Article

A Study on Storm and Flood Insurance Management Mapping: Case Study of Incheon Metropolitan City

1
Korea Land and Geospatial Informatix Corporation, Wanju-gun, Jeollabuk-do 55365, Korea
2
National Institute of Ecology, Seochon-gun, Jeollabuk-do 33657, Korea
*
Author to whom correspondence should be addressed.
ISPRS Int. J. Geo-Inf. 2019, 8(11), 485; https://doi.org/10.3390/ijgi8110485
Submission received: 26 September 2019 / Revised: 21 October 2019 / Accepted: 28 October 2019 / Published: 29 October 2019

Abstract

:
In this research, we have used spatial information analysis techniques and procedures to process storm, flood, and snow damage risks, and apply premium rates to produce a Storm and Flood Insurance Management Map. To calculate risk, we used ArcGIS’s main features to overlay, integrate, and classify data. Moreover, we designed an ArcGIS Model Builder program to process very large amounts of risk data quickly and accurately. Excel’s pivot feature was used to calculate areas and premium rates according to flood depth. In the case of Incheon metropolitan city, the average risk was 2.85 on the 4-level scale, which lies between "alert" and "danger" and corresponds to the 1st of the 4 premium rate grades. In particular, there were high risks and high premium rates in areas around ports, ocean beaches, and beaches connected to rivers. We expect that this insurance management map created using spatial information analysis techniques will provide useful data for scientific natural disaster response and prevention planning, rational insurance rate calculation and application, and promotion of policies, which identify and prevent areas at risk for frequent storm and flood damage.

1. Introduction

Recently, various types of natural damages have been caused by climate change. The term "damage caused by storm and flood" means any disaster caused by typhoon, flood, heavy rainfall, strong wind, wind wave, sea wave, tidal water, heavy snowfall, or other natural phenomena corresponding thereto [1]. "Storm and flood insurance" refers to insurance that compensates for losses from property damage that occurs due to storm or flood damage [2]. The Storm and Flood Insurance Act is a regulation for quick and fair compensation of losses from property damage that occurred due to storm and flood damage, and it was created with the goal of providing stabilization of the livelihood of citizens.
Moreover, according to the Countermeasures against Natural Disasters Act Article 2 (Definitions) and Article 21 (Creating and Using Various Disaster Maps), a "disaster map" means the drawings that indicate traces of flooding, flooding forecasts, and disaster-related information, etc. When looking at flood and storm insurance, there are many problems to be solved: (i) throughout the country, the same premium rates have been applied by city, district, neighborhood; (ii) the management of storm and flood damage risk maps and insurance management maps are insufficient and not reasonable; (iii) there is no system for continually and systematically managing a map for Storm and Flood Insurance Management and premium rates; (iv) there is a need for database-powered (GIS) record management that can support a variety of features such as statistical analysis of the map for Storm and Flood Insurance Management and risk maps.
In a domestic study, Shin shin [3] analyzed the development progress on storm and flood damage in fire insurance and comprehensive homeowner’s insurance by studying natural disaster risk diversification and the government’s role. Lee et al. [4] examined the risk classification systems for flood insurance in the United States and various European countries, and based on this, they proposed a plan for calculating graded rates by weighting flood areas by flood depth, which could be automatically applied to premium rates according to risk.
The National Emergency Management Agency (NEMA) [5] performed research on operating a pilot project for calculating storm and flood premium rates by examining methods for calculating storm and flood premium rates. NEMA [6] also studied a plan for creating a storm and flood management map and developed [7] the teaching textbook for storm and flood insurance, including an overview of storm and flood insurance and the method of assessment of loss. Lee et al. [8] suggested a calculation and verification method for the Natural Disaster Insurance Rate.
Overseas, Martini et al. [9] showed that Atlas of Flood Maps includes examples of flood map data from 19 European countries, the United States, and Japan. This report mentions flood maps and insurance maps. The insurance maps are used for two purposes: for normal users to check if there is a possibility of flooding on their real estate, and for insurance companies to assess the actual risk of flooding. These maps show flood risk information too. This flood risk information is expressed as flood extent probability and the possibility of latent damage.
The insurance maps include CatNet [10] and others, and the user interface screen of these maps contains flood risk information on European countries such as Belgium, Czech Republic, Germany, Italy, Hungary, Netherlands, Slovakia, and the United Kingdom, as well as Argentina, Israel, and the United States. To supplement this information, Swiss Re developed "Global Flood Zones."
The CatNet web service provides data on floods, earthquakes, tsunamis, storms, landslides, volcanoes, liquefaction, wildfire, climate change, climate data, etc. Figure 1 shows the CatNet web service providing information on flood areas (a) and earthquakes (b).
De Moel et al. [11] examined the present state of flood risk maps and whether or not they used insurance maps. In Taiwan, Hsu et al. [12] developed an integrated flood risk assessment model for real estate insurance companies that cover rainfall, flooding, vulnerability, and loss modules. In addition, FEMA [13] introduced a flood insurance rate map. Shinjuku City [14] published the flood risk for the city, including the flood range and recommended evacuation shelters based on rainfall characteristics and rainfall amount.
The time range for our research is from January 2015 to March 2016; the spatial range is Incheon metropolitan city; the scope of the study includes the generation of the Storm and Flood Insurance Management Map by combining premium rates with the risk of storm, flood, and snow.
In this research, we have suggested spatial information analysis techniques and procedures to process storm, flood, and snow damage risks and apply premium rates to ultimately produce a Storm and Flood Insurance Management Map.

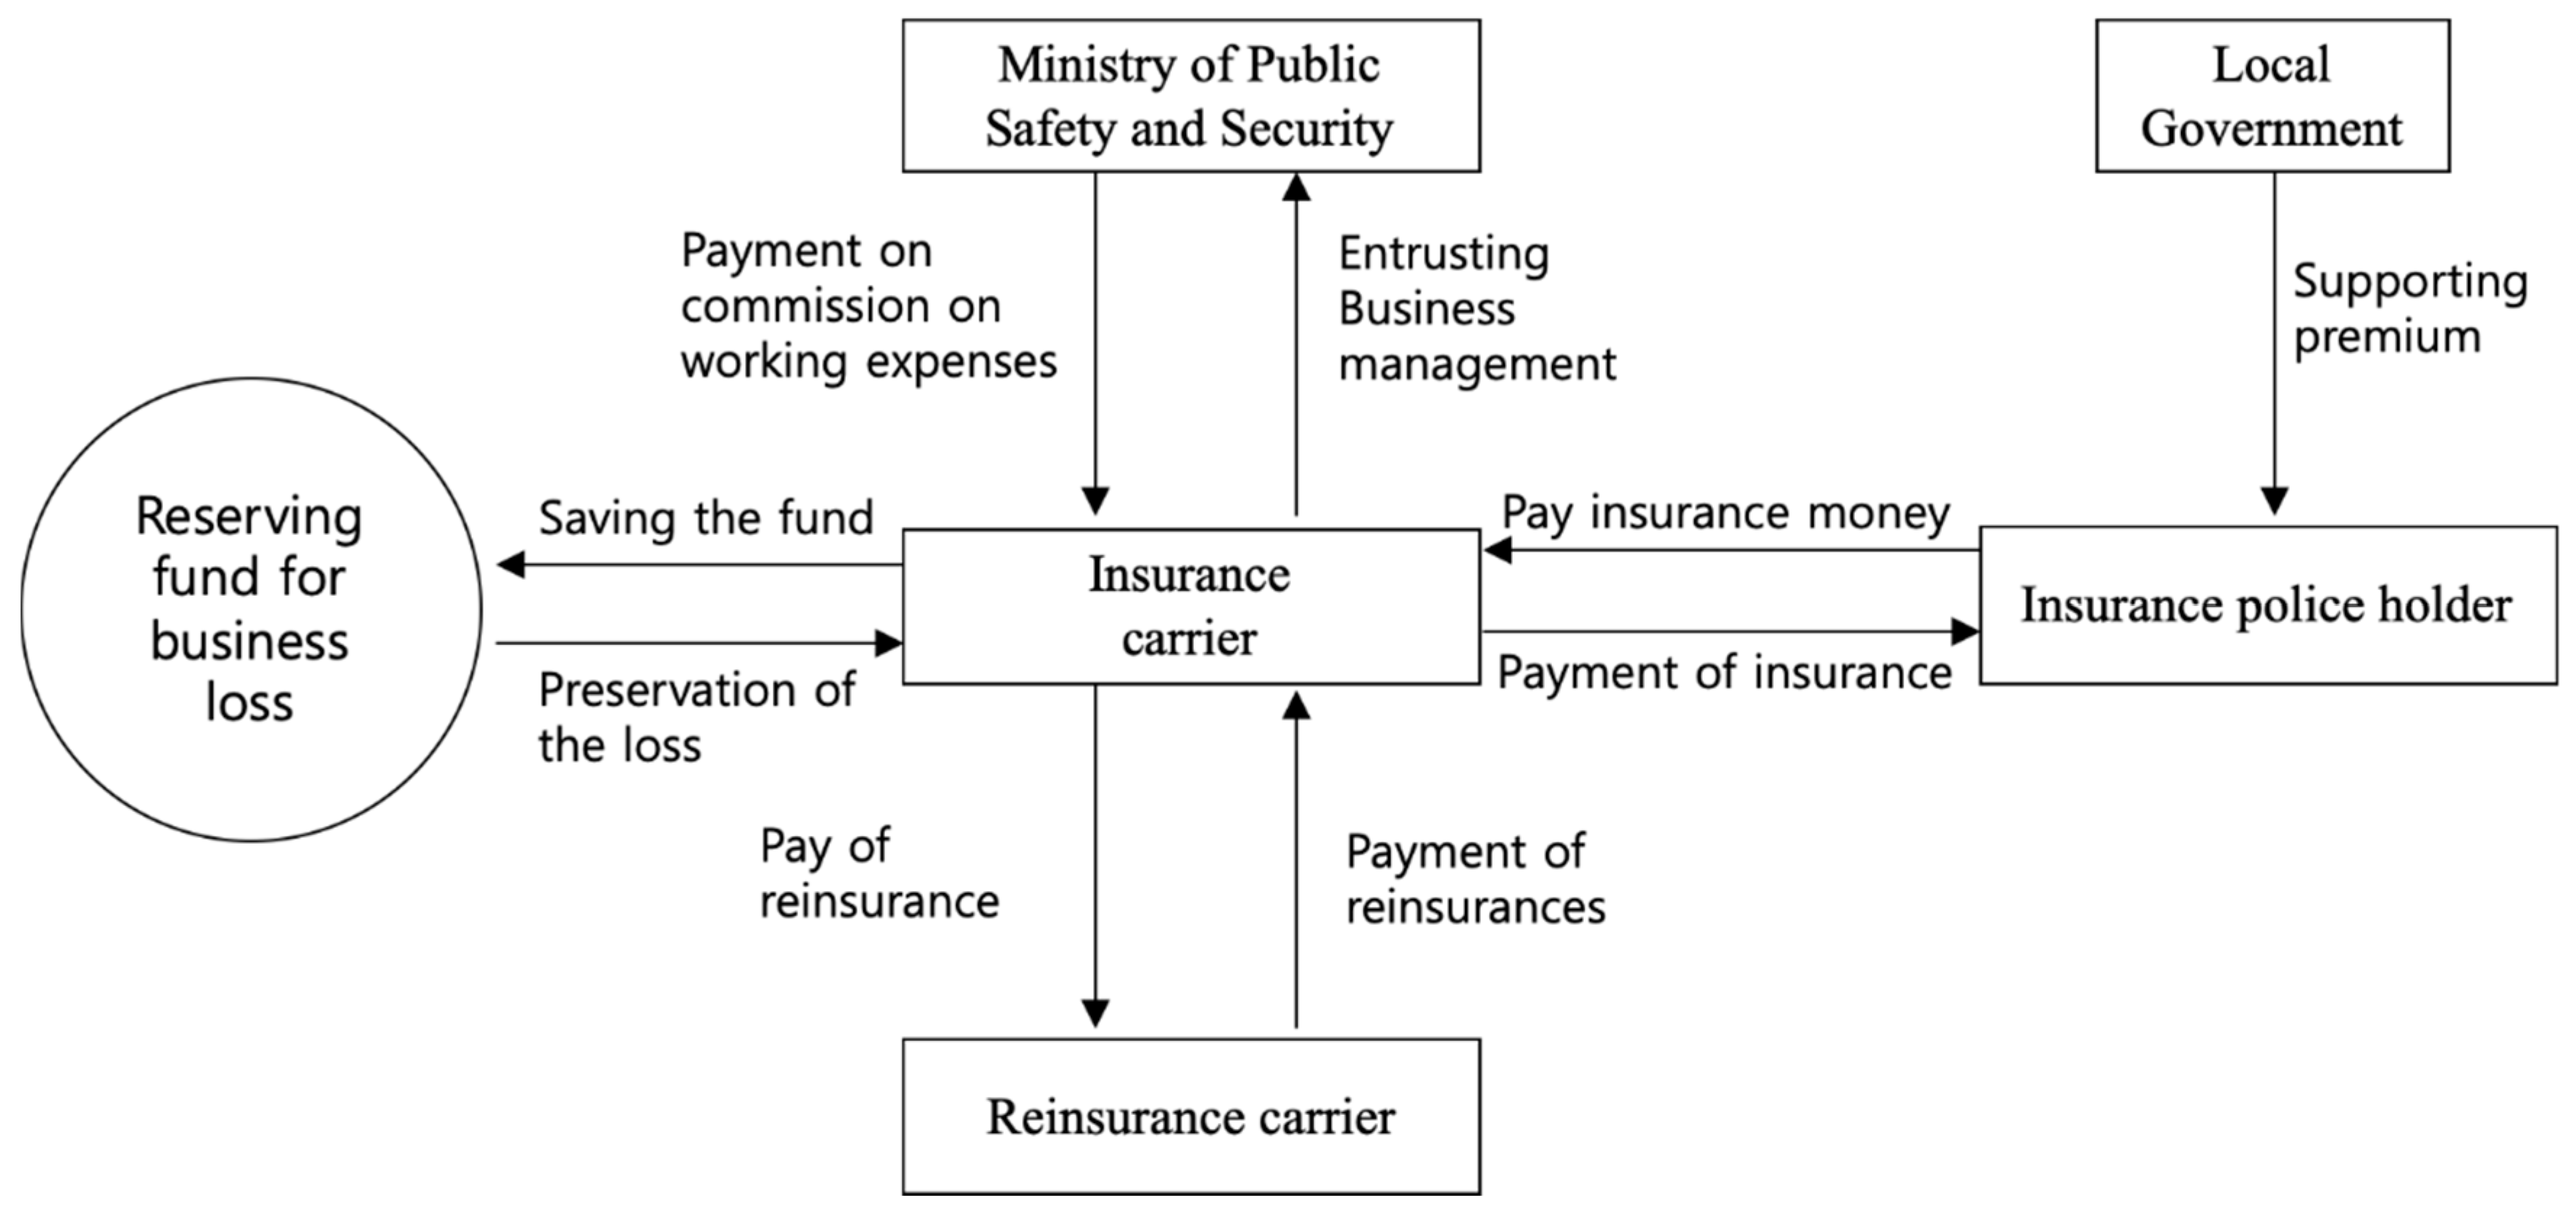
2. Overview of Storm and Flood Insurance

Storm and Flood insurance was created to supplement the limitations in support systems for private property damage due to natural disasters, to revitalize the business insurance market for storm and flood damage, and to introduce a reward system according to the principle of self-responsibility.
The relevant risks include typhoons, floods, heavy rains, strong winds, wind volume, tsunami, heavy snow, and earthquakes. The relevant facilities are homes (including personal effects), greenhouses (including plastic houses), etc. According to the Building Act Article 2, Section 2, Items 1 and 2, homes are buildings that are directly being used as residences out of all purpose-built buildings. Greenhouses are structures built for agriculture and forestry from among the "Standard Farming Houses" and "Disaster-resistant Standard Plastic Greenhouses" designated by the Ministry of Agriculture, Food and Rural Affairs.
Insurance products come in three types: storm and flood insurance product I, product II, and product III. Product I is for houses and greenhouses, a fixed payment; product II is for houses and tenant’s assets, a fixed payment; and product III is for apartments or condos, a reward commensurate with actual damages (excess construction). Products I and II are sold by dividing into 70%, 80%, and 90% compensation of the insured amount.
Storm and flood insurance is controlled by the Ministry of Public Safety and Security and supervised by the Financial Services Commission. Business operations are performed by five insurance companies, which are contracted with the Ministry of Public Safety and Security, and these are currently Dongbu Fire Insurance, Hyundai Marine and Fire Insurance, Samsung Fire Insurance, KB Insurance, and NH Property and Casualty Insurance.
Figure 2 below shows the layout of the system of operation that runs the actual insurance business.

3. Test Data Acquisition and Analysis
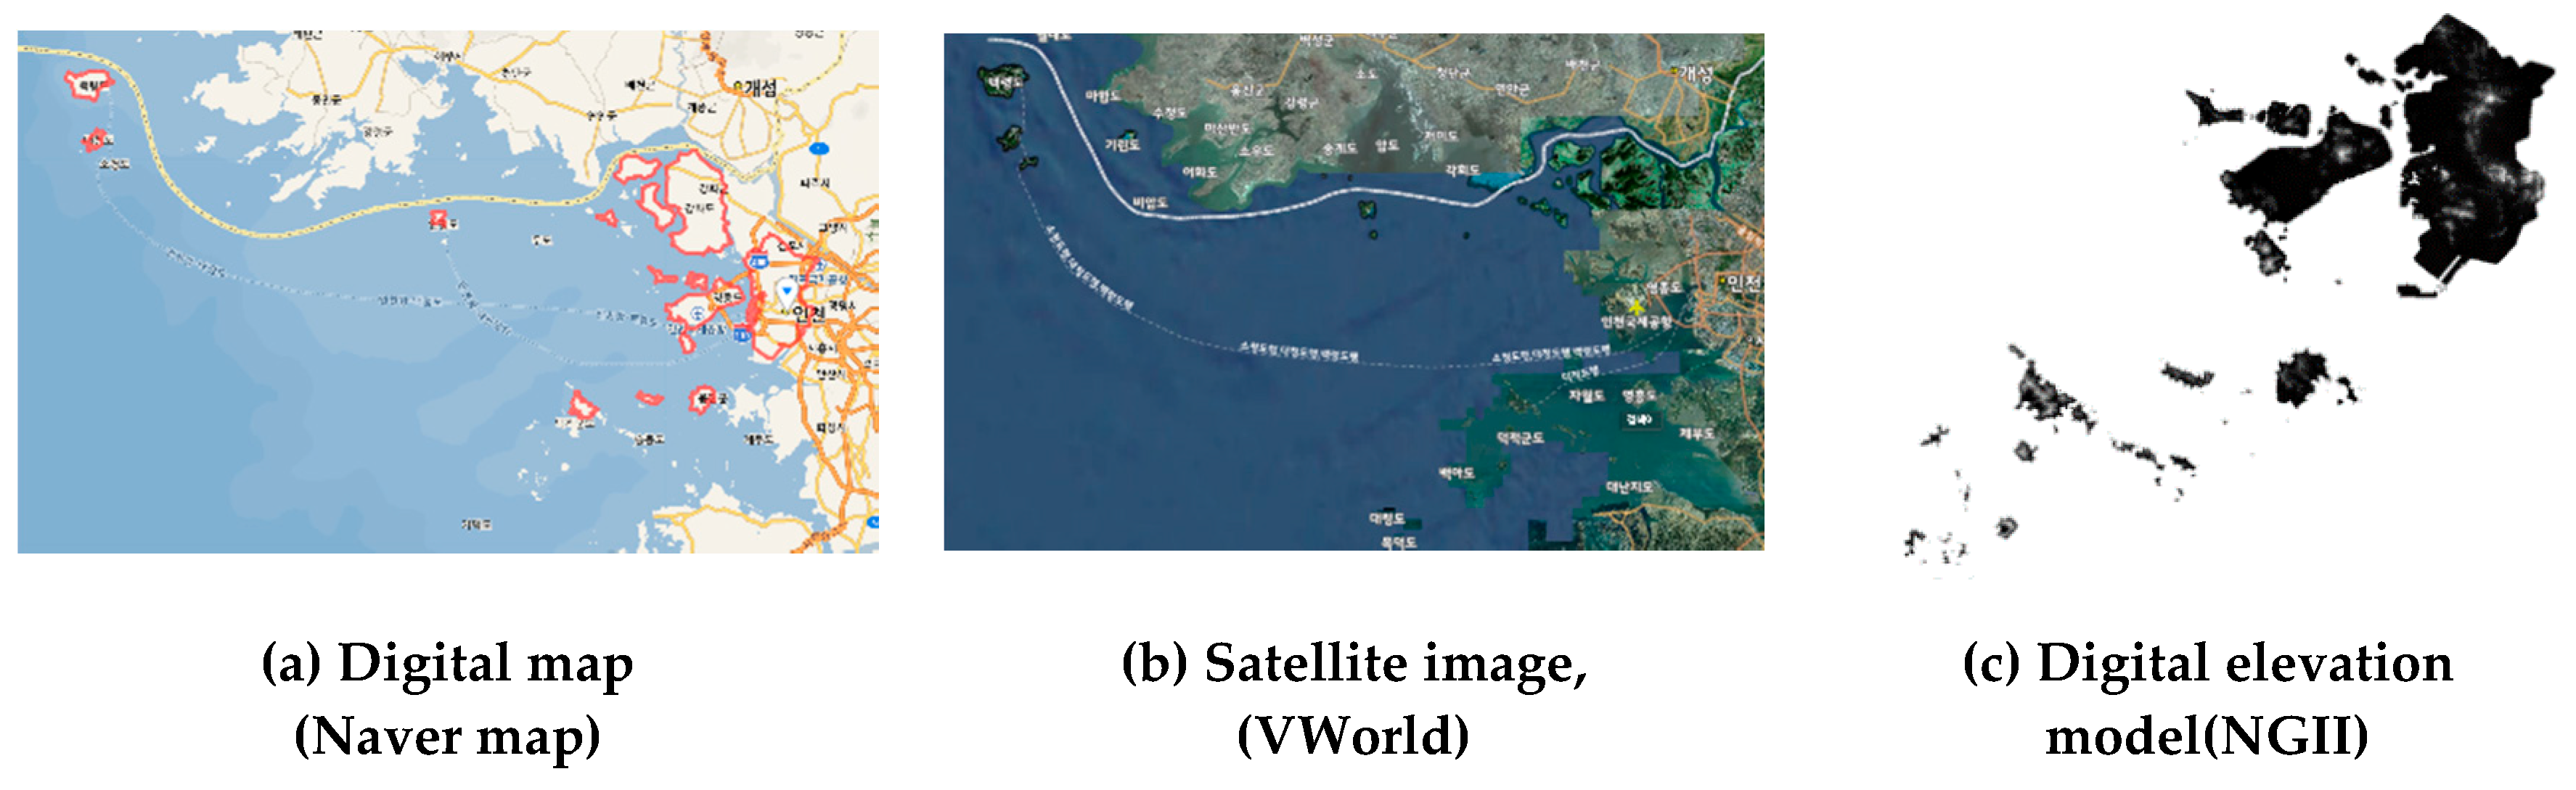
3.1. Study Area

The experiment region for this research is the Incheon metropolitan city, a city located in the northwest part of South Korea and comprising four administrative districts. Incheon metropolitan city, a famous port city, is one of South Korea’s six largest cities.

3.2. Data classification

To create an insurance management map, basic data and required data are needed. Basic data includes the digital elevation model (DEM), a building database, aerial photographs, etc. The required data are the risk and insurance premium rates. Table 1 shows data, data provider, and data format to build an insurance management map.
Figure 3 shows the basic data used in the Mapping for a Storm and Flood Insurance Management: (a) digital map, (b) satellite image, (c) digital elevation model.

3.3. Risk

In this research, flood risk (inner water, outer water), storm risk, and snow risk were gathered from other research organizations and through GIS analysis algorithms. Three risks and premium rates were combined on the DEM (10 m x10 m) to create the storm and flood insurance management map.
The flood risk map is produced with inner water and outer water maps. The inner water risk map is made using a digital topography map, and the outer water map is based on the existing flood risk map. Flood risk is graded into four classes by flood depth (m).
The storm risk maps are produced using the probability of failure (PF) maps by applying storm velocity maps to vulnerability functions. Then, storm risk is graded into 4 classes by PF. A storm velocity map is made using the wind velocity data from 70 weather centers that have tracked wind data for more than 20 years (1971–2015).
The snow risk map is produced using PF maps by applying snow depth maps to vulnerability functions (NEMA, 2009). Then, snow risk is graded into four classes by PF. The snow depth map is made using the snow depth data from 68 weather centers tracked during 1960–2015.

3.4. Premium Rate

The items considered when calculating premium rates include the mean damage ratio (MDR), premium rate calculation variables by risk grade, and weight of disaster causes for each grade. The final weight of disaster is calculated by averaging each weight of flood, storm, and snow damage shown in the statistical yearbook of natural disaster (2012–2014), insurance money of storm and flood insurance (2006–2014), and the number of payments of storm and flood insurance (2006–2014). In most districts of Incheon metropolitan city, the average weight of damage is 90–100 (flood), 0–6 (storm), 0–4 (snow), except for Bupyeong-gu, Ongjin-gun, Ganghwa-gun.
Table 2 shows the main items considered when calculating premium rates. The calculation of the premium rate in this study is based on the previous research [8], which was performed by the same research team.

4. The Storm, Flood, and Snow Insurance Management Map

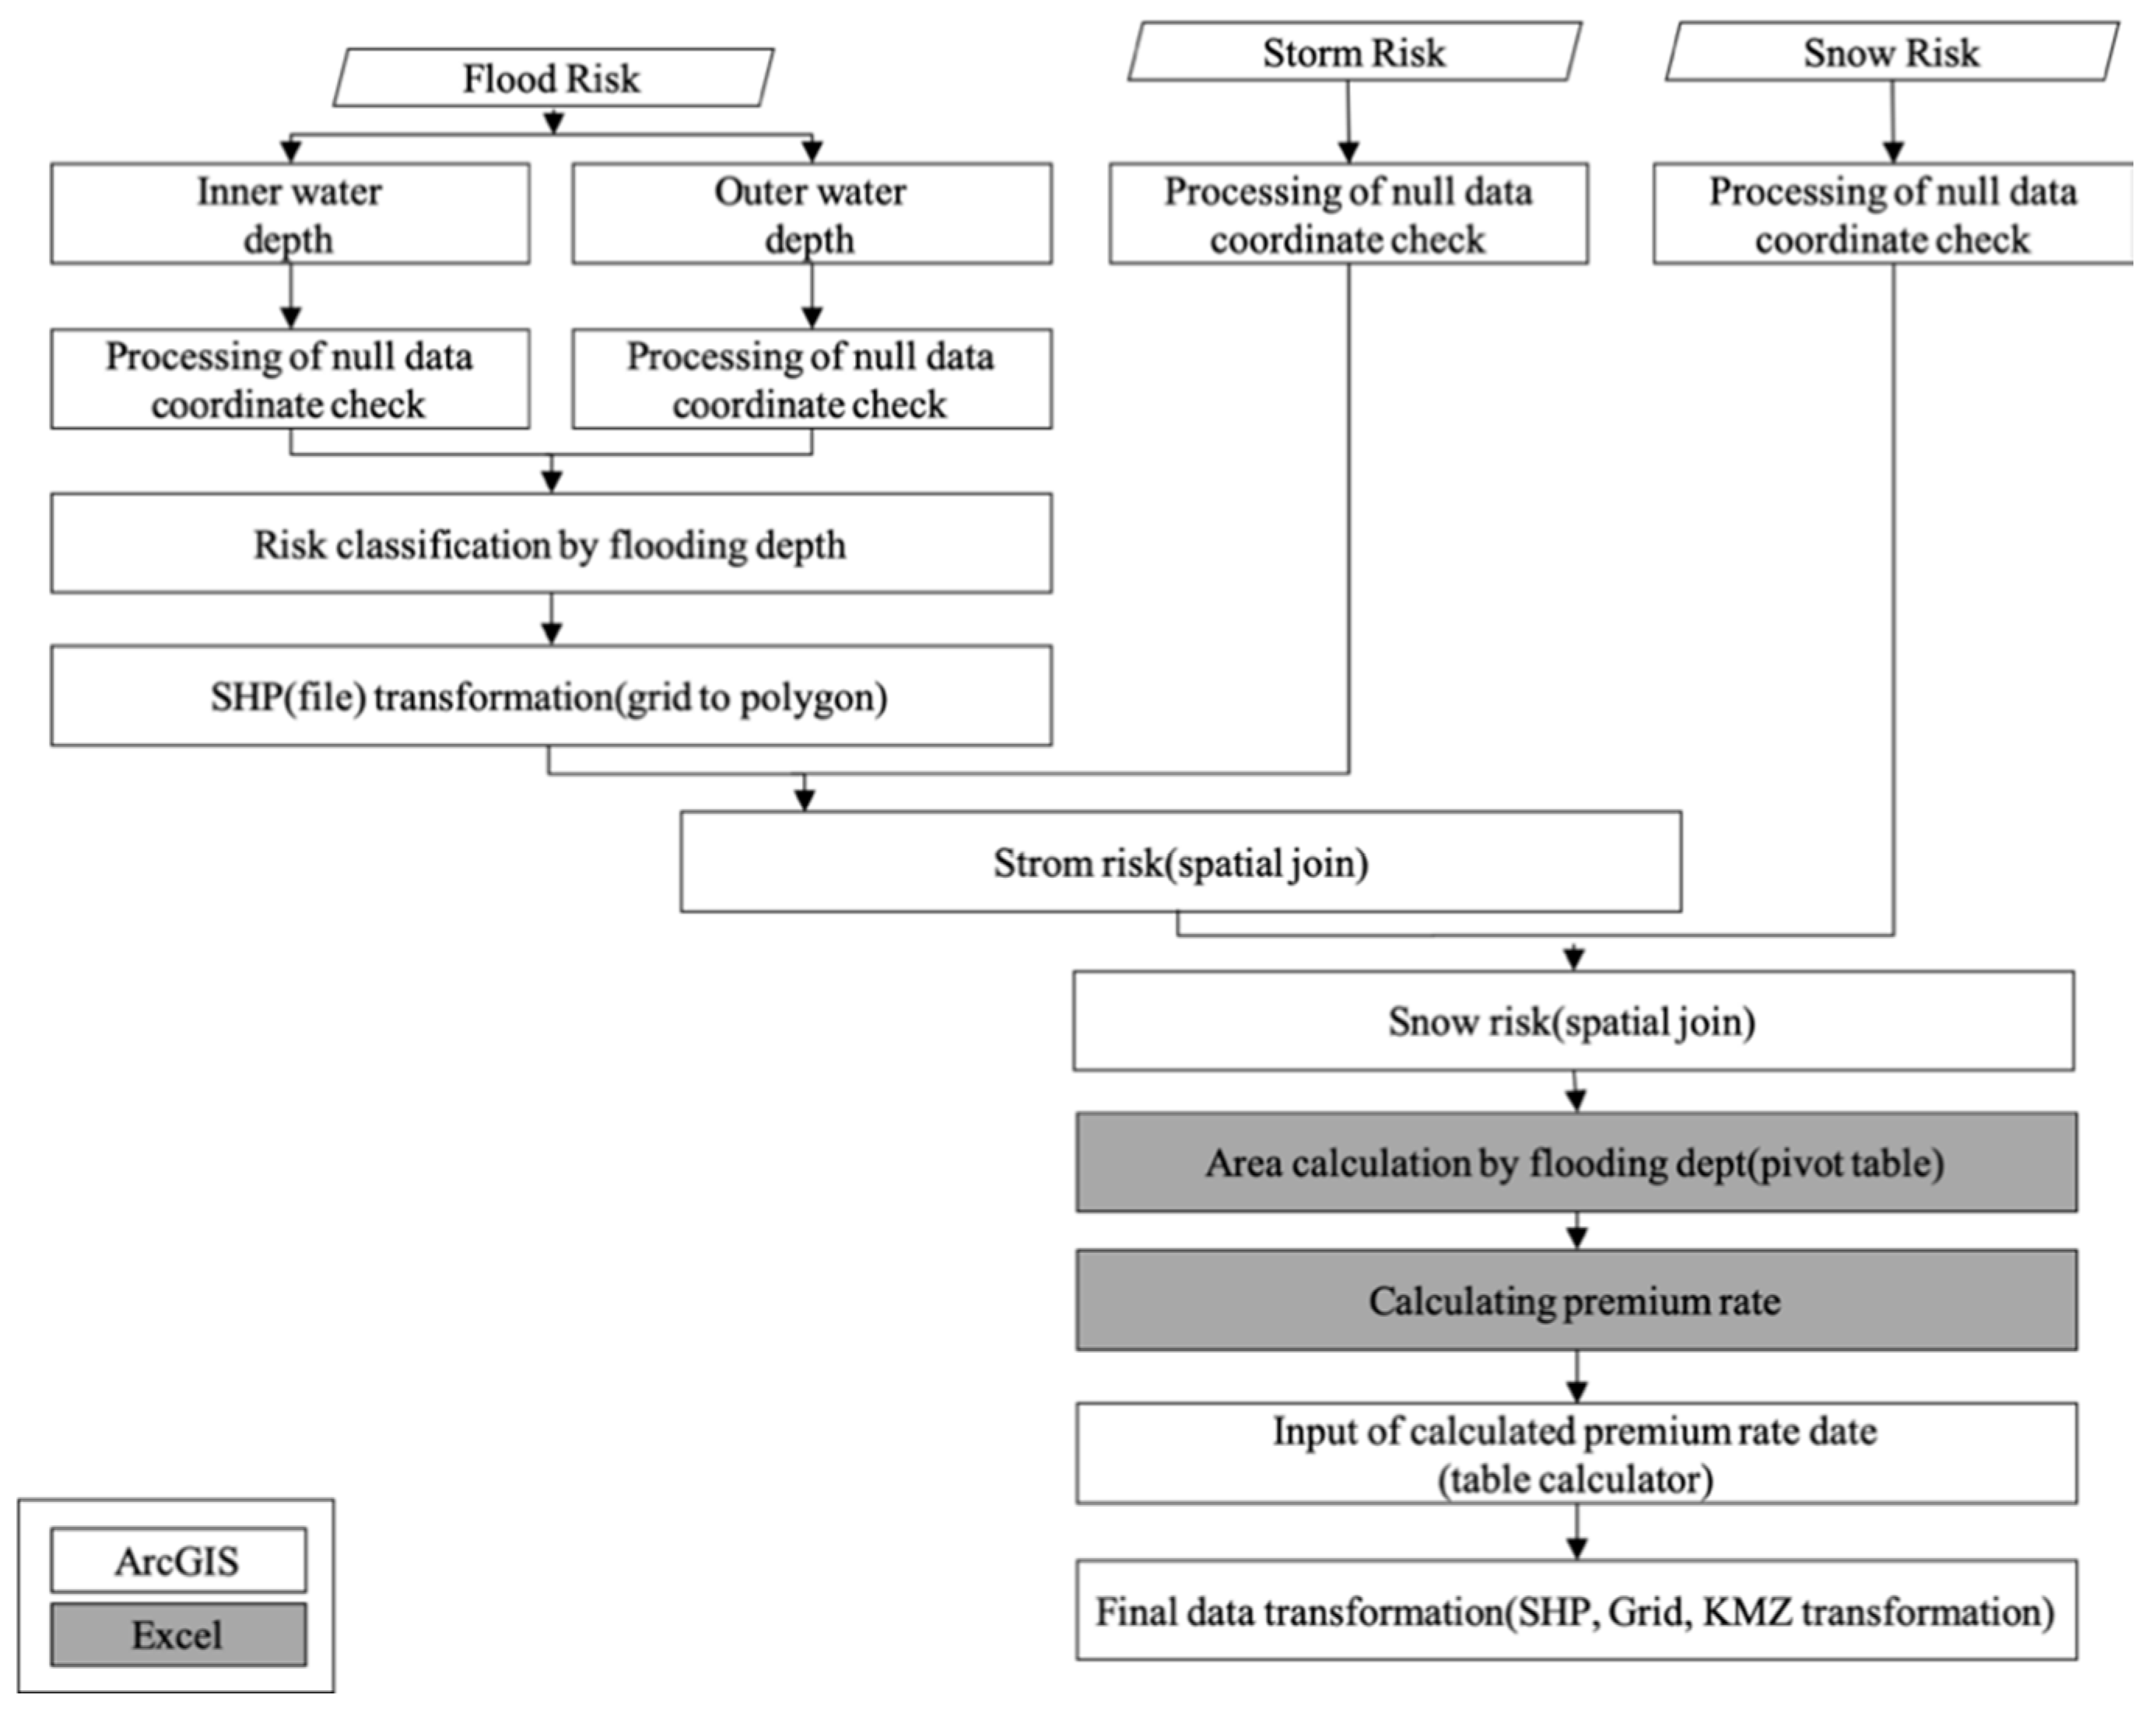
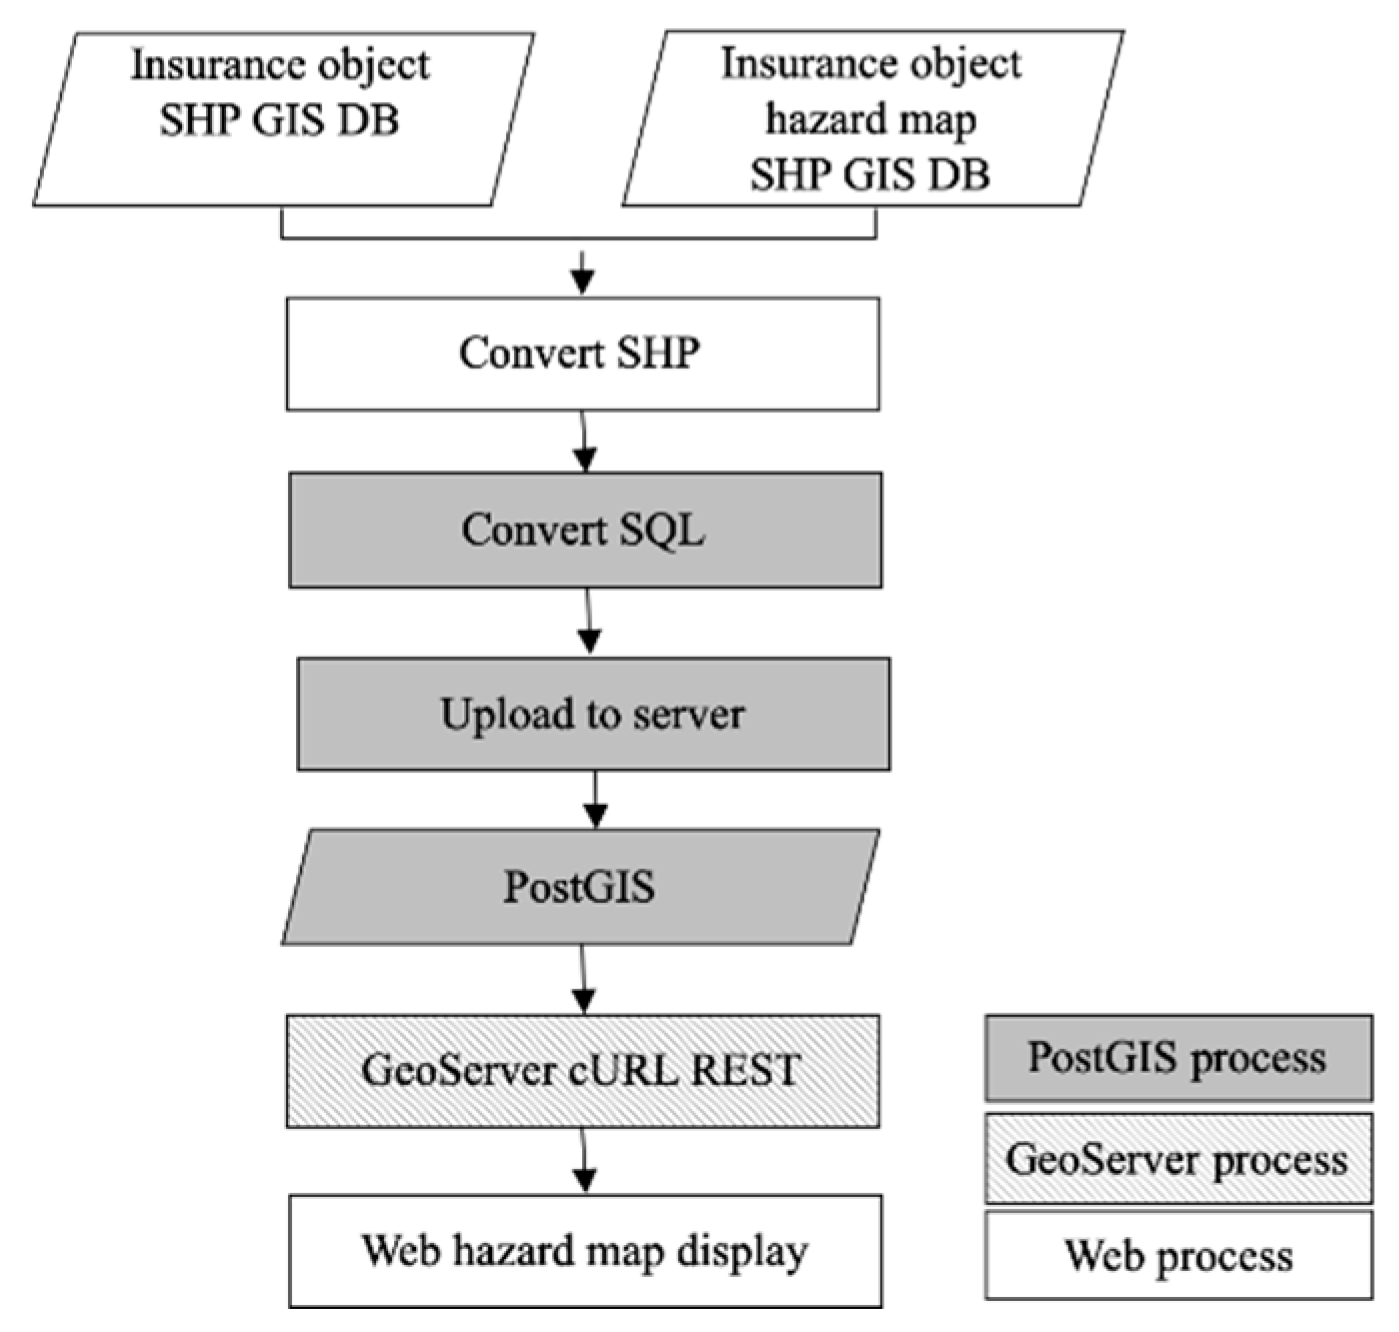
4.1. Integration of Risk and Premium Rate Analysis Process

We explain the process of supplementing the risk data created in Section 3 with premium rates. Figure 4 is a data analysis flowchart for creating an insurance management map by connecting risk data (inner water, outer water, storm, snow) with premium rates. In order to analyze premium rates and risk data (raster), flood risk is divided into four zones according to flood depth (h) using ArcGIS’ GRID classification—zone 1 (no flood), zone 2 (0.0 < h ≤ 0.5 m), zone 3 (0.5 < h ≤ 1.0 m), zone 4 (1.0 m < h). Flood risk acts as the basis, and snow and storm risks act as weights for raising or discounting premium rates.
To combine flood risk with storm and snow risks, ArcGIS’ spatial join function is needed, and risk data is changed into shapefile format. Storm and snow risk (grid) are processed with consideration of relative safety, depending on the region’s risk standard, and the spatial join function is used to add snow and storm risk to flood risk.
ArcGIS is used to calculate storm, flood, and snow damage risks and create an insurance management map, and an Excel pivot table is used to calculate the flooding areas by flood depth and premium rates. An ArcGIS’ table calculator is used to create data input values for visualizing the premium rates calculated in Excel.
When finishing the rate calculation using Excel data, the rates are again given data attributes using the shape’s Database Join function. The insurance premium rates calculated using the data export function are permanently saved as a shapefile. In ArcGIS, data is uploaded to a web platform and finally converted into SHP, GRID, and KMZ file formats.

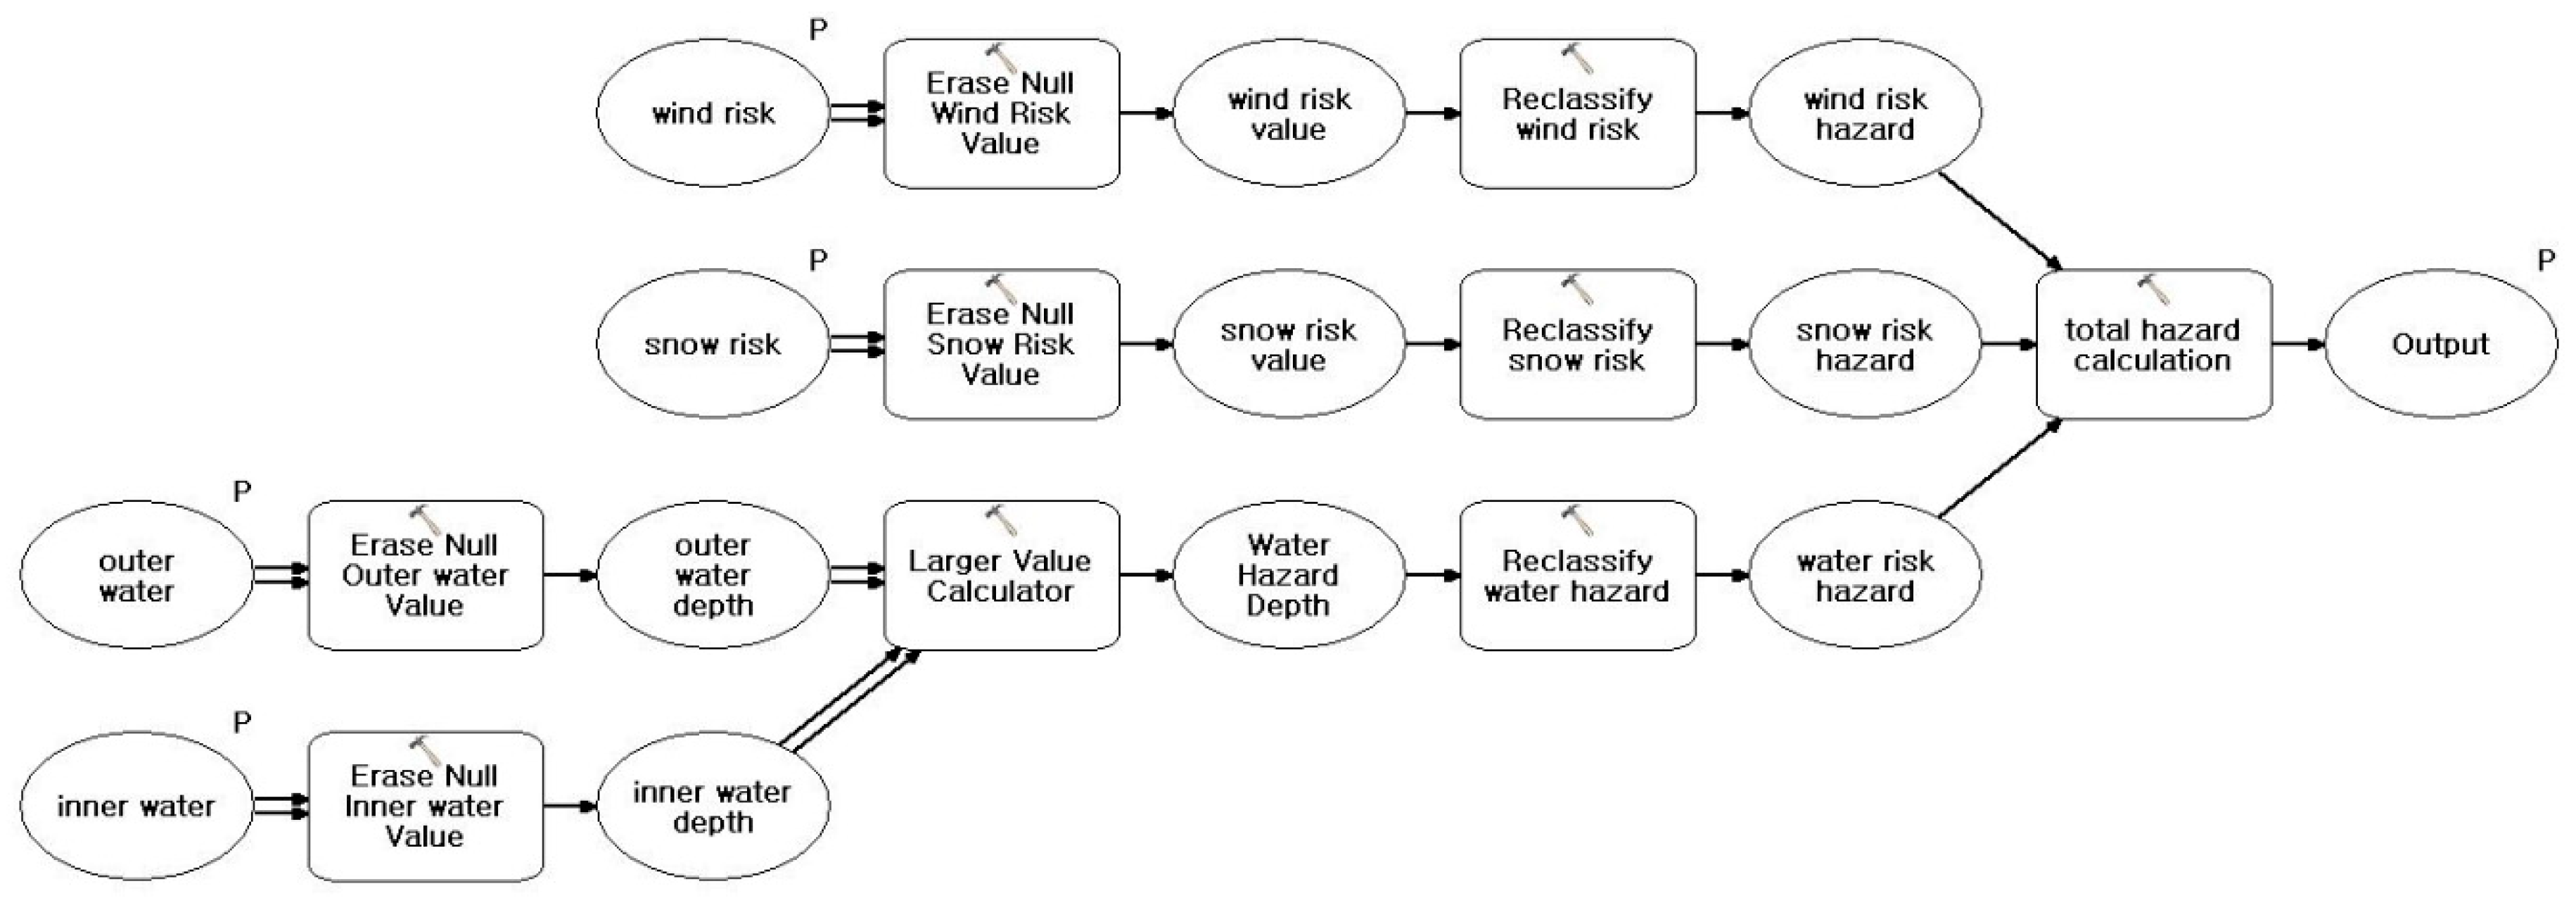
4.2. Automatic Risk Analysis Method

This section describes a method that uses the ArcGIS Model builder to automate the risk analysis processing, which consumes a lot of time when creating an insurance management map. When there are many risk analysis areas and a lot of data to be processed, there are limitations to performing analysis through multiple tasks. Therefore, ArcGIS Model builder Script is used to automate these tasks, as shown in Figure 5, which is the basis of the designed model.
When the procedures in Figure 5 are completed, the flood, storm, and snow risk attribute values can be obtained from Table 3. The modeling process of the storm and flood damage converts the risks of inner water, outer water, snow, wind damage to a 10 m grid, replaces the null value with 0 for calculation, and creates a flood risk classification by selecting a larger value from the inner water and outer water risks.
The weight of storm and flood damage in this study was calculated by using the results of research [15] by NEMA. In the study, the weight of the flood, wind, and snow damage was 95, 2, and 3. The flood risk analysis was performed using the level pool and flood analysis model. The wind hazard risk was analyzed using the homogeneous model, the surface roughness model, and the topographical effect model. Snow risk was analyzed using snowfall frequency analysis.

4.3. Risk Data and Premium Rate Results
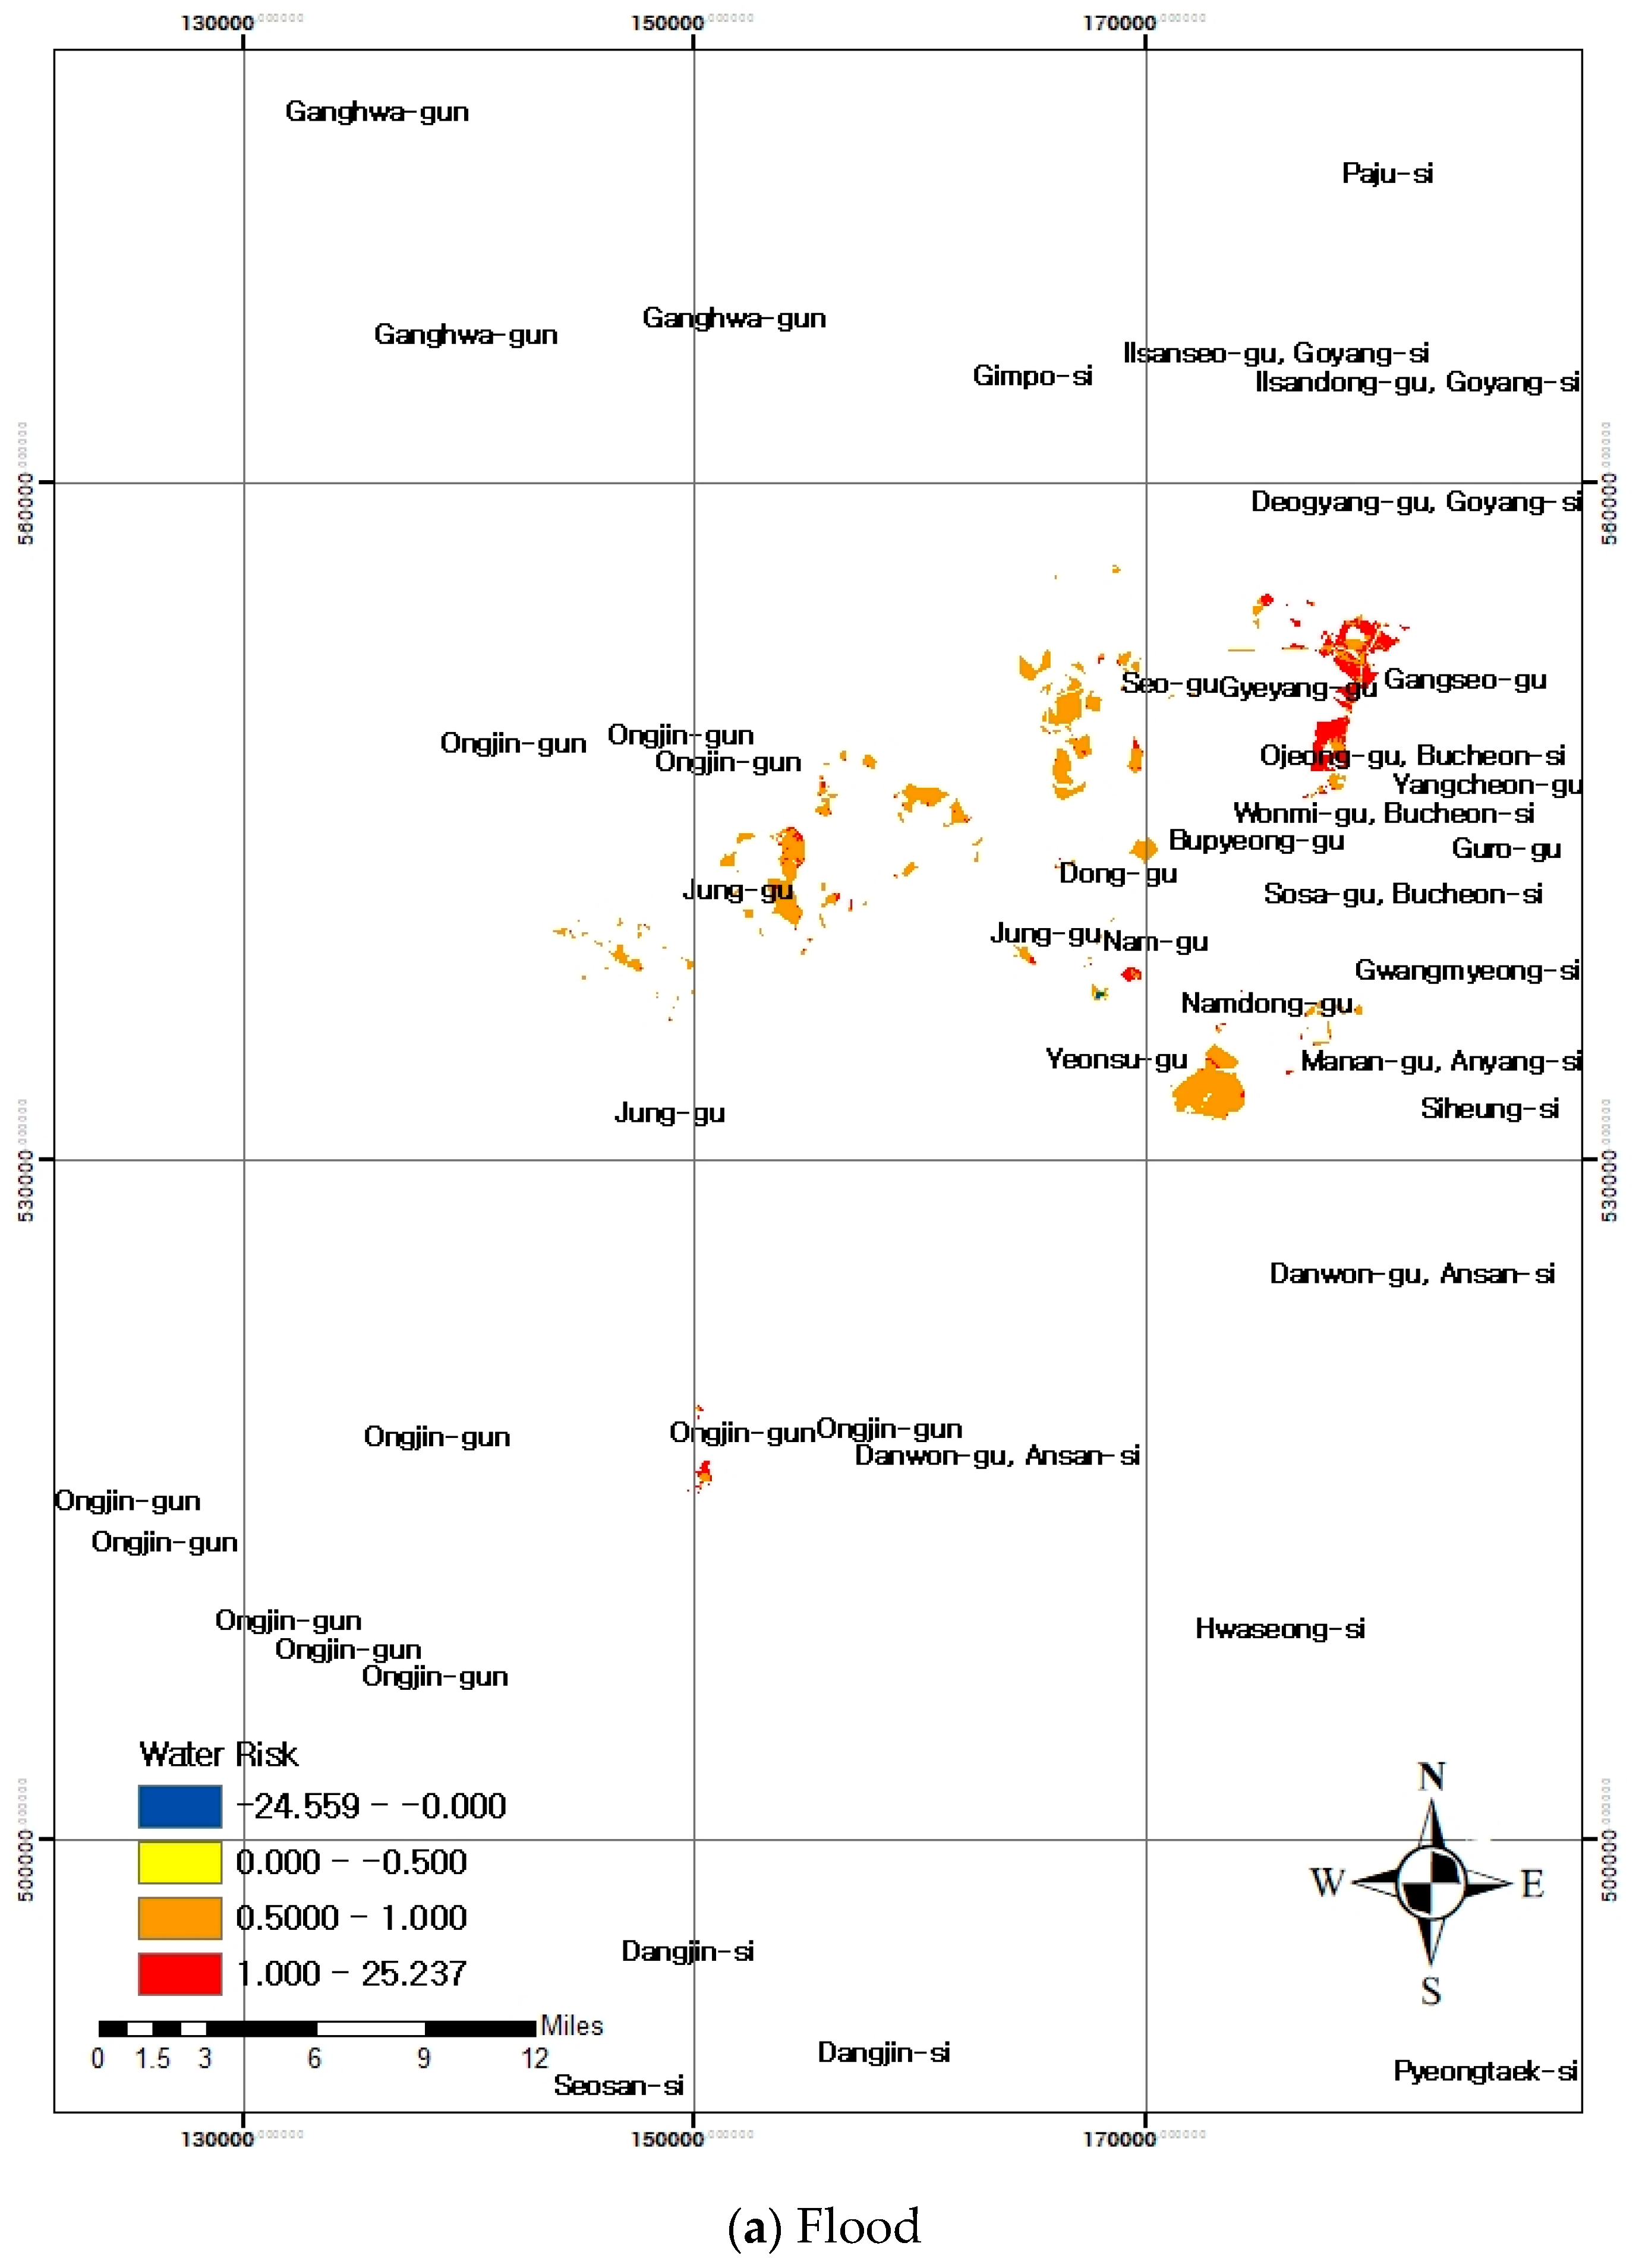
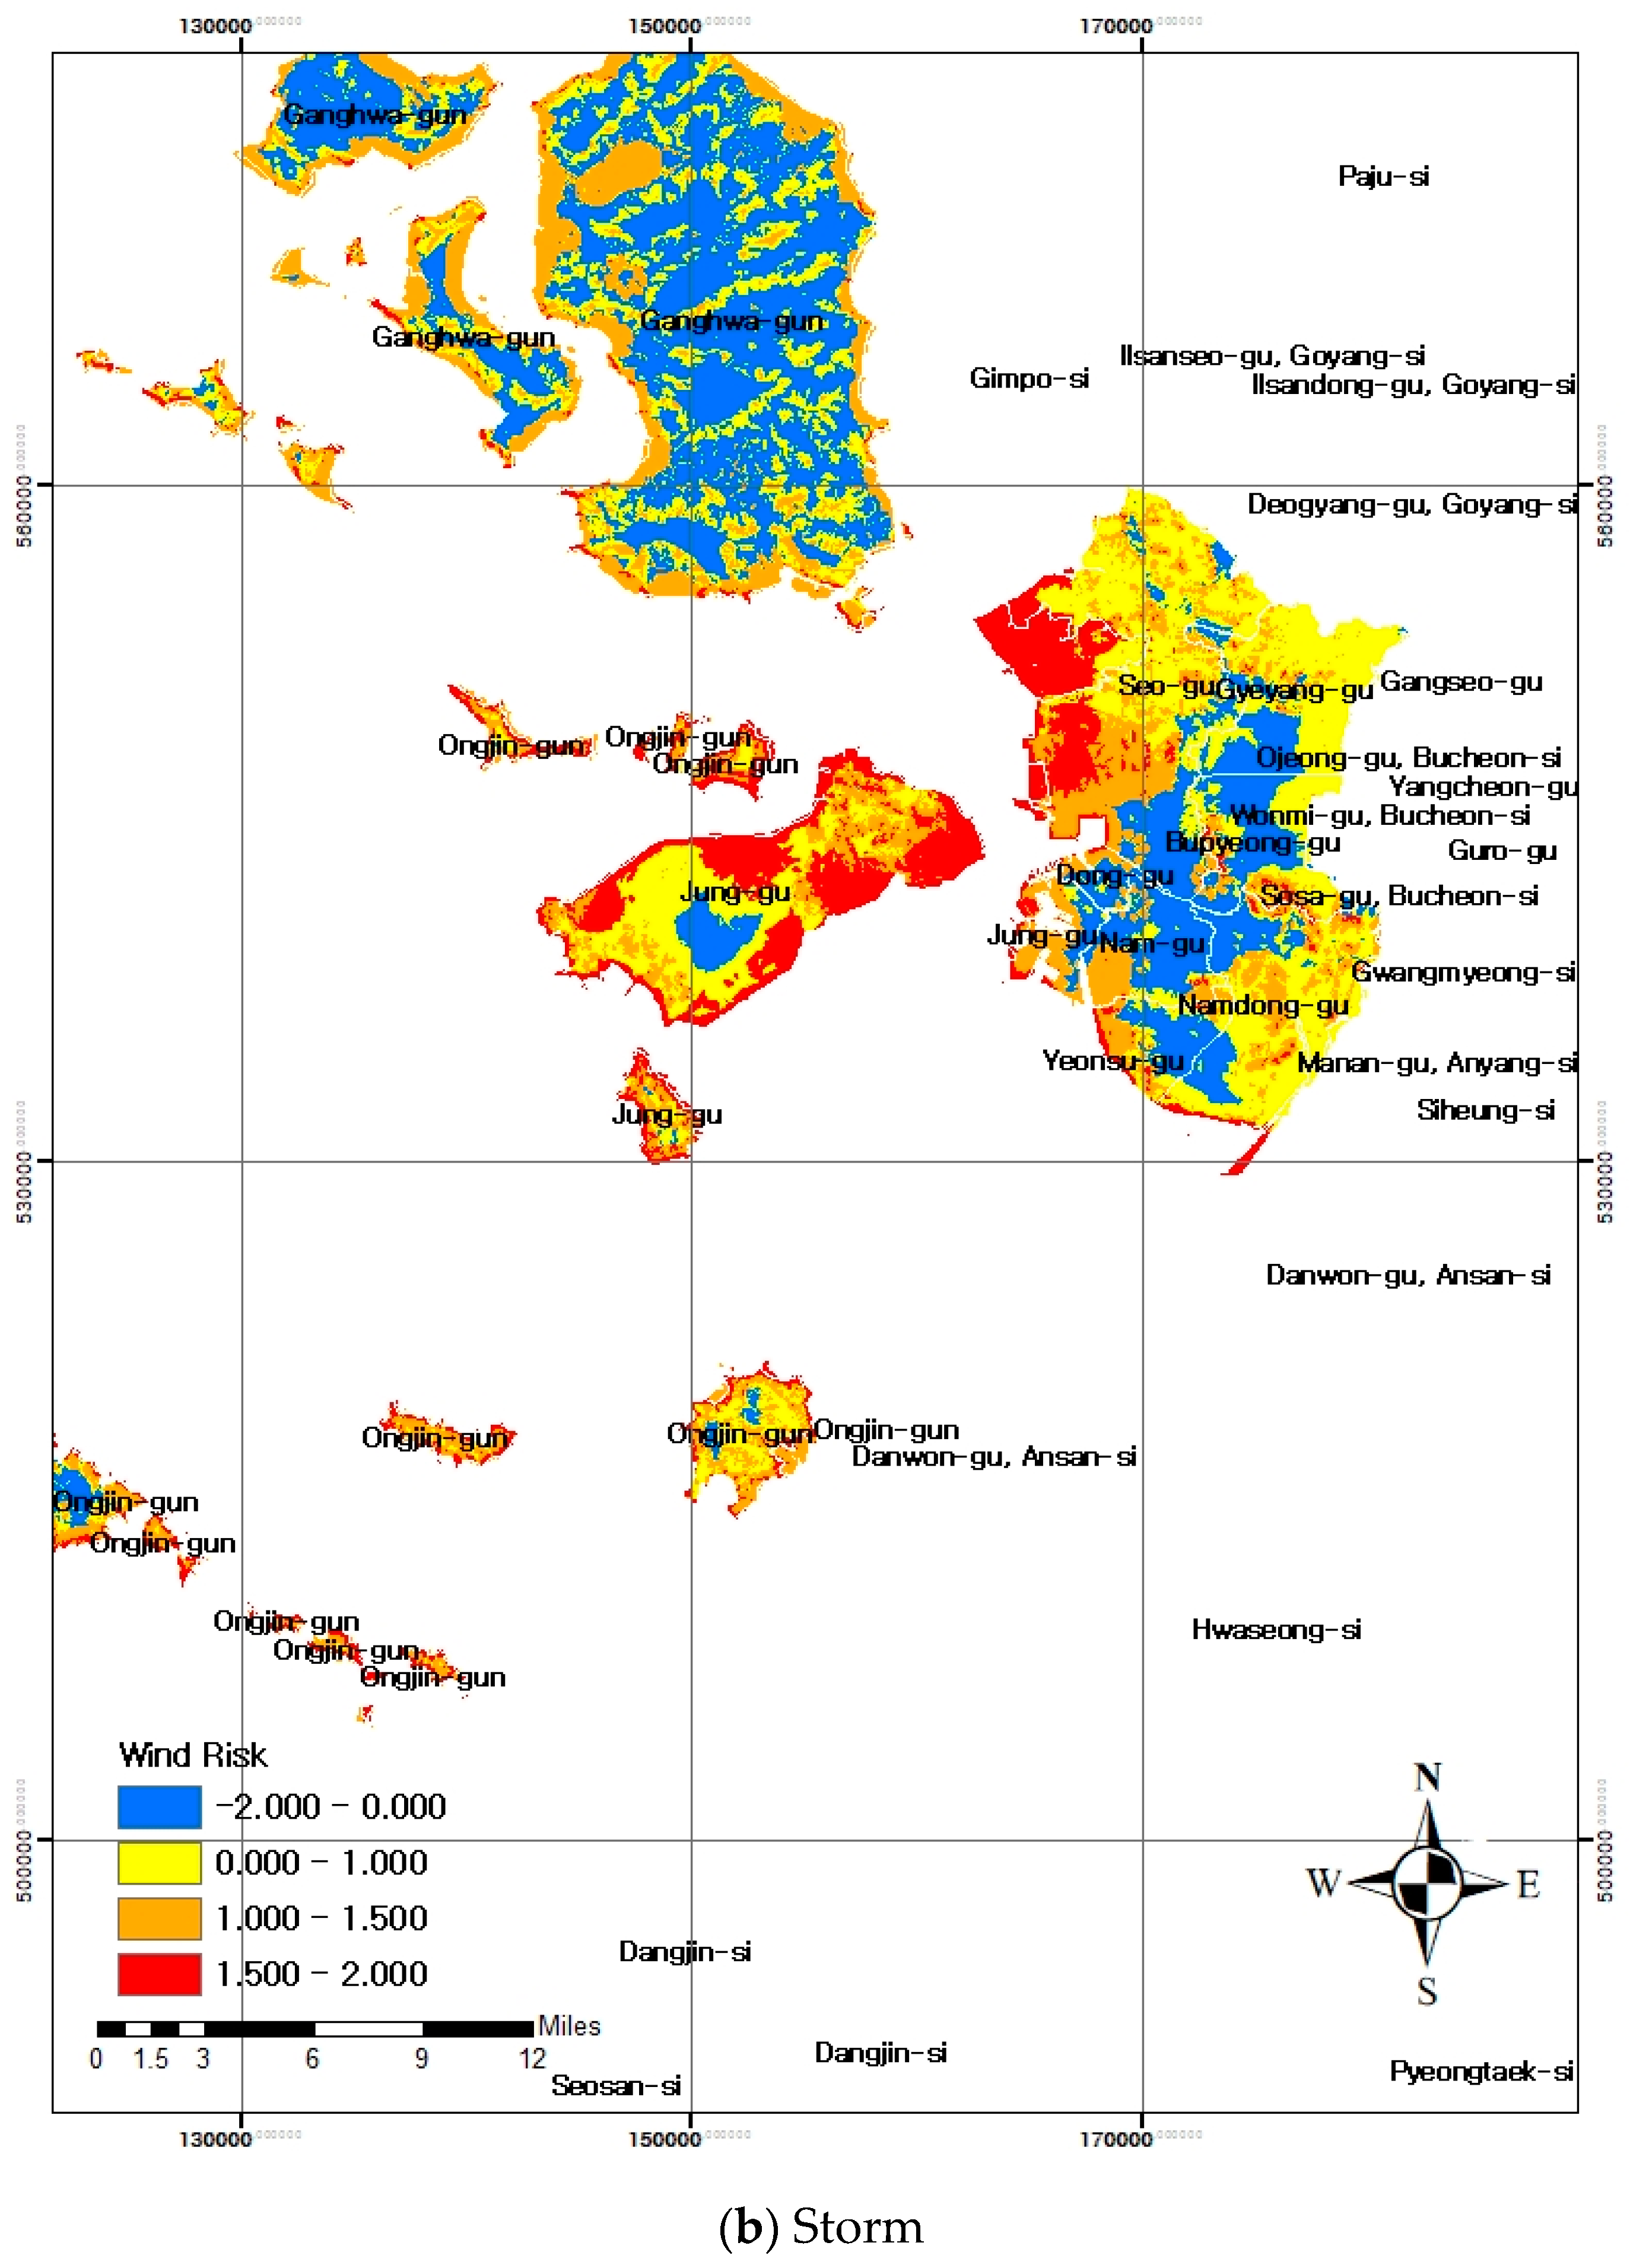
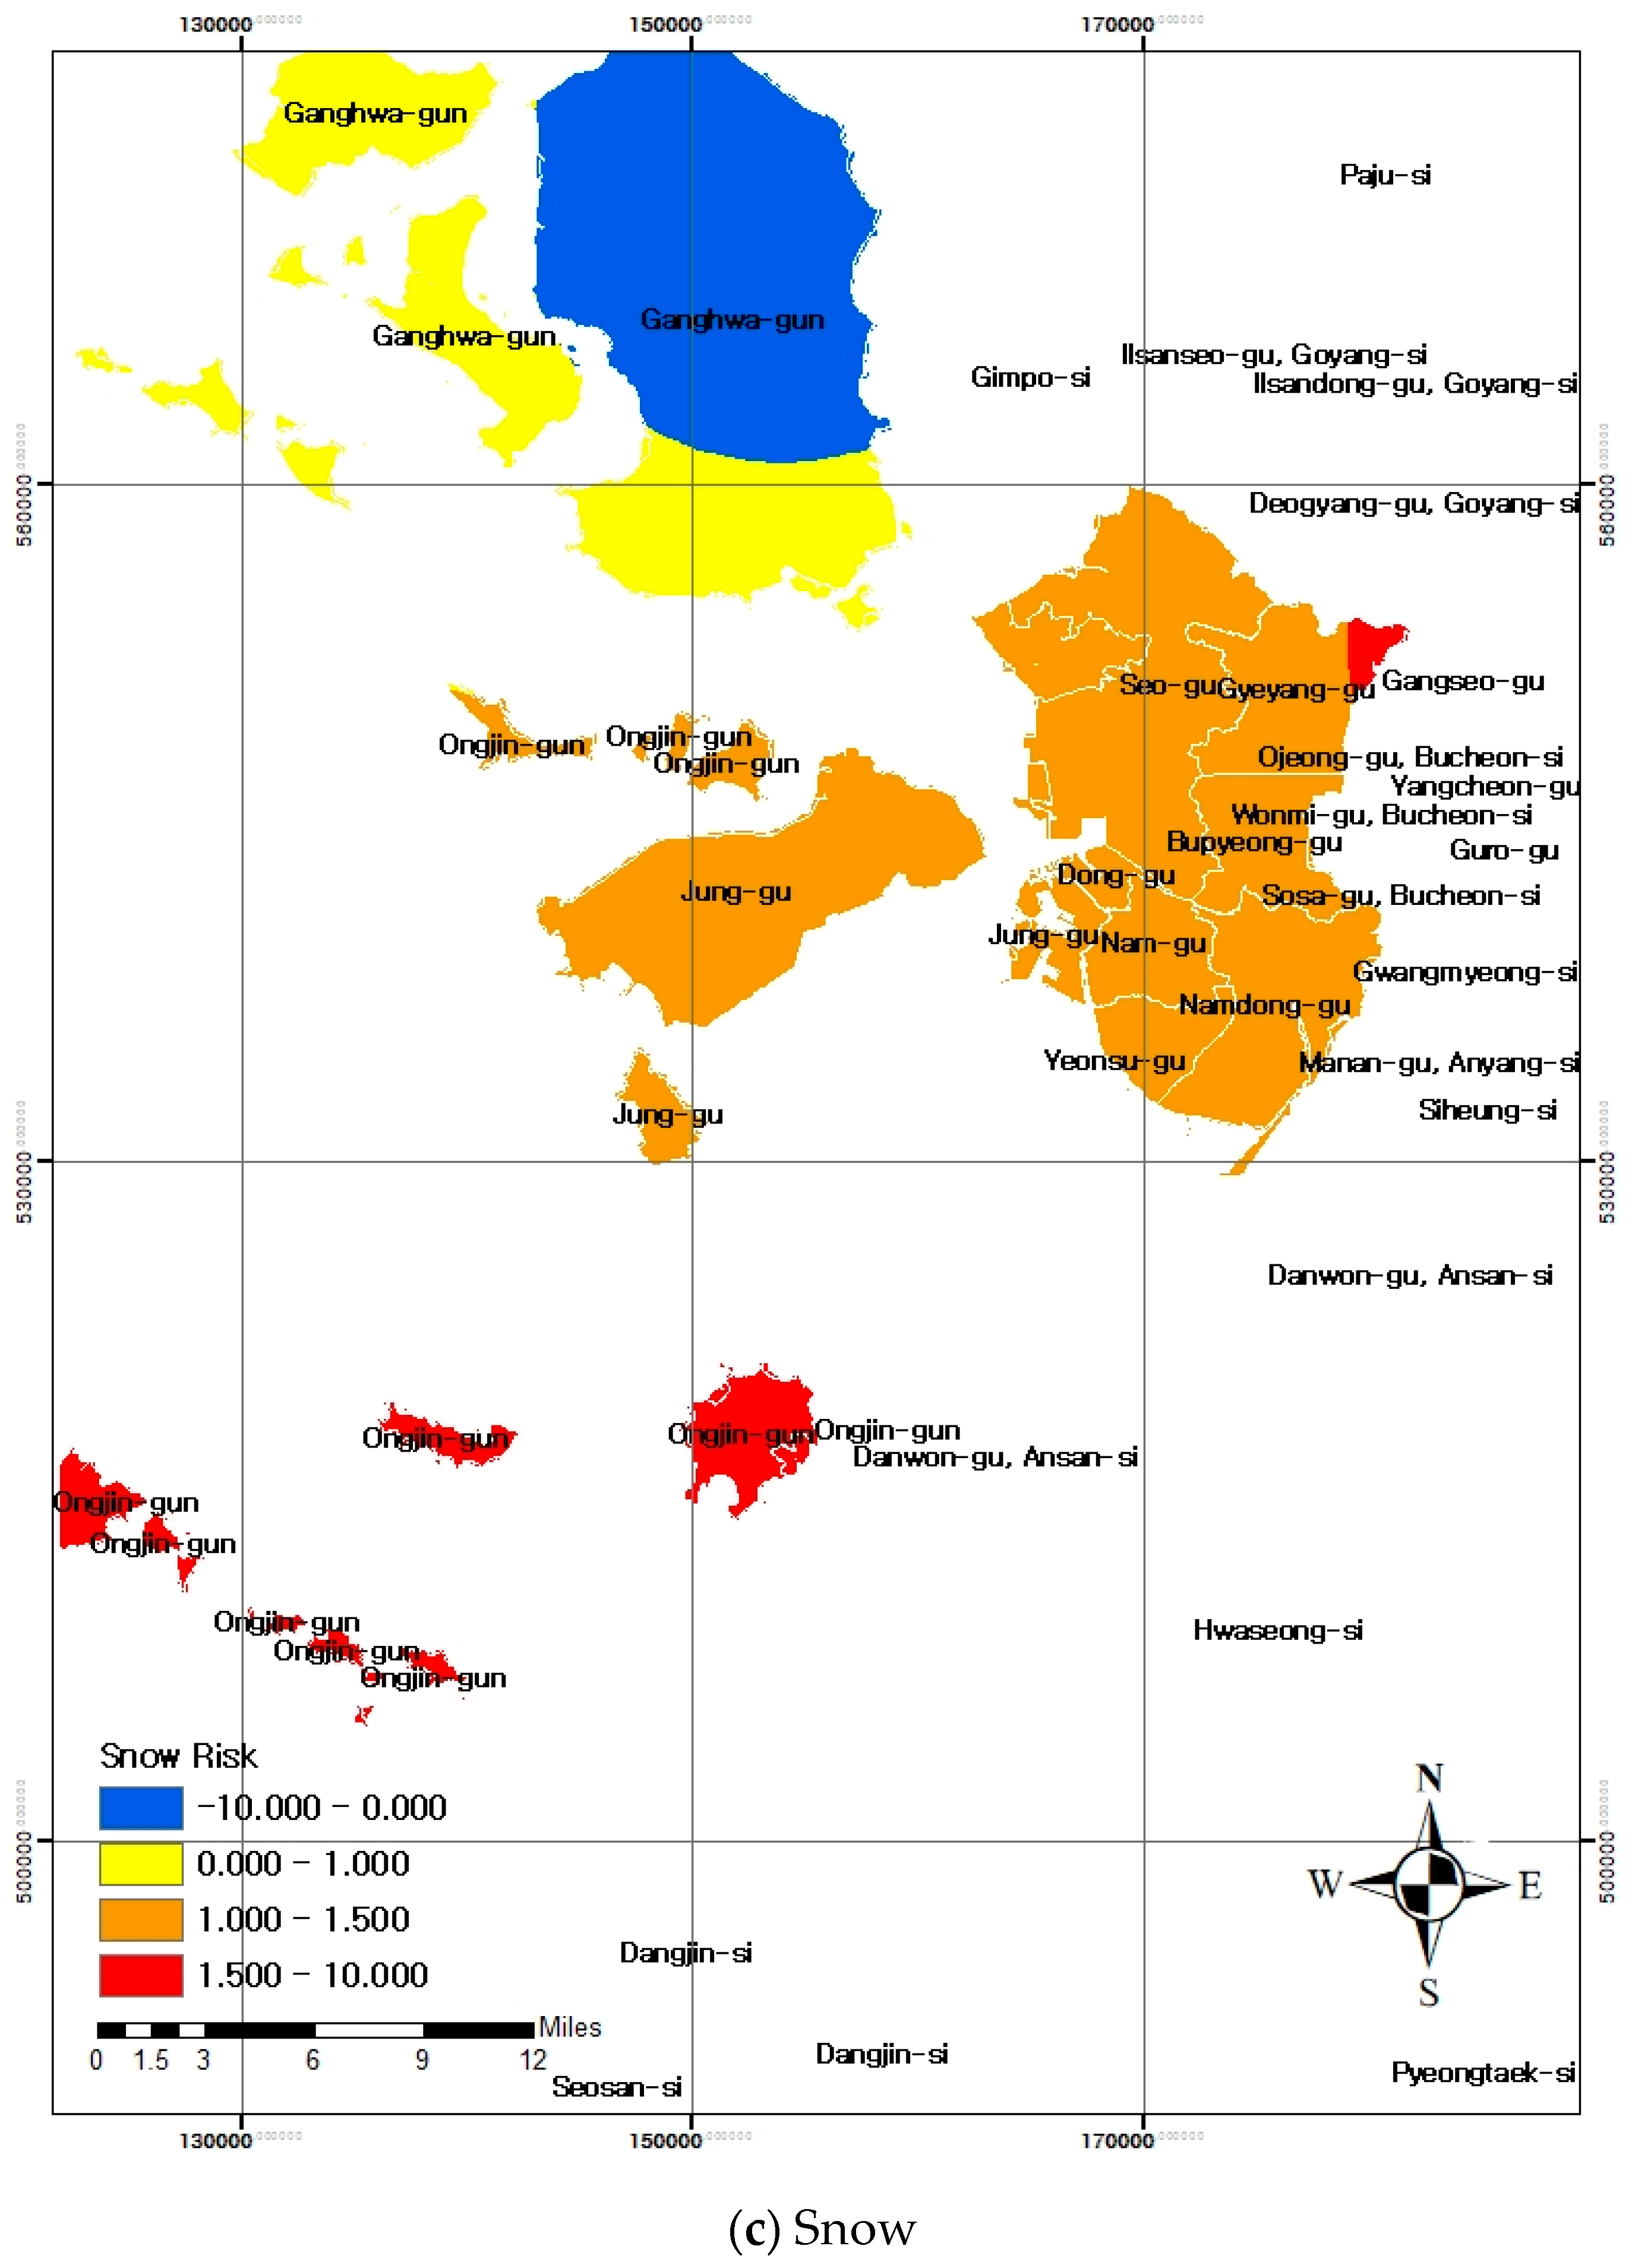
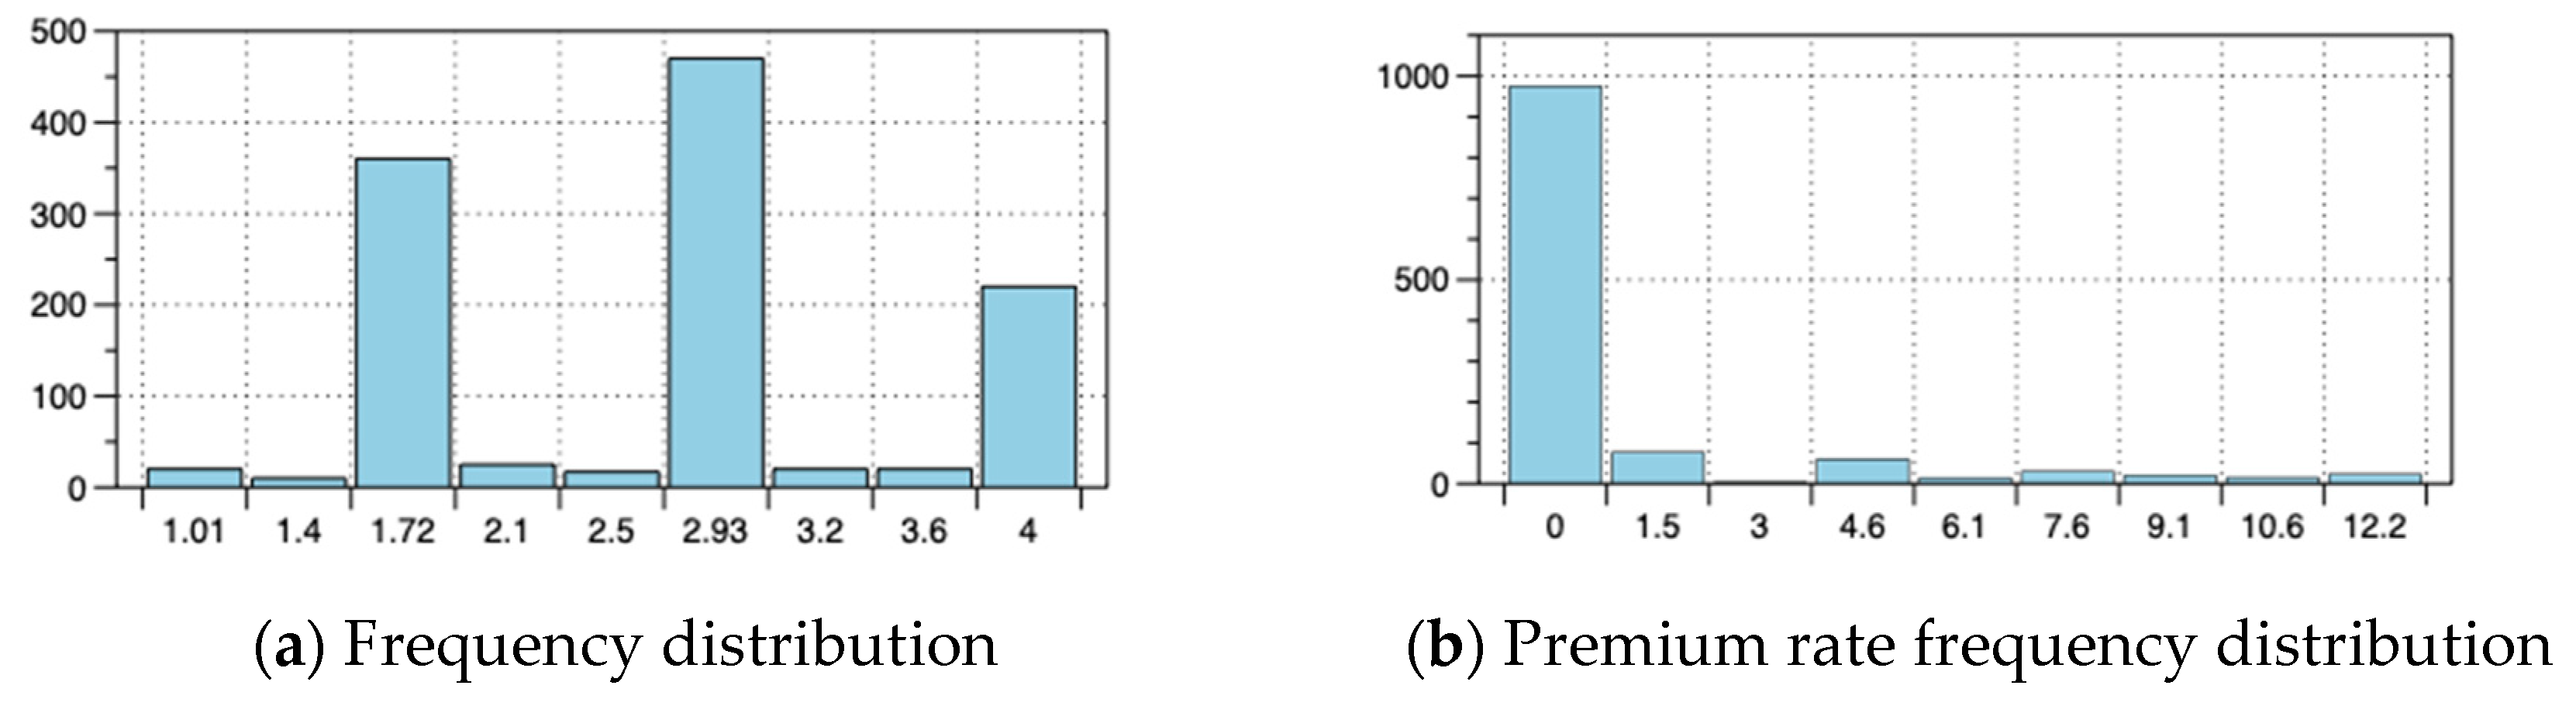
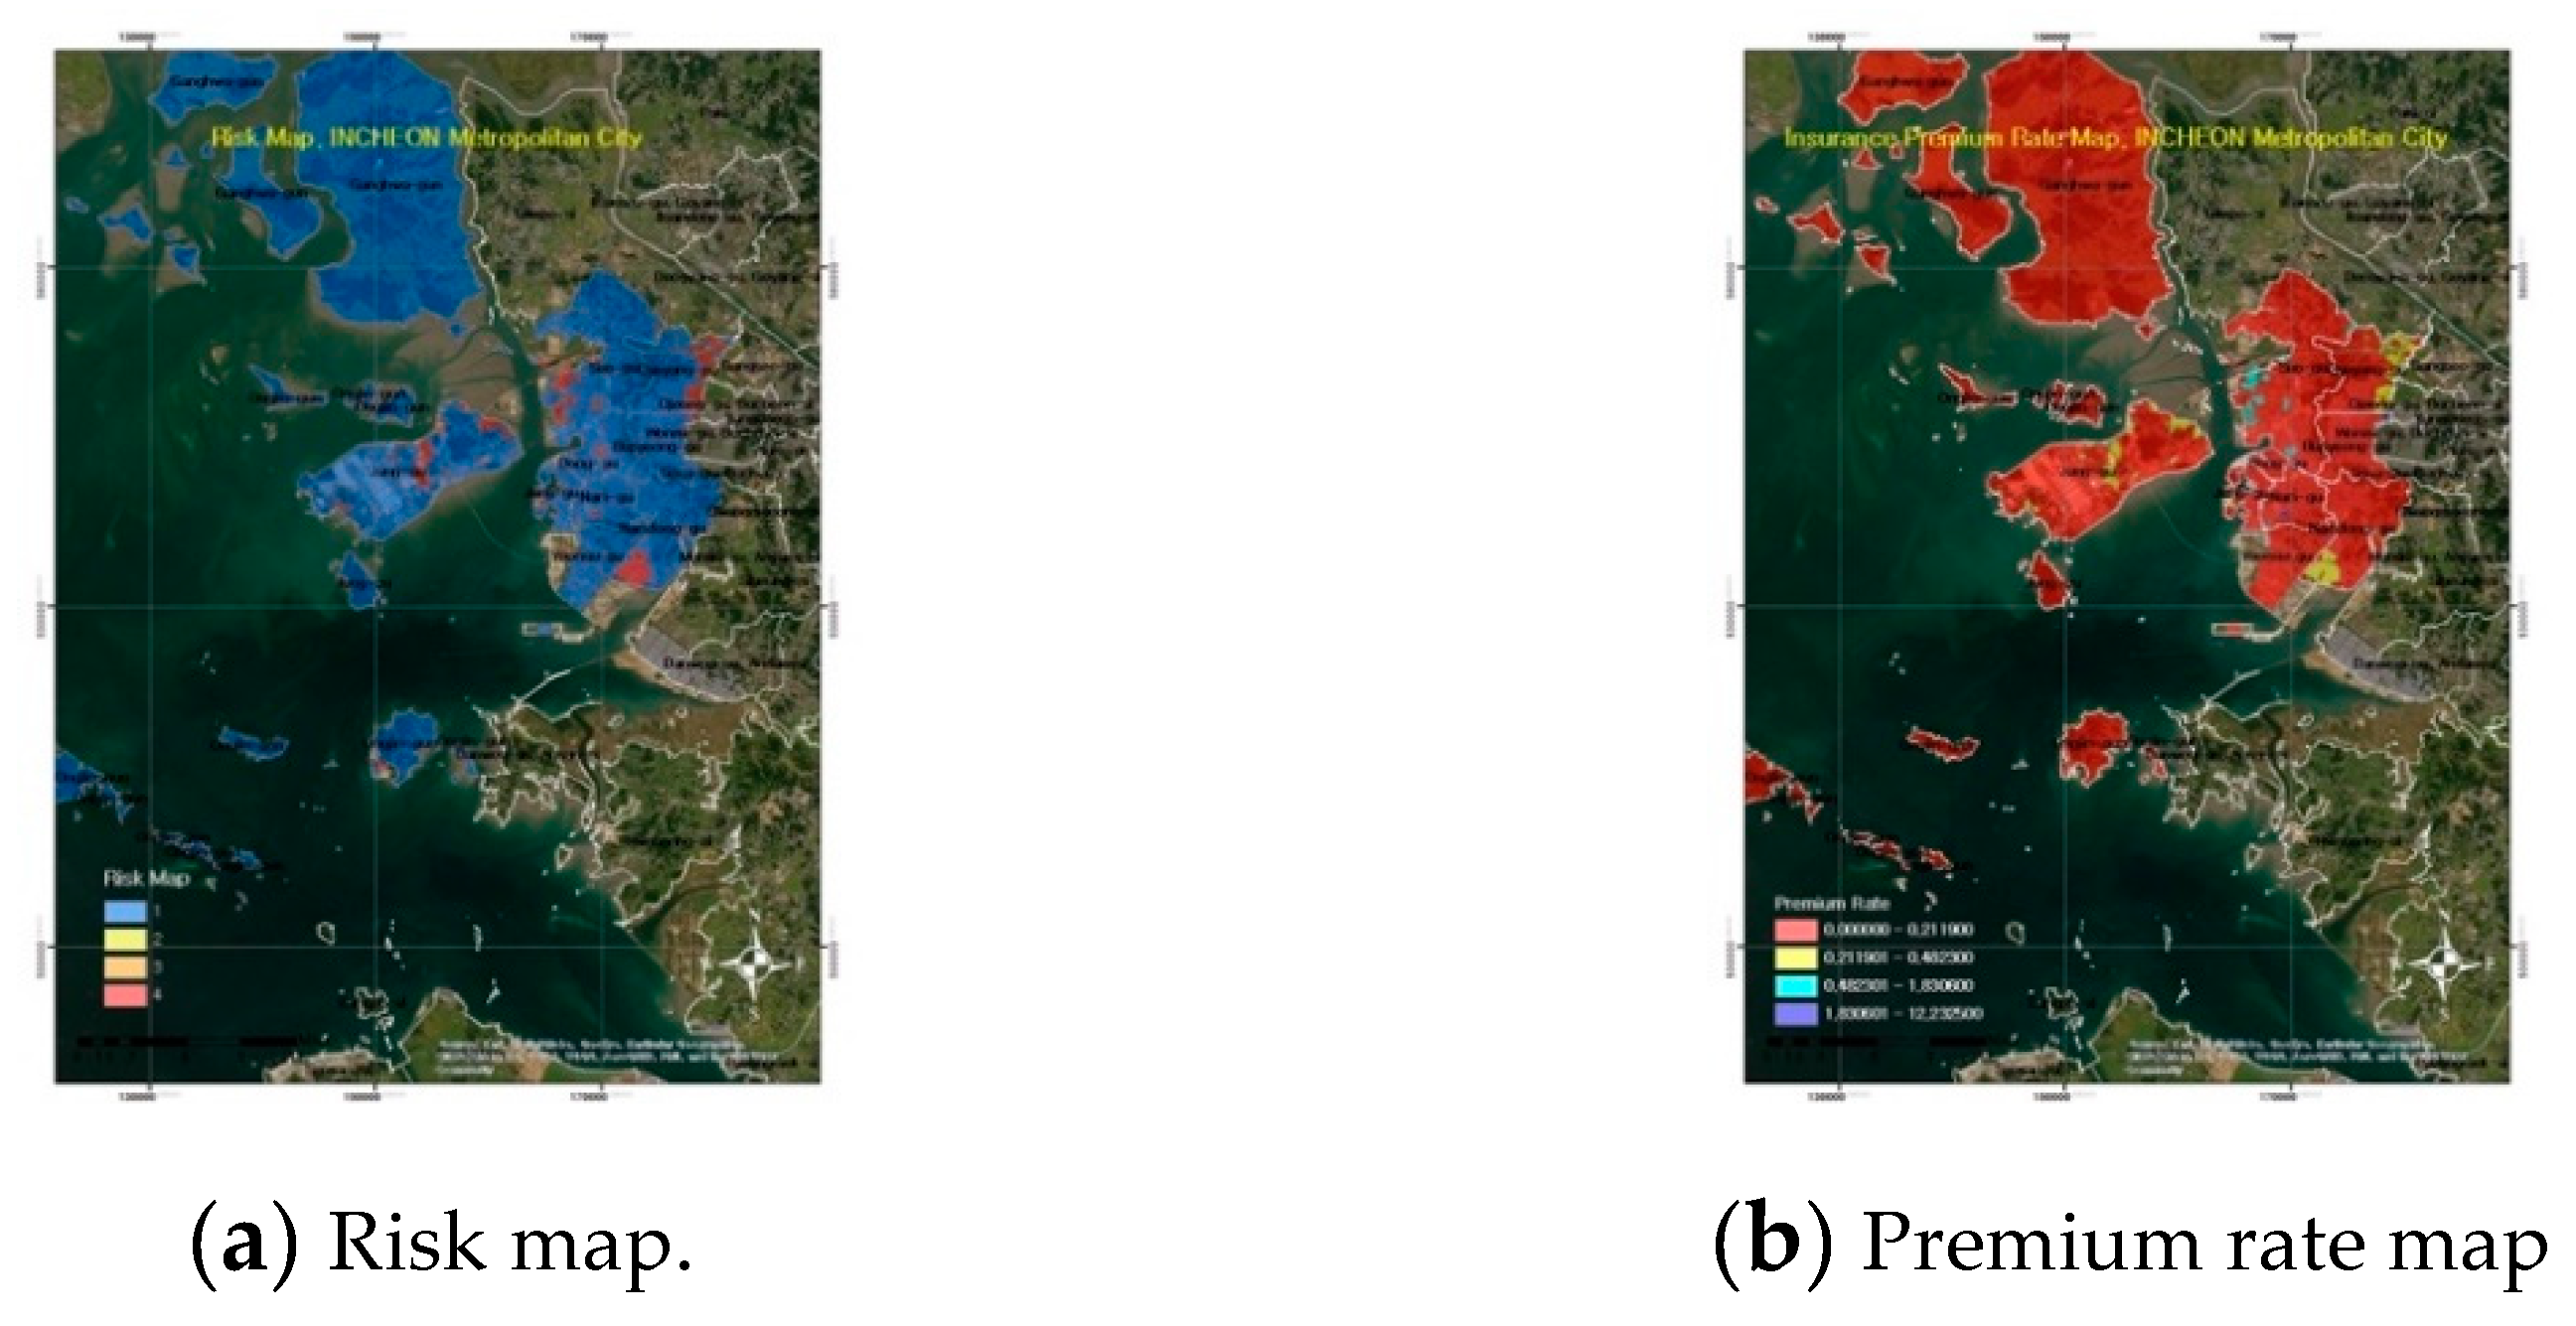
4.3.1. Risk Data

Table 3 shows the flood, storm, and snow risk attributes values. These data include the risk rating for storm damage data, snow damage data, and flood damage data (house).

4.3.2. Premium Rate

Table 4 shows the examples of risks and premium rates derived from the results of the ArcGIS Model builder processing and Excel’s pivot feature.
In Figure 6, flood, storm, and snow risks are visualized by ArcGIS (ver. 10.4) based on the original data values for the flood (a), storm (b), and snow (c), respectively.
Figure 7 shows the risk frequency distribution (a) and premium rate frequency distribution (b). The data population size for the statistical risk analysis is 1056; the minimum value is 1; the maximum value is 4; the mean is 2.85; the standard deviation is 0.77. From this, it can be seen that the Incheon metropolitan city’s risk rating is between "alert" and "danger." In addition, the data population size for premium rate statistical analysis is 1056; the minimum value is 0; the maximum value is 12.23; the mean is 0.71; the standard deviation is 1.37. The premium rate grade was 1 on most of the area, making the premium rates fairly small.

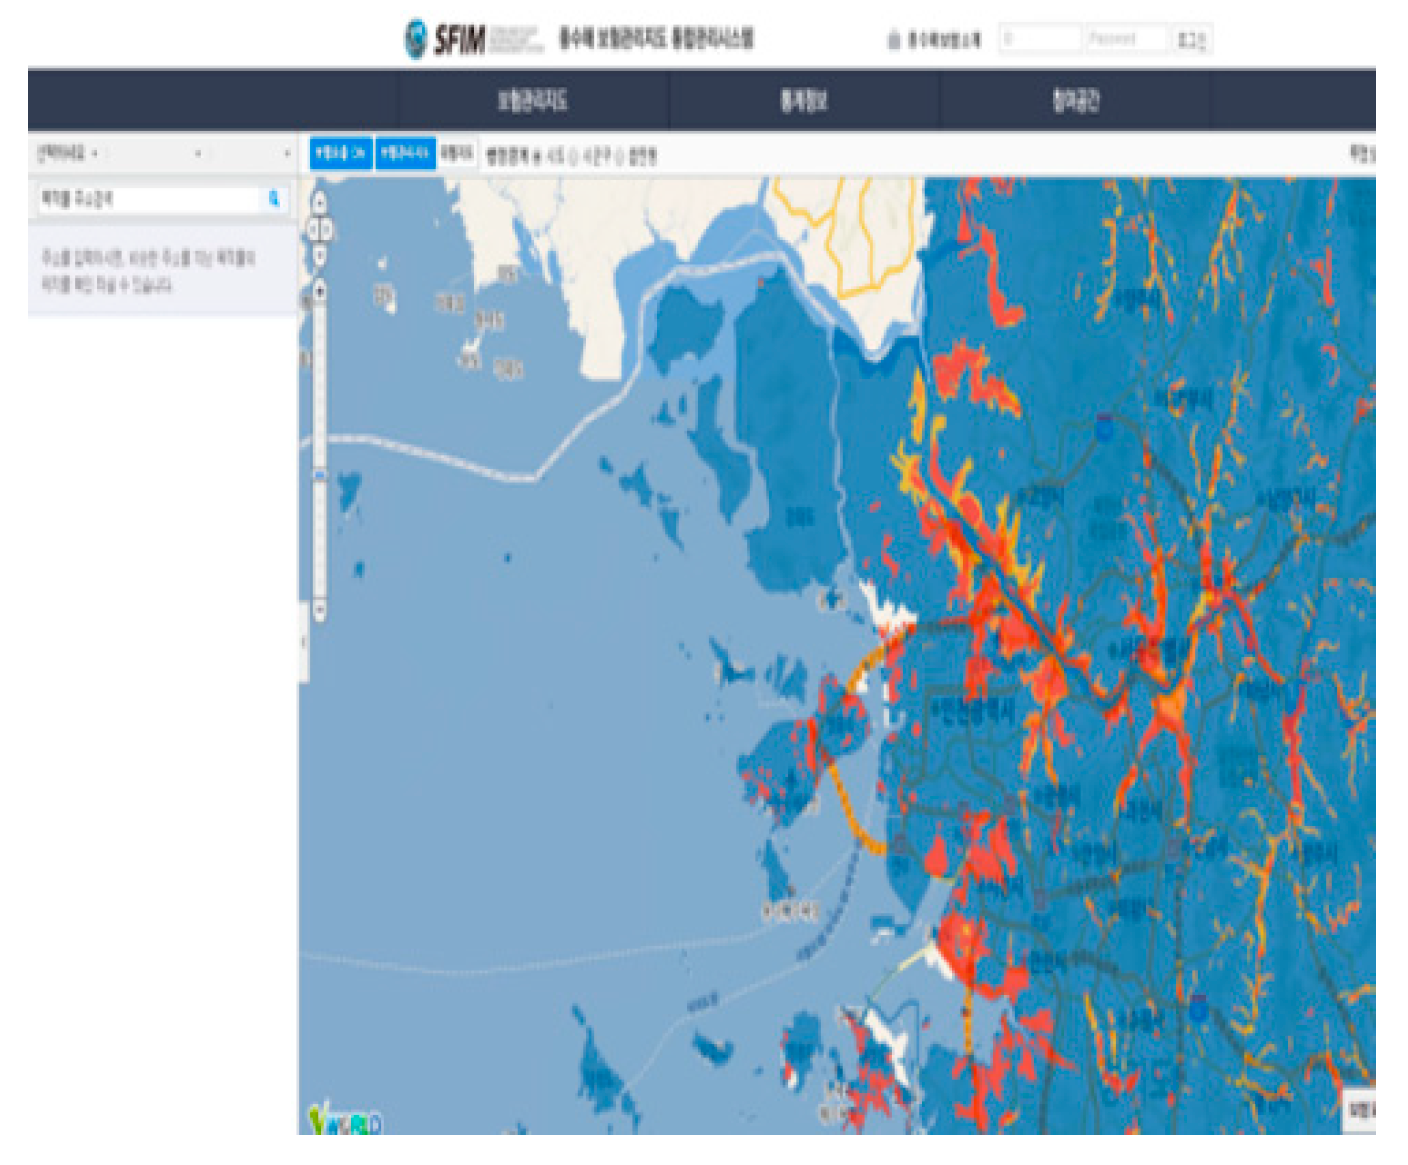
4.4. Mapping of Storm and Flood Insurance Management (SFIM)

Table 5 shows the database structure for the final data contained in the insurance management map, which includes an administrative district name, risk, rate, rate grade, etc. The basic spatial information is a digital elevation model built using a 1/5000 digital topographic map. Moreover, the risk is expressed as four ratings (levels) from I to IV, and the premium rates are shown as four grades from 1 to 4.7.
Figure 8 shows the fundamental map for Storm and Flood Insurance Management for Incheon metropolitan city; (a), risk map (b) premium rate map. Most regions of Incheon metropolitan city have a rating of grade 1 (safe), and only parts of the region have a 2 (alert), 3 (danger), or 4 (serious danger) grade. It can be seen that the island district of Ganghwa-gun has no river, so it is almost entirely grade 1. The premium rate becomes high around ports, ocean beaches, and rivers near the ocean.
The integrated management system built at this research is made of open source software such as GeoServer, PostGIS, etc., and Figure 9 shows the process for uploading and processing spatial information using open source software. The spatial information (shapefile) on the storm and flood damage target objects and the risk maps are saved in SQL format using shp2pgsql of PostGIS, and the coordinates, encoding, table attributes, etc., are specified in this process.
The data saved in PostGIS is transmitted to GeoServer so that it can be displayed on the web. In this process, space and data storage are created for the calculation tasks, and the PostGIS information is used to link to GeoServer. Next, the data storage and the PostGIS data tables are linked, and the style is applied to display the maps. Figure 10 shows the web-based Storm and Flood Insurance Management System.

5. Conclusions

This study used GIS analysis techniques to analyze risk and create a Storm and Flood Insurance Management map. The research results led us to the following conclusions.
To produce risks, inner water-, outer water-, storm-, and snow risks were produced based on a 10 m x 10 m digital elevation model grid. The flood risk was used as the standard risk when creating the insurance management maps, and the storm- and snow risks were used as weights for raising or discounting the cost when calculating the premium rates. To create risks, ArcGIS’ Raster calculator, grid classification, and spatial join functions were used, and Excel’s pivot function was used to calculate the flood areas by flood depth and premium rates. To handle an increasing amount of risk and premium rate data for creating the insurance management maps, we used the ArcGIS modeler to design an algorithm for automatically calculating risk and developing its execution program.
In the future, the Storm and Flood Insurance Management map can be used as the key information source for making scientific natural disaster prevention and response policies using regional storm and flood risk maps, for reasonable calculation and application of premium rates, for choosing regular dangerous areas for storm and flood damage, and promoting prevention policies.

Author Contributions

Conceptualization, I.L., J.L.; formal analysis, J.L.; funding acquisition, I.L.; writing—original draft, I.L.; writing—review and editing, S.H.

Funding

This research was supported by a grant (2019-MOIS32-015) from the Disaster-Safety Industry Promotion Program funded by the Ministry of Interior and Safety (MOIS, Korea), and by a grant [MPSS-NH-2013-62] through the Natural Hazard Mitigation Research Group funded by the Ministry of Public Safety and Security of the Korean Government.

Conflicts of Interest

The authors declare no conflict of interest. The funders had no role in the design of the study; in the collection, analyses, or interpretation of data; in the writing of the manuscript, or in the decision to publish the results.

References

  1. Korea Ministry of Government Legislation. Countermeasures Against Natural Disasters Act; Korea Ministry of Government: Sejong teukbyeol jachisi, Korea, 2018.
  2. Korea Ministry of Government Legislation. Storm and Flood Insurance Act; Korea Ministry of Government Legislation: Sejong teukbyeol jachisi, Korea, 2017.
  3. Shin, D.H. A study on the risk distribution of natural hazards and the role of government. J. Insur. Stud. 2005, 45, 49–75. [Google Scholar]
  4. Lee, H.-C.; Park, S.-Y.; Lee, C.-H.; Kim, Y.-S. The point at issue and improvement of natural disaster insurance rate system. J. Korean Soc. Hazard Mitig. 2014, 14, 223–232. [Google Scholar] [CrossRef]
  5. National Emergency Management Agency. Disaster Report; National Emergency Management Agency: Seoul, Korea, 2006. [Google Scholar]
  6. National Emergency Management Agency. Disaster Report; National Emergency Management Agency: Seoul, Korea, 2008. [Google Scholar]
  7. National Emergency Management Agency. Disaster Report; National Emergency Management Agency: Seoul, Korea, 2010. [Google Scholar]
  8. Lee, H.; Lim, H.; Shin, D.; Lee, J.; Lee, J.; Kim, Y. A Study on Calculation and Verification Method of Natural Disaster Insurance Rate. J. Korean Soc. Hazard Mitig. 2017, 17, 101–115. [Google Scholar] [CrossRef]
  9. Frederique, M.; Loat, R. Handbook on Good Practices for Flood Mapping in Europe Handbook on Good Practices for flood Mapping in Europe; European Exchange Circle on Flood Mapping (EXCIIMAP): Emmeloord, The Netherlands, 2007. [Google Scholar]
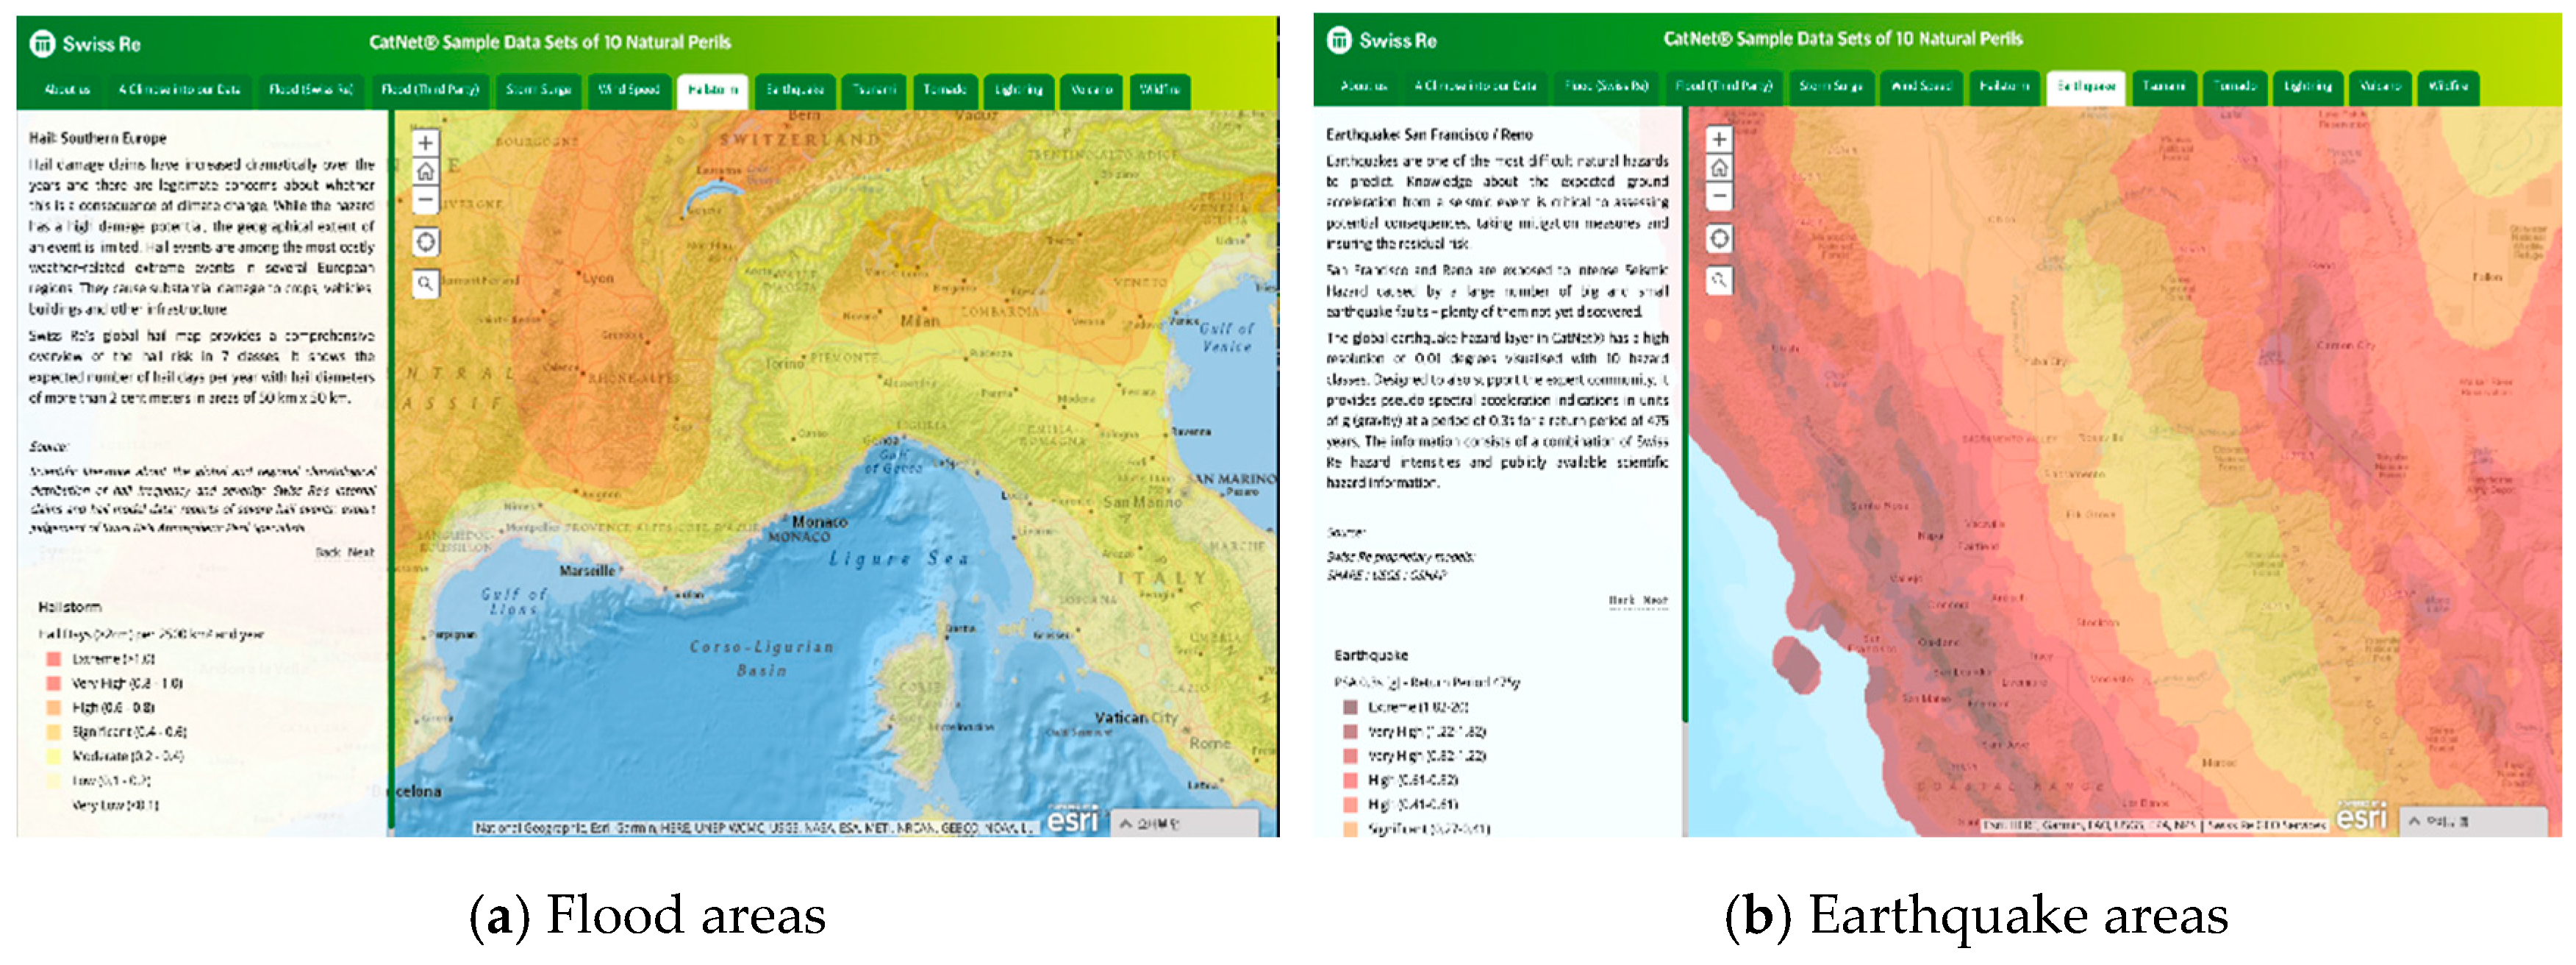
  10. Swiss Re Cat Net. Available online: https://www.swissre.com/reinsurance/property-and-casualty/solutions/property-specialty-solutions/catnet.html (accessed on 10 March 2019).
  11. de Moel, H.; van Alphen, J.; Aerts, J. Flood maps in Europe-methods, availability and use. Natural Hazards and Earth System Sciences. 2009, 9, 289–301. [Google Scholar] [CrossRef]
  12. Hsu, W.-K.; Huang, P.-C.; Chang, C.-C.; Chen, C.-W.; Hung, D.-M.; Chiang, W.-L. An integrated flood risk assessment model for property insurance industry in Taiwan. Nat. Hazards 2011, 58, 1295–1309. [Google Scholar] [CrossRef]
  13. FEMA Flood Insurance Rate Map (FIRM). Available online: https://www.fema.gov/flood-insurance-rate-map-firm (accessed on 10 March 2019).
  14. Shinjuku City Shinjuku Flood Hazard Map. Available online: http://www.city.shinjuku.lg.jp/anzen/htdocs/index.html (accessed on 10 March 2019).
  15. Park, S.; Jang, D.; Seo, B. Measures to Activate Storm and Flood Insurance Considering Comprehensive Reduction Measures. J. Korean Soc. Soc. Secur. 2009, 2, 3–7. [Google Scholar]
Figure 1. CatNet web map service, Swiss Re.
Ijgi 08 00485 g001
Figure 2. Flood and storm insurance business operation system.
Ijgi 08 00485 g002
Figure 3. Basic data.
Ijgi 08 00485 g003
Figure 4. Flowchart for generating insurance management map.
Ijgi 08 00485 g004
Figure 5. Storm and flood mapping model builder.
Ijgi 08 00485 g005
Figure 6. Risk map.
Figure 6. Risk map.
Ijgi 08 00485 g006aIjgi 08 00485 g006bIjgi 08 00485 g006c
Figure 7. Statistical analysis.
Ijgi 08 00485 g007
Figure 8. Fundamental map for storm and flood insurance management.
Ijgi 08 00485 g008
Figure 9. Spatial data upload process.
Ijgi 08 00485 g009
Figure 10. Web-based storm and flood insurance management system, NOAA SNC.
Ijgi 08 00485 g010
Table 1. Data, provider, and data formats.
DataProviderData Format
Flood riskDongbu EngineeringGRID, Shape
Storm riskQuber, Inc.GRID, Shape
Snow riskKongju National UniversityGRID, Shape
Premium rateKangwon National UniversityTable
Other data
(digital maps, DEM, hydrological analysis data)
Korea Land and Geospatial Informatix Corp.GRID, Shape, Table
Table 2. Items considered when calculating premium rates.
TypeDefinition
Mean damage ratioMDR (%)
- Insurance money/Insurance amount
(ex: experiential approach, vulnerability function modeling)
Premium rate calculation variables by risk grade GradeIIIIIIIV
Flood depth (h)h < 0 m0 m ≤ h < 0.5 m0.5 m ≤ h < 1 m1 m ≤ h
Damage history data by risk grade37 data (I: 23, II: 3, III: 3, IV: 8)
Weight of disaster causes Calculating average weight by disaster causes
- Amount of damage (Annual disaster report)
- Number of insurance accidents and Insurance money
* Weight of disaster causes of City, County, District
Table 3. Risk attributes table.
RisksnFIDWaterStormSnow
110.11 0.04
210.08 0.04
310.10 0.04
410.09 0.04
510.08 0.04
610.09 0.03
710.10 0.04
810.10 0.04
910.08 0.04
1030.10 0.04
1130.10 0.04
1240.10 0.04
1340.10 0.04
Table 4. Premium rates.
FIDJoin CodeRisksPremium Rate
1Namdong-gu110.05
2Bupyeong-gu110.11
3Jung-gu110.04
4Dong-gu110.08
5Gyeyang-gu110.12
6Ganghwa-gun110.07
7Seo-gu110.12
8Yeonsu-gu110.03
9Ganghwa-gun220.07
10Seo-gu441.83
11Seo-gu221.08
12Seo-gu331.24
13Seo-gu441.83
14Gyeyang-gu440.47
Table 5. Final database structure of Map for Storm and Flood Insurance Management.
CategoryMain ContentsNotes
ContentAdministrative
district, risk rating (risk), rate, rate grade
-
Basic spatial informationTopographical map DEM (10 m × 10 m grid)1/5000 digital topographic map
Risk (risk rating)
Premium rate grade
four ratings (I, II, III, IV)Based on flood depth

