Article

Using a Complex Network to Analyze the Effects of the Three Gorges Dam on Water Level Fluctuation in Poyang Lake

1
State Key Laboratory of Earth Surface Processes and Resource Ecology, Beijing Normal University, Beijing 100875, China
2
Key Laboratory of Environmental Change and Natural Disaster, Beijing Normal University, Beijing 100875, China
3
Center for Geodata and Analysis, Faculty of Geographical Science, Beijing Normal University, Beijing 100875, China
4
College of Environment and Planning, Henan University, Kaifeng 475003, China
*
Author to whom correspondence should be addressed.
ISPRS Int. J. Geo-Inf. 2019, 8(11), 470; https://doi.org/10.3390/ijgi8110470
Submission received: 30 August 2019 / Revised: 7 October 2019 / Accepted: 21 October 2019 / Published: 23 October 2019

Abstract

:
Because the Three Gorges Dam (TGD) has disturbed the normal hydrological regime downstream, analyzing the influence of the TGD on water level fluctuation is of great importance to ecological planning. The distribution and dynamic of the water level before and after the TGD were analyzed using frequency distribution and a complex network. Frequency distribution was unimodal before the TGD, and the peak ranged from 13–15 m. Frequency distribution was bimodal after TGD and two peaks ranged from 9–10 m and 16–17 m. The number of days when the water level was above warning level was reduced, and it was increased when the water level was below the ecological level. Further, the TGD had little effect on the number of days of rapid water level rising, which mainly existed during the flood season. However, this imposed a greater influence on the number of days of rapid water level decline, which implies a weaker intensity of the recession process, along with a longer duration. Thirdly, in winter and spring, the water level after the TGD was lower than that before the TGD by approximately 1 m. In summer, the number of days when the water level was above warning level was reduced. In autumn, the frequency distribution changed from unimodal to bimodal. The TGD has the greatest influence during the winter, which resulted in a lower water level and more severe drought.

1. Introduction

Wetlands are complicated and special ecosystems formed by soil, water, and organisms, and have evolved over billions of years [1,2]. They not only provide a great deal of natural resources for the survival and development of human beings [3] but are also of great significance to climate regulation [4], water conservation and purification [5], the protection of biodiversity, carbon sequestration [6], and other life-support functions [7]. As the key zone of intense interaction between various circle layers of the Earth [8,9], wetlands are listed as one of the three major ecosystems on Earth. Furthermore, wetlands are known as “the kidneys of the Earth” because of their important and unique ecological functions [10,11].
The abovementioned services probably depend on the health of the ecosystems. However, environments in wetlands are vulnerable to disturbance due to their transitional location between land and water [12,13,14]. During the past decades, several large water conservancy and hydroelectric projects have been built worldwide, which has changed the natural hydrological process downstream and caused unavoidable impact to the health of wetlands [15,16,17]. The Three Gorges Dam (TGD) is regarded as the world’s largest hydroelectric project to date. Advantageously, the construction of the TGD has brought great benefits for shipping, power generation, and flood control. Disadvantageously, it has inevitably affected the hydrological regime, e.g., disturbing water discharge and the water level of downstream rivers and lakes, altering the ecosystems and posing threats to the well-being of humans. Hence, its influence on the hydrological regime has elicited
Considerable concern worldwide ever since the planning phase, and there has been a large amount of research to document the impact of the TGD in recent years [18,19,20,21,22,23,24]. It should be noted that previous studies have been mostly conducted using statistical methods and they mainly focused on the numerical values in stationary time series [25]. For example, Xu and Milliman showed that the problems of severe channel erosion and drastic sediment decline have been brought about by the TGD, and revealed this through the statistics of sediment and water discharge [20]. Moderate-resolution imaging spectroradiometery time series were utilized to reveal significantly decreasing trends in the inundation areas of Poyang Lake and Dongting Lake [24]. In view of the nonlinear and non-stationary characteristics of the hydrological series, it is difficult to reveal the dynamic variation of hydrological elements due to human activities and the construction of the TGD using traditional methods.
In recent years, with the discovery of ‘small-world’ networks [26], ‘scale-free’ networks [27], and Newman and Watts networks [28], the complex network approach has provided us with a new research perspective, and a wave of research related to various disciplines and fields has arisen using network approaches [29,30,31,32,33,34,35]. Coarse-graining and symbolism processing is one of the effective methods to construct a complex network and analyse the fluctuation of a time series [36]. Then, fluctuation patterns hidden in the time series are extracted and encoded into the topology of the corresponding networks, and a directed weighted complex network is conveniently constructed. Through analysing the structural properties and topological parameters of the complex network, dynamic information and inherent laws of the hydrological regime hidden in the time series can be explored via the topological statistics [36,37,38]. Therefore, the complex network model has been widely used in time series analysis, and great progress has been made in studies analysing stock holdings [39], tourist flows [36], natural disasters [40], stock markets [37,41], crude oil prices, and trade [25,42,43]. However, this method is seldom used in the field of hydrology, let alone in analysing the differences of hydrological regimes before and after the construction of human projects.
Poyang Lake is a typical outland lake and the largest freshwater lake in China. Poyang Lake is home to a large amount of animals and plants with extreme biodiversity due to the abundant water and heat resources [44]. Located immediately downstream of the TGD, Poyang Lake is one of the two largest freshwater lakes linked to the TGD. The water level, which guarantees the existence of biodiversity and growth in the region, is directly and obviously affected by the construction of the TGD [24]. In the current research, frequency distribution was employed to describe the distribution of the water level using water level data from Poyang Lake before and after the TGD, from the period of 1991–2016. Then, coarse-graining and symbolism processing were introduced into the hydrological analysis, and two directed complex networks were built to analyse the fluctuation pattern and dynamics information hidden in the hydrological time series before and after the TGD. The objectives of the study were to: 1) Analyse the difference of the distribution of the water level before and after the TGD; 2) analyse the difference of the seasonal distribution of the water level before and after the TGD, and 3) further explore the variation of the hydrodynamics patterns of the water level before and after the TGD. The results and discoveries can provide us with more information about the influence of the largest hydraulic projects on the fluctuation of the water level downstream, and to make scientific and effective decisions about environmental protection and project management.

2. Materials and Methods

2.1. Study Area and Data

Poyang Lake is located in the southern part of the middle reach of the Yangtze River Basin in northern Jiangxi Province, approximately between 114°41′35″ and 116°50′26″ longitude and 27°3′18″ and 29°55′55″ latitude. The lake has a watershed area of 162200 km2 and is controlled by a subtropical, monsoon climate. It receives inflows from five rivers, namely, the Xiushui, Ganjiang, Fuhe, Xinijiang and Raohe. Accordingly, the area of Poyang Lake varies significantly, and the minimum and maximum areas are 244 km2 and 4553 km2, respectively, due to the seasonal precipitation and special topography [45].
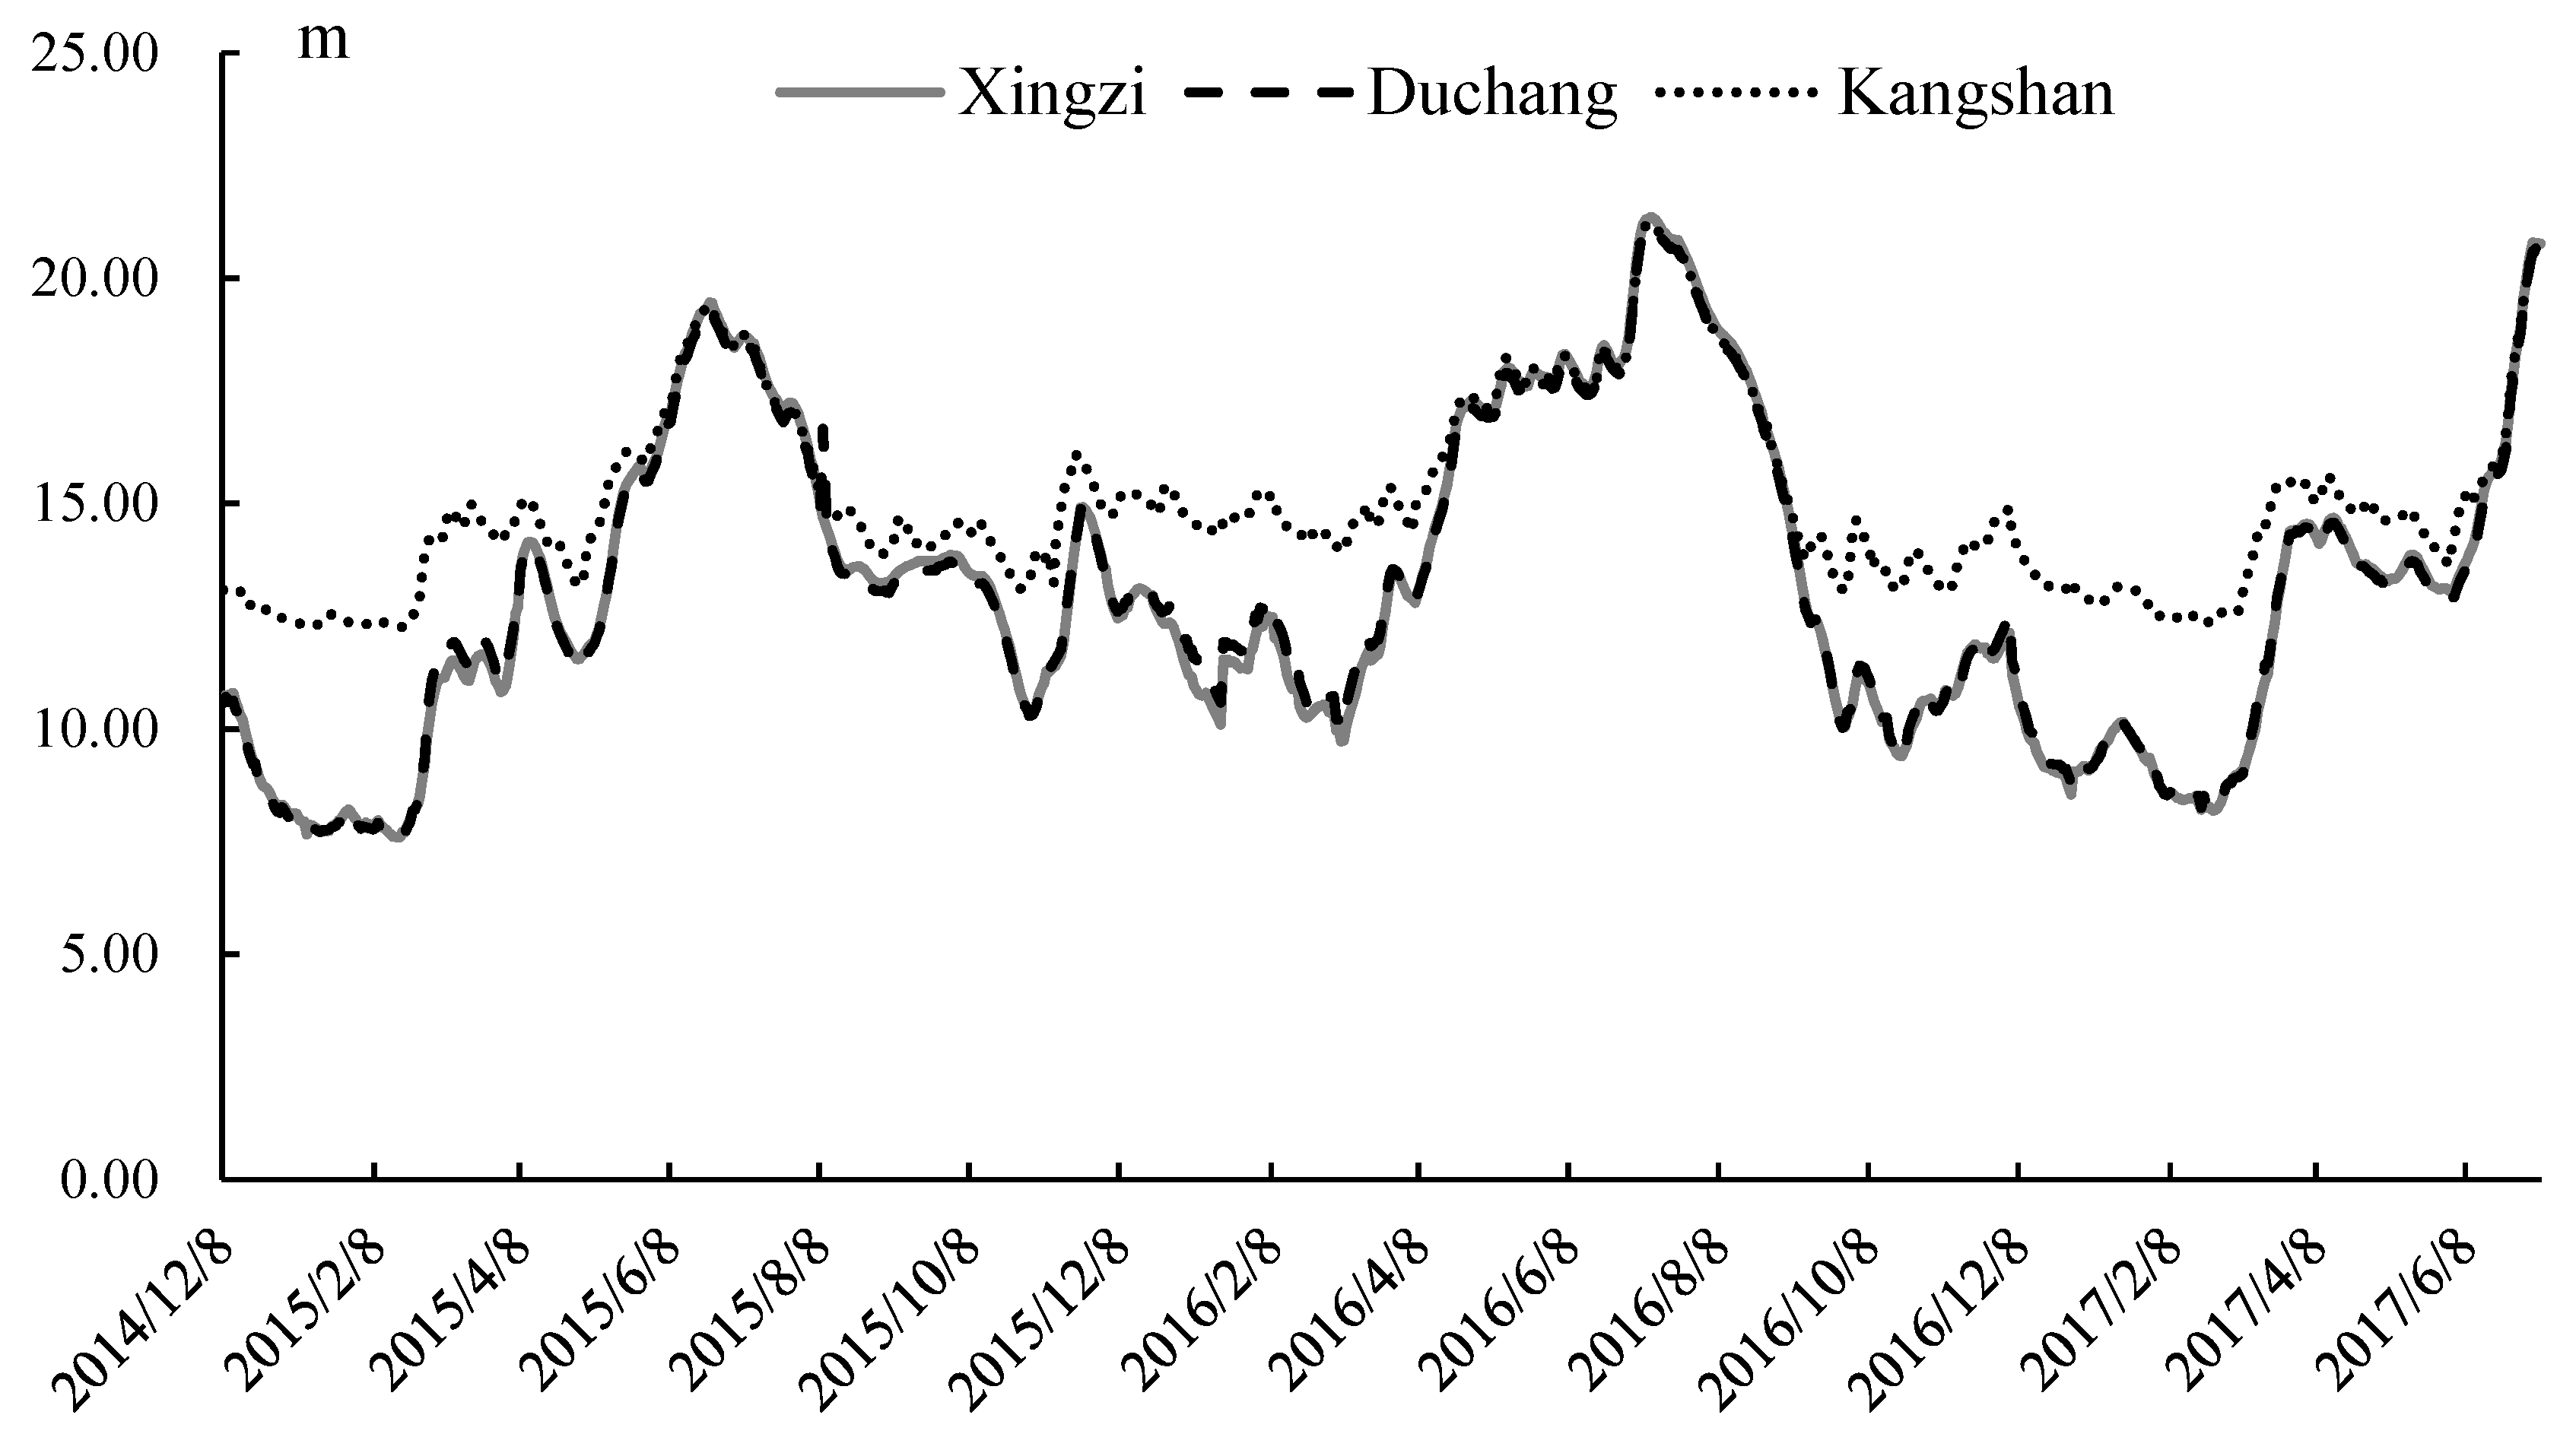
The hydrological regime of Poyang Lake is complicated by a strong river–lake interaction and complex hydraulic connection. Xingzi, Duchang, and Kangshan stations are the main hydrological stations. Duchang station is located in the central part of the lake, and Kangshan is located at the southern part of the lake. Xingzi Station is located on the northern edge of the lake and away from the junction of the lake and Yangtze River. Similarly, they are all located in Poyang Broad Lake (Figure 1). Here, we used the observed water level data from the three gauging stations to analyse their relationship, and the time span of the data is 8 December 2014 to 8 July 2017 (Figure 2 and Table 1). The Pearson correlation coefficient revealed that the water level at Xingzi, Duchang, Kangshan stations are closely related, so they can all be used to reflect the hydrological regime of the lake. In spite of this, Xingzi is considered the best station to stand for the water level of Poyang Lake and reflect the proximal effect of the river because slight differences of the lake level could be observed [45,46,47]. Moreover, due to its unique position, the water level variation of Xingzi station can not only reflect the hydrological regime of Poyang Lake, but also reflect the influence of Yangtze River. Li [48] employed a physically based hydrodynamic model to quantify the contributions of the river to the lake’s water level variation. The study found that, between April and June, the water level changes at Xingzi station were more remarkable than those at Duchang, Tangyin, and kangshan station affected by the 30% reduction of Yangtze River discharge. Additionally, a more notable variation of the water level was observed in the northern parts of the lake affected by the increment of Yangtze River discharge. Further, model simulations revealed that, between July and August, the Yangtze River imposed a greater influence on the water level, resulting in a change as much as 0.68–2.61 m. Meanwhile, these changes reduced from North to South. In summary, Xingzi station was selected to represent the water level of the lake and it could reflect the influence of the Yangtze River. Additionally, it has been established for a long time, so it has a long history of observation. In the current research, Xingzi Station was selected as the representative hydrologic station downstream of the Yangtze River, and the water level data was selected to analyse the variation of the water level downstream of the Yangtze River.
The data used in this paper mainly include the water level data monitored at Xingzi Station, which was acquired from the Hydrological Bureau of Jiangxi Province. The time period selected was from 1991 to 2016, for a total of 26 years, and the time step is one day. The website of the Hydrological Bureau of Jiangxi Province provided the water level data at 24 observation stations, e.g., Xingzi, Duchang, and Kangshan stations. The water level was automatically measured using pressure transducers or noncontact transducers, based on the reference of elevation systems of Wusong. Water level data was recorded every day by the author from 2014.
Other datasets were also needed, such as the boundaries of the Poyang Lake basin.

2.2. Methods

2.2.1. Change-Point Analysis

With climate change and human activities, the hydrologic regime of Poyang Lake has changed significantly over the past several decades. Based on the purpose of this study, a natural question would be whether the water level of Poyang Lake was related to the TGD. This paper used water level data to quantitatively detect the abrupt change points in order to identify the definite time point when the TGD began to work. There are a number of methods that can be applied to determine change points of a time series [49,50]. Change point analysis (CPA) has been widely utilized to detect change points in time series of hydrological and meteorological parameters. Briefly, a combination of cumulative sum charts (CUSUM) and bootstrap techniques is used to detect abrupt change points. By calculating and plotting a cumulative sum based on the data, a CUSUM chart was constructed. The cumulative sums, S0, S1, … Sn, were the sums between the values and the average, and they are calculated iteratively in the following steps [51].
a. Set S0 = 0, and the average of time series Xaverage was calculated. Then, Si = Si − 1+(XiXaverage), i = 1, 2, …, n.
The cumulative sums always end at zero, because the sum of the differences is zero. A sudden change in the direction of the CUSUM indicates a shift or change in the average. Bootstrap analysis will be performed to determine the confidence level in the following steps.
b. A bootstrap sample of n units, X10, X20, … Xn0, was generated by randomly reordering the original n values.
c. The bootstrap CUSUM, S10, S20, … Sn0, were calculated based on the generated bootstrap sample.
d. The minimum, the maximum, and the difference of the bootstrap CUSUM, Smin0, Smax0, Sdiff0, were calculated.
e. Determine whether the original Sdiff is more than the bootstrap Sdiff0 or not.
f. Iterate the procedure a-d N times
g. Let X be the number of bootstrap for Sdiff0 < Sdiff, and calculate the confidence level (CL = 100X/N%) where a change point occured.
Detailed processing of the CUSUM and bootstrapping could be acquired from other articles [52,53,54]. Change-Point Analyser v3.2 software developed by Taylor was applied for change point analysis [55].

2.2.2. Complex Network Generated by Coarse-Graining Processing

Coarse-graining processing is homogenously partitioned in system intervals, and the intervals are averagely separated into limited subintervals [37,56]. A symbol represents each subinterval, and the time series can be transformed into a discrete symbolic sequence. Then, the analysis of the symbolic sequence is equivalent to analysing the time series [36,41]. A hydrological time series of Xingzi Station can be coarse-grained into a symbolism sequence, which can be modeled as a complex network. By representing the time series via a complex network, various parameters, e.g., water level dynamics, can be extracted from the network organization. In the networks, each node represents a different fluctuation pattern of the water level, the edges connecting the nodes represent transfer information, and the weight of each edge is the degree of transfer. The statistical properties constituting the network are of great importance for understanding the dynamics of the hydrological time series. The processing is as follows:
a. Fitting to get the trend (or slope) of water level fluctuation in three consecutive days requires the use of a moving three-day window to smooth out the outliers. The least squares method was used to fit the trend (or slope), named k, of the water level time series (T(t)).
k ( i 3 ) = t = 1 i t × T ( t ) 1 i ( t = 1 i T ( t ) ) ( t = 1 i t ) t = 1 i t 2 1 i ( t = 1 i t ) 2   ( i = 3 , 4 , , n ) .
b. The probability, named P(k), of the occurrence of different hydrological fluctuations was calculated,
P ( k ) = k N u m ( x ) N d x
where Num(x) is the number of occurrences of the fluctuation mode x.
c. P(k) was divided into five equal-probability intervals, and the k(t) functions falling in these five intervals were expressed as five meta patterns, which are R, r, e, d, and D. So, each meta pattern represents the three-day fluctuation characteristics of water level.
s i = { R , 0 > P ( k ) > 0.2 r , 0.2 P ( k ) > 0.4 e , 0.4 P ( k ) > 0.6 d , 0.6 P ( k ) > 0.8 D , 0.8 P ( k ) > 1.0
where R stands for rapid rising of the water level, r for slow rising, e for relative stability, d for slow declining, and D for rapid declining.
d. By performing the coarse-graining process mentioned above, the time series of the water level could be transformed into a meta pattern series.
S n = ( s 1 , s 2 , s 3 , ) , ( s i ( R , r , e , d , D ) )
e. We let n-string be a string composed of n symbols, yielding 5n different n-strings with a given n. We defined the n-strings, which can be regarded as motifs of symbolic sequences, as significant patterns of interconnections. In a weather system, one complete weather process ranges from 5 to 7 days [57]. Therefore, 3 was selected as n, and the three-string meta patterns, (e.g., R, R, R,) were constituted as one fluctuation pattern (e.g., RRR). Because of the fact that there is one coincidence day between two consecutive meta patterns, or two coincidence days in three meta patterns, one fluctuation pattern represents the fluctuation characteristics in seven days, rather than nine days.
As one fluctuation pattern consists of three-symbol strings, the fluctuation patterns of Sn evolve into {RRRRrRrrrrdeeDDDdD→…}. Here, the three-symbol strings were called patterns.
f. A weighted complex network was introduced to describe the interaction of fluctuation of time series, where fluctuation patterns consisted of three-symbol string are defined as the nodes of the network, the connection relationship between two nodes are defined as edges, and the weights of the edges indicate the number of connection relationship.

2.2.3. The Measurement of Betweenness Centrality (BC) of Complex Network Topology Parameters

After constructing the complex network, analysing the topological architecture is important to understand the fluctuations of the hydrological regime. A good measurement of the network’s topological architecture has to incorporate more global information. The topological importance of a node is equivalent to the connectivity with other nodes, which is the centrality of node measuring capability of obtaining and controlling information or resource [37,41,58]. BC may be the best parameter to measure the importance of a node which has been widely used in network analysis. It is an important quantitative parameter indicating how influential a node is in the network communications between each pair of nodes [59,60].
Here, we use c(i,j) to denote the number of shortest pathways between nodes i and j. Among them, let ck(i,j) to denote the number of shortest pathways running through a node k. Then, gk(i,j) is defined as:
g k ( i ,   j ) = c k ( i , j ) c ( i , j )
Then, BC of the node k could be defined as the following:
g k = { ( i , j ) } c k ( i , j ) c ( i , j ) = { ( i , j ) } g k ( i , j )

3. Results

3.1. Change Point (CPA) Analysis

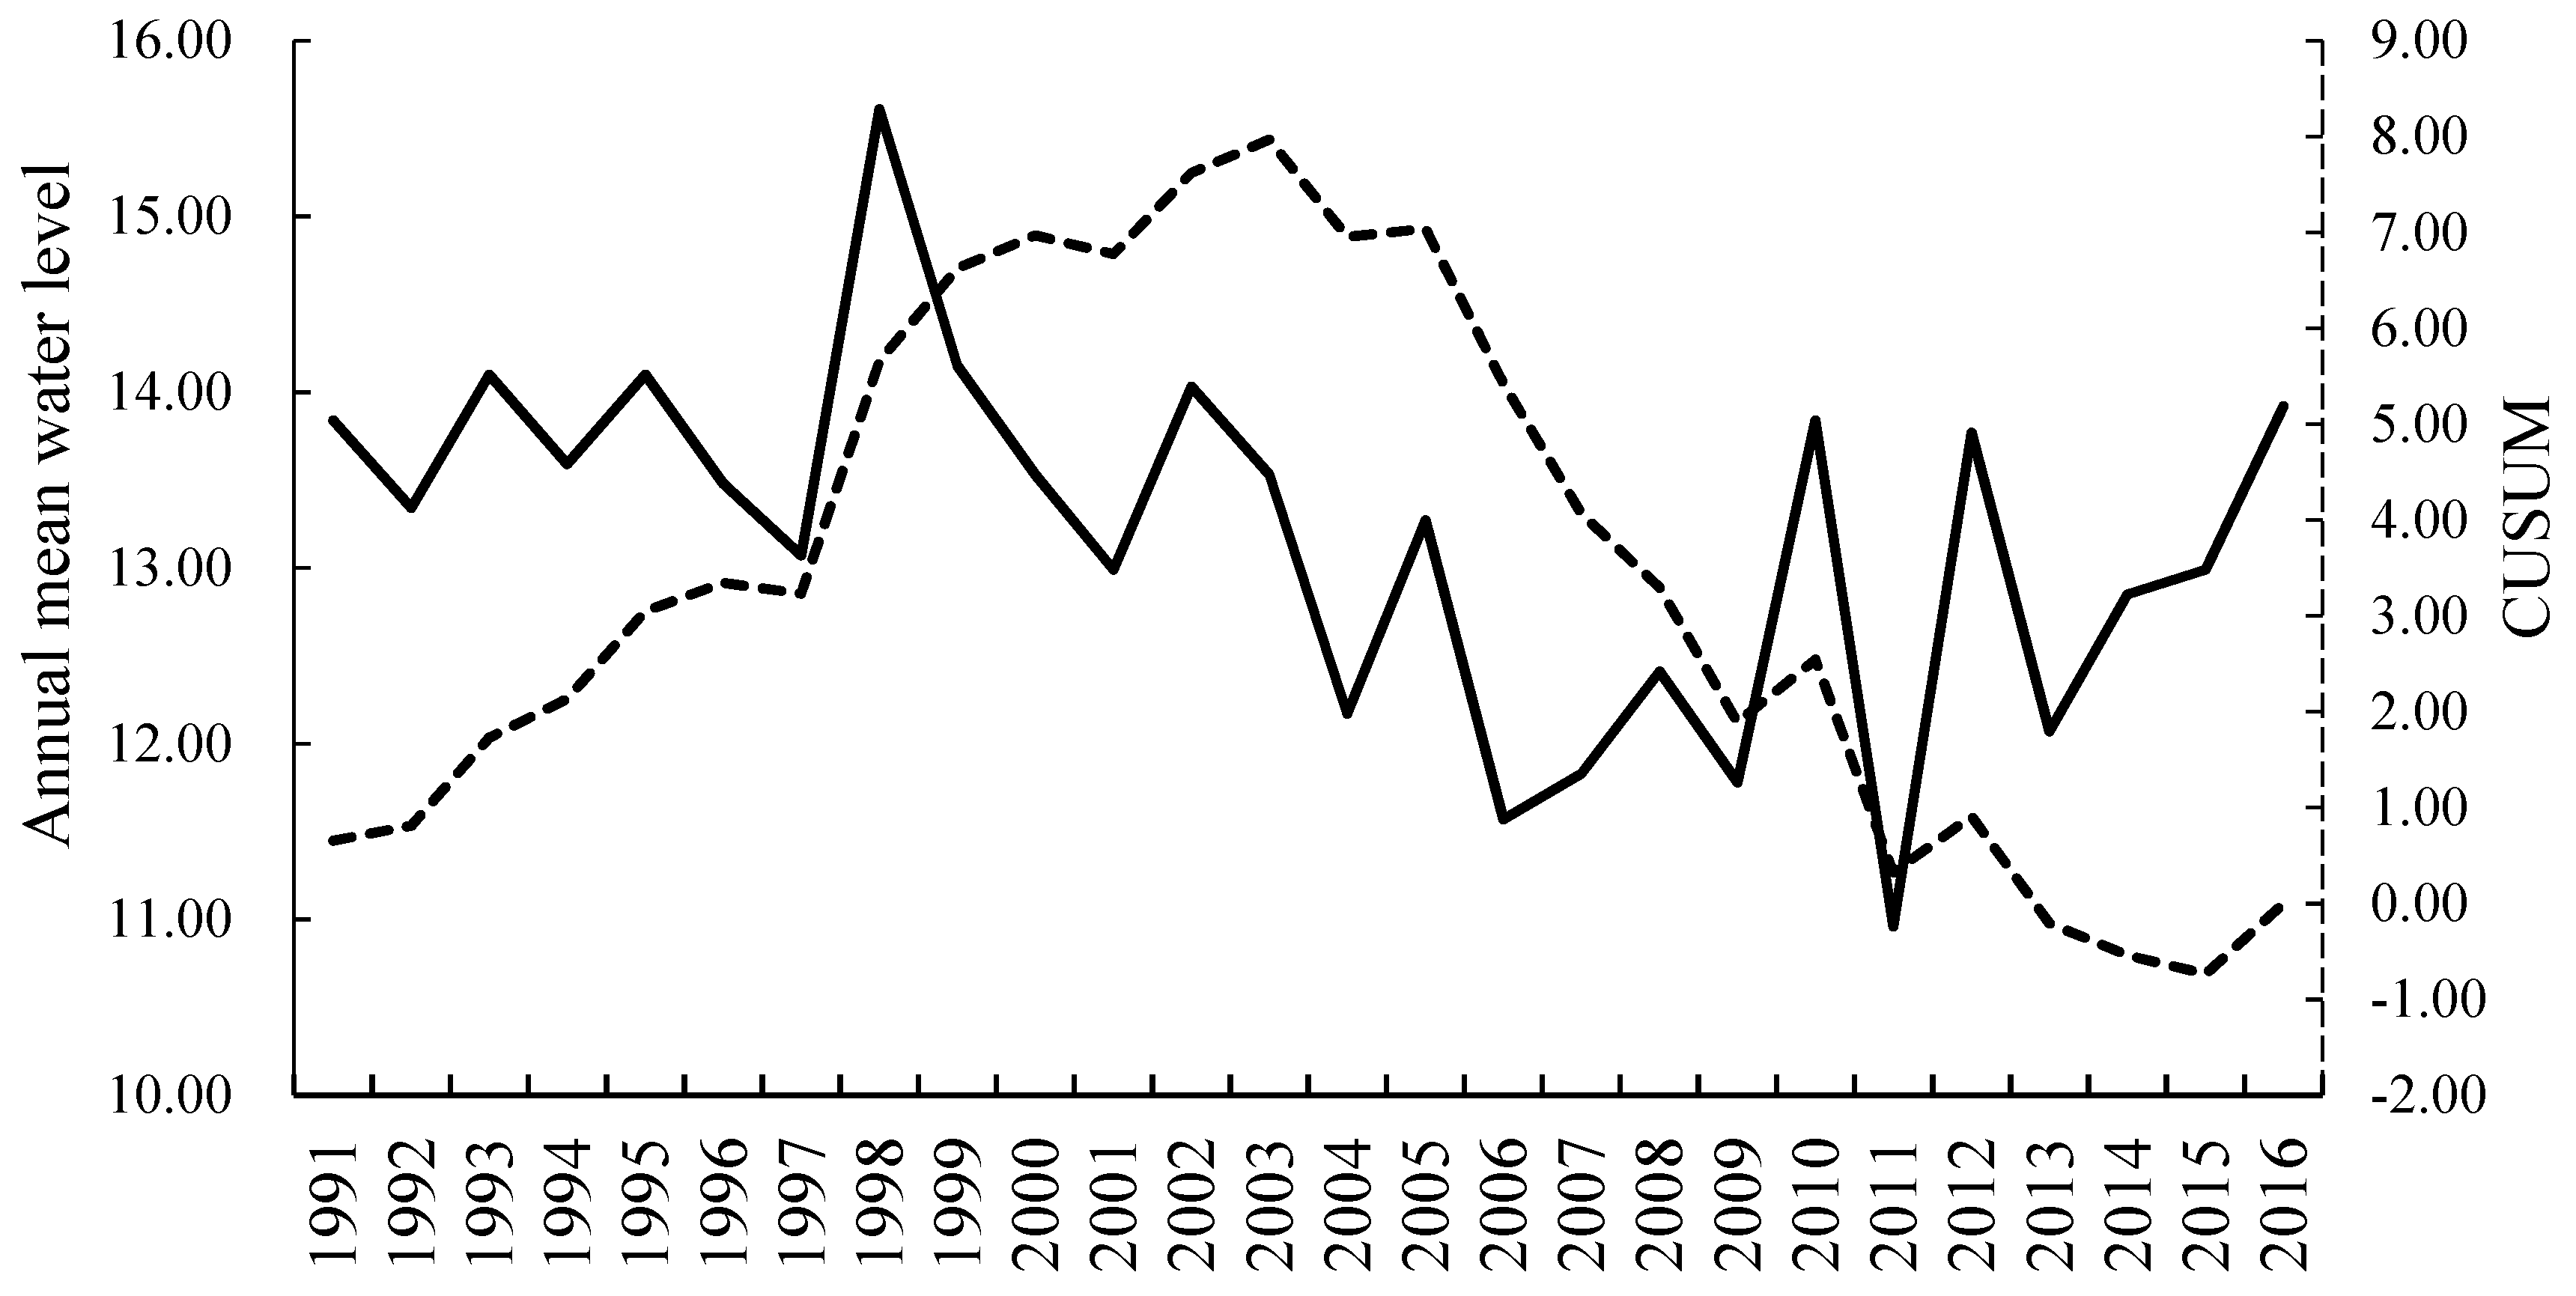
The annual mean time series and CUSUM are shown in Figure 3. A declining trend was found in the annual mean time series of the water level at Xingzi Station. For 2003, a change point was discovered in the time series of water levels because a sudden change in the direction of the CUSUM occurred in 2003 (change from the positive to negative direction). By performing the bootstrap procedure, the confidence level for the change point of the water level was found to be 100%, which was above the 95% significance level. Furthermore, Poyang Lake showed a mean water level of 13.82 m before 2003, which decreased to 12.57 m after 2003. The difference of the water level between the two periods is statistically significant (p=0.001<0.05, t test). Additionally, the daily water level at Xingzi Station of Poyang lake from 1991 to 2016 is presented in Figure 4. To make it clear and concise, the average water levels during the two periods, 1991–2003 and 2004–2016, were calculated and presented. The average water level before 2003 was 13.80 m, and it was 12.57 m after 2004. There are significant differences between the two periods.
The above analysis proves that the water-level time series of Poyang Lake changed suddenly in 2003. This year is exactly when the TGD began to store water and discharge sediment. This result is in agreement with the conclusions obtained in previous studies [24,61]. In the current research, we focused on analysing the variation of the hydrological regime before and after the TGD, instead of discussing the sudden change of water level in 2013. Thus, to avoid the effect of hydrological instability in 2003, we divided the study period into two periods, 1991–2002 and 2005–2016, each covering 12 years. Differences of the water level in the two periods will be discussed in the following sections.

3.2. Distribution of the Water Level Using Frequency Distribution

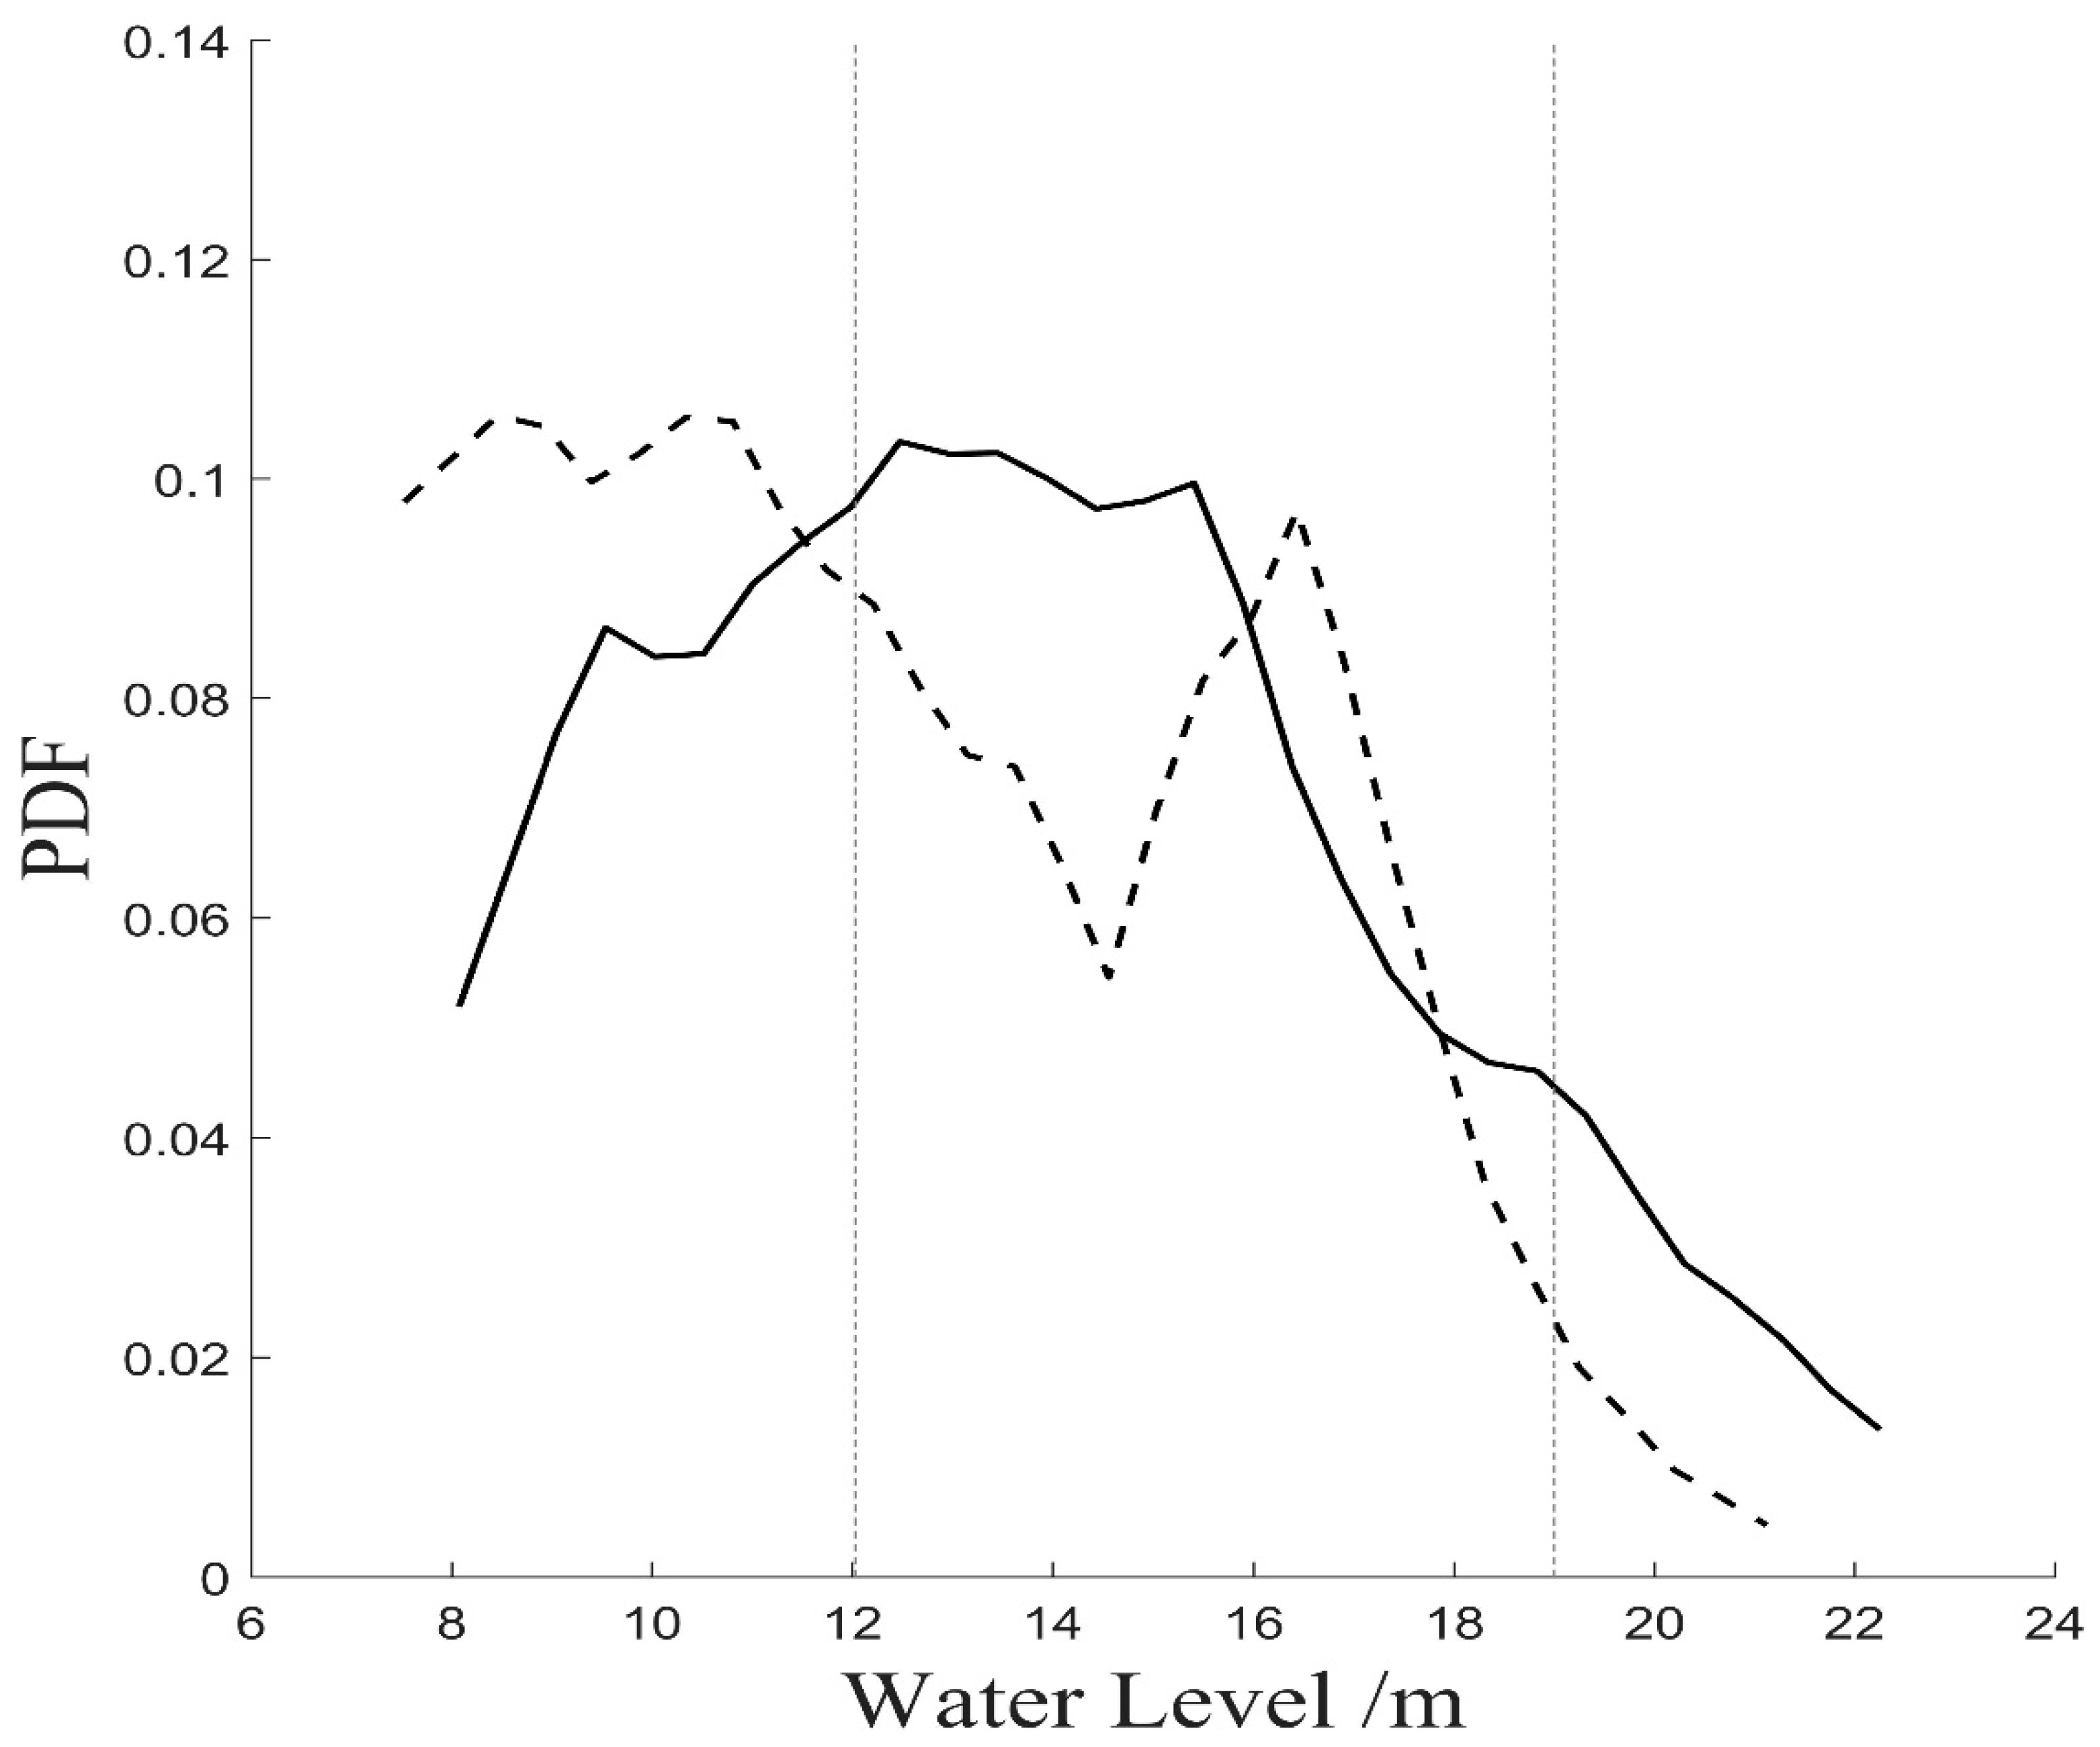
Frequency distribution is used to specify the probability of a variable within a particular range of values, and its integral over the entire range is equal to one. It is one of the effective methods to describe the distribution of data series. Therefore, the frequency distributions for the water level of the two periods were plotted, and the results are shown in Figure 5 where two vertical lines are presented. The line on the right represents the warning water level. It refers to the water level at which a dangerous situation may occur. The line on the left represents the ecological water level, which is 12.03 m. It refers to the minimum water requirement that must be stored by lakes in order to maintain the basic ecological functions of water bodies, and to meet the basic needs of aquatic organisms for living space [62]. Most of the grasslands in Poyang Lake are distributed between 12 m and 17 m. These grasslands could become the spawning grounds and feeding grounds of the fish when they are submerged. However, when the water level is lower than the ecological water level, the spawning environment of the fish will deteriorate. In other words, the area of spawning and the amount of eggs laid will decrease. The average catch of fish between 2006 and 2017 with a water level of 11.70 m is only 46% of the catch between 2000 and 2006 with a water level of 13.52 m. Meanwhile, the low water level could also make it difficult to catch fish, and lead to the further decline of fish resources, because fish, shrimp, crickets, etc., are often caught together during fishing. Additionally, a low water level could affect the self-purification ability of the lake water body. The total N in the dry season of 2007, 2008, and 2009 with average water levels of 9.34 m, 10.17 m, and 9.00 m varies from 0.168–3.320, 0.119–2.297, and 0.288–6.11, respectively [63].
Visually, the distributions of the water level in the two periods are obviously different. The frequency distribution is unimodal in the early period, and the peak lies at approximately 13–15 m. In contrast, the frequency distribution is bimodal in the latter period, and the two peaks lie at 9–10 m and 16–17 m, respectively, which are higher than the frequency distribution values in the early period. Time spent at 13–15 m, which was the peak of the frequency distribution covering the early period, appeared obviously lower in the latter period. The striking result was that the frequency distribution in the latter period was obviously lower than that in the early period over the range of 18–22 m. Furthermore, a more pronounced characteristic was that, over the range to the left of the left vertical line, the frequency distribution in the early period was higher than that in the latter period, while the trend was reversed over the range to the right of the right vertical line.
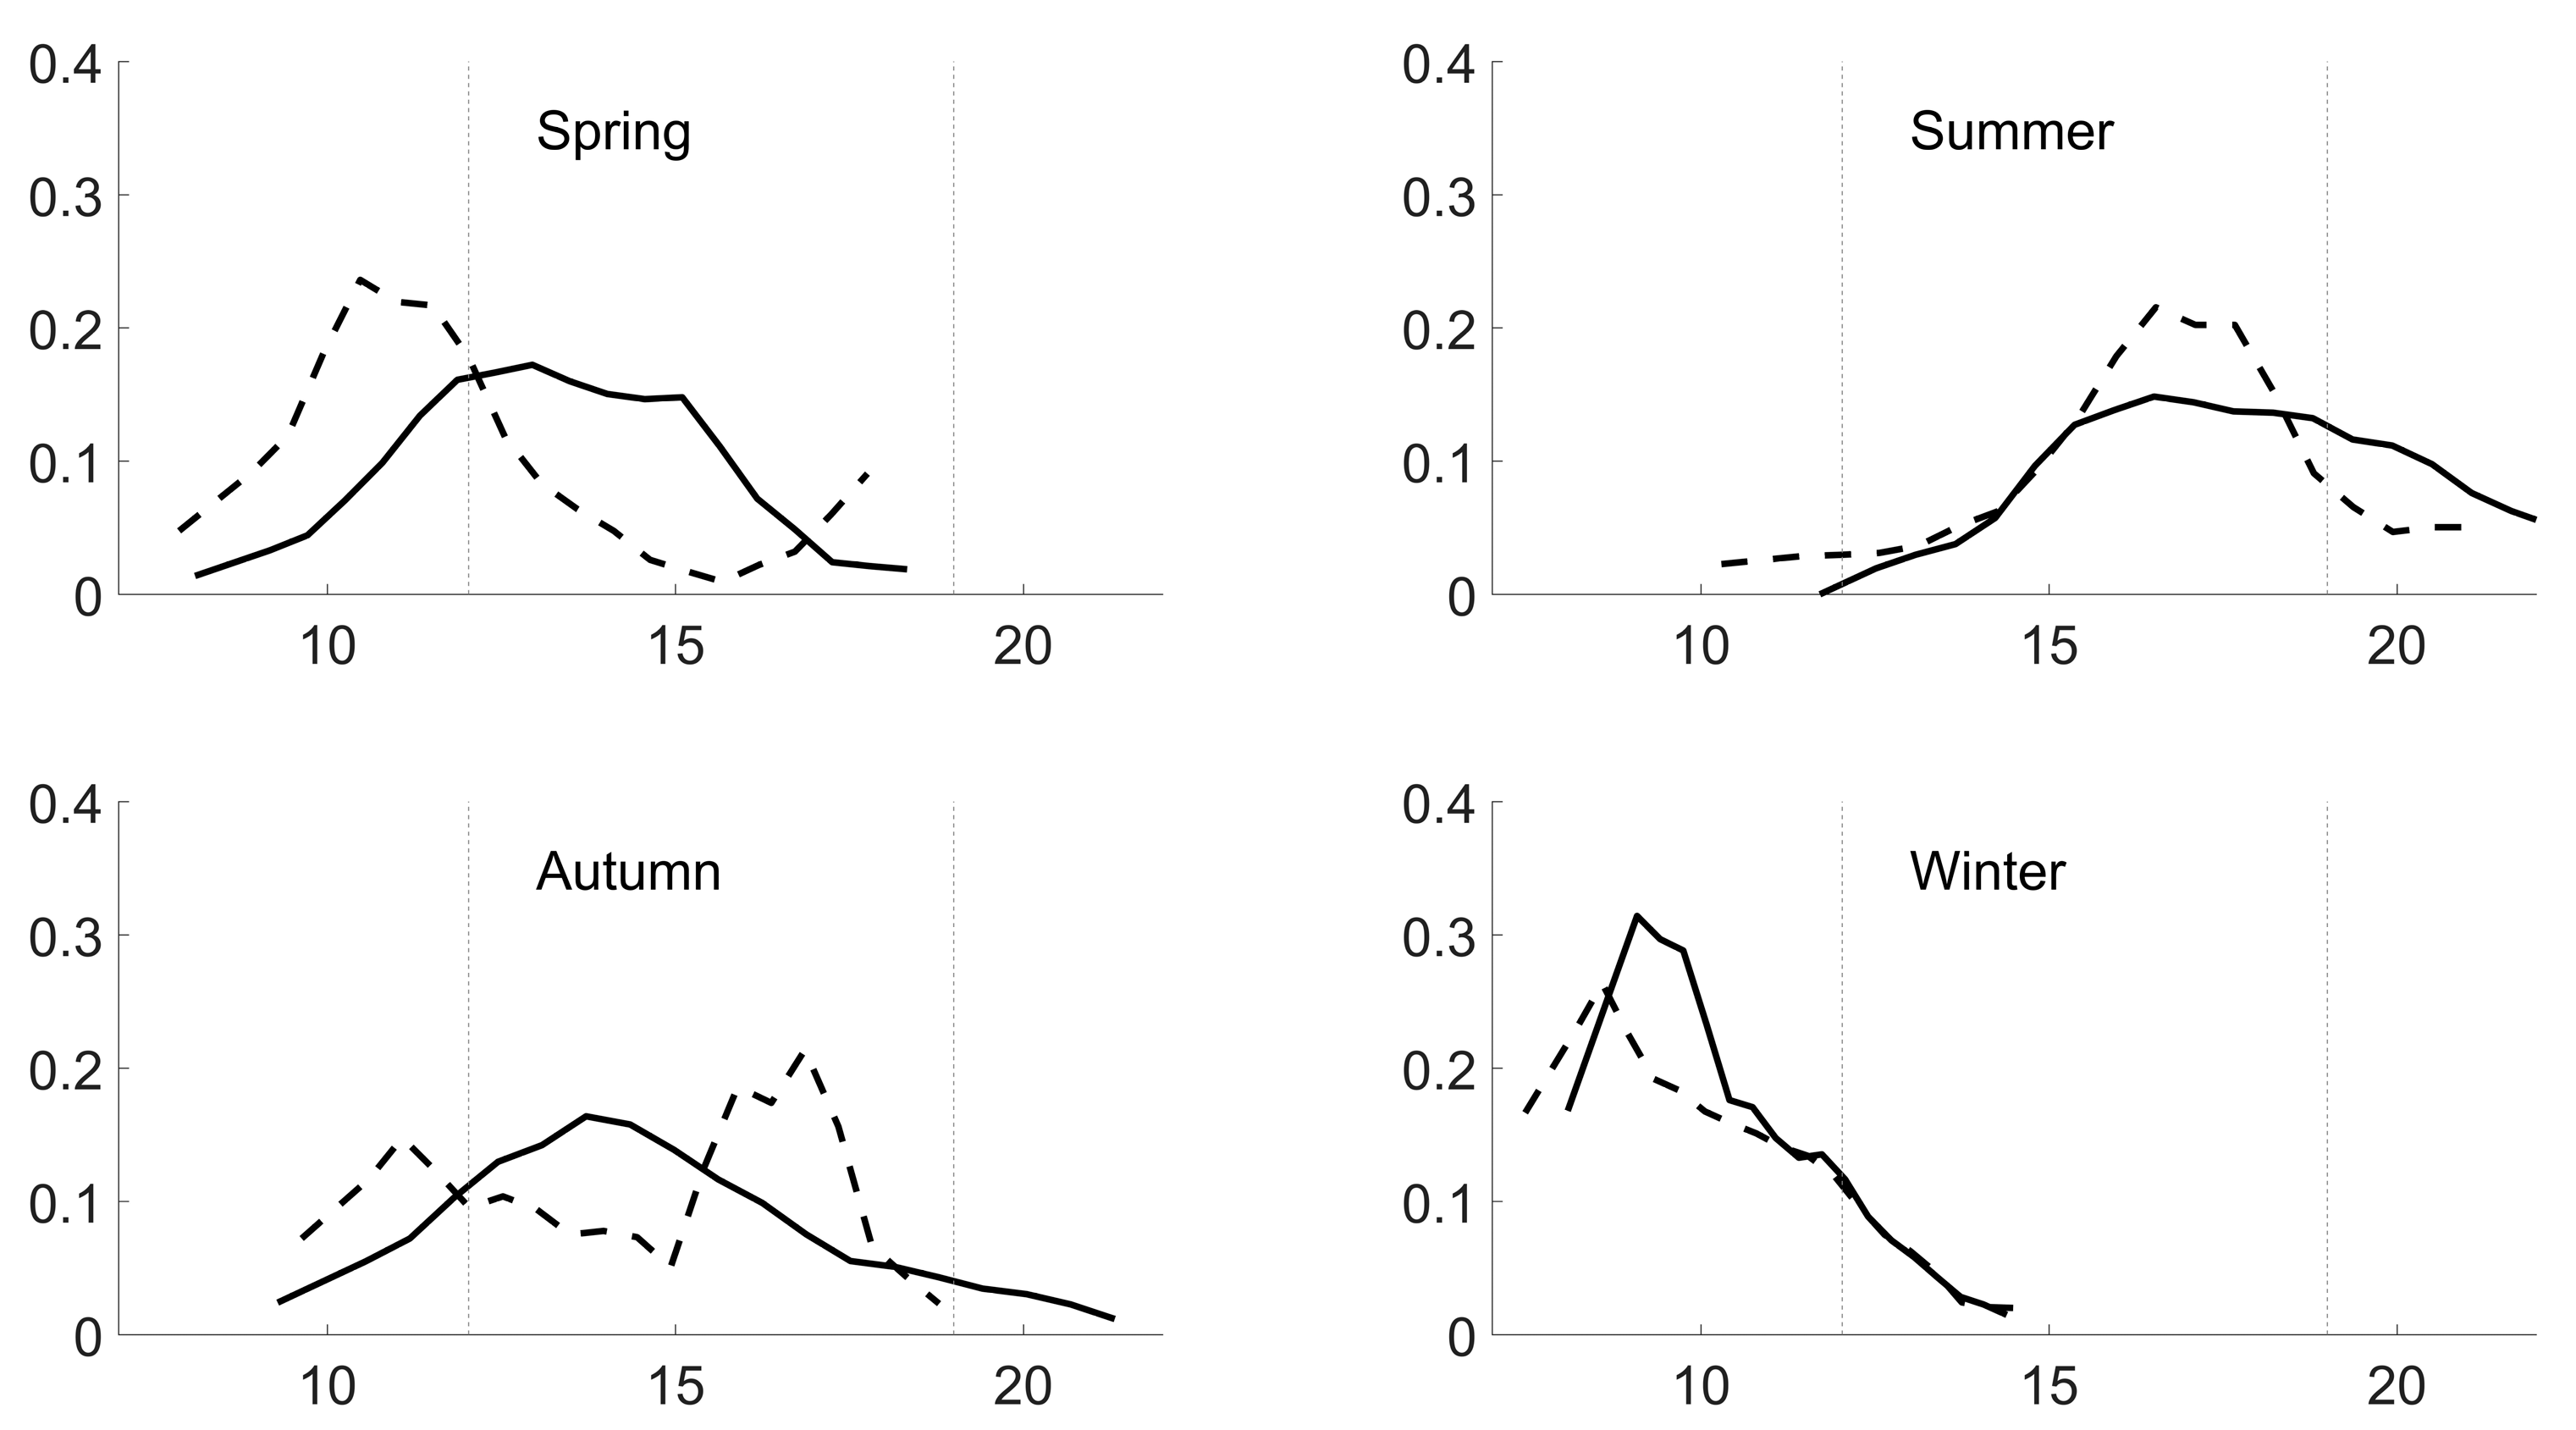
Poyang Lake showed strong seasonality in the distribution of the water level across the two periods. This paper selected the periods from March to May, June to August, September to November, and December to February as spring, summer, autumn, and winter, respectively. The frequency distributions of the water level for the four seasons, namely, spring, summer, autumn and winter, were computed for the two periods, and the results are shown in Figure 6.
In general, the seasonal distribution of the water level was different across the two periods. In spring, the peak value of frequency distribution ranged from 12–15 m for the early period, while the high frequency distribution value was at 10–12 m in the latter period. Furthermore, over the range to the left of the left vertical line, the frequency distribution in the latter period was much higher than that in the previous period, while the trend was almost reversed over the range to the right. In summer, the range of the high frequency distribution value was concentrated from 16–20 m to 17–18 m. It was noted that, over the range to the right of the right vertical line, the frequency distribution in the latter period was lower than that in the previous period. A striking result was that the frequency distribution changed from a unimodal distribution to a bimodal distribution in autumn, and the range of the high value changed from 13–15 m to 16–17 m and 11 m. In winter, the distribution of the frequency distribution across the two periods was more similar than in other seasons. Precisely, the peak of the frequency distribution was at 9 m in the early period and changed to 8 m in the latter period. In other words, the peak of the curve moved to the left.

3.3. Analysis of the Hydrological Complex Network of the Two Periods

A frequency distribution can describe the distribution of the water level in the two periods, which showed obvious differences. The method cannot explore the dynamics information hidden in the hydrological time series. Therefore, a network approach was used to reveal the dynamic features of the hydrological variation, which can be considered as causes of the change of water level distribution in the latter periods.
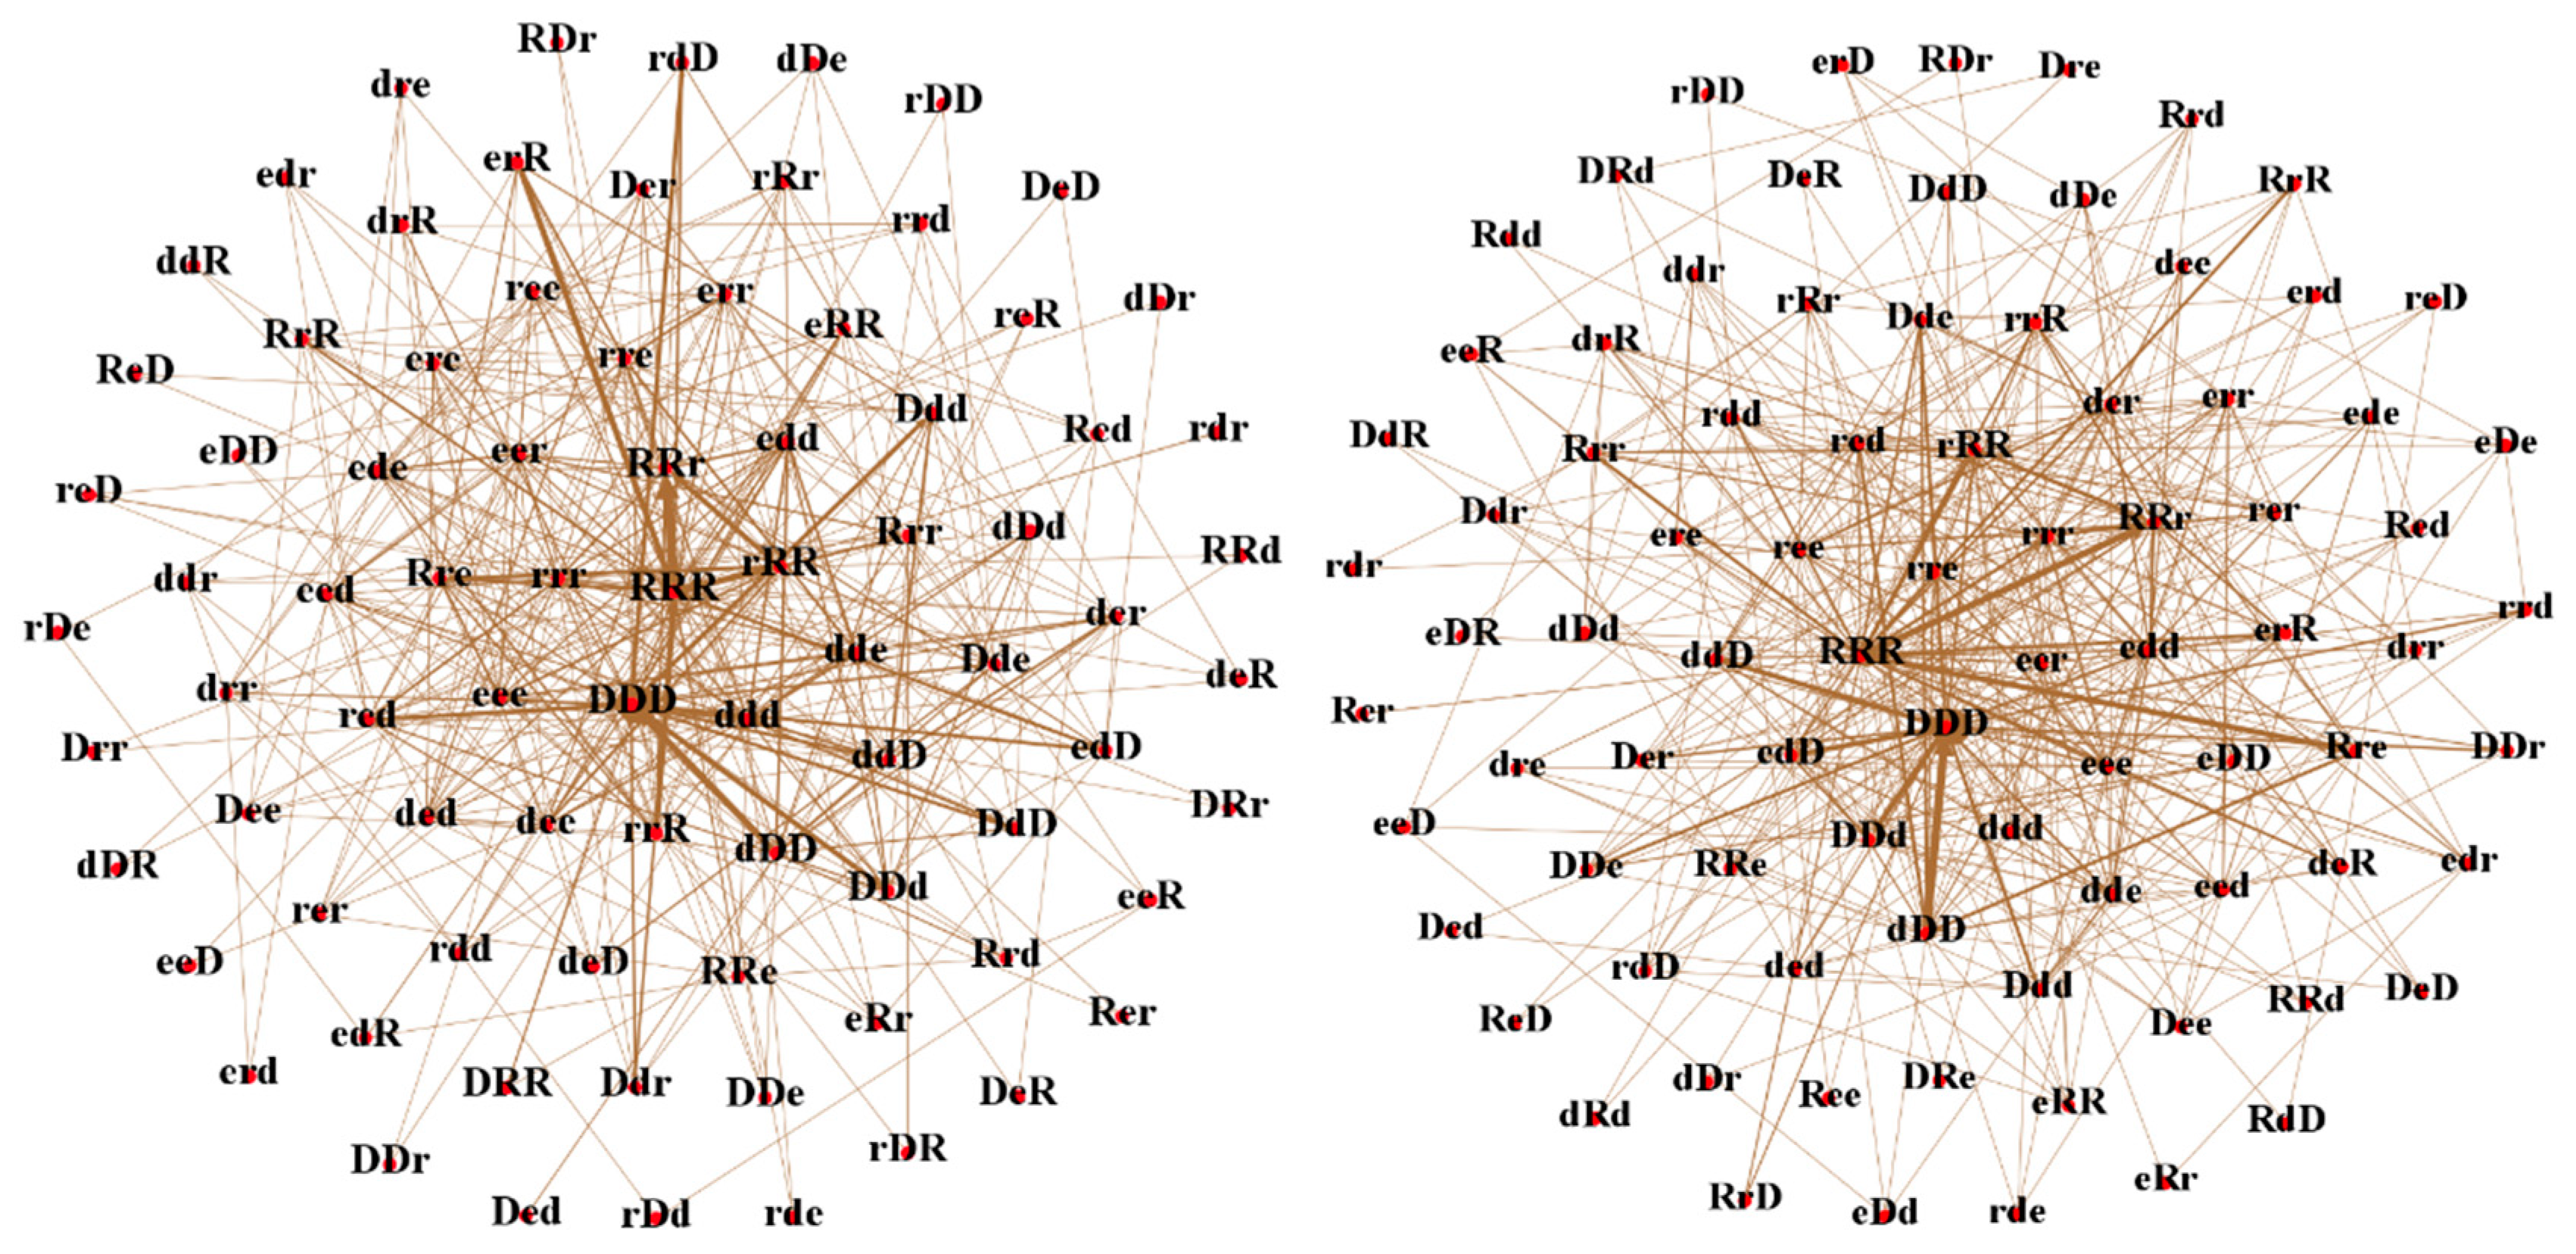
Coarse-graining processing is the first step to building a hydrological complex network. During the processing, three-symbol strings, in which each symbol was one of the five meta patterns, were selected to represent fluctuation patterns. Different fluctuation patterns of the water level were expressed as nodes, transfer information between the nodes was expressed as edges, and the degree of transfer was expressed as the weight of each edge—then, the hydrological network was constructed (Figure 7).
Here, the number of rapid rising patterns, slow variation patterns and rapid declining patterns were counted for the two periods (Table 2), where the rapid rising pattern meant that the three meta patterns consisted of R and r only, the slow variation pattern consisted of e only, and the rapid declining pattern consisted of d and D only.
In general, the variation of the number of rapid rising patterns before and after the TGD was mild, and the counts were 182 and 185, respectively. In contrast, the number of rapid declining patterns in the two periods were obviously different. The number was 194 in the early period, which was larger than the number of rapid rising patterns, and it was 163 in the latter period, which was smaller than the number of rapid rising patterns. In particular, the number of slow variation patterns increased from 18 in the early period to 23 in the latter period.
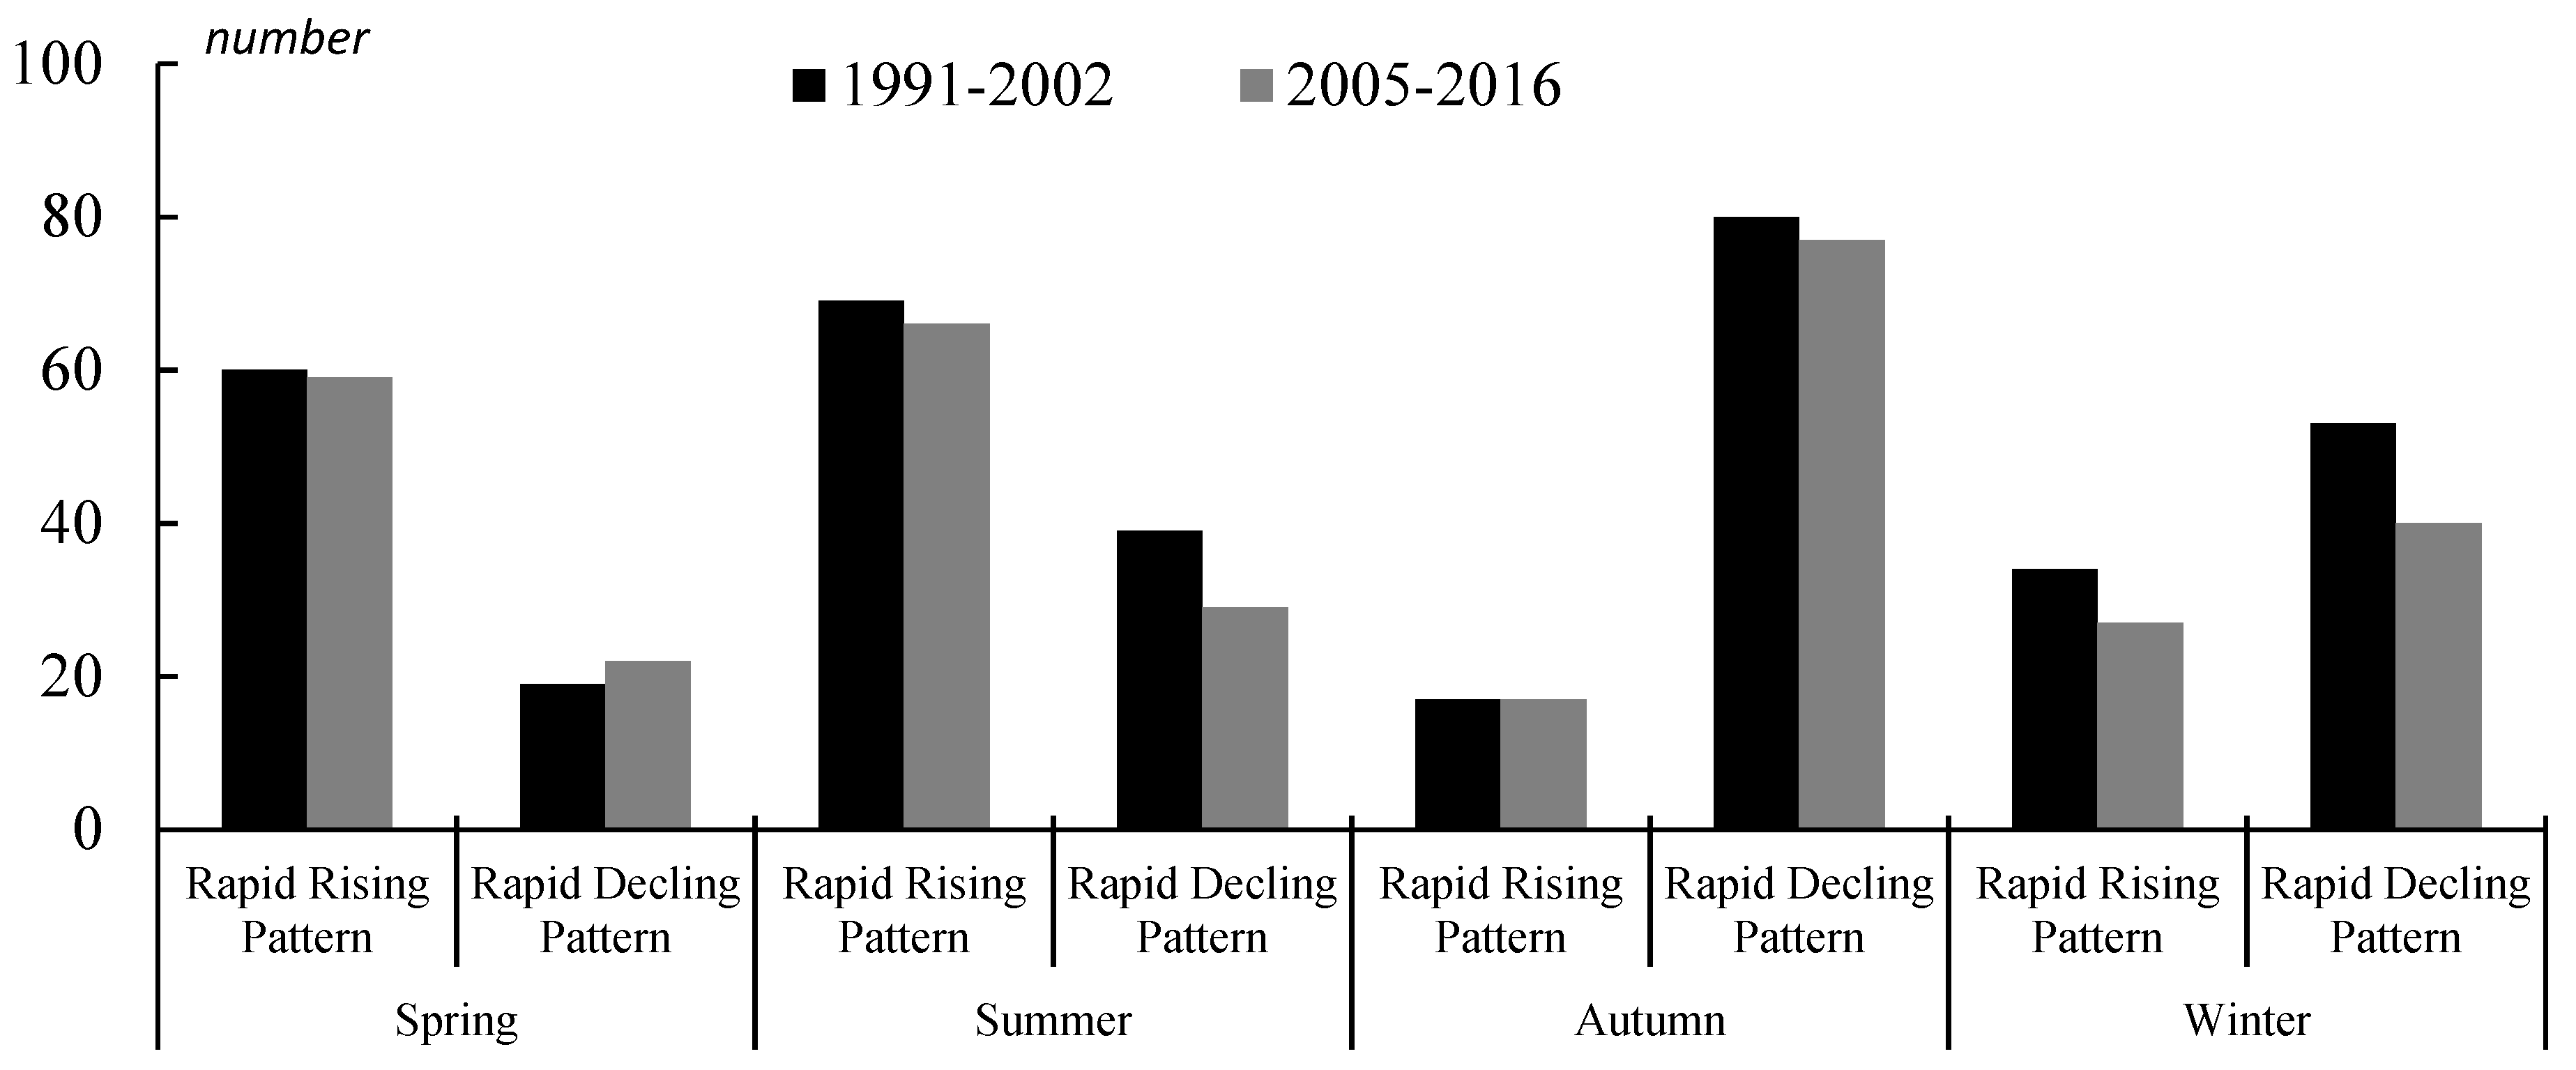
The differences of seasonal variation of the water level in the two periods were further revealed by counting the number of rapid rising patterns and rapid declining patterns of the four seasons. Here, we mainly focused on the differences of rapid variation patterns in the two periods—therefore, slow variation patterns were not calculated. The results are shown in Figure 8.
In general, it was obvious that the number of rapid rising patterns was larger than that of rapid declining patterns in spring and summer, while it was reversed in autumn and winter. In addition, it should be noted that the sum of rapid variation patterns in the early period, consisting of rapid rising patterns and rapid declining patterns, was 371, which was obviously larger than the sum of rapid variation patterns in the latter period, at 337 precisely. In detail, almost all of the seasonal counts of rapid variation patterns in the early period were larger than that in the latter period, except for the number of rapid declining patterns in spring. Additionally, there were some patterns for which the numbers changed obviously in certain seasons, such as the two patterns in winter, and the rapid declining pattern in summer.
In the network of the hydrological regime, the network influence of a fluctuation pattern could be explained by BC for its capability of revealing the topological importance of nodes to control or affect other patterns in the complex network. Further, the BC of nodes among networks before and after TGD has been calculated in Table 3.
As we can see, the differences among the BC of nodes before TGD are evident. According to the statistics, the summed BC of the first 10 nodes in the network before TGD is 55.54%, and the BC of any of the 10 nodes is more than 2.7%, that is 12.19% of the total 82 nodes account for 55.54% of the summed BC of the network. Then, for network after TGD, the fluctuation of the magnitude of BC is mild. The summed BC of the first 10 nodes is 55.98%, and the BC of any of the 10 nodes is more than 3.7%. Besides, the BC of RRR nodes, which is the top one in the two networks, dropped from 15.97% in the early period to 9.94% in the latter period. In addition, except for the two mutual patterns RRR and DDD, there are two continuous declining patterns consisting of d and D only, ddd and dDD, in the network for the early period and their BCs are 4.50% and 3.44%. However, for the network in the latter period, there is no continuous declining pattern consisting of d and D only.

4. Discussion

Research revealed that Poyang Lake experienced a significant decline of water level after 2003, as shown by analysing the hydrological time series. To determine the possible cause of the water level variation exactly and convincingly, Feng et al. combined remote, meteorological, and hydrological data to discuss the influence of the TGD on downstream lakes. The conclusion was that the declining of water level appeared to be linked to the TGD rather than to precipitation, temperature, sunshine hours, or wind speed [24]. Zhang et al. employed a hydrodynamic model to reveal that the construction of the TGD had a greater impact on the variation of the water level in Poyang Lake than climate variability [45]. The infiltration process is another important factor influencing the fluctuation of the water level, which is related to hydrogeology. However, this paper is focused on the impact of the TGD on the hydrological regime downstream using a relatively short period of 26 years. During this period, the geology of the lake can be regarded as unchanged. On the other hand, the research used the data of 13 years to smooth its effects if a minor change of geology is assumed.
The TGD is regarded as the world’s largest hydroelectric project to date. Despite its demonstrable benefits for shipping, power generation, and flood control, the dam has inevitably affected the hydrological situation of the rivers and lakes downstream to some extent. From the analysis of the distribution of water level, it appears that the trend of the frequency distribution diagram of the water level across the two periods is obviously different. The frequency distribution is unimodal for the early period, while it is bimodal for the latter period. Generally, the water level of Poyang Lake in the latter period was lower than that in the early period. Precisely, there were three distinct differences. First, the number of days when the water level was above the warning level was significantly reduced. Second, the number of days when the water level was below the ecological level was significantly increased. Third, the concentration of the water level was at 13–15 m in the early period, while it was at 9–10 m and 16–17 m in the latter period. Mechanically, the operation of the TGD is the main reason for the change of water level distribution across the two periods. Normally, the TGD begins to store water gradually until 145 m during the flood season (from July to September). As a result of this, the discharge of the Yangtze River is smaller than under normal conditions, which facilitates the removal of large amounts of water stored in Poyang Lake, thereby reducing the lake water level from its position above the warning level in the flood season. From October to November, the TGD is at another stage of water storage until 175 m. This results in a smaller discharge of the Yangtze River and a lower water level at Xingzi Station than under normal conditions, which is one of the reasons for the bimodal frequency distribution in the latter period. From January to March, which is the dry season, the TGD releases more water to meet the needs of shipping and power generation. However, due to the smaller storage of water in Poyang Lake during the flood season, the release of water by the TGD is not enough to meet the needs of Poyang Lake. This results in a lower hydrological level and drier land in Poyang Lake in winter. From May to June, the TGD increases water drainage to meet the demand of flood control during the flood season, leading to a larger discharge of the Yangtze River. Similarly, due to the lower water level of Poyang Lake, the water discharged by the TGD is not enough to raise the water level to a normal level. Thus, this results in a lower water level at Xingzi Station in the latter period than that in the early period. Consequently, the number of days with a low water level increased, while the number of days with a high water level decreased.
By performing complex network processing, the dynamic information of water level fluctuation can be detected to analyse the influence of the TGD. From the dynamic information of the water level, it appears that the number of rapid rising patterns of the two periods (one pattern represented variation across seven days) was similar—the number of rapid declining patterns decreased significantly, and the number of slow variation patterns tended to increase. The results suggest that the construction of the TGD had little effect on the time range of rapid rising stages of the water level, which mainly existed in the flood season, despite its certain effect on the degree of rapid rising of the water level. In contrast, there was an obvious impact of the TGD on the time range of rapid declining stages of the water level. Precisely, the number of rapid declining patterns after the TGD was lower than that before the TGD. This means that the construction caused a significant decrease in the intensity of the water withdrawal, along with a longer duration. This can be further revealed by the variation in the number of slow variation patterns. Physically, the lake receives a great deal of inflow from the Yangtze River and the five major rivers during the flood season. Thus, the TGD has stored large amounts of water before the arrival of the dry season. When the dry season comes, more water would be released to meet the demand of shipping and power generation. Even though the release of more water cannot stop the decline of the water level, it will reduce the degree and speed of the water level decline to a certain degree. Additionally, the phenomenon is most obvious in winter compared to other seasons.
By analysing the BC of nodes in the two networks, the results showed that the smaller proportion of nodes account for a larger proportion of summed BC. These results indicate that these fluctuation patterns, such as RRR and DDD, are the important intermediaries in the process of transformation for water level fluctuation patterns. These fluctuation patterns can be seen as the precursor to the transformations between fluctuation patterns. In addition, the significant differences among the BC of nodes also indicate the presence of higher volatility in the water level of Poyang Lake [36]. However, the analysis of complex network constructed for the latter period showed that the fluctuation of magnitudes of BC of the first 10 nodes are milder. Li has constructed a random network and the calculated their BC. The research found that there are no nodes of topological importance or of the highest BC [41]. In summary, the construction of TGD has more or less caused the hydrological network to become a random network. In addition, there are two continuous declining patterns among the top 10 BC of nodes for the network in the early period. However, for the network in the latter period, there is no continuous declining pattern. This also prove that TGD has a significant impact on the stage when the water level is declining.
To measure the influence of the TGD on downstream lakes and rivers, the frequency distribution functions of the water level at Xingzi Station before and after the TGD were calculated to quantify the difference of distribution. Then, networks before and after the TGD were structured by coarse-graining processing, and the dynamic information of the water level across the two periods could be explored. The analysis yielded various results that can provide knowledge of the effect of human hydroelectric projects. However, there are certain limitations that need to be considered in the future. Weather conditions is another major factor affecting hydrological variation. Although 12 years was selected for each period as the basis for analysing the change of the water level to minimize the impact of weather variation, weather will influence the variation of water level in rivers and lakes. Therefore, how to analyse the influence of hydroelectric projects to hydrological regime while excluding the effects of weather variation present a difficult problem which should be considered in the future. Meanwhile, there are several distinctive periods (phases) in TGD construction, filling, water storage, and operation. For example, in 1994, the TGD started; in 2003, the TGD began to store water for power generation; in 2009, the TGD was expected to be fully operational, but additional projects delayed this until 2012. However, limited by a shortage of data and the short time span of each period (phases), this paper did not seek to analyse the different influences of distinctive periods of the TGD downstream. After the construction of a dam, its influence on the hydrology downstream is closely related to the purpose and policies of the local government. So, whether there is a similar result or not in other climatic areas may be related to the purpose of the dam under construction. Further, this depends on the follow-up research performed by other scholars.

5. Conclusions

Research was conducted using the hydrological data in daily units over the period from 1991 to 2016 at Xingzi Station, which is located at a channel connecting the Yangtze River and Poyang Lake. The distribution and dynamic information of the water level before and after the TGD were analysed with the help of a frequency distribution and complex network approach. Additionally, the topological structures of the networks were calculated and analysed. The results showed the following. 1) The water level at Xingzi Station changed suddenly in 2003, which was exactly the time when the TGD began to store water. 2)The number of days when the water level was above the warning level was significantly reduced, and the number of days when the water level was below the ecological level was significantly increased. 3) In spring, the high value of the frequency distribution before the TGD was at 12–15 m, while the high value was at 10–12 m after the TGD. In summer, the range of high values of the frequency distribution was concentrated from 16–20 m to 17–18 m, and the number of days when the water level was above the warning level was reduced. In autumn, the frequency distribution changed from a unimodal distribution to a bimodal distribution, and the range of high values changed from 13–15 m to 16–17 m and 11 m. In winter, the distribution of the frequency distribution was more similar across the two periods. Precisely, the peak of the frequency distribution was at 9 m in the early period, while it was at 8 m in the latter period. 4) The number of rapid rising patterns was similar before and after the TGD, the number of rapid declining patterns decreased significantly, and the number of slow variation patterns tended to increase. Besides, TGD has caused the number of continuous declining pattern to decrease from 2 to 0. These results mean that the TGD had little effect on the time range of rapid rising of the water level, which mainly existed in the flood season. In contrast, it caused a significant decrease in the intensity of the water withdrawal, as well as a longer duration. 5) For dynamic variation of the water level, the TGD had the greatest influence in winter compared to other seasons, which resulted in a lower water level and more severe drought. 6) the TGD has caused the hydrological network to become a random network to a certain degree.
The fluctuation of the water level downstream is inevitably affected by the construction of a large hydraulic project. The results and discoveries of this paper can provide us with more information about this. In the future, the government should consider this connection before the construction of projects. In other words, we should consider the issue comprehensively, rather than from a regional perspective. While building a large hydraulic project, the government should consider the construction of a series of corresponding supporting facilities to ensure normal ecological processes downstream. Large hydraulic projects could change the hydrological process and may further change the self-purification capacity of the water body. Therefore, the government may need to consider some changes in policy and management.

Author Contributions

Lixin Ning conceived and wrote the paper; Yunkai Zhou designed the experiments; Changxiu Cheng supplied the data; Sijing Ye performed analyzed the data; Shi Shen performed the modeling. All authors read and approved the manuscript.

Funding

This work was supported by National Key Research and Development Plan of China (No. 2019YFA0606901), the Strategic Priority Research Program of the Chinese Academy of Sciences (No. XDA23100303), the Fundamental Research Funds for the Central Universities, and the Chinese government scholarship.

Acknowledgments

The authors would like to acknowledge the Hydrological Bureau of Jiangxi Province, National Earth System Science Data Sharing Infrastructure for providing the data.

Conflicts of Interest

The authors declare no conflict of interest.

References

  1. Zhang, Y.; Wang, C.; Bai, W.; Wang, Z.; Tu, Y.; Yangjaen, D.G. Alpine wetlands in the Lhasa River basin, China. J. Geogr. Sci. 2010, 20, 375–388. [Google Scholar] [CrossRef]
  2. Brinson, M.M.; Malvárez, A.I. Temperate freshwater wetlands: Types, status, and threats. Environ. Conserv. 2002, 29, 115–133. [Google Scholar] [CrossRef]
  3. Ming, J.; Xian-Guo, L.; Lin-Shu, X.; Li-juan, C.; Shouzheng, T. Flood mitigation benefit of wetland soil—A case study in Momoge National Nature Reserve in China. Ecol. Econ. 2007, 61, 217–223. [Google Scholar] [CrossRef]
  4. Ouyang, X.; Lee, S.Y.; Connolly, R.M.; Kainz, M.J. Spatially-explicit valuation of coastal wetlands for cyclone mitigation in Australia and China. Sci. Rep. 2018, 8, 3035. [Google Scholar] [CrossRef]
  5. Verhoeven, J.T.; Meuleman, A.F. Wetlands for wastewater treatment: Opportunities and limitations. Ecol. Eng. 1999, 12, 5–12. [Google Scholar] [CrossRef]
  6. Erwin, K.L. Wetlands and global climate change: The role of wetland restoration in a changing world. Wetl. Ecol. Manag. 2009, 17, 71. [Google Scholar] [CrossRef]
  7. Birol, E.; Cox, V. Using choice experiments to design wetland management programmes: The case of severn estuary wetland, UK. J. Environ. Plan. Manag. 2007, 50, 363–380. [Google Scholar] [CrossRef]
  8. Berthou, S.; Mailler, S.; Drobinski, P.; Arsouze, T.; Bastin, S.; Béranger, K.; Flaounas, E.; Lebeaupin Brossier, C.; Somot, S.; Stéfanon, M. Influence of submonthly air–sea coupling on heavy precipitation events in the western mediterranean basin. Q. J. R. Meteorol. Soc. 2016, 142, 453–471. [Google Scholar] [CrossRef]
  9. Hulme, A.L.; Martin, J.E. Synoptic-and frontal-scale influences on tropical transition events in the atlantic basin. Part i: A six-case survey. Mon. Weather Rev. 2009, 137, 3605–3625. [Google Scholar] [CrossRef]
  10. Ma, K.; You, L.; Liu, J.; Zhang, M. A hybrid wetland map for China: A synergistic approach using census and spatially explicit datasets. PLoS ONE 2012, 7, e47814. [Google Scholar] [CrossRef]
  11. Costanza, R.; d’Arge, R.; De Groot, R.; Farber, S.; Grasso, M.; Hannon, B.; Limburg, K.; Naeem, S.; O’neill, R.V.; Paruelo, J. The value of the world’s ecosystem services and natural capital. Nature 1997, 387, 253. [Google Scholar] [CrossRef]
  12. Carpenter, S.R.; Stanley, E.H.; Vander Zanden, M.J. State of the world’s freshwater ecosystems: Physical, chemical, and biological changes. Annu. Rev. Environ. Resour. 2011, 36, 75–99. [Google Scholar] [CrossRef]
  13. Vörösmarty, C.J.; McIntyre, P.B.; Gessner, M.O.; Dudgeon, D.; Prusevich, A.; Green, P.; Glidden, S.; Bunn, S.E.; Sullivan, C.A.; Liermann, C.R. Global threats to human water security and river biodiversity. Nature 2010, 467, 555. [Google Scholar] [CrossRef] [PubMed]
  14. Webb, E.L.; Friess, D.A.; Krauss, K.W.; Cahoon, D.R.; Guntenspergen, G.R.; Phelps, J. A global standard for monitoring coastal wetland vulnerability to accelerated sea-level rise. Nat. Clim. Chang. 2013, 3, 458. [Google Scholar] [CrossRef]
  15. Walling, D. Human impact on land–ocean sediment transfer by the world’s rivers. Geomorphology 2006, 79, 192–216. [Google Scholar] [CrossRef]
  16. Nilsson, C.; Reidy, C.A.; Dynesius, M.; Revenga, C. Fragmentation and flow regulation of the world’s large river systems. Science 2005, 308, 405–408. [Google Scholar] [CrossRef] [PubMed]
  17. Yin, H.; Liu, G.; Pi, J.; Chen, G.; Li, C. On the river–lake relationship of the middle yangtze reaches. Geomorphology 2007, 85, 197–207. [Google Scholar] [CrossRef]
  18. Fu, B.-J.; Wu, B.-F.; Lü, Y.-H.; Xu, Z.-H.; Cao, J.-H.; Niu, D.; Yang, G.-S.; Zhou, Y.-M. Three gorges project: Efforts and challenges for the environment. Prog. Phys. Geogr. 2010, 34, 741–754. [Google Scholar] [CrossRef]
  19. Sun, Z.; Huang, Q.; Opp, C.; Hennig, T.; Marold, U. Impacts and implications of major changes caused by the three gorges dam in the middle reaches of the Yangtze River, China. Water Resour. Manag. 2012, 26, 3367–3378. [Google Scholar] [CrossRef]
  20. Xu, K.; Milliman, J.D. Seasonal variations of sediment discharge from the yangtze river before and after impoundment of the three gorges dam. Geomorphology 2009, 104, 276–283. [Google Scholar] [CrossRef]
  21. Gong, G.C.; Chang, J.; Chiang, K.P.; Hsiung, T.M.; Hung, C.C.; Duan, S.W.; Codispoti, L. Reduction of primary production and changing of nutrient ratio in the East China Sea: Effect of the three gorges dam? Geophys. Res. Lett. 2006, 33. [Google Scholar] [CrossRef]
  22. Yang, S.; Zhang, J.; Xu, X. Influence of the three gorges dam on downstream delivery of sediment and its environmental implications, yangtze river. Geophys. Res. Lett. 2007, 34. [Google Scholar] [CrossRef]
  23. Guo, H.; Hu, Q.; Zhang, Q.; Feng, S. Effects of the three gorges dam on yangtze river flow and river interaction with Poyang Lake, China: 2003–2008. J. Hydrol. 2012, 416, 19–27. [Google Scholar] [CrossRef]
  24. Feng, L.; Hu, C.; Chen, X.; Zhao, X. Dramatic inundation changes of China’s two largest freshwater lakes linked to the three gorges dam. Environ. Sci. Technol. 2013, 47, 9628–9634. [Google Scholar] [CrossRef]
  25. An, H.; Gao, X.; Fang, W.; Huang, X.; Ding, Y. The role of fluctuating modes of autocorrelation in crude oil prices. Phys. A Stat. Mech. Appl. 2014, 393, 382–390. [Google Scholar] [CrossRef]
  26. Watts, D.J.; Strogatz, S.H. Collective dynamics of ‘small-world’networks. Nature 1998, 393, 440. [Google Scholar] [CrossRef] [PubMed]
  27. Barabási, A.-L.; Albert, R. Emergence of scaling in random networks. Science 1999, 286, 509–512. [Google Scholar] [CrossRef] [PubMed]
  28. Newman, M.E.; Watts, D.J. Renormalization group analysis of the small-world network model. Phys. Lett. A 1999, 263, 341–346. [Google Scholar] [CrossRef] [Green Version]
  29. Cheng, C.X.; Shi, P.J.; Song, C.Q.; Gao, J.B. Geographic big-data: A new opportunity for geography complexity study. Acta Geogr. Sin. 2018, 8, 1397–1406. [Google Scholar]
  30. Kaluza, P.; Kölzsch, A.; Gastner, M.T.; Blasius, B. The complex network of global cargo ship movements. J. R. Soc. Interface 2010, 7, 1093–1103. [Google Scholar] [CrossRef]
  31. Van den Heuvel, M.P.; Mandl, R.C.; Stam, C.J.; Kahn, R.S.; Pol, H.E.H. Aberrant frontal and temporal complex network structure in schizophrenia: A graph theoretical analysis. J. Neurosci. 2010, 30, 15915–15926. [Google Scholar] [CrossRef] [PubMed]
  32. Brockmann, D.; Helbing, D. The hidden geometry of complex, network-driven contagion phenomena. Science 2013, 342, 1337–1342. [Google Scholar] [CrossRef] [PubMed]
  33. Pagani, G.A.; Aiello, M. The power grid as a complex network: A survey. Phys. A Stat. Mech. Appl. 2013, 392, 2688–2700. [Google Scholar] [CrossRef]
  34. Wang, J.; Mo, H.; Wang, F.; Jin, F. Exploring the network structure and nodal centrality of China’s air transport network: A complex network approach. J. Transp. Geogr. 2011, 19, 712–721. [Google Scholar] [CrossRef]
  35. Yang, J.; Cheng, C.; Shen, S.; Yang, S. Comparison of complex network analysis software: Citespace, Sci 2 and Gephi. In Proceedings of the 2017 IEEE 2nd International Conference on Big Data Analysis (ICBDA), Beijing, China, 10–12 March 2017; pp. 169–172. [Google Scholar]
  36. Guo, Y.; Zhang, J.; Yang, Y.; Zhang, H. Modeling the fluctuation patterns of monthly inbound tourist flows to China: A complex network approach. Asia Pac. J. Tour. Res. 2015, 20, 942–953. [Google Scholar] [CrossRef]
  37. Li, P.; Wang, B.-H. Extracting hidden fluctuation patterns of hang seng stock index from network topologies. Phys. A Stat. Mech. Appl. 2007, 378, 519–526. [Google Scholar] [CrossRef]
  38. Garlaschelli, D.; Loffredo, M.I. Structure and evolution of the world trade network. Phys. A Stat. Mech. Appl. 2005, 355, 138–144. [Google Scholar] [CrossRef] [Green Version]
  39. Li, H.; An, H.; Gao, X.; Huang, J.; Xu, Q. On the topological properties of the cross-shareholding networks of listed companies in China: Taking shareholders’ cross-shareholding relationships into account. Phys. A Stat. Mech. Appl. 2014, 406, 80–88. [Google Scholar] [CrossRef]
  40. Shen, S.; Cheng, C.; Yang, J.; Yang, S. Visualized analysis of developing trends and hot topics in natural disaster research. PLoS ONE 2018, 13, e0191250. [Google Scholar] [CrossRef]
  41. Li, P.; Wang, B. An approach to hang seng index in Hong Kong stock market based on network topological statistics. Chin. Sci. Bull. 2006, 51, 624–629. [Google Scholar] [CrossRef]
  42. An, H.; Zhong, W.; Chen, Y.; Li, H.; Gao, X. Features and evolution of international crude oil trade relationships: A trading-based network analysis. Energy 2014, 74, 254–259. [Google Scholar] [CrossRef]
  43. Wang, M.; Tian, L. From time series to complex networks: The phase space coarse graining. Phys. A Stat. Mech. Appl. 2016, 461, 456–468. [Google Scholar] [CrossRef]
  44. Wang, H.; Zhao, Y.; Liang, D.; Deng, Y.; Pang, Y. 30+ year evolution of cu in the surface sediment of Lake Poyang, China. Chemosphere 2017, 168, 1604–1612. [Google Scholar] [CrossRef] [PubMed]
  45. Zhang, Q.; Ye, X.-C.; Werner, A.D.; Li, Y.-L.; Yao, J.; Li, X.-H.; Xu, C.-Y. An investigation of enhanced recessions in Poyang Lake: Comparison of Yangtze River and local catchment impacts. J. Hydrol. 2014, 517, 425–434. [Google Scholar] [CrossRef] [Green Version]
  46. Ye, X.; Li, Y.; Li, X.; Zhang, Q. Factors influencing water level changes in China’s largest freshwater lake, Poyang Lake, in the past 50 years. Water Int. 2014, 39, 983–999. [Google Scholar] [CrossRef]
  47. Sheng, L.; Xiu-Ping, Z.; Rong-Fang, L.; Xiao-Hua, X.; Qun, F. Analysis the changes of annual for poyang lake wetland vegetation based on modis monitoring. Procedia Environ. Sci. 2011, 10, 1841–1846. [Google Scholar] [CrossRef]
  48. Li, X.; Yao, J.; Li, Y.; Zhang, Q.; Xu, C.-Y. A modeling study of the influences of yangtze river and local catchment on the development of floods in Poyang Lake, China. Hydrol. Res. 2016, 47, 102–119. [Google Scholar] [CrossRef]
  49. Buishand, T.A. Some methods for testing the homogeneity of rainfall records. J. Hydrol. 1982, 58, 11–27. [Google Scholar] [CrossRef]
  50. Radziejewski, M.; Bardossy, A.; Kundzewicz, Z.W. Detection of change in river flow using phase randomization. Hydrol. Sci. J. 2000, 45, 547–558. [Google Scholar] [CrossRef] [Green Version]
  51. Smadi, M.M.; Zghoul, A. A sudden change in rainfall characteristics in Amman, Jordan during the mid 1950s. Am. J. Environ. Sci. 2006, 2, 84–91. [Google Scholar] [CrossRef]
  52. Mavromatis, T.; Stathis, D. Response of the water balance in Greece to temperature and precipitation trends. Theor. Appl. Climatol. 2011, 104, 13–24. [Google Scholar] [CrossRef]
  53. Burdon, F.J.; McIntosh, A.R.; Harding, J.S. Habitat loss drives threshold response of benthic invertebrate communities to deposited sediment in agricultural streams. Ecol. Appl. 2013, 23, 1036–1047. [Google Scholar] [CrossRef] [PubMed]
  54. Tao, H.; Gemmer, M.; Bai, Y.; Su, B.; Mao, W. Trends of streamflow in the Tarim River basin during the past 50 years: Human impact or climate change? J. Hydrol. 2011, 400, 1–9. [Google Scholar] [CrossRef]
  55. Taylor, W.A. Change-Point Analysis: A Powerful New Tool for Detecting Changes. 2000. Available online: http://www.variation.com/cpa/tech/changepoint.html (accessed on 3 October 2018).
  56. Wackerbauer, R.; Witt, A.; Atmanspacher, H.; Kurths, J.; Scheingraber, H. A comparative classification of complexity measures. Chaos Solitons Fractals 1994, 4, 133–173. [Google Scholar] [CrossRef]
  57. Zhou, L.; Gong, Z.-Q.; Zhi, R.; Feng, G.-L. Study on the regional characteristics of the temperature changes in China based on complex network. Acta Phys. Sin. 2009, 58, 7351–7358. [Google Scholar]
  58. Freeman, L.C. Centrality in social networks conceptual clarification. Soc. Netw. 1978, 1, 215–239. [Google Scholar] [CrossRef]
  59. Goh, K.-I.; Oh, E.; Kahng, B.; Kim, D. Betweenness centrality correlation in social networks. Phys. Rev. E 2003, 67, 017101. [Google Scholar] [CrossRef] [Green Version]
  60. Freeman, L.C.; Borgatti, S.P.; White, D.R. Centrality in valued graphs: A measure of betweenness based on network flow. Soc. Netw. 1991, 13, 141–154. [Google Scholar] [CrossRef] [Green Version]
  61. Gao, B.; Yang, D.; Yang, H. Impact of the three gorges dam on flow regime in the middle and lower yangtze river. Quat. Int. 2013, 304, 43–50. [Google Scholar] [CrossRef]
  62. Liu, J.; Zhang, Q.; Sun, P.; Gu, X.; Fang, Z. Minimun ecological water requirements of the poyang lake. Acta Sci. Nat. Univ. Sunyatseni 2014, 53, 149–153. [Google Scholar]
  63. Gan, X.Y. The Research about the Impact of Drought on Poyang Wetland; Nanchang University: Nanchang, China, 2011. [Google Scholar]
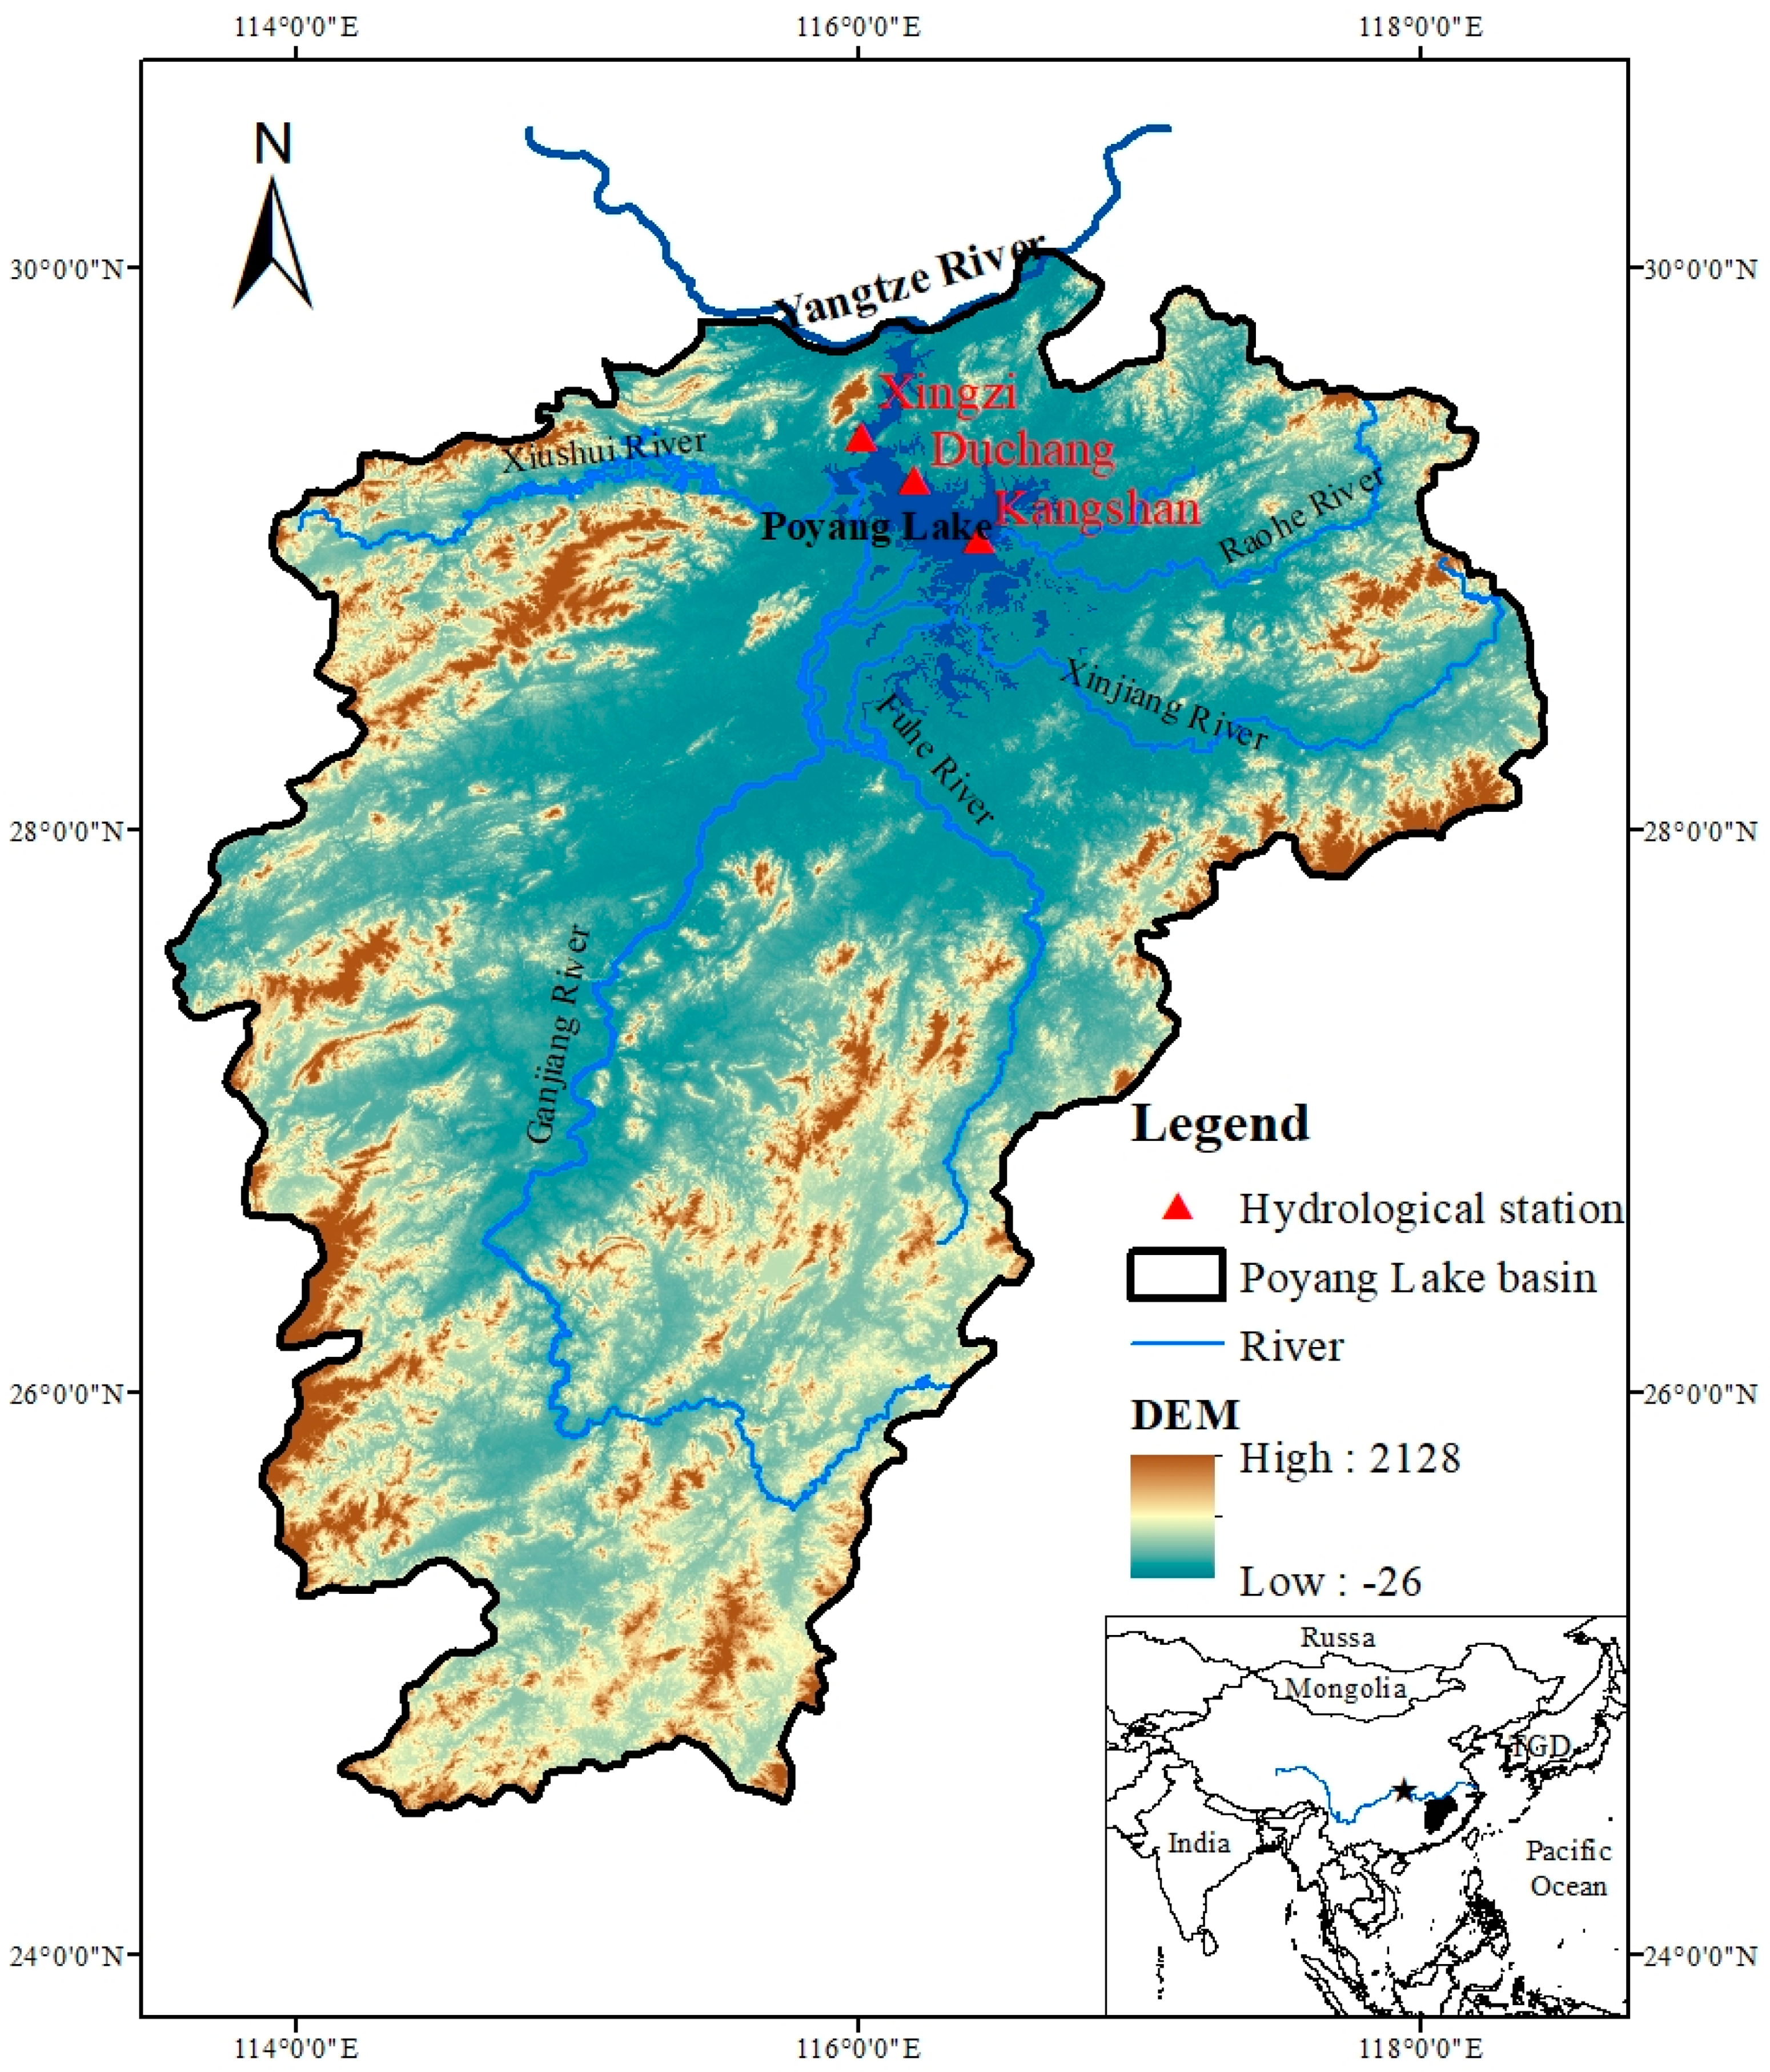
Figure 1. Location of Poyang Lake and Xingzi, Duchang, and Kangshan Stations.
Ijgi 08 00470 g001
Figure 2. Water level of Xingzi, Duchang, Kangshan stations from 2014/12/08 to 2017/07/08.
Ijgi 08 00470 g002
Figure 3. Annual mean water level and combination of cumulative sum charts (CUSUM) for 1991–2016. (The solid line is the annual mean water level, and the dashed line is the CUSUM of corresponding parameters.).
Ijgi 08 00470 g003
Figure 4. Daily water level at Xingzi Station of Poyang lake and Average water level during the period 1991–2003, 2004–2016.
Ijgi 08 00470 g004
Figure 5. A comparison of the frequency distribution for water level between the two periods (1991–2002, 2004–2016). The solid line represents the frequency distribution of the water level in the early period, and the dashed line represent the frequency distribution in the latter period. The two vertical lines on the left and right represent the minimum ecological water level [62] and the warning water level, respectively.
Ijgi 08 00470 g005
Figure 6. A comparison of the frequency distribution of water level for four seasons between the two periods. The solid lines represent the frequency distribution of the water level of the years in the early period, the and dashed lines represent the frequency distribution in the latter period. The two vertical lines on the left and right represent the minimum ecological water level [62] and the warning water level, respectively.
Ijgi 08 00470 g006
Figure 7. The hydrological network constructed from the water level over the two periods. (The graph on the left is the network of the early period. The graph on the right is the network of the latter period).
Ijgi 08 00470 g007
Figure 8. The statistical results of fluctuation patterns of spring, summer, autumn, and winter during the two periods. (Because of the small number of slow variation patterns, they are not listed.).
Ijgi 08 00470 g008
Table 1. Correlation between water level at Xingzi, Duchang, Kangshan stations.
XingziDuchangKangshan
Xingzi10.998 **0.959 **
Duchang-10.966 **
Kangshan--1
** Correlation is significant at the 0.01 level (2-tailed).
Table 2. The statistical results of three patterns during the two periods.
PeriodsRapid Rising PatternSlow Variation PatternRapid Declining Pattern
1991–2002182 (24.9%)18 (2.5%)194 (26.6%)
2005–2016185 (25.3%)23 (3.2%)163 (22.3%)
Table 3. Betweenness centrality (BC) of nodes among networks before and after TGD.
1991–2002NodeRRRDDDrrrRRrdddRredDDederRRrrR
BC(%)16.0%8.6% 5.5% 5.3% 4.5% 4.0% 3.4% 2.7% 2.7% 2.7%
Rank12345678910
2005–2016NodeRRRDDDrRReddrrreerrrederRRreee
BC(%)9.9% 9.4% 5.5% 5.0% 4.9% 4.8% 4.3% 4.2% 4.1% 3.7%
Rank12345678910