Deep Neural Networks and Kernel Density Estimation for Detecting Human Activity Patterns from Geo-Tagged Images: A Case Study of Birdwatching on Flickr


Abstract
1. Introduction
1.1. Biases of Citizen Science and Social Media Data
1.2. Computer Vision Algorithms
1.3. Birdwatching
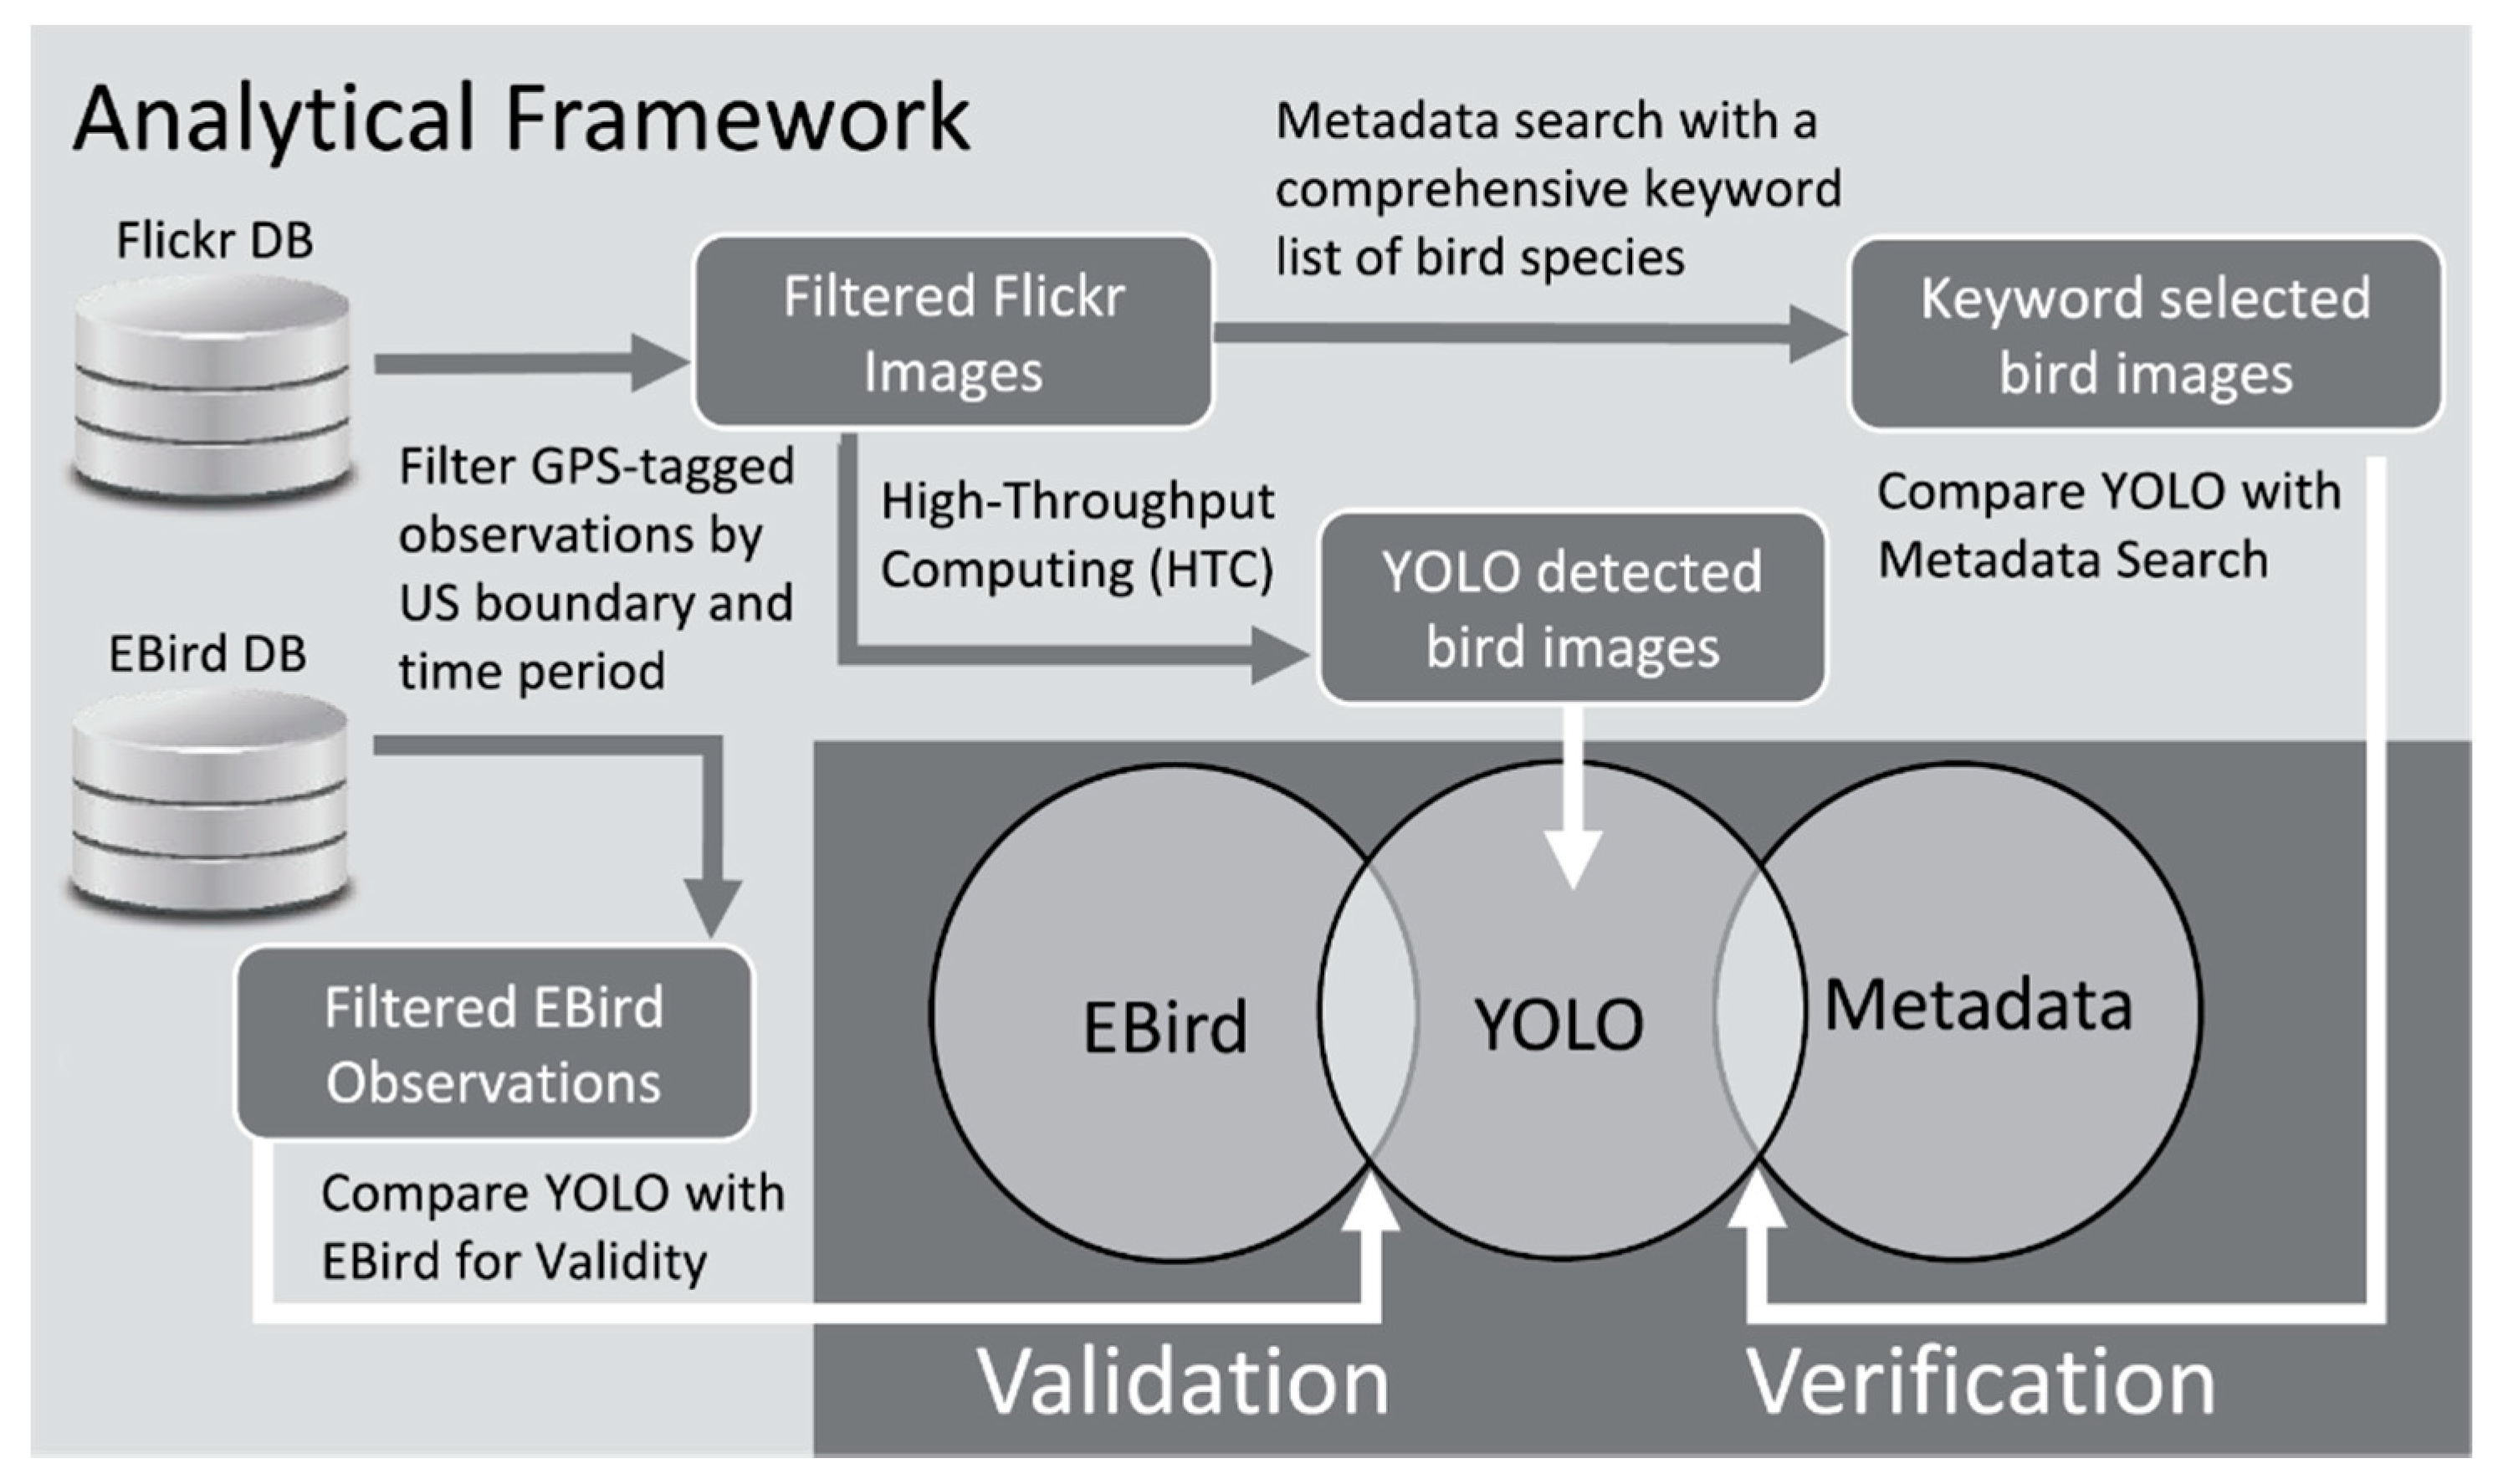
2. Materials and Methods
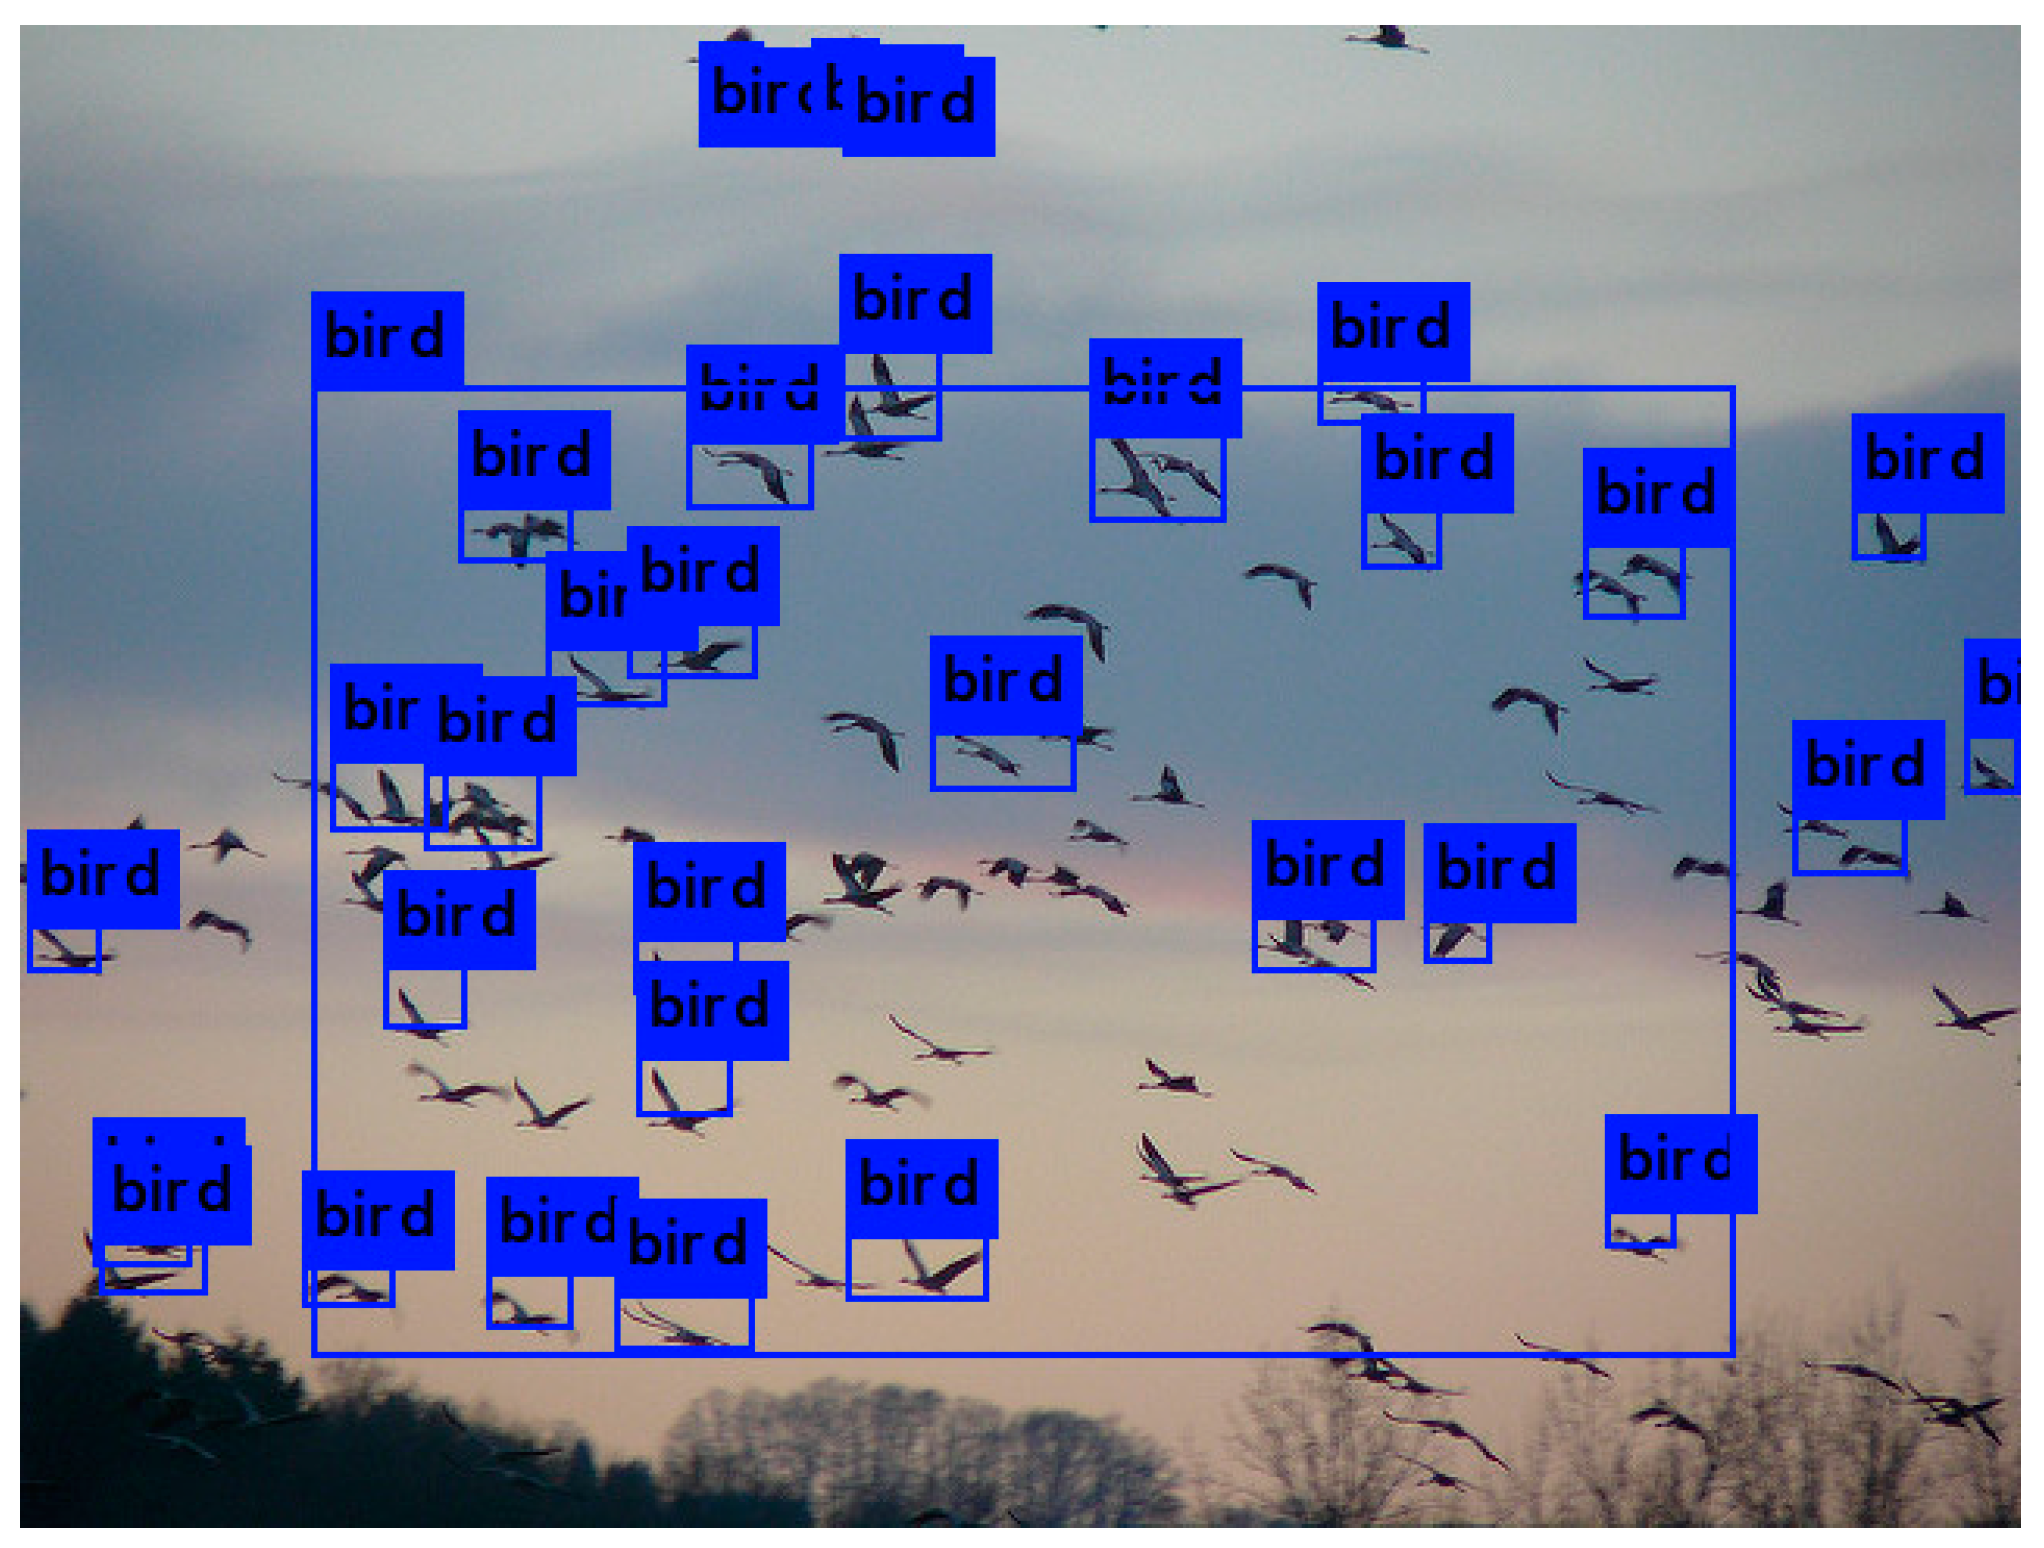
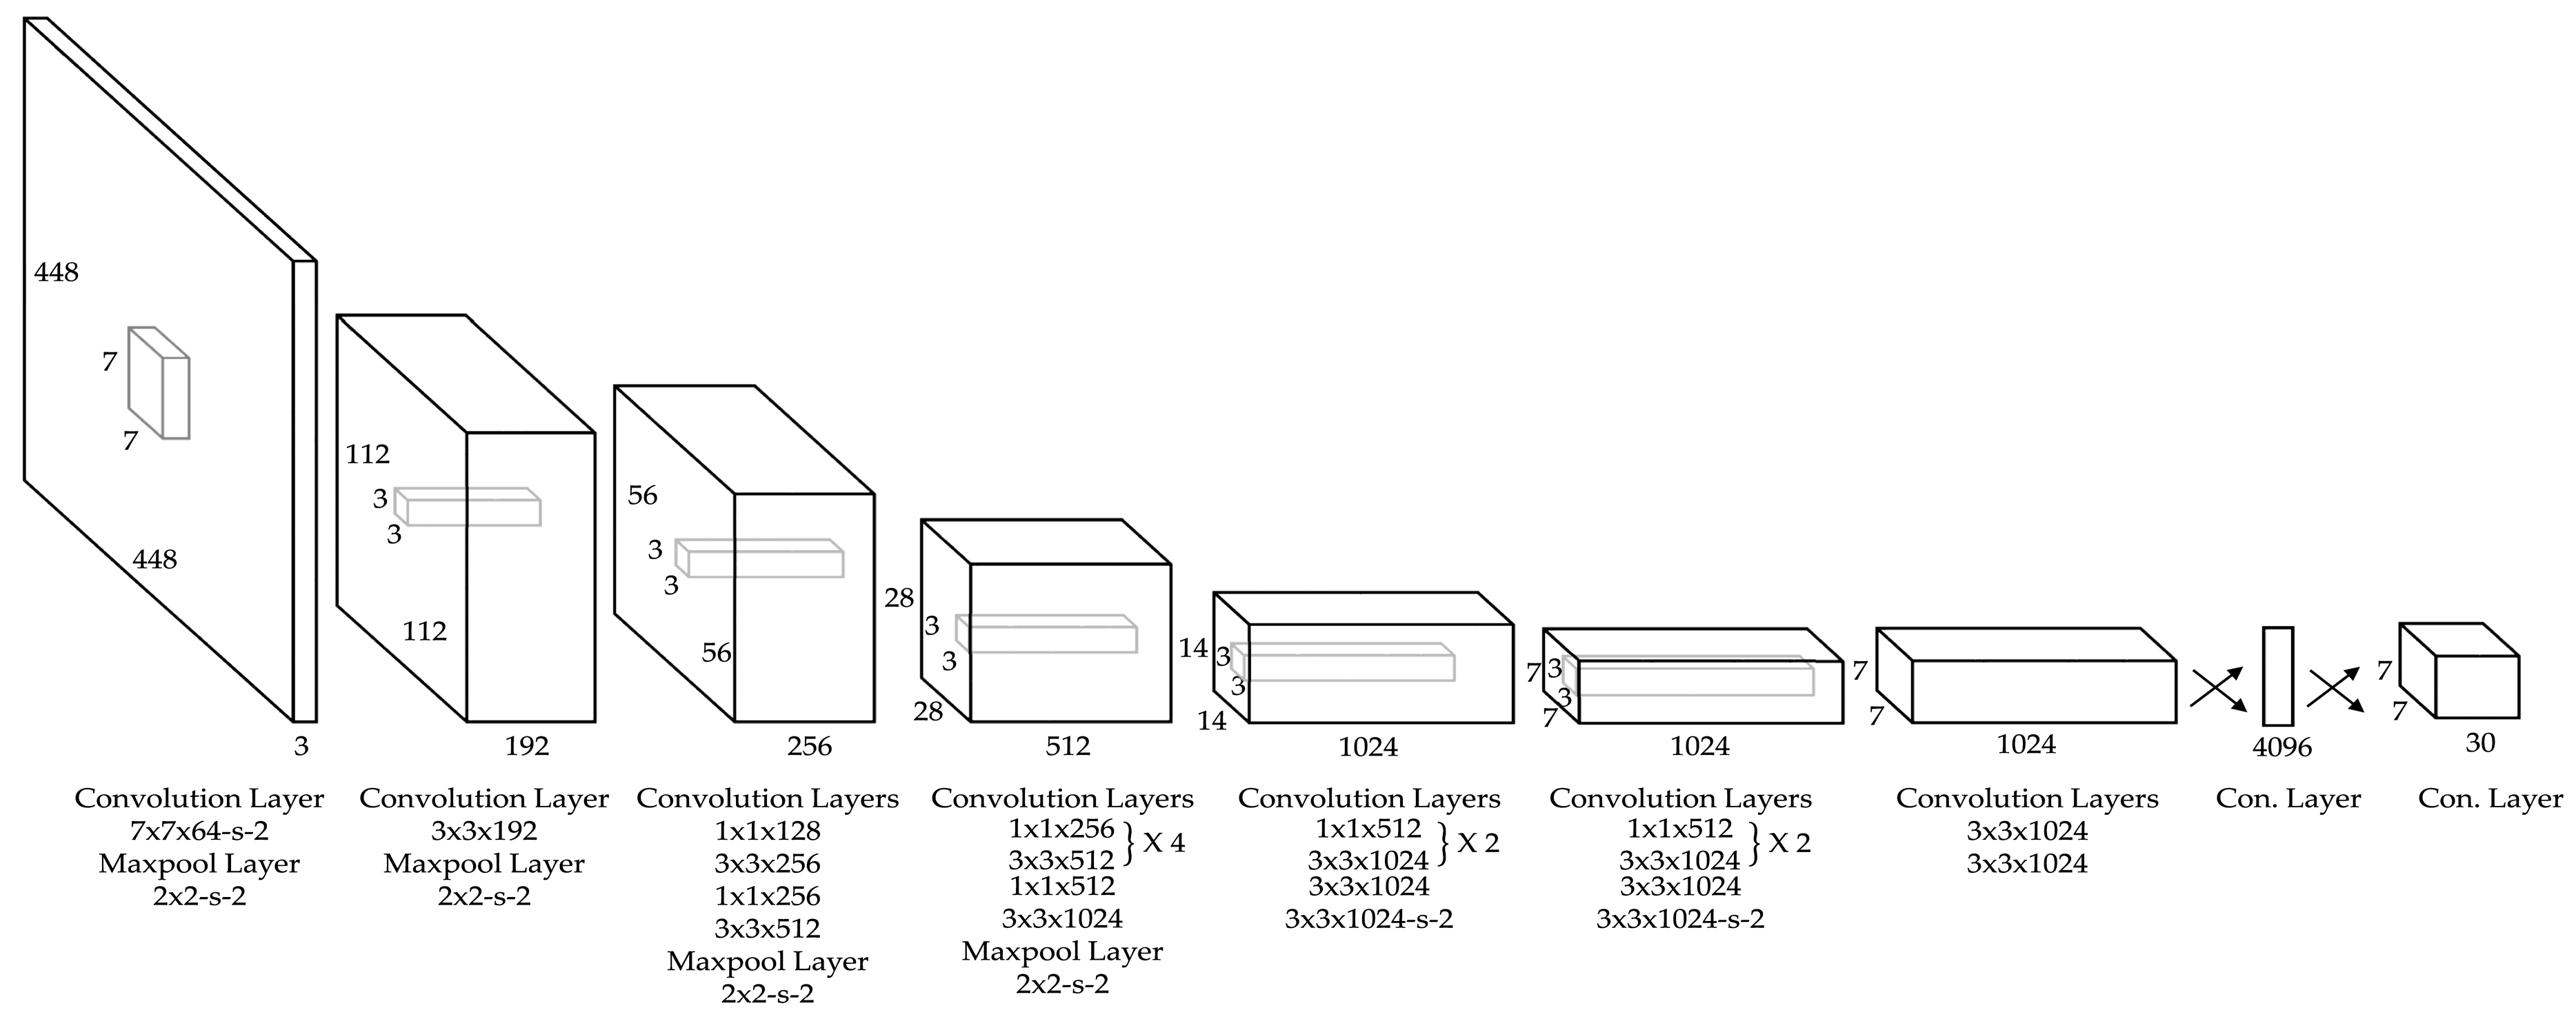
2.1. You Only Look Once (YOLO)
2.2. Kernel Density Estimation
- G: Grid: the total set of grid cells that covers the study area.
- Gi: Grid cell i. Gi ∈ G.
- k: Adaptive filter (neighborhood) threshold based on the total number of distinct users.
- Ui: The list of users within the neighborhood of Gi.
- Oi: The list of observations within the neighborhood of Gi.
- h (Gi, k): The bandwidth of the k-Size Neighborhood of the grid cell Gi is defined as the smallest KNN (Gi, k) = {} that has a total count of distinct users:
- K: Kernel function. Uniform function is used for simple interpretation of the results.
- (1)
- Compute G, the grid of the study area given a resolution r. In this study, r = 8 km was used.
- (2)
- Aggregate observation statistics such as the number of observations and keep a list (hash) of users for each distinct observation location for both Flickr and eBird.
- (3)
- Given k = 100, compute a spatial index based on Sort-tile-recursive (STR) tree for finding the k-nearest Flickr and eBird users for each grid-cell.
- (4)
- Determine Oi, h (Gi, k), and the weights of observations for each grid-cell using the adaptive kernel estimation.
- (5)
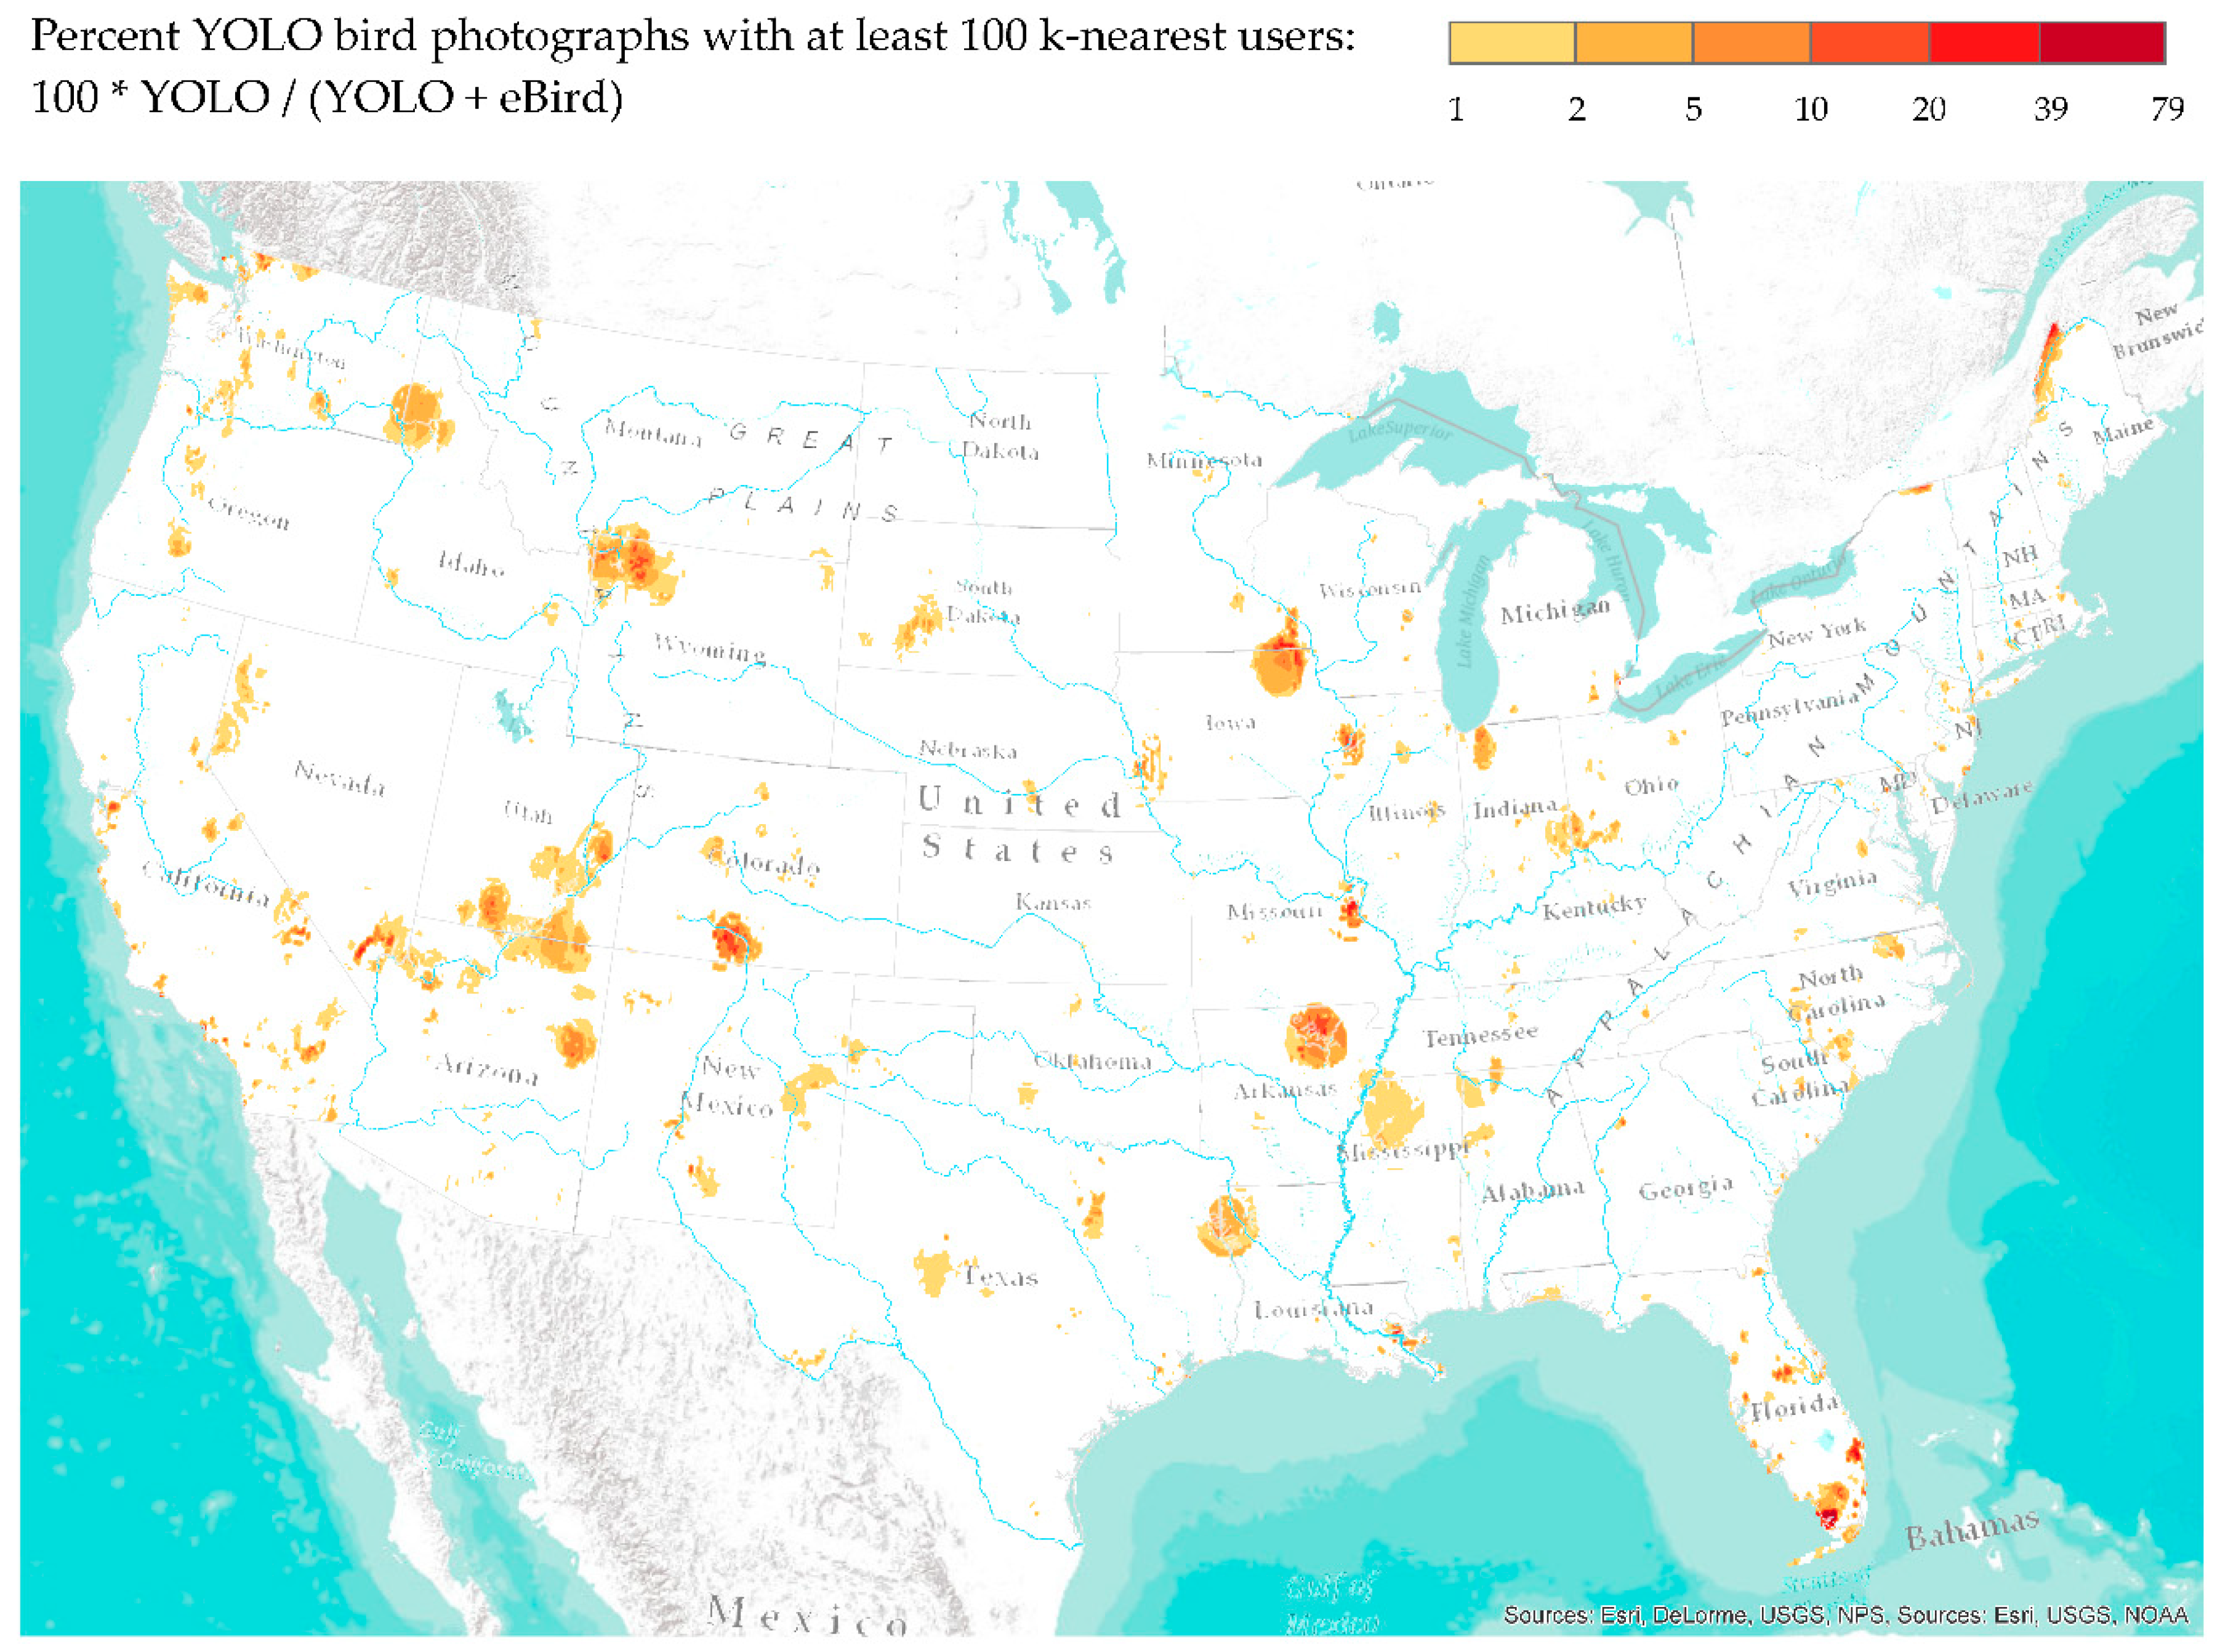
- Compute the percentage of YOLO-detected Flickr images to eBird observations for each grid-cell.
3. Results and Evaluation
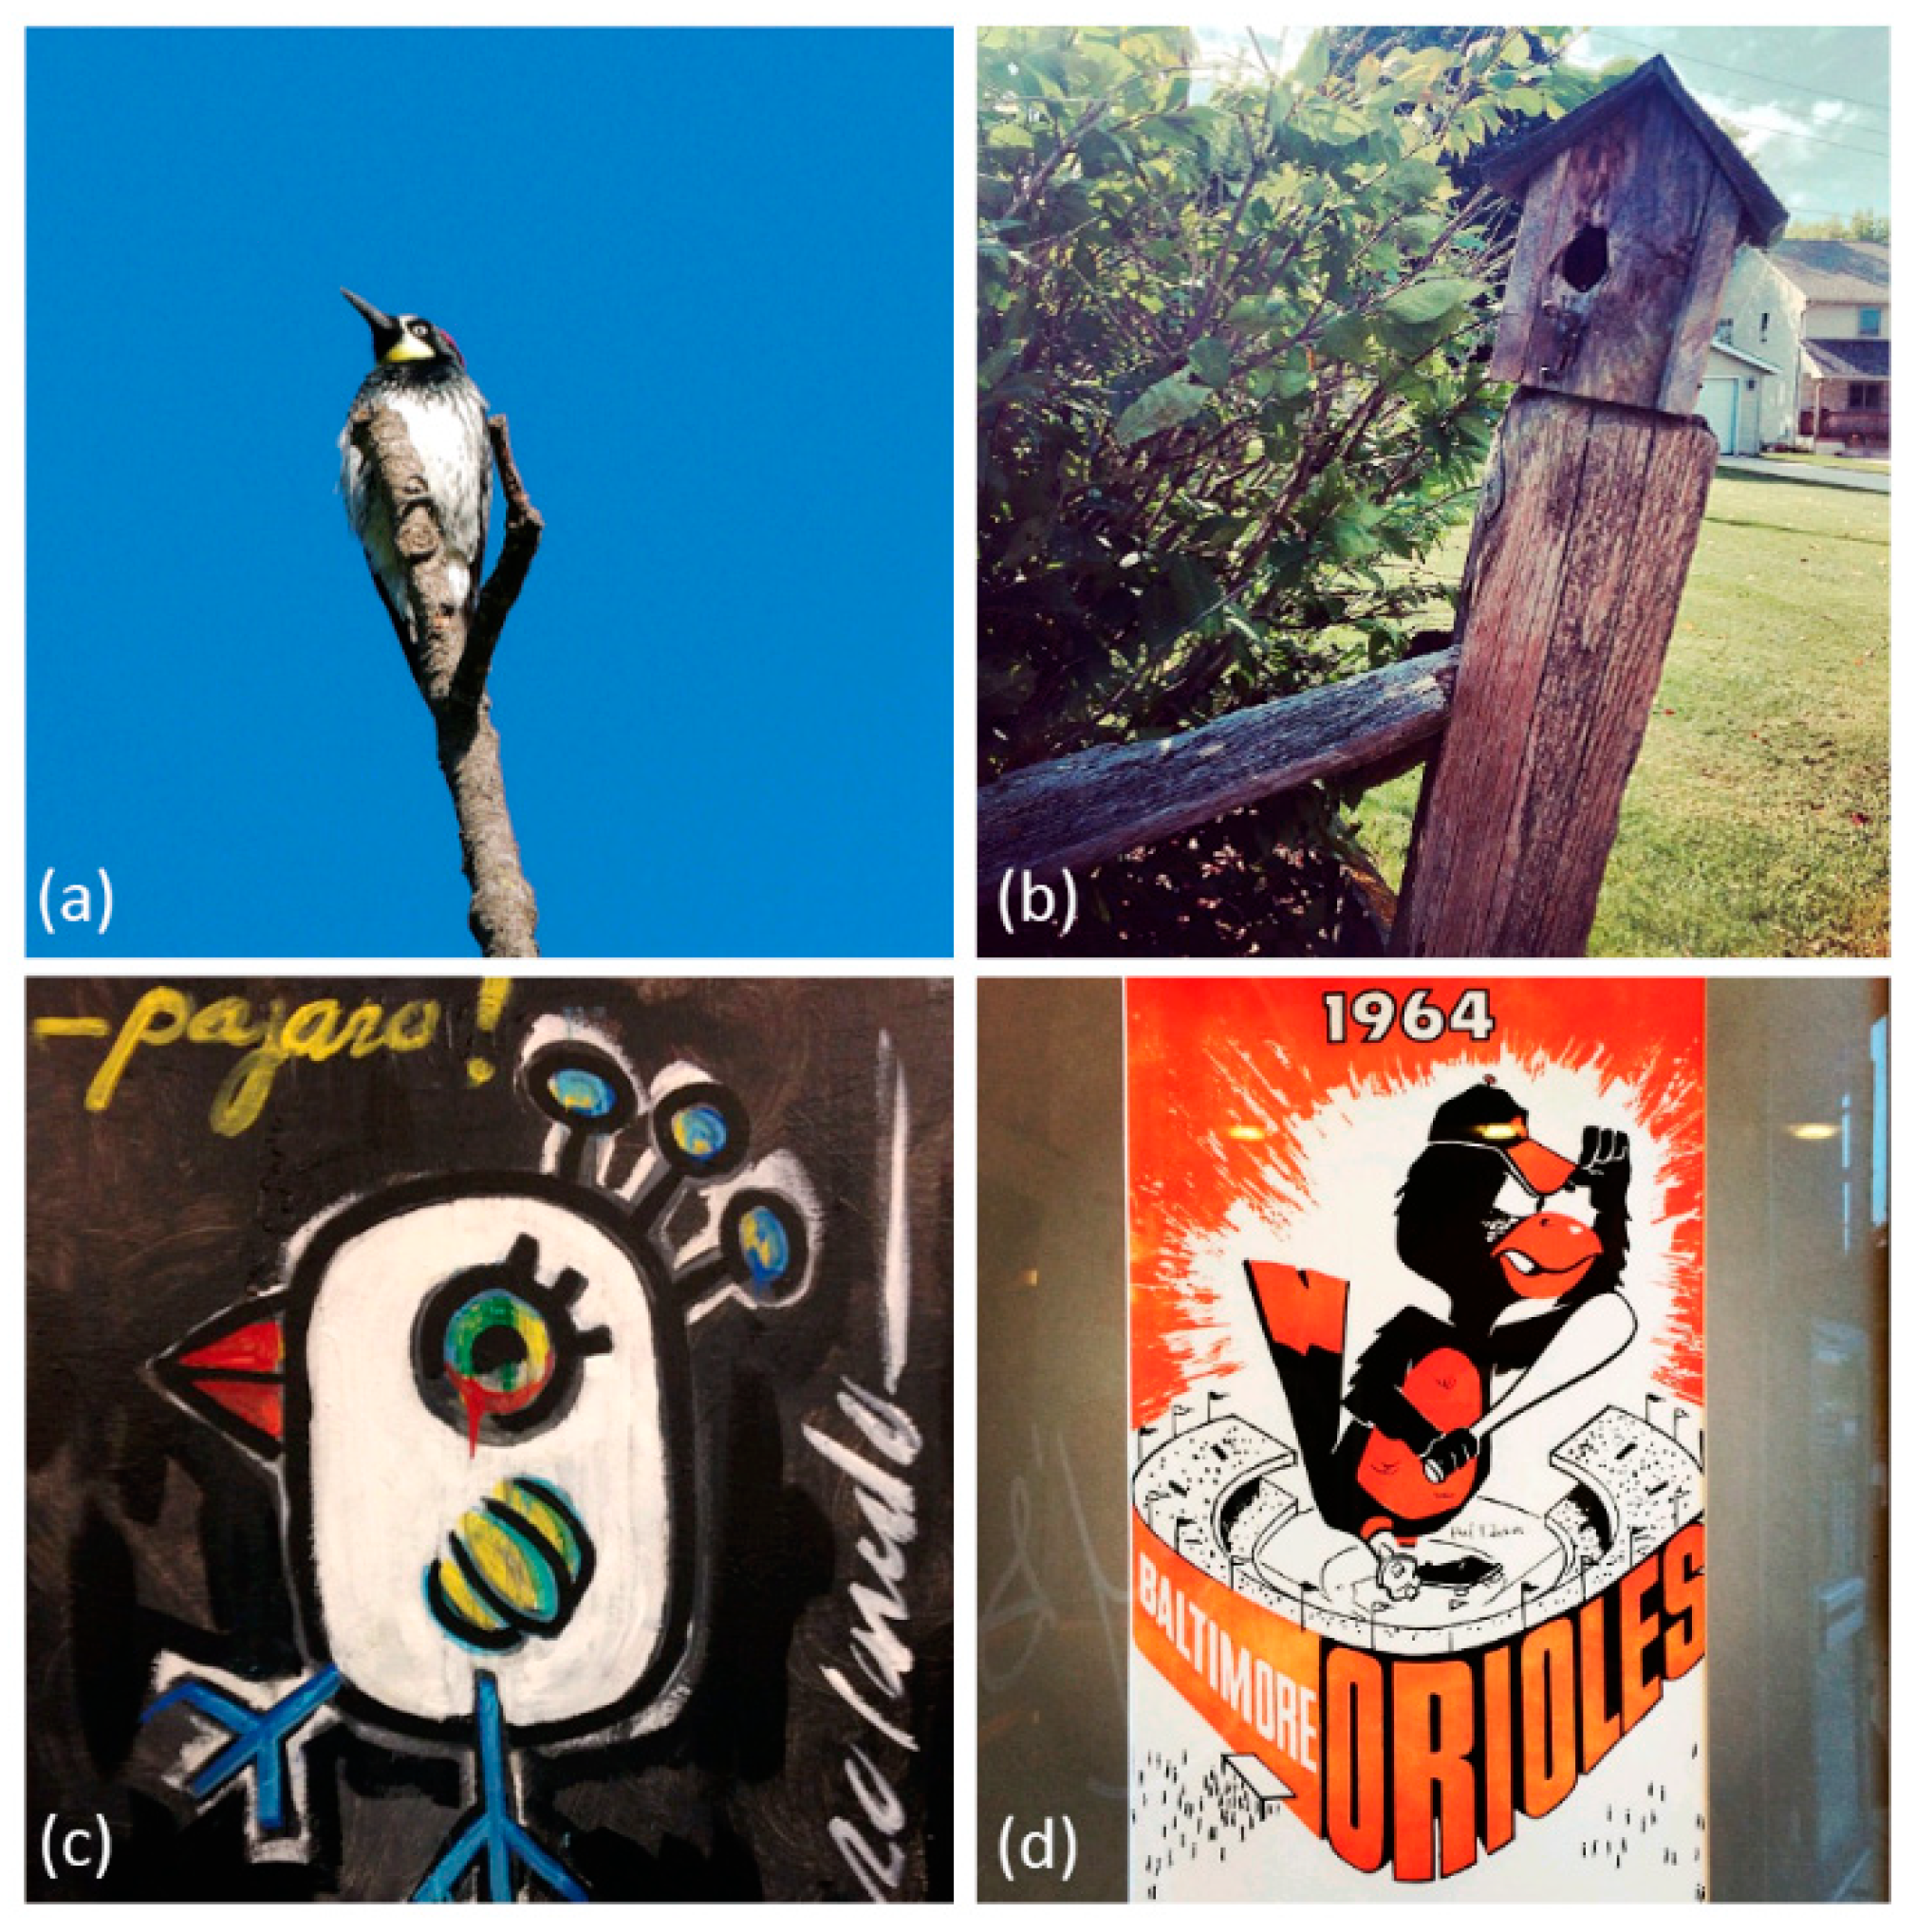
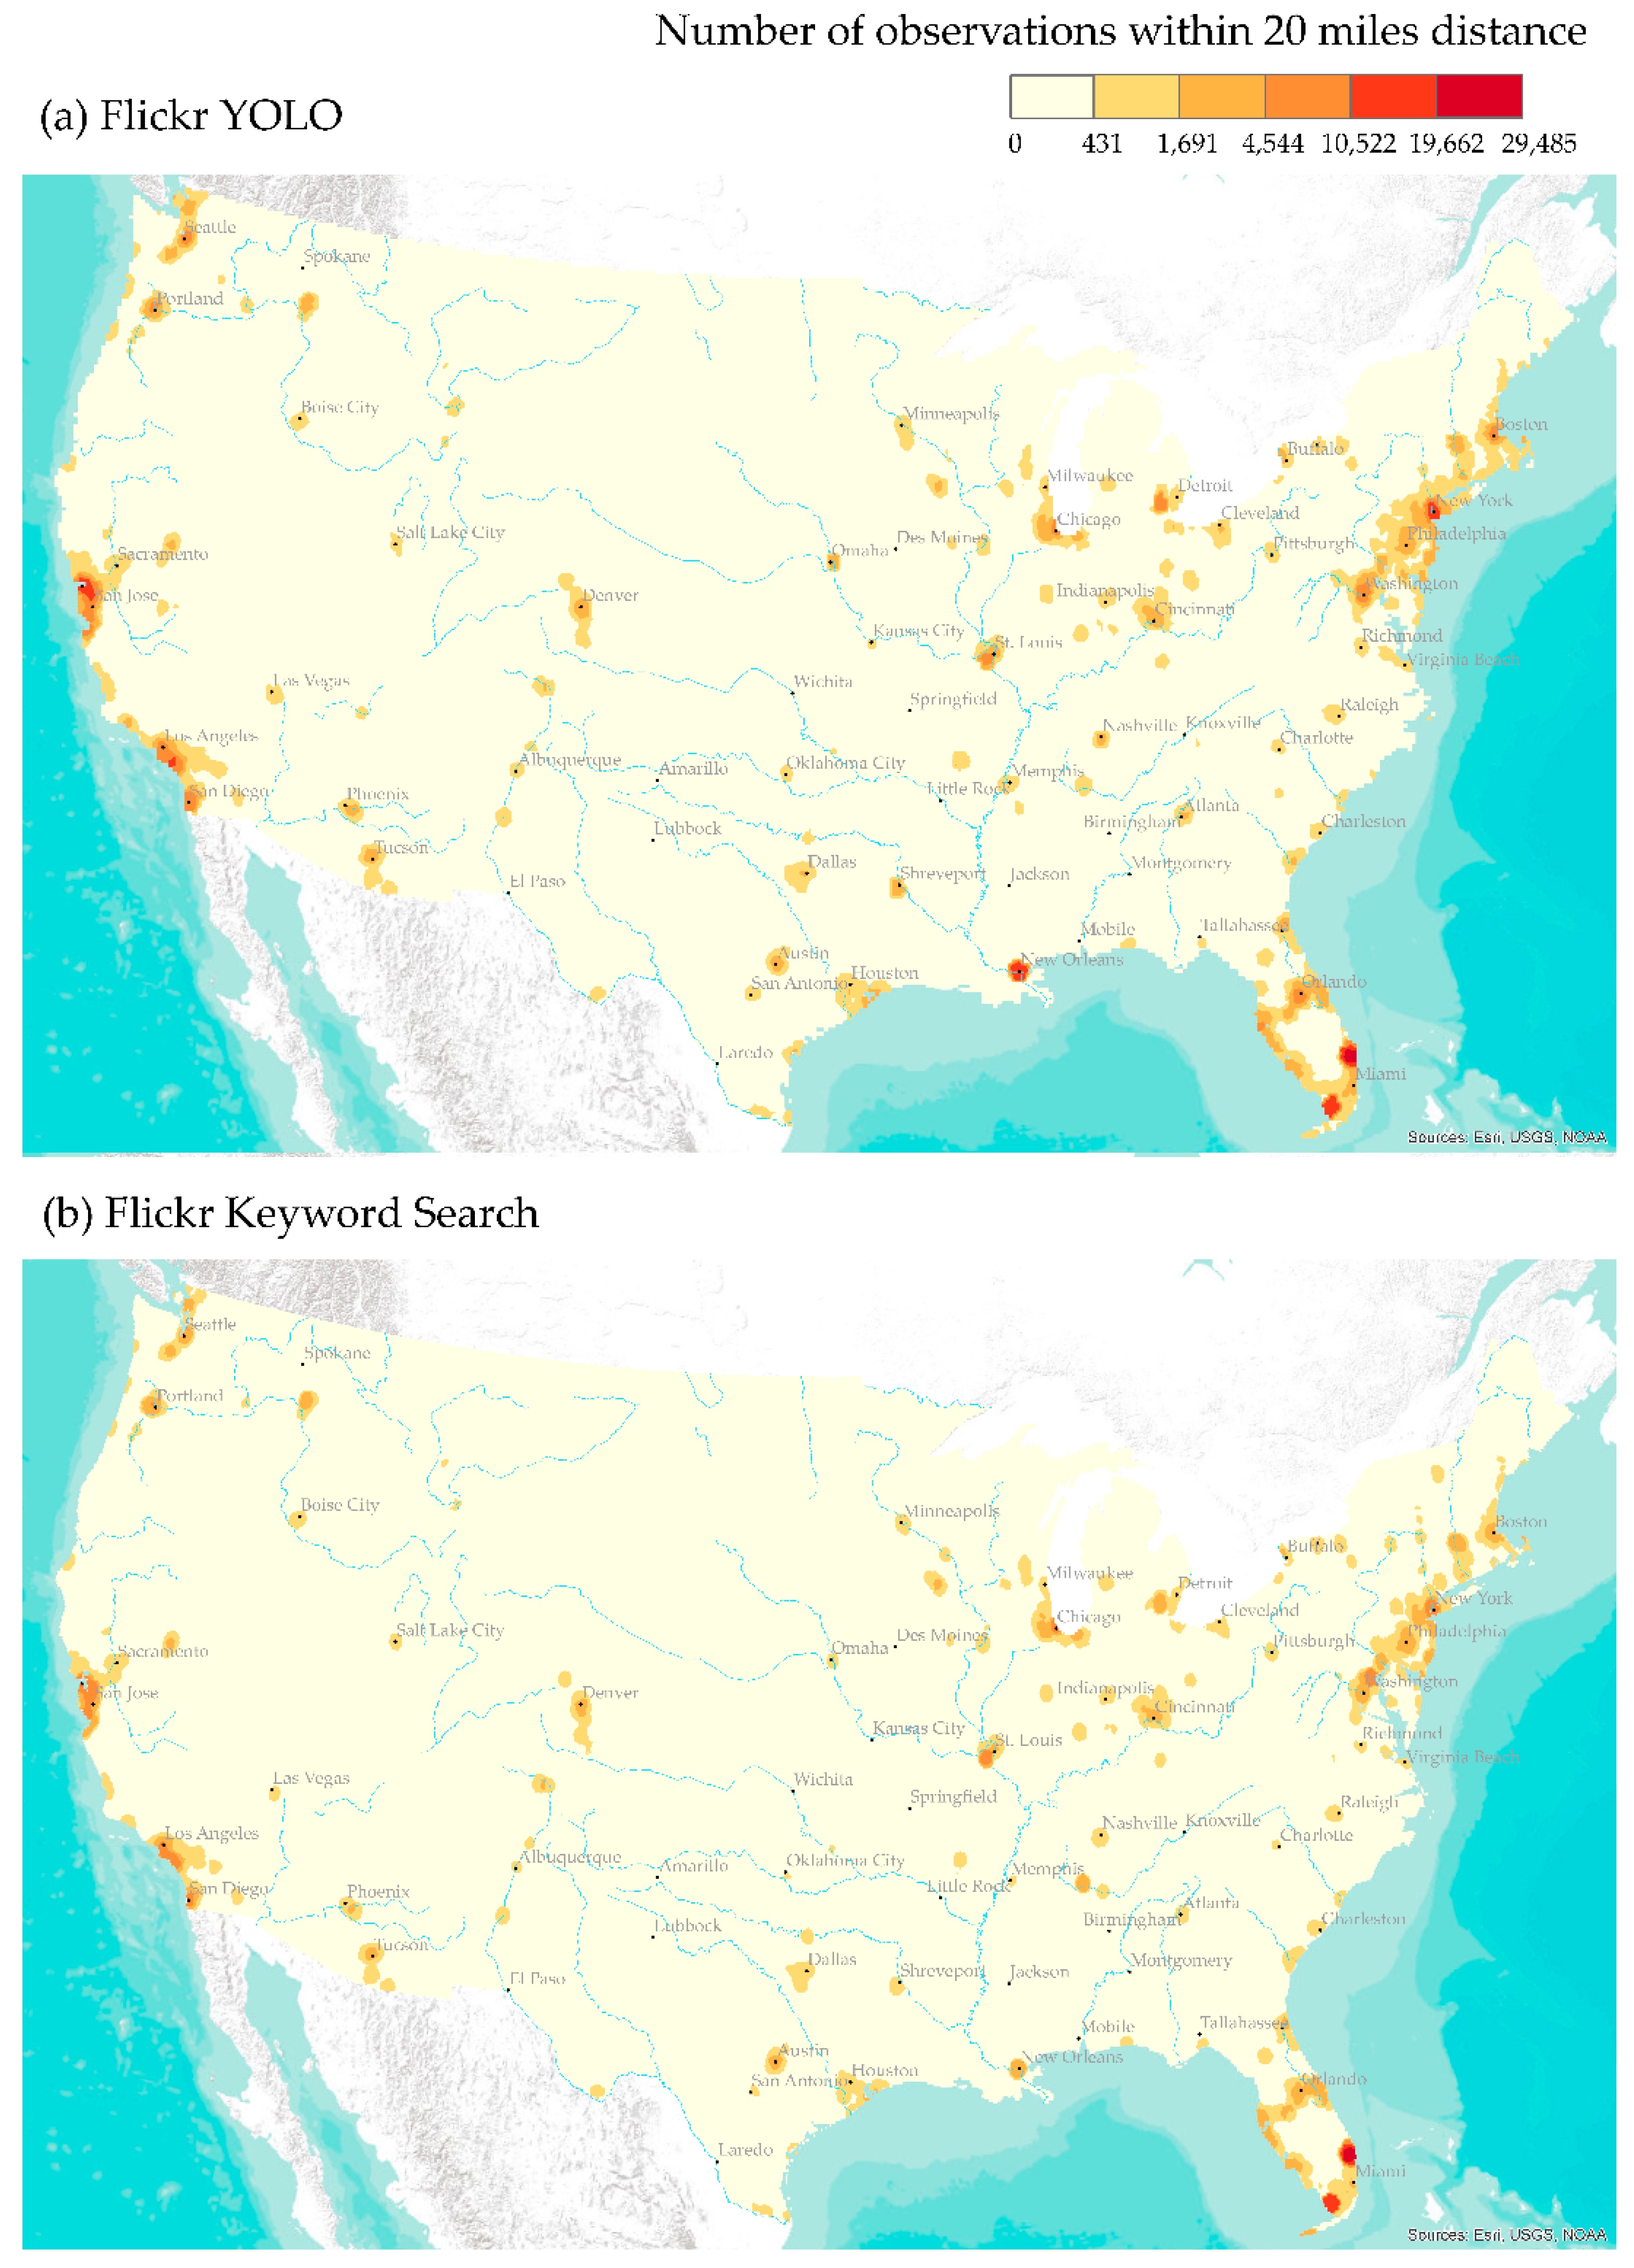
3.1. Verification
- Is object detection more accurate than metadata search for capturing bird images on Flickr?
- Are there any spatial and temporal biases between the results of metadata search and YOLO object detection?
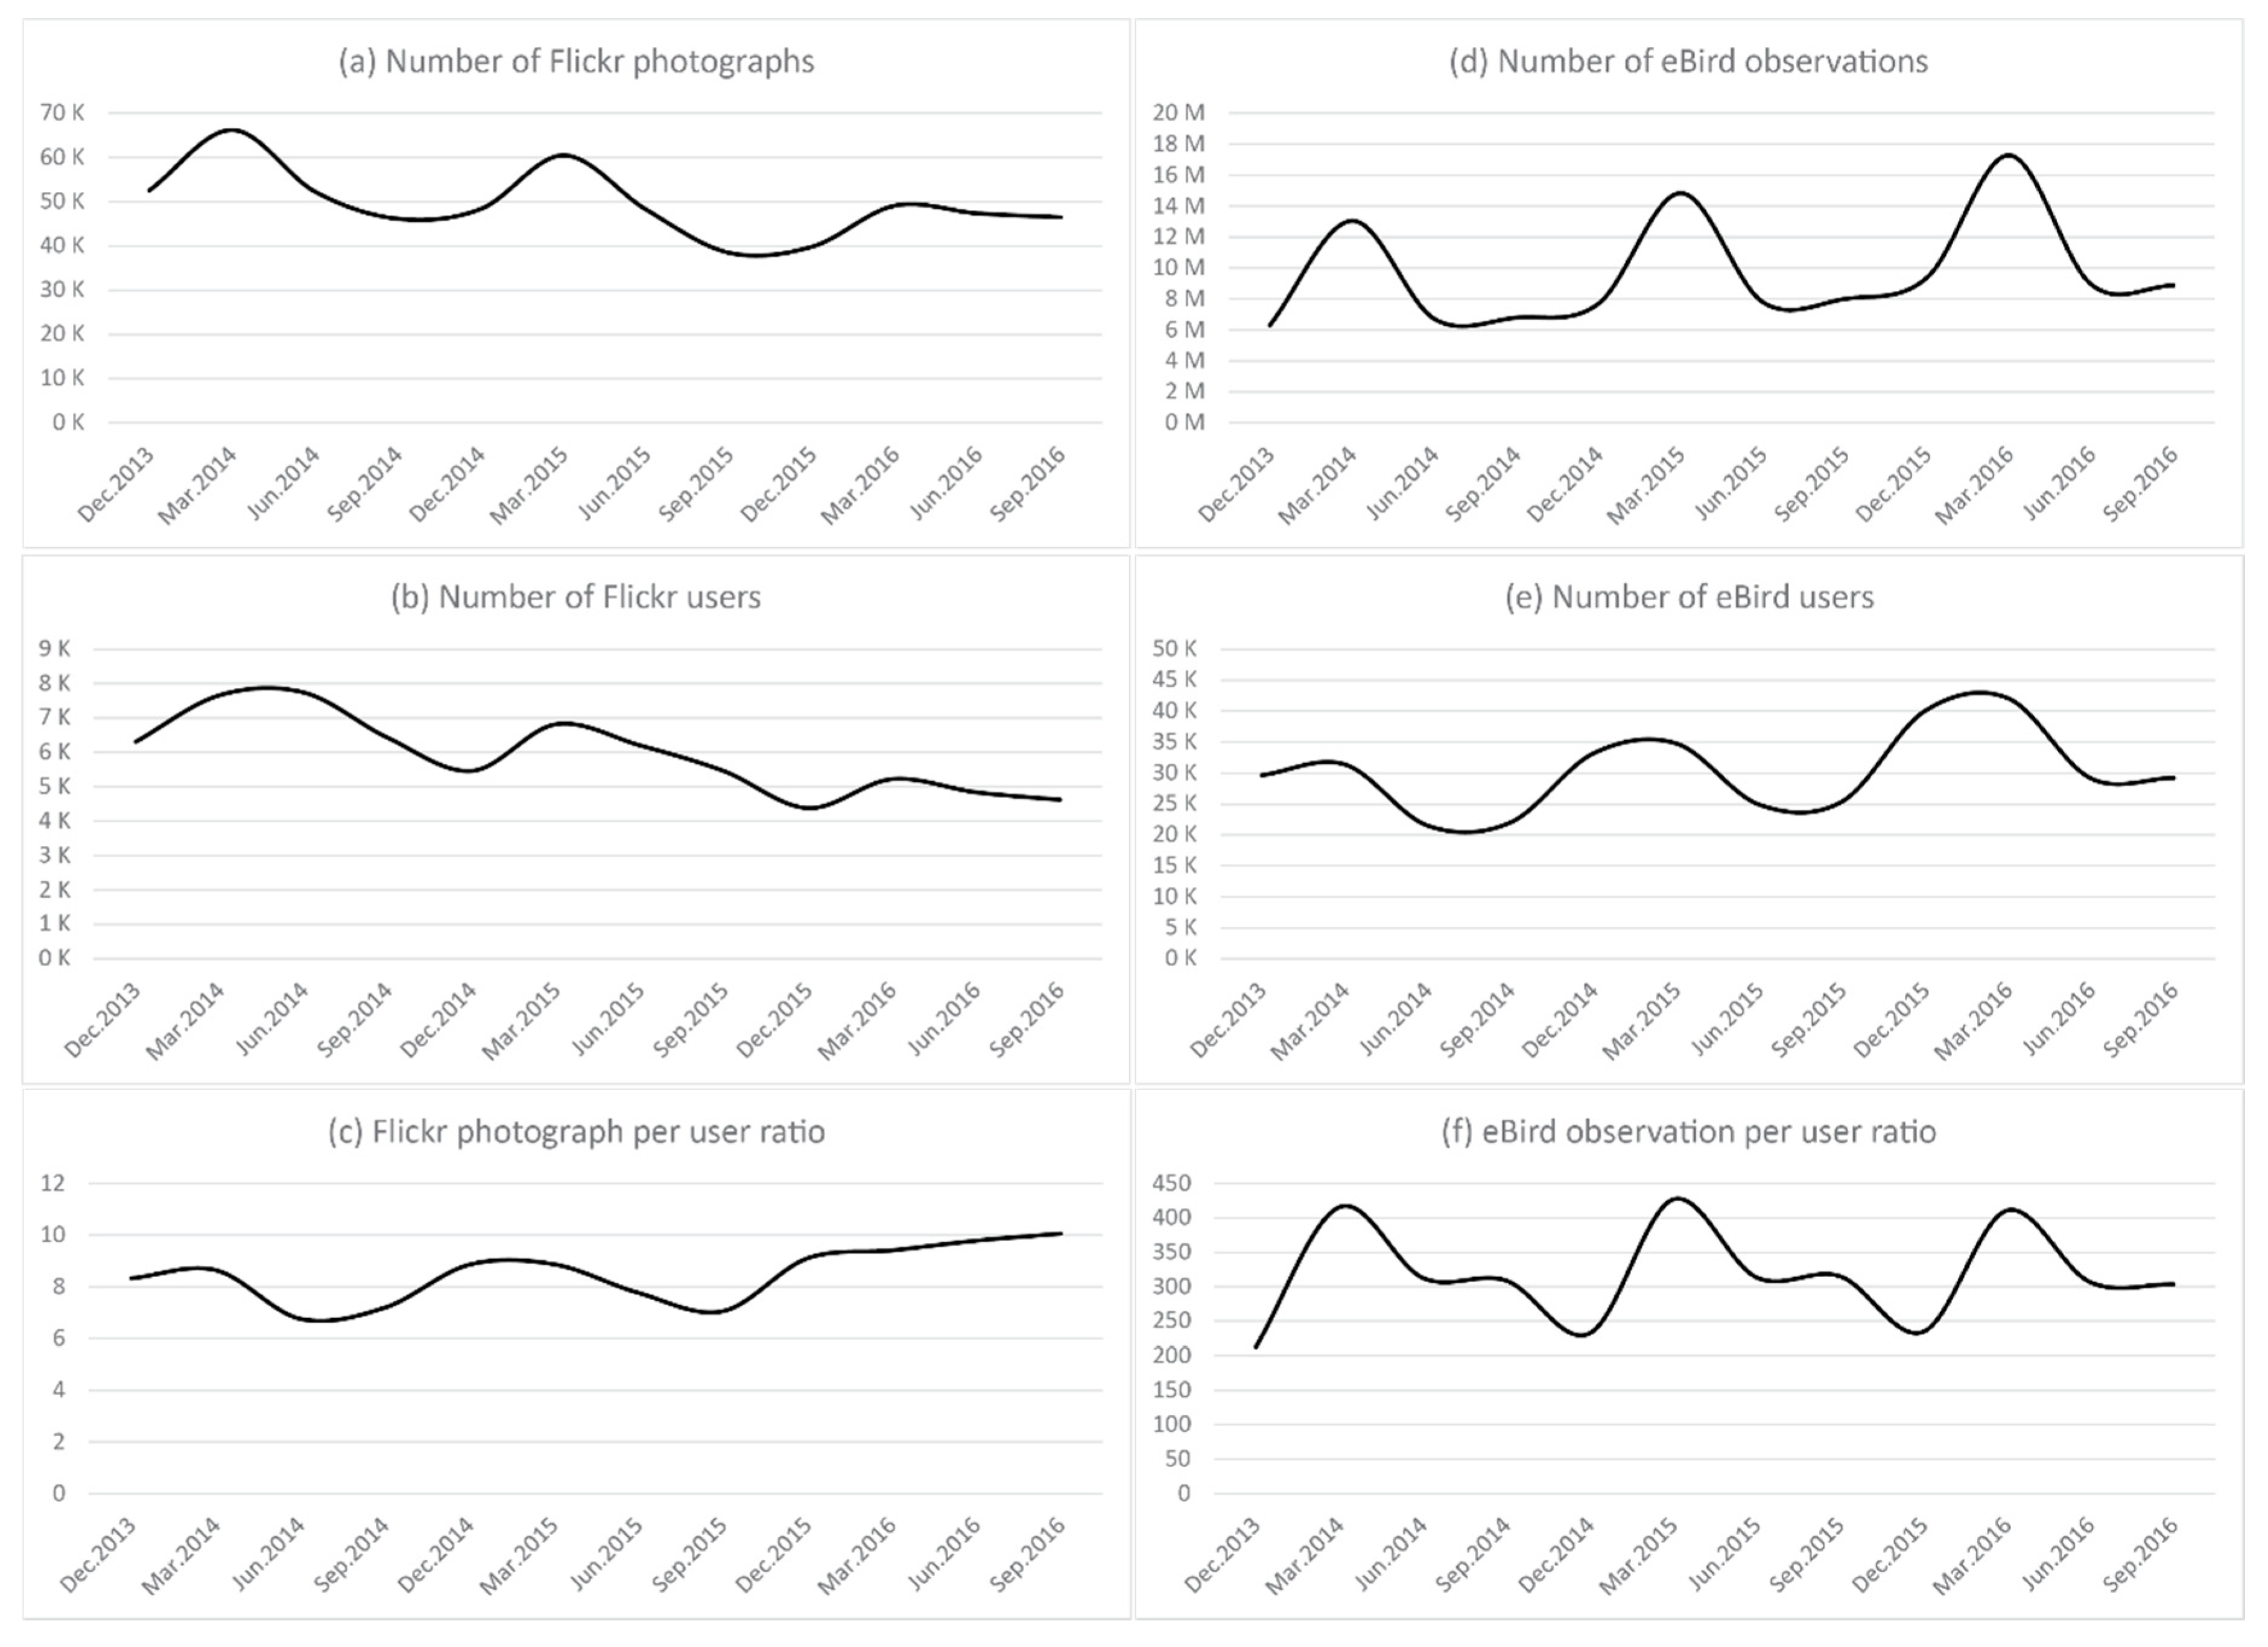
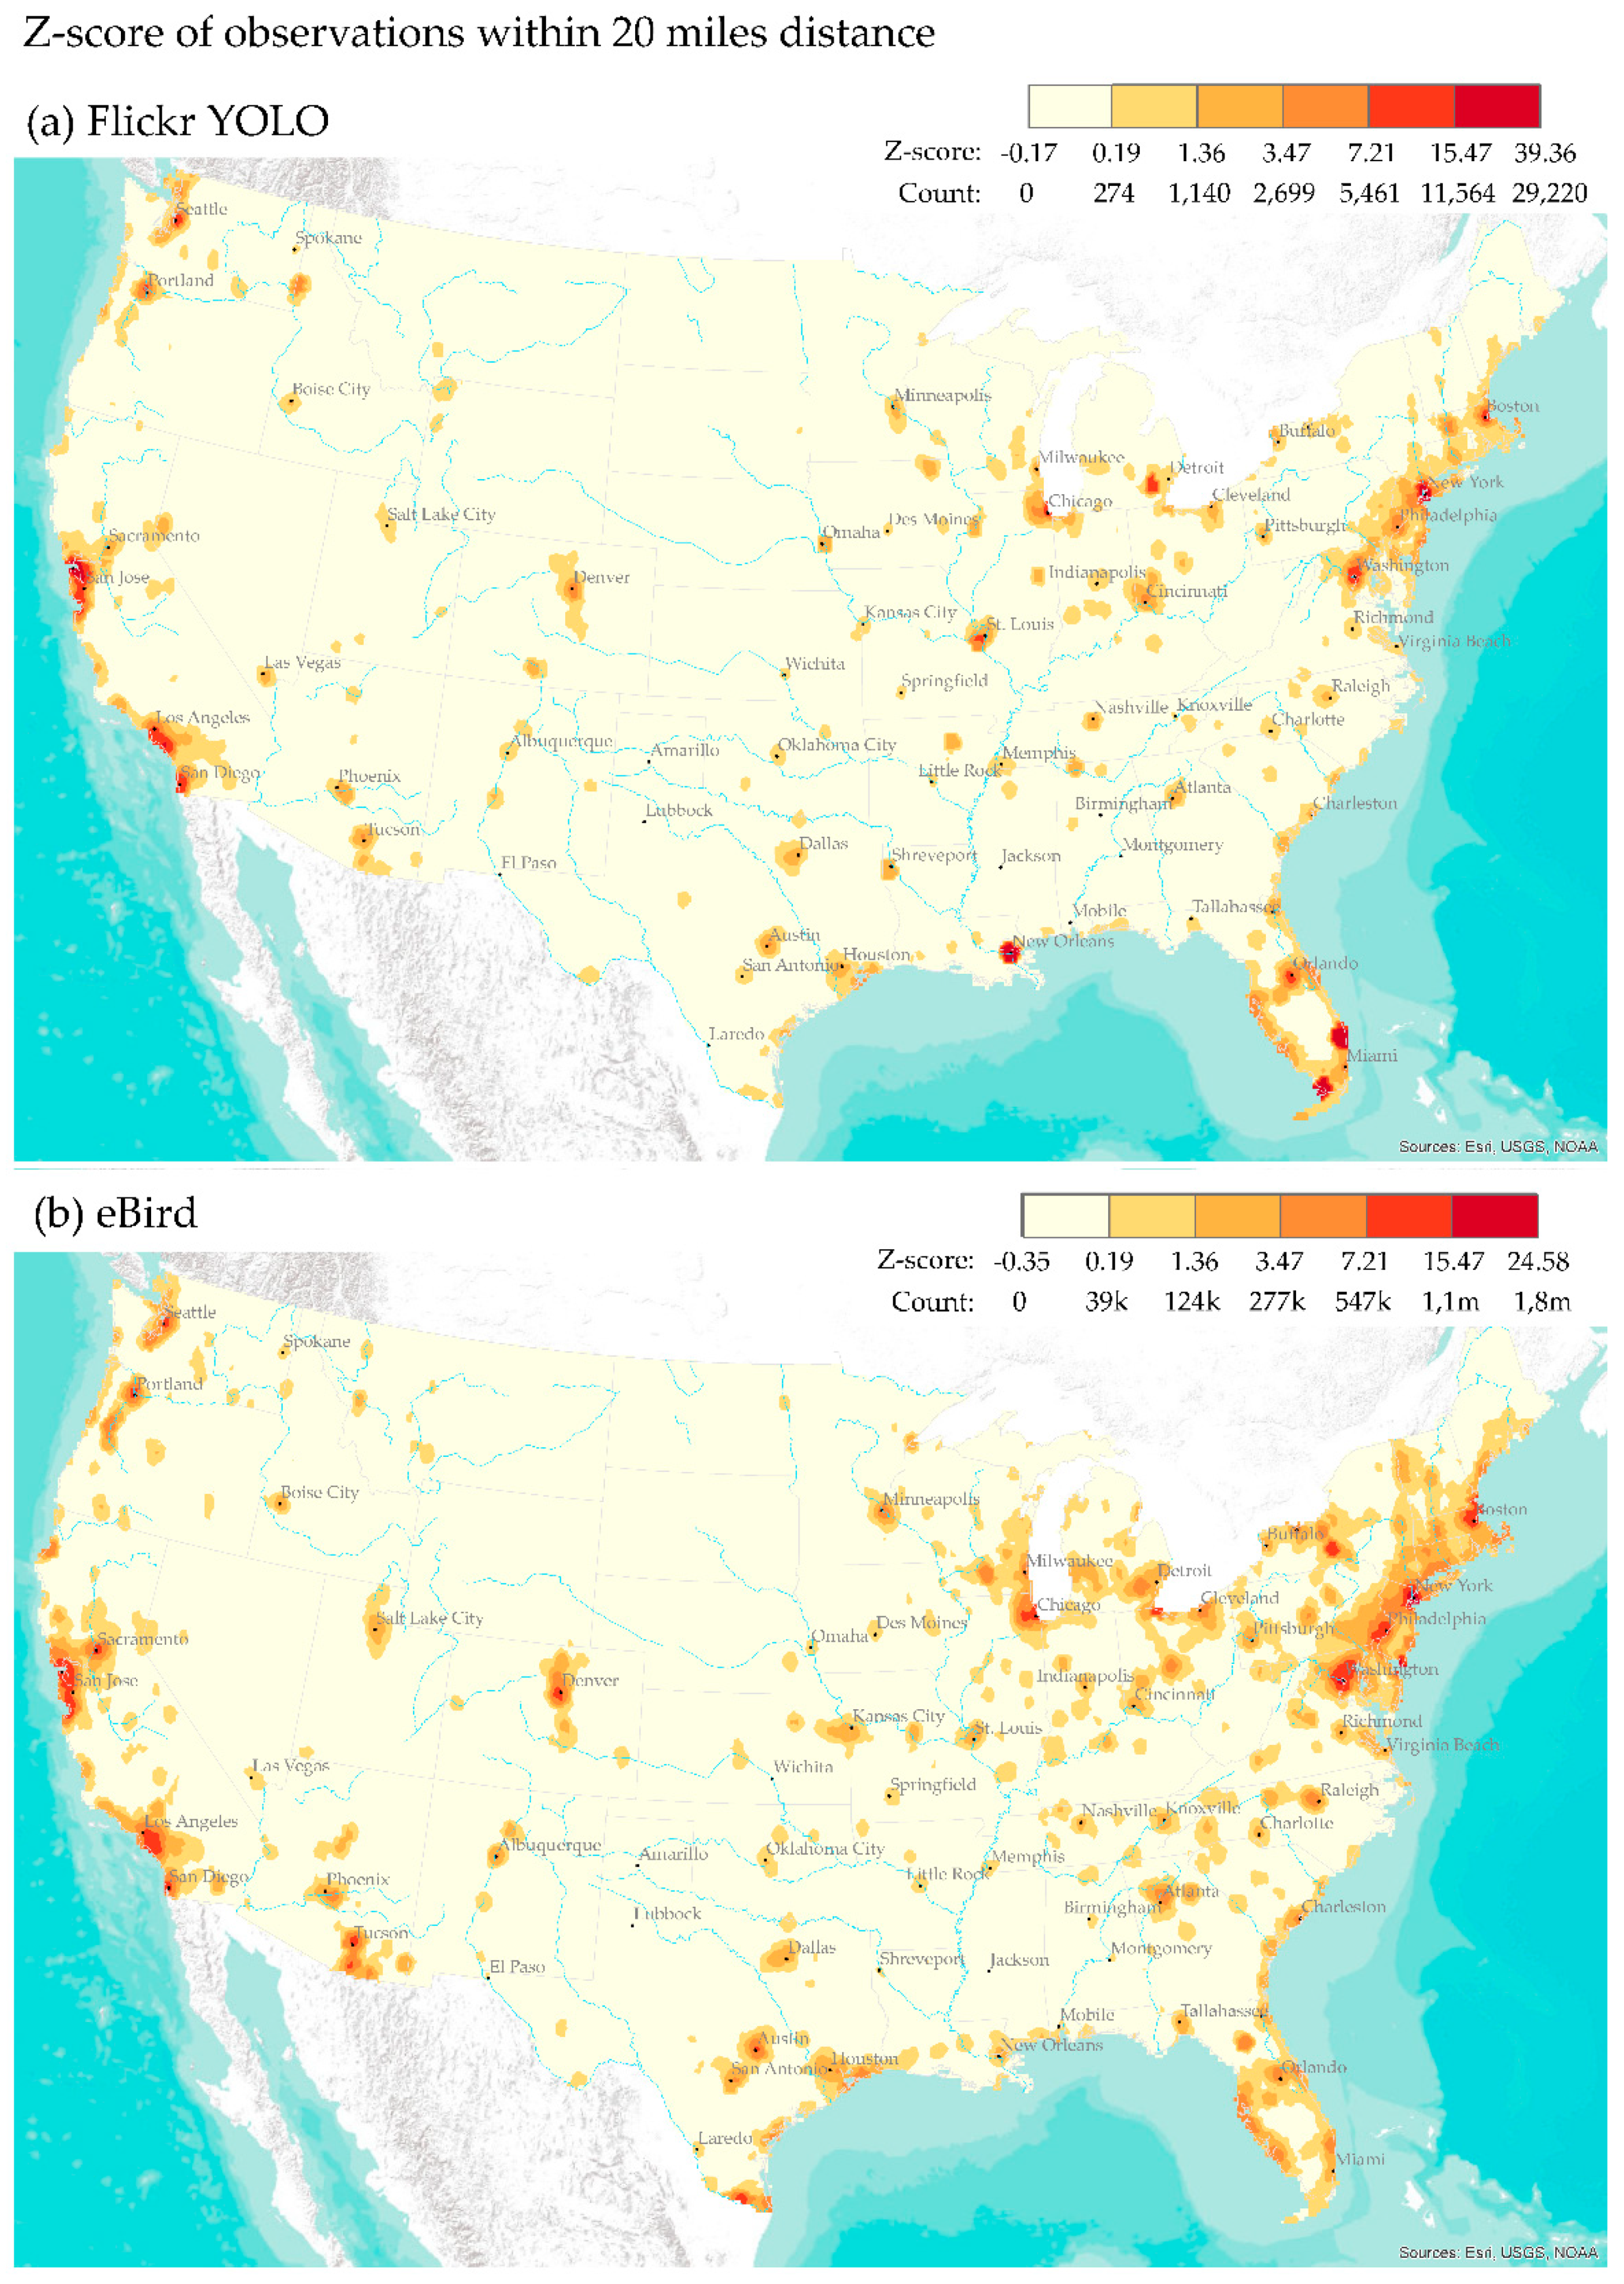
3.2. Validation
- To what extent can Flickr be used to infer birdwatching as a human activity pattern?
- Are there any spatial and temporal biases between YOLO-detected birding activities and eBird observations?
4. Discussion and Conclusions
Author Contributions
Funding
Acknowledgments
Conflicts of Interest
References
- Keeler, B.L.; Wood, S.A.; Polasky, S.; Kling, C.; Filstrup, C.T.; Downing, J.A. Recreational demand for clean water: Evidence from geotagged photographs by visitors to lakes. Front. Ecol. Environ. 2015, 13, 76–81. [Google Scholar] [CrossRef]
- Sessions, C.; Wood, S.A.; Rabotyagov, S.; Fisher, D.M. Measuring recreational visitation at US National Parks with crowd-sourced photographs. J. Environ. Manag. 2016, 183, 703–711. [Google Scholar] [CrossRef] [PubMed]
- Wood, S.A.; Guerry, A.D.; Silver, J.M.; Lacayo, M. Using social media to quantify nature-based tourism and recreation. Sci. Rep. 2013, 3, 2976. [Google Scholar] [CrossRef] [PubMed]
- Dunkel, A. Visualizing the perceived environment using crowdsourced photo geodata. Landsc. Urban Plan. 2015, 142, 173–186. [Google Scholar] [CrossRef]
- Tracewski, L.; Bastin, L.; Fonte, C.C. Repurposing a deep learning network to filter and classify volunteered photographs for land cover and land use characterization. Geo-Spat. Inf. Sci. 2017, 20, 252–268. [Google Scholar] [CrossRef]
- Kisilevich, S.; Krstajic, M.; Keim, D.; Andrienko, N.; Andrienko, G. Event-based analysis of people’s activities and behavior using Flickr and Panoramio geotagged photo collections. In Proceedings of the 2010 14th International Conference Information Visualisation (IV), London, UK, 26–29 July 2010; pp. 289–296. [Google Scholar]
- Rossi, L.; Boscaro, E.; Torsello, A. Venice through the Lens of Instagram: A Visual Narrative of Tourism in Venice. In Proceedings of the Companion of the Web Conference, Lyon, France, 23–27 April 2018; pp. 1190–1197. [Google Scholar]
- Lee, J.Y.; Tsou, M.-H. Mapping Spatiotemporal Tourist Behaviors and Hotspots Through Location-Based Photo-Sharing Service (Flickr) Data. In Proceedings of the LBS 2018: 14th International Conference on Location Based Services, Zurich, Switzerland, 15–17 January 2018; pp. 315–334. [Google Scholar]
- Willemen, L.; Cottam, A.J.; Drakou, E.G.; Burgess, N.D. Using social media to measure the contribution of Red List species to the nature-based tourism potential of African protected areas. PLoS ONE 2015, 10, e0129785. [Google Scholar] [CrossRef] [PubMed]
- Jankowski, P.; Andrienko, N.; Andrienko, G.; Kisilevich, S. Discovering landmark preferences and movement patterns from photo postings. Trans. GIS 2010, 14, 833–852. [Google Scholar] [CrossRef]
- Yang, L.; Wu, L.; Liu, Y.; Kang, C. Quantifying Tourist Behavior Patterns by Travel Motifs and Geo-Tagged Photos from Flickr. ISPRS Int. J. Geo-Inf. 2017, 6, 345. [Google Scholar] [CrossRef]
- Casalegno, S.; Inger, R.; DeSilvey, C.; Gaston, K.J. Spatial covariance between aesthetic value & other ecosystem services. PLoS ONE 2013, 8, e68437. [Google Scholar]
- Figueroa-Alfaro, R.W.; Tang, Z. Evaluating the aesthetic value of cultural ecosystem services by mapping geo-tagged photographs from social media data on Panoramio and Flickr. J. Environ. Plan. Manag. 2017, 60, 266–281. [Google Scholar] [CrossRef]
- Gliozzo, G.; Pettorelli, N.; Haklay, M. Using crowdsourced imagery to detect cultural ecosystem services: A case study in South Wales, UK. Ecol. Soc. 2016, 21, 6. [Google Scholar] [CrossRef]
- Oteros-Rozas, E.; Martín-López, B.; Fagerholm, N.; Bieling, C.; Plieninger, T. Using social media photos to explore the relation between cultural ecosystem services and landscape features across five European sites. Ecol. Indic. 2017, 94, 74–86. [Google Scholar] [CrossRef]
- Cordts, M.; Omran, M.; Ramos, S.; Rehfeld, T.; Enzweiler, M.; Benenson, R.; Franke, U.; Roth, S.; Schiele, B. The cityscapes dataset for semantic urban scene understanding. In Proceedings of the IEEE Conference on Computer Vision and Pattern Recognition, Las Vegas, NV, USA, 27–30 June 2016; pp. 3213–3223. [Google Scholar]
- Hu, Y.J.; Gao, S.; Janowicz, K.; Yu, B.L.; Li, W.W.; Prasad, S. Extracting and understanding urban areas of interest using geotagged photos. Comput. Environ. Urban Syst. 2015, 54, 240–254. [Google Scholar] [CrossRef]
- Redmon, J.; Farhadi, A. Yolov3: An incremental improvement. arXiv, 2018; arXiv:1804.02767. [Google Scholar]
- Sullivan, B.L.; Wood, C.L.; Iliff, M.J.; Bonney, R.E.; Fink, D.; Kelling, S. eBird: A citizen-based bird observation network in the biological sciences. Biol. Conserv. 2009, 142, 2282–2292. [Google Scholar] [CrossRef]
- Walker, J.; Taylor, P. Using eBird data to model population change of migratory bird species. Avian Conserv. Ecol. 2017, 12, 4. [Google Scholar] [CrossRef]
- Tufekci, Z. Big Questions for Social Media Big Data: Representativeness, Validity and Other Methodological Pitfalls. ICWSM 2014, 14, 505–514. [Google Scholar]
- Quattrone, G.; Capra, L.; De Meo, P. There’s no such thing as the perfect map: Quantifying bias in spatial crowd-sourcing datasets. In Proceedings of the 18th ACM Conference on Computer Supported Cooperative Work & Social Computing, Vancouver, BC, Canada, 14–18 March 2015; pp. 1021–1032. [Google Scholar]
- Tsou, M.-H. Research challenges and opportunities in mapping social media and Big Data. Cartogr. Geogr. Inf. Sci. 2015, 42, 70–74. [Google Scholar] [CrossRef]
- Nielsen, J. Participation inequality: Encouraging more users to contribute. Available online: https://www.nngroup.com/articles/participation-inequality/ (accessed on 1 August 2018).
- Goodchild, M.F. Citizens as sensors: The world of volunteered geography. GeoJournal 2007, 69, 211–221. [Google Scholar] [CrossRef]
- Hecht, B.J.; Stephens, M. A Tale of Cities: Urban Biases in Volunteered Geographic Information. ICWSM 2014, 14, 197–205. [Google Scholar]
- Koylu, C.; Guo, D. Smoothing locational measures in spatial interaction networks. Comput. Environ. Urban Syst. 2013, 41, 12–25. [Google Scholar] [CrossRef]
- Antoniou, V.; Morley, J.; Haklay, M. Web 2.0 geotagged photos: Assessing the spatial dimension of the phenomenon. Geomatica 2010, 64, 99–110. [Google Scholar]
- Sonter, L.J.; Watson, K.B.; Wood, S.A.; Ricketts, T.H. Spatial and temporal dynamics and value of nature-based recreation, estimated via social media. PLoS ONE 2016, 11, e0162372. [Google Scholar] [CrossRef] [PubMed]
- Hollenstein, L.; Purves, R. Exploring place through user-generated content: Using Flickr tags to describe city cores. J. Spat. Inf. Sci. 2013, 21–48. [Google Scholar]
- Li, L.; Goodchild, M.F.; Xu, B. Spatial, temporal, and socioeconomic patterns in the use of Twitter and Flickr. Cartogr. Geogr. Inf. Sci. 2013, 40, 61–77. [Google Scholar] [CrossRef]
- Guo, Y.; Liu, Y.; Oerlemans, A.; Lao, S.; Wu, S.; Lew, M.S. Deep learning for visual understanding: A review. Neurocomputing 2016, 187, 27–48. [Google Scholar] [CrossRef]
- Porzi, L.; Rota Bulò, S.; Lepri, B.; Ricci, E. Predicting and understanding urban perception with convolutional neural networks. In Proceedings of the 23rd ACM International Conference on Multimedia, Brisbane, Australia, 26–30 October 2015; pp. 139–148. [Google Scholar]
- Lin, T.-Y.; Cui, Y.; Belongie, S.; Hays, J. Learning deep representations for ground-to-aerial geolocalization. In Proceedings of the IEEE Conference on Computer Vision and Pattern Recognition, Boston, MA, USA, 7–12 June 2015; pp. 5007–5015. [Google Scholar]
- Zhou, B.; Lapedriza, A.; Xiao, J.; Torralba, A.; Oliva, A. Learning deep features for scene recognition using places database. In Proceedings of the Advances in Neural Information Processing Systems, Montreal, QC, Canada, 8–13 December 2014; pp. 487–495. [Google Scholar]
- Wan, J.; Wang, D.; Hoi, S.C.H.; Wu, P.; Zhu, J.; Zhang, Y.; Li, J. Deep learning for content-based image retrieval: A comprehensive study. In Proceedings of the 22nd ACM International Conference on Multimedia, Orlando, FL, USA, 3–7 November 2014; pp. 157–166. [Google Scholar]
- Yang, L.; MacEachren, A.M.; Mitra, P.; Onorati, T. Visually-Enabled Active Deep Learning for (Geo) Text and Image Classification: A Review. ISPRS Int. J. Geo-Inf. 2018, 7, 65. [Google Scholar] [CrossRef]
- Bircham, P.M.M. A History of Ornithology; Collins: London, UK, 2007. [Google Scholar]
- National Survey of Fishing, Hunting, and Widllife-Associated Recreation; United States Fish and Wildlife Service: Arlington, VA, USA, 2012.
- Sheard, K. A twitch in time saves nine: Birdwatching, sport, and civilizing processes. Sociol. Sport J. 1999, 16, 181–205. [Google Scholar] [CrossRef]
- Oddie, B. Bill Oddie’s Little Black Bird Book; Pavilion Books: London, UK, 2014. [Google Scholar]
- Ramenofsky, M.; Wingfield, J.C. Regulation of migration. AIBS Bull. 2007, 57, 135–143. [Google Scholar] [CrossRef]
- Redmon, J.; Farhadi, A. YOLO9000: Better, faster, stronger. arXiv, 2016; arXiv:1612.08242. [Google Scholar]
- Redmon, J.; Divvala, S.; Girshick, R.; Farhadi, A. You only look once: Unified, real-time object detection. In Proceedings of the IEEE Conference on Computer Vision and Pattern Recognition, Las Vegas, NV, USA, 27–30 June 2016; pp. 779–788. [Google Scholar]
- Felzenszwalb, P.F.; Girshick, R.B.; McAllester, D.; Ramanan, D. Object detection with discriminatively trained part-based models. IEEE Trans. Pattern Anal. Mach. Intell. 2010, 32, 1627–1645. [Google Scholar] [CrossRef] [PubMed]
- Girshick, R.; Donahue, J.; Darrell, T.; Malik, J. Rich feature hierarchies for accurate object detection and semantic segmentation. In Proceedings of the IEEE Conference on Computer Vision and Pattern Recognition, Columbus, OH, USA, 23–28 June 2014; pp. 580–587. [Google Scholar]
- Sadeghi, M.A.; Forsyth, D. 30hz object detection with dpm v5. In Proceedings of the European Conference on Computer Vision, Zurich, Switzerland, 6–12 September 2014; pp. 65–79. [Google Scholar]
- Yan, J.; Lei, Z.; Wen, L.; Li, S.Z. The fastest deformable part model for object detection. In Proceedings of the IEEE Conference on Computer Vision and Pattern Recognition, Columbus, OH, USA, 23–28 June 2014; pp. 2497–2504. [Google Scholar]
- Lenc, K.; Vedaldi, A. R-cnn minus r. arXiv, 2015; arXiv:1506.06981. [Google Scholar]
- Ren, S.; He, K.; Girshick, R.; Sun, J. Faster r-cnn: Towards real-time object detection with region proposal networks. In Proceedings of the Advances in Neural Information Processing Systems, Montreal, QC, Canada, 7–12 December 2015; pp. 91–99. [Google Scholar]
- Silverman, B.W. Density Estimation for Statistics and Data Analysis; Chapman and Hall: London, UK, 1986; 175p. [Google Scholar]
- Tiwari, C.; Rushton, G. Using spatially adaptive filters to map late stage colorectal cancer incidence in Iowa. In Developments in Spatial Data Handling; Springer: Berlin/Heidelberg, Germany, 2005; pp. 665–676. [Google Scholar]
- Boakes, E.H.; McGowan, P.J.; Fuller, R.A.; Chang-qing, D.; Clark, N.E.; O’Connor, K.; Mace, G.M. Distorted views of biodiversity: Spatial and temporal bias in species occurrence data. PLoS Biol. 2010, 8, e1000385. [Google Scholar] [CrossRef] [PubMed]


| Object | Image Count | Object | Image Count | Object | Image Count |
|---|---|---|---|---|---|
| person | 8,309,891 | tie | 277,644 | motorbike | 139,648 |
| car | 2,080,796 | traffic light | 275,140 | sofa | 135,411 |
| chair | 870,726 | train | 261,775 | cell phone | 135,301 |
| truck | 764,307 | sports ball | 259,229 | book | 133,518 |
| bird | 747,015 | bench | 258,984 | bus | 130,706 |
| diningtable | 452,627 | handbag | 243,079 | cat | 129,015 |
| cup | 428,193 | pottedplant | 222,407 | horse | 125,918 |
| aeroplane | 365,747 | tvmonitor | 219,358 | wine glass | 117,165 |
| bottle | 352,077 | bowl | 199,816 | bed | 108,157 |
| dog | 317,291 | backpack | 191,202 | cake | 104,080 |
| boat | 296,850 | umbrella | 180,092 | baseball glove | 97,638 |
| bicycle | 287,272 | clock | 171,435 | vase | 86,496 |
| Time Periods | Metadata | % | YOLO | % |
|---|---|---|---|---|
| Winter 2013 | 44,718 | 3.31 | 61,117 | 4.58 |
| Spring 2014 | 54,558 | 2.54 | 80,164 | 3.77 |
| Summer 2014 | 41,216 | 1.89 | 65,787 | 3.05 |
| Autumn 2014 | 39,243 | 2.19 | 57,723 | 3.28 |
| Winter 2014 | 43,850 | 3.49 | 58,707 | 4.68 |
| Spring 2015 | 57,064 | 3.18 | 75,026 | 4.23 |
| Summer 2015 | 43,901 | 2.31 | 61,147 | 3.45 |
| Autumn 2015 | 37,279 | 2.39 | 49,779 | 3.23 |
| Winter 2015 | 38,759 | 3.74 | 48,875 | 4.74 |
| Spring 2016 | 48,711 | 3.44 | 62,816 | 4.48 |
| Summer 2016 | 44,945 | 3.14 | 66,028 | 4.22 |
| Autumn 2016 | 44,877 | 3.45 | 59,846 | 4.33 |
© 2019 by the authors. Licensee MDPI, Basel, Switzerland. This article is an open access article distributed under the terms and conditions of the Creative Commons Attribution (CC BY) license (http://creativecommons.org/licenses/by/4.0/).
Share and Cite
Koylu, C.; Zhao, C.; Shao, W. Deep Neural Networks and Kernel Density Estimation for Detecting Human Activity Patterns from Geo-Tagged Images: A Case Study of Birdwatching on Flickr. ISPRS Int. J. Geo-Inf. 2019, 8, 45. https://doi.org/10.3390/ijgi8010045
Koylu C, Zhao C, Shao W. Deep Neural Networks and Kernel Density Estimation for Detecting Human Activity Patterns from Geo-Tagged Images: A Case Study of Birdwatching on Flickr. ISPRS International Journal of Geo-Information. 2019; 8(1):45. https://doi.org/10.3390/ijgi8010045
Chicago/Turabian StyleKoylu, Caglar, Chang Zhao, and Wei Shao. 2019. "Deep Neural Networks and Kernel Density Estimation for Detecting Human Activity Patterns from Geo-Tagged Images: A Case Study of Birdwatching on Flickr" ISPRS International Journal of Geo-Information 8, no. 1: 45. https://doi.org/10.3390/ijgi8010045
APA StyleKoylu, C., Zhao, C., & Shao, W. (2019). Deep Neural Networks and Kernel Density Estimation for Detecting Human Activity Patterns from Geo-Tagged Images: A Case Study of Birdwatching on Flickr. ISPRS International Journal of Geo-Information, 8(1), 45. https://doi.org/10.3390/ijgi8010045