Article

Analyzing Spatial and Temporal User Behavior in Participatory Sensing

GEOTEC, Institute of New Imaging Technologies (INIT), Universitat Jaume I, 12071 Castellón, Spain
*
Author to whom correspondence should be addressed.
ISPRS Int. J. Geo-Inf. 2018, 7(9), 344; https://doi.org/10.3390/ijgi7090344
Submission received: 30 June 2018 / Revised: 12 August 2018 / Accepted: 21 August 2018 / Published: 23 August 2018

Abstract

:
The large number of mobile devices and their increasingly powerful computing and sensing capabilities have enabled the participatory sensing concept. Participatory sensing applications are now able to effectively collect a variety of information types with high accuracy. Success, nevertheless, depends largely on the active participation of the users. In this article, we seek to understand spatial and temporal user behaviors in participatory sensing. To do so, we conduct a large-scale deployment of Citizense, a multi-purpose participatory sensing framework, in which 359 participants of demographically different backgrounds were simultaneously exposed to 44 participatory sensing campaigns of various types and contents. This deployment has successfully gathered various types of urban information and at the same time portrayed the participants’ different spatial, temporal and behavioral patterns. From this deployment, we can conclude that (i) the Citizense framework can effectively help participants to design data collecting processes and collect the required data, (ii) data collectors primarily contribute in their free time during the working week; much fewer submissions are done during the weekend, (iii) the decision to respond and complete a particular participatory sensing campaign seems to be correlated to the campaign’s geographical context and/or the recency of the data collectors’ activities, and (iv) data collectors can be divided into two groups according to their behaviors: a smaller group of active data collectors who frequently perform participatory sensing activities and a larger group of regular data collectors who exhibit more intermittent behaviors. These identified user behaviors open avenues to improve the design and operation of future participatory sensing applications.

1. Introduction

The increasing proliferation of smartphones, each equipped with a set of powerful embedded sensors such as microphone, coupling with the near-pervasive coverage of the wireless technology (e.g., 4G LTE and WiFi) and the constant mobility of the human population has given birth to various data collecting concepts such as volunteered geographic information (VGI), mobile crowdsensing and participatory sensing [1]. They partly overlap, as they all share the main characteristic of utilizing the participation of a large number of users to collect various types of information through electronic means. At the same time, there are some slight differences among these concepts. VGI applications focus on the collection of geographic information [2], as its name suggests. A typical example of a VGI is OpenStreetMap (OSM), a worldwide project to create free and editable map data [3], where users collectively contribute the geographical contents. In mobile crowdsensing, sensory data is, with or without user interaction/knowledge, being collected from participants’ mobile devices (i.e., physical measurements), and possibly combined with other data sources, such as social media networks (i.e., online community) [4]. In a realization of this concept, the Context-Aware Real-time Open Mobile Miner application (CAROMM) combines and processes the sensory data from the mobile devices and the data retrieved from social media networks such as Facebook and Twitter [5]. Participatory sensing, which is the main topic of this article, is a subset of mobile crowdsourcing that emphasizes the active and intentional participation of the users to collect information from the surrounding environments.
Due to its abilities to collect different types of data, including geographic data, at a high spatial and temporal resolution, participatory sensing has many applications. Some examples include measuring the ambient noise level [6,7], monitoring the presence of insects [8,9], or collecting information on air pollution [10,11]. The surveys of Khan et al. [12] and Guo et al. [4] provided a comprehensive overview on the functionalities of participatory sensing applications and the classification among them. These surveys analyze 45 and 66 participatory sensing applications, respectively, and show the variety of these applications and their applicability. However, they do not provide an in-depth comparison of some key characteristics when considering the successful gathering of different types of urban information, such as the flexibility (reusability) of the applications, the ability of (normal) users to customize and launch participatory sensing campaigns, the possibility to incentivize data collectors, or the (type of) data that can be gathered. Furthermore, these surveys generally do not include participatory sensing frameworks, which attempt to address the aforementioned characteristics. In our own review of participatory sensing applications (see Section 2.2), focused on the aforementioned characteristics, we have identified two main drawbacks. First, we observed that most participatory sensing applications center around one or a limited number of sensing topics, scenarios or types of data to be collected; this observation is also reflected in [13]. As a result, this single-functionality characteristic usually leads to the creation of a multitude of applications with limited and similar capabilities, which requires time and efforts from software developers to create and might cause confusions among the users. For example, the processes of collecting information on the presence of mosquitos and bugs are largely similar; however, there are two different applications dedicated for these purposes [8,9]. Second, ordinary people and/or researchers wanting to use participatory sensing applications to start a data collecting initiatives are not in full control of these applications. Instead, they depend on the application developers, who decided how that data collecting initiative will proceed (i.e., which data and data type, flow of data collection). This dependency has impeded the broader use of participatory sensing, despite its potential to generate a large amount of useful information in a short amount of time at an affordable cost. Just as other participatory sensing frameworks, Citizense, introduced by the authors in [14], attempts to address these lacks; we therefore also include participatory sensing frameworks in our review and compare them with Citizense.
Despite the aforementioned abundance of participatory sensing applications and the emergence of more flexible participatory sensing frameworks, there is little research available on how participants behave in a participatory sensing context. Particularly, their spatio-temporal behaviors (e.g., time periods in which participants collect more or less data [15]; spatial patterns regarding where they collect data), across different sensing scenarios and different types of information collected, are under-investigated (an overview of existing research is given in Section 2.3). Nevertheless, the study of participants’ behaviors is of paramount importance as it may offer organizers of participatory sensing campaigns’ valuable intelligence to enhance their campaigns’ setups and receive better results from their campaigns. For example, organizers may launch promotional campaigns to attract new users in specific areas, based on spatial knowledge of existing participants; they may decide to launch time-based notifications (reminders) for existing users, based on their temporal data collection patterns in order to have them complete more campaigns (e.g., during peak hours or off-peak hours) or location-based notifications to serve less-covered areas; they may adjust incentives to fill spatial or temporal data collection lacks if so desired (e.g., to obtain evenly spread data measurements, for example, in a noise pollution campaign; etc.). Apart from the spatio-temporal behaviors, understanding the frequency of contributions by different users, and, more generally, the different types of data contributors, is essential, as this might affect the completeness, consistency and reliability of the results from participatory sensing, as was already shown in other user-generated data approaches. For example, the revealed uneven distribution of contribution from Wikipedia users [16] might cause problems, such as the decrease of willingness to contribute among the participants in the long term or biased information (intentionally) produced by the participants [17,18]. Similar inequalities in user contribution are observed in the field of VGI [19,20] and peer-to-peer file sharing [21].
The aim in this article is twofold: (i) to study the interaction between Citizense and participants with demographically different backgrounds and its effectiveness to gather various types of urban information, and (ii) to study the participants’ spatial and temporal behavior. To do so, we first describe how Citizense [14], a generic participatory sensing framework developed by the authors, assists the participants in creating participatory sensing campaigns and collecting the required information, and point out its novelties (Section 3). We then describe a deployment of the Citizense framework in a real-world scenario, in which 359 participants were exposed to 44 different sensing campaigns (Section 4). While, in previous work, we reported on the participants’ reactions to monetary incentives in this deployment (7 of the 44 campaigns were applied with monetary incentives) [22], in this article, we give an overall overview of the interaction of participants with the framework (Section 5.1) and its effectiveness (Section 5.2), after which we study the temporal (Section 5.3 and Section 5.4) and spatial (Section 5.5) behavior of data collectors in depth. We expect to find spatial and temporal patterns valid for all campaigns, yet, due to the variety of campaigns, we also expect to find different spatial and temporal distributions of submissions, influenced by factors such as the type of user, or the context and content of these campaigns. Regarding the involvement the data collectors, in accordance with other user-generated data approaches, we anticipate an uneven distribution of their interaction with the participatory sensing framework. Finally, Section 6 presents the final conclusions and future works.

2. Related Works

2.1. Volunteered Geographic Information and Participatory Sensing

VGI and participatory sensing are two prime examples of user-generated content where a variety of data is collected through the collaboration of a large number of participants. While sharing the same principle of leveraging the intelligence of participants and their mobility, there are significant differences between VGI and participatory sensing. VGI particularly focuses on the collection of geographic information, and extensively use maps for displaying the results. In the field of VGI, data quality, reputation of the contributor and user participation are the main research issues [23]. First, as the contributions come from a large number of participants with a varying level of knowledge and expertise, there is a concern about the quality of their contributed VGI data. To verify the data quality of VGI, a trivial method is to analyze this data using a reference dataset of high quality. Second, there is a need to establish the rank of reputation among the numerous contributors. This ranking, if established, might shed light on the quality of the VGI data. Third, the participation of the contributors differs significantly from each other: on one hand, there are a few active contributors who account for most of the collected information; on the other hand, there is a larger number of contributors who seldom interact with the VGI platform; and finally the rest of the users, which are the majority, do not contribute any information to the VGI platform [19,20].
While traditional VGI applications focus on the collection of geographic information (e.g., place names, description of places, pictures, addresses), they are not optimized to collect other types of information. In contrast, participatory sensing allows users to collect various types of data [24], leveraging the mobile device’s embedded sensors. In this article, we focus on the public participatory sensing as it involves a large number of participants and, at the same time, it potentially benefits the public.
Participatory sensing has been utilized in various application domains [13], such as bird conservation [25], urban infrastructure monitoring [26], traffic monitoring [27], radio signal strength measuring [28] and other information in the city [29]. The plethora of participatory sensing applications can be divided into two groups: single-purpose applications (i.e., [26,27]) and multi-purpose applications or frameworks [30,31]. The emergence of these multi-purpose participatory sensing applications shows a significant change in the realization of the participatory sensing concept. In many cases, such framework support configurable participatory sensing campaigns, hereby reducing the dependency of those who want to initiate a data collecting process from the application developers. At the same time, participants enjoy the flexibility of the application to perform various sensing tasks. Furthermore, the cost and efforts to develop, maintain and deploy participatory sensing application is also significantly reduced. These frameworks also provide an excellent opportunity to study participants’ user behavior under different sensing scenarios and collecting various data types.

2.2. An Analysis of the Selected Participatory Sensing Applications and Frameworks

In this section, we compare our proposed Citizense participatory sensing framework [14] with other existing participatory sensing applications in order to point out Citizense’s distinctive features. The summary of Citizense will be presented in Section 3.1 and Section 4.2. Although it is hard to estimate the exact number of existing participatory sensing applications to date (the surveys of Khan et al. [12] and Guo et al. [4] analyzed 45 and 66 applications, respectively), the 21 applications used in this comparison were selected from the growing list of participatory sensing examples, and at the same time they represent the diverse and complex nature of participatory sensing. Our comparison was performed along common features observed in literature: flexibility of the tool [32], the presence of incentive [33,34], the selection of data collectors [35,36], result delivery [37,38], identity of data collectors [39] and the flexibility of the sensing process [30] (see Table 1). Additionally, useful meta-data are listed: name and publication time of the application, theme covered, origin (industry or academia) and the status of the application (a research prototype or a complete product).
Compared with other participatory sensing applications, and multi-purpose participatory sensing frameworks such as Ohmage [30] and OpenDataKit [31], Citizense proves to be more complete, combining all features from other applications/frameworks and introducing some novelties. First, it allows the selection of participants based on various criteria such as time, their profile and location. For the latter, although a few applications allow definition of this location constraint, it comes only in the form of circle [32,43,50,51]. In contrast, Citizense allows this location constraint to be a list of arbitrary shapes (polygons), therefore precisely and flexibly reflecting the campaign’s location requirements. Furthermore, Citizense enables campaign authors to select participants using both their static profile information (i.e., post code, gender) and dynamic profile information (i.e., age, level of experience within the framework). Second, Citizense provides both intrinsic and extrinsic incentives to the participants, to stimulate them to participate and compensate them for the various costs caused by their sensing activities [22]. Third, the framework also makes it possible for campaign authors to create campaigns on their preferred topics with dynamic workflow within these campaigns and collecting various types of data. Last but not least, participants are able to receive real-time feedback on their collected results from the campaign authors, which enhances the communication between them and serves as an motivator for the former.

2.3. Participants’ Spatial and Temporal Behaviors in Participatory Sensing

Once participatory sensing data has been collected, they should be validated and analyzed. Regarding the analysis of participatory sensing data, and more particularly spatial and temporal analysis as this is the main goal of this article, gathering meta-data (e.g., when and where are users contributing) is of primarily importance. Such information might help organizers to better recruit the participants and generally better plan their sensing campaign, and hopefully obtain more and more qualitative results. Until now, the factors that drive the participants to contribute their observed data remain unclear [54]. Stimulating factors such as incentives [33], gamification techniques [55] and their internal willingness [56] have been studied, but we found few works [57,58,59,60,61] investigating the spatial and temporal behavior of participants. City Probe [57] is an application designed to help citizens in reporting certain city issues, whereby the exact location (latitude and longitude) of a report submission was stored. In its deployment, the participants were asked to report on the single issue of occupancy of the arcade in the city using this application. Finally, the map of all reports is compared with the map of the bus stations in the same studied area; the conclusion was that the location of the reports and the bus stations may have spatially negative correlation. We argue that this spatial behavior is applicable to only one specific issue; it is therefore not known if similar spatial behaviors hold when reporting other issues, or generally, collecting other types of data.
In their work, Grasso et al. extracted the information on heat waves from social media data (tweets) and examined the relation between the social media activities and the spatio-temporal pattern of the heat waves [58]. Due to the extremely low number of tweets with geo-location meta-data, the location of a tweet had to be inferred from the content of the tweet through entity recognition and natural language processing. As a result, the accuracy of this inference is not high, tweets can only be located at city level in the best case.
In contrast, exact GPS locations are retrieved from the crowdsourced data to extract and analyze spatial patterns from cyclists (e.g., [60]). However, these GPS traces are automatically created by the mobile device without any human intervention, and therefore the collected data does not represent the users’ participation behaviors.
Li et al. summarized a large-scale participatory noise measuring and analyzed the spatio-temporal distribution of the received measurements [59]. Their analysis showed that the measurements’ temporal distribution matches the human work-rest cycle (measurements were made primarily between 9.00 a.m. to 11.00 p.m.) and the measurements were often conducted in residential areas. Unfortunately, the authors did not analyze these spatial and temporal patterns in more detail, even though a large number of measurements were available.
Alt et al. described two small participatory sensing experiments in which 18 participants were asked to perform simple tasks such as taking a picture of the closest mailbox or checking the departure time of the next bus [61]. Based on the analysis of the participants’ spatial and temporal behaviors, the authors concluded that midday breaks are the participants’ preferable time for performing the tasks and participants tended to complete tasks near their homes. However, we argue that the small number of participants and the simplicity of the tasks significantly limit the validity of their conclusions.
In summary, we argue that, although the aforementioned studies discussed the participants’ spatial and temporal behaviors, there is room for significant improvement as each study has specific limitations. Furthermore, they all share the characteristic that participants were facing one or a few participatory sensing tasks of similar types and collect one or a few types of data, in a specific participatory sensing scenario. If the participants were given several sensing tasks of different nature, their spatial and temporal behaviors might be different. In our study, we will analyze the spatial and temporal behavior of the participants who were given multiple participatory sensing tasks, where each task has a unique content and context. We aim to identify the overall spatial and temporal patterns of all participants and subsequently focus on specific patterns, if they deviate from the overall patterns. Specifically, we expect to see the relation between the content of a campaign and the corresponding spatial and temporal submission patterns from the participants. Regarding the participants’ involvement, we expect to see an uneven distribution of the interaction among the participants. These analyses are performed using the location and time of the submissions and the knowledge on the participants’ profile.

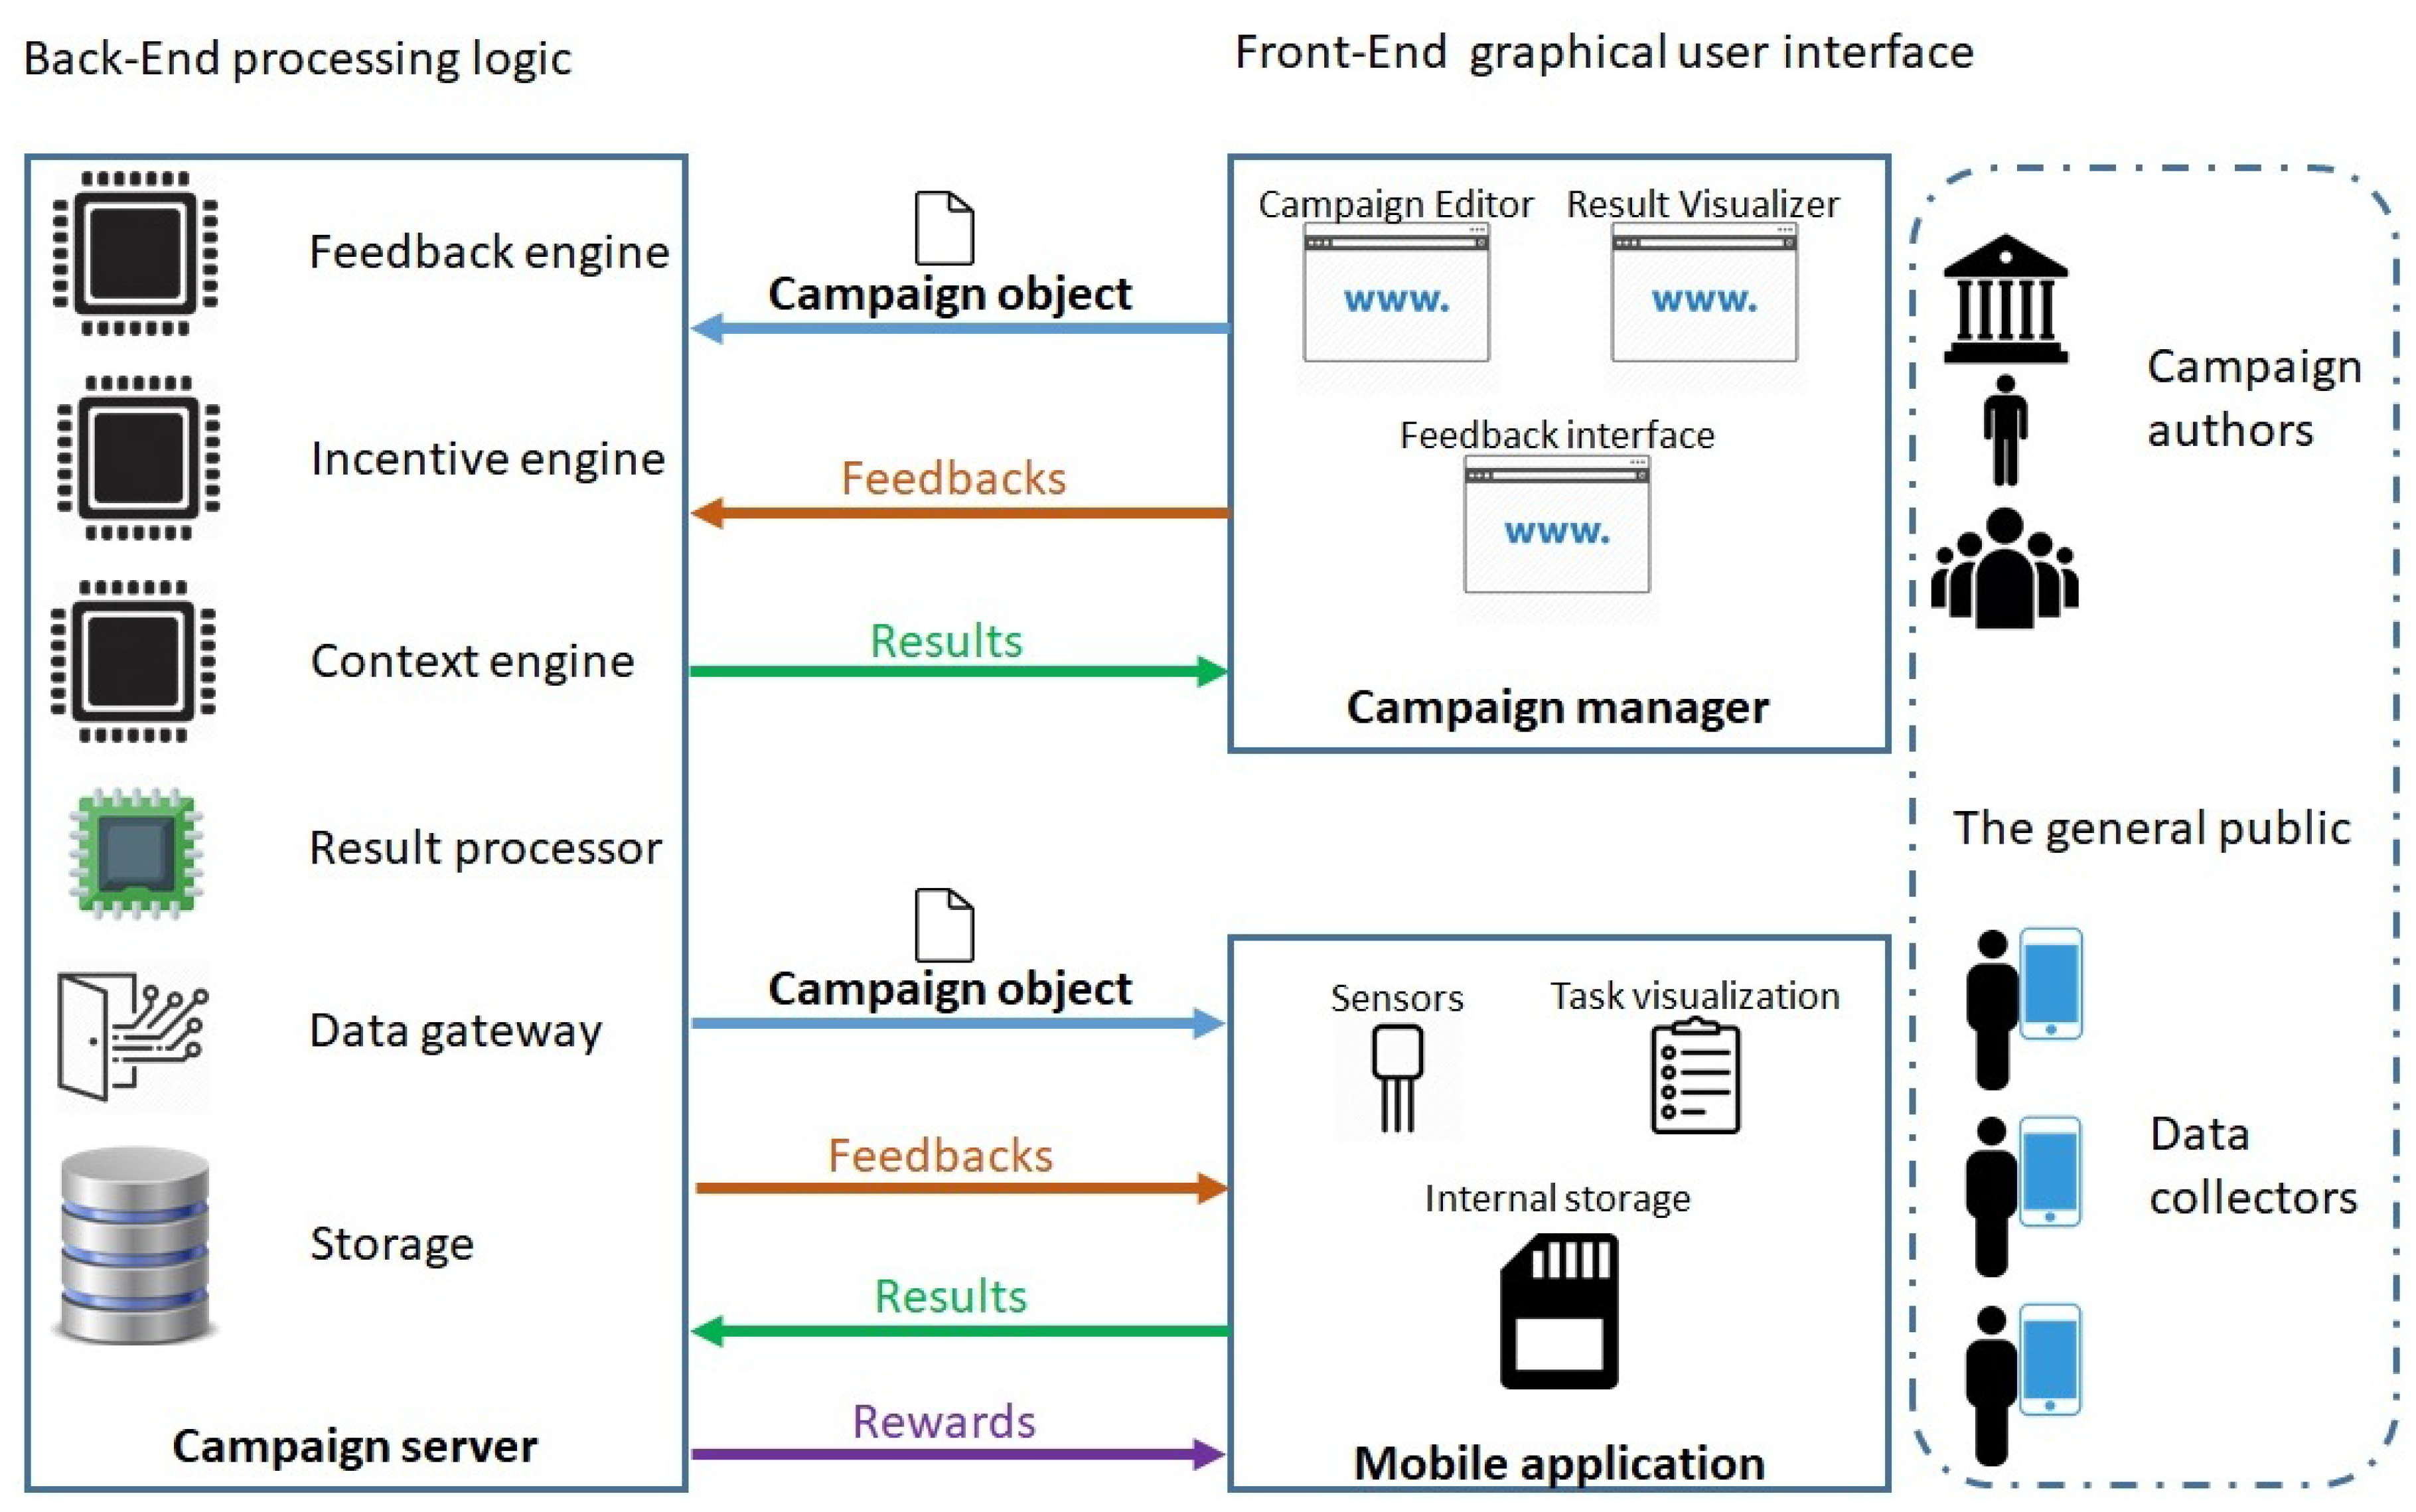
3. The Citizense Framework

In order to provide a comprehensive picture of the Citizense framework and its deployment, we provide here a brief overview of Citizense and its main functionalities. Citizense is designed as a generic user-oriented participatory sensing framework, aiming to make participatory sensing accessible to all users, regardless of their role (i.e., defining data collection campaigns, gathering the required data) [14]. As an open source software, the source code of the Citizense framework is accessible from the project’s OCT repository [62], and it is redistributed under the Apache v2 license, which effectively makes the code reusable [63]. The central design principle of Citizense is to divide a complex sensing process into several sequential atomic sensing tasks, where each task deals with a single type of data or sensor. Consequently, the whole framework can be reused in different scenarios and collect a variety of data. This principle distinguishes two different roles of the users: campaign authors and data collectors. The former define the participatory sensing process to collect certain data and the latter provide the former with the required data; we will use these terms consistently throughout the article. To realize this design principle, the Citizense framework consists of four main components (see Figure 1):
  • the campaign objects, which hold all the details of the different participatory sensing campaigns such as context condition, the list of atomic sensing task, types of data to collect, and incentives for the data collector;
  • the campaign manager, which allows campaign authors to create campaigns (i.e., campaign objects) using an intuitive graphical user interface and to visualize the results;
  • the campaign server, which serves data collectors with campaigns, processes and stores the submissions, and sends real-time feedback to the data collectors;
  • the mobile application, which receives campaigns (i.e., campaign objects), visualizes these upon request of the data collector, and finally deliver the collected data to the campaign server.

3.1. New Features of the Citizense Framework

We continuously extend the capabilities of the Citizense framework. Compared with our earlier technical description of the Citizense framework [14], the latest version of Citizense has substantial improvements, some of which were already mentioned in less detail in [22], which focused on exploring the participants’ behavior under monetary incentives [22]. For clarity, we list novelties compared to [14] here:
  • Extension of the types of data collected by the framework: The Citizense framework is now capable of collecting different types of sensory data (i.e., WiFi measurement, GPS location), multimedia content (i.e., picture), date and time input. This extension significantly improves the flexibility and reusability of the framework as it allows campaign authors to combine various types of data into their campaigns.
  • The implementation of real-time feedback: Campaign authors are now able to manually validate each submission (after the automatic validation performed by the campaign server based on submission’s location and time), define the status of each submission (e.g., accepted, rejected, pending), add text annotation and send feedback to a single data collector and/or all data collectors through the web-based result visualizer. The inclusion of feedback in Citizense framework is of paramount importance as it effectively engages the data collectors. On a higher level, data collectors experience the transparency of the system [64] and realize their data contribution will be taken seriously [65].
  • The selection of data collectors based on their user profiles: Campaign authors can intuitively and easily define the filters for selecting the data collectors. These filters include static information (i.e., gender, postal code) and dynamic information (i.e., age, previous experience using the Citizense framework) of the data collectors. Combined with the location and time filters previously implemented, the framework now has flexible and rigorous control on the selection of data collectors, aiming to improve the quality of the collected results.
  • The new input method aims to facilitate the participation of users with disabilities: the Citizense mobile application allows data collectors to speak into the device’s microphone in order to use almost all features of the mobile device (e.g., downloading campaigns, selecting a campaign, inputting text). This input method significantly lowers the barriers for participants with disabilities, thereby making the Citizense framework more inclusive.

3.2. The Technical Testing

At the time of writing, the central server of Citizense is deployed on a standard infrastructure with Intel Xeon E5-2690 v2 3.0GHz CPU (manufactured by Intel Corporation - Santa Clara, CA, United States) and 4 GB of memory. We performed several stress tests to examine the scalability of the framework under different load conditions. Among the monitored parameters, the processing time for each request is of importance, as serving a request is a time-critical operation and the processing time greatly affects the waiting time on the data collector’s side (the latency). It is worth noting that this latency depends on the processing time in the server and the propagation time in the communication network; the latter is independent from the Citizense framework.
The processing time directly depends on the following factors: number of campaigns, the size of each campaign and the number of concurrent requests. For the first and the second factors, we filled the campaign database with 100 identical campaigns; each contains 27 atomic sensing tasks that cover all the different task types supported by the Citizense framework and are connected by both conditional and unconditional transitions. After sending 1000 repeated single requests to the central server, on average, the central server took 787.613 miliseconds to process each request, with the maximum of 1144 miliseconds, minimum of 310 miliseconds and standard deviation of 122.39. For the third factor, the Apache JMeter tool was used to launch a large number of concurrent requests to the central server simultaneously. We launched 1000 simultaneous requests to the central server containing 11 campaigns. The result was very satisfying: the server was able to handle all the requests and 95% of the request was processed in less than 500 miliseconds. We performed another stress test in a more realistic condition: using JMeter, 100 simultaneous requests was sent to the central server containing 24 different campaigns, most of the campaigns have more than 15 tasks of different types. The result of this realistic test was satisfying as well: the central server replied instantly to all the requests. Specifically, the processing time for all request is less than 500 miliseconds. It was therefore concluded that the Citizense’s central server can independently withstand a high load should it arise, which is certainly more than sufficient for our deployment. Furthermore, the implementation allows easy redeployment and upscaling in a cloud environment, should more stringent performance be required.

4. The Real-World Deployment of the Citizense Framework

4.1. The Goals of the Deployment

The purpose of deploying the Citizense framework is two-fold. Firstly, the deployment serves to explore the framework’s effectiveness in collecting both geographic and general information. Secondly, and most importantly, the main purpose is to analyze the participants’ spatial and temporal behavior based on the meta-data of data submission in this deployment.

4.2. The Participatory Sensing Process Using Citizense Framework

As the first step to join the Citizense deployment, participants are required to register. A single credential allowed participants to play the role of both campaign author and data collector.

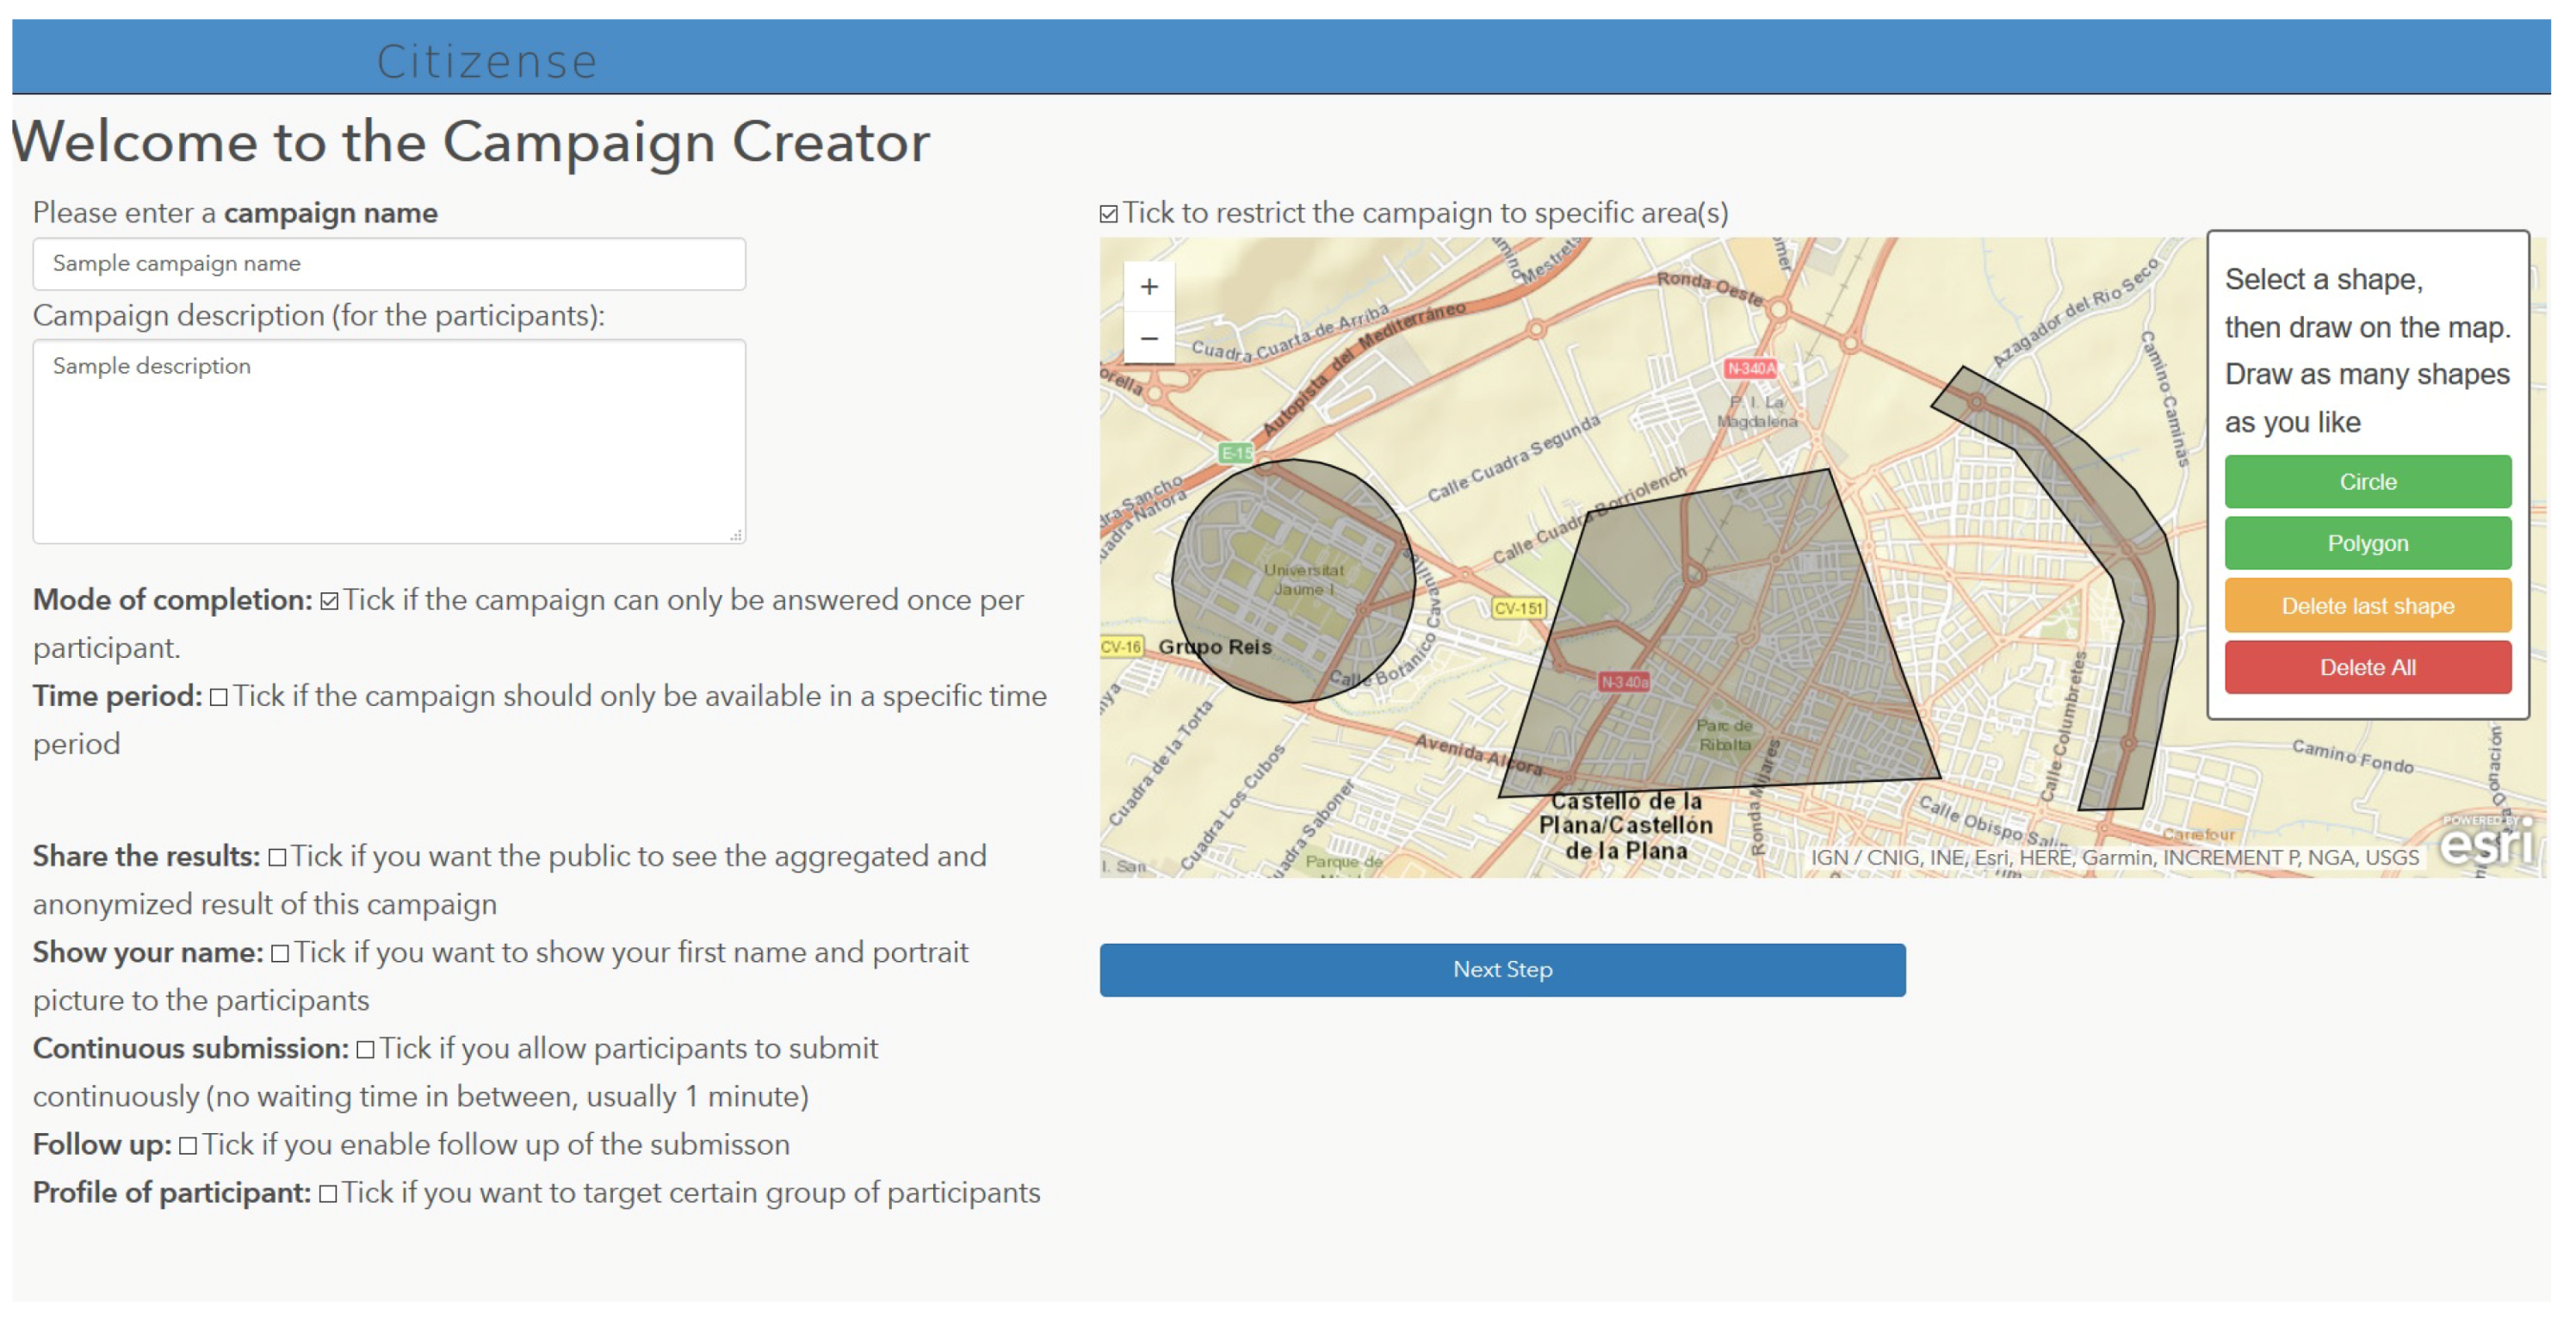
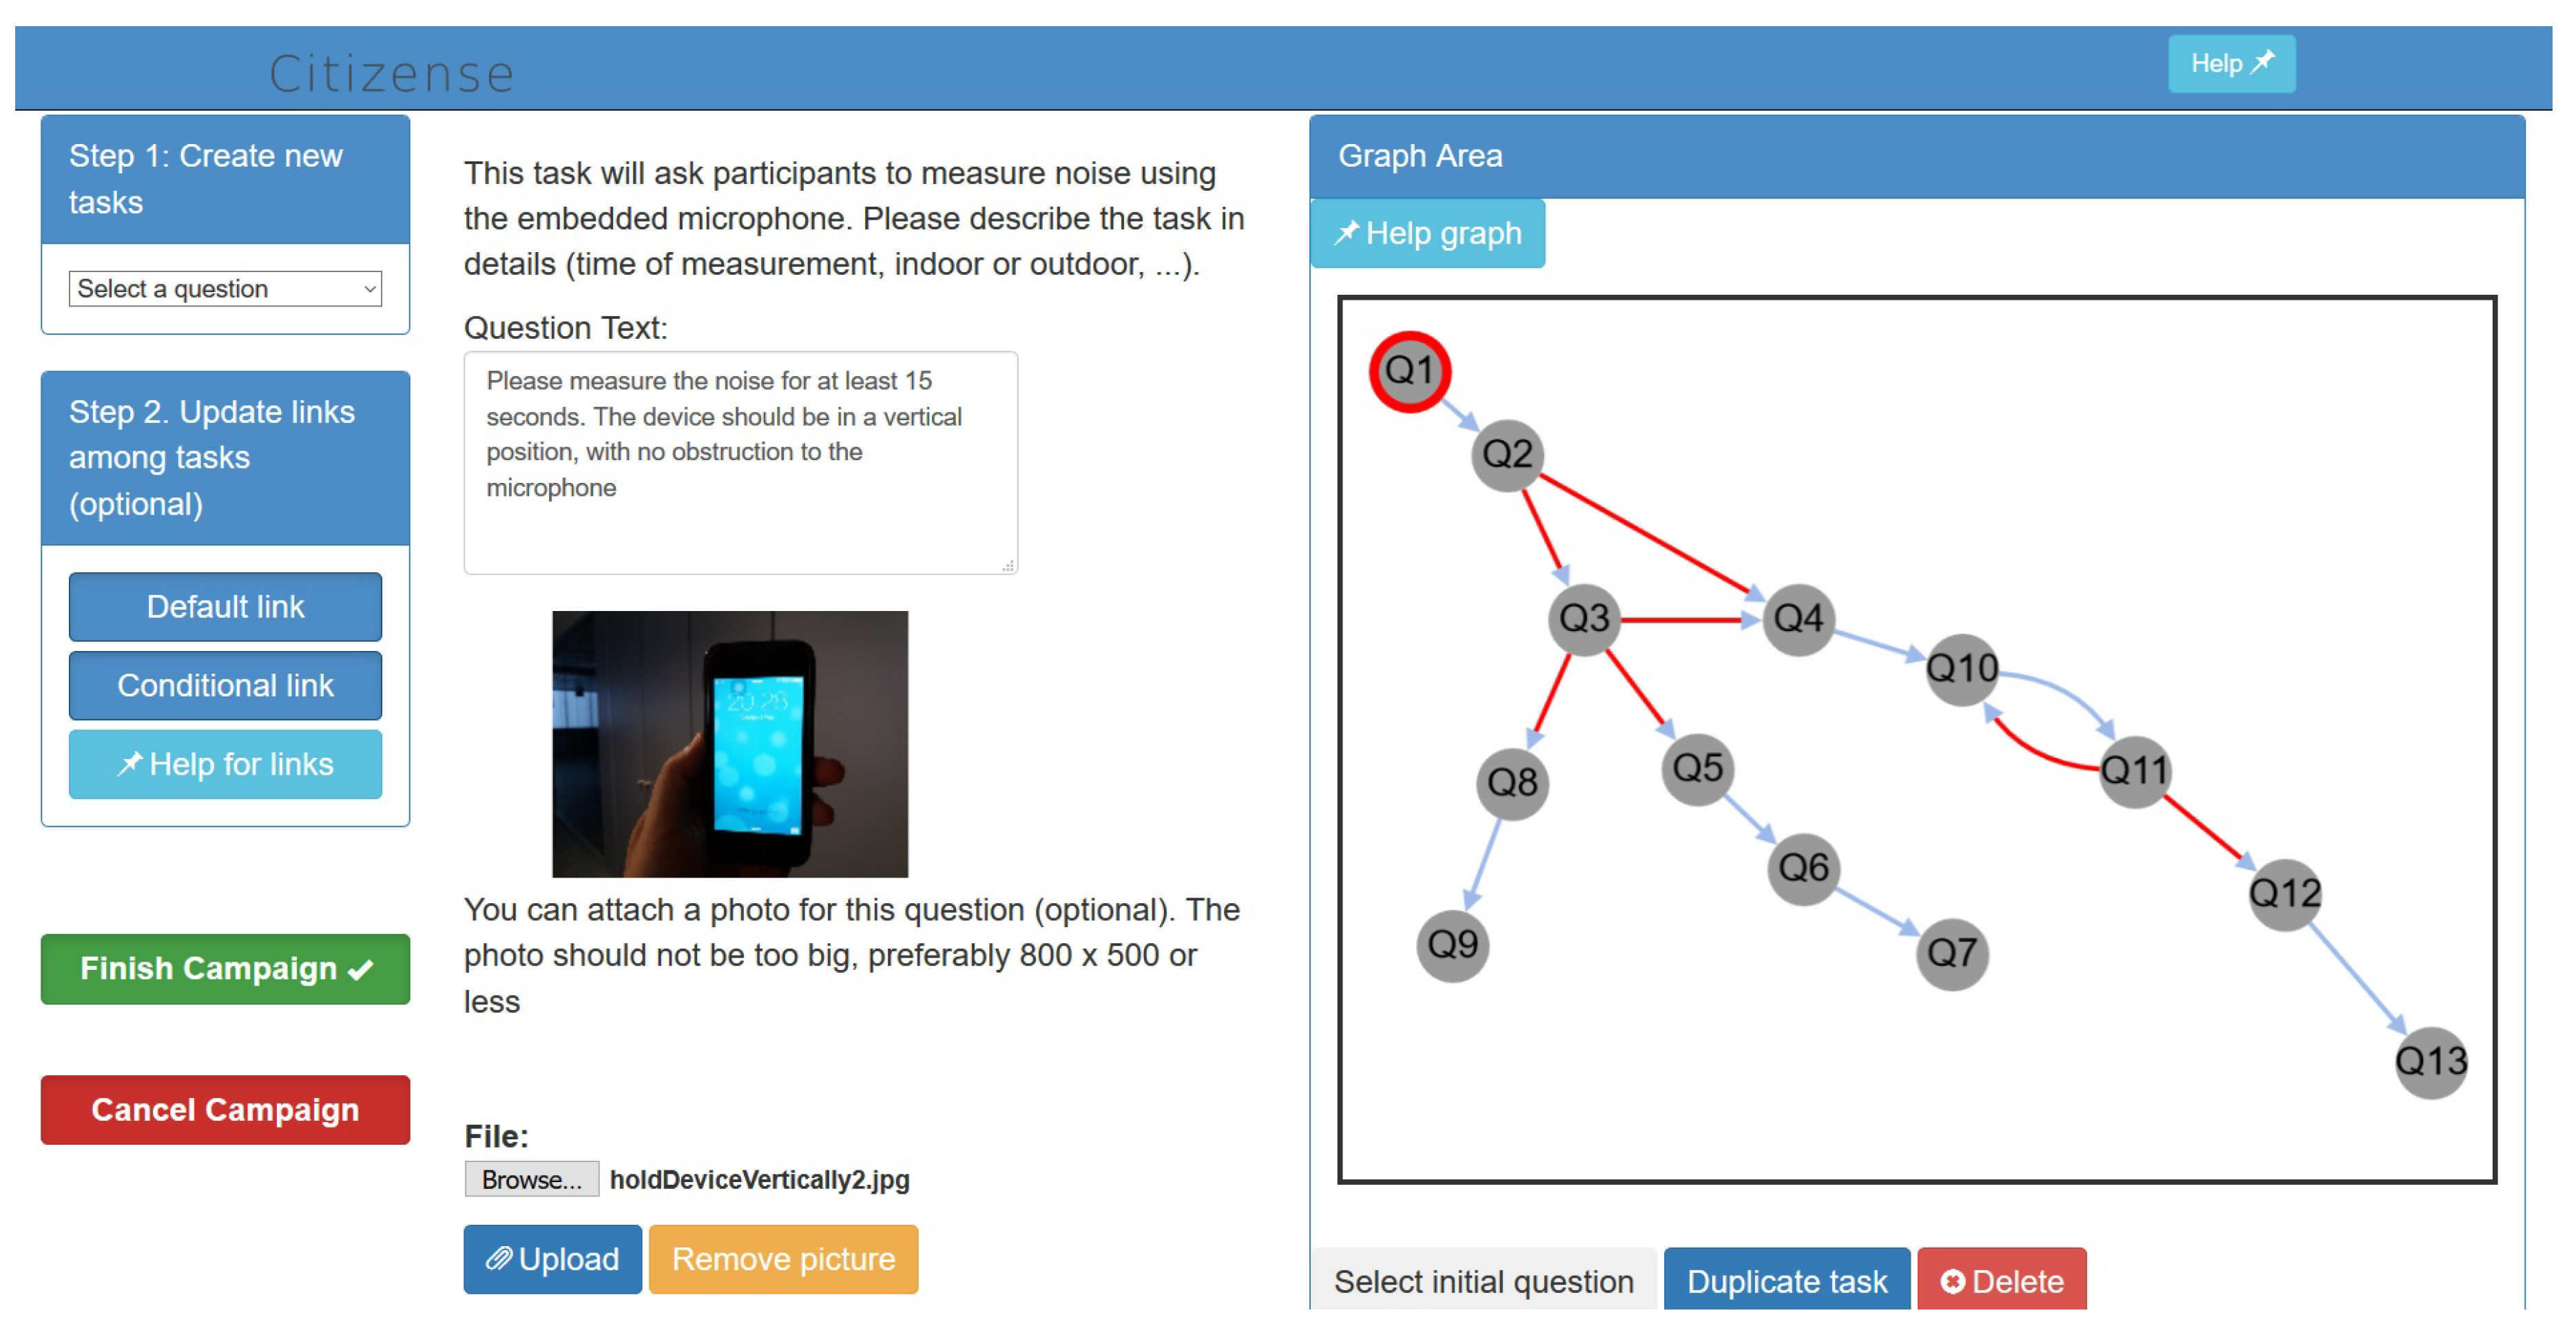
4.2.1. Creating Campaigns

A campaign author can easily create a participatory sensing campaign through any platform (e.g., desktop, mobile device) in two steps by interacting with the web-based campaign editor. In the first step (see Figure 2), the campaign author is expected to specify the general working parameters of the campaign, including visibility of the campaign results, location and time constraint, the textual description and profile of the eligible data collectors. The graphical user interface allows campaign authors to easily define every parameter of the campaign. In particular, the location constraints can be intuitively and precisely defined by drawing one or several areas of arbitrary shape on the map to define where the campaign should be available (see Figure 2, right side).
In the second step, to realize the multi-purpose design principle, campaign authors define the sequence of atomic sensing tasks to be completed by the data collectors (see Figure 3). Each task contains a textual description, an optional picture (which can guide data collectors to improve the quality of the submission [66]) and other necessary parameters, depending on the task type (e.g., the different options in case of a multiple choice question). At the time of writing, the Citizense framework supports 12 different task types, grouped into sensory input (noise measurement, GPS location and WiFi fingerprint), multimedia input (picture) and human input (text input, bounded and unbounded numeric input, multiple choice question, date input and time input). To make the campaign more flexible and better fit to the data collector’s situation, the Citizense campaign editor allows multiple branches within the sequence of the atomic sensing tasks through the use of conditional and unconditional transitions. Different controls in this graphical user interface assist the campaign author with quick and easy management of the atomic sensing tasks (see Figure 3, right side). For example, the graph-based visualization highlights the campaign’s structure; buttons such as duplicating and deleting a specific task give campaign authors flexibility in defining atomic sensing tasks. The Citizense campaign editor not only allows the campaign authors to create campaigns, but also to view, update and delete campaigns at any time.
After the one-time login or registration in the mobile application, data collectors are presented with a list of campaigns relevant to their real-time context. Upon selecting a campaign, the Citizense mobile application guides the data collector through this campaign (taking into account task transitions), and supports him/her in performing the sensing tasks. For example, tasks involving text input can be completed using speech recognition as a method to input text faster and more conveniently, tasks involving sensory measurement have simple sensor controls and tasks involving sensory measurements and pictures have exact location information attached to their results. When a data collector completes a campaign, the result is attached with various meta-data (i.e., time, location, Internet connection status) and submitted to the campaign server.
At any time, data collectors can use both the mobile application and the Web-based Result viewer to view live (aggregated) results of certain campaigns, if such visualization of contents are allowed by the corresponding campaign author. They can also view the status (feedback) from their past submissions through this mobile application (see Figure 4d).

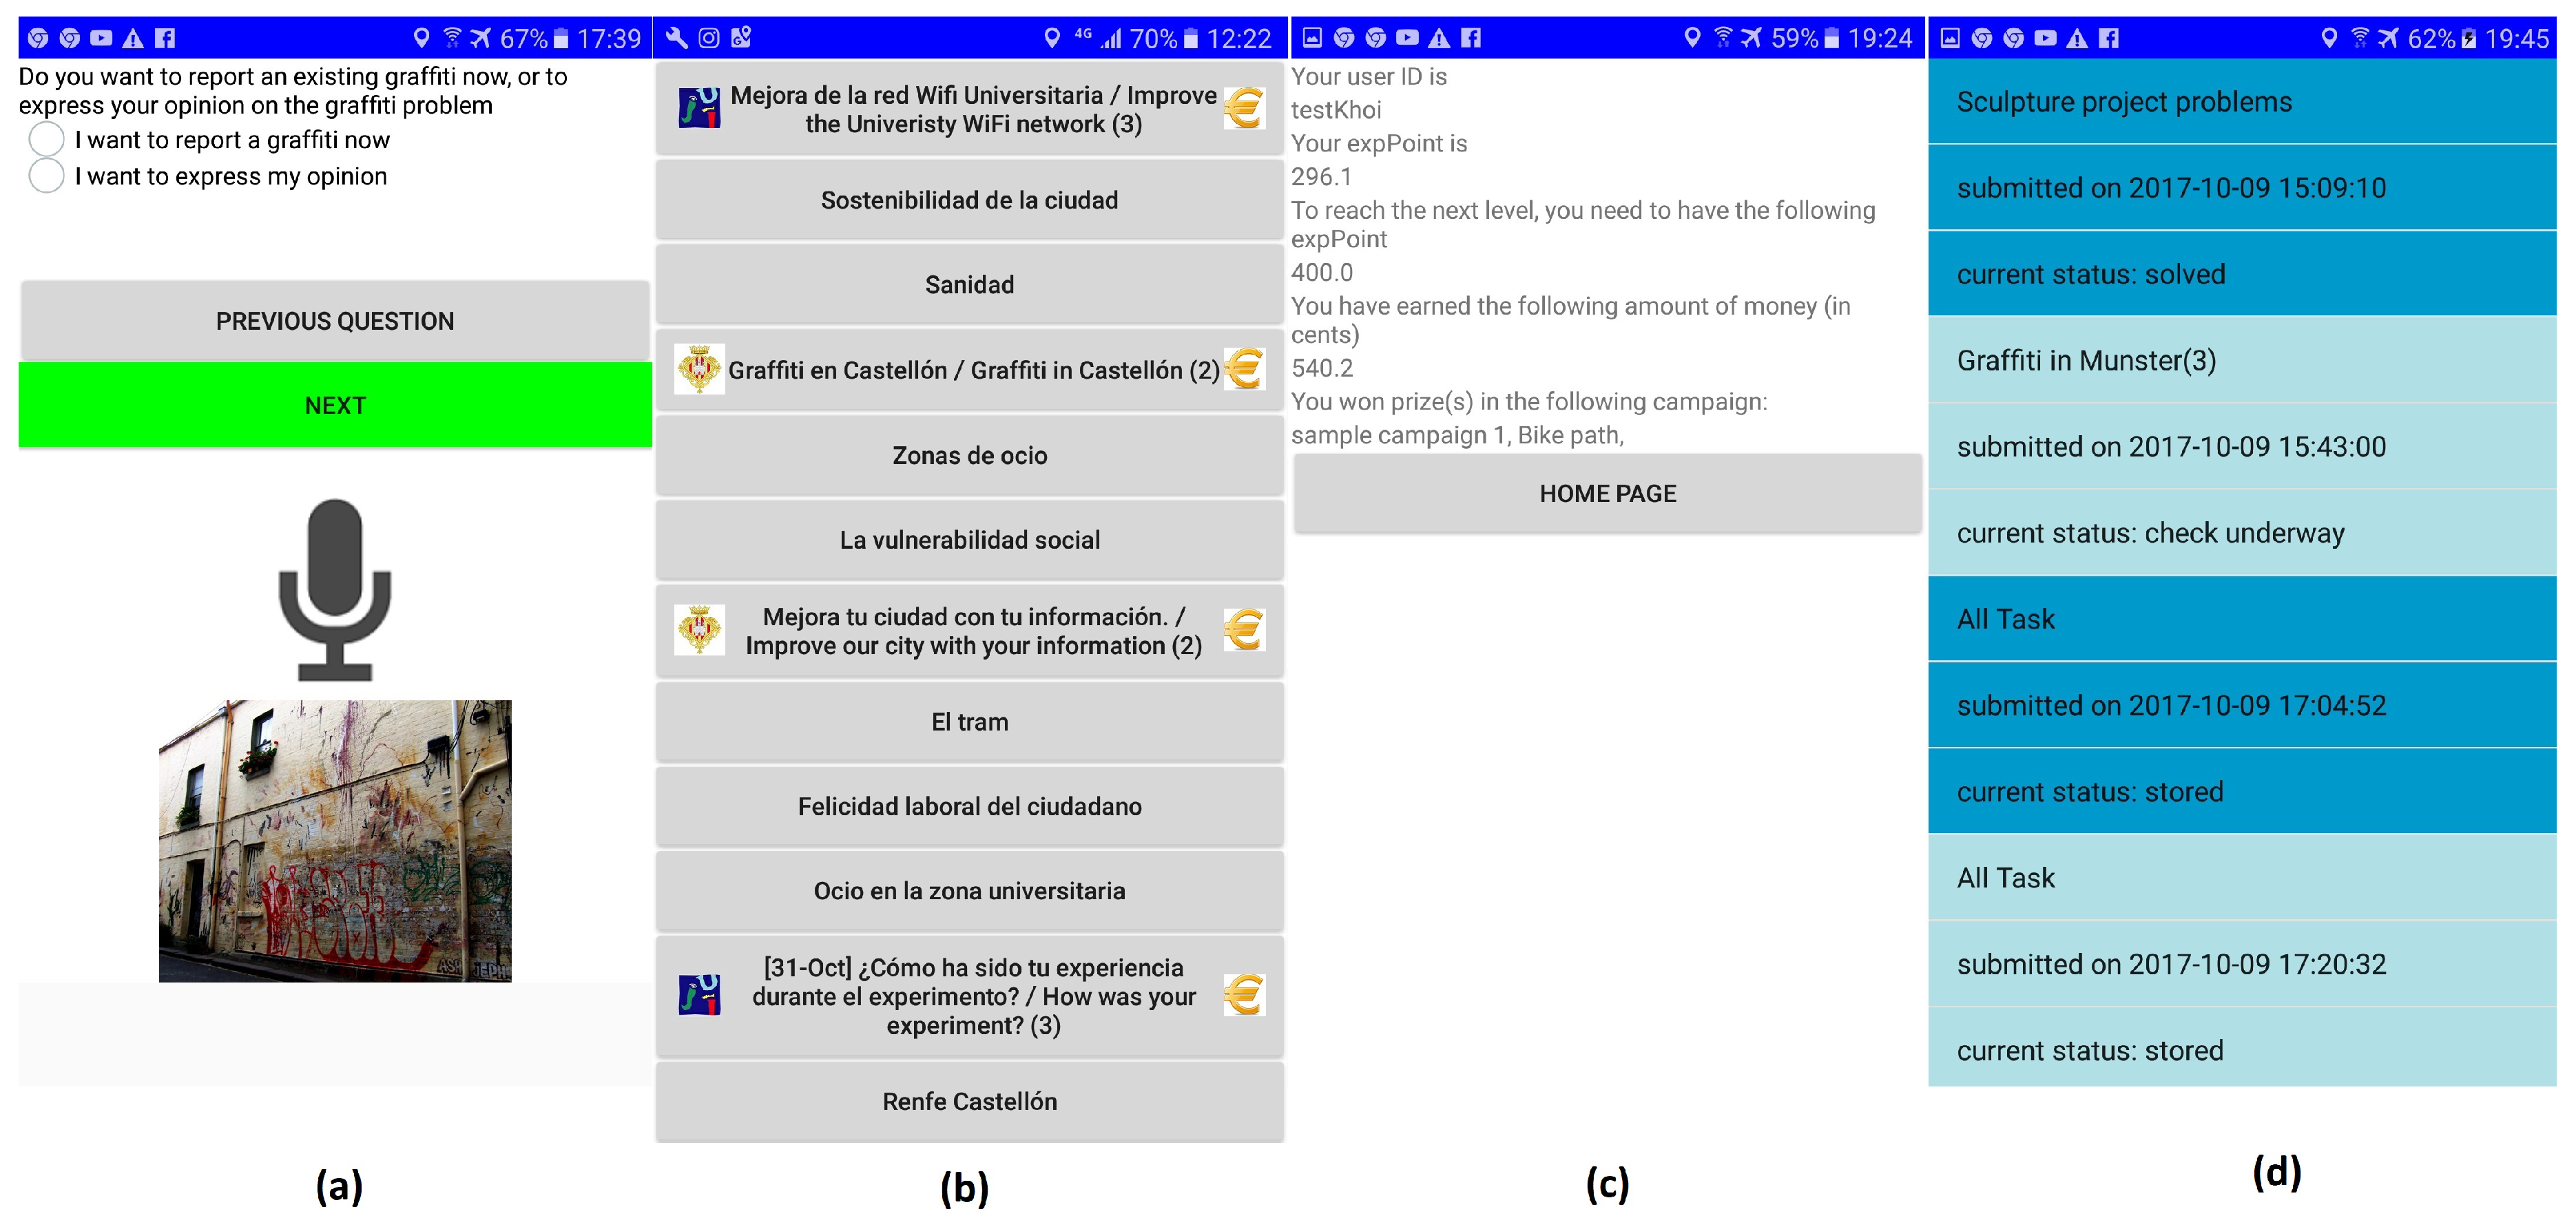
4.2.2. Participating in Campaigns

After the one-time login or registration in the mobile application, data collectors are presented with a list of campaigns relevant to their real-time context. Upon selecting a campaign, the Citizense mobile application guides the data collector through this campaign (taking into account task transitions), and supports him/her in performing the sensing tasks. For example, tasks involving text input can be completed using speech recognition as a method to input text faster and more conveniently, tasks involving sensory measurement have simple sensor controls and tasks involving sensory measurements and pictures have exact location information attached to their results. When a data collector completes a campaign, the result is attached with various meta-data (i.e., time, location, Internet connection status) and submitted to the campaign server. At any time, data collectors can use both the mobile application and the Web-based Result viewer to view live (aggregated) results of certain campaigns, if such visualization of contents are allowed by the corresponding campaign author. They can also view the status (feedback) from their past submissions through this mobile application (see Figure 4d).

4.3. The Setup of the Deployment

The Citizense framework was presented to the students, professors, staff and passers-by of the Universitat Jaume I’s campus (Castellón, Spain). At the beginning of this 20-day deployment, a promotional activity was performed to recruit participants: emails concerning the deployment were sent to all members of the university (i.e., students, professors and administrative staffs), flyers were handed out and posters were visible in the most-visited places in the university campus (e.g., canteens, entrances, library, bus stops). Through this promotional activity, participants were encouraged to register in the Citizense framework and participate as campaign authors (to create campaigns for other participants to collect city-related information) and/or data collectors (to respond to the campaigns available in the framework). It is known that, in general, the university staff, professors and especially the students live across the province, not only in the city of Castellón.
On the first day of the deployment, four participatory sensing campaigns from the organizers were launched; these campaigns addressed relevant and common issues that can have impact on the lives of the local residents and the participants such as illegal graffiti and vandalism, cycling infrastructure in the city and improvement in the public furniture. While data collectors were responding to the campaigns from the organizers, campaign authors were encouraged to create campaigns for the data collectors, these campaigns are expected to gather meaningful information related to the city, which can be used by the city authority to improve different aspects of the city. During the course of the deployment, another six campaigns with similar themes were launched regularly by the organizers, totaling the number of campaigns from the organizers at 10 campaigns.

5. Results and Discussion

5.1. Participation Results

Throughout the deployment, 359 participants registered in the Citizense framework, among them 179 males and 180 females. These participants included administrative staff, teaching staff, researchers and mostly students; participants come from different academic domains such as engineering, social science and life science. The participants’ age range from 18 to 63, with an average value of 23.769, median value of 22 and standard deviation of 6.637. Concerning the registration, 176 participants registered through the campaign manager and the rest (183 participants) registered through the mobile application. Due to the single credential system within the framework, 47 participants originally registered through the campaign manager also logged in to the mobile application. Therefore, in total, there were 230 data collectors using the mobile application.
The participants created 34 campaigns, which addressed a variety of topics mostly related to the urban context. Together with the 10 campaigns launched by the organizers, the total number of campaigns available during the deployment was 44. Table 2 gives an overview of the first half (22 campaigns), having a substantial number of submissions and data collectors, among them five campaigns that were applied with a monetary incentive to study the data collectors’ reactions to monetary incentive (i.e., campaign number 1, 2, 3, 4 and 6) [22]. These 22 campaigns lay the foundation for subsequent discussion and analysis in this article. Examples of user-created campaigns include public transportation and its efficiency, public furniture, key infrastructure in the city, the city’s sustainability issues and cultural issues. The length of the campaigns created by participants ranges from 3 to 45 atomic sensing tasks, a typical campaign has six to eight tasks.
After the manual data cleaning process performed by the authors of this article, which removed empty and duplicated submissions, the cleaned dataset contains 4167 requests sent by data collectors and 2615 submissions were received for the 22 campaigns detailed in Table 2 (for all 44 campaigns, the number of submissions was 2944). Data collectors were encouraged to enable their GPS sensor when interacting with the Citizense mobile application. However, they had the right to disable this GPS sensor at any time, due to the enforced privacy regulations. Among the 2615 received submissions, 70.13% of them (1834 submissions) were attached with the GPS location while the rest (781 submissions-29.86%) were made without the GPS location. Among the 230 data collectors, 57.82% of the data collectors (133 data collectors) always had their GPS sensor enabled when collecting data while the rest (97 data collectors-42.18% of the data collectors) had at least one of their submission without the location data.

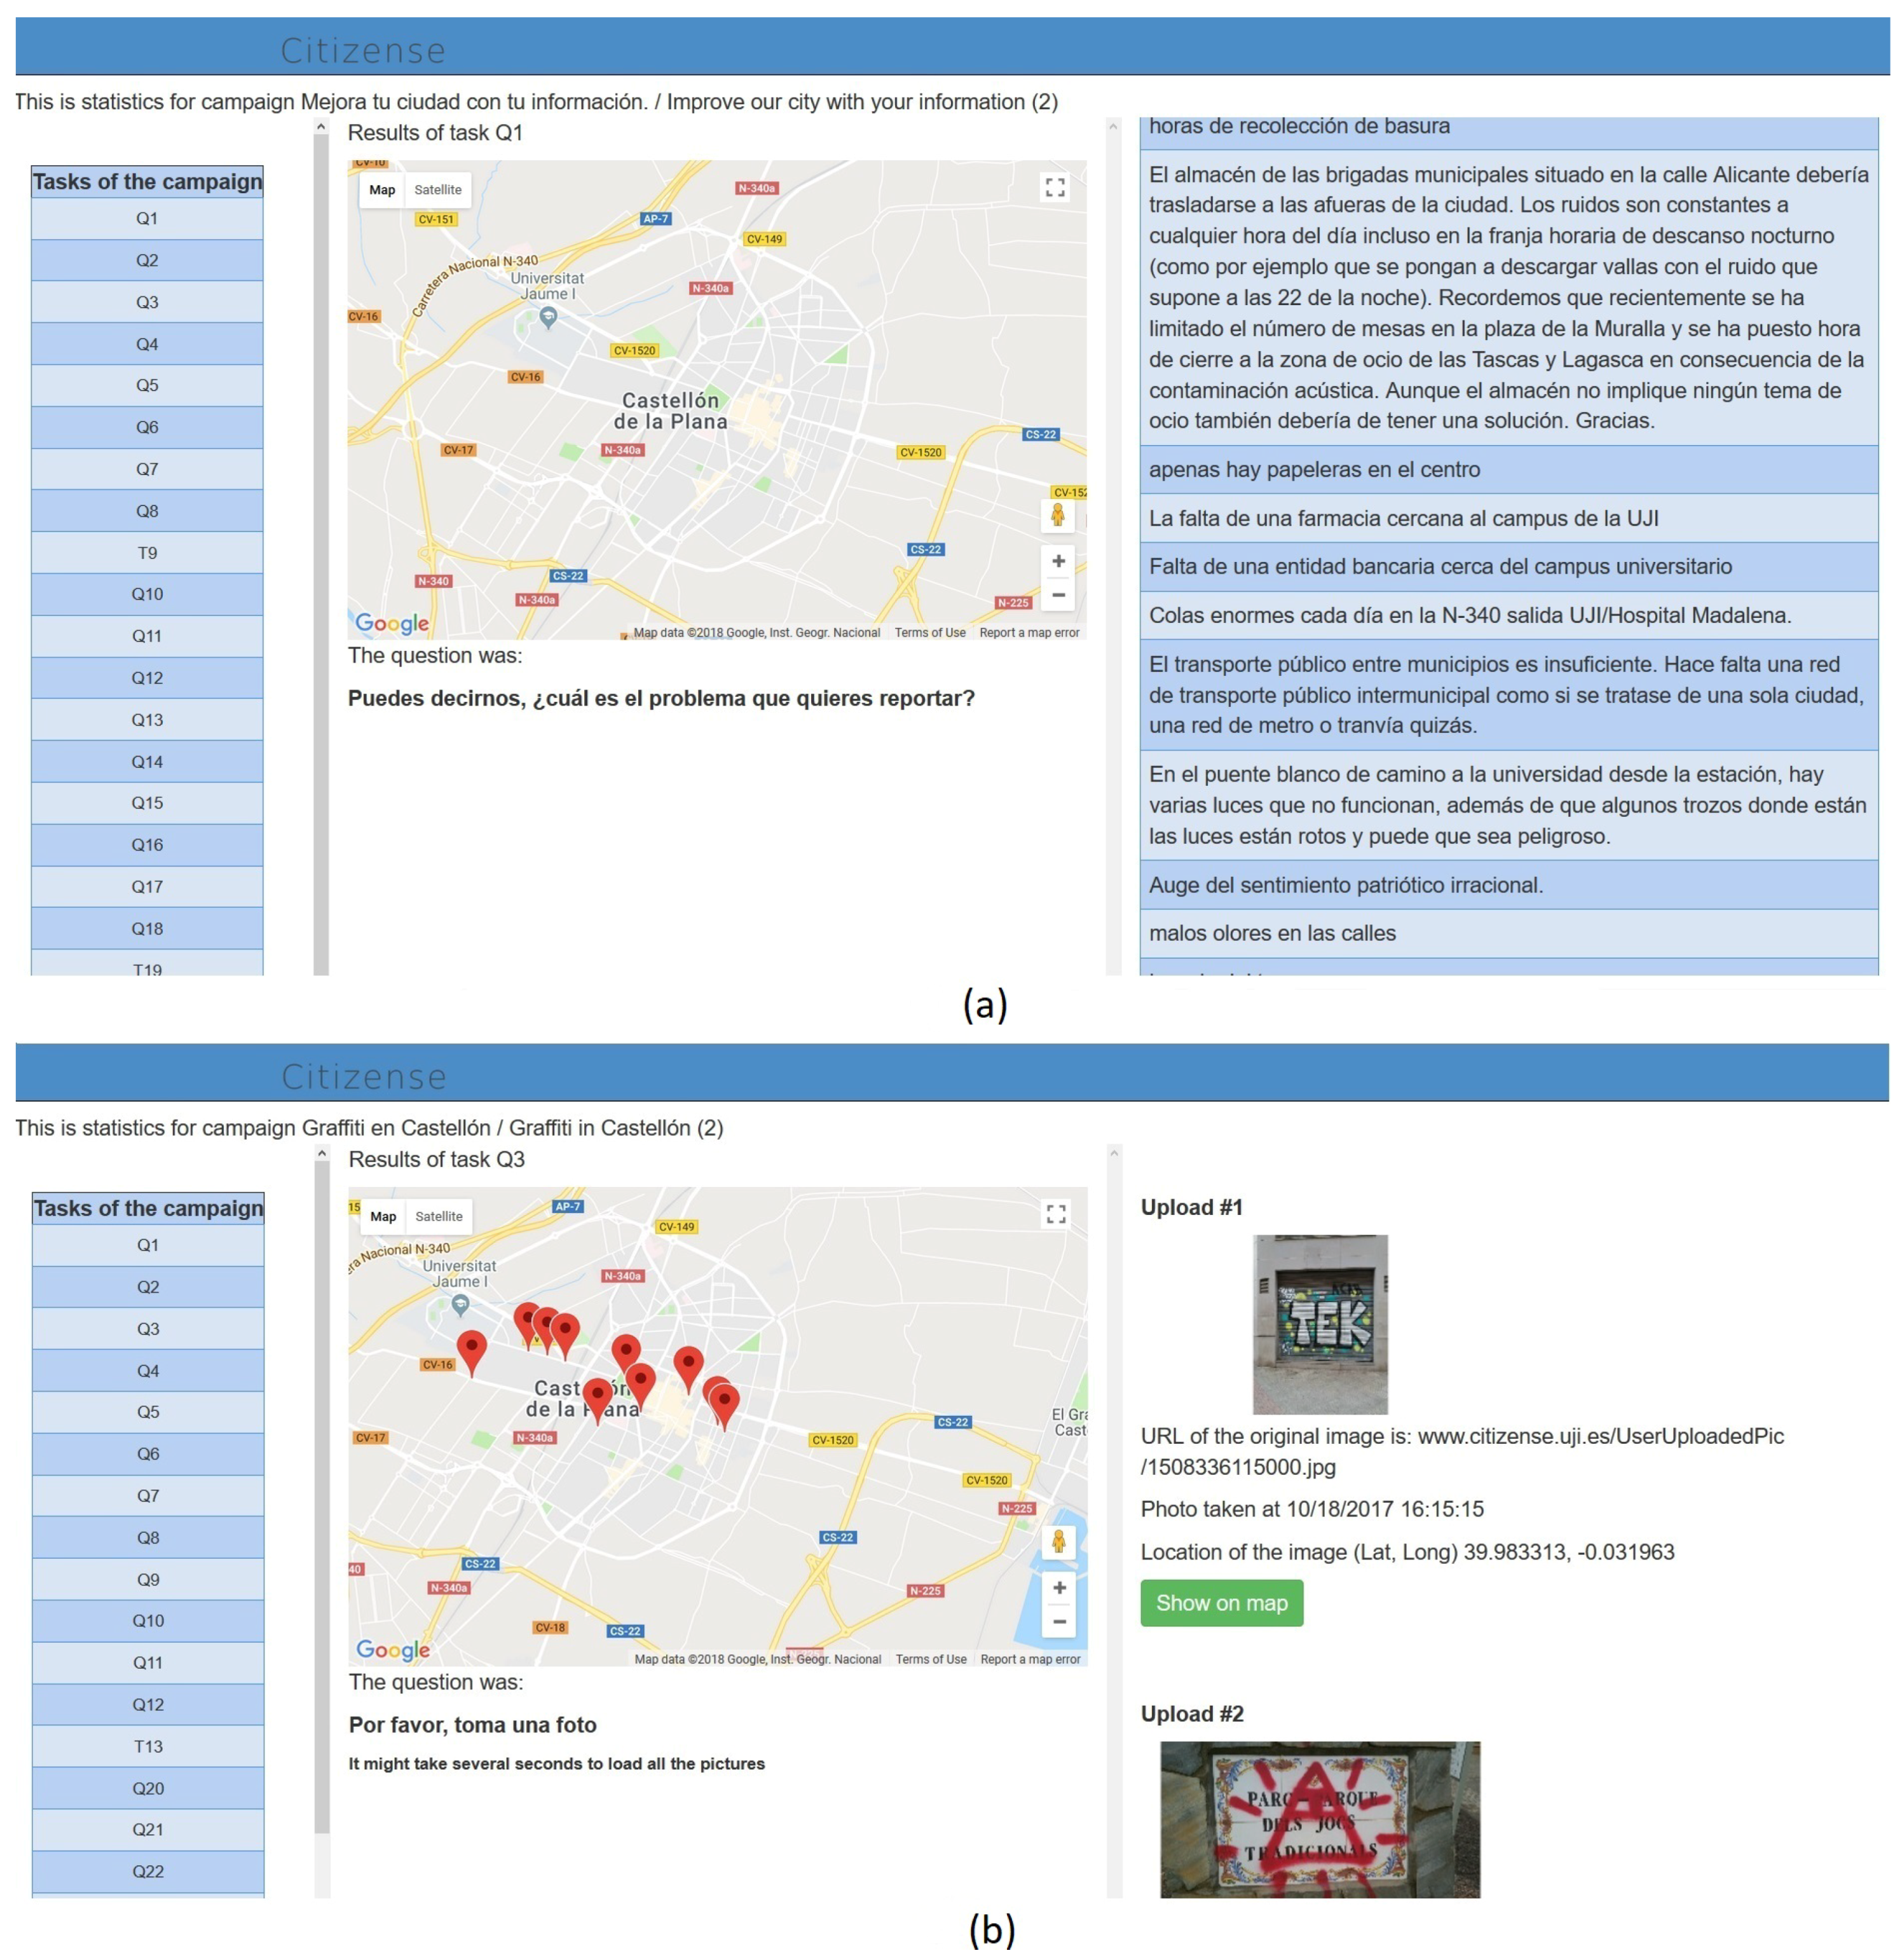
5.2. Effectiveness of Citizense for Collecting Geographic and General Information

In order to discuss the effectiveness of Citizense to collect geographical and general data, we discern the campaign authors’ ability to successfully use Citizense to create a variety of qualitative campaigns, and the data collectors’ results with respect to the data collected.
The campaigns created by the participants, especially the 13 campaigns in Table 2, incorporated all the campaign’s features that were available during the deployment, such as the location and time restrictions, the visibility of the results and attaching multimedia content in atomic sensing tasks. Apart from the relevant topics covered by campaign authors, they used 11 out of the 12 supported task types throughout their campaigns; only the noise measurement type was not used. At the same time, we did not receive any requests for further explanation of the framework in the contact email throughout the Citizense deployment. This is an indication that the campaign editor is easy to use, the existing features are appreciated and no additional technical assistance is required, especially considering the diverse backgrounds of the campaign authors and their first time using this framework.
In terms of collected data, the deployment has gathered various data types: text (through typing, speech-to-text conversion and selecting pre-defined options), numeric values, pictures, date and time values, GPS locations and WiFi measurements. These data types correspond to the types of sensing task supported by the Citizense framework; only audio was not recorded, as the corresponding task was not used by campaign authors. More specifically, among the 2615 submissions received there are 327 submissions containing embedded sensory measurements and 27 submissions containing pictures (see Figure 5b), 3464 text responses, 93 numeric responses and 30 date and time responses. On a higher level, these primitive data types were combined into geographic contents and general contents. The geographic contents include time- and geo-tagged reports on the issue of illegal graffiti, street animals and potential dangers and malfunctions in the city’s cycling infrastructure. In each of these reports, the data collectors provided a comprehensive set of information such as the GPS location of the object of interest, the time of appearance, the corresponding text description, the subjective opinion, the severity of the potential danger and a picture describing the object. General contents are the data collectors’ subjective feedbacks, opinions and suggestions on various issues raised in the campaigns during the deployment, such as the comments on price of the city’s tram line and its punctuality, complaints about the bike sharing system and suggestions for improving the infrastructure in the city’s beach.
While the large amount of submissions and variety of data collected demonstrate the potential of Citizense to engage users, the qualitative involvement can be examined through the text input and pictures they produced. In this Citizense deployment, 100% of the submitted pictures are on topic and sharp; none of these pictures are regarded invalid or low quality. In contrast, in the work of Reddy et al. [67], the authors described an experiment in which college students were involving in the participatory sensing task of taking photos of the trash bins in their campus. The authors reported the ratio of invalid picture of 6 ± 4%. Nineteen campaigns (86.36% of the 22 campaigns detailed in Table 2) had their text-input tasks completed at a ratio over 90%. In particular, the user-created campaign on social vulnerability achieved the completion rate of 100% for its text-input tasks. Furthermore, several data collectors provided very detailed text to elaborate their answers (see Figure 5a). The reasons for some campaigns to have low completion ratio for text-input tasks are the poor description of these tasks and/or these tasks are optional.
Next to the above quantitative indications, both data collectors and campaign authors were surveyed at the end of the deployment, in order to obtain their opinion on the usefulness of Citizense. This was done through a campaign in the Citizense framework and an email-based questionnaire, answered by 31 data collectors and 32 campaign authors, respectively. Thirty data collectors (96.77% of those who responded to the campaign) agreed that Citizense is a useful platform to collect various types of city-related information while 31 campaign authors (96.87% of those who answered the survey) appreciated their abilities to create campaigns on the topics of their choice. Finally, in the post-deployment phase, face-to-face interviews were conducted with 33 participants. All the interviewed participants appreciated the various functionalities, the simplicity and ease of use of the Citizense graphical campaign manager and the mobile application. All data collectors were satisfied with the way they contributed data through the Citizense client mobile application while all campaign authors were pleased with the information gathered and visualized by the Citizense framework. During these interviews, some participants acknowledged the behaviors identified by the analysis of the deployment’s results (see Section 5.3).
In conclusion, the Citizense deployment showed that the Citizense campaign editor is effective in assisting the authors in designing their data collecting process. On the other hand, data collectors showed their willingness and involvement in providing a variety of high quality data. Both campaign authors and data collectors indicated to be satisfied and useful to collect city-related information.

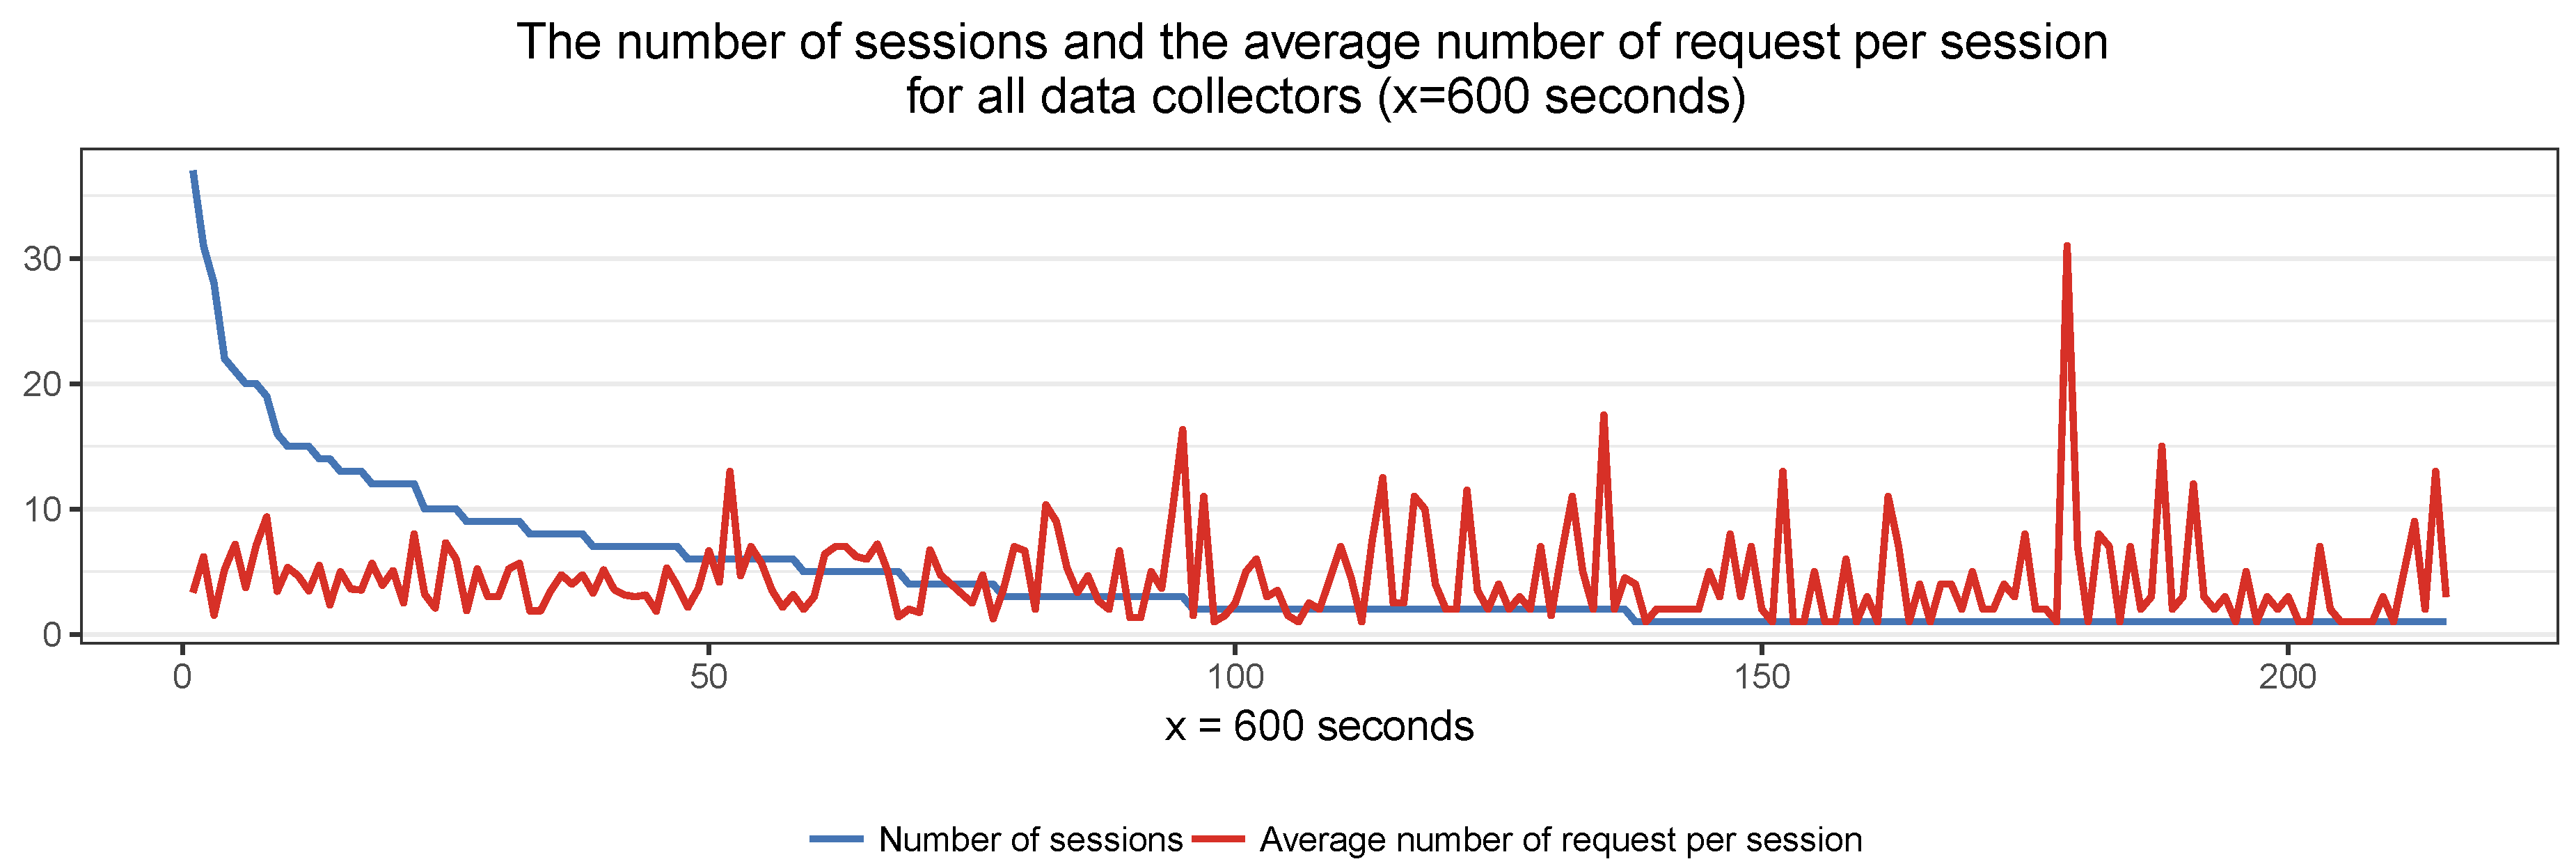
5.3. Temporal User Behavior: Frequency of Use

First, we are interested in studying the temporal interaction behavior of the user with the mobile application, or in other words, their frequency of use. In order to understand the performed analysis, consider the following typical usage pattern of the mobile application: at a certain moment in time, a data collector opens the mobile application, which sends a request for the list of current campaigns to the central server. Subsequently, the received list of campaigns is visualized on the user’s mobile device. The user can now browse through the list and open a selected campaign to read its details. He then has two options: completing that campaign, after which he’s again presented with the list of campaigns, or withdrawing from the selected campaign after reading its summary and returning to the list of campaigns. In either case, each time the user returns to the list of campaigns, it is refreshed by sending a request to the central server. This process might be repeated several times until the user finally exits the mobile application and comes back later. Therefore, based on the timestamp of the requests for the list of campaigns to the campaign server, and the time separation between them, we are able to determine usage sessions: periods of time in which the user is actively using the mobile application and potentially contributes data. Figure 6 exemplifies the behavior of a typical data collector (the timestamp of the requests) over time: certain requests are clustered in time, representing active, longer (usage) sessions, while others are more isolated, representing less active, shorter (usage) sessions.
We thus define a session as a cluster of requests coming from a single data collector, where the time difference between any two consecutive requests is at most x seconds. The delay x denotes a threshold high enough to include the time it takes to scroll through the list of downloaded campaigns, open a campaign to view its details and (possibly) complete it, plus any minor distraction the data collector may have (e.g., answering a text message, greeting a friend in the street). For our study, we select x to be 600 s (10 min) as this value allows data collectors to comfortably complete any available campaign, considering the average length of a campaign (i.e., at least six tasks) and the high-quality results produced by the data collectors (i.e., sharp pictures, detailed text). We then compute the number of sessions and the average number of request per session for every data collector. Due to the fact that the inequality in participation can be found in various fields (e.g., Wikipedia [16], VGI [19,20], peer-to-peer file sharing [21]), we expect to find a similar (uneven) distribution for the number of sessions among the data collectors in this deployment.
Figure 7 shows the distribution of number of sessions and the average number of request per session for every data collector at the value x = 600 s, decreasingly ordered according to the number of sessions. If we increase the value of x, the number of sessions decreases, as several sessions might form one bigger session due to the more tolerant waiting time between server requests. The most active data collector had 37 sessions (x = 600 s) throughout the 20-day deployment, meaning that he/she had around two sessions per day on average. As we expected, Figure 7 clearly shows an uneven distribution of number of sessions among the data collectors. Specifically, this distribution follows a long-tail distribution [68], with a smaller number of active data collectors having a large number of sessions and a much larger number of less active data collectors having a much smaller number of sessions [69,70]. Specifically, while the most active data collector had 37 sessions, 227 of 230 data collectors (98.69%) had less than 30 sessions, 222 data collectors (96.52%) had less than 20 sessions, 201 data collectors (87.39%) had less than 10 sessions and 159 data collectors (69.13%) had at most five sessions. Such a distribution of performance is common for this type of participatory and voluntary works [71]. Among the number of average requests per session, there are some outliers. Furthermore, it can be observed that the average number of requests per session is slightly lower, and there is lower variation, among data collectors having more sessions (the smaller group of active data collectors, on the left part of Figure 7) than that of the data collectors having fewer sessions (the bigger group of regular data collectors, on the right part of Figure 7); most of the outliers are from these regular data collectors, which also brings the average number of requests per session slightly up. This observation suggests two different behaviors of the data collectors: the regular data collectors interacted with the Citizense mobile application a few times, and each time they tried to discover (and complete) a larger number of campaigns (in some cases, a very large number of campaigns) and later left the application for a longer time, while their active peers opened the mobile application more frequently, and each time selected (and completed) a smaller number of campaigns. Additionally, this observation is confirmed by some of the interviewed data collectors after the deployment. Three data collectors confirmed that they frequently opened the Citizense mobile application while 10 others acknowledged that they interacted with the Citizense mobile application just a few times, where each time they tried to explored several campaigns. Our further analysis has shown that, in general, the total number of submissions made by an active data collector is larger than that of a regular data collector. To put this in perspective, note that a related study [72] gauged the number of visits to social network platforms among college students with different academic backgrounds. They concluded that the users made between 6 to 60 such visit per day, compared to two sessions per day for the most active data collector day for Citizense.

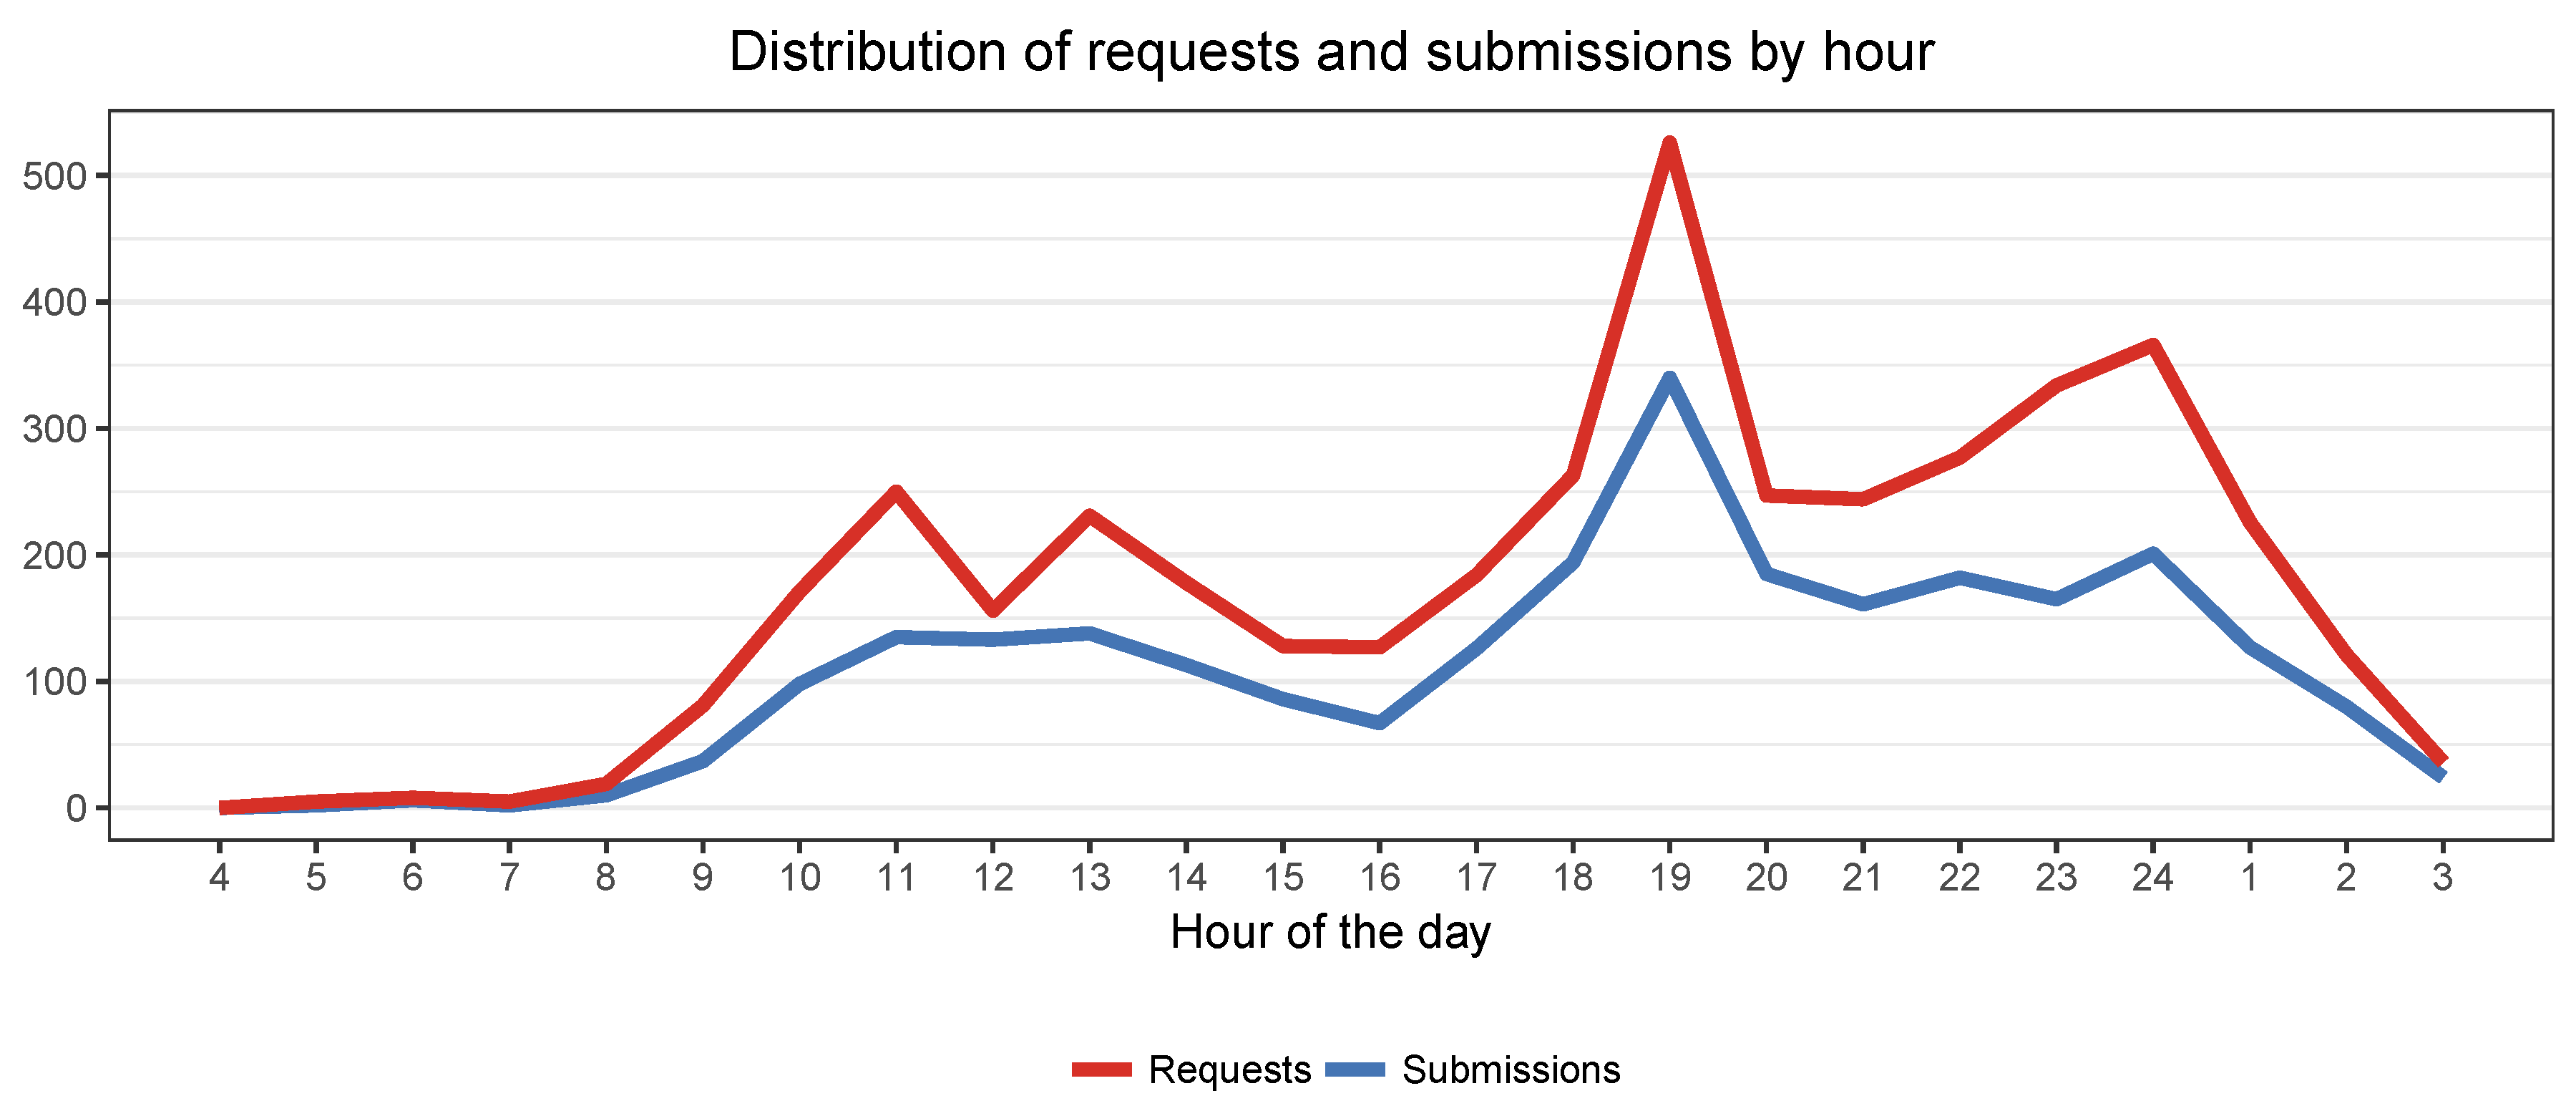
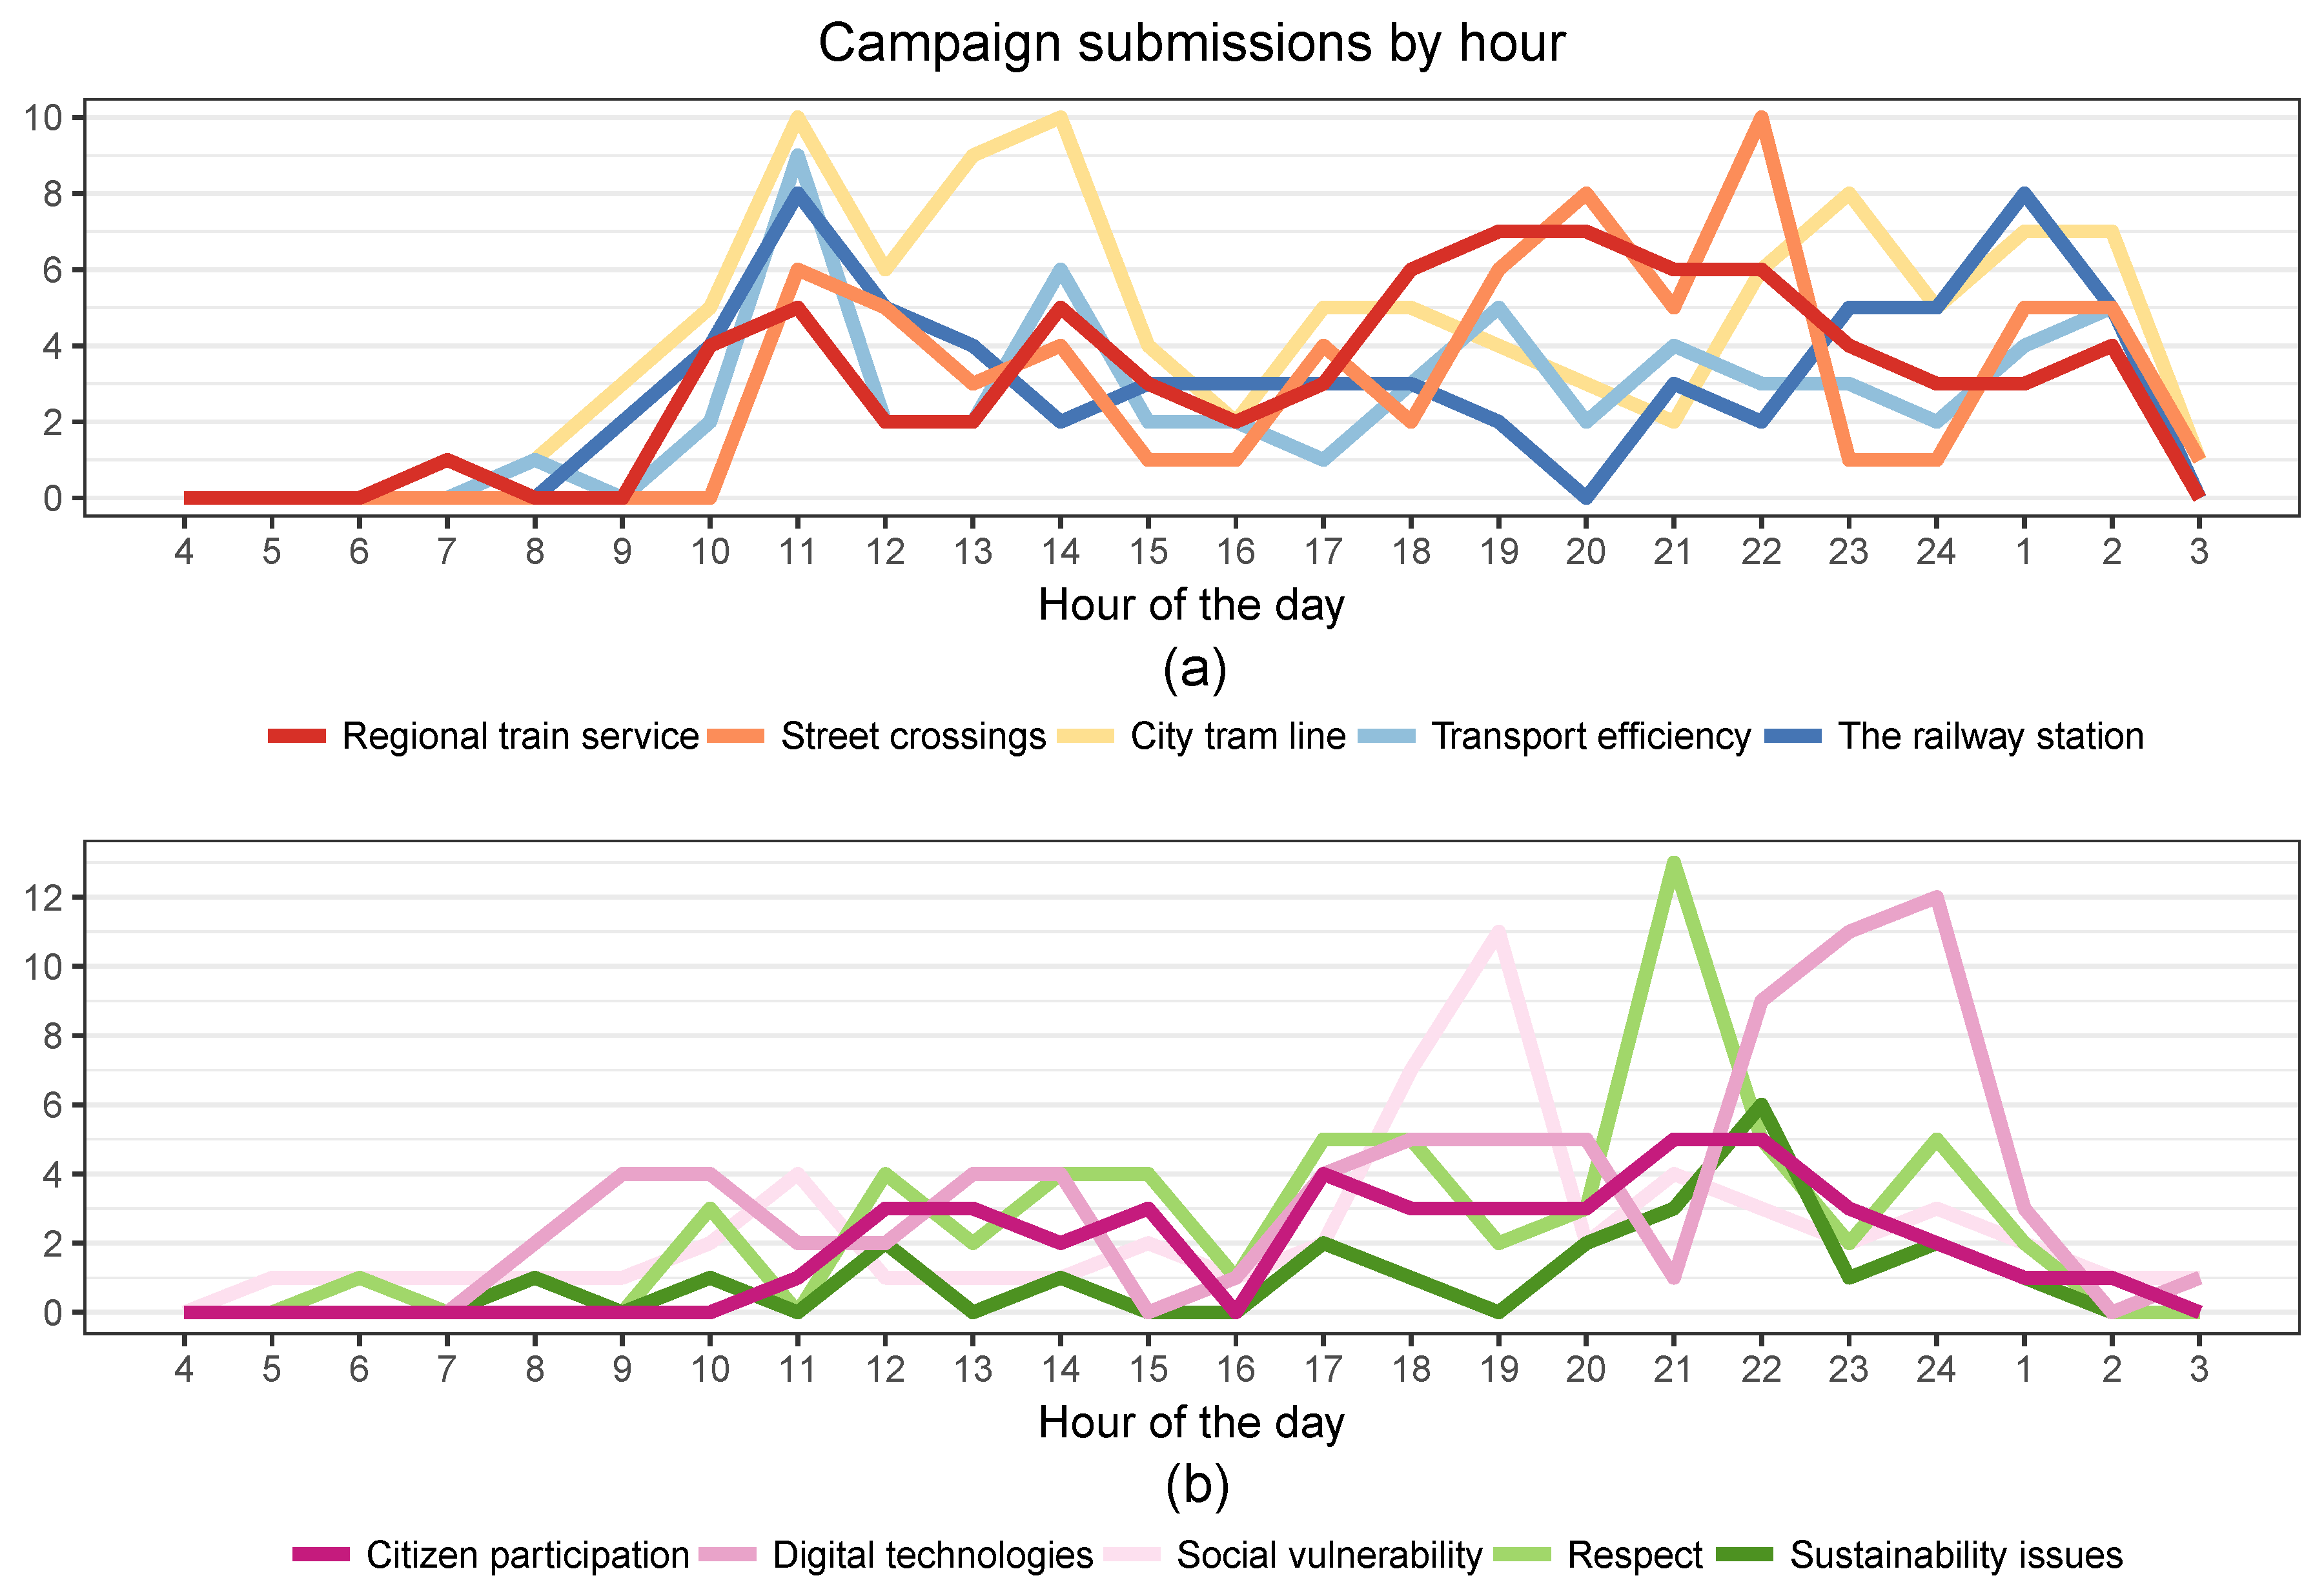
5.4. Temporal User Behavior: Distribution of Use

Based on the timestamp of the requests and the submissions from the data collectors, we seek to answer the question: when are the participants interacting with the Citizense framework? We expect to find the participants’ overall submission behaviors in terms of time. We further speculate there may be a relation between the content of a campaign and the temporal distribution of its corresponding submissions. From our analysis, we first note that the number of interactions (requests and submissions) in the weekend is insignificant compared with the total number of interactions (weekend requests and submissions constitute 5% and 4%, respectively). It is thus clear, perhaps somehow surprisingly, that data collectors are mainly active during the working days, and much less during weekends. From Figure 8, it is clear that the distribution of the data collectors’ requests generally matches the human work-rest cycle (which is consistent with the findings of [59]), although several requests occurred late at night. A distinct peak around 7:00 p.m. can be identified, which corresponds to the hour work/classes generally finish, and the request intensity is generally higher in the evening (7:00 p.m. to 12:00 a.m.) than during daytime (9:00 a.m. to 6:00 p.m.). This observation suggests that data collectors interact more with the mobile application in the evening, during their free time, although a reasonable amount of requests is also made during the (working) day. As a submission would likely follow a request, the distribution of the submissions from 22 campaigns in Table 2 follows the same pattern, with a distinct peak around 7:00 p.m. and more submissions delivered in the evening than during daytime. Overall, the submission intensity is relatively stable during mid-day, then slightly decreases in the afternoon and increase again in the evening. While being higher than the mid-day intensity, the submission intensity in the evening reaches two peaks in the evening before gradually dropping to 0 when data collectors are sleeping.
A closer look into the temporal pattern of the submissions from different campaigns provides deeper insight in the data collectors’ submission intensities. Indeed, they generally follow the overall pattern: submission intensities are higher in the evening than any other time of the day, with peaks occurring from 7:00 p.m. to 10:00 p.m. However, some campaigns have a different temporal pattern. In particular, one observed deviating pattern is that a primary peak occurs around mid-day, not in the evening (see Figure 9a), and a secondary peak during the evening. Interestingly, the campaigns whose submission patterns differ from the overall submission pattern discuss several aspects of the transportation such as the regional train service, the city’s tram line, street crossings, the railway station and the transport efficiency. In contrast, this phenomenon is less visible in other campaigns whose topics are not related to the transportation theme (see Figure 9b) as they generally have a primary peak and more submissions in the evening. This difference might suggest that responding to campaigns related to the data collectors’ current or recent activity and context (e.g., using public transport in their commute to/from the university campus in the morning, noon (lunch), evening) might be triggered by the data collectors performing the activity, rather than in during fixed time periods (i.e., their free time in the evening). We further explore this hypothesis when considering the data collectors’ spatial behavior in the next subsection.

5.5. Spatial User Behavior

As the data collectors live across the city (and the province) and commute to the university on a daily basis, their requests and submissions are spread across the city of Castellón, the nearby towns and the routes connecting them (i.e., railways and highways). The biggest cluster of submissions is in the city of Castellón, as many campaigns addressed issues of the city on one hand, and data collectors spent much of their time in the city on the other hand. Therefore, we focus our attention to this cluster and study the relation between the locations of a campaign’s submissions and the topic of that campaign.
With respect to spatial properties, the 22 campaigns detailed in Table 2 can be divided into two groups: geographically-constrained campaigns and campaigns not geographically-constrained (see Figure 10). The former are campaigns having location constraint(s) defined by the campaign authors through the Citizense campaign manager (for an example, see Figure 2 and Section 4.2.1): a data collectors can only download (i.e., each time he refreshes the list of available campaigns) and submit results for these campaigns if he complies with the defined location constraint(s) (i.e., he is inside the specified area(s)). In contrast, the latter are campaigns that do not have such location constraint(s): data collectors can download them and submit the results regardless of their current location. These campaigns which are not geographically constrained can be further divided into two sub-groups (see Figure 10): campaigns on a topic having a clear geographic boundary (e.g., a campaign on the city’s only tram line, which has a fixed defined route), later referred to as geographically-related campaigns; and campaigns on a topic that does not have a geographic boundary (e.g., a campaign on the issue of citizen participation or the use of digital technologies), later referred to as geographically-neutral campaigns. Based on this classification, there are one geographically-constrained campaign, 10 geographically-related campaigns and 11 geographically-neutral campaigns (see Table 2 for details of these campaigns).
As campaigns geographically constrained by the Citizense framework restrict responses to originate from specific area(s), they are not suitable to study the spatial distribution of responses. On the other hand, campaigns that are not geographically constrained leave participants free to submit responses anywhere in or outside the city; they are thus suitable to study the spatial distribution of responses in order to detect possible patterns. Due to the variety of the campaign and their content, we expect to see the different spatial distributions of the submissions from different campaigns. Specifically, we suspect a certain amount of submissions to fall within the boundaries of the geographically-related campaigns, reflecting the fact that the data collectors’ current context (i.e., location) influences his participation behavior. We thus compare the spatial distributions of submissions from geographically-related campaigns to those of geographically-neutral campaigns. To do so, we first formally define the geographic boundaries of the former campaigns. We then propose the on-target ratio as the number of submissions that fall within the boundary of a geographically-related campaign. Finally, we compare the on-target ratio among the different geographically-related campaigns.
The boundary of a geographically-related campaign is the buffers surrounding the basic geographic shapes such as a point, polyline and polygon, depending on the topic of the campaign in question. For example, the campaign “City tram line” about Castellón’s only tram line has its buffer in the form of a polygon surrounding a polyline, which represents the tram route. Similarly, the campaign “Regional train service” has its buffer in the form of polygon and circles surrounding the polyline and points which represent the railroad and the stations, respectively. The campaigns “University campus” and “Illegal graffiti” have the buffers encompassing the polygons representing the university campus and the city border, respectively. For our analysis, we select the initial buffer distance d = 100 m and then we then gradually increase it to 200 m and 400 m (see Figure 11b). There are several reasons behind this selection. First, we note that the embedded GPS receivers may have an error of 5 m in ideal conditions and cell tower triangulation (used in low power mode in Android or when GPS is not available) often has accuracy of a few hundreds of meters; these figures probably increase in less favorable conditions. Consequently, we need values for the buffer which are significantly bigger in order to compensate for these errors. Second, we seek to capture the submissions close to the geographic context of the campaign (i.e., the tram line, the station, the university campus) as these submissions are likely made due to the data collectors’ preceding activities (e.g., commuting, taking classes in the university), hence the distances of 200 m and 400 m are reasonable (e.g., capturing users who perform the campaign while walking away or being driven away from the tram stop or train station). Third, taking into account the length of a typical campaign (i.e., six to eight tasks), the required time to complete such campaign is around 1 min; this time can be longer if the data collectors elaborate their answers and many data collectors did so (for an example, see Figure 5a). Combined with the different transportation modes of the data collectors (i.e., walking, personal car, public bus), the distances of 200 m and 400 m give data collectors sufficient time to complete these campaigns. Finally, the value of 400 m is a typical distance for the catchment used in transportation engineering [73].
From visual inspection, we have identified a difference in the spatial distribution of the submissions between geographically-related campaigns and geographically-neutral campaigns. Specifically, it is observed that the former have many of their submissions falling in the buffer related to the campaigns’ topics; this observation will be quantified using the on-target ratio (introduced later in the text). For example, the campaign “City tram line” (campaign 14 in Table 2) has several submissions in the vicinity of the tram route (see Figure 11b); coupled with the submissions’ timestamps, it can be inferred that these submissions were made when the corresponding data collectors were using or recently used the tram service. This finding is consistent with the data collectors’ temporal patterns, which showed peeks during typical commute times (see Section 5.4). In contrast, the campaign “Citizen participation” is geographically-neutral, as its topic does not have a clear geographic boundary, and shows submissions spread over the city (see Figure 11a) and the region.
To quantify this result, we propose a campaign’s on-target ratio as the ratio between the number of submissions falling in the campaign’s buffer according to distance d, and the total number of submissions (with GPS location) of that campaign. This ratio shows how much the submissions are geographically concentrated in the campaign’s buffer, or, in other words, in the geographical neighborhood of the topic of the campaign. Table 3 details the on-target ratios of the four geographically-related campaigns (i.e., city tram line, regional train service, the intermodal station, university campus), with the different buffer distances d = 100 m, 200 m and 400 m. These campaigns were selected among the 13 geographically-related campaigns as their buffers cover a small area of the city or the region (in contrast to the other campaigns which cover the whole city of Castellón), and thus they allow the study of data collectors’ spatial behavior with relatively high accuracy. For comparison purposes, we include the geographically-neutral campaign “Respect” (campaign 12 in Table 2) for each geographically-related campaign, computing the on-target ratio with the same geographical buffer as the corresponding geographically-related campaigns (see Table 3). The “Respect” campaign was chosen because it has a similar number of submissions and duration (in terms of days) compared with the four geographically-related campaigns in Table 3.
Table 3 suggests that, in general, a significant part of the data collectors tend to answer geographically-related campaigns when they are within the campaigns’ buffer areas, even if these areas are small compared to the whole city or region. Remarkably, even when considering a buffer distance of only 100 meters, a high percentage of submissions already falls within the buffer area, subsequently doubling the buffer distance (i.e., from d = 100 to 200, and from d = 200 to 400) in comparison only slightly increases the on-target ratios (see Table 3). This denotes that a significant amount of people submit results in an area close by (d = 100 m) the topic of geographically-related campaigns, and the effect decreases the farther away. In comparison, the corresponding on-target ratio of the “Respect” campaign, which is geographically neutral, is very low, which shows that the found spatial correlation for geographically-related campaigns is not a general effect. In other words, the submissions of a geographically-neutral campaign are spread across the city (or the province); they do not cluster around any specific geographic feature. Evidently, if the buffer distance is increased by large amounts (e.g., a few kilometers, the whole city), the on-target ratios for geographically-related campaigns increases significantly. However, we argue that this effect is no longer due to the topic of the geographically-related campaign, but simply because a larger area of the city/region is covered. Table 3 also suggests that for geographically-related campaigns, the on-target ratio is relatively high (in many cases over 50%), for all different topics addressed. Therefore, it can be inferred that the decision to open and complete a campaign can be influenced by the proximity to (the buffer of) the topic of the corresponding campaign.
Next to using buffers, the on-target ratio can also be computed using the concept of catchment, which is widely used in the field of transportation engineering [74]. For example, in the case of the “City tram line” campaign, the catchment-based on-target ratio is defined as the ratio between the number of submissions falling in the catchment of 400 m (see Figure 12a), which is a typical value for transit stop [73], and the total number of submissions (with GPS location) of that campaign. Consequently, this catchment-based on-target ratio is 52.77%, which is slightly lower than the on-target ratios using the corresponding tram route’s buffer (see Table 3). For the sake of comparison, we also compute the on-target ratio of this campaign using the 400-meter circular buffer [74] around the tram stations (see Figure 12b) and get the value of 58.33%. Although slightly less outspoken than the corresponding values for the 400 m buffer (see Table 3), both catchment-based and buffer-based on-target ratios support that a significant amount of data collectors have their decision to open and complete the “City tram line” campaign influenced by the proximity to the tram line.
For the campaigns “regional train service” and “the intermodal station”, we use the same value of 400 m for the catchment as suggested in [73]. The catchment-based on-target ratios for campaigns “regional train service” and “the intermodal station” are 22.95% and 44.44 %. It is observed that, for the campaign “regional train service”, its catchment-based on-target ratio drops considerably compared with the corresponding on-target ratio using the buffer of the railroad network as several submissions made while the train is moving (on the rail track and between the stations several kilometers away from each other) are excluded from the computation of the former. In conclusion, using the buffer-based and catchment-based on-target ratios and for all three considered transport-related campaigns, it can be concluded that a significant amount of data collectors are influenced in their decision to open and complete a campaign by the proximity to the geographical context of that campaign.

5.6. Limitations

First of all, our deployment had mostly students as participants; this homogeneity must be taken into account when drawing conclusions on their participation and behaviors, and further studies should confirm the findings for a more heterogeneous audience. Secondly, even though we do not anticipate deviations in the overall results, the lack of a mobile application for iOS devices has excluded part of the target population to collect data and input for our analysis. Finally, for our spatial analysis, only geo-tagged submissions could be considered, which amount to 70.13% of submissions (1834 out of 2615 submissions). This limitation, however, is shared with any other study using mobile device produced data (e.g., tweets), as users always have the option to disable their location sensor.

6. Conclusions and Future Work

6.1. Conclusions

This article first reviewed Citizense—a generic participatory sensing framework that supports campaign authors and data collectors to respectively define the data collecting process of a participatory sensing campaigns, and collect the required data. The framework combines and extends features of existing participatory sensing applications. Using Citizense, a real-world deployment with 359 participants, who have diverse demographical and educational backgrounds, was performed, in order to demonstrate Citizense meets its goals, and, more importantly, to study the participants’ spatial and temporal behavior when collecting data. For the former, the deployment showed that the framework’s campaign editor effectively enabled campaign authors to intuitively design their desired participatory sensing campaigns that collect meaningful city-related information on one hand, and that the framework’s mobile application effectively assisted data collectors in gathering various types of data through their mobile devices on the other hand. This result reaffirms the potentials, applicabilities and effectiveness of multi-purpose participatory sensing frameworks, with Citizense as an example, in collecting a large variety of data in different scenarios [30,31].
Based on the results of campaigns receiving most interactions from data collectors, the analysis of the data collectors’ spatial and temporal behavior revealed several patterns. First, and perhaps somewhat surprisingly, data collectors are much more active during weekdays compared to weekends. Second, data collectors as a whole tend to contribute data during their (evening) free time. However, for certain campaigns (e.g., campaigns related to public transportation), a different pattern emerges. Specifically, the submissions were made when data collectors found these campaigns relevant to their current context and activities: a considerable portion of the submissions were made during daytime when they are involved in the transportation activities. These observations provide new insights into the data collectors’ temporal pattern, showing when they actively take part in their participatory sensing activities. Third, we discern two groups of data collectors: a smaller group of active data collectors, who regularly use the mobile application (the most active participants on average twice daily), and a larger number of regular data collectors, who use the mobile application less frequently to collect data. This uneven distribution of interactions in participatory sensing matches with the distribution of users’ participation in other domains in which users voluntarily contribute their resources [21], data and efforts [19,20,71]. Furthermore, active data collectors perform less campaigns in each session, while regular data collectors perform more campaigns in a session. Overall, active data collectors collect more data. Fourth, when data collectors are not geographically confined when downloading campaigns and submitting their results, their submissions are spread across the city (or the province). However, if a campaign has a geographical context (i.e., a topic with clear geographic boundaries), it is observed that a significant part of that campaign’s submissions (more than 50% in many cases) are within the buffer of that campaign’s geographical context, even when the buffer is relatively small and data collectors are geographically free to submit their data anywhere. This suggests that a substantial part of the data collectors are bound to the geographical context of a campaign; data collectors complete these campaigns when the campaigns’ contexts are geographically relevant to them. The observed behavior provides new understandings in how data collectors spatially behave in participatory sensing, which is under-investigated in the current state of the art. Interestingly, from the initial 100-m buffer, the on-target ratios (submissions within the buffer w.r.t. all submissions) of such campaigns do not increase significantly with increasing buffer size (unless the buffer is enlarged considerably), denoting that the geographical context effect is strongest close by the topic of the campaign and weakens the further away. These observations hold for several geographically-related campaigns, regardless of their topic and contents.

6.2. Future Work

This work opens several avenues for future research, aimed at further deepening our knowledge of temporal and spatial behavior of participatory sensing users. For example, the data collectors’ behavior identified in this work can be analyzed against their mobility model to find the places/times in which more contributions can be made. Secondly, it is desirable to study the change in data collectors’ behaviors when they are subjected to different factors such as the length of the participatory sensing activities, the presence of (different types of) incentive and the general public’s feedback on their collected data. Thirdly, the comparison between data quality produced by active and regular contributors can provide more insights in their behavior and motivation when taking part in participatory sensing. Finally, finding correlations between data quality and spatial/temporal submissions patterns could generally improve the quality of results. All of these research directions will gain more insights into the behavior of data collectors from different angles and greatly benefit the ongoing research in the field of participatory sensing. Next to further deepening our understanding of spatial/temporal user behavior, a large research avenue lies in using the generated insights to improve the participatory sensing process. For example, promotional campaigns to attract new users may be focused on areas where existing users frequently participate (or contrary, focus on citizens inhabiting less covered areas). As another example, based on the segmentation of the data collectors, each group of data collectors can have a tailored communication strategy. The participatory sensing application might focus on active data collectors and suggest them to contribute during off-peak hours as they are more likely to comply. In the same way, persuasive notifications/reminders can be sent to data collectors with less-than-average contribution to ask them for more activities (e.g., "We haven’t heard from you for some time. Would you like to participate in Citizense campaigns again? Your submissions are very much appreciated"). Developers might enhance the functionality of a participatory sensing application by introducing time- and location-dependent notifications, which can be used by campaign authors to stimulate submissions during certain times, or in certain regions. Similarly, developers can include time- and location-dependent incentives, which adjust the amount of incentive based on the temporal (e.g., striving for more submissions during off-peak times) and spatial desirableness (e.g., striving for full spatial coverage) of the submissions, respectively.
We wholeheartedly would like to invite the research community to perform similar and further analyses on their own participatory sensing data, and help us to gain a better understanding of spatial and temporal user behavior in participatory sensing. Next, we would like to invite participatory sensing organizers to report on usage of spatio-temporal patterns to improve their participatory sensing campaigns.

Author Contributions

N.M.K. reviewed the literature and performed the data analysis; N.M.K. and S.C. designed and implemented the software, carried out the deployment and wrote the manuscript.

Funding

This research was funded by the European Commission GEO-C project (H2020-MSCA-ITN-2014, Grant Agreement No. 642332, http://www.geo-c.eu/). A part of this research was funded by the Association of Geographic Information Laboratories in Europe (AGILE). The APC was funded by the GEO-C. Sven Casteleyn is funded by the Ramón y Cajal Programme of the Spanish government, Grant No. RYC-2014-16606.

Conflicts of Interest

The authors declare no conflict of interest. The funding sponsors had no role in the design of the study; in the collection, analyses, or interpretation of data; in the writing of the manuscript, and in the decision to publish the results.

References

  1. Comber, A.; Schade, S.; See, L.; Mooney, P.; Foody, G. Semantic analysis of citizen sensing, crowdsourcing and VGI. In Proceedings of the 17th AGILE International Conference, “Connecting a Digital Europe Through Location and Place”, Castellón, Spain, 3–6 June 2014. [Google Scholar]
  2. Goodchild, M.F. Citizens as sensors: The world of volunteered geography. GeoJournal 2007, 69, 211–221. [Google Scholar] [CrossRef]
  3. Haklay, M. How good is volunteered geographical information? A comparative study of OpenStreetMap and Ordnance Survey datasets. Environ. Plan. B Plan. Des. 2010, 37, 682–703. [Google Scholar] [CrossRef]
  4. Guo, B.; Wang, Z.; Yu, Z.; Wang, Y.; Yen, N.Y.; Huang, R.; Zhou, X. Mobile crowd sensing and computing: The review of an emerging human-powered sensing paradigm. ACM Comput. Surv. (CSUR) 2015, 48, 7. [Google Scholar] [CrossRef]
  5. Sherchan, W.; Jayaraman, P.P.; Krishnaswamy, S.; Zaslavsky, A.; Loke, S.; Sinha, A. Using on-the-move mining for mobile crowdsensing. In Proceedings of the 2012 IEEE 13th International Conference on Mobile Data Management (MDM), Bengaluru, India, 23–26 July 2012; pp. 115–124. [Google Scholar]
  6. Maisonneuve, N.; Stevens, M.; Niessen, M.E.; Steels, L. NoiseTube: Measuring and mapping noise pollution with mobile phones. In Information Technologies in Environmental Engineering; Springer: Berlin/Heidelberg, Germany, 2009; pp. 215–228. [Google Scholar] [Green Version]
  7. Schweizer, I.; Bärtl, R.; Schulz, A.; Probst, F.; Mühläuser, M. NoiseMap-real-time participatory noise maps. In Proceedings of the Second International Workshop on Sensing Applications on Mobile Phones, Bethesda, MD, USA, 28 June–1 July 2011. [Google Scholar]
  8. Mosquito Alert. 2018. Available online: http://www.mosquitoalert.com/ (accessed on 30 June 2018).
  9. Malek, R.; Tattoni, C.; Ciolli, M.; Corradini, S.; Andreis, D.; Ibrahim, A.; Mazzoni, V.; Eriksson, A.; Anfora, G. Coupling Traditional Monitoring and Citizen Science to Disentangle the Invasion of Halyomorpha halys. ISPRS Int. J. Geo-Inf. 2018, 7, 171. [Google Scholar] [CrossRef]
  10. Hasenfratz, D.; Saukh, O.; Sturzenegger, S.; Thiele, L. Participatory air pollution monitoring using smartphones. In Proceedings of the 1st International Workshop on Mobile Sensing: From Smartphones and Wearables to Big Data, Beijing, China, 16–20 April 2012. [Google Scholar]
  11. Mendez, D.; Perez, A.J.; Labrador, M.A.; Marron, J.J. P-sense: A participatory sensing system for air pollution monitoring and control. In Proceedings of the 2011 IEEE International Conference on Pervasive Computing and Communications Workshops (PERCOM Workshops), Seattle, WA, USA, 21–25 March 2011; pp. 344–347. [Google Scholar]
  12. Khan, W.Z.; Xiang, Y.; Aalsalem, M.Y.; Arshad, Q. Mobile phone sensing systems: A survey. IEEE Commun. Surv. Tutor. 2013, 15, 402–427. [Google Scholar] [CrossRef]
  13. Tilak, S. Real-world deployments of participatory sensing applications: Current trends and future directions. ISRN Sens. Netw. 2013, 2013, 583165. [Google Scholar] [CrossRef]
  14. Khoi, N.M.; Rodríguez-Pupo, L.E.; Casteleyn, S. Citizense—A generic user-oriented participatory sensing framework. In Proceedings of the 2017 International Conference on Selected Topics in Mobile and Wireless Networking (MoWNeT), Avignon, France, 17–19 May 2017; pp. 1–8. [Google Scholar]
  15. Silva, T.H.; De Melo, P.O.V.; Almeida, J.M.; Loureiro, A.A. Large-scale study of city dynamics and urban social behavior using participatory sensing. IEEE Wirel. Commun. 2014, 21, 42–51. [Google Scholar] [CrossRef]
  16. Wilkinson, D.M.; Huberman, B.A. Assessing the value of coooperation in wikipedia. arXiv, 2007; arXiv:cs/0702140. [Google Scholar]
  17. Callahan, E.S.; Herring, S.C. Cultural bias in Wikipedia content on famous persons. J. Am. Soc. Inf. Sci. Technol. 2011, 62, 1899–1915. [Google Scholar] [CrossRef]
  18. Royal, C.; Kapila, D. What’s on Wikipedia, and what’s not...? Assessing completeness of information. Soc. Sci. Comput. Rev. 2009, 27, 138–148. [Google Scholar] [CrossRef]
  19. Hochmair, H.H.; Zielstra, D. Analysing user contribution patterns of drone pictures to the dronestagram photo sharing portal. J. Spat. Sci. 2015, 60, 79–98. [Google Scholar] [CrossRef]
  20. Juhász, L.; Hochmair, H.H. User contribution patterns and completeness evaluation of Mapillary, a crowdsourced street level photo service. Trans. GIS 2016, 20, 925–947. [Google Scholar] [CrossRef]
  21. Hughes, D.; Coulson, G.; Walkerdine, J. Free riding on Gnutella revisited: The bell tolls? IEEE Distrib. Syst. Online 2005, 6. [Google Scholar] [CrossRef]
  22. Khoi, N.M.; Casteleyn, S.; Moradi, M.M.; Pebesma, E. Do Monetary Incentives Influence Users’ Behavior in Participatory Sensing? Sensors 2018, 18, 1426. [Google Scholar] [CrossRef] [PubMed]
  23. Neis, P.; Zielstra, D. Recent developments and future trends in volunteered geographic information research: The case of OpenStreetMap. Future Internet 2014, 6, 76–106. [Google Scholar] [CrossRef] [Green Version]
  24. Guo, B.; Yu, Z.; Zhou, X.; Zhang, D. From participatory sensing to mobile crowd sensing. In Proceedings of the 2014 IEEE International Conference on IEEE Pervasive Computing and Communications Workshops (PERCOM Workshops), Budapest, Hungary, 24–28 March 2014; pp. 593–598. [Google Scholar]
  25. Wang, J.; Liu, X.; Lu, R.; Wang, C.; Wang, C. Poster: Interactive Platform for Urban Bird Studies Using Participatory Sensing. In Proceedings of the 14th Annual International Conference on Mobile Systems, Applications, and Services Companion, Singapore, 25–30 June 2016; p. 85. [Google Scholar]
  26. Aubry, E.; Silverston, T.; Lahmadi, A.; Festor, O. CrowdOut: A mobile crowdsourcing service for road safety in digital cities. In Proceedings of the 2014 IEEE International Conference on Pervasive Computing and Communications Workshops (PERCOM Workshops), Budapest, Hungary, 24–28 March 2014; pp. 86–91. [Google Scholar]
  27. Hussin, M.F.B.; Jusoh, M.H.; Sulaiman, A.A.; Aziz, M.Z.A.; Othman, F.; Ismail, M.H.B. Accident reporting system using an iOS application. In Proceedings of the 2014 IEEE Conference on Systems, Process and Control (ICSPC), Kuala Lumpur, Malaysia, 12–14 December 2014; pp. 13–18. [Google Scholar]
  28. Open Signal. 2018. Available online: https://opensignal.com/ (accessed on 30 June 2018).
  29. Miluzzo, E.; Papandrea, M.; Lane, N.D.; Sarroff, A.M.; Giordano, S.; Campbell, A.T. Tapping into the vibe of the city using vibn. In Proceedings of the 1st International Symposium on Social and Community Intelligence (SCI’11), co-located with 13th International Conference on Ubiquitous Computing (Ubicomp’11), Beijing, China, 18 September 2011. [Google Scholar]
  30. Tangmunarunkit, H.; Hsieh, C.K.; Longstaff, B.; Nolen, S.; Jenkins, J.; Ketcham, C.; Selsky, J.; Alquaddoomi, F.; George, D.; Kang, J.; et al. Ohmage: A general and extensible end-to-end participatory sensing platform. ACM Trans. Intell. Syst. Technol. (TIST) 2015, 6, 38. [Google Scholar] [CrossRef]
  31. Brunette, W.; Sundt, M.; Dell, N.; Chaudhri, R.; Breit, N.; Borriello, G. Open data kit 2.0: Expanding and refining information services for developing regions. In Proceedings of the 14th Workshop on Mobile Computing Systems and Applications, Jekyll Island, Georgia, 26–27 February 2013; p. 10. [Google Scholar]
  32. Pavlov, D.V. Hive: An Extensible and Scalable Framework for Mobile Crowdsourcing. Ph.D. Thesis, Imperial College London, London, UK, 2013. [Google Scholar]
  33. Restuccia, F.; Das, S.K.; Payton, J. Incentive mechanisms for participatory sensing: Survey and research challenges. ACM Trans. Sens. Netw. (TOSN) 2016, 12, 13. [Google Scholar] [CrossRef]
  34. Gao, H.; Liu, C.H.; Wang, W.; Zhao, J.; Song, Z.; Su, X.; Crowcroft, J.; Leung, K.K. A survey of incentive mechanisms for participatory sensing. IEEE Commun. Surv. Tutor. 2015, 17, 918–943. [Google Scholar] [CrossRef]
  35. Reddy, S.; Estrin, D.; Srivastava, M. Recruitment framework for participatory sensing data collections. In Proceedings of the International Conference on Pervasive Computing, Helsinki, Finland, 17–20 May 2010; pp. 138–155. [Google Scholar]
  36. Reddy, S.; Shilton, K.; Burke, J.; Estrin, D.; Hansen, M.; Srivastava, M. Using context annotated mobility profiles to recruit data collectors in participatory sensing. In Proceedings of the International Symposium on Location-and Context-Awareness, Tokyo, Japan, 7–8 May 2009; pp. 52–69. [Google Scholar]
  37. Havlik, D.; Egly, M.; Huber, H.; Kutschera, P.; Falgenhauer, M.; Cizek, M. Robust and trusted crowd-sourcing and crowd-tasking in the Future Internet. In Proceedings of the International Symposium on Environmental Software Systems, Neusiedl am See, Austria, 9–11 October 2013; pp. 164–176. [Google Scholar]
  38. Li, R.Y.; Liang, S.H.; Lee, D.W.; Byon, Y.J. TrafficPulse: A mobile GISystem for transportation. In Proceedings of the First ACM SIGSPATIAL International Workshop on Mobile Geographic Information Systems, Redondo Beach, CA, USA, 6 November 2012; pp. 9–16. [Google Scholar]
  39. Kazemi, L.; Shahabi, C. A privacy-aware framework for participatory sensing. ACM Sigkdd Explor. Newslett. 2011, 13, 43–51. [Google Scholar] [CrossRef]
  40. Rana, R.K.; Chou, C.T.; Kanhere, S.S.; Bulusu, N.; Hu, W. Ear-phone: An end-to-end participatory urban noise mapping system. In Proceedings of the 9th ACM/IEEE International Conference on Information Processing in Sensor Networks, Stockholm, Sweden, 12–16 April 2010; pp. 105–116. [Google Scholar]
  41. Ruge, L.; Altakrouri, B.; Schrader, A. Soundofthecity-continuous noise monitoring for a healthy city. In Proceedings of the 2013 IEEE International Conference on Pervasive Computing and Communications Workshops (PERCOM Workshops), San Diego, CA, USA, 18–22 March 2013; pp. 670–675. [Google Scholar]
  42. Silva, T.H.; de Melo, P.O.V.; Viana, A.C.; Almeida, J.M.; Salles, J.; Loureiro, A.A. Traffic condition is more than colored lines on a map: Characterization of waze alerts. In Proceedings of the International Conference on Social Informatics, Kyoto, Japan, 25–27 November 2013; pp. 309–318. [Google Scholar]
  43. Carreras, I.; Miorandi, D.; Tamilin, A.; Ssebaggala, E.R.; Conci, N. Matador: Mobile task detector for context-aware crowd-sensing campaigns. In Proceedings of the 2013 IEEE International Conference on Pervasive Computing and Communications Workshops (PERCOM Workshops), San Diego, CA, USA, 18–22 March 2013; pp. 212–217. [Google Scholar]
  44. Higgins, C.I.; Williams, J.; Leibovici, D.G.; Simonis, I.; Davis, M.J.; Muldoon, C.; van Genuchten, P.; O’Hare, G.; Wiemann, S. Citizen observatory web (cobweb): A generic infrastructure platform to facilitate the collection of citizen science data for environmental monitoring. Int. J. Spat. Data Infrastruct. Res. 2016, 11, 20–48. [Google Scholar]
  45. Mergel, I. Distributed Democracy: Seeclickfix.com for Crowdsourced Issue Reporting. 2018. Available online: https://kops.uni-konstanz.de/handle/123456789/36359 (accessed on 30 June 2018).
  46. Walravens, N. Validating a business model framework for smart city services: The case of fixmystreet. In Proceedings of the 2013 27th International Conference on Advanced Information Networking and Applications Workshops (WAINA), Barcelona, Spain, 25–28 March 2013; pp. 1355–1360. [Google Scholar]
  47. Tsampoulatidis, I.; Ververidis, D.; Tsarchopoulos, P.; Nikolopoulos, S.; Kompatsiaris, I.; Komninos, N. ImproveMyCity: An open source platform for direct citizen-government communication. In Proceedings of the 21st ACM international conference on Multimedia, Barcelona, Spain, 21–25 October 2013; pp. 839–842. [Google Scholar]
  48. Sanchez, L.; Gutierrez, V.; Galache, J.A.; Sotres, P.; Santana, J.R.; Muñoz, L. Engaging Individuals in the Smart City Paradigm: Participatory Sensing and Augmented Reality. Interdiscip. Stud. J. 2014, 3, 129–142. [Google Scholar]
  49. Mukherjee, T.; Chander, D.; Mondal, A.; Dasgupta, K.; Kumar, A.; Venkat, A. CityZen: A cost-effective city management system with incentive-driven resident engagement. In Proceedings of the 2014 IEEE 15th International Conference on Mobile Data Management (MDM), Brisbane, Australia, 14–18 July 2014; Volume 1, pp. 289–296. [Google Scholar]
  50. Das, T.; Mohan, P.; Padmanabhan, V.N.; Ramjee, R.; Sharma, A. PRISM: Platform for remote sensing using smartphones. In Proceedings of the 8th International Conference on Mobile Systems, Applications, and Services, San Francisco, CA, USA, 15–18 June 2010; pp. 63–76. [Google Scholar]
  51. Ra, M.R.; Liu, B.; La Porta, T.F.; Govindan, R. Medusa: A programming framework for crowd-sensing applications. In Proceedings of the 10th International Conference on Mobile Systems, Applications, and Services, Low Wood Bay, Lake District, UK, 25–29 June 2012; pp. 337–350. [Google Scholar]
  52. Kim, S.; Mankoff, J.; Paulos, E. Sensr: Evaluating a flexible framework for authoring mobile data-collection tools for citizen science. In Proceedings of the 2013 Conference on Computer Supported Cooperative Work, San Antonio, TX, USA, 23–27 February 2013; pp. 1453–1462. [Google Scholar]
  53. Katsomallos, M.; Lalis, S. EasyHarvest: Supporting the deployment and management of sensing applications on smartphones. In Proceedings of the 2014 IEEE International Conference on Pervasive Computing and Communications Workshops (PERCOM Workshops), Budapest, Hungary, 24–28 March 2014; pp. 80–85. [Google Scholar]
  54. Massung, E.; Coyle, D.; Cater, K.F.; Jay, M.; Preist, C. Using crowdsourcing to support pro-environmental community activism. In Proceedings of the SIGCHI Conference on Human Factors in Computing Systems, Paris, France, 27 April–2 May 2013; pp. 371–380. [Google Scholar]
  55. Arakawa, Y.; Matsuda, Y. Gamification mechanism for enhancing a participatory urban sensing: Survey and practical results. J. Inf. Process. 2016, 24, 31–38. [Google Scholar] [CrossRef]
  56. Jaimes, L.G.; Vergara-Laurens, I.J.; Raij, A. A survey of incentive techniques for mobile crowd sensing. IEEE Internet Things J. 2015, 2, 370–380. [Google Scholar] [CrossRef]
  57. Shen, Y.T.; Shiu, Y.S.; Liu, W.K.; Lu, P.W. The Participatory Sensing Platform Driven by UGC for the Evaluation of Living Quality in the City. In Proceedings of the International Conference on Human Interface and the Management of Information, Vancouver, BC, Canada, 9–14 July 2017; pp. 516–527. [Google Scholar]
  58. Grasso, V.; Crisci, A.; Morabito, M.; Nesi, P.; Pantaleo, G. Public crowdsensing of heat waves by social media data. Adv. Sci. Res. 2017, 14, 217–226. [Google Scholar] [CrossRef] [Green Version]
  59. Li, C.; Liu, Y.; Haklay, M. Participatory soundscape sensing. Landsc. Urban Plan. 2018, 173, 64–69. [Google Scholar] [CrossRef]
  60. Sultan, J.; Ben-Haim, G.; Haunert, J.H.; Dalyot, S. Extracting spatial patterns in bicycle routes from crowdsourced data. Trans. GIS 2017, 21, 1321–1340. [Google Scholar] [CrossRef]
  61. Alt, F.; Shirazi, A.S.; Schmidt, A.; Kramer, U.; Nawaz, Z. Location-based crowdsourcing: extending crowdsourcing to the real world. In Proceedings of the 6th Nordic Conference on Human-Computer Interaction: Extending Boundaries, Reykjavik, Iceland, 16–20 October 2010; pp. 13–22. [Google Scholar]
  62. Geo-C Joint Doctorate Program. Open City Toolkit. 2018. Available online: http://giv-oct.uni-muenster.de:5000/ (accessed on 30 June 2018).
  63. The Apache Software Foundation. Apache License Version 2.0; The Apache Software Foundation: Forest Hill, MD, USA, 2018. [Google Scholar]
  64. Panopoulou, E.; Tambouris, E.; Tarabanis, K. Success factors in designing eParticipation initiatives. Inf. Organ. 2014, 24, 195–213. [Google Scholar] [CrossRef]
  65. Pina, V.; Torres, L.; Royo, S. Comparing online with offline citizen engagement for climate change: Findings from Austria, Germany and Spain. Gov. Inf. Q. 2017, 34, 26–36. [Google Scholar] [CrossRef]
  66. Budde, M.; Schankin, A.; Hoffmann, J.; Danz, M.; Riedel, T.; Beigl, M. Participatory Sensing or Participatory Nonsense?: Mitigating the Effect of Human Error on Data Quality in Citizen Science. Proc. ACM Interact. Mob. Wearable Ubiquitous Technol. 2017, 1, 39. [Google Scholar] [CrossRef]
  67. Reddy, S.; Estrin, D.; Hansen, M.; Srivastava, M. Examining micro-payments for participatory sensing data collections. In Proceedings of the 12th ACM International Conference on Ubiquitous Computing, Copenhagen, Denmark, 26–29 September 2010; pp. 33–36. [Google Scholar]
  68. Anderson, C. The Long Tail: Why the Future of Business Is Selling More for Less; Hyperion: New York, NY, USA, 2006. [Google Scholar]
  69. Hinz, O.; Eckert, J.; Skiera, B. Drivers of the long tail phenomenon: an empirical analysis. J. Manag. Inf. Syst. 2011, 27, 43–70. [Google Scholar] [CrossRef]
  70. Pan, B.; Li, X.R. The long tail of destination image and online marketing. Ann. Tour. Res. 2011, 38, 132–152. [Google Scholar] [CrossRef]
  71. Geiger, R.S.; Halfaker, A. Using edit sessions to measure participation in Wikipedia. In Proceedings of the 2013 Conference on Computer supported cooperative Work, San Antonio, TX, USA, 23–27 February 2013; pp. 861–870. [Google Scholar]
  72. Wang, Y.; Niiya, M.; Mark, G.; Reich, S.M.; Warschauer, M. Coming of age (digitally): An ecological view of social media use among college students. In Proceedings of the 18th ACM Conference on Computer Supported Cooperative Work & Social Computing, Vancouver, BC, Canada, 14–18 March 2015; pp. 571–582. [Google Scholar]
  73. Daniels, R.; Mulley, C. Explaining walking distance to public transport: The dominance of public transport supply. J. Transp. Land Use 2013, 6, 5–20. [Google Scholar] [CrossRef]
  74. Andersen, J.L.E.; Landex, A. Catchment areas for public transport. WIT Trans. Built Environ. 2008, 101, 175–184. [Google Scholar] [Green Version]
Figure 1. The architecture of the Citizense framework and its main information flows.
Ijgi 07 00344 g001
Figure 2. The graphical campaign editor. Creating a campaign, step 1: specifying the various parameters of the campaign; for example, location constraints are the shaded areas (i.e., near a point of interest and along a specific road) in the map.
Ijgi 07 00344 g002
Figure 3. The graphical campaign editor. Creating a campaign, step 2: defining the atomic sensing tasks and their transitions; red and blue arrows represent conditional and unconditional transitions, respectively. In this figure, a loop between task Q10 and Q11 is formed by combining the two types of transition.
Ijgi 07 00344 g003
Figure 4. The client mobile application. From left to right, (a) an atomic sensing task; (b) the list of available campaigns; (c) the details of a participant’s account; and (d) the status of the submissions.
Ijgi 07 00344 g004
Figure 5. Example of the submissions during the deployment displayed by the Citizense result visualizer. (a) the different text answers to a text-input task; (b) the pictures and locations of the graffiti gathered by data collectors.
Ijgi 07 00344 g005
Figure 6. An illustrative example of requests sent by a typical data collector over time, each request is represented by a blue dot. A session is a cluster of requests, marked by the red ellipses.
Ijgi 07 00344 g006
Figure 7. The number of sessions (blue) and average number of request per session (red) for every data collector throughout the deployment considering a separation time x = 600 s, decreasingly ranked according to the number of sessions.
Ijgi 07 00344 g007
Figure 8. The distribution of all received requests and all submissions from 22 campaigns in Table 2 throughout the deployment rendered in a 24-h time frame.
Ijgi 07 00344 g008
Figure 9. The distribution of submissions from different campaigns throughout the deployment rendered in a 24-h time frame. (a) the campaigns having different patterns than the overall submission pattern; (b) the campaigns having a similar pattern to the overall submission pattern; the number of submissions from campaign “Citizen participation” has been scaled down to fit the chart.
Ijgi 07 00344 g009
Figure 10. The taxonomy of campaigns used in the Citizense deployment.
Ijgi 07 00344 g010
Figure 11. The data collectors’ spatial pattern in different campaigns, with red points representing the submissions. (a) the map extent shows submissions from the geographically-neutral campaign addressing the topic of citizen participation (campaign 1 in Table 2), with the black rectangular frame covering the map extent on the right side; (b) the map extent shows submissions from the geographically-related campaign asking feedback on the city’s only tram line (campaign 14 in Table 2), with the blue line representing the tram route and the purple area representing the buffer of the tram route (buffer distance d = 400 m). This map extent includes 34 submissions, equivalent to 94.44% of all location-enabled submissions from this campaign.
Ijgi 07 00344 g011
Figure 12. The submissions of the campaign “City tram line”, represented by the red points. (a) the 400-m catchments around the tram stations; (b) the 400-m circular buffers around the tram stations.
Ijgi 07 00344 g012
Table 1. Analyzing the selected participatory sensing applications.
NameTimeThemeOriginStatusTool FlexibilityIncentiveSelection CriteriaResult DeliveryIdentity of ParticipantsCampaign Flexibility
Earphone [40]2010NoiseAcademiaPrototypeNoExperience pointNoImmediateAnonymousNo
NoiseTube [6]2009NoiseAcademiaCompleteNoNoNoImmediateTraceableNo
SoundOfTheCity [41]2013NoiseAcademiaPrototypeNoNoNoImmediateAnonymousNo
Waze [42]2010TrafficIndustryPopularNoReputation point, rankNoImmediateTraceableNo
Matador [43]2013GeneralAcademiaPrototypePartialNoLocation, timeImmediateUnknownPartial
OpenSignal [28]2010Signal strengthIndustryPopularNoNoNoImmediateAnonymousNo
COBWEB [44]2015EnvironmentAcademiaCompletePartialNoNoFlexibleTraceablePartial
Bird Watching platform [25]2016Bird informationAcademiaPrototypeNoNoNoImmediateUnknownNo
CrowdOut [26]2014Road safetyAcademiaPrototypeNoNoNoImmediateTraceableNo
SeeClickFix [45]2008City incidentsIndustryPopularNoNoNoImmediateTraceableNo
FixMyStreet [46]2012City incidentsIndustryPopularNoNoNoImmediateTraceableNo
ImproveMyCity [47]2013City incidentsIndustryCompleteNoNoNoFlexibleUnknownNo
Pulso De La Ciudad [48]2014City incidentsAcademiaCompleteNoNoNoImmediateAnonymousNo
Cityzen [49]2014City incidentsAcademiaPrototypeNoYesNoImmediateTraceableNo
PRISM [50]2010MultipleAcademiaPrototypePartialNoLocationImmediateAnonymousPartial
Medusa [51]2012MultipleAcademiaPrototypePartialYesLocation, timeImmediateTraceablePartial
Hive [32]2013MultipleAcademiaPrototypePartialNoLocationImmediateTraceablePartial
Sensr [52]2013MultipleAcademiaPrototypeCompleteNoNoImmediateAnonymousPartial
OpenDataKit [31]2013MultipleAcademiaCompletePartialNoNoImmediateAnonymousPartial
EasyHarvest [53]2014MultipleAcademiaPrototypePartialNoNoFlexibleAnonymousPartial
Ohmage [30]2015MultipleAcademiaCompleteCompleteNoNoImmediateTraceableDynamic
Citizense [14]2017MultipleAcademiaPrototypeCompleteIntrinsic, extrinsicLocation, time, user profileFlexibleTraceableDynamic
Table 2. Overview of 22 campaigns with highest number of submissions and data collectors, sorted by the number of submissions.
Campaign TitleNumber of SubmissionsNumber of Data CollectorsGeographical ScopeDuration (Days)Origin
1Citizen participation370195Neutral20Organizer
2Improve University’s WiFi332147Constrained20Organizer
3Graffiti in Castellón212125Geographically-related20Organizer
4Street animal in the city19775Geographically-related20Organizer
5University campus154113Geographically-related20Organizer
6City incidents15390Geographically-related20Organizer
7Hygienic issues in the city11761Geographically-related20Organizer
8City’s cycling infrastructure10555Geographically-related20Organizer
9Professors and teaching methods10475Neutral12Participant
10Regional train service10392Geographically-related18Participant
11Leisure destination10181Neutral14Participant
12Respect8375Neutral19Participant
13The intermodal station7672Geographically-related20Participant
14City tram line7355Geographically-related16Participant
15Transport efficiency7268Neutral18Participant
16Digital technologies6449Neutral20Participant
17Street crossings6158Neutral14Participant
18Nocturnal ambiance in Castellón5244Geographically-related18Participant
19Sustainability issues4742Neutral19Participant
20Social vulnerability4635Neutral19Participant
21Sales promotion4529Neutral20Organizer
22Food consumption4141Neutral15Participant
Table 3. The on-target ratio of the geographically-related campaigns with different values of buffer distance d.
BufferCatchment
Campaign NameCampaign ContentGeographic Buffer100 m200 m400 m400 m
City tram lineThe citizens’ opinions
on the tram service
Polyline-The tram route52.77%55.55%61.11%52.77%
RespectHow people respect each otherNeutral7.69%7.69%7.69%7.69%
Regional train serviceFeedback on the current
regional train service
Polyline-The railroad network
and Points-The stations
45.90%47.54%54.09%22.95%
RespectHow people respect each otherNeutral4.61%4.61%4.61%1.53%
The intermodal stationOpinion on the current state
of the station and ways to improve it
Point-The station36.11%41.66%47.22%44.44%
RespectHow people respect
each other
Neutral0%0%0%0%
University campusHow to improve the
campus’s infrastructure
Polygon-The university campus45.09%50.98%50.98%n/a
RespectHow people respect each otherNeutral6.55%6.55%6.55%n/a

