Article

Prioritizing Abandoned Mine Lands Rehabilitation: Combining Landscape Connectivity and Pattern Indices with Scenario Analysis Using Land-Use Modeling

1
College of Resources and Environment Sciences, China Agricultural University, Beijing 100193, China
2
Key Laboratory of Arable Land Conservation (North China), Ministry of Agriculture and Rural Affairs, Beijing 100193, China
3
Key Laboratory of Agricultural Land Quality, Ministry of Natural Resources, Beijing 100193, China
4
People’s Government of Panggezhuang Township, Daxing District, Beijing 102601, China
5
College of Earth and Environmental Science, Anhui University of Science and Technology, Huainan 232001, China
*
Author to whom correspondence should be addressed.
ISPRS Int. J. Geo-Inf. 2018, 7(8), 305; https://doi.org/10.3390/ijgi7080305
Submission received: 8 June 2018 / Revised: 11 July 2018 / Accepted: 20 July 2018 / Published: 31 July 2018

Abstract

:
Connectivity modeling approaches for abandoned mine lands (AML) patches are limited in post-mining landscape restoration, especially where great land use changes might be expected due to large-scale land reclamation. This study presents a novel approach combining AML patch sizes with a proximity index to characterize patch-scaled connectivity for determining the spatial positions of patches with huge sizes and high connectivity. Then this study propose a scenario-based method coupled with landscape-scale metrics for quantifying landscape-scaled connectivity, which aims at exploring the optimal reclamation scheme with the highest connectivity. Using the Mentougou District in Beijing, China, as a case study, this paper confirmed which patches should be reclaimed first to meet the predetermined reclamation numbers; then this paper tested three different reclamation scenarios (i.e., cultivated land-oriented, forest-oriented, and construction land-oriented scenarios) to describe the impact of the different development strategies on landscape connectivity. The research found that the forest-oriented scenario increased connectivity quantitatively, showing an increase in the integral index of connectivity (IIC) and other landscape-scale metrics. Therefore, this paper suggests that future land-use policies should emphasize converting AML into more forest to blend in with the surrounding land-use categories. The findings presented here can contribute to better understanding the quantitative analysis of the connectivity of AML patches at both the patch scale and the landscape scale, thus providing scientific support for AML management in mine-site rehabilitation.

1. Introduction

Large-scale mining activities have led to a great number of abandoned mine lands (AML), which refers to idle or abandoned lands after mining or exploration activities that cannot be reused without remediation [1,2,3]. The sizes of AML patches vary and the patches are widely dispersed. In China, rules for AML reclamation are that patches with high connectivity and large areas should be given priority and that the patch restoration should coincide with the surrounding land cover category to achieve high landscape connectivity. Though this management strategy is frequently recommended, only limited qualitative analyses have been conducted as quantitative methods for measuring connectivity in the field of mining landscape restoration are commonly not used in China and internationally.
Landscapes have been referred to as complex adaptive systems, in which patterns at higher levels emerge from localized interactions at lower levels [4]. Landscape metrics could be used as indicators to describe, characterize and quantify the pattern, composition and configuration of the biotope and landscape structure of some region on various spatial and temporal scales. At the patch-scale, Gustafson and Parker developed the proximity index to describe the aggregation degree of the patches of the same land-use type [5,6,7]. The index can be used to distinguish isolated patches from those which are components of complex patches, which and it provide a way to evaluate the aggregation levels of the scattered AML patches with high connectivity values for priority reclamation. At the landscape scale, contagion, aggregation index, shape index, etc. are usually selected to measure the degree of aggregation and clumpiness of the overall landscape patterns [8,9,10,11]. The landscape-scale indices could be used to assess the reclaimed post-mining landscape. Leitão and Muge revealed landscape ecological metrics can be useful in each mine planning phase, i.e., allocation, development, exploitation, and closure, to address the environmental component [12]. Herzog et al. tested the usefulness of geometry-based landscape metrics for monitoring landscapes in a heavily disturbed environment caused by surface mining and agri-cultural intensification in Saxony, eastern Germany [13]. Kirmikil and Arici investigated the utility of metric parameters such as the shape index and fractal dimension for analyzing parcel conditions pre- and post-land consolidation in four villages within the county of Karacabey in Bursa, Turkey, aiming at eliminating scattered land forms [14].
Moreover, graph theory has also significantly contributed to the development of modeling functional connectivity of landscapes, which characterizes spatial relationships among focal patches, nodes, and links of a network [15,16,17]. Currently, the study of land connectivity is primarily conducted in the research areas of conservation planning, protection of ecological species and habitats, and forest management. Lechner et al. studied the influence of future development and public orientation on landscape connectivity under different scenarios [18,19]. Nogués and Cabarga-Varona (2014) established a variety of scenarios to model land-use changes for landscape connectivity, with the aim of improving the connectivity of a forest habitat network [20]. Ernst (2014) quantified connectivity in complex landscapes via graph-based connectivity response curves under a range of simulated forest management scenarios for biodiversity conservation [21], and Pirnat (2000) proposed a connectivity model based on GIS (Geographic Information System) to confirm core forest patches and corridors [22]. Especially, the integral index of connectivity (IIC) is suggested to assess the complex functional connectivity of landscapes [23,24]. Although these methods provide systematic ways of understanding connectivity based on landscape pattern theory and graph metric theory, there are comparatively few approaches for spatially evaluating the degrees of spatial aggregation of existing AML patches.
At the same time, land-use changes (i.e., converting AML into cultivated land, forest land or built-up land) can also have a positive or negative impact on connectivity. Scenario planning approaches can be effective for considering the potential influence of reclamation on connectivity across the landscape scale. Three different land-use-type-oriented scenarios have been designed per land requirements. As the land-use type of adjacent patches could also change during the period of rehabilitation, it is necessary to predict future land-use shifts [25] via land-use models [26,27]. The Conversion of Land Use and its Effects at the Small Regional Extent (CLUE-S) model has been widely used for simulating the regional changes of land-use cover [28,29,30,31,32]. CLUE-S is an empirical analysis-based model that considers the influences of geophysical and socioeconomic driving factors on land-use category changes [33,34,35,36,37,38,39,40]. Hence, the CLUE-S model is used to simulate the land-use types transformations. After reclamation, the separated reclaimed patches, adjacent patches, and the matrix are considered as a whole post-mining landscape. So, after reclamation, the connectivity would be analyzed using a range of graph metrics from the landscape scale but not from the patch scale.
In brief, this paper tries to combine landscape connectivity and pattern indices with scenario analysis to determine priorities for reclamation, using the Mentougou District in Beijing, China, as a case study, aiming to answer the following issues: (i) how to investigate connectivity modeling to determine the spatial locations of AML patches for reclamation priority; (ii) how to design simulated management scenarios for AML reclamation; and (iii) how to assess different scenarios from the perspective of connectivity.

2. Materials and Methods

2.1. Study Area

The Mentougou District is in the west of Beijing, China (Figure 1), with rich mining resources. Coal and limestone dominate. The Mentougou District was the energy source base of Beijing for a long time. However, from 2007, the Beijing municipal government converted its emphasis from mining extraction to ecological environment preservation in the district. A total of 267 mines were closed, leaving 4130 ha of AML for land reclamation. According to the General Land-Use Plan in Mentougou District (2006–2020), 3573 ha of AML will be reclaimed by the year 2020. Most AML patches are distributed in the east, with mainly small ones in the west. The 2007 land-use map was classified into eight types, including cultivated land, garden land, forest land, grassland, construction land, AML, water, and unutilized land. The respective numbers of the eight land-use categories are 1735 ha, 3925 ha, 101,904 ha, 19,805 ha, 3596 ha, 4130 ha, 1914 ha, and 7806 ha, respectively, as shown in Figure 2. Land use information was obtained from Beijing Municipal Bureau of Land and Resources.

2.2. Methods

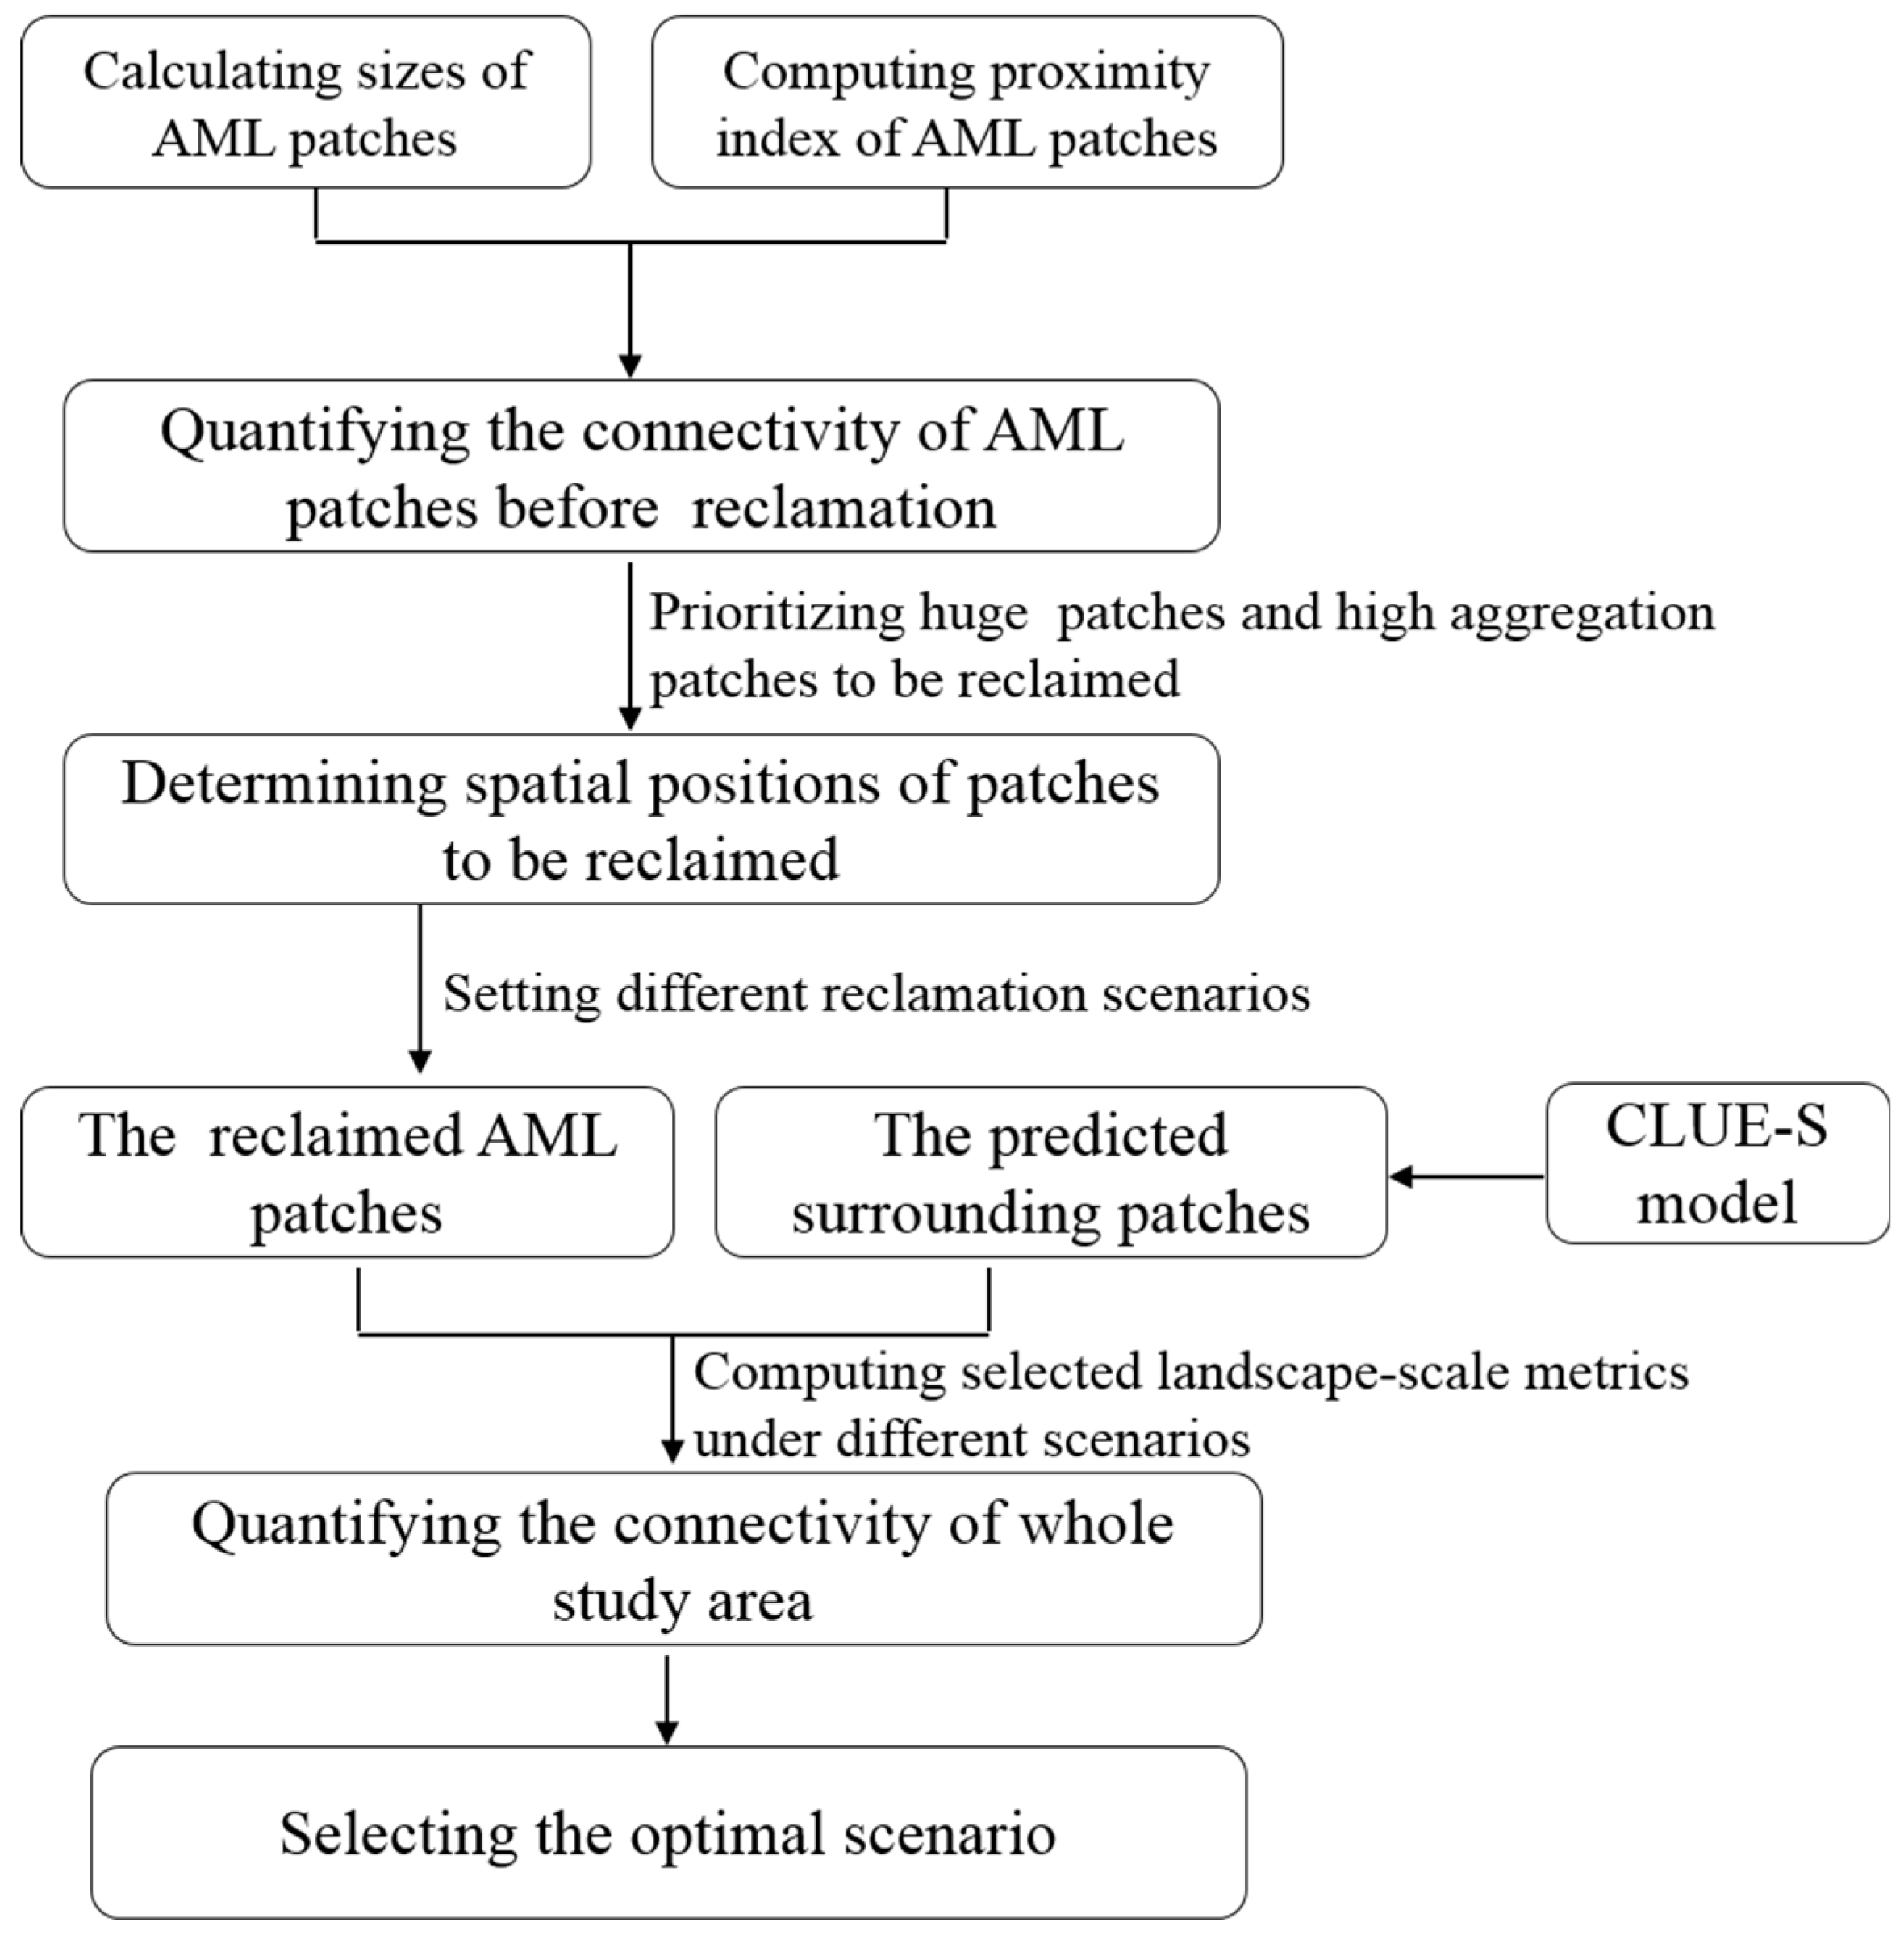
This paper first incorporates the patch sizes and the proximity index to characterize the connectivity of AML patches prior to reclamation. Then it sets a range of reclamation scenarios based on different reclamation targets. Finally, it assesses the scenarios through selected landscape-scale graphics to demonstrate landscape connectivity. The technical flow of this study is illustrated in Figure 3.

2.2.1. Patch-Scale Connectivity Approach for Identifying AML Patches for Reclamation

Gustafson and Parker developed the proximity index in 1992 [5,6,7]. This index considers the size and proximity of all patches of the same category with edges that fall within a specified search radius of the focal patch. The index can be used to distinguish isolated patches from those which are components of complex patches and to describe the aggregation degree of patches of the same land-use type. The proximity index is calculated using the following equation:
P r o x i m i t y   i n d e x = i = 1 n [ A ( i ) / N N D ( i ) i = 1 N A ( i ) / N N D ( i ) ]  
where A(i) is the area (m2) of patch i and NND(i) is the nearest-neighbor distance between that patch and each neighboring patch of the same type with edges that fall within the specified neighborhood (m) of the patch indexed. The value ranges from 0 to 1. A higher value means that the patches are closer and more contiguous (or less fragmented) in the spatial distribution.
However, patch metrics are often calculated using the software of FRAGSTATS 4.0 (UMass Landscape Ecology Lab, Amherst, MA, USA) in the research work [10], which is a set of spatial statistics that are automatically implemented by ecologists. The value is calculated using the following equation:
P r o x i m i t y   i n d e x = s = 1 n a i j s h i j s 2  
where aijs is the area (m2) of patch ijs within the specified neighborhood (m) of patch ij; hijs is the distance (m) between patch ij and patch ijs, based on patch edge-to-edge distance, computed from cell center to cell center. Here, the search radius is set to 1000 m per the reclamation work practice.
The value of proximity index equals the sum of the patch area (m2) divided by the nearest edge-to-edge distance squared (m2) between the patch and the focal patch of all patches of the corresponding patch type whose edges are within a specified distance (m) of the focal patch [41]. FRAGSTATS uses the distance between the focal patch and each of the other patches within the search radius, rather than the nearest-neighbor distance of each patch within the search radius (which may indicate a patch other than the focal patch), as in Gustafson and Parker [5]. The value equals 0 if a patch has no neighbors of the same patch type within the specified search radius. The value increases as the neighborhood (defined by the specified search radius) becomes increasingly occupied by patches of the same type and as those patches become closer in distribution [41].
Since the sizes of AML patches vary, reclamation priorities should be set for large patches. Then the connectivity of the remaining AML patches is computed according to Equation (2) and the values are sorted in descending order. Patches with high connectivity values are assigned to be reclaimed to meet pre-determined reclamation numbers.

2.2.2. Land Reclamation Scenarios

According to the results of the mined land suitability assessment, AML in the study region can be rehabilitated into cultivated land, forest land and construction land [11]. The potential uses of AML patches using three different modeling scenarios are evaluated.
Scenario 1 (fertility dependent cultivation or forestry): Since cultivated resources are limited in China, land consolidation has maintained the provision of additional arable land as its primary target [42]. Thus, in this scenario, AML patches would be reclaimed into cultivated land if it has a high soil fertility. In order to distinguish which patches are suitable for reclamation into cultivated land, an evaluation indicators system was built for assessment. First, the graph overlay method was adopted to divide the evaluation units, which referred to the superposition of the land-use map and the corresponding soil map to obtain separate patches as evaluation units. Then six indicators, i.e., soil texture, elevation, slope, aspect, soil organic matter, and available phosphorus, are used to build the indicators system according to The Rules for Cultivated Land Productivity Assessment in Beijing, China (DB11/T 1083-2014) and relative literature [40]. The weights are 0.251, 0.195, 0.152, 0.103, 0.196, 0.103, relatively. Afterwards, the additive method was used to compute the integrated index of each unit. Finally, patches with a score higher than 75 could be transformed into cultivated land to supplement arable land resources, whereas patches with the scores lower than 75 could be changed into forest land. The data used for the evaluation system, were obtained from the Beijing Digital Soil System. All data were converted for the same projection with an equal grid size of 100 × 100 m. According to the land use scheme, the patches in Yongding with low elevation and good transport accessibility would be transformed to construction land to meet the demand of the industry.
Scenario 2 (elevation dependent cultivation or forestry): In China, one rule for the reclamation of AML is that reclaimed patches should be line with the surrounding land-use types, according to the Management Approach to The Reclamation and Utilization of Abandoned Mine Land. The typical land-use type in the study region is forest, and thus converting AML patches into forest patches would be consistent with the policy. The elevations of patches could be calculated in the ArcGIS 10.2 software. In this scenario, AML patches with an elevation higher than 30 m would be reclaimed into forests, whereas AML patches with an elevation lower than 30 m and high soil attributes would be reclaimed into cultivated land. Based on land use planning, only selected patches in Yongding are to be reclaimed into construction land, with neighboring patches of the same type.
Scenario 3 (urbanization, cultivation and forestry): According to General Land-Use Plan in Mentougou District (2006–2020), the four townships of Longquan, Datai, Wangping, and Yongding aim to develop new factories and infrastructural facilities to realize industrial transformation. Thus, the patches within the four townships would be transformed into built-up lands. Scattered patches with high soil fertility in Miaofengshan and Junzhuang would be changed into cultivated land. Other patches that are left over would be shifted to forest.

2.2.3. Prediction of Other Land-Use Cover Changes in 2020

Considering that the land-use types in the research area will change during the period of reclamation, it is necessary to predict the land-use types in the study area to precisely calculate the connectivity of the reclaimed AML patches and their surrounding patches.
In this paper, the CLUE-S model [28,30,31,43,44] is adopted to predict future land-use changes, excluding AML, in the study region. Conversion of other land-use types into AML, and conversion of AML types into other land-use types were not allowed. The spatial location of AML was defined as per the area restrictions. Therefore, the CLUE-S model only simulated the distribution of the other seven land-use types without AML. The model is divided into the non-spatial and spatial modules.
1. The non-spatial module
It calculated the demands for seven land-use types and the demands were taken from the general land-use plan of the study area and different scenarios characteristics.
2. The spatial module
Ten driving variables were selected considering the data availability, stability, and relevance. Elevation (X1), slope (X2), distance to the nearest road (X3), distance to the nearest river (X4), distance to the nearest main township (X5), distance to the nearest rural residential site (X6), soil organic matter (X7), population density (X8), per capita income (X9), and annual rainfall (X10) were selected as the driving factors. X1 and X2 were acquired from DEM (Digital Elevation Model). X3 to X6 were calculated via ArcGIS 10.2. X7 was obtained from a 1:5 million soil map in the Beijing Digital Soil System. Other variables (i.e., X8X10) were from the Statistical Yearbooks of the Mentougou District, Beijing. Specifically, X1 and X2 were used to describe terrain conditions, and X3, X4, X5, and X6 were used to describe transportation accessibility. X7 is an important indicator of soil property, which largely decides whether the AML patches are suitable for cultivation. X8, X9, and X10 are key socioeconomic factors influencing the social development of townships.
The detailed principles of the CLUE-S model can be found in the relative literature [11,32,35,45,46,47,48].

2.2.4. Landscape-Scale Connectivity Modeling after Reclamation

After obtaining the future land-use changes of the study region by the CLUE-S model and transformations of AML by scenarios analysis, the research combined them together and used several landscape-scale indices to assess connectivity from a landscape view. Six landscape graph metrics, i.e., the mean patch size (MPS), number of patches (NP), contagion index (CONTAG), aggregation index (AI), shape index (SHAPE), and integral index of connectivity (IIC), were used to measure connectivity. Table 1 shows the landscape-scale graph metrics and their ecological significance.

3. Results

3.1. Connectivity Values of Existing AML Patches before Reclamation

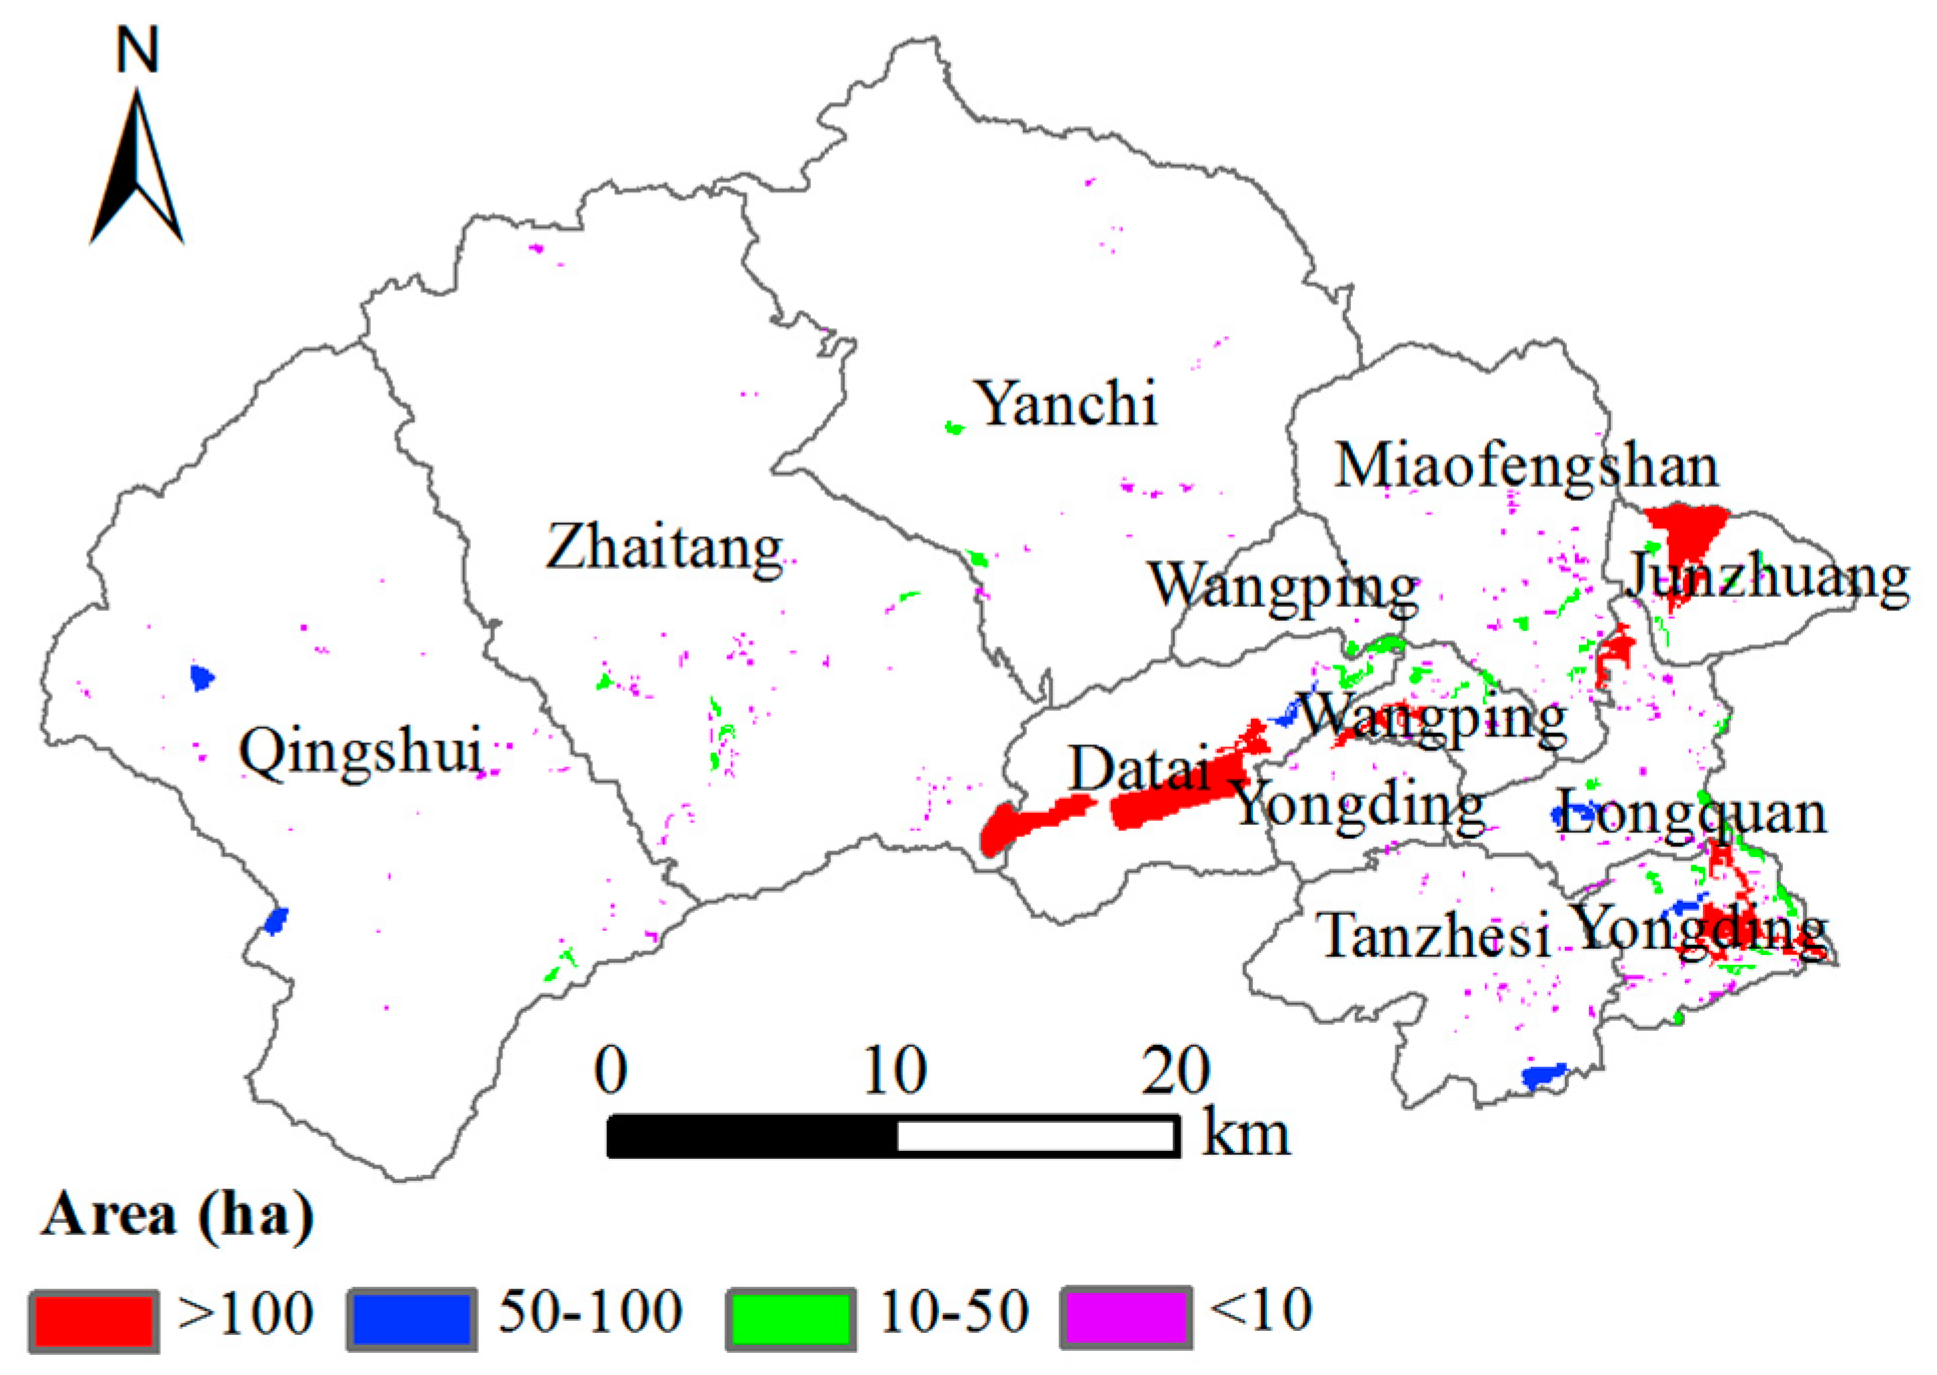
The AML patch sizes were calculated in ArcGIS 10.2. Table 2 shows the descriptive statistics of the different sizes of AML patches. Six AML patches were larger than 100 ha in 2007, and most of them passed through the coal mining industrial region located in the eastern part of the research area. The spatial distribution of AML patches is shown in Figure 4. Small plots were mainly scattered around the townships of Qingshui, Zhaitang, and Yanchi. These three townships have higher elevation and they primarily relied on forestry rather than coal mining for their economic survival.
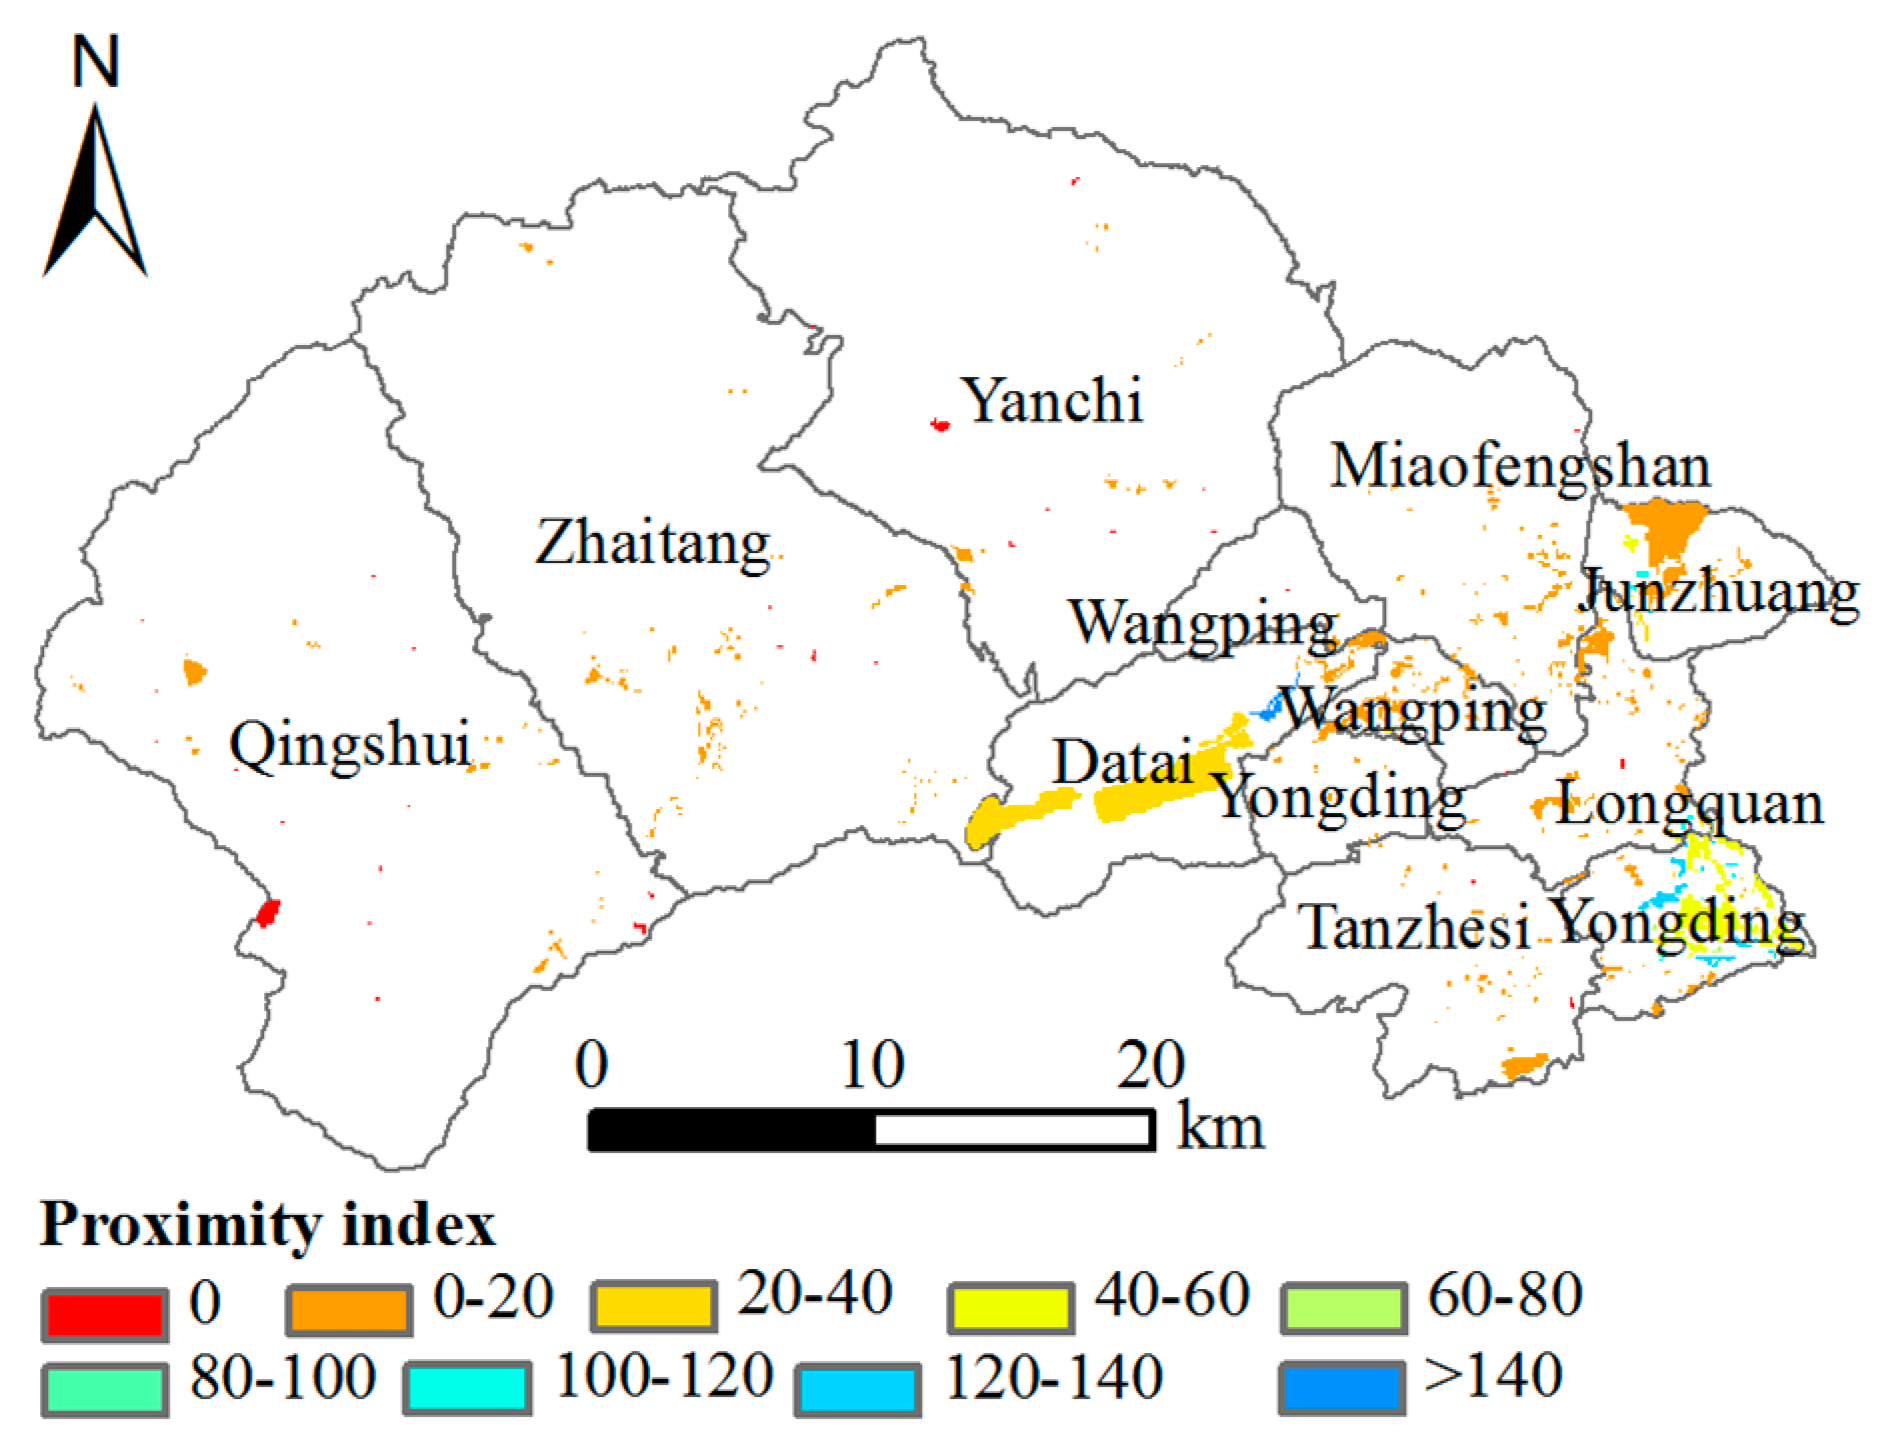
The AML patches in Figure 4 were input into FRAGSTATS 4.0. The connectivity value for each patch in 2007 was computed using Equation (2). The computed values were sorted in descending order and classified into 9 grades, as shown in Figure 5. If a focal patch had no neighbors of the same patch type within the search radius of the focal patch, it received a value of zero, i.e., the spatial connectivity was low. Conversely, the values were high if the patch has a large-area surrounding patches. The reason for this observation was that based on Equation (2), a large patch area (aijs) within the search radius and a short interpatch distance (hijs) results in a large value. The proximity index values of AML patches in the banded region in the northeast of Datai (in dark blue) were high because a patch as huge as 733 ha was close to these patches. Furthermore, the values for several patches in Yongding were high because a huge patch with the area of 501 ha falls within the search radius.
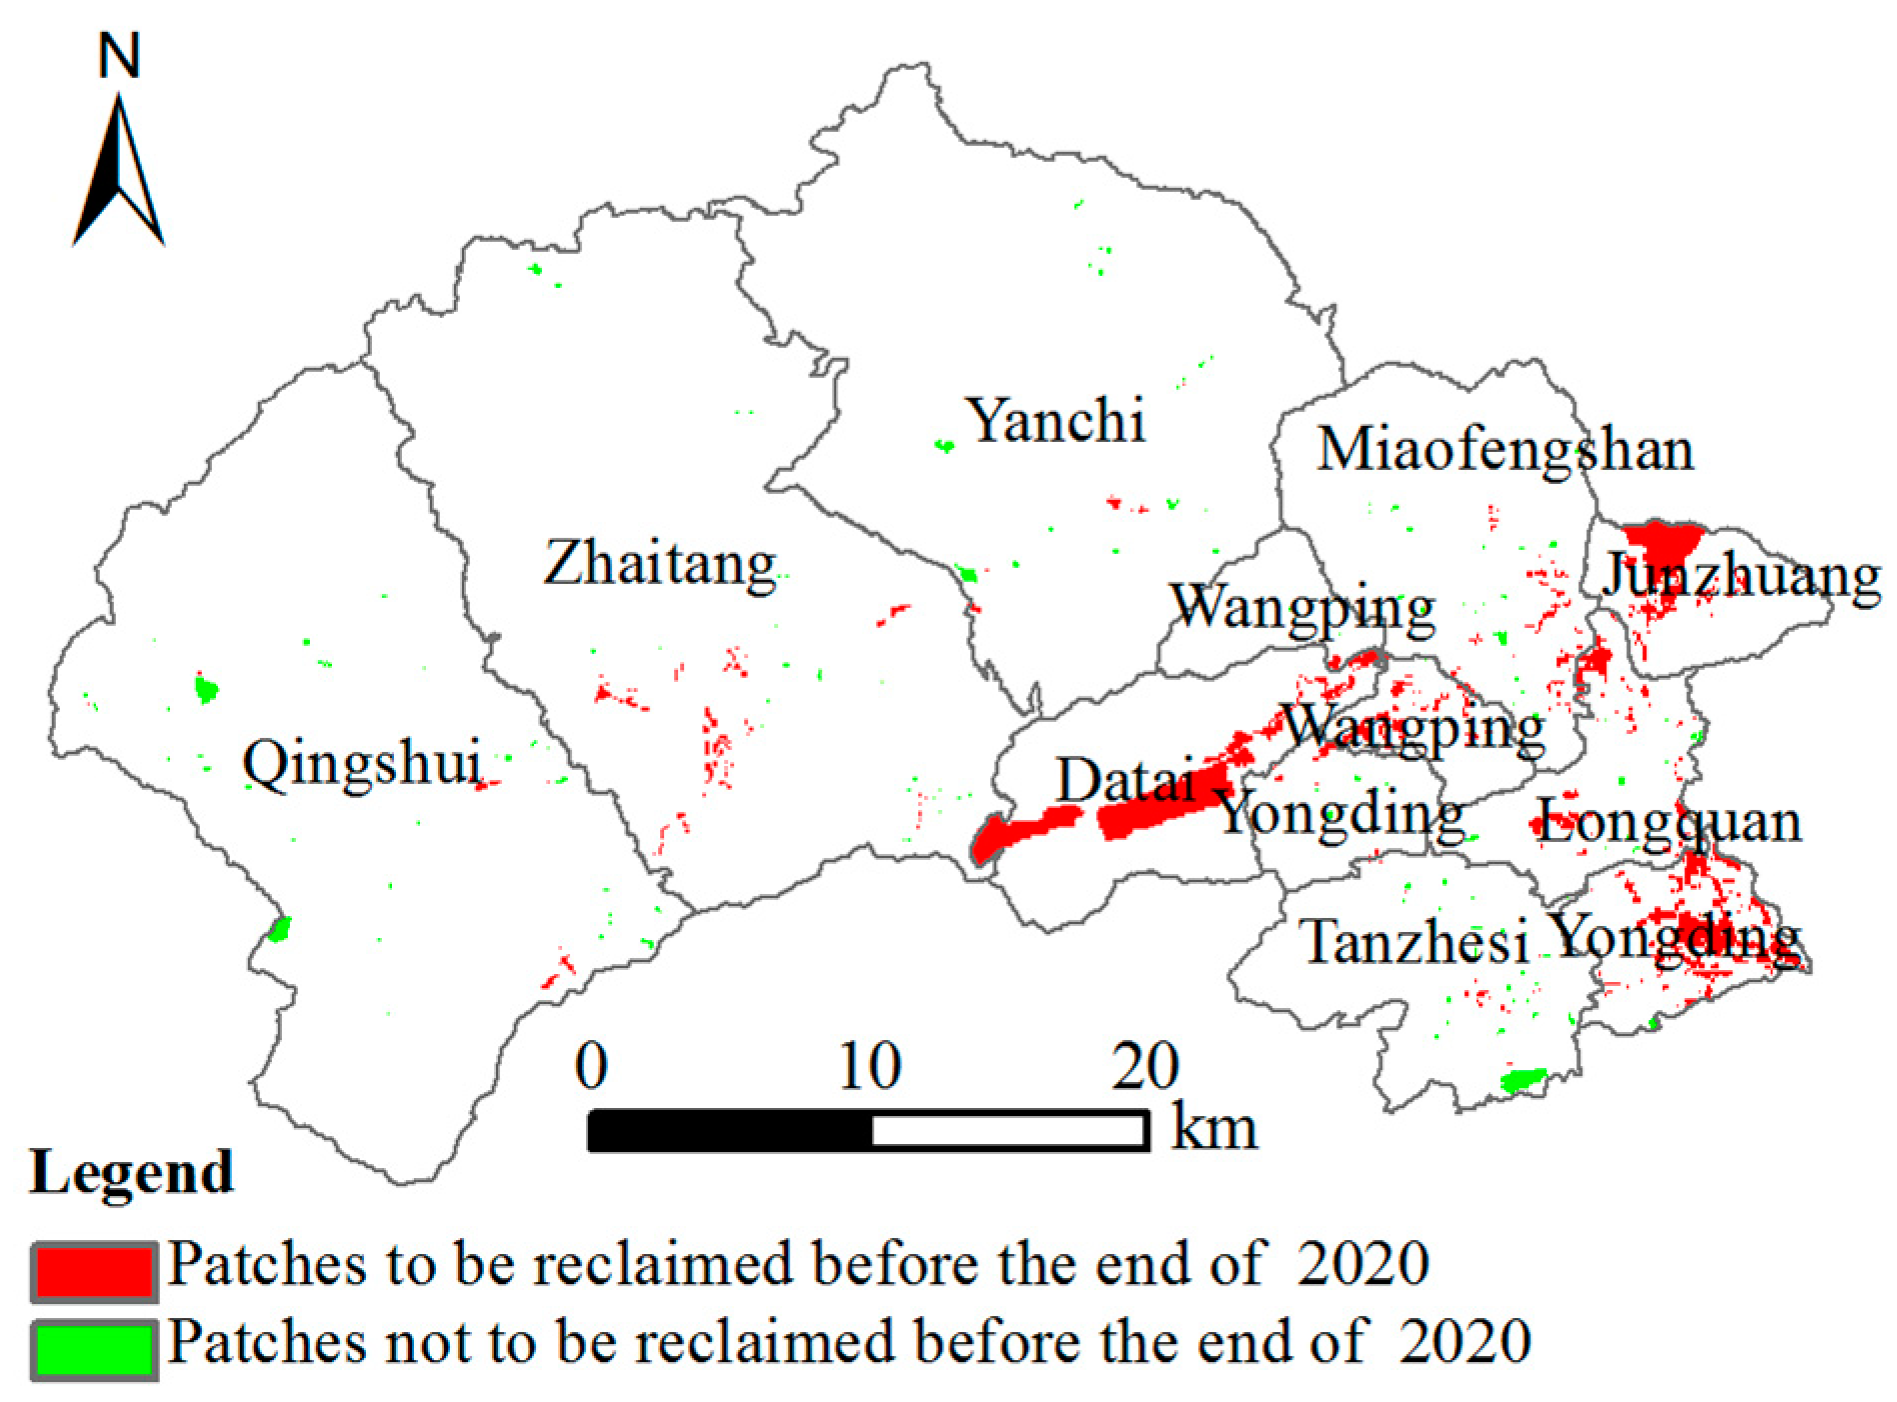
Therefore, priorities were set for the six huge patches. Next, the computed values were sorted in descending order. The patches with relatively high values were selected for reclamation to meet the demand for reclaimed areas in the general land-use plan (to be exact, 3573 ha). The spatial allocations of patches that were to be reclaimed and not reclaimed are shown in Figure 6.

3.2. AML Transformation under Different Reclamation Scenarios

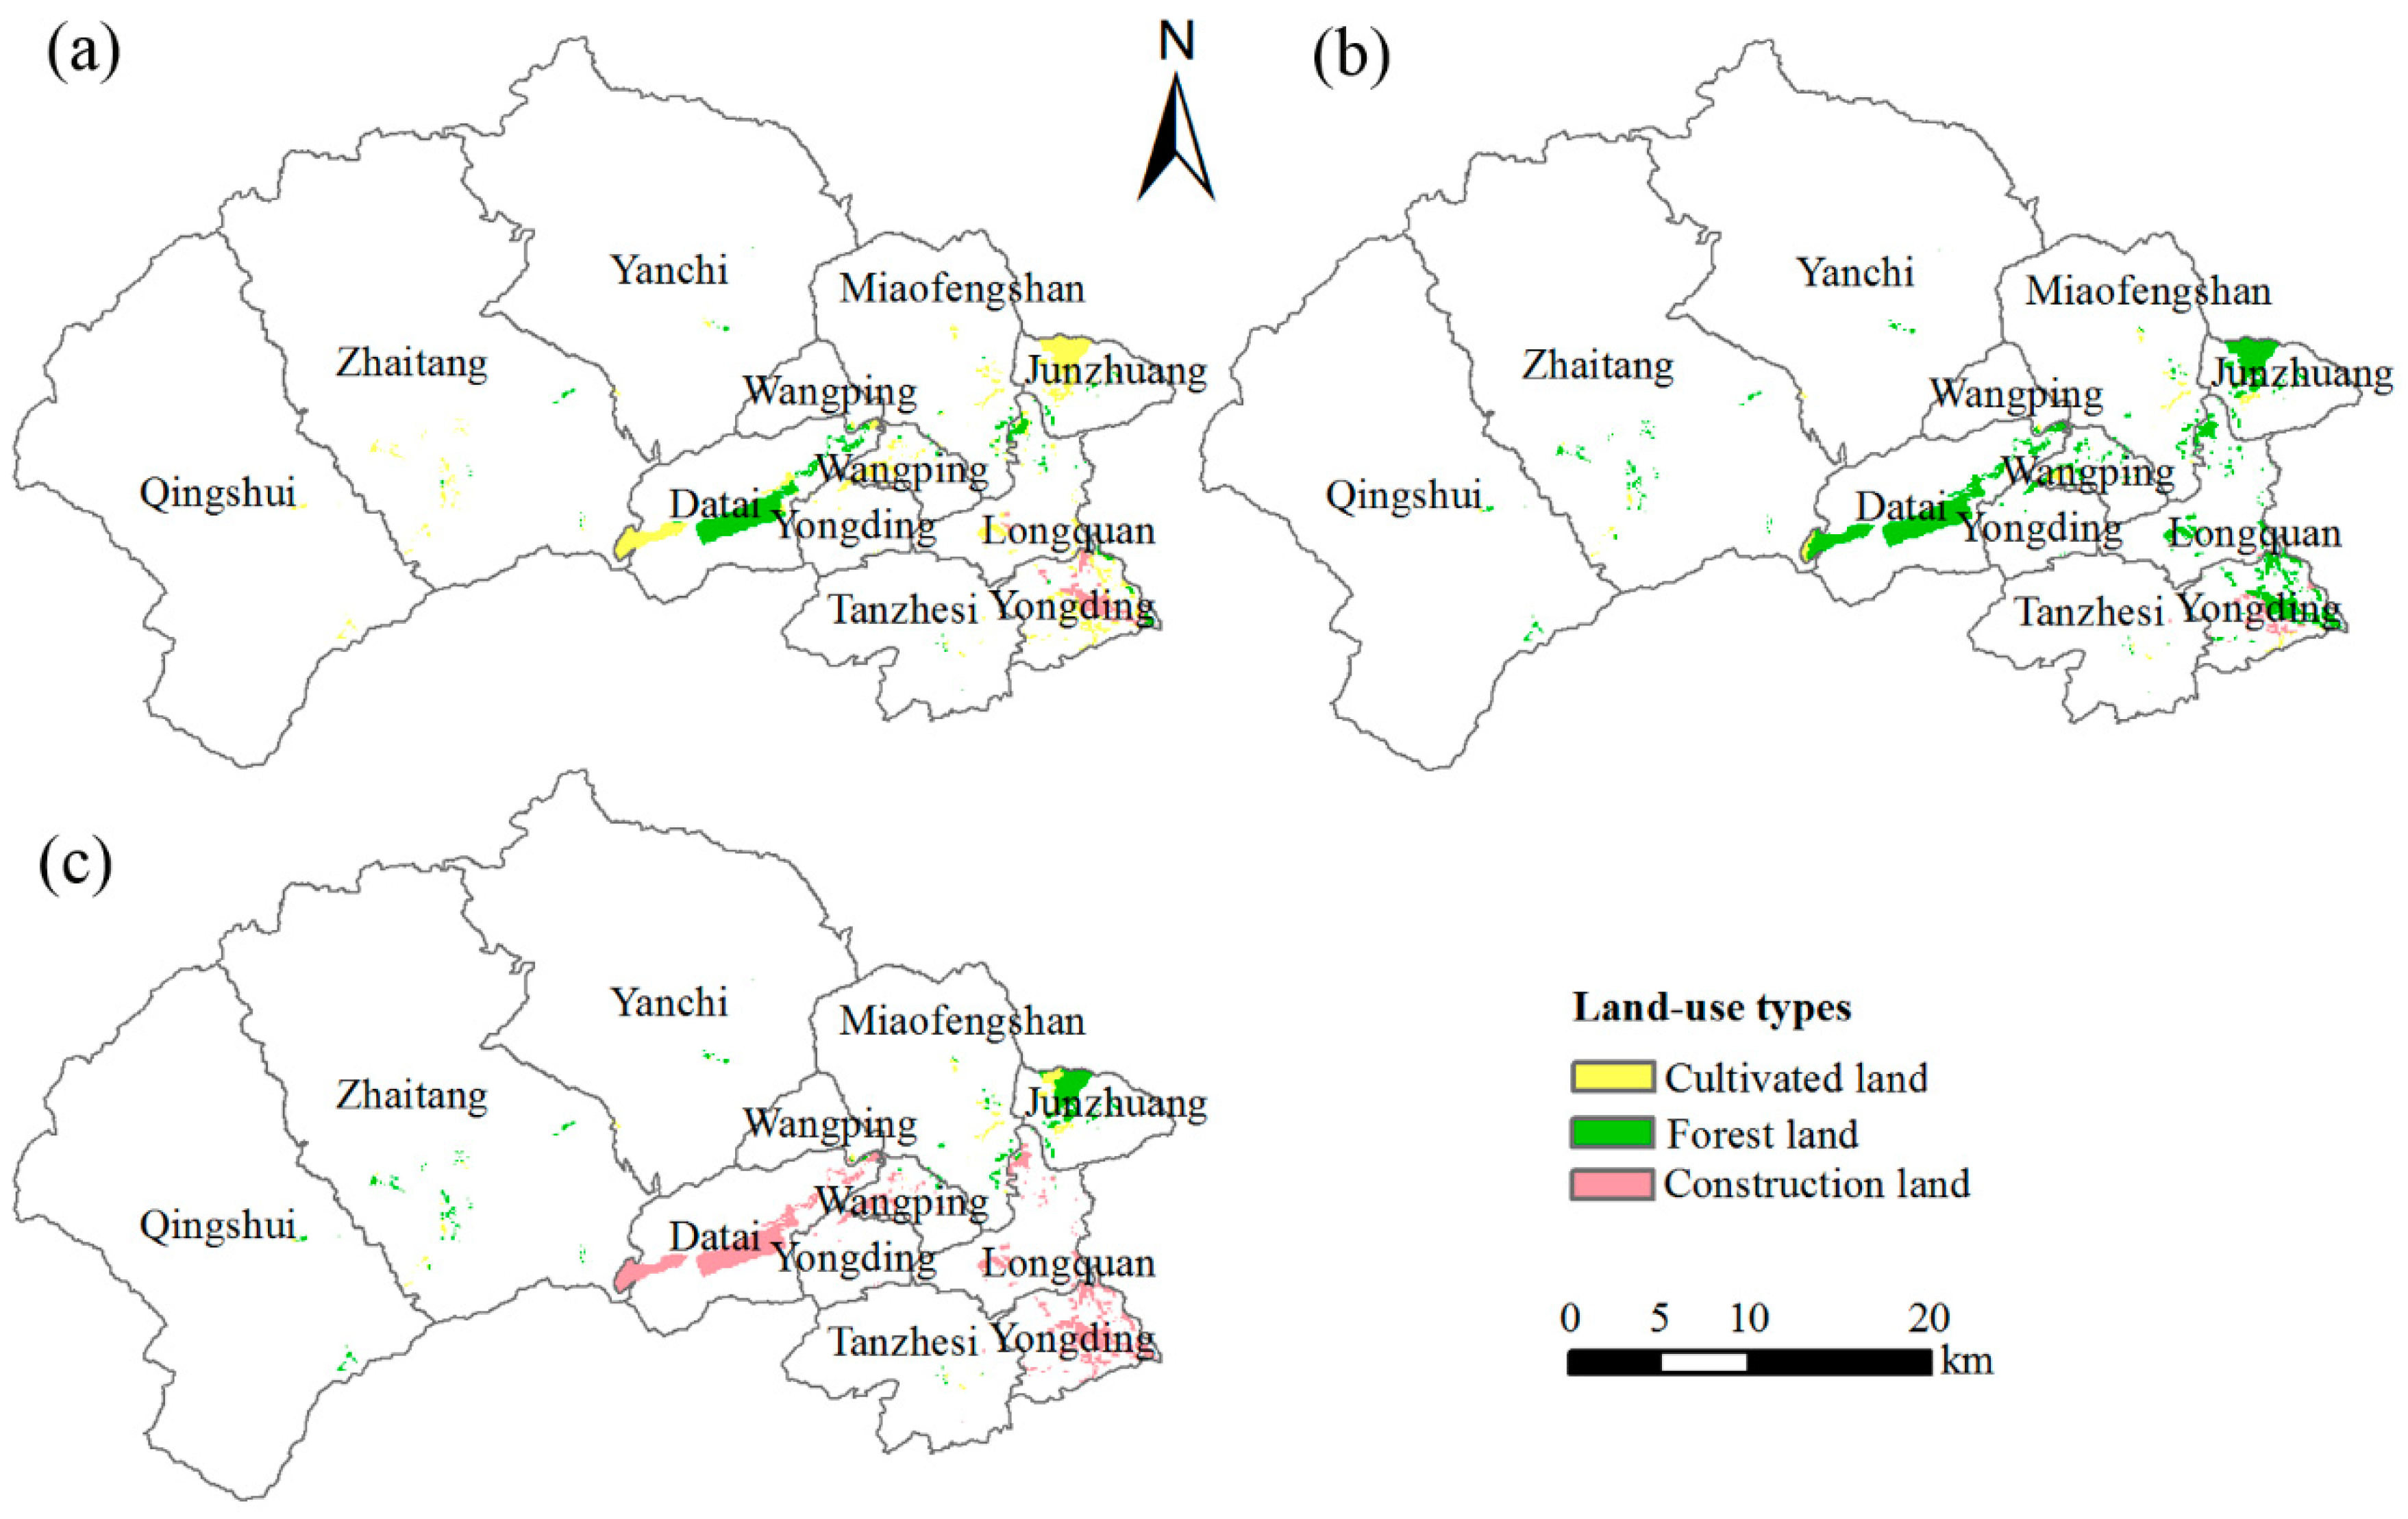
The reclaimed areas and their percentages under different scenarios can be found in Table 3. The spatial transformation of AML patches under different scenarios are shown in Figure 7. In scenario 1, the reclaimed cultivated land was mainly in Yongding (in the east), Junzhuang and Datai, with high values in soil attributes. Large patches in Datai were converted to forests because of the low soil fertility. The patches in the middle of Yongding (in the east) were transformed into built-up areas due to the low elevation and good transport condition for industry development. In scenario 2, most of the patches were converted into forest per the nature of this scenario. Only a small percentage, approximately 8%, of patches were reclaimed into cultivated land due to the low elevation and only about five percent of AML were shifted into built-up areas. In scenario 3, construction land dominated. The patches located in Datai, Wangping, Yongding, and Longquan were changed to built-up areas to meet the demand of industrial transformation according to the local land-use plan.

3.3. Prediction of Land-Use Changes Via the CLUE-S Model

The simulated distribution of the seven land-use types in 2020 was obtained using the CLUE-S model. After overlapping Figure 7 with the simulated map, the spatial distribution of all land-use types in 2020 was shown in Figure 8.
The results of logistic regression were examined through receiver operating characteristic (ROC) curves [49]. If the ROC is greater than 0.7, it suggests strong correlations and an ability to explain shifts among the different types via the driving factors. The ROCs for the seven land use categories were all above 0.7. The accuracy of predicting future land-use types could be tested by Kappa index [50]. The predicted map for 2013 was compared with the actual map, and the Kappa index was 0.89 (should be larger than 0.85), suggesting that the model could capture future trends.

3.4. Connectivity Modeling after Reclamation

Connectivity characteristics of the three scenarios can be seen in Table 4.
As shown in Table 4, scenario 2 had the largest MPS and the lowest NP, whereas scenario 1 had the smallest MPS with the highest NP. The CONTAG and AI both ranked from highest to lowest in the order of scenario 2, scenario 3, and scenario 1. The SHAPE is the simplest and perhaps most straightforward measure of shape complexity, and the value for scenario 2 was the lowest, which means the landscape was the most aggregated. Scenario 2 showed an advantage in IIC, which quantifies the importance of habitat areas and links for the improvement of landscape connectivity. Therefore, based on the comparisons of graph metrics, these rankings suggest that scenario 2 had the most contiguous units, with most of the units exhibiting a greater aggregation trend, that is, higher connectivity.

4. Discussion

4.1. The Limitation of the Proximity Index When Assessing the Connectivity of Existing AML Patches

Although the index can quantitatively describe the spatial inner structure of patches of the same type, a potential problem remains with Equation (2) when used with FRAGSTATS 4.0. Indeed, the problem is regarding cases involving widely varying patch sizes. Consider the spatial case involving 10 patches of the focal class in which 9 of the 10 patches are small and equal in size (e.g., 1 ha each), whereas the tenth patch is large (e.g., 1000 ha). If all of the small patches are located close to the large patch (within the search distance), the value for each of the 9 small patches will be high because the single large patch will be reflected in the index; however, the value for the single large patch will be low because the only neighboring patches are small (1 ha each).
To overcome this problem, in this study, both the sizes of the patches and the proximity index were taking into account to determine the spatial distribution of potential reclaimed AML patches. Priority for reclamation was first assigned to huge patches; then, patches with higher values were reclaimed to meet the demand of predetermined numbers. For different study regions, the classification of patches, i.e., the definition of huge patches, can be determined according to the features (e.g., size, distribution) of existing AML patches in the targeted landscape.
Furthermore, the values are influenced by the threshold distance (i.e., search radius). Nogués and Cabarga-Varona (2014) examined the effect of the search radius (e.g., 2000, 5000, 10,000, and 20,000 meters) on connectivity indices (i.e., integral index of connectivity and probability of connectivity) [20]. In the present study, the search radius was set to 1000 m in consideration of the relationships between the focal patch and the surrounding patches per the reclamation work practice. If the AML patches were scattered throughout the research area, their mutual influence could be neglected for the patches are located far from each other. The influence of the search radius on proximity values was also tested. The search radius was initialized at only 500 m and was increased stepwise (100 m step−1) to 2000 m for comparative purposes. The observed differences in proximity values under different stepwise conditions were not significant. Therefore, in connection with working practice, the search radius was finally set to 1000 m.

4.2. Selection of Landscape Metrics Characterizing Connectivity in the Post-Mining Landscape

Despite the proliferation of connectivity modeling approaches, there are limited studies about the spatial structural information of AML patches in the field of land restoration.
As this paper aims to explore suitable landscape-scale metrics to reveal the formation of spatial aggregation in the post-mining landscape, six indices were chosen based on their ecological significance, which is consistent with some relevant work [8,9,10,23,24]. The application of these indices achieved a distinct and comparable evaluation of the landscape metrics of different land-use-type-oriented scenarios. The results indicated that the indices selected were valid after incorporating land-use cover changes following land rehabilitation.
MPS and NP provided simple statistics for the gross differences among the three scenarios. The higher value in scenario 2 can be attributed to the large number of forest land due to reclamation, which further enlarged the areas of forest in the entire study region. CONTAG measures the extent to which patch types are aggregated; higher values may result from a few large and contiguous patches in the landscape, whereas lower values generally characterize the landscape with many small and dispersed patches. CONTAG can generate an effective summary of overall clumpiness on categorical maps. The values ranked from highest to lowest in the order of scenario 2, scenario 3, and scenario 1. AI measures the aggregation levels of spatial patterns: it equals 0 when the patches greatly disaggregated, and it rises as the landscape becomes increasingly aggregated. The AI value of scenario 2 was the highest of the three scenarios. Large contiguous forest patches could result in large aggregation index values. The SHAPE measures the complexity of the patch shape compared to a standard shape (square) of the same size and therefore alleviates the size dependency problem of the perimeter-area ratio index. Scenario 2 had the lowest shape value, indicating that the landscape was more aggregated. In scenario 1, cultivated land occupied a comparatively large portion of the entire landscape, and the patches in the study region were scattered. Adding small and more dispersed cultivated land patches may lead to greater landscape fragmentation. With regard to IIC, scenario 2 had a higher value compared with other scenarios. The natural forest network occupied almost 70% of the total study area, indicating the importance of particular patches for maintaining connectivity. The connection was further increased whenever the reclaimed forest patches were considered, and the larger reclaimed forest areas, the greater the IIC values.

4.3. Implications for Policy-Making of the Mine-Site Rehabilitation

According to the Management Approach to the Reclamation and Utilization of Abandoned Mine Land in China, high-connectivity AML patches should be reclaimed first, and the post-mining landscape should be of high connectivity. However, there is limited domestic research about these objectives. Thus, the approaches presented here can provide government officers with a systematic and clear framework for evaluating the connectivity values of existing AML patches and for assessing the impact of future land-use changes on landscape connectivity due to land restoration. The framework can be used to guide management decisions by assessing the efficiency of several simulated scenarios for planning [51,52,53].
The method for quantifying connectivity coupling patch sizes and the proximity index presented in this paper constitute an approach for guiding the determination of potential spatial positions of AML patches before reclamation, which can be effectively applied in working practice. Regarding the approach for quantifying connectivity after reclamation, the combined connectivity modeling and scenario-based planning should be iterative and dynamic [19]. Analysis of a range of reclamation scenarios showed the extent to which connectivity would be enhanced in the study region. Scenario 2 exhibited an advantage with respect to the selected graph metrics, with the patches being the most combined and aggregated, which would help to enhance connectivity. Therefore, this research recommends that the government should transform AML into more forest land in the targeted landscape. As forests comprise a large proportion of study area, increasing the same type of patches can improve the degree of spatial aggregation. Furthermore, as shown by the rules of management approaches to AML reclamation, the reclaimed patches should coincide with the surrounding landscape, and shifting AML patches into forest can also meet this requirement.

5. Conclusions

In this paper, a novel approach for assessing the connectivity of existing AML patches and for evaluating the impact on landscape connectivity of future land-use changes caused by land restoration are presented. This study investigated how the proximity indicator describe the connectivity of the patches and revealed how the factors of quantity, fragmentation and spatial dispersion can influence landscape connectivity. The forest-oriented scenario was identified as the optimal scenario, with higher connectivity than its alternatives. The decreased fragmentation, dispersion indices, and increased connectivity benefits gained through reclamation are due to the increasing number of the greater clustering of forest land patches. This study’s findings can be used to provide scientific support for evaluating the feasibility of reclamation plans and facilitating polices of AML management.
However, it should be emphasized that the results and conclusions here are based on a study done in a certain area. The results cannot be generalized to other areas with other variables, that is, it is an example of how to act to recover AML spaces. Further research should be done to select proper indicators to describe and characterize the landscape connectivity pre- and post-land rehabilitation in other regions. Moreover, mined land reclamation is subject to a range of suitability factors, such as environmental hazards, economics, etc. Environmental challenges and economic development should also be considered in future studies to explore the optimal land reclamation scenarios.

Author Contributions

Conceptualization, L.Z. and Y.H.; Methodology, L.Z. and Y.H.; Software, L.Z.; Validation, L.Z.; Formal Analysis, L.Z. and S.Z.; Investigation, L.Z. and Y.H.; Resources, L.Z.; Data Curation, L.Z.; Writing-Original Draft Preparation, L.Z.; Writing-Review & Editing, L.Z. and Y.H.; Visualization, L.Z., A.X., Z.Z., Z.S., Z.L. and M.C.; Supervision, Y.H.; Project Administration, Y.H.; Funding Acquisition, Y.H.

Funding

This research was funded by [National Key Research and Development Program of China] grant number [2016YFD0300801].

Acknowledgments

We gratefully acknowledge the financial support to this project by National Key Research and Development Program of China, Grant No. 2016YFD0300801. We are grateful to Alex Mark Lechner for his valuable advice in the research work. We would like to thank anonymous reviewers for their constructive suggestions and comments.

Conflicts of Interest

The authors declare no conflicts of interest.

References

  1. Fernández-Martínez, R.; Loredo, J.; Ordóñez, A.; Rucandio, I. Mercury availability by operationally defined fractionation in granulometric distributions of soils and mine wastes from an abandoned cinnabar mine. Environ. Sci. Process. Impacts 2014, 16, 1069–1075. [Google Scholar] [CrossRef] [PubMed]
  2. Hu, Z.Q.; Fu, Y.H.; Xiao, W.; Zhao, Y.L.; Wei, T.T. Ecological restoration plan for abandoned underground coal mine site in Eastern China. Int. J. Min. Reclam. Environ. 2015, 29, 316–330. [Google Scholar] [CrossRef]
  3. Yang, S.; Cao, J.; Hu, W.; Zhang, X.; Duan, C. An evaluation of the effectiveness of novel industrial by-products and organic wastes on heavy metal immobilization in Pb–Zn mine tailings. Environ. Sci. Process. Impacts 2013, 15, 2059–2067. [Google Scholar] [CrossRef] [PubMed]
  4. Schröder, B. Pattern, process, and function in landscape ecology and catchment hydrology & ndash; how can quantitative landscape ecology support predictions in ungauged basins? Hydrol. Earth Syst. Sci. 2006, 10, 967–979. [Google Scholar]
  5. Gustafson, E.J.; Parker, G.R. Relationships between landcover proportion and indices of landscape spatial pattern. Landsc. Ecol. 1992, 7, 101–110. [Google Scholar] [CrossRef]
  6. Gustafson, E.J.; Parker, G.R. Using an index of habitat patch proximity for landscape design. Landsc. Urban Plan. 1994, 29, 117–130. [Google Scholar] [CrossRef]
  7. Gustafson, E.J.; Parker, G.R.; Backs, S.E. Evaluating spatial pattern of wildlife habitat: A case study of the wild turkey (meleagris gallopavo). Am. Midl. Nat. 1994, 131, 24–33. [Google Scholar] [CrossRef]
  8. Luck, M.; Wu, J. A gradient analysis of urban landscape pattern: A case study from the Phoenix metropolitan region, Arizona, USA. Landsc. Ecol. 2002, 17, 327–339. [Google Scholar] [CrossRef]
  9. He, H.S.; DeZonia, B.E.; Mladenoff, D.J. An aggregation index (AI) to quantify spatial patterns of landscapes. Landsc. Ecol. 2000, 15, 591–601. [Google Scholar] [CrossRef]
  10. McGarigal, K.; Tagil, S.; Cushman, S.A. Surface metrics: An alternative to patch metrics for the quantification of landscape structure. Landsc. Ecol. 2009, 24, 433–450. [Google Scholar] [CrossRef]
  11. Zhang, L.P.; Zhang, S.W.; Huang, Y.J.; Cao, M.; Huang, Y.F.; Zhang, H.Y. Exploring an ecologically sustainable scheme for landscape restoration of abandoned mine land: Scenario-based simulation integrated linear programming and CLUE-S model. Int. J. Environ. Res. Public. Health 2016, 13. [Google Scholar] [CrossRef] [PubMed]
  12. Leitão, A.B.; Muge, F. The role of landscape metrics in environmental planning and management of mining activities. In Proceedings of the 29th International Symposium on Computer Applications in the Minerals Industries (APCOM), Beijing, China, X., 25–27 April 2001; Heping, X., Wang, Y., Jiang, Y., Eds.; Balkema Publishers: Rotterdam, The Netherlands. [Google Scholar]
  13. Herzog, F.; Lausch, A.; MüLler, E.; Thulke, H.-H.; Steinhardt, U.; Lehmann, S. Landscape metrics for assessment of landscape destruction and rehabilitation. Environ. Manag. 2001, 27, 91–107. [Google Scholar] [CrossRef] [PubMed]
  14. Kirmikil, M.; Arici, I. The use of landscape metrics to assess parcel conditions pre- and post-land consolidation. J. Food Agric. Environ. 2013, 11, 985–989. [Google Scholar]
  15. Galpern, P.; Manseau, M.; Fall, A. Patch-based graphs of landscape connectivity: A guide to construction, analysis and application for conservation. Biol. Conserv. 2011, 144, 44–55. [Google Scholar] [CrossRef]
  16. Tischendorf, L.; Fahrig, L. How should we measure landscape connectivity? Landsc. Ecol. 2000, 15, 633–641. [Google Scholar] [CrossRef]
  17. Ziółkowska, E.; Ostapowicz, K.; Kuemmerle, T.; Perzanowski, K.; Radeloff, V.C.; Kozak, J. Potential habitat connectivity of European bison (Bison bonasus) in the Carpathians. Biol. Conserv. 2012, 146, 188–196. [Google Scholar] [CrossRef]
  18. Lechner, A.M.; Brown, G.; Raymond, C.M. Modeling the impact of future development and public conservation orientation on landscape connectivity for conservation planning. Landsc. Ecol. 2015, 30, 699–713. [Google Scholar] [CrossRef]
  19. Lechner, A.M.; Harris, R.M.B.; Doerr, V.; Doerr, E.; Drielsma, M.; Lefroy, E.C. From static connectivity modelling to scenario-based planning at local and regional scales. J. Nat. Conserv. 2015, 28, 78–88. [Google Scholar] [CrossRef] [Green Version]
  20. Nogués, S.; Cabarga-Varona, A. Modelling land use changes for landscape connectivity: The role of plantation forestry and highways. J. Nat. Conserv. 2014, 22, 504–515. [Google Scholar] [CrossRef]
  21. Ernst, B.W. Quantifying connectivity using graph based connectivity response curves in complex landscapes under simulated forest management scenarios. For. Ecol. Manag. 2014, 321, 94–104. [Google Scholar] [CrossRef]
  22. Pirnat, J. Conservation and management of forest patches and corridors in suburban landscapes. Landsc. Urban Plan. 2000, 52, 135–143. [Google Scholar] [CrossRef]
  23. Pascual-Hortal, L.; Saura, S. Comparison and development of new graph-based landscape connectivity indices: Towards the priorization of habitat patches and corridors for conservation. Landsc. Ecol. 2006, 21, 959–967. [Google Scholar] [CrossRef]
  24. Pascual-Hortal, L.; Saura, S. Integrating landscape connectivity in broad-scale forest planning through a new graph-based habitat availability methodology: Application to capercaillie (Tetrao urogallus) in Catalonia (NE Spain). Eur. J. For. Res. 2007, 127, 23–31. [Google Scholar] [CrossRef]
  25. Hoyos, L.; Cabido, M.; Cingolani, A. A multivariate approach to study drivers of land-cover changes through remote sensing in the Dry Chaco of Argentina. ISPRS Int. J. Geo-Inf. 2018, 7, 170. [Google Scholar] [CrossRef]
  26. Rimal, B.; Zhang, L.; Keshtkar, H.; Haack, B.; Rijal, S.; Zhang, P. Land use/land cover dynamics and modeling of urban land expansion by the integration of cellular automata and Markov Chain. ISPRS Int. J. Geo-Inf. 2018, 7, 154. [Google Scholar] [CrossRef]
  27. Rimal, B.; Zhang, L.; Keshtkar, H.; Wang, N.; Lin, Y. Monitoring and modeling of spatiotemporal urban expansion and land-use/land-cover change using integrated Markov chain cellular automata model. ISPRS Int. J. Geo-Inf. 2017, 6, 288. [Google Scholar] [CrossRef]
  28. Verburg, P.H.; Eickhout, B.; Meijl, H. van a multi-scale, multi-model approach for analyzing the future dynamics of European land use. Ann. Reg. Sci. 2007, 42, 57–77. [Google Scholar] [CrossRef]
  29. Verburg, P.H.; Overmars, K.P. Combining top-down and bottom-up dynamics in land use modeling: Exploring the future of abandoned farmlands in Europe with the Dyna-CLUE model. Landsc. Ecol. 2009, 24, 1167–1181. [Google Scholar] [CrossRef]
  30. Verburg, P.H.; van de Steeg, J.; Veldkamp, A.; Willemen, L. From land cover change to land function dynamics: A major challenge to improve land characterization. J. Environ. Manag. 2009, 90, 1327–1335. [Google Scholar] [CrossRef] [PubMed]
  31. Verburg, P.H.; Soepboer, W.; Veldkamp, A.; Limpiada, R.; Espaldon, V.; Mastura, S.S.A. Modeling the spatial dynamics of regional land use: The CLUE-S model. Environ. Manag. 2014, 30, 391–405. [Google Scholar] [CrossRef] [PubMed]
  32. Britz, W.; Verburg, P.H.; Leip, A. Modelling of land cover and agricultural change in Europe: Combining the CLUE and CAPRI-Spat approaches. Agric. Ecosyst. Environ. 2011, 142, 40–50. [Google Scholar] [CrossRef]
  33. Luo, G.P.; Yin, C.Y.; Chen, X.; Xu, W.Q.; Lu, L. Combining system dynamic model and CLUE-S model to improve land use scenario analyses at regional scale: A case study of Sangong watershed in Xinjiang, China. Ecol. Complex. 2010, 7, 198–207. [Google Scholar] [CrossRef]
  34. Zhu, Z.Q.; Liu, L.M.; Chen, Z.T.; Zhang, J.L.; Verburg, P.H. Land-use change simulation and assessment of driving factors in the loess hilly region—A case study as Pengyang County. Environ. Monit. Assess. 2009, 164, 133–142. [Google Scholar] [CrossRef] [PubMed]
  35. Zhang, L.P.; Zhang, S.W.; Zhou, Z.M.; Hou, S.; Huang, Y.F.; Cao, M. Spatial distribution prediction and benefits assessment of green manure in the Pinggu District, Beijing, based on the CLUE-S model. J. Integr. Agric. 2016, 15, 465–474. [Google Scholar] [CrossRef]
  36. Herrero, M.; Thornton, P.K.; Bernués, A.; Baltenweck, I.; Vervoort, J.; van de Steeg, J.; Makokha, S.; van Wijk, M.T.; Karanja, S.; Rufino, M.C.; et al. Exploring future changes in small holder farming systems by linking socio-economic scenarios with regional and household models. Glob. Environ. Chang. 2014, 24, 165–182. [Google Scholar] [CrossRef]
  37. Waiyasusri, K.; Yumuang, S.; Chotpantarat, S. Monitoring and predicting land use changes in the Huai Thap Salao Watershed area, Uthaithani Province, Thailand, using the CLUE-s model. Environ. Earth Sci. 2016, 75, 1–16. [Google Scholar] [CrossRef]
  38. Shrestha, S.; Htut, A.Y. Land use and climate change impacts on the hydrology of the Bago River Basin, Myanmar. Environ. Model. Assess. 2016. [Google Scholar] [CrossRef]
  39. Trisurat, Y.; Eawpanich, P.; Kalliola, R. Integrating land use and climate change scenarios and models into assessment of forested watershed services in Southern Thailand. Environ. Res. 2016, 147, 611–620. [Google Scholar] [CrossRef] [PubMed]
  40. Zhang, L.P.; Cao, M.; Xing, A.; Sun, Z.X.; Huang, Y.F. Modelling the spatial expansion of green manure considering land productivity and implementing strategies. Sustainability 2018, 10, 225. [Google Scholar] [CrossRef]
  41. UMass Landscape Ecology Lab. Available online: http://www.umass.edu/landeco/research/fragstats/documents/fragstats_documents.html (accessed on 5 June 2018).
  42. Jiang, G.H.; Wang, X.P.; Yun, W.J.; Zhang, R.J. A new system will lead to an optimal path of land consolidation spatial management in China. Land Use Policy 2015, 42, 27–37. [Google Scholar]
  43. Verburg, P.H.; Veldkamp, A.; Fresco, L.O. Simulation of changes in the spatial pattern of land use in China. Appl. Geogr. 1999, 19, 211–233. [Google Scholar] [CrossRef]
  44. Verburg, P.H.; Schulp, C.J.E.; Witte, N.; Veldkamp, A. Downscaling of land use change scenarios to assess the dynamics of European landscapes. Agric. Ecosyst. Environ. 2006, 114, 39–56. [Google Scholar] [CrossRef]
  45. Kline, J.D.; Moses, A.; Lettman, G.J.; Azuma, D.L. Modeling forest and range land development in rural locations, with examples from eastern Oregon. Landsc. Urban Plan. 2007, 80, 320–332. [Google Scholar] [CrossRef] [Green Version]
  46. Lambin, E.F. Modelling and monitoring land-cover change processes in tropical regions. Prog. Phys. Geogr. 1997, 21, 375–393. [Google Scholar] [CrossRef]
  47. Lambin, E.F.; Rounsevell, M.D.A.; Geist, H.J. Are agricultural land-use models able to predict changes in land-use intensity? Agric. Ecosyst. Environ. 2000, 82, 321–331. [Google Scholar] [CrossRef]
  48. Schulp, C.J.E.; Nabuurs, G.-J.; Verburg, P.H. Future carbon sequestration in Europe—Effects of land use change. Agric. Ecosyst. Environ. 2008, 127, 251–264. [Google Scholar] [CrossRef]
  49. Pontius, R.G., Jr.; Schneider, L.C. Land-cover change model validation by an ROC method for the Ipswich watershed, Massachusetts, USA. Agric. Ecosyst. Environ. 2001, 85, 239–248. [Google Scholar] [CrossRef]
  50. Gobin, A.; Campling, P.; Feyen, J. Logistic modelling to derive agricultural land use determinants: A case study from southeastern Nigeria. Agric. Ecosyst. Environ. 2002, 89, 213–228. [Google Scholar] [CrossRef]
  51. Bergsten, A.; Zetterberg, A. To model the landscape as a network: A practitioner’s perspective. Landsc. Urban Plan. 2013, 119, 35–43. [Google Scholar] [CrossRef]
  52. Pierce, S.M.; Cowling, R.M.; Knight, A.T.; Lombard, A.T.; Rouget, M.; Wolf, T. Systematic conservation planning products for land-use planning: Interpretation for implementation. Biol. Conserv. 2005, 125, 441–458. [Google Scholar] [CrossRef]
  53. Soltanmohammadi, H.; Osanloo, M.; Aghajani Bazzazi, A. An analytical approach with a reliable logic and a ranking policy for post-mining land-use determination. Land Use Policy 2010, 27, 364–372. [Google Scholar] [CrossRef]
Figure 1. The location and elevation of the study region.
Ijgi 07 00305 g001
Figure 2. The land use map of the study region (2007).
Ijgi 07 00305 g002
Figure 3. Technical flow of this study.
Ijgi 07 00305 g003
Figure 4. The spatial distribution of AML patches and their sizes in 2007.
Ijgi 07 00305 g004
Figure 5. The proximity values of AML patches before reclamation.
Ijgi 07 00305 g005
Figure 6. The patches to be reclaimed and not to be reclaimed before the end of 2020.
Ijgi 07 00305 g006
Figure 7. Transformations of AML under different reclamation scenarios: (a) Scenario 1: fertility dependent cultivation or forestry; (b) Scenario 2: elevation dependent cultivation or forestry; (c) Scenario 3: urbanization, cultivation and forestry.
Ijgi 07 00305 g007
Figure 8. Land-use maps of the entire study region in 2020 under different scenarios: (a) Scenario 1: fertility dependent cultivation or forestry; (b) Scenario 2: elevation dependent cultivation or forestry; (c) Scenario 3: urbanization, cultivation and forestry.
Ijgi 07 00305 g008
Table 1. The ecological descriptions of landscape-scale graph metrics.
Landscape-Scale Graph MetricsEcological DescriptionReferences
Mean patch size (MPS)The area occupied by a particular patch type divided by the number of patches of that type.[8]
Number of patches (NP)Total number of patches in the landscape. A simple measurement of subdivision and other measures of aggregation.[10]
Contagion (CONTAG)Measuring the degree of aggregation and clumpiness of the overall landscape patterns.[9]
Aggregation index (AI)Quantification of the level of aggregation of spatial patterns. In addition, it provides a quantitative basis for correlating spatial patterns with processes that are typically class specific.[9]
Shape index (SHAPE)It measures the degree of departure of a spatial pattern from geometric shapes. Higher values indicate a shape further differing from the standard shape(square).[9]
Integral index of connectivity (IIC)The probability that two dispersers randomly located in the landscape can access each other.[23,24]
Table 2. The descriptive statistics of different sizes of patches after reclamation.
Classifications of Patches 1Number of PatchesRate (%)Area of Patches (ha) Rate (%)Patch-Scale Proximity Index
MinimumMaximumMean
huge patches60.02231956.152.4342.8118.22
large patches70.0243210.460148.1440.34
medium patches370.1063115.280131.2819.09
small patches3050.8674818.110133.228.37
1 The patches are divided into four categories according to the patch area: huge patches (greater than 100 ha), large patches (50–100 ha), medium patches (10–50 ha) and small patches (less than 10 ha).
Table 3. The reclaimed areas and their percentages under different scenarios after reclamation.
ScenariosReclaimed Cultivated Land (ha)Percentage (%)Reclaimed Forest Land (ha)Percentage (%)Reclaimed Construction Land (ha)Percentage (%)
Scenario 1209258.55108430.3439711.11
Scenario 23128.73307886.151835.12
Scenario 32817.8672120.18257171.96
Table 4. The connectivity characteristics of the three scenarios after reclamation.
Landscape IndicesScenario 1Scenario 2Scenario 3
MPS91.889098.580798.1131
NP157614691476
CONTAG68.259469.806668.4399
AI91.693192.009691.8645
SHAPE1.20671.19741.2021
IIC0.63970.66440.6497