Article

3D WebGIS: From Visualization to Analysis. An Efficient Browser-Based 3D Line-of-Sight Analysis

GIScience Research Group, Institute of Geography, Heidelberg University, 69120 Heidelberg, Germany
*
Author to whom correspondence should be addressed.
ISPRS Int. J. Geo-Inf. 2018, 7(7), 279; https://doi.org/10.3390/ijgi7070279
Submission received: 30 May 2018 / Revised: 6 July 2018 / Accepted: 19 July 2018 / Published: 21 July 2018
(This article belongs to the Special Issue Web and Mobile GIS)

Abstract

:
3D WebGIS systems have been mentioned in the literature almost since the beginning of the graphical web era in the late 1990s. The potential use of 3D WebGIS is linked to a wide range of scientific and application domains, such as planning, controlling, tracking or simulation in crisis management, military mission planning, urban information systems, energy facilities or cultural heritage management, just to name a few. Nevertheless, many applications or research prototypes entitled as 3D WebGIS or similar are mainly about 3D visualization of GIS data or the visualization of analysis results, rather than about performing the 3D analysis itself online. This research paper aims to step forward into the direction of web-based 3D geospatial analysis. It describes how to overcome speed and memory restrictions in web-based data management by adapting optimization strategies, developed earlier for web-based 3D visualization. These are applied in a holistic way in the context of a fully 3D line-of-sight computation over several layers with split (tiled) and unsplit (static) data sources. Different optimization approaches are combined and evaluated to enable an efficient client side analysis and a real 3D WebGIS functionality using new web technologies such as HTML5 and WebGL.

1. Introduction

This paper aims to promote the usage of WebGIS beyond visualization as an analytical tool. We describe the implementation and evaluation of a browser based 3D line-of-sight analysis. Besides computing if the line between two points in 3D space is obstructed or not, the analysis returns the point of obstruction, which is determined by finding the closest intersection of the sight line with any triangle in the scene. To tackle performance and scalability issues, it uses strategies such as compression, tiling, streaming and caching known to work for visualization and adapts them to carry out data intensive analyses over the web. It takes a holistic view on the problem scope by presuming a realistic use case where an analysis has a prior phase of visualization, and that the data to be analyzed are composed of several layers with different characteristics and potentially integrated from distributed sources. The described method for a 3D line-of-sight analysis takes advantage of that holistic view, which opens more possibilities for process optimization than considering only the visibility computation.
The example of a 3D line-of-sight computation demonstrates well the challenges that have to be solved in the context of the browser based spatial analyses. Its efficient computation is relevant for the development of further 3D WebGIS functionalities, as the line-of-sight can be used as an atomic process of more complex visibility analysis such as viewsheds.
To demonstrate the qualities of the proposed concept, it was evaluated in different scenarios (Figure 1) to reveal the potential performance gains and its scalability as well as its limitations in different usage constellations.
Before discussing the related work of 3D WebGIS, 3D line-of-sight computation and WebGIS performance research in Section 2, the following two subsections provide an overview of the context in which this work makes its contribution, beginning with general remarks on the relevance of WebGIS in the next subsection and closing the Introduction with a short summary of research challenges in the realm of WebGIS.

1.1. Why Do We Need WebGIS?

At the end of 2017, there were about 4 billion (~51.8%) people using the Internet worldwide [1]. In developed countries, more than 80% of individuals use the Internet [2]. These numbers show the simple fact that our societies have incorporated the Internet as one of the most important technologies for information and communication. The Internet, and especially the World Wide Web, facilitate access to spatial information and services that can provide fast and easy solutions to spatial questions from private individuals, over public administration to business applications. However, why do we need WebGIS? We are using the web extensively to solve our daily tasks and we have a big demand for spatial information in a wide spectrum of use cases and application domains, e.g., public participation in planning (e.g., [3]), natural resource management, market research or logistics, just to name a few. The widespread use of GIS applications distributed over the web has changed the early role of desktop GIS as specialized analysis tools to being a media type for communicating geographic information to a broad audience [4]. Many WebGIS applications have a strong focus on communication by means of web mapping, nevertheless it is important to enable WebGIS applications to cover other important aspects of GIS software, such as data capture, data management and especially data analysis. The effort made in the approach of this paper is a step in the direction of enabling WebGIS applications to perform analysis even on large datasets efficiently over the web. Hereby, the approach follows the paradigm of client-side computation in favor of more flexibility on how the user can combine private local data with provided published data from a spatial data infrastructure (SDI) without the need to upload any of his data to a remote server.
Before giving the details of the proposed method for a browser-based client-side line-of-sight analysis, some remarks on the general research scope of WebGIS are given below.

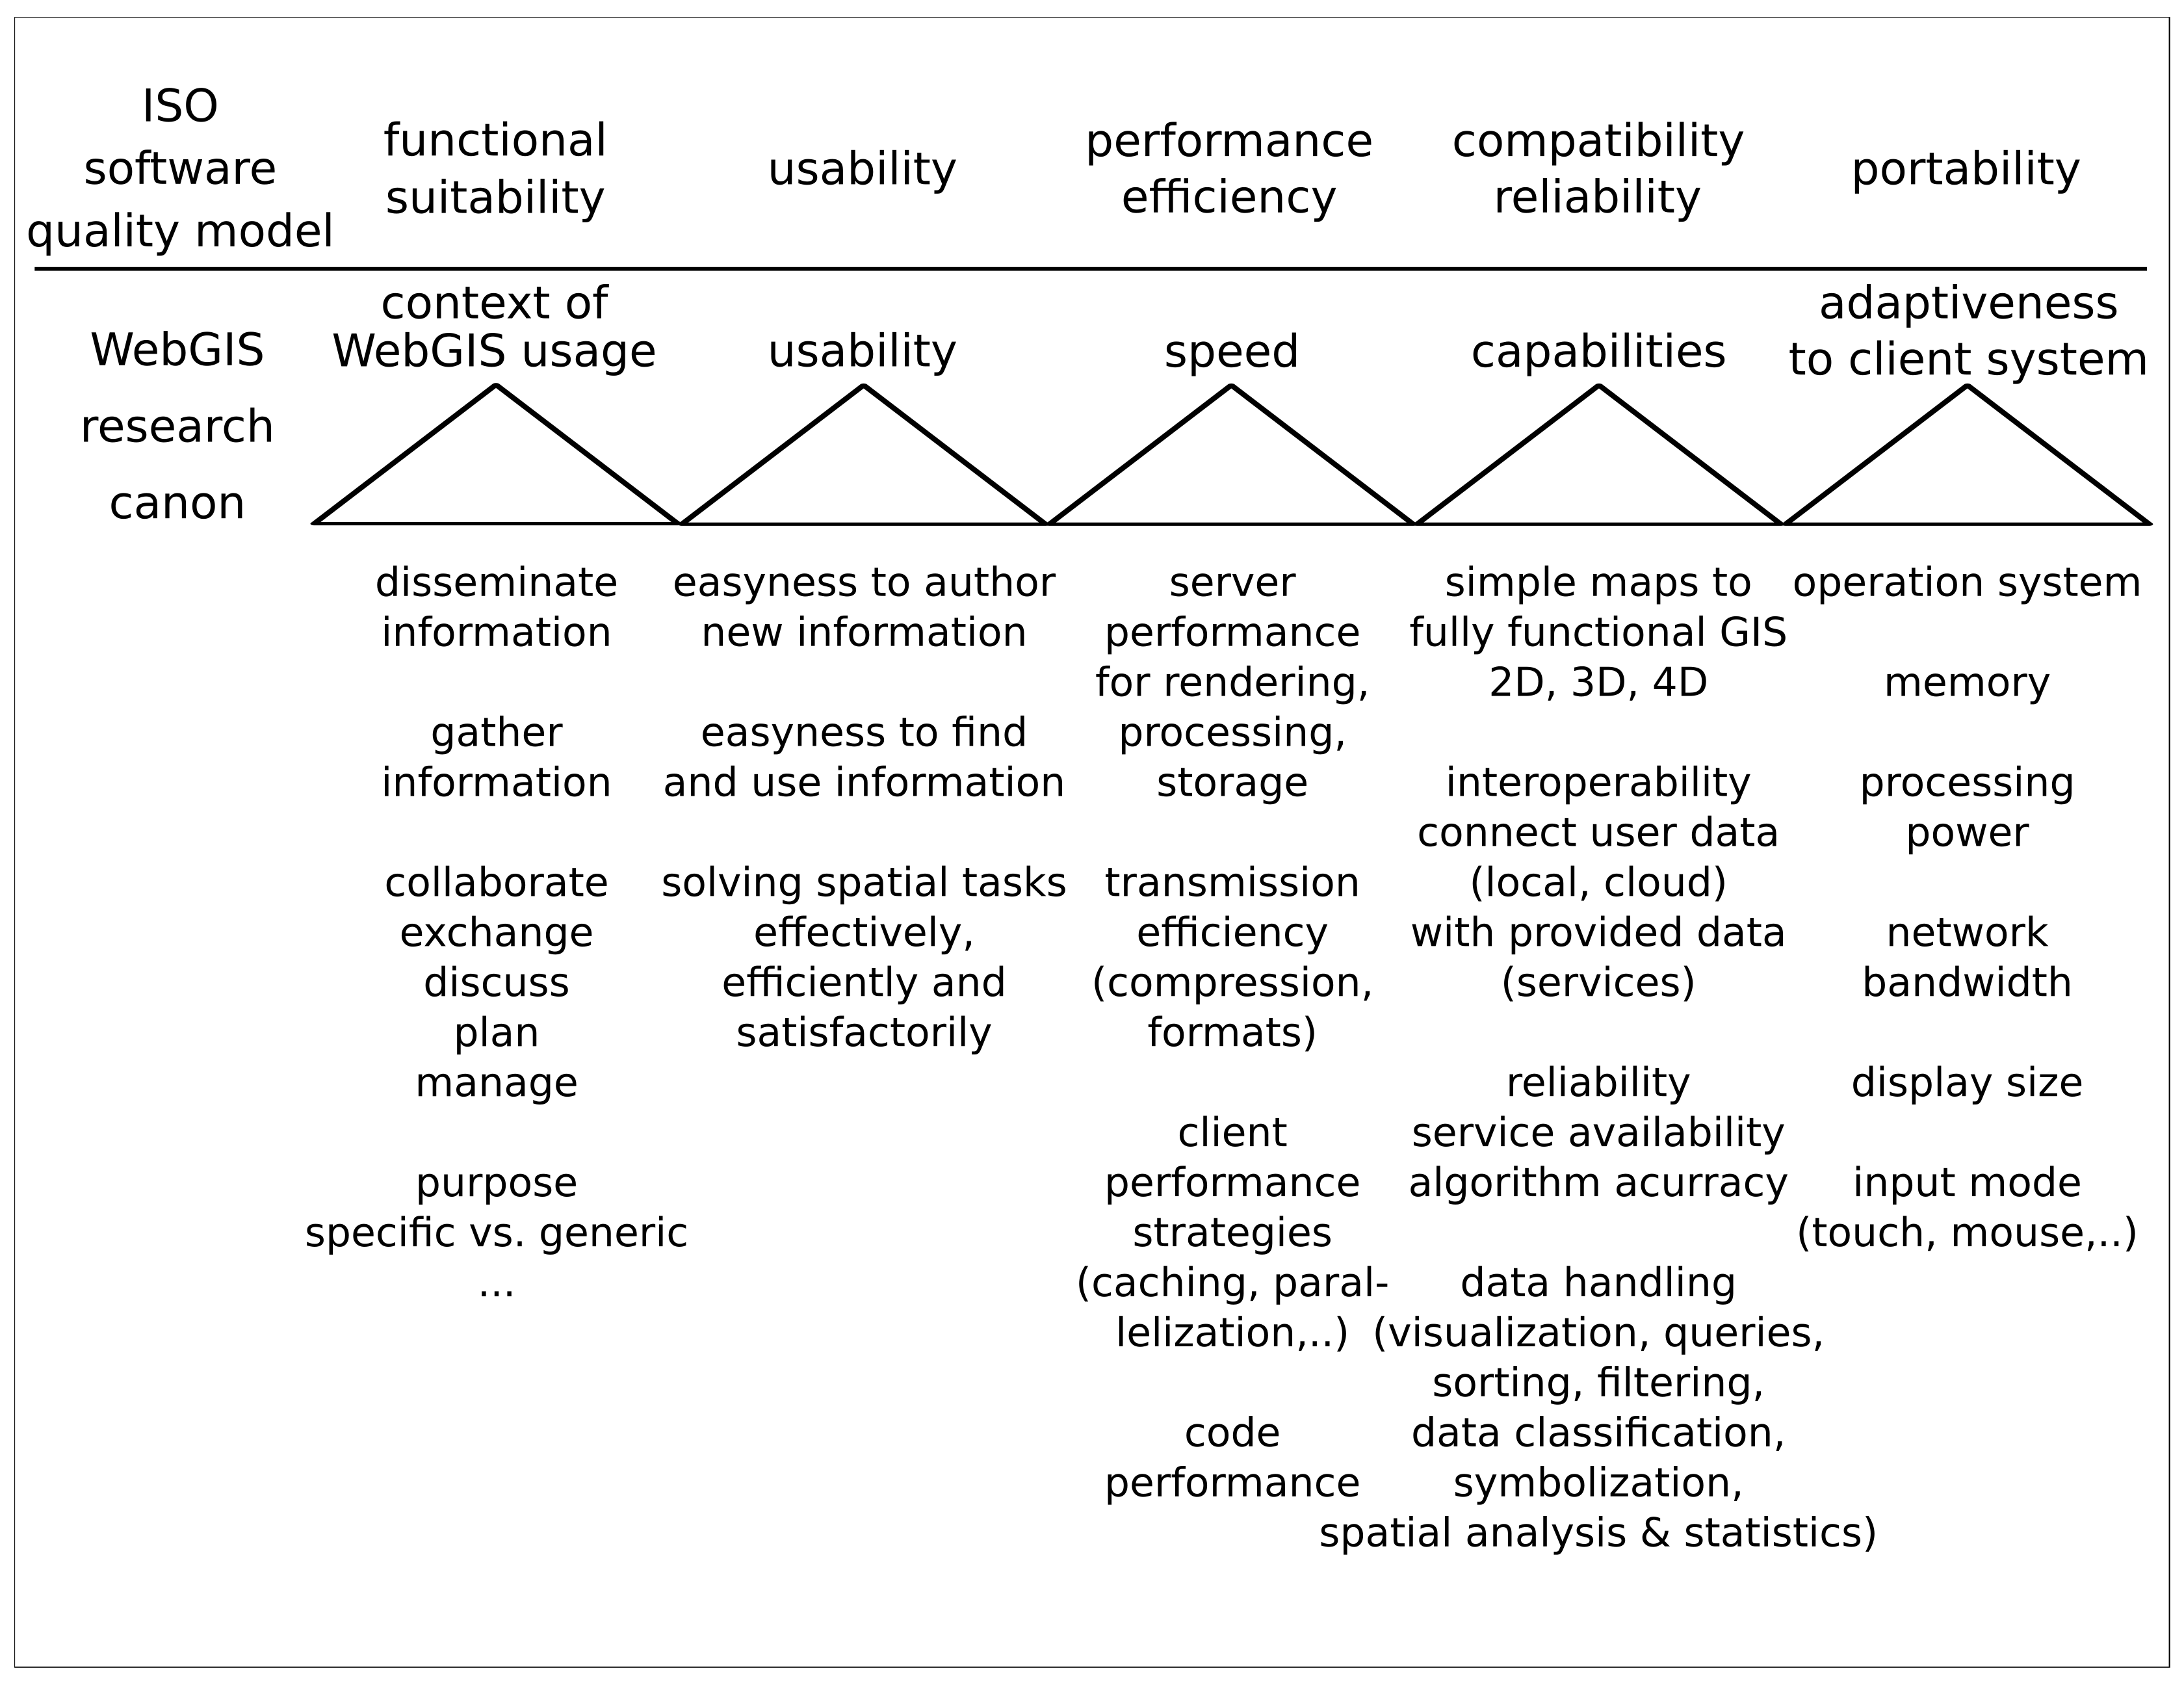
1.2. The Research Challenges of WebGIS

The challenges that have to be addressed in research to make WebGIS a useful means of understanding spatial phenomena and communicating geographic information are manifold. The main topics in Figure 2 are related to the ISO/IEC 25010 standard for Systems and Software engineering [5], which defines a software product quality model. This model is composed of eight characteristics. Having these general characteristics of software quality in mind and relating them to the context of WebGIS reveals a subjective selection of topics and issues for a research canon of WebGIS. However, it might provide a useful starting point of discussion to sort and develop the field of WebGIS research. Some of the issues are more general and also apply to other kinds of web applications, e.g., adaptiveness, while others are more specific to WebGIS applications and need specific solutions, such as map usability, compression techniques or data retrieval strategies and high-performance analysis computations. In the overall concept of WebGIS, various different scientific fields are involved in the research scope, e.g., cartography, psychology of perception, human–computer interaction, communication science, ergonomics, art and design, computer science, geoinformatics, and domain experts from the thematic field of usage where the WebGIS is applied. To solve all the challenges in the realm of web-based GIS research, a broad interdisciplinary effort would be necessary. This paper mainly focuses on two aspects of browser-based client-side GIS analyses, speed and capabilities (compare in Figure 2). The strategies to reach these goals are exemplified by examining and evaluating an implementation of a browser-based 3D line-of-sight analysis.

2. Related Work

2.1. History and Current State of 3D WebGIS

The development of 3D WebGIS can be subdivided into a history of formats, hardware, bandwidth and software. While the first format for 3D web content was developed already in the early days of the World Wide Web in 1994—namely VRML [6]—the other components needed almost 30 years to be usable in a broad market. Hardware in the sense of powerful graphics cards became continuously better over time. The access to high bandwidth rates are still very dependent on the place where someone lives. Until today, developing countries, as well as rural areas in industrial countries, often lack access to fast Internet [2]. In the case of software, it took until December 2010 for the first web browser to natively support 3D content, when Google Chrome version 8 started to partially support the new WebGL Standard [7], which was officially released three months later in 2011. Today, WebGL is at least partially supported by all major desktop and mobile web browsers [8]. Before, mostly plugins (e.g., Cortona3D (http://www.cortona3d.com/de/cortona3dviewer), FreeWRL (http://freewrl.sourceforge.net/), etc.) or Java applets (e.g., XNavigator (http://xnavigator.sourceforge.net/doku.php)) have been used for direct browser integration or standalone desktop applications. Both were able to communicate with web resources (e.g., WorldWind (https://worldwind.arc.nasa.gov/), Google Earth (https://www.google.com/intl/de/earth/desktop/), etc.) but had to be downloaded and installed. Current examples of WebGL based 3D WebGIS frameworks are: OpenWebGlobe (http://www.openwebglobe.org/), Cesium (https://cesiumjs.org/), NASA Web World Wind (https://worldwind.arc.nasa.gov/), TerraExplorer for Web (http://skylineglobe.com/sg/TerraExplorerWeb/TerraExplorer.html), ESRI 3D Scene Viewer (http://www.esri.com/software/scene-viewer), or GIScene.js (http://giscience.github.io/GIScene.js/).
Another important part of facilitating 3D WebGIS is the efforts of standardization. In 2010, two standardization proposals were published as OGC Discussion Papers: (1) the Web View Service (WVS) [9] using server side rendering; and (2) the Web 3D Service (W3DS) [10] delivering 3D data for client side rendering. Both strategies have been included in the recently approved OGC 3D Portrayal Service Standard 1.0 (3DPS) [11] which enables interoperable service based presentation of 3D content.
A good overview on 3D representation, geometric and topological datamodels, database models, formats and applications is given in [12,13].

2.2. 3D Line-of-Sight Computation

Lines-of-sight play a role in different research areas. In computer graphics, visibility computations are used to determine visible surfaces for rendering, improving this rendering through visibility culling, computing shadows as a result of being not visible from a light source and more [14]. In GIS, lines-of-sight are used, e.g., in urban planning, telecommunication planning [15], military simulations [16] or archaeological analyses [17].
In computer graphics, ray shooting is involved in many algorithms used to solve visibility problems. A special case of ray shooting can be used to compute point-to-point visibility in 2D and 3D [14]. Many visibility analyses in GIS are available for 2.5D data based on raster [18,19,20,21] or TIN structure [22,23,24]. In these cases, for the line-of-sight computation, several restrictions can be observed: (1) observer and target must be on or above the surface; and (2) all participating data layers must be preprocessed into a single digital surface model. In the case of 3D ray shooting, these limitations can be overcome. A ray is a half-line, which is represented by a start point and a direction. Such a ray can then be tested on intersection with the surface triangles of objects in the scene. Thus, it does not matter if the objects in the scene originate from one or several sources or layers. All intersection points of triangles that have been detected to intersect the ray can be sorted by their distance to the rays starting point. The closest intersection identifies the object that causes the visual obstruction. Several ray-triangle intersection algorithms are available [25,26,27,28].

2.3. WebGIS Performance Research

There is a lot of literature about WebGIS in general and even more about applications, but searching explicitly for scientific work on “WebGIS performance” reveals sparse results. Some early work exists describing techniques to reduce the amount of data transmission through a tiling and indexing approach (e.g., [29]). The general idea of this approach is also used in this paper, although in a different shaping. Further WebGIS performance improving techniques have been described by Yang et al. [30] and Yang et al. [31]. For the server-side, they proposed multi-threaded request handling and distributed processing using computer clusters. For the reduction of data transmission, they proposed a pyramid approach for raster images and evaluated the effect of compression on vector data. Further, client side data caching is proposed to reduce server and network loads. Zhang et al. [32] optimized the performance of a JavaApplet based WebGIS Application. The largest gain of performance could be reached through a serve-side cache for map tiles to avoid on-the-fly map rendering. Recent work on WebGIS performance focuses more on distributed data storage and processing in cloud environments (e.g., [33,34]). Current implementations for geospatial and even spatiotemporal storage and processing of Big Spatial Data are, e.g., Spatial Hadoop (http://spatialhadoop.cs.umn.edu/), Geomesa (http://www.geomesa.org/), GeoWave (http://locationtech.github.io/geowave/) or especially for large rasterdata repositories the rasdaman database (http://www.rasdaman.com/).

3. Methods

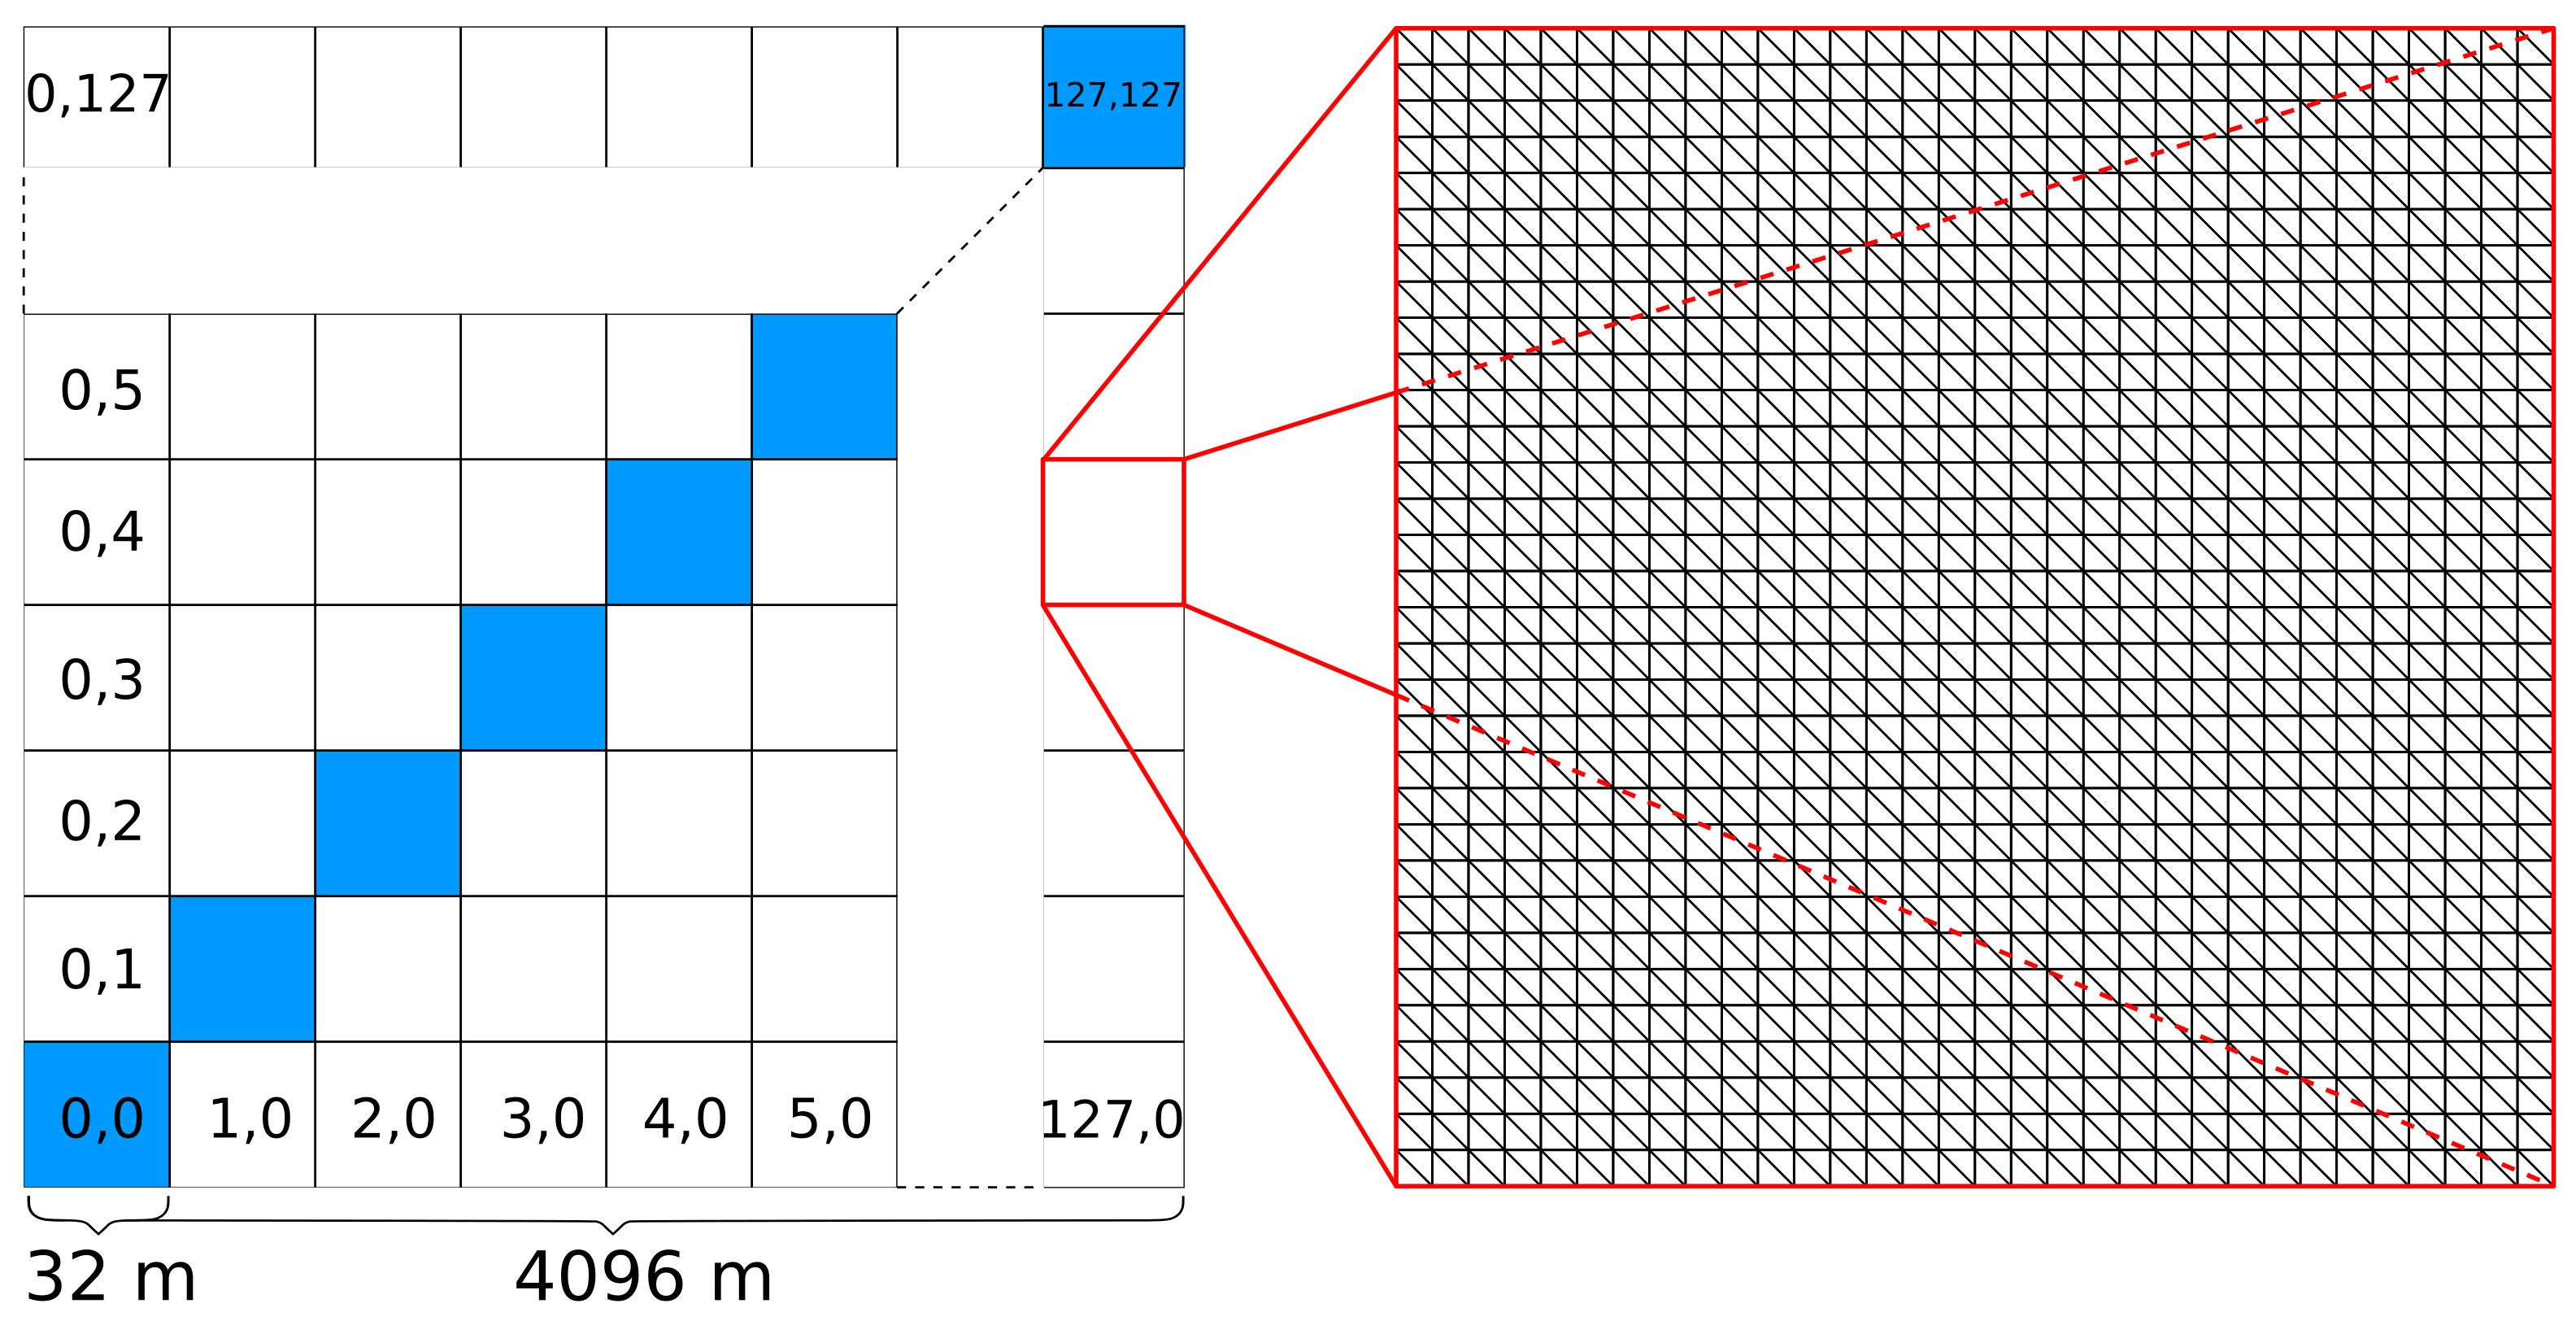
3.1. Creating a LiDAR-Inspired Artificial Test Dataset

For the evaluation of the proposed optimizations for the data handling during the analysis phase, it is very useful to have full control over the data structure, data size, and obstacle locations. Full control can only be achieved by designing and creating an artificial dataset. To achieve a realistic behavior of the WebGIS and the analysis process, the test data represent the characteristics of an airborne LiDAR derived triangulated digital elevation model (DEM) with a horizontal resolution of 1 m (point spacing) and a total area of ∼16 km 2 (4096 m × 4096 m). As a single regular triangulated DEM, this would result in a dataset with 16,785,409 vertices and 33,554,432 triangles. With current technologies, it is not feasible to load such a dataset into a browser-based WebGIS at once for visualization or analysis purposes. It has to be prepared making use of different strategies that enable the web-based usage of such a dataset. Typically, for visualization purposes, the data would be further processed into a series of datasets with each having a lower resolution to reduce the data size. The resulting set of datasets, known as Levels-of-Detail (LoD) (e.g., [35,36]), can be cut afterwards into smaller units, e.g., tiles. To be able to display several parts of different LoDs simultaneously in one scene, e.g., depending on the distance to the camera, the parts of one LoD have to be interchangeable with parts from the adjacent LoDs. In the case of partition into tiles, each one can be represented in the next higher LoD by four tiles, such that a quadtree-like data structure evolves (Figure 3). The tiled structure of the dataset is not only useful for the visualization of large datasets, but enables also the reduction of the data size necessary to be loaded for a specific line-of-sight analysis. We can use this data structure to reduce the potential data to be downloaded for the analysis to just those tiles whose 2D bounding boxes are intersected by the 2D line segment, projected on a horizontal plane, representing the line-of-sight. By tiling a triangulated dataset, it becomes bigger so that finally the artificial test dataset with the original resolution gets 17,989,632 vertices, an increase of ∼7%, while in our case the numbers of triangles stays constant.
The dataset is designed such that its surface is completely flat except for systematically distributed obstacles in some of the tiles (Figure 4 and Figure 5). This way, we can run several test analyses with varying oberserver–obstacle distances to measure the effect of the different optimizations.
The test data were created using a script that automatically creates tiles in different LoDs with different resolutions and tile sizes and stores them in a database such that each LoD is represented in one table. The geometry is stored as polyhedralsurface, a PostGIS data type that stores 3D surfaces as a collection of polygons, but also as JSON representation in the THREE.js-JSON scene-format 3.2 (https://github.com/mrdoob/three.js/wiki/JSON-Model-format-3), which is natively supported by the THREE.js JavaScript visualization library. Additionally, a centroid is stored in a separate database column for fast spatial indexing of the tiles. The LoD tables are all indexed using the gist-index provided by PostGIS as the standard spatial index to speed up search times for spatial queries such as bounding box queries. The simultaneous storing of two geometry representations has the advantage that one type, the polyhedralsurface, can be used in spatial queries with PostGIS functions while the other type, the JSON representation, can directly be given out to be delivered to the web client without ad hoc conversion from one format to the other.

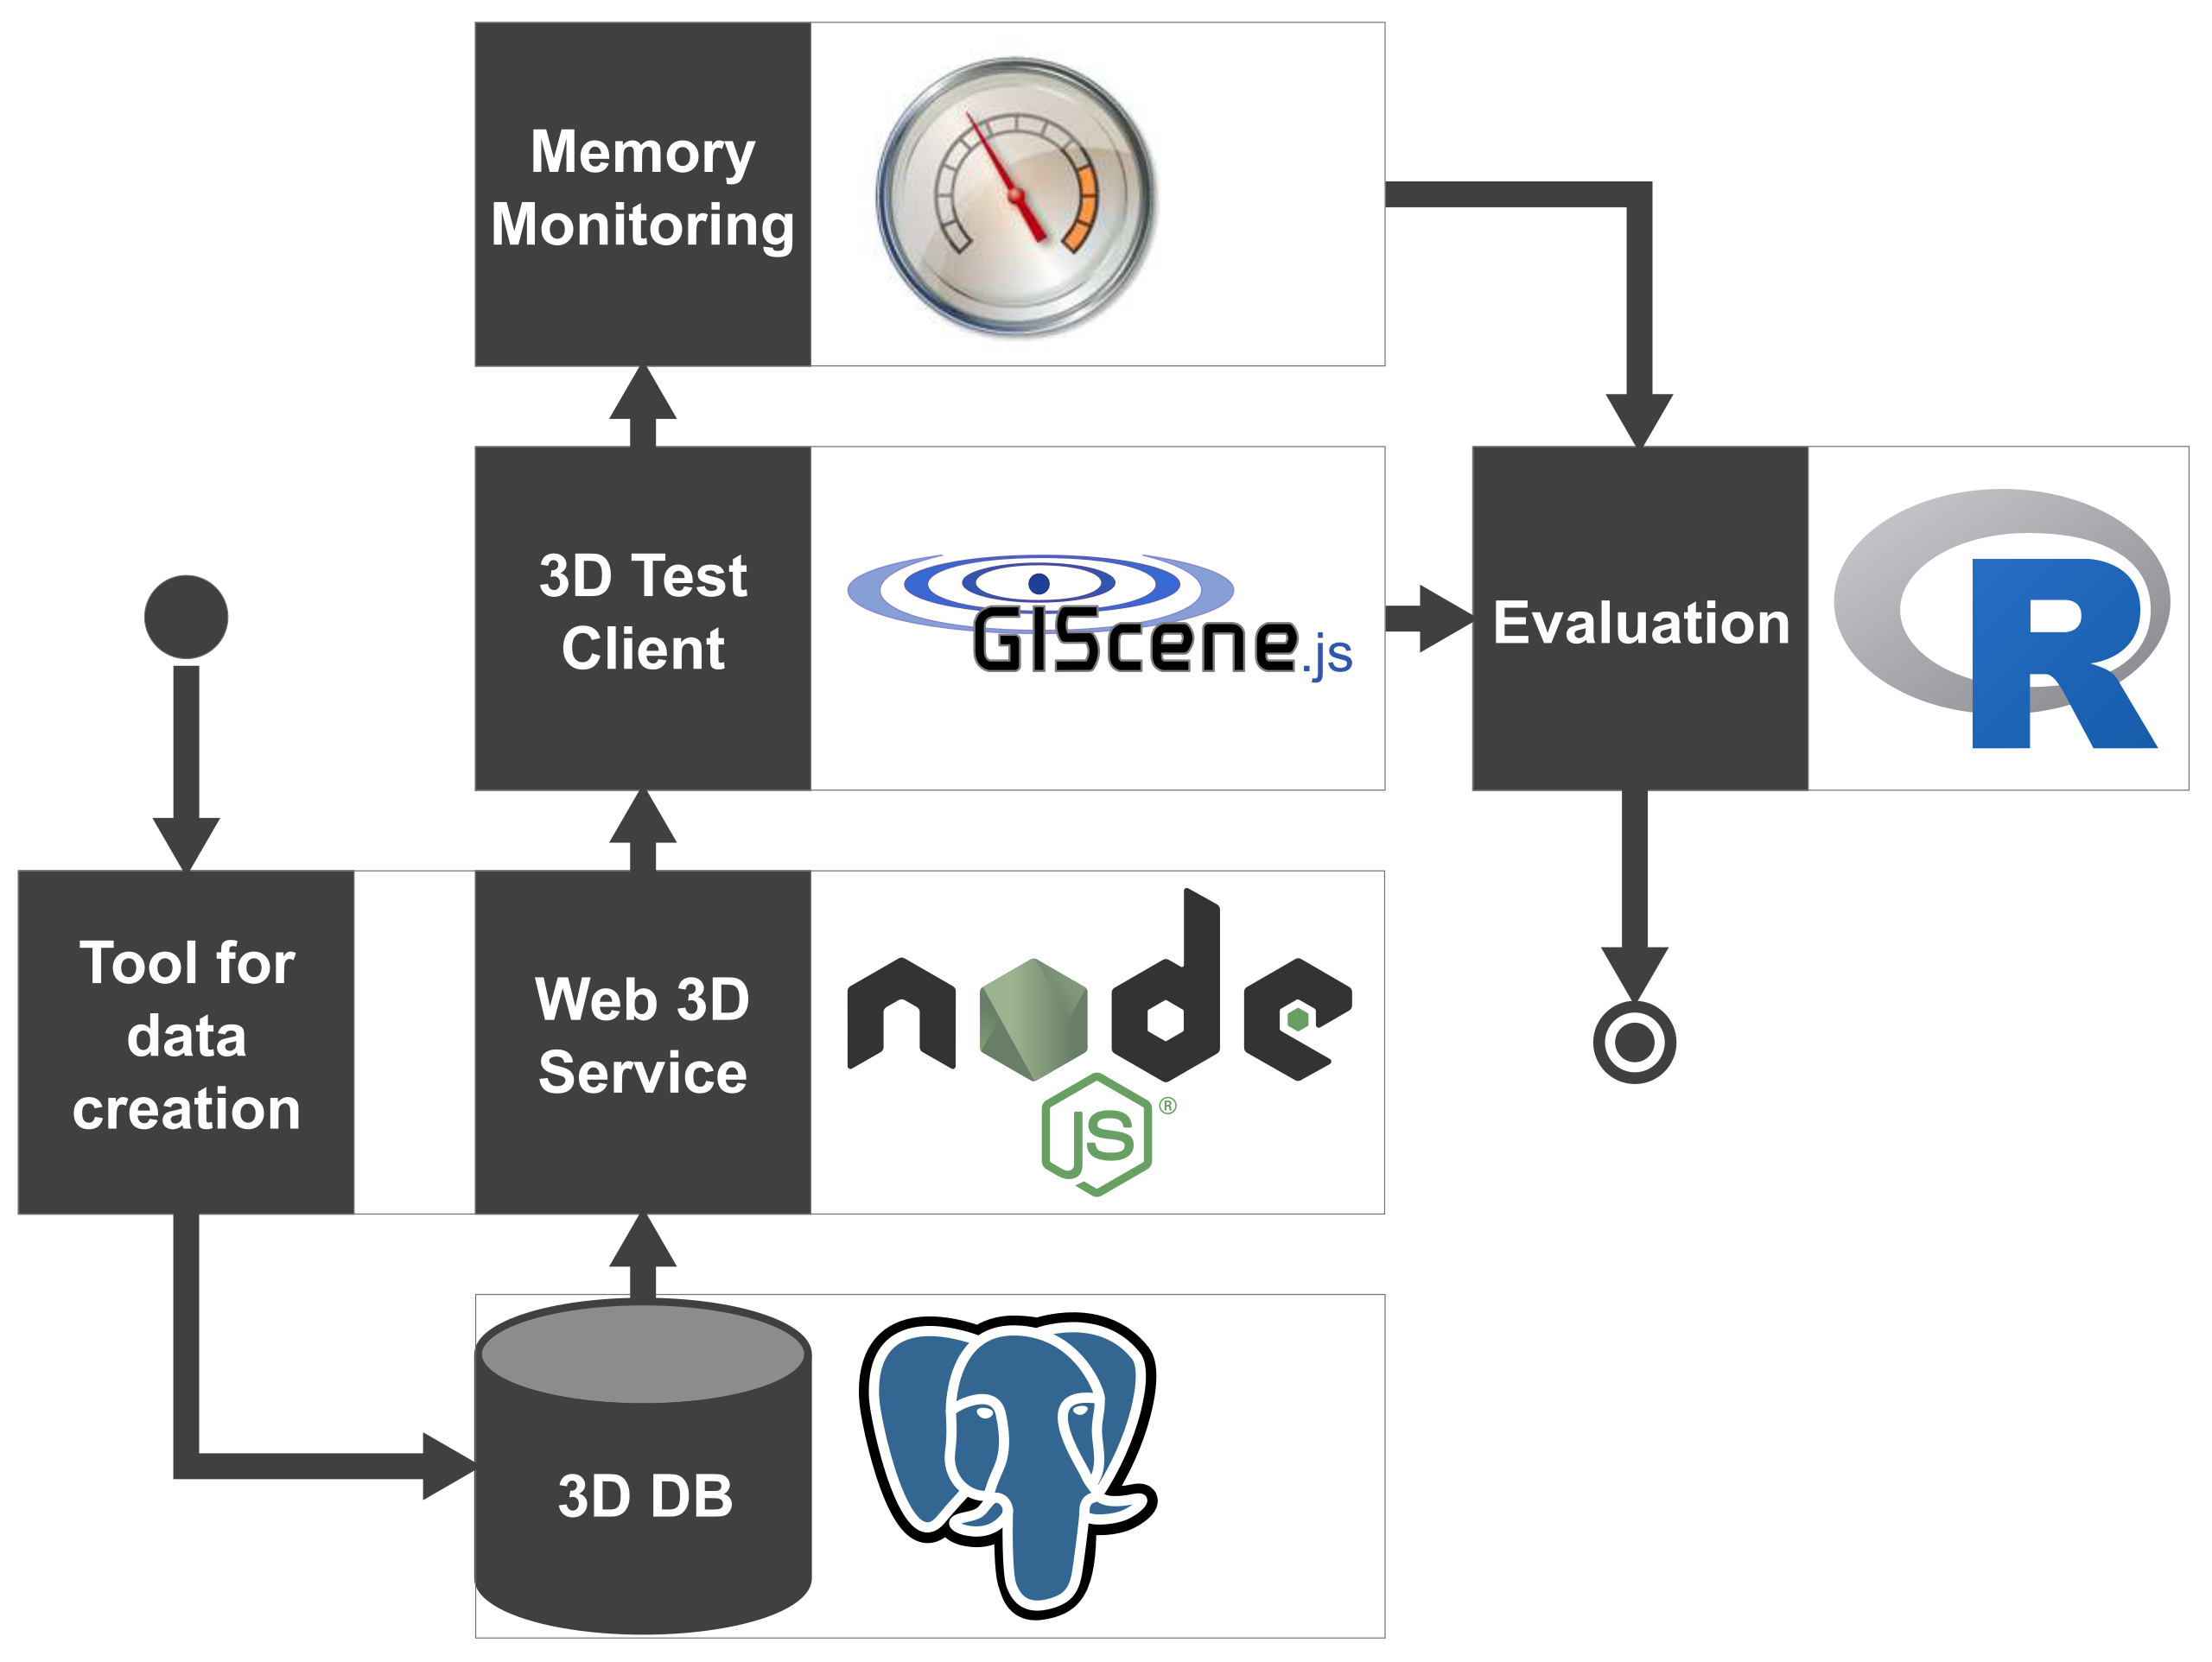
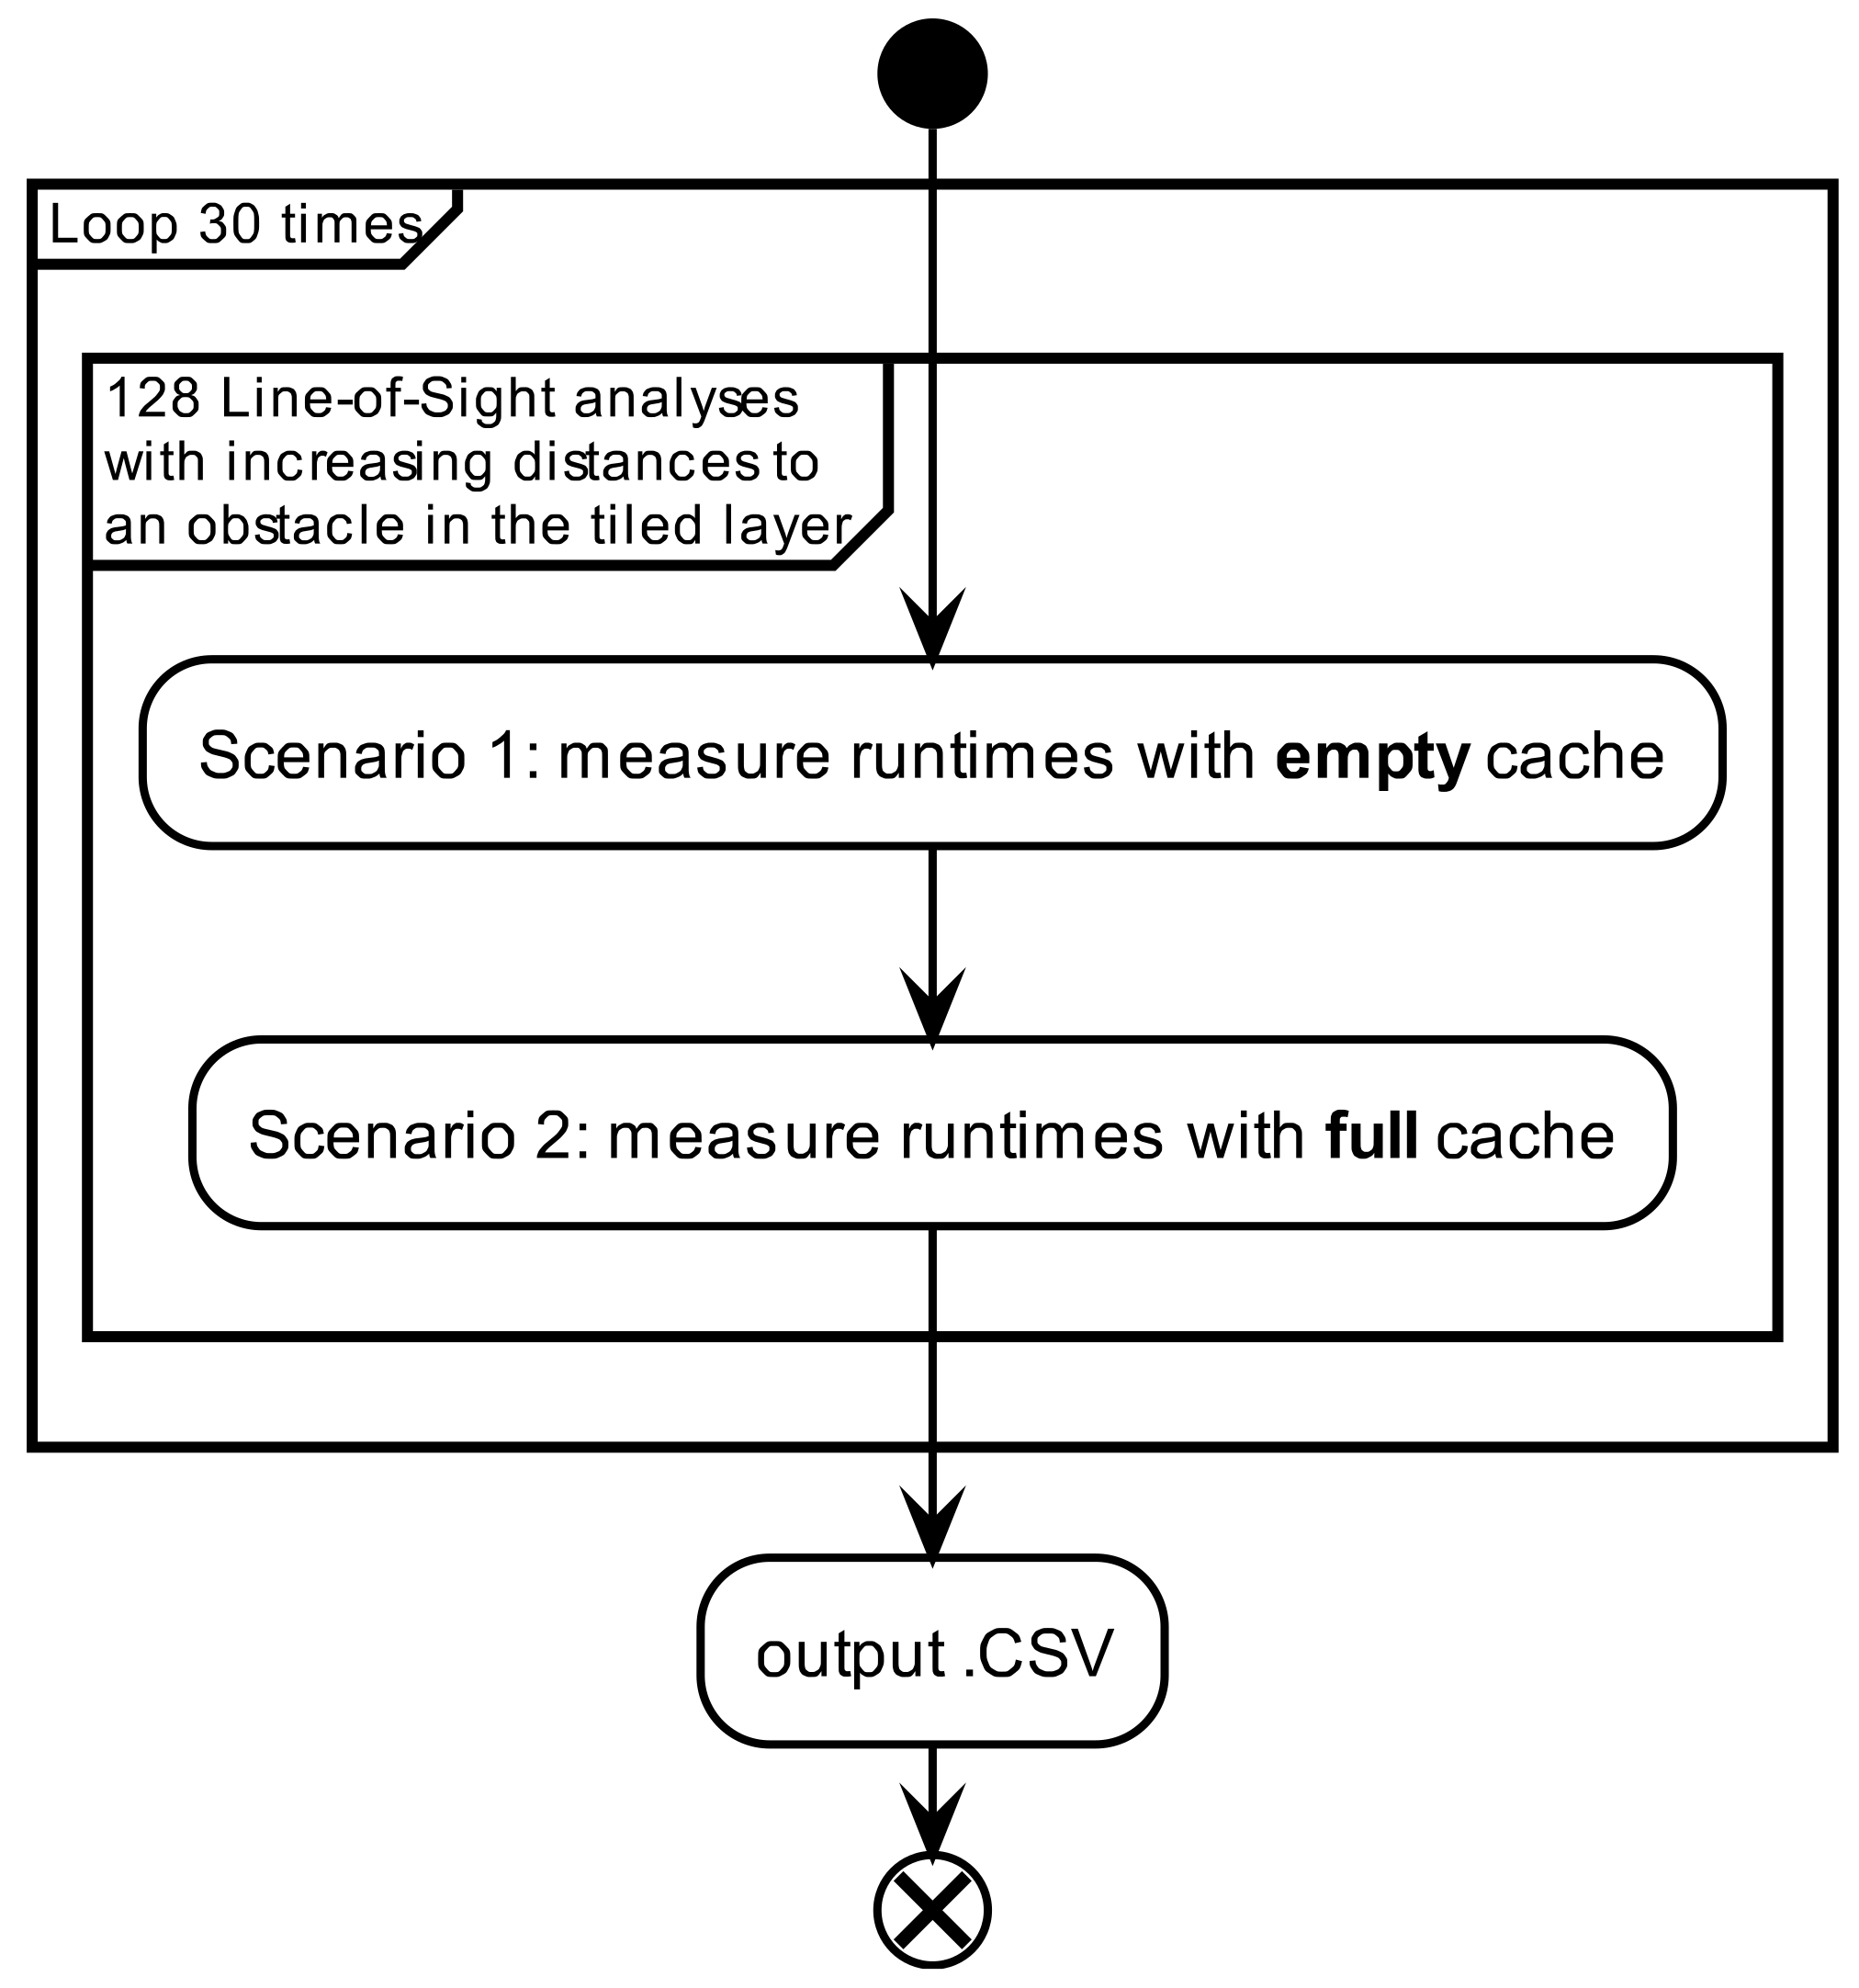
3.2. Test Environment

To deliver the test data to the client, a test environment was created (Figure 6). This environment contains a spatial database (PostgreSQL/PostGIS) and a web service that delivers the data based on Node.js (https://nodejs.org—Node.js is a JavaScript runtime for server-side scripting and development of web services). The service API implements the interface of the Web 3D Service (W3DS) specification [10], which is currently an OGC Discussion Paper for standardization. The client in this case is a browser application using the JavaScript library GIScene.js (http://giscience.github.io/GIScene.js/) which itself depends on Three.js (https://threejs.org—THREE.js is a popular library for web-based 3D Visualizations using the browsers native API for WebGL) and WebGL [37]. While hlThree.js is an abstraction library for WebGL, GIScene.js adds geographic concepts to the 3D library such as spatial reference systems, data organization as layers, implementation of OpenGIS Web Service (OWS) standards and geospatial analysis functionality.
To measure the performance behavior in the different scenarios (Figure 1), two test functions were implemented for the test client: one for the “single layer” scenario variant and one for the “multi layer” scenario variant. Both test functions follow the same pattern (Figure 7).
According to the tile layout (Figure 4 and Figure 5) of the artificial dataset, the lines-of-sight to be tested were constructed as follows. At the center position of each of the 128 grid rows, one line-of-sight was constructed from the western border to the eastern border of the dataset. Each line represents a test case of the analysis with equal distances between observer and target points but with varying distances to the point of obstruction, which has to be found. This layout gives the possibility to test each line-of-sight twice, one after another, to measure the influence of the caching strategy (empty cache vs. full cache) and the influence of topographic variance in the 3D scene (varying distances to obstruction points). The cache filling automatically takes place during the first run of each line-of-sight analysis. All first runs with an empty cache deliver the worst case measurements (Figure 8a,c), while all second runs deliver the best case values (Figure 8b,d). The comparison of both results shows the potential performance gains by utilizing a tile cache for the analysis process and secondly it illustrates the extremes between which a real case could perform. These variations indicate the advantage of the method, that is, through using tiles in a split-up analysis, we can skip a part of the analysis, once we have determined the closest obstacle from the observer. This means that those analyses, finding a close obstacle, will finish much faster than analysis with far obstacles, independently of the total length of the line-of-sight. These 128 double measured analysis are further repeated 30 times to create a median value of the performance behviour to eliminate other influences on the measurements such as varying network speed or other activities performed by the operating system during the measurement phase. Finally, all measurements are given out as a comma separated value list for further usage.
To measure the duration with sufficient precision, especially for the best case scenarios, where an analysis runs only a few milliseconds, it was necessary to use the “W3C High Res Time API” [38], which in contrast to the common JavaScript Date-object, is independent of the system clock and therefore can deliver monotonic time values. Its resolution is up to five microseconds (=0.000005 s).
To measure and evaluate the memory consumption during the analyses, the built-in MS-Windows tool “Performance Monitor” was used to log the amount of Private Bytes of the browser process together with a timestamp into a CSV file. Using the timestamp, this information can then be combined with the log running inside the browser during the analysis which measures the durations of the line-of-sight computations. For the memory measurement, the used browser was an instance of Google Chrome Version 52.0.2743.82. To minimize external influences in the measurement, the browser was started with a disabled disk-cache, which normally caches a certain amount of server responses on the local hard drive to avoid network traffic and download times. Further, the in-memory-cache implemented in GIScene.js for tiled data was also disabled, such that the measurements reflect only what is used for holding the code, the input and results data, and what is needed for the computation.

3.3. A Browser-Based 3D Line-of-Sight Analysis
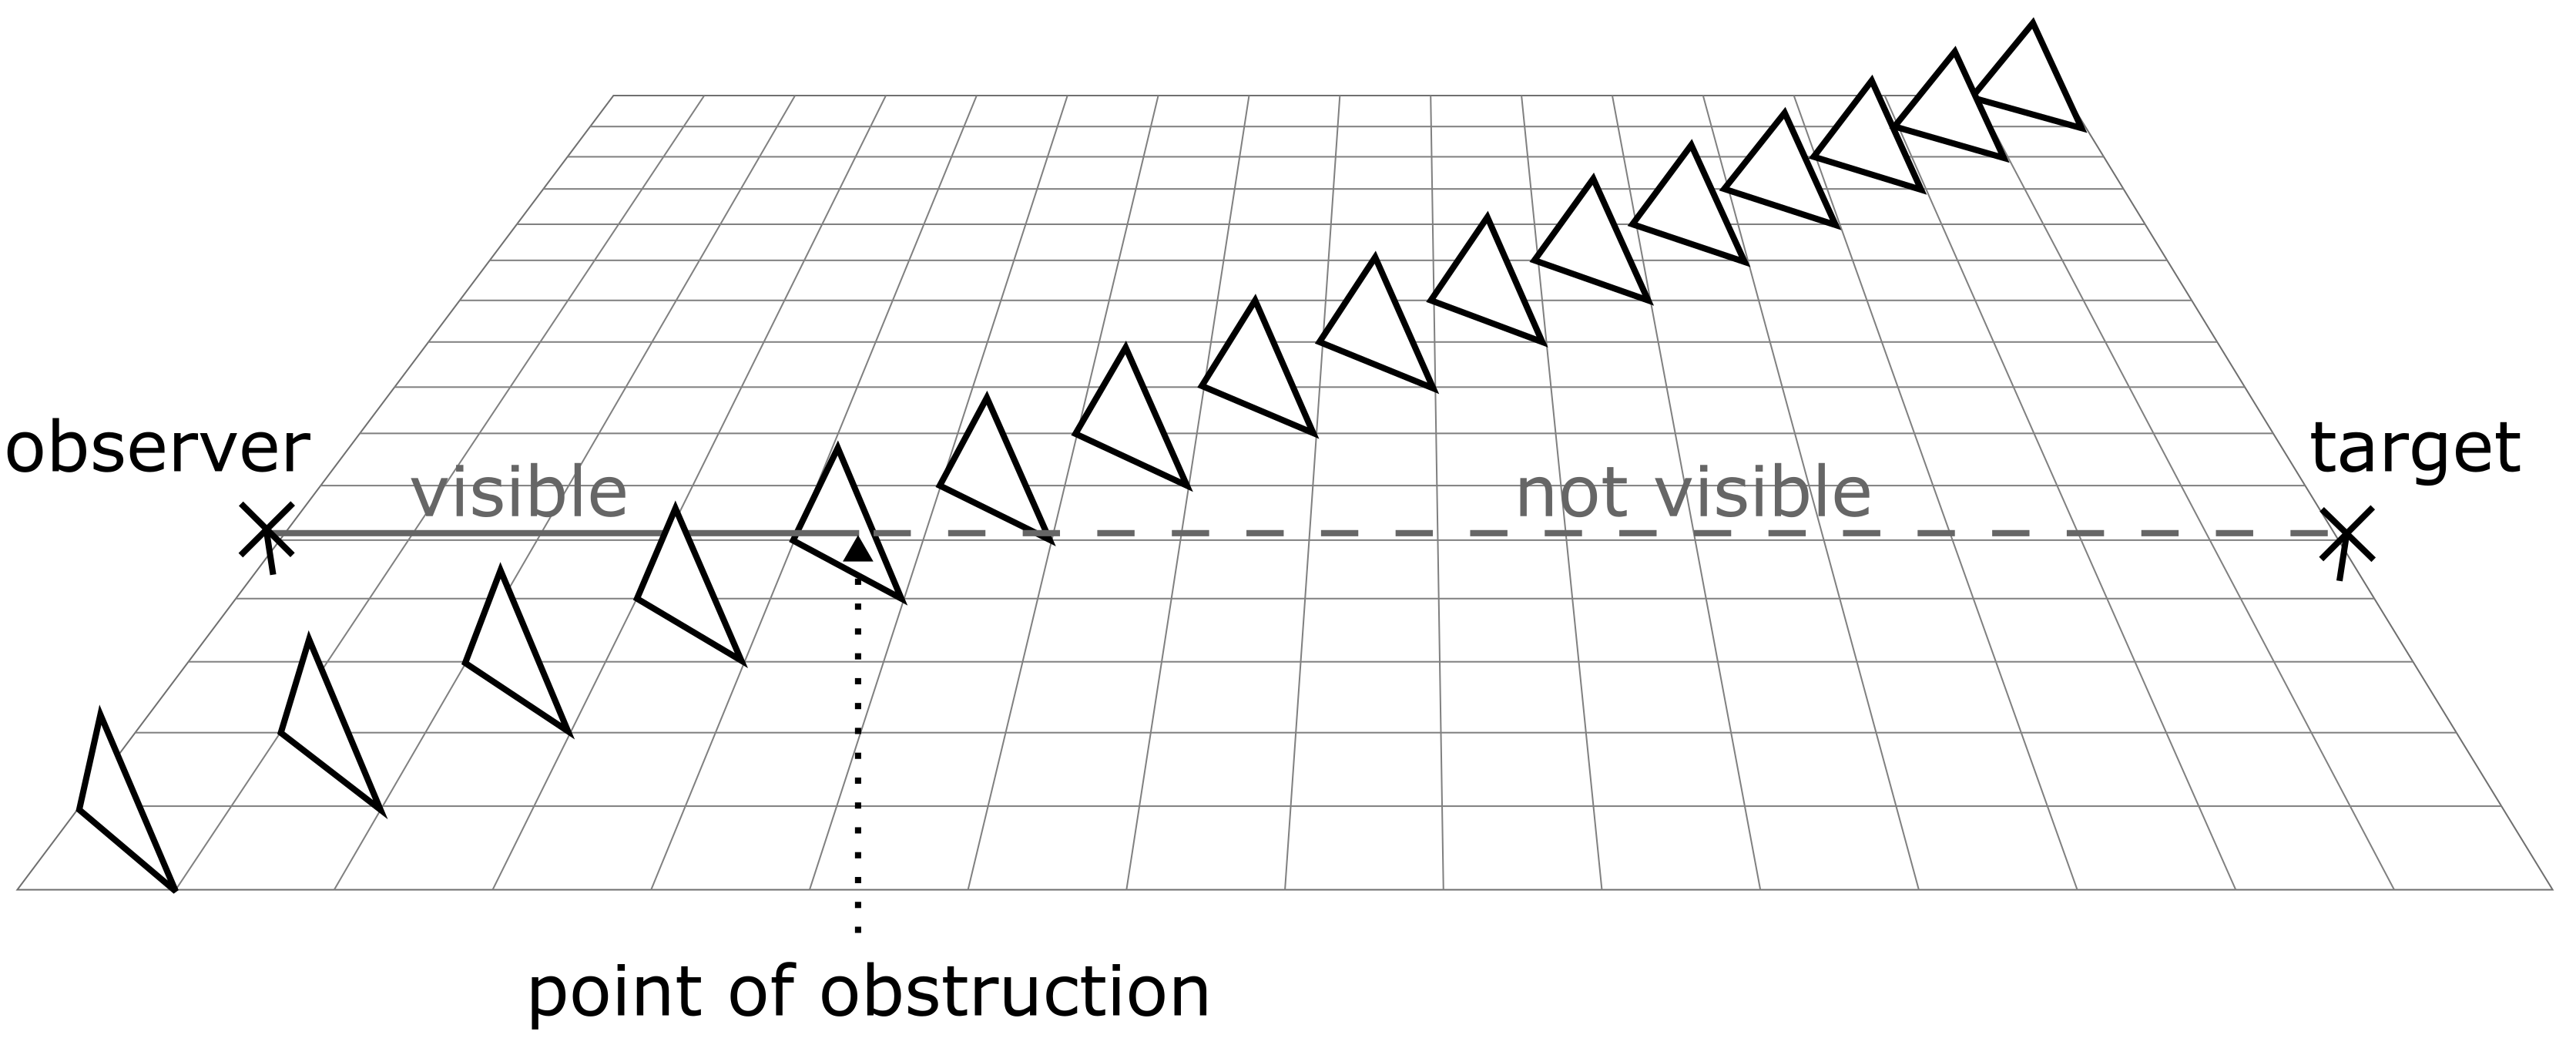
3.3.1. Definition

In the context of this paper, the aim was to optimize the computation of a browser-based 3D line-of-sight Analysis. The computation took place on the client-side in a web-browser. The 3D line-of-sight Analysis uses a 3D line-of-sight, which is a line from an observer point to distant target point in three-dimensional euclidean space, to compute whether an obstacle is intersecting that line and additionally determine the closest point of intersection with an obstacle (point of obstruction) seen from the observer point .

3.3.2. Aims and Strategies

The intention of the proposed method is to fulfill the following aims: performance, scalability, practicability and robustness. To develop a practicable and robust analysis method, it is important to account for the fact that real world 3D datasets often contain topological errors, and may not be manifold, especially when surfaces are automatically reconstructed from point clouds. Scenes may be composed of many different and disconnected objects which have been created from different data sources and by different processing methods. To avoid time consuming data preparation, the proposed method uses a visibility algorithm [28] that does not rely on a specific data structure, except that the objects are composed of triangles. No manifoldness or special topology is needed. This allows spontaneously including multiple and different types of layered data possibly stemming from different remote or local sources, which is an important feature for the practical usage of a WebGIS. To reach scalability, in this context, means to design the analysis process in such a way, that the consumption of memory becomes independent of the size of the underlying data to be analyzed and also independent of the length of the line-of-sight which has to be tested. The strategy followed here is to process data chunks such as tiles if available (e.g., for terrain data) or object groups retrieved by bounding boxes (e.g., buildings). For web applications, the timely performance is a crucial factor to gain user acceptance. Generally, the time (T) of a browser based analysis can be formulated as:
T = T send + T server side processing + T receive + T client side processing
While T send and T receive are dependent of the data size and available bandwidth, the processing parts depend on hardware, software and the size of input data. As the available bandwidth and hardware cannot be influenced by the application, the performance optimizations should concentrate on reducing the data size to be transmitted and processed and the algorithms for processing that data. In this case, the dominating time component is T receive so that the applied strategy is to reduce downloads and processing by analyzing already loaded layers or cached tiles first to determine a possibly smaller amount of necessary data that has to be analyzed and thus downloaded. This aim can be targeted at two different points in the processing pipeline, before starting new data downloads.

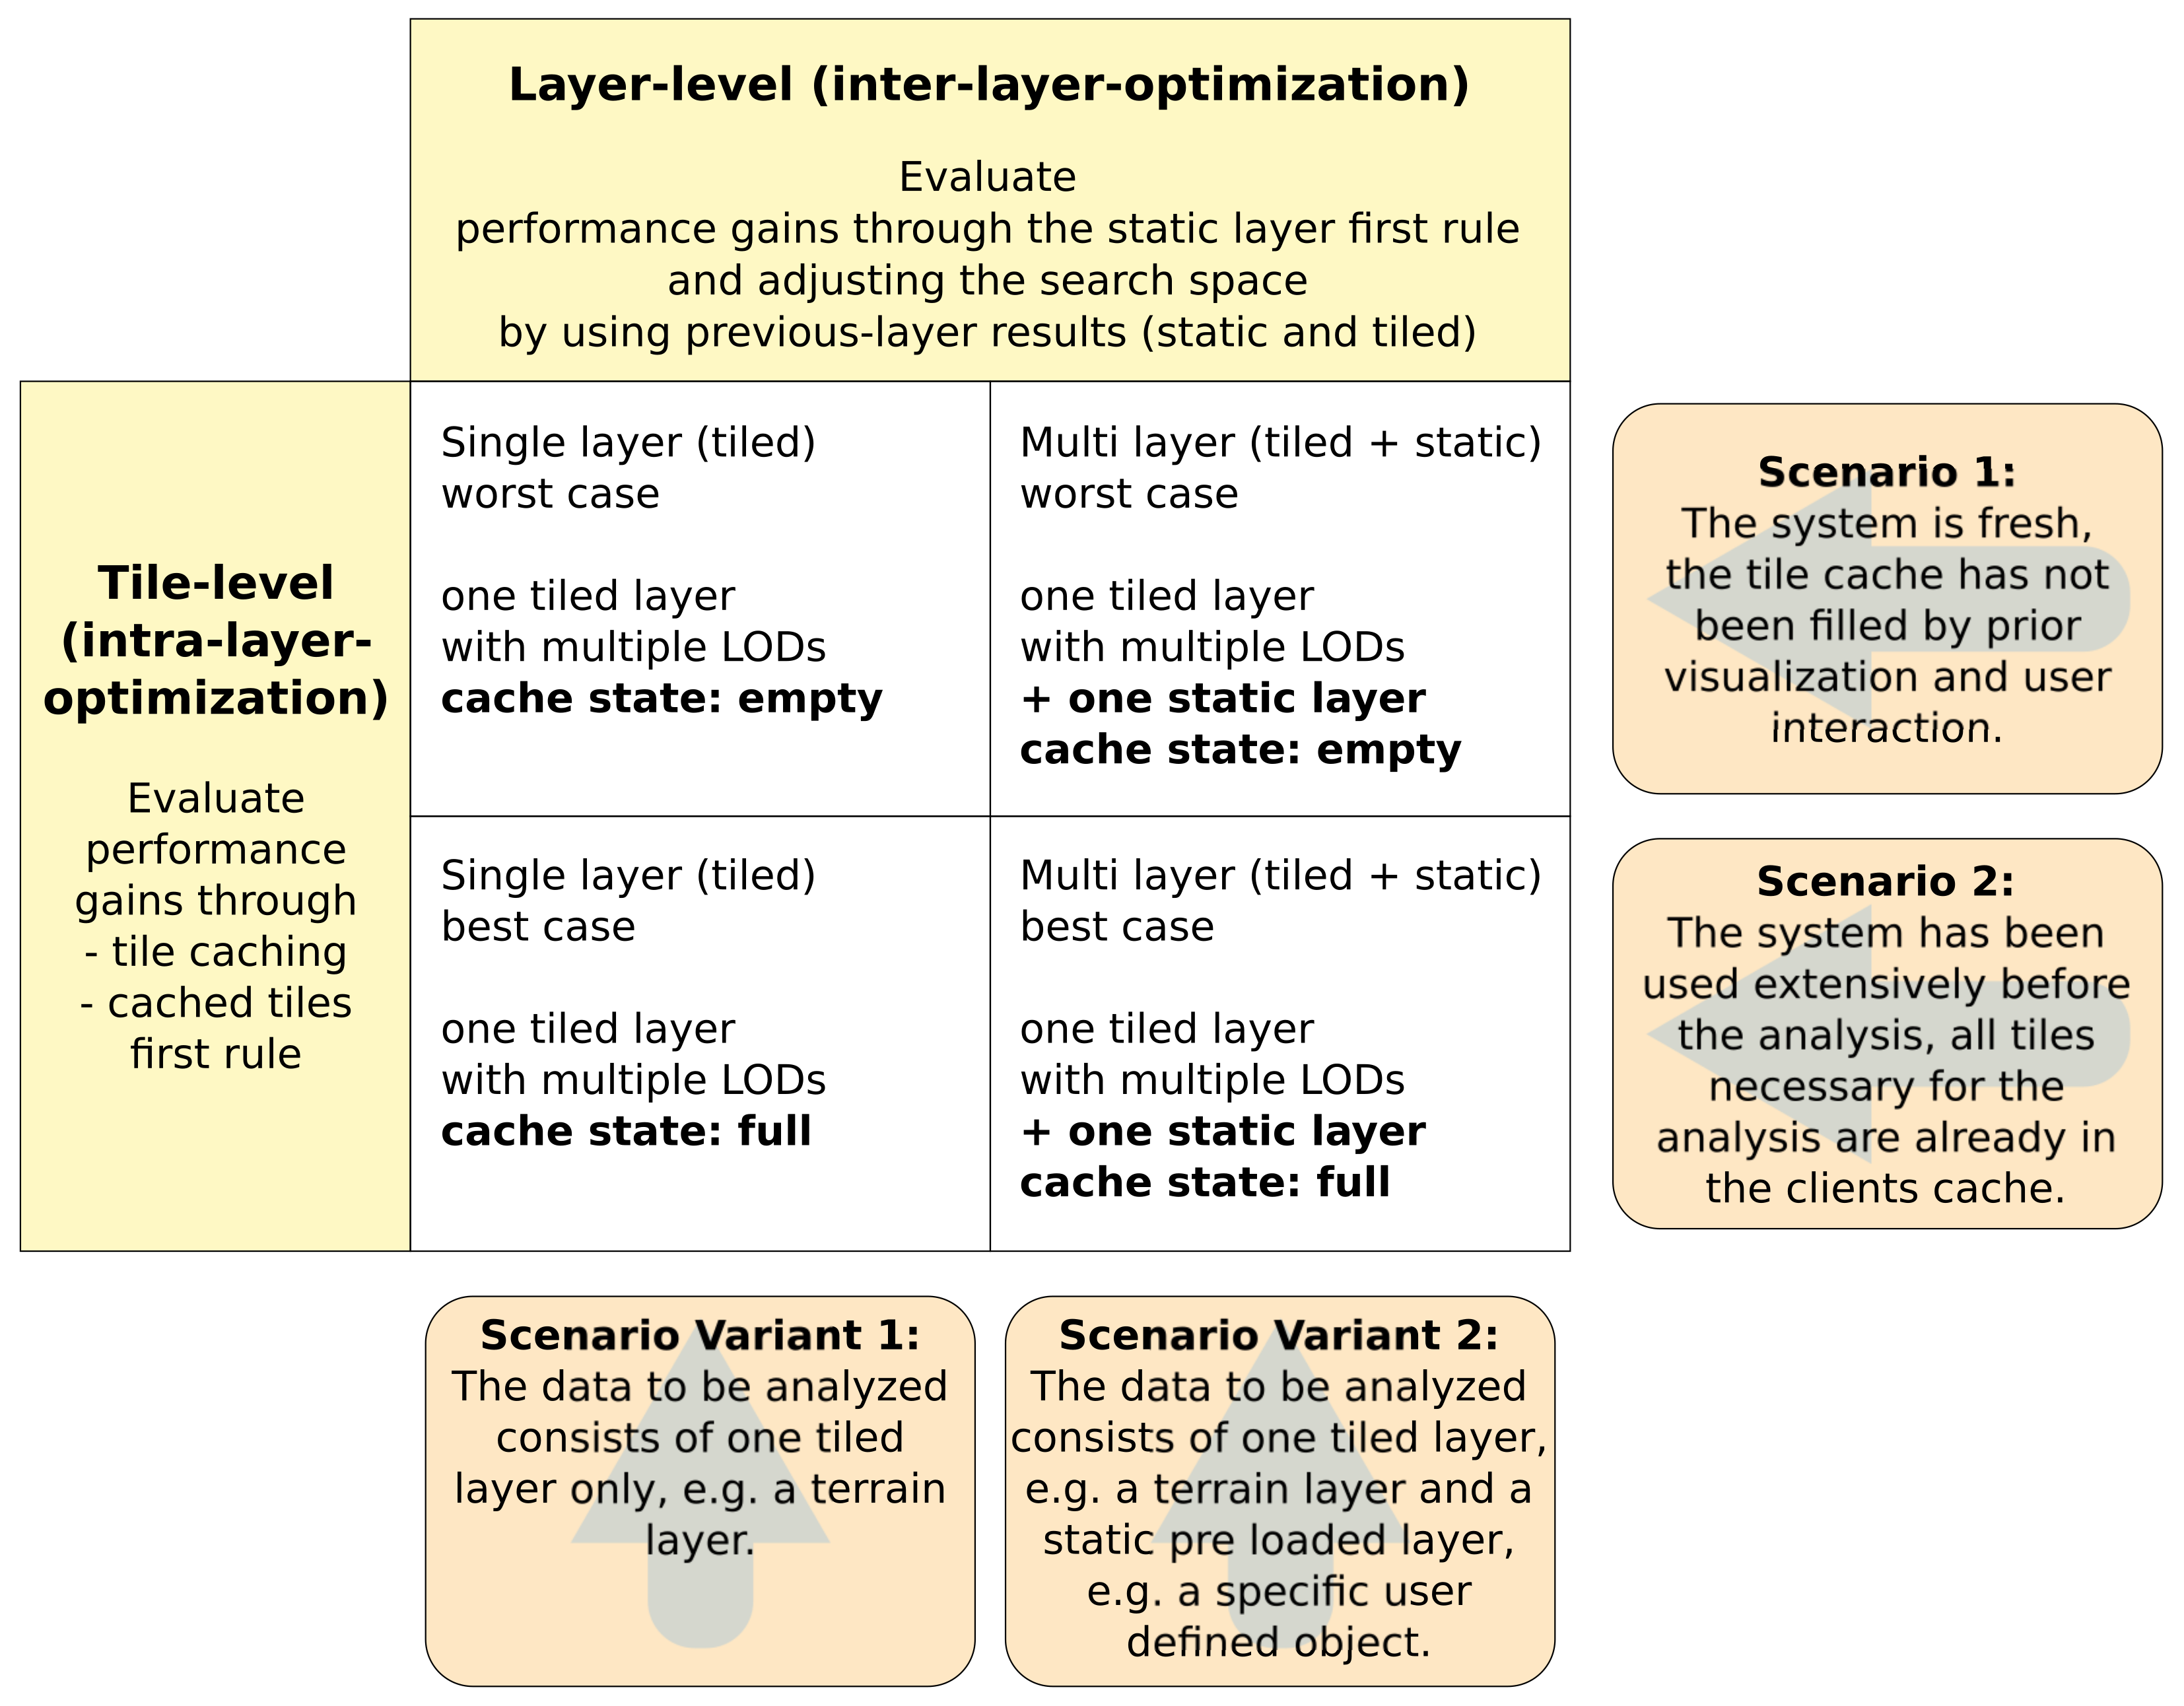
3.3.3. Two Levels of Optimization

In this paper, a two-level approach is applied to improve the WebGIS performance in a holistic way rather than just to focus on a single algorithm optimization. The approach introduced here is based on the assumption that, before the actual analysis phase begins, a prior visualization phase has already taken place. This leads to the advantage that some of the required analysis data may already have been loaded in the web clients memory and can be accessed very quickly and thus can be used for performance optimization. For the computation of the line-of-sight, optimizations can be performed on two different levels—the layer-level (inter-layer-optimization) and the tile-level (intra-layer-optimization). Both optimization levels can be combined into a 2 × 2 scenario matrix (Figure 1). This matrix is used to evaluate and demonstrate the contribution to the performance gain under different usage conditions.
  • The layer-level
    The inter-layer-optimization makes use of two principles. First, the algorithm examines static layers before tiled layers. Static layers are not tiled or requested by grid-based bounding boxes but instead consist of objects that are loaded at once and afterwards are constantly kept in the client memory for visualization. Static layers are useful to add specific objects to a scene that are not too big in data size but are required for individual visualizations or analyses, e.g., a model of a planned building in a cityscape. Second, the search space that has to be examined in subsequent tiled layers will be reduced by the results of the previously examined static and other tiled layers. Between the examination of two layers, the target point parameter of the next layers analysis is adjusted to the closest obstacle intersection found in the previous layer. This reduces the search distance and thus the number of tiles that have to be downloaded and analyzed during the next layer check.
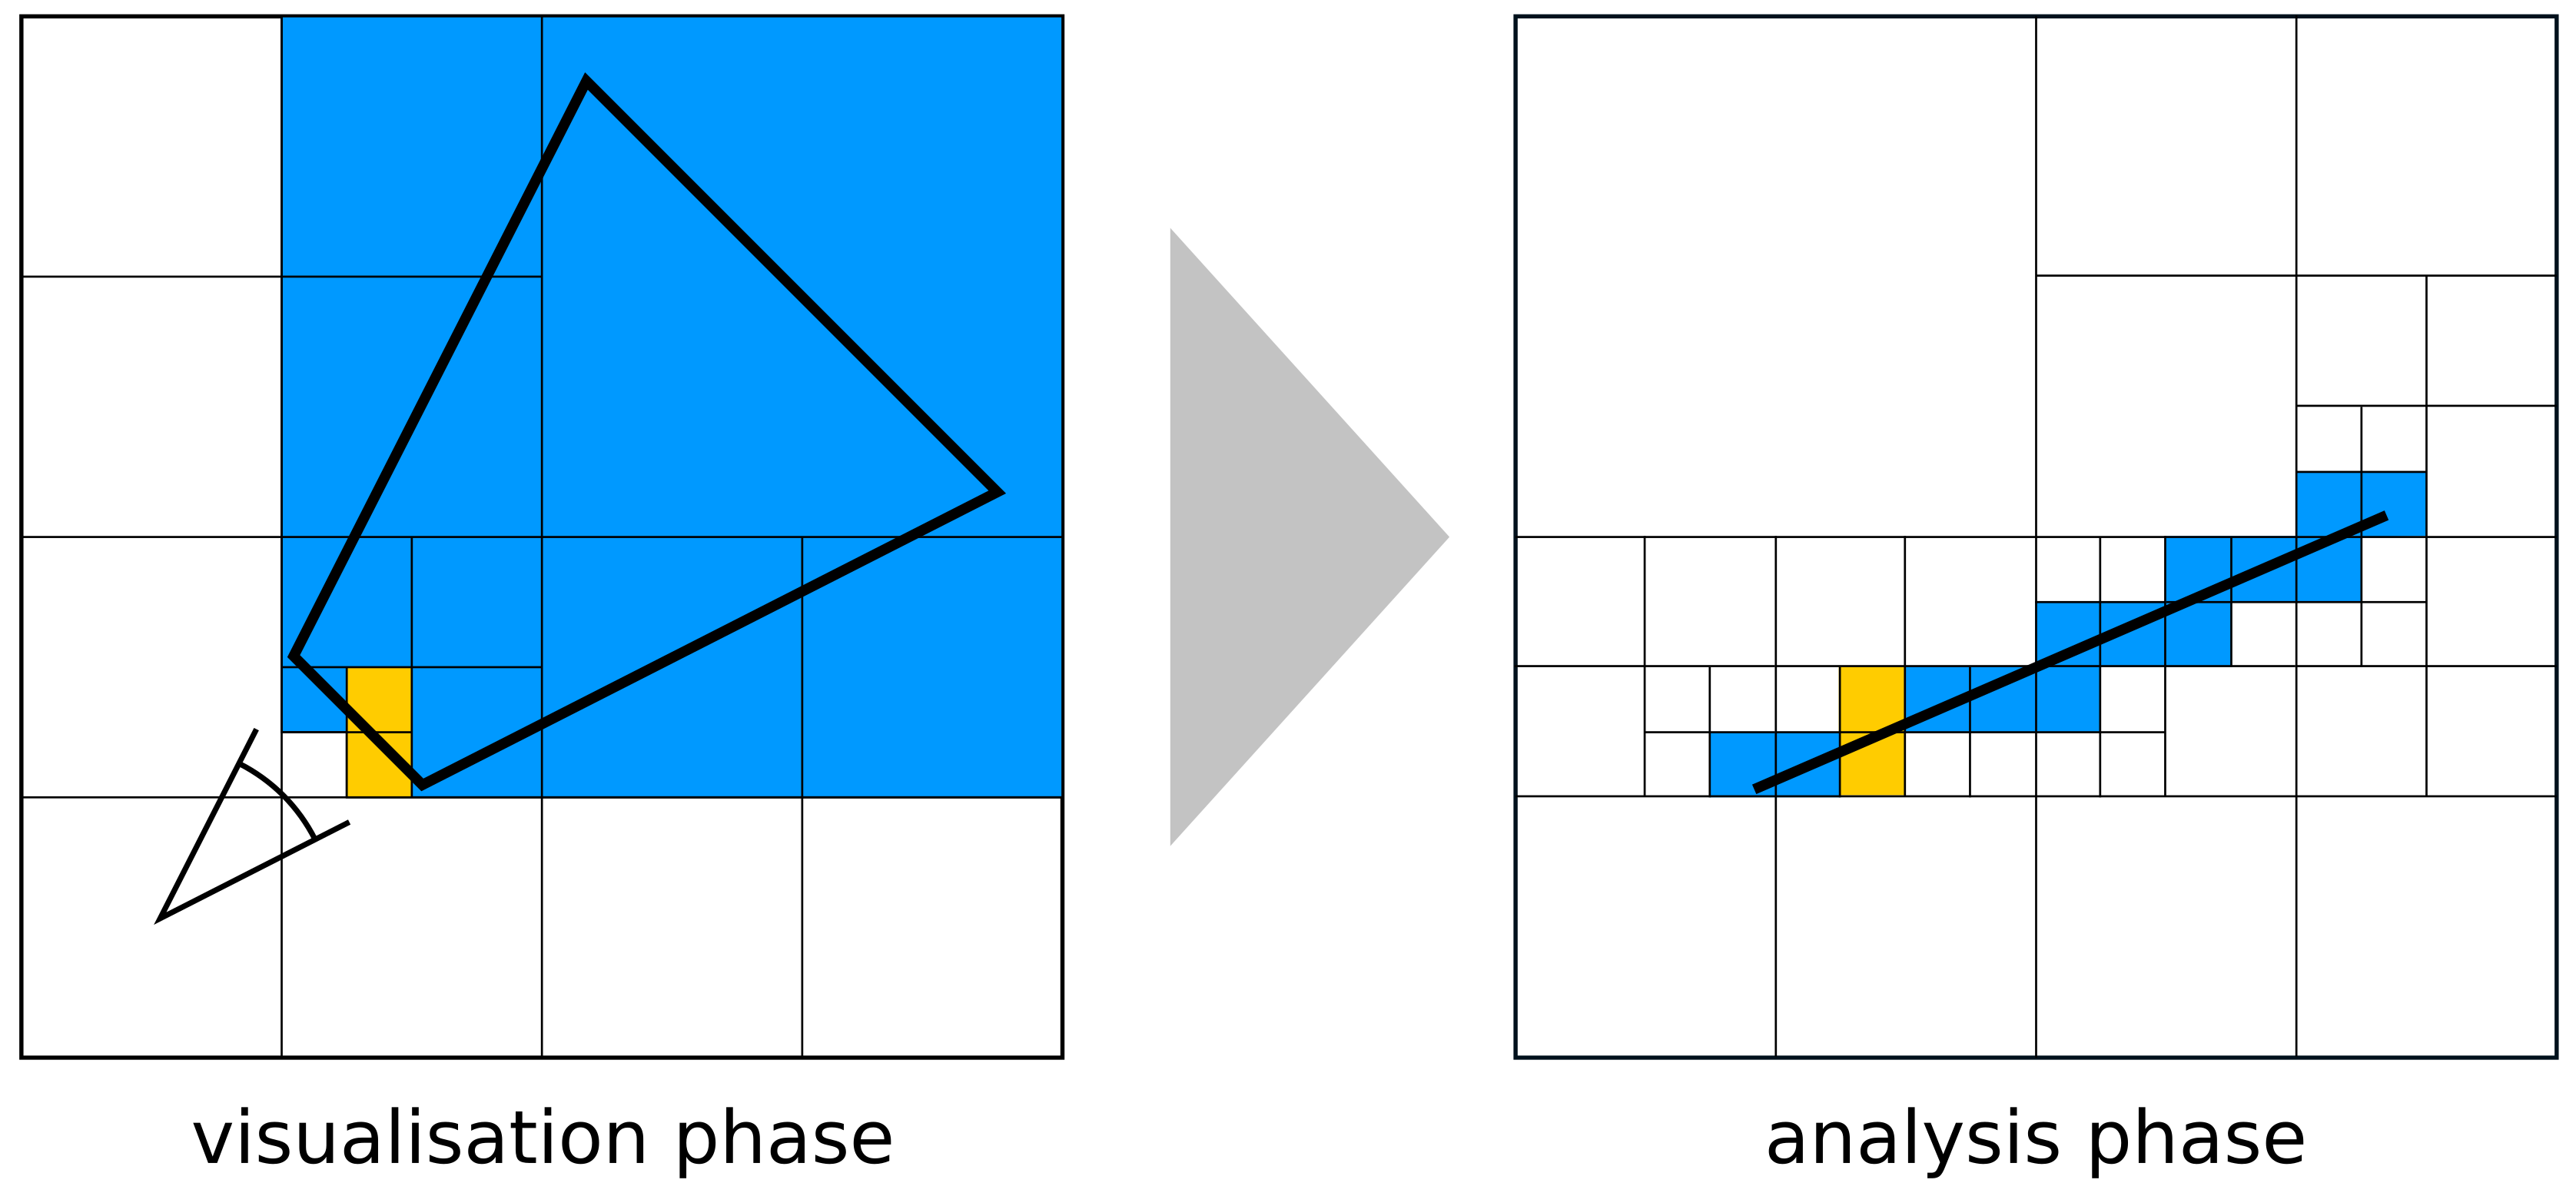
  • The tile-level
    On the tile-level (intra-layer-optimization), three strategies can be applied to optimize performance. First, the chunked (i.e., tiled) nature of the data allows loading just a necessary subset of the whole dataset, and thus enables data streaming. Data partitioning is a crucial strategy to be able to handle very large datasets and to process it piecewise. Second, some tiles that have to be analyzed may already be found in the client cache (because they were loaded earlier either for visualization or for another earlier analysis) and can be accessed and analyzed fast. Such cached tiles can be accessed and analyzed very fast and should be prioritized when determining the sequence of tiles to be analyzed. A sorting of the tiles by being cached or uncached and starting the analysis with the cached ones, which can reveal a new closest intersection, that can, similar to in the layer level, be used to reduce to search space and reduce the number of uncached tiles that have to be loaded, separates the analysis in a faster and a slower part. If during the fast part an intersection with the line-of-sight can be found, all slow parts (uncached tiles) that lie behind that intersection can be skipped and thus improve the overall performance. Third, the remaining uncached tiles can now be requested asynchronously, which means that, depending on current browser implementations, 6–13 parallel connections can be established from the browser to resources of the same Internet domain [39] (host server addresses of the data services) to download the pending data. Thus, some of the server and network load can be handled in parallel to speed up the process.

4. Discussion of the Results
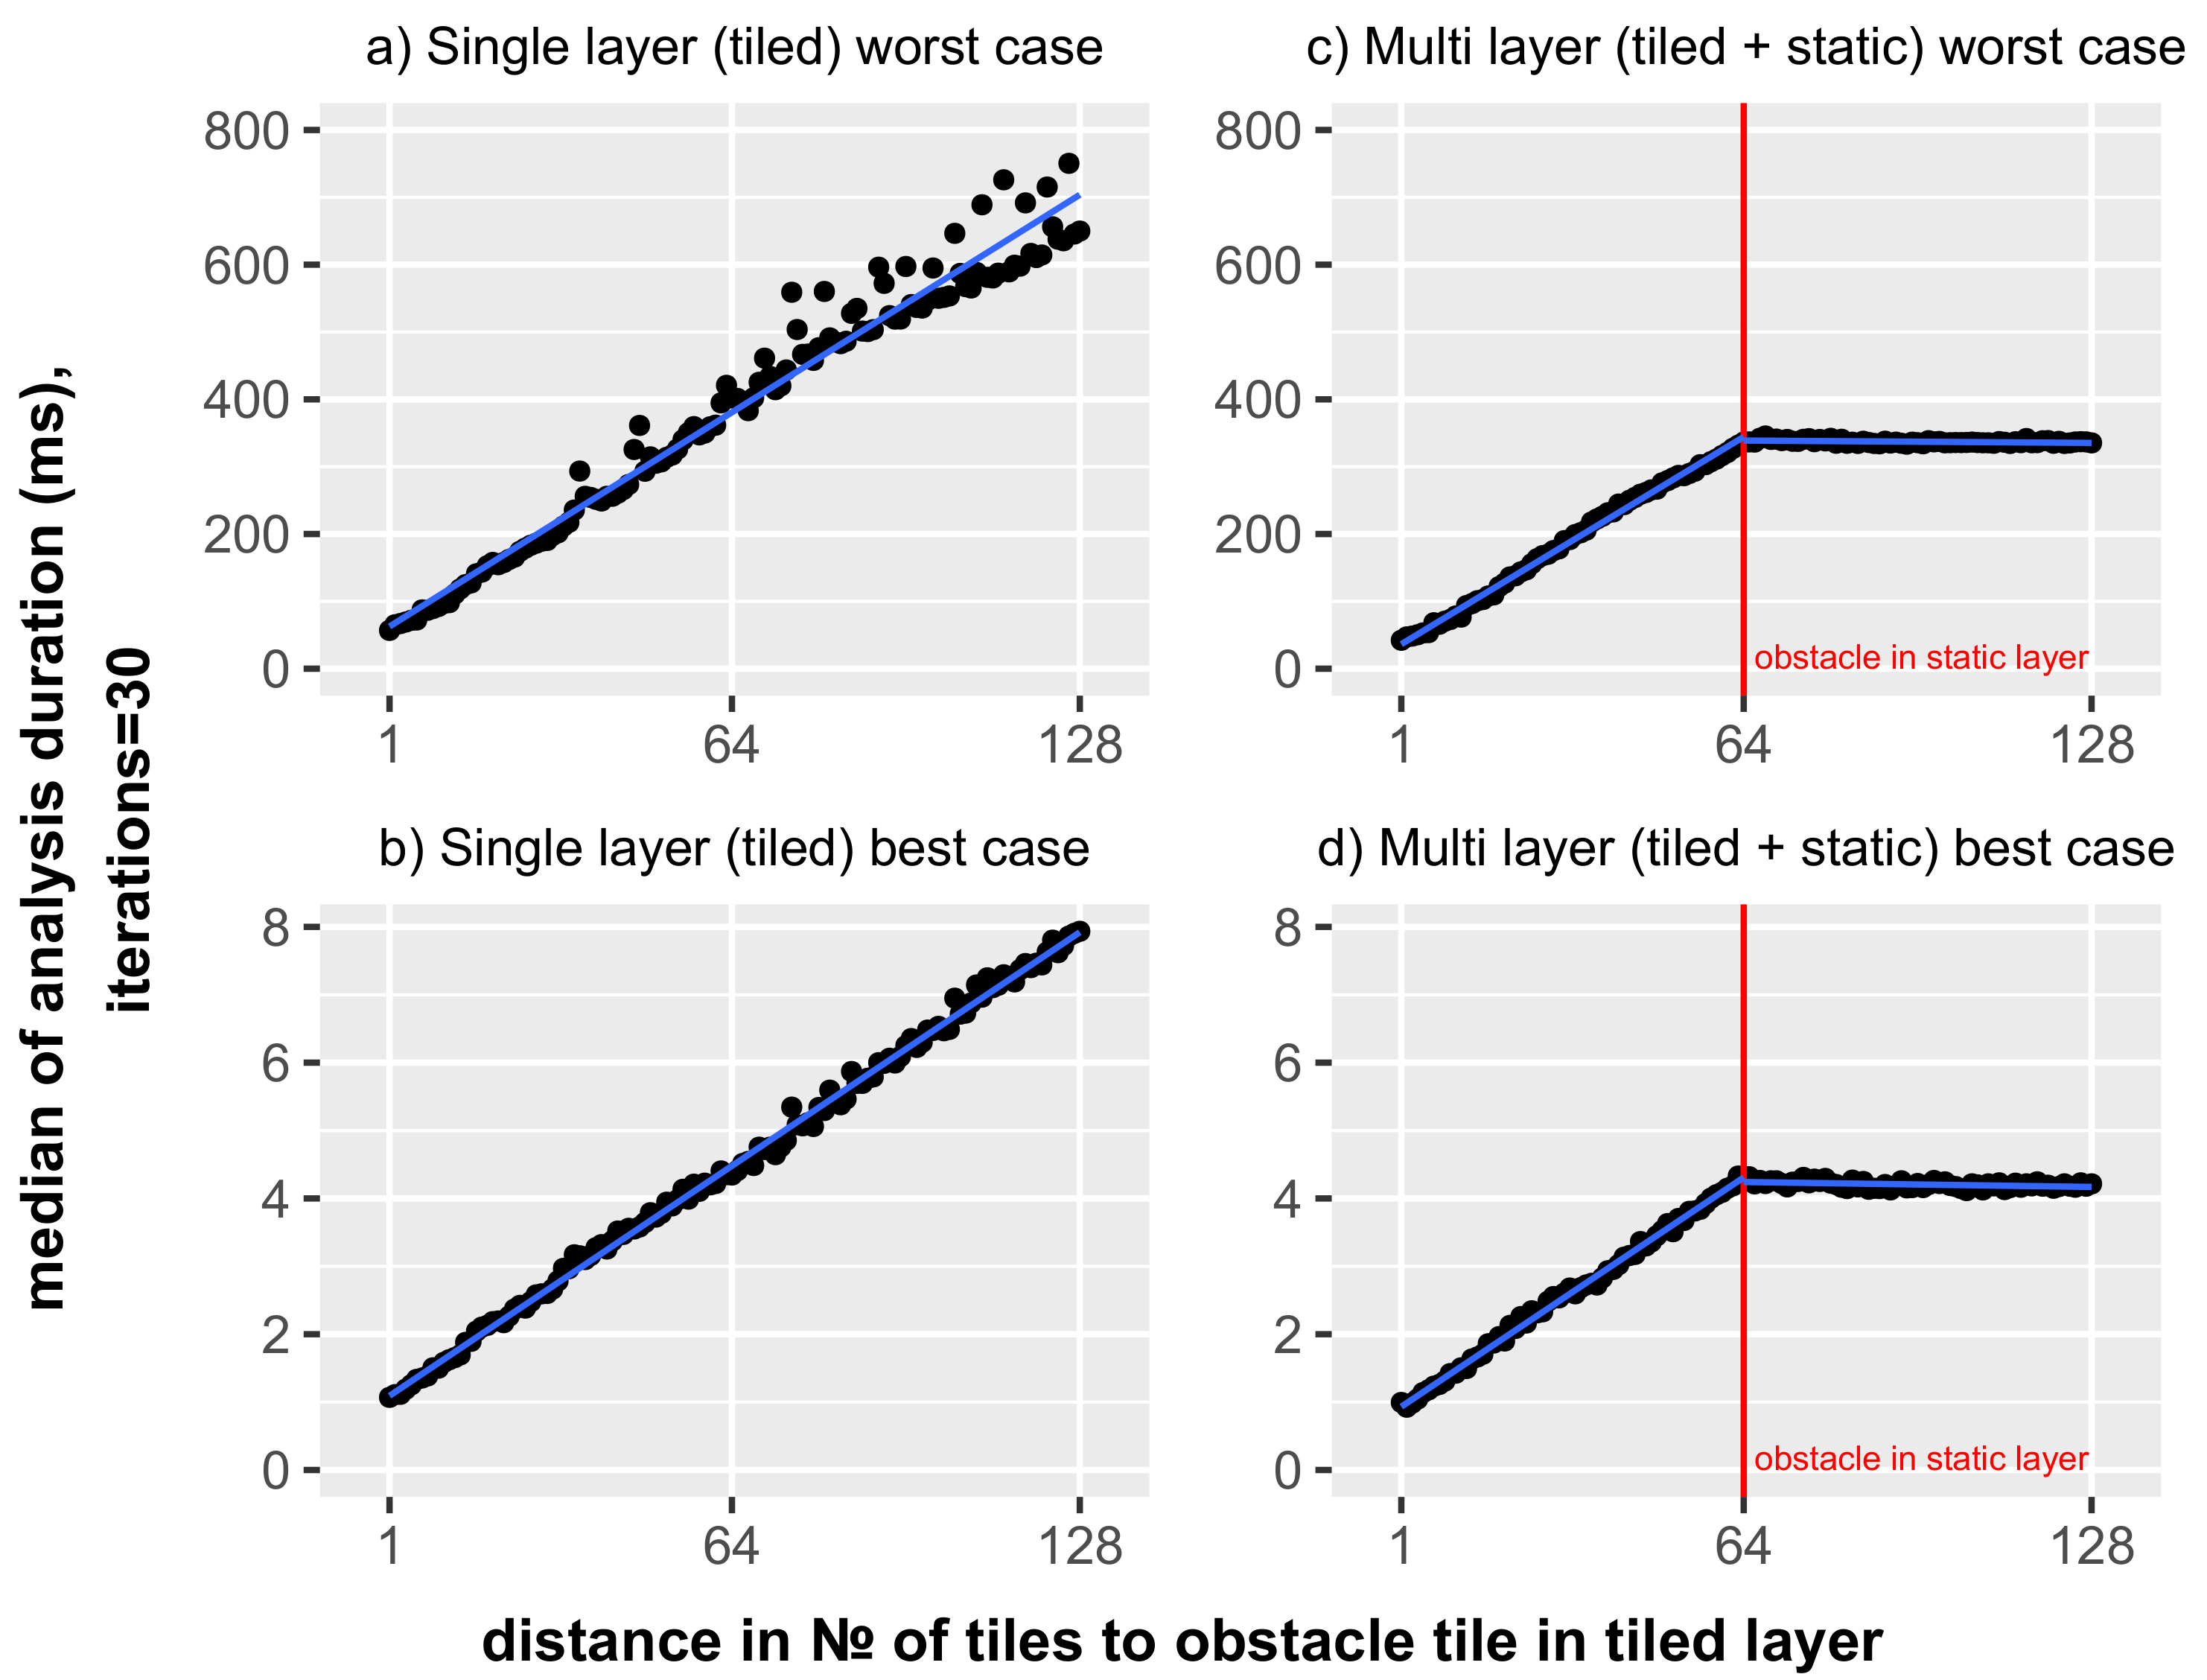
4.1. Performance

For the evaluation of the performance, four different scenarios were measured (Figure 8). The two scenarios with a single tiled layer (Figure 8a,b) demonstrate that the process duration is linearly dependent on the number of tiles to be analyzed between observer point and nearest obstacle. In other words this means that using this method the analysis performance is independent of the total size of the underlying tiled layer dataset and it is only dependent of the total distance between observer and target point if no obstacle can be found in the line-of-sight. The earlier an obstacle in the line-of-sight is found, the better is the performance.
Further, comparing the worst case (Figure 8a,c) and best (Figure 8b,d) case scenarios, one can see a very big difference in the analysis duration—in the test case, approximately by factor 90. This can vary if applied under different network conditions, but underlines the importance of applying strategies to avoid downloading unnecessary data to reach a good performance. This can be achieved by applying a local memory cache to avoid multiple downloads of data that have already been used for visualization or prior analyses.
Figure 8c,d represents the equivalent to Figure 8a,b but with a second layer included in the analysis. In our test setup, this second layer obstructs the line-of-sight exactly at the midpoint between observer and target point. The diagram shows the advantage of the approach by including multiple layers to reduce the amount of data that have to be fetched from the remote server. In practice, this means that the inclusion of data from all static layers into to computation can help avoid time consuming downloads of dynamic tiled layer data and thus improve the overall performance.

4.2. Scalability

Figure 9 shows the memory consumption of the browser during a test run of 128 different line-of-sight analyses with increasing distances to their nearest obstacle. It shows a constant consumption of RAM, independently of the amount of data that have to be processed for the different analyses. This demonstrates the scalability of the approach. In practical use, this means that there is no limitation of the length of a line-of-sight or resolution of the underlying obstacle layers as long as they can be retrieved in a partitioned way, e.g., tiled or by bounding box, to support streaming. To control the amount of necessary memory, the only parameter to adjust would be the tile size or bounding box size depending on the resolution of the underlying data.

5. Conclusions

This paper discusses the potential of browser based WebGIS applications beyond its typical usage as geodata viewer. It exemplifies its extended usage as real web-based analysis interface by evaluating an implementation of a browser-based 3D line-of-sight computation under different scenarios to prove acceptable performance and scalability by applying the suggested methods from above. To ensure comparable test conditions, an artificial dataset has been created, simulating a LiDAR derived Digital Terrain Model. Further, an evaluation framework was set up to measure performance and memory consumption during four different test scenarios. The results show that the applied approach with its holistic view on WebGIS usage and its two levels of optimization (layer-level and tile-level) lead to greatly improved performance, while the streaming and partitioned way of processing of the data leads to an independence between memory consumption and the length of the line-of-sight as well as the resolution of input data, thus showing that the approach is scalable, which is important, especially in web-based environments.
References

Author Contributions

Conceptualization, M.A. and A.Z.; Data curation, M.A.; Formal analysis, M.A.; Funding acquisition, A.Z.; Investigation, M.A.; Methodology, M.A.; Project administration, A.Z.; Resources, A.Z.; Software, M.A.; Supervision, A.Z.; Validation, A.Z.; Visualization, M.A.; Writing—original draft, M.A.; and Writing—review and editing, M.A. and A.Z.

Funding

Part of the research was funded by the German Ministry of Research and Education (BMBF) eHumanities program, grant #01UG1244B and was done during the MayaArch3D-Project (www.mayaarch3d.org). Further work on this research could be finished through funding of the Klaus-Tschira-Foundation (KTS).

Acknowledgments

Many thanks are given to our colleagues from the GIScience Reasearch Group Heidelberg for their valuable input and discussions, especially to Lukas Loos and Bernhard Höfle.

Conflicts of Interest

The authors declare no conflict of interest. The founding sponsors had no role in the design of the study; in the collection, analyses, or interpretation of data; in the writing of the manuscript, and in the decision to publish the results.

References

  1. De Argaez, E. Internet World Stats—Usage and Population Statistics. Available online: http://www.internetworldstats.com/stats.htm (accessed on 15 February 2018).
  2. International Telecommunication Union (ITU). ICT Facts & Figures—The World in 2015; Technical Report; ICT Data and Statistics Division—Telecommunication Bureau, International Telecommunication Union: Geneva, Switzerland, 2015. [Google Scholar]
  3. Dragićević, S.; Balram, S. A Web GIS collaborative framework to structure and manage distributed planning processes. J. Geogr. Syst. 2004, 6, 133–153. [Google Scholar] [CrossRef]
  4. Sui, D.Z.; Goodchild, M.F. GIS as media? Int. J. Geogr. Inf. Sci. 2001, 15, 387–390. [Google Scholar] [CrossRef]
  5. ISO/IEC 25010:2011. Systems and Software Engineering—Systems and Software Quality Requirements and Evaluation (SQuaRE)—System and Software Quality Models; Technical Report; International Organization for Standardization: Geneva, Switzerland, 2011. [Google Scholar]
  6. Ragget, D. Extending WWW to Support Platform Independent Virtual Reality. 1994. Available online: https://www.w3.org/People/Raggett/vrml/vrml.html (accessed on 19 September 2016).
  7. Khronos Group. WebGL Specification, version 1.0.0; Khronos Group: Beaverton, OR, USA, 2011. Available online: https://www.khronos.org/registry/webgl/specs/1.0.0/.
  8. Deveria, A. WebGL—3D Canvas Graphics. Available online: http://caniuse.com/feat=webgl (accessed on 20 September 2016).
  9. Hagedorn, B.; Web View Service Discussion Paper. Web View Service Discussion Paper. OGC Discussion Paper, Ref. No. OGC 09-166r2; Open Geospatial Consortium, 2010. Available online: http://portal.opengeospatial.org/files/?artifactid=37257.
  10. Schilling, A.; Kolbe, T.H. Draft for Candidate OpenGIS(R) Web 3D Service Interface Standard. OGC Discussion Paper, Ref. No. OGC 09-104r1; Open Geospatial Consortium, 2010. Available online: http://portal.opengeospatial.org/files/?artifactid=36390.
  11. Hagedorn, B.; Thum, S.; Reitz, T.; Coors, V.; Gutbell, R. OGC® 3D Portrayal Service 1.0. OGC Implementation Standard, Ref. No. OGC 15-001r4; Open Geospatial Consortium, 2017. Available online: http://docs.opengeospatial.org/is/15-001r4/15-001r4.html.
  12. Coors, V.; Zipf, A. (Eds.) 3D-Geoinformationssysteme. Grundlagen und Anwendungen; Wichmann: Heidelberg, Germany, 2005; pp. XXII, 522. [Google Scholar]
  13. Abdul-Rahman, A.; Pilouk, M. Spatial Data Modelling for 3D GIS; Springer: Berlin/Heidelberg, Germany, 2008; pp. 1–289. [Google Scholar]
  14. Bittner, J.; Wonka, P. Visibility in computer graphics. Environ. Plan. B Plan. Des. 2003, 30, 729–755. [Google Scholar] [CrossRef] [Green Version]
  15. De Floriani, L.; Marzano, P.; Puppo, E. Line-of-sight communication on terrain models. Int. J. Geogr. Inf. Syst. 1994, 8, 329–342. [Google Scholar] [CrossRef]
  16. Liu, B.; Yao, Y.; Tang, W.; Lu, Y. Research on gpu-based computation method for line-of-sight queries. In Proceedings of the 2012 ACM/IEEE/SCS 26th Workshop on Principles of Advanced and Distributed Simulation, PADS 2012, Zhangjiajie, China, 15–19 July 2012; pp. 84–86. [Google Scholar] [CrossRef]
  17. Paliou, E.; Wheatley, D.; Earl, G. Three-dimensional visibility analysis of architectural spaces: Iconography and visibility of the wall paintings of Xeste 3 (Late Bronze Age Akrotiri). J. Archaeol. Sci. 2011, 38, 375–386. [Google Scholar] [CrossRef]
  18. Osterman, A.; Benedičič, L.; Ritoša, P. An IO-efficient parallel implementation of an R2 viewshed algorithm for large terrain maps on a CUDA GPU. Int. J. Geogr. Inf. Sci. 2014. [Google Scholar] [CrossRef]
  19. Tabik, S.; Cervilla, A.R.; Zapata, E.; Romero, L.F. Efficient data structure and highly scalable algorithm for total-viewshed computation. IEEE J. Sel. Top. Appl. Earth Observ. Remote Sens. 2015. [Google Scholar] [CrossRef]
  20. Ferreira, C.R.; Andrade, M.V.; Magalhes, S.V.; Franklin, W.R.; Pena, G.C. A parallel sweep line algorithm for visibility computation. In Proceedings of the Brazilian Symposium on GeoInformatics, Campos do Jordão, Brazil, 24–27 November 2013. [Google Scholar]
  21. Bartie, P.; Mackaness, W. Improving the sampling strategy for point-to-point line-of-sight modelling in urban environments. Int. J. Geogr. Inf. Sci. 2017, 31, 805–824. [Google Scholar] [CrossRef]
  22. De Floriani, L.; Magillo, P. Algorithms for visibility computation on terrains: A survey. Environ. Plan. B Plan. Des. 2003, 30, 709–728. [Google Scholar] [CrossRef]
  23. Hillen, F.; Höfle, B. Webbasierte Sichtbarkeitsanalyse mit Laserscanningdaten. gis.SCIENCE 2013, 1, 1–7. [Google Scholar]
  24. Alderson, T.; Samavati, F. Optimizing line-of-sight using simplified regular terrains. Vis. Comput. 2015, 31, 407–421. [Google Scholar] [CrossRef]
  25. Badouel, D. An efficient ray-polygon intersection. In Graphics Gems; Glassner, A.S., Ed.; Academic Press Professional, Inc.: San Diego, CA, USA, 1990; pp. 390–393. [Google Scholar]
  26. Bogart, R.; Arenberg, J. Ray/Triangle Intersection with Barycentric Coordinates. Ray Tracing News 1988, 1, 17–19. [Google Scholar]
  27. Moller, T.; Trumbore, B. Fast, Minimum Storage Ray/Triangle Intersection. J. Gr. Tools 1997, 2, 21–28. [Google Scholar] [CrossRef]
  28. Eberly, D. Geometric Tools Engine. Ray-Trianlge-Intersection Algorithm. Available online: http://www.geometrictools.com/GTEngine/Include/Mathematics/GteIntrRay3Triangle3.h (accessed on 14 June 2016).
  29. Wei, Z.K.; Oh, Y.H.; Lee, J.D.; Kim, J.H.; Park, D.S.; Lee, Y.G.; Bae, H.Y. Efficient spatial data transmission in Web-based GIS. In Proceedings of the Second International Workshop on Web Information and Data Management—WIDM ’99, Kansas City, MO, USA, 2–6 November 1999; ACM Press: New York, NY, USA, 1999; pp. 38–42. [Google Scholar] [CrossRef]
  30. Yang, C.P.; Wong, D.W.; Yang, R.; Kafatos, M.; Li, Q. Performance-improving techniques in web-based GIS. Int. J. Geogr. Inf. Sci. 2005, 19, 319–342. [Google Scholar] [CrossRef]
  31. Yang, C.; Wu, H.; Huang, Q.; Li, Z.; Li, J.; Li, W.; Miao, L.; Sun, M. WebGIS performance issues and solutions. In Advances in Web-Based GIS, Mapping Services and Applications; Li, S., Dragićević, S., Veenendaal, B., Eds.; CRC Press: Boca Raton, FL, USA, 2011; Volume 9, pp. 121–138. [Google Scholar]
  32. Zhang, X.; Li, G.; Lan, X. Research on WebGIS Performance Optimization. In Proceedings of the 2011 7th International Conference on Wireless Communications, Networking and Mobile Computing, Wuhan, China, 23–25 September 2011; pp. 1–4. [Google Scholar] [CrossRef]
  33. Liu, X.; Han, J.; Zhong, Y.; Han, C.; He, X. Implementing WebGIS on Hadoop: A case study of improving small file I/O performance on HDFS. In Proceedings of the 2009 IEEE International Conference on Cluster Computing and Workshops, New Orleans, LA, USA, 31 August–4 September 2009; pp. 1–8. [Google Scholar] [CrossRef]
  34. Zhong, Y.; Han, J.; Zhang, T.; Fang, J. A distributed geospatial data storage and processing framework for large-scale WebGIS. In Proceedings of the 2012 20th International Conference on Geoinformatics, Hong Kong, China, 15–17 June 2012; pp. 1–7. [Google Scholar] [CrossRef]
  35. Heckbert, P.S.; Garland, M. Multiresolution Modelling for Fast Rendering. In Proceedings of the Graphics Interface’ 94, Banff, AB, Canada, 18–20 May 1994; pp. 43–50. [Google Scholar]
  36. Clark, J.H. Hierarchical geometric models for visible surface algorithms. Commun. ACM 1976, 19, 547–554. [Google Scholar] [CrossRef]
  37. Khronos Group. WebGL Specification, version 1.0.3; Khronos Group: Beaverton, OR, USA, 2014.
  38. Mann, J. High Resolution Time, W3C Recommendation 17 December 2012; World Wide Web Consortium, 2012. Available online: https://www.w3.org/TR/hr-time-1/.
  39. Souders, S. Browserscope. Available online: http://www.browserscope.org/?category=networkv=top. (accessed on 15 March 2016).
Figure 1. Scenario and evaluation matrix.
Ijgi 07 00279 g001
Figure 2. Challenges in WebGIS research.
Ijgi 07 00279 g002
Figure 3. The LoD Schema during the visualization phase (left) shows the tiles of different levels which have to be loaded to display a certain field of view, based on the distance to the camera. After switching to the analysis phase (right), some tiles can be reused from the cache (orange). For the analysis only the highest available level of detail must be loaded that intersect the line-of-sight.
Ijgi 07 00279 g003
Figure 4. Distribution of obstacles in the test dataset with example of a line-of-sight indicating the visible and non visible part, which are divided by the point of obstruction.
Ijgi 07 00279 g004
Figure 5. Tile-grid setup: Each tile is composed of 2048 triangles (right). The whole artificial DEM is made of 128 × 128 of such tiles (left). Some of those tiles (blue shaded tiles) contain a large vertical triangle, spanned diagonally across the whole tile, which serves as obstacle.
Ijgi 07 00279 g005
Figure 6. Test environment.
Ijgi 07 00279 g006
Figure 7. Pattern of the test functions.
Ijgi 07 00279 g007
Figure 8. Performance of the line-of-sight computation in different scenarios.
Ijgi 07 00279 g008
Figure 9. Memory consumption (top) during 128 different line-of-sight analyses (blue line segments) (bottom) with increasing distances to their nearest obstacle.
Ijgi 07 00279 g009

