Article

Characterizing Light Pollution Trends across Protected Areas in China Using Nighttime Light Remote Sensing Data

1
Institute of Remote Sensing and Digital Earth, Chinese Academy of Sciences, Beijing 100094, China
2
University of Chinese Academy of Sciences, Beijing 100049, China
3
Key Laboratory of Earth Observation Hainan Province, Sanya 572029, China
4
Sanya Institute of Remote Sensing, Sanya 572029, China
*
Authors to whom correspondence should be addressed.
ISPRS Int. J. Geo-Inf. 2018, 7(7), 243; https://doi.org/10.3390/ijgi7070243
Submission received: 27 April 2018 / Revised: 13 June 2018 / Accepted: 18 June 2018 / Published: 22 June 2018

Abstract

:
Protected areas (PAs) with natural, ecological, and cultural value play important roles related to biological processes, biodiversity, and ecosystem services. Over the past four decades, the spatial range and intensity of light pollution in China has experienced an unprecedented increase. Few studies have been documented on the light pollution across PAs in China, especially in regions that provide a greater amount of important biodiversity conservation. Here, nighttime light satellite images from the Defense Meteorological Satellite Program Operational Linescan System (DMSP-OLS) were selected to characterize light pollution trends across PAs using nighttime light indexes and hot spot analysis, and then the light pollution changes in PAs were classified. Furthermore, the causes of light pollution changes in PAs were determined using high-resolution satellite images and statistical data. The results showed the following: (1) Approximately 57.30% of PAs had an increasing trend from 1992 to 2012, and these PAs were mainly located in the eastern region, the central region, and a small part of the western region of China. Hot spot analysis showed that the patterns of change for the total night light and night light mean had spatial agglomeration characteristics; (2) The PAs affected by light pollution changes were divided into eight classes, of which PAs with stable trends accounted for 41%, and PAs with high increasing trends accounted for 10%. PAs that had high increasing trends with low density accounted for the smallest amount, i.e., only 1%; (3) The factors influencing light pollution changes in PAs included the distance to urban areas, mineral exploitation, and tourism development and the migration of residents. Finally, based on the status of light pollution encroachment into PAs, strategies to control light pollution and enhance the sustainable development of PAs are recommended.

Graphical Abstract

1. Introduction

With the expansion of human activity and the changes in the global environment, biodiversity loss has become one of the widespread issues related to the sustainable development of the global ecosystem [1,2]. To protect global biodiversity, several regulations and plans have been developed by each country and international organizations over the past century [3,4]. Practice has demonstrated that the establishment and maintenance of protected areas (PAs) is the best means for protecting biodiversity and preserving ecosystem services [5,6,7]. According to the protected planet report of 2014, PAs cover 15.4% of the world’s terrestrial surface and inland water areas and 3.4% of the global marine area [8]. Though many types of PAs have been established around the world, the management of these areas is facing profound challenges [9], especially in developing countries [10]. The widespread conditions in developing countries, including economic development, population growth, persistent poverty and war, have limited the sustainable development of PAs [10,11,12]. Evidence from previous studies have suggested that the functions of PAs have shown a trend in degradation in local areas during the past several decades [13,14], and recent studies have documented that the animal and plant abundances have shown a declining trend inside PAs [15,16].
Generally, PAs are established far from areas of human activity. However, the pressure from human activity on ecosystems is still the main driving factor influencing the decline in biodiversity [17]. Among the various types of human activity pressure, there is growing evidence that artificial lighting affects the natural ecosystem and PAs directly or indirectly [18,19,20]. Because long-term artificial lighting disrupts the natural cycles of light and dark [21], this disruption may affect the physiology, behavior, migration, reproduction, and mortality of species at the organismal level, and it can also impact the structure, function and biodiversity at the ecosystem level when combined with other pressures [22].
Over the past two decades, with the development of social economy and the popularity of lighting facilities, the surface of the earth has been illuminated [23]. One study documented that 23% of the global land area experienced light pollution, and 80% of the world’s population lived under light-polluted skies [23]. Lighting adds convenience and benefits to human life, but it causes environmental issues related to light pollution. According to the International Dark-Sky Association, light pollution is defined as inappropriate or excessive use of artificial light [24]. The impact of light pollution on ecosystems has gained increasing attention in recent years [25,26]. Specifically, studies have investigated the influence of light pollution on sleep [27], flight trajectories [20], and spawning [28].
With the emergence and development of nighttime light remote sensing techniques, nighttime light Earth observation data have been widely used for various purposes, including the estimation of socioeconomic parameters [29], urbanization process monitoring [30], conflict and crisis monitoring [31,32], and ecological and environmental observation [33]. Moreover, nighttime light remote sensing also promotes an understanding of light pollution at the local and global scales [18,25], and thus, it has become a unique and popular technology for high-frequency light pollution investigations at large scales [34,35]. Light pollution at the administrative scale in addition to the global scale [36] as well as Europe [34], China [35,37], and Pakistan [38] has been investigated using long-term series nighttime light images.
Regarding the effect of light pollution on ecosystems from the perspective of nighttime light remote sensing, Bennie et al. highlighted global trends of light pollution in natural terrestrial ecosystems and found that Mediterranean-climate ecosystems have experienced the greatest increase in exposure to light pollution [25]. Furthermore, de Freitas investigated the spatial and temporal levels of artificial nighttime light in tropical ecosystems with high biodiversity and found that the terrestrial coastal vegetation types were most affected [22]. Moreover, Gaston et al. [39] proposed a method to quantitatively assess erosion due to light pollution in PAs at the globe scale, and the results suggested that 7–42% of PAs experienced large increases in light pollution from 1992 to 2012. Davies et al. [18] assessed the exposure to light pollution of marine PAs and found that light pollution was increasing in most marine PAs. In terms of the impact of light pollution on biodiversity in PAs, an investigation showed that biodiversity hot spots are facing human pressure worldwide [40].
Many globally important PAs are located in China, and some studies have documented the issue of light pollution in these PAs [35]. Xiang and Tan studied spatial-temporal changes in light pollution in China’s PAs at different regional scales and the factors influencing light pollution. The results showed that light pollution in the eastern region of China is the most serious and that the Qinghai–Tibet Plateau is significantly affected by light pollution [41]. Kaifang Shi et al. used Defense Meteorological Satellite Program Operational Linescan System (DMSP-OLS) nighttime light images and land cover datasets to assess human activities in China’s PAs. The results showed that light pollution in China’s PAs showed an increasing trend from 1992 to 2012, and because of human activities, two species are on the verge of extinction in the Yangzie Nature Reserve [42]. Moreover, the total nighttime light index, night light mean index and mean composite difference method have been used to explore light pollution changes in China, the results of which have shown that dark PAs have decreased by 35.38% nationwide from 1992 to 2012 [43]. Although previous studies have constructed nighttime light indexes to reflect trends in light pollution across PAs in China [43], changes in the light pollution pattern have not been explored. This paper further investigated this pattern using the Getis-Ord Gi* tool in the ArcGIS 10.2 software platform and classified light pollution change levels in PAs. Moreover, the causes of light pollution changes in PAs were analyzed with high-resolution remote sensing images and statistical data.
Based on nighttime light remote sensing Earth observation data and geographic information system (GIS) spatial analysis tools, the aim of this study was to understand and characterize the light pollution across the PAs in China over the past two decades. To achieve this goal, we addressed three issues: (1) the light pollution trends and patterns in PAs; (2) the classification of light pollution change levels in PAs; and (3) the causes of light pollution changes in PAs. The method proposed in this paper can provide a reference for light pollution trend assessments in PAs, and the results will be helpful for understanding the impacts of human pressure on PAs and assisting the government with light pollution control; these objectives will help achieve sustainable ecosystem development in PAs.

2. Materials and Methods
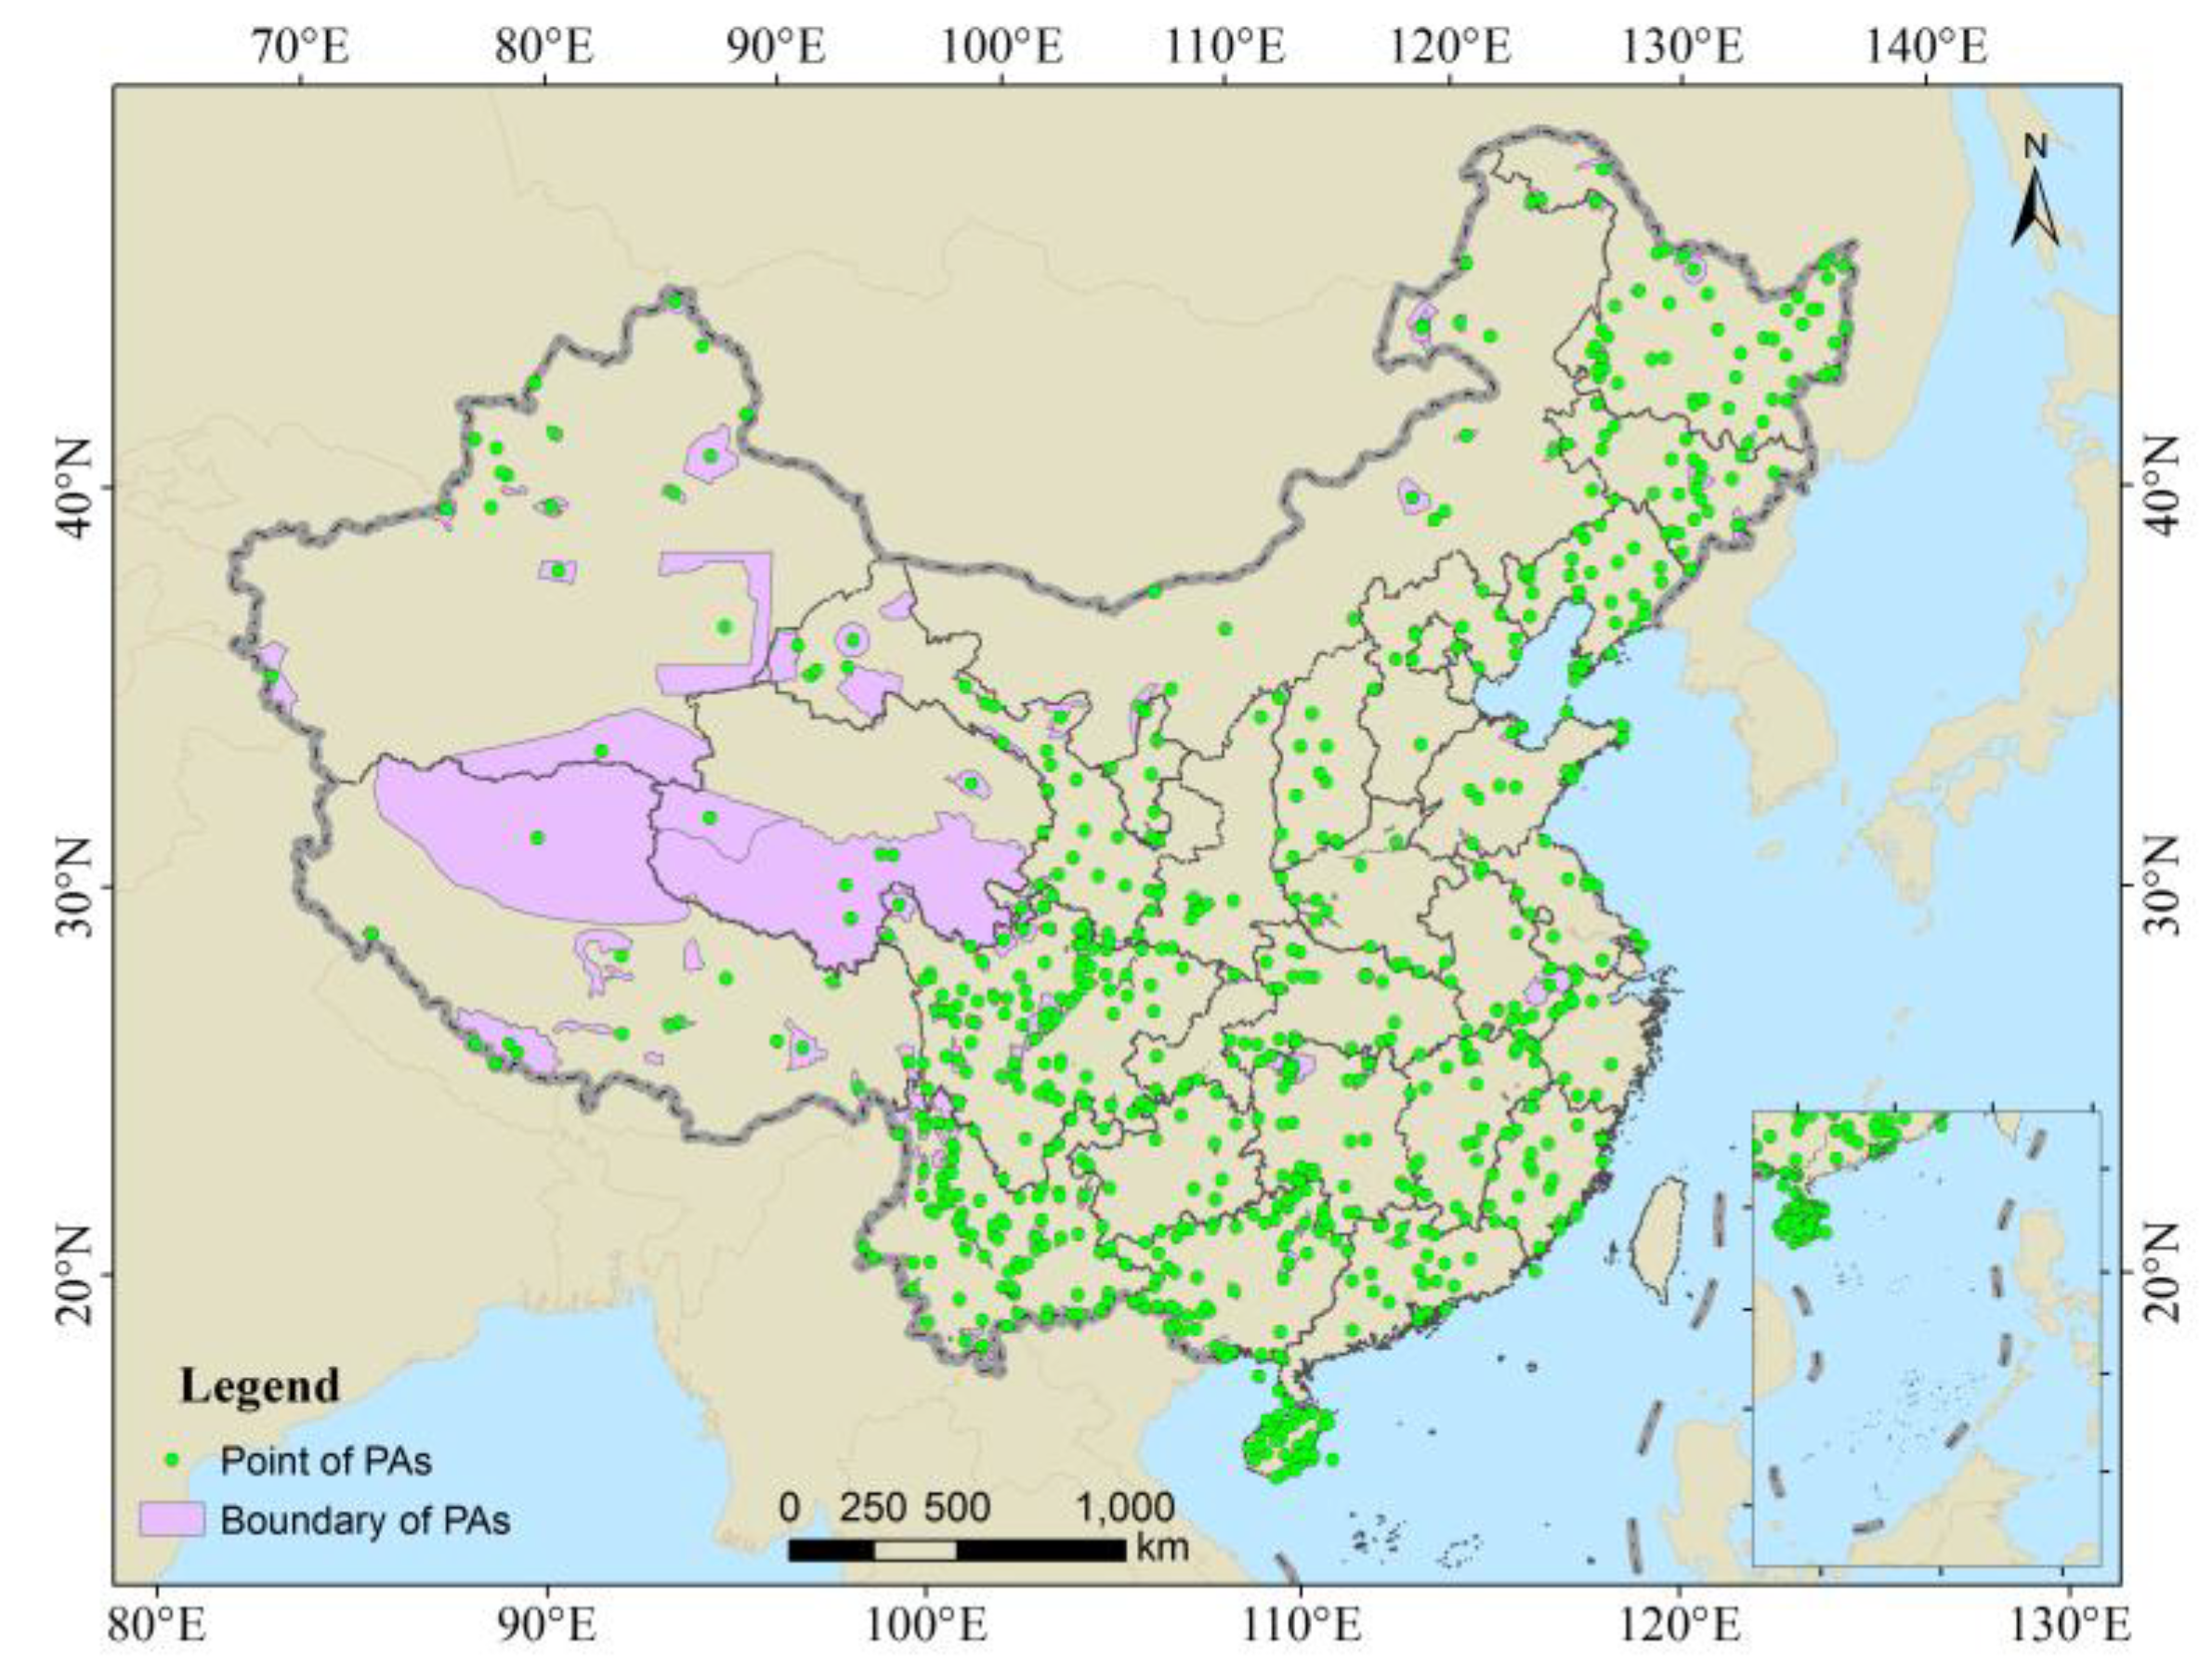
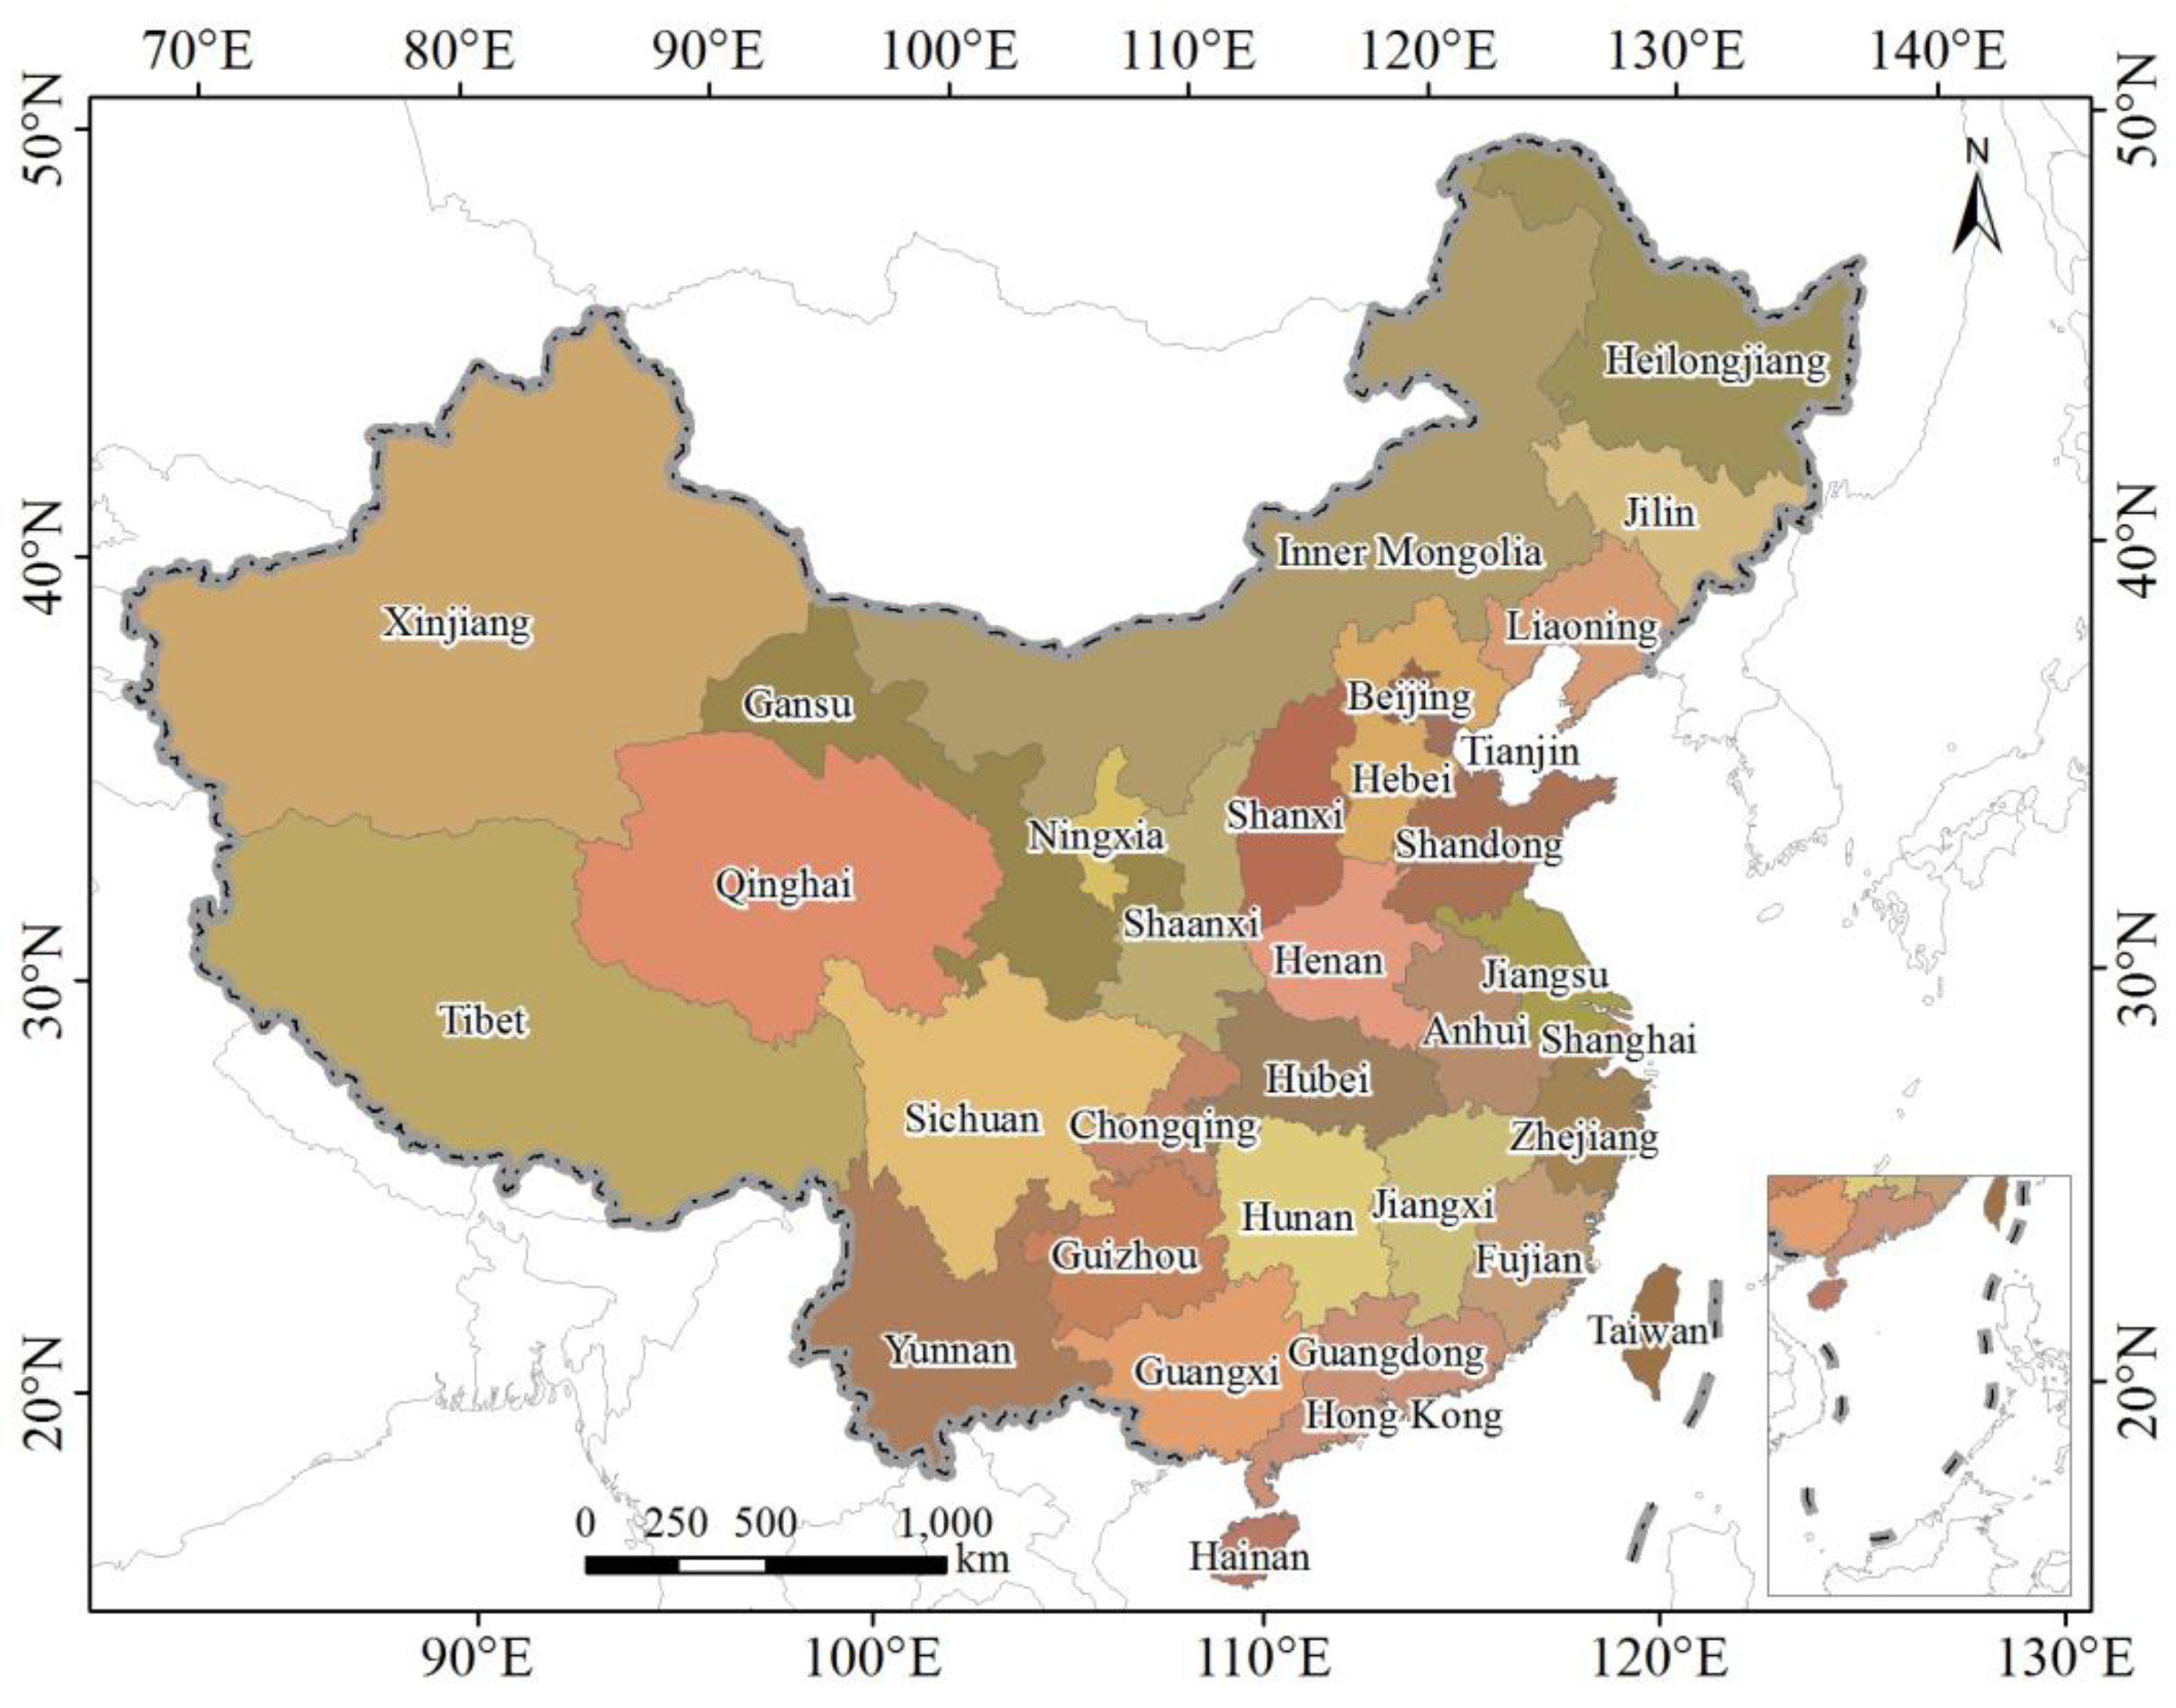
2.1. Study Area

China is a country with abundant biodiversity. Due to continuous and rapid socioeconomic development, the biodiversity and ecosystem services in China are facing serious threats [41,44]. To safeguard biodiversity and ecosystem function, China has established several PAs. According to the UN Environment World Conservation Monitoring Center (UNEP-WCMC) report from 2016 [45], 2158 PAs had been identified in China, covering 17.08% (1,599,092.0 km2) of the total terrestrial area and 3.77% (33,086.0 km2) of the total marine area. The percentages of terrestrial and marine PAs in China are higher than those at the global level. The distribution of PAs in China is shown in Figure 1; the dataset was acquired from the World Database on Protected Areas (WDPA) [46]. Among the 2158 PAs, 726 (i.e., 35%) of them have a clear boundary, and the remaining PAs have point-type boundaries because they have smaller areas. In this study, we focused on characterizing the trends in light pollution for PAs with a clear boundary.

2.2. Data Sources

2.2.1. Nighttime Light Imagery

The DMSP-OLS is the longest-operating nighttime light Earth observation satellite in the world, and it contains six sensors (i.e., F10, F12, F14, F15, F16, and F18) to capture luminescence on the Earth’s surface under cloud-free conditions. This dataset can be acquired freely from the National Centers for Environmental Information (NCEI) website of the National Oceanic and Atmospheric Administration (NOAA) [47]. The annual data of nighttime lights contain three types of products, i.e., cloud-free observation frequency products, average lighting products and stable nighttime lighting products. The stable nighttime lighting products were selected as the dataset since they exclude background noises and fluctuating lights, such as gas flares, wildlife fires and auroras. Stable nighttime light products include lights from cities, towns, and other sites with persistent lighting. This product has a 6-bit radiometric resolution, and the range of the digital number (DN) is from 0 to 63. The spatial resolution of this product is 30 arcseconds (approximately 1 km around the equator).
Because the long time series of DMSP-OLS nighttime light images was obtained by different sensors, the consistency and comparability of the images cannot be ignored. Therefore, Sicily, Italy, was used as the invariant area to establish a second-order polynomial regression model [35]. According to the coefficient of the model, the time series images were intercalibrated. After intercalibration, interannual composition and interannual series correction were conducted to improve the comparability of the images. Through the system correction, the consistency and comparability of the time series images were significantly improved [35]. After correction, the images were clipped and projected, and a nighttime light composite map of China was generated, as shown in Figure 2, using multitemporal (i.e., 1992, 2002, and 2012) nighttime light imagery. For example, white colors represent the area that kept unchanged in the three phases and it refers to the stable light pollution area. Similarly, black colors represent no light pollution in the three phases. Ted colors represent extended light pollution and blue colors represent decreasing light pollution.

2.2.2. Protected Areas Dataset

With the support of the International Union for Conservation of Nature (IUCN) [48], the World Database on Protected Areas (WDPA) was released by the UNEP-WCMC [49]. It is a public dataset that can be used to identify terrestrial and marine PAs and access related statistical information [50]. Until now, the WDPA was the only complete database with information about PAs from around the world, and it has been used in government decision making, including policy development and conservation planning. Meanwhile, it has attracted attention from scientists in biodiversity conservation [51], ecosystem services [52], and sustainable development [51].

2.3. Methods

2.3.1. Nighttime Light Index

To characterize the light pollution trend in each PA, we employed the two nighttime light indexes from Jiang et al. [35], i.e., the total night light (TNL) and the night light mean (NLM). TNL represents the overall level of light pollution, and previous studies have confirmed that it is strongly related to human activity [53] and socioeconomic parameters [29]. NLM represents the density of light pollution [35], and it has been widely used to quantitatively analyze the light pollution density at the pixel and regional scales [25,39].
TNL represents the summed level of nighttime light pollution in PAs, and it can be expressed as follows:
TNL = i = 1 63 C i × D N i
where DNi is the ith gray level, and Ci is the number of pixels that correspond to the gray level.
NLM denotes the average level of light pollution within PAs, and its formula is as follows:
NLM = ( i = 1 63 C i × D N i ) / i = 1 63 C i
where DNi is the ith gray level and Ci is the number of pixels that correspond to the gray level.
Different nighttime light (DNL) indexes can be used to measure the differences in light pollution indexes, such as TNL and NLM. This difference can demonstrate the change in the light pollution index between two periods. The equation is as follows:
DNL = ϕ t 1 ϕ t 2
where ϕ t 1 and ϕ t 2 denote the nighttime light index of the t1 period and t2 period, respectively.

2.3.2. Spatial Pattern Analysis

The Getis-Ord Gi* statistic was adopted to identify spatial hot spots and cold spots with different significance levels in the ArcGIS 10.2 software platform. By calculating the context of neighboring features for each PA, three new feature classes, including the z-score, p-value and confidence level, were generated as outputs. A high z-score with a small p-value represents a significant hot spot, and a low negative z-score with a small p-value represents a significant cold spot. Moreover, a significant hot spot should be surrounded by high-value features, and the absolute value of the z-score demonstrates the spatial cluster intensity. This approach can help visualize spatial pattern changes of the features, and the formula is shown as follows:
G i * = j = 1 n w i j x j X ¯ j = 1 n w i j S [ n j = 1 n w i j 2 ( j = 1 n w i j ) ] 2 n 1
X ¯ = j = 1 n x j / n , S = ( j = 1 n x j 2 ) / ( n 1 ) ( x ¯ ) 2
where G i * is the z-score of patch i, Xj is the attribute value for feature j, Wij is the spatial weight between patch i and patch j, and n is the total number of features.

2.3.3. Spatial Trend Analysis

The linear regression trend method is a tool used to calculate changes in trends in time series images at the pixel scale [54], and it has been demonstrated to be an efficient and convenient method for revealing the spatial-temporal patterns of light pollution using long time series of nighttime light images [35]. The formula is expressed as follows:
T DMSP - OLS = n × i = 1 n i × D N i i = 1 n i i = 1 n D N i n × i = 1 n i 2 ( i = 1 n i ) 2
where TDMPS-OLS refers to the regression trend in the DMSP-OLS time series images, DNn represents the DN value in year n, and n represents the time span. If TDMPS-OLS > 0, it represents an increasing trend, and if TDMPS-OLS < 0, it represents a decreasing trend. If TDMPS-OLS = 0, it represents a stable trend.

2.3.4. Division of Light Pollution Change Levels in PAs

Based on the TNL index and the NLM index, the PAs impacted by light pollution were divided into eight categories: decreasing trend (DT), stable trend (ST), low increasing trend with low density (LL), low increasing trend with high density (LH), medium increasing trend with low density (ML), medium increasing trend with high density (MH), high increasing trend with low density (HL), and high increasing trend with high density (HH). Table 1 shows the classification criteria.

3. Results

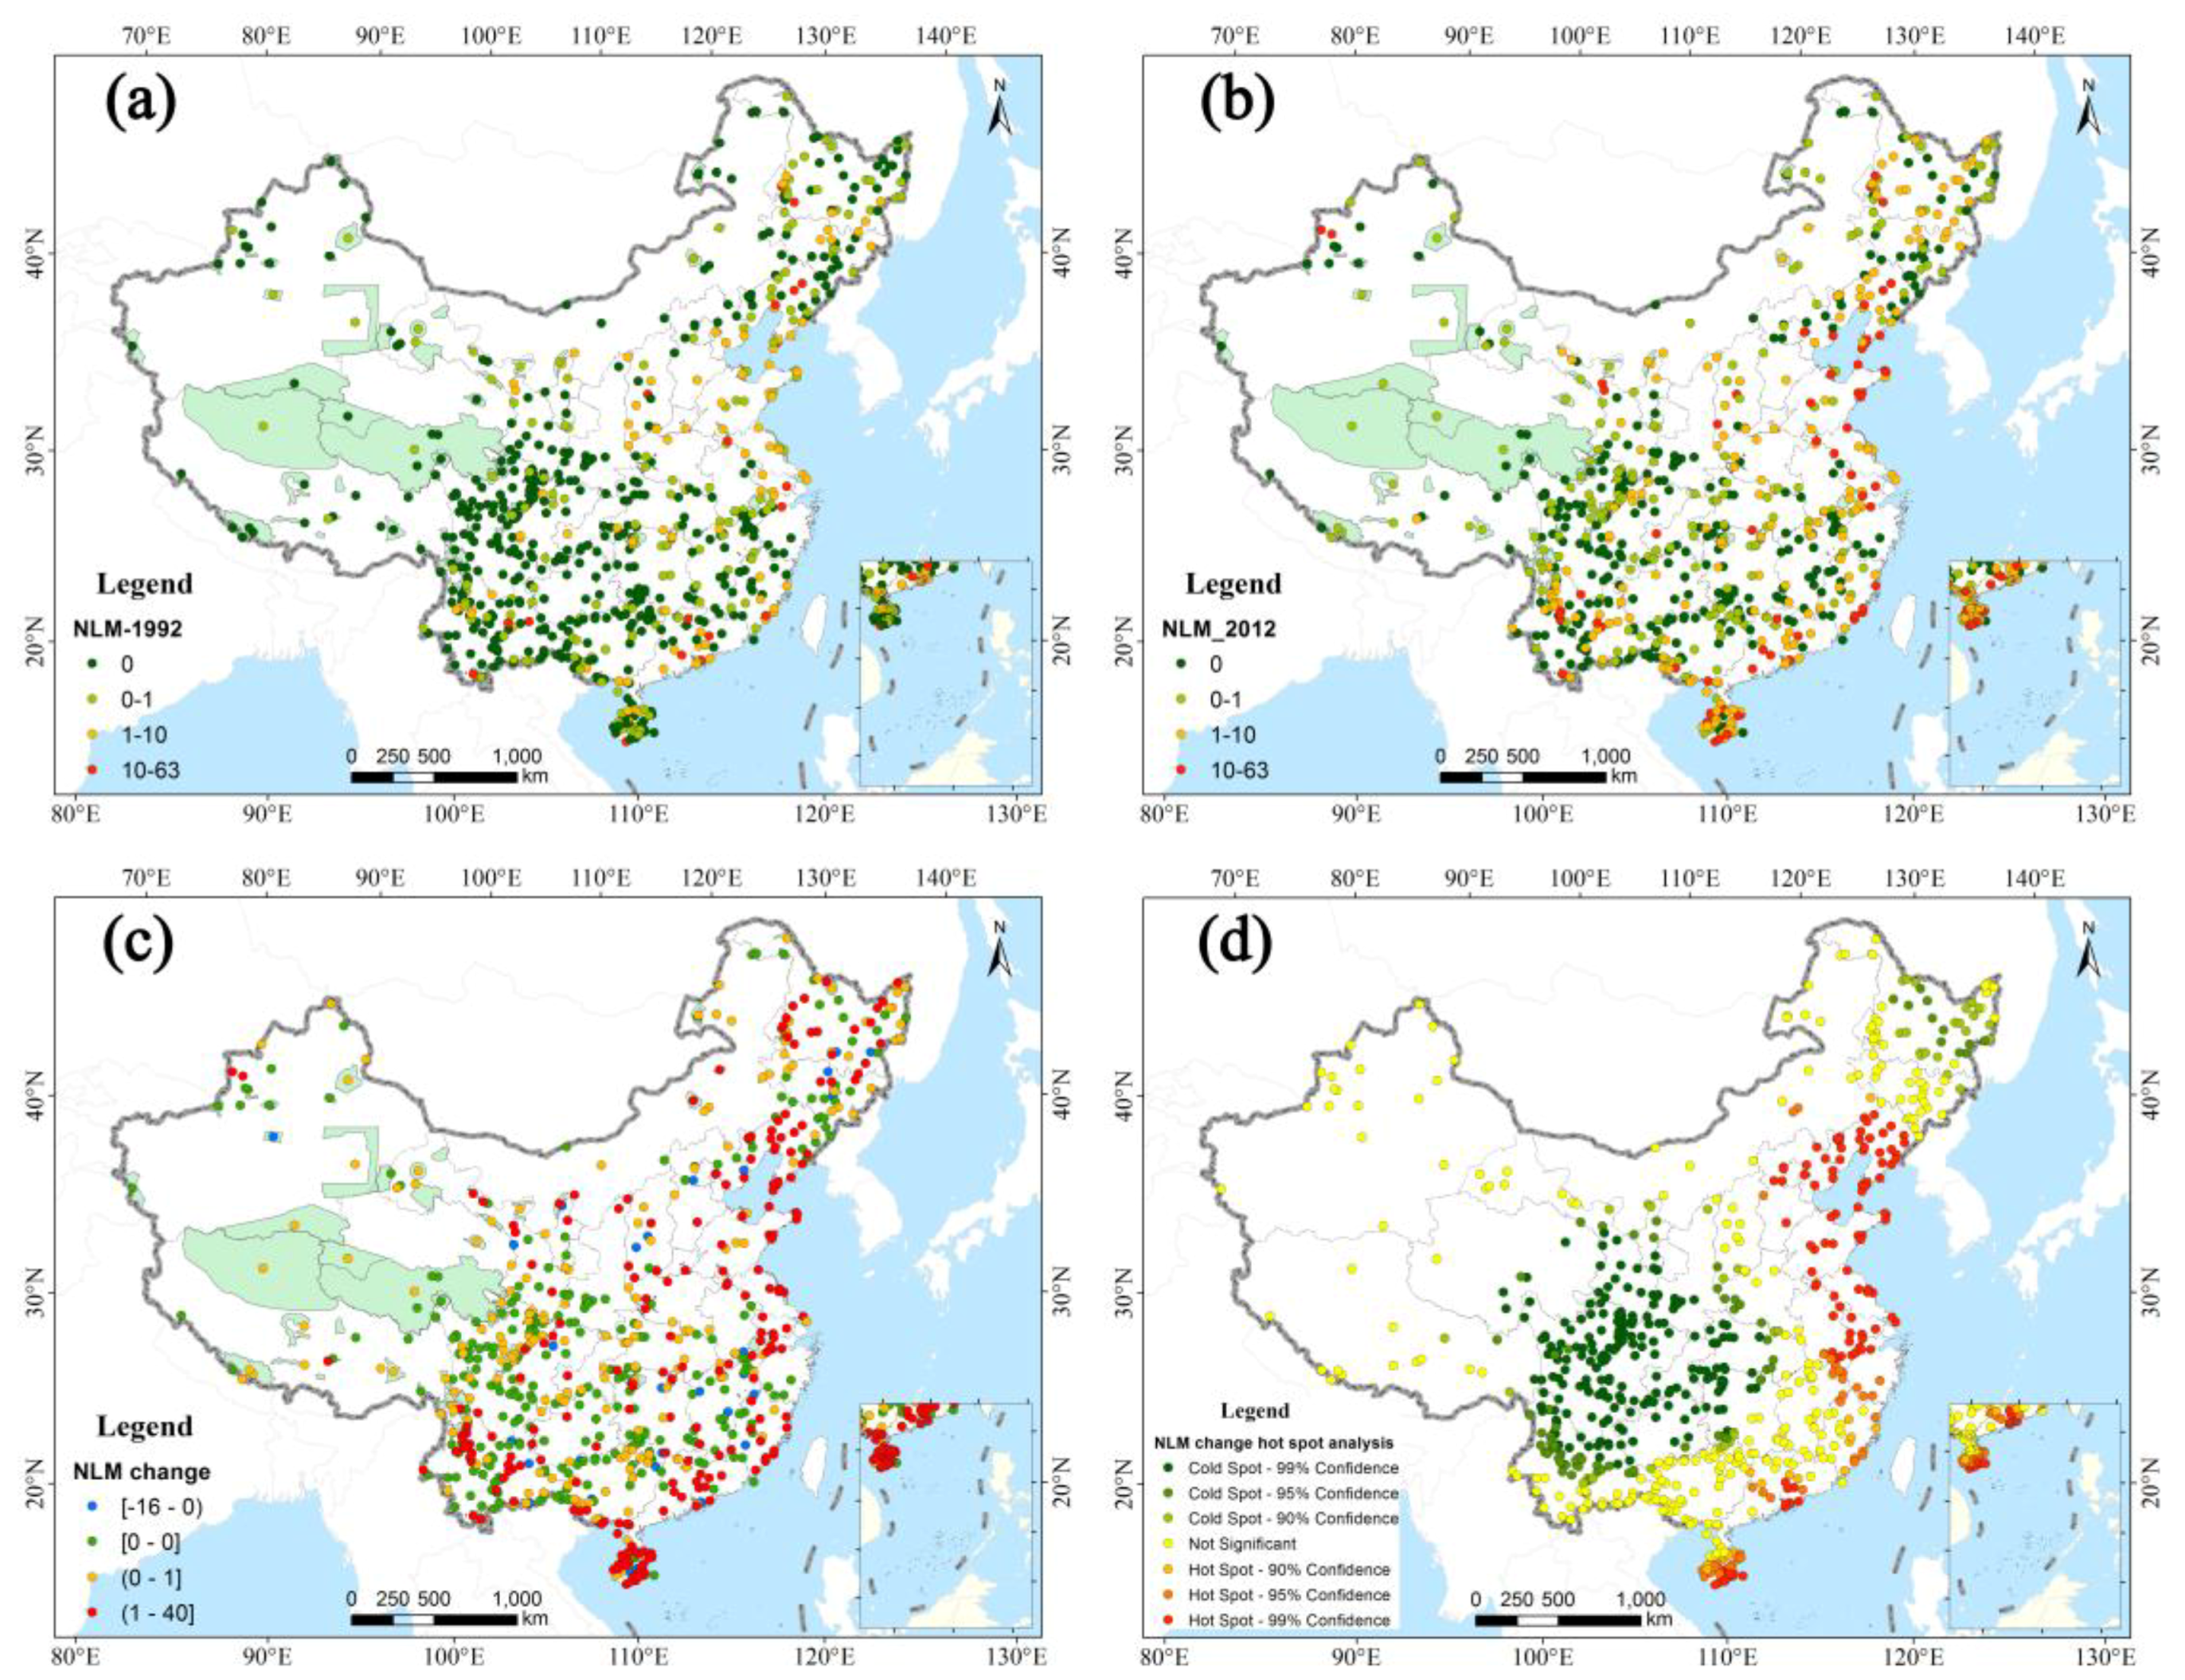
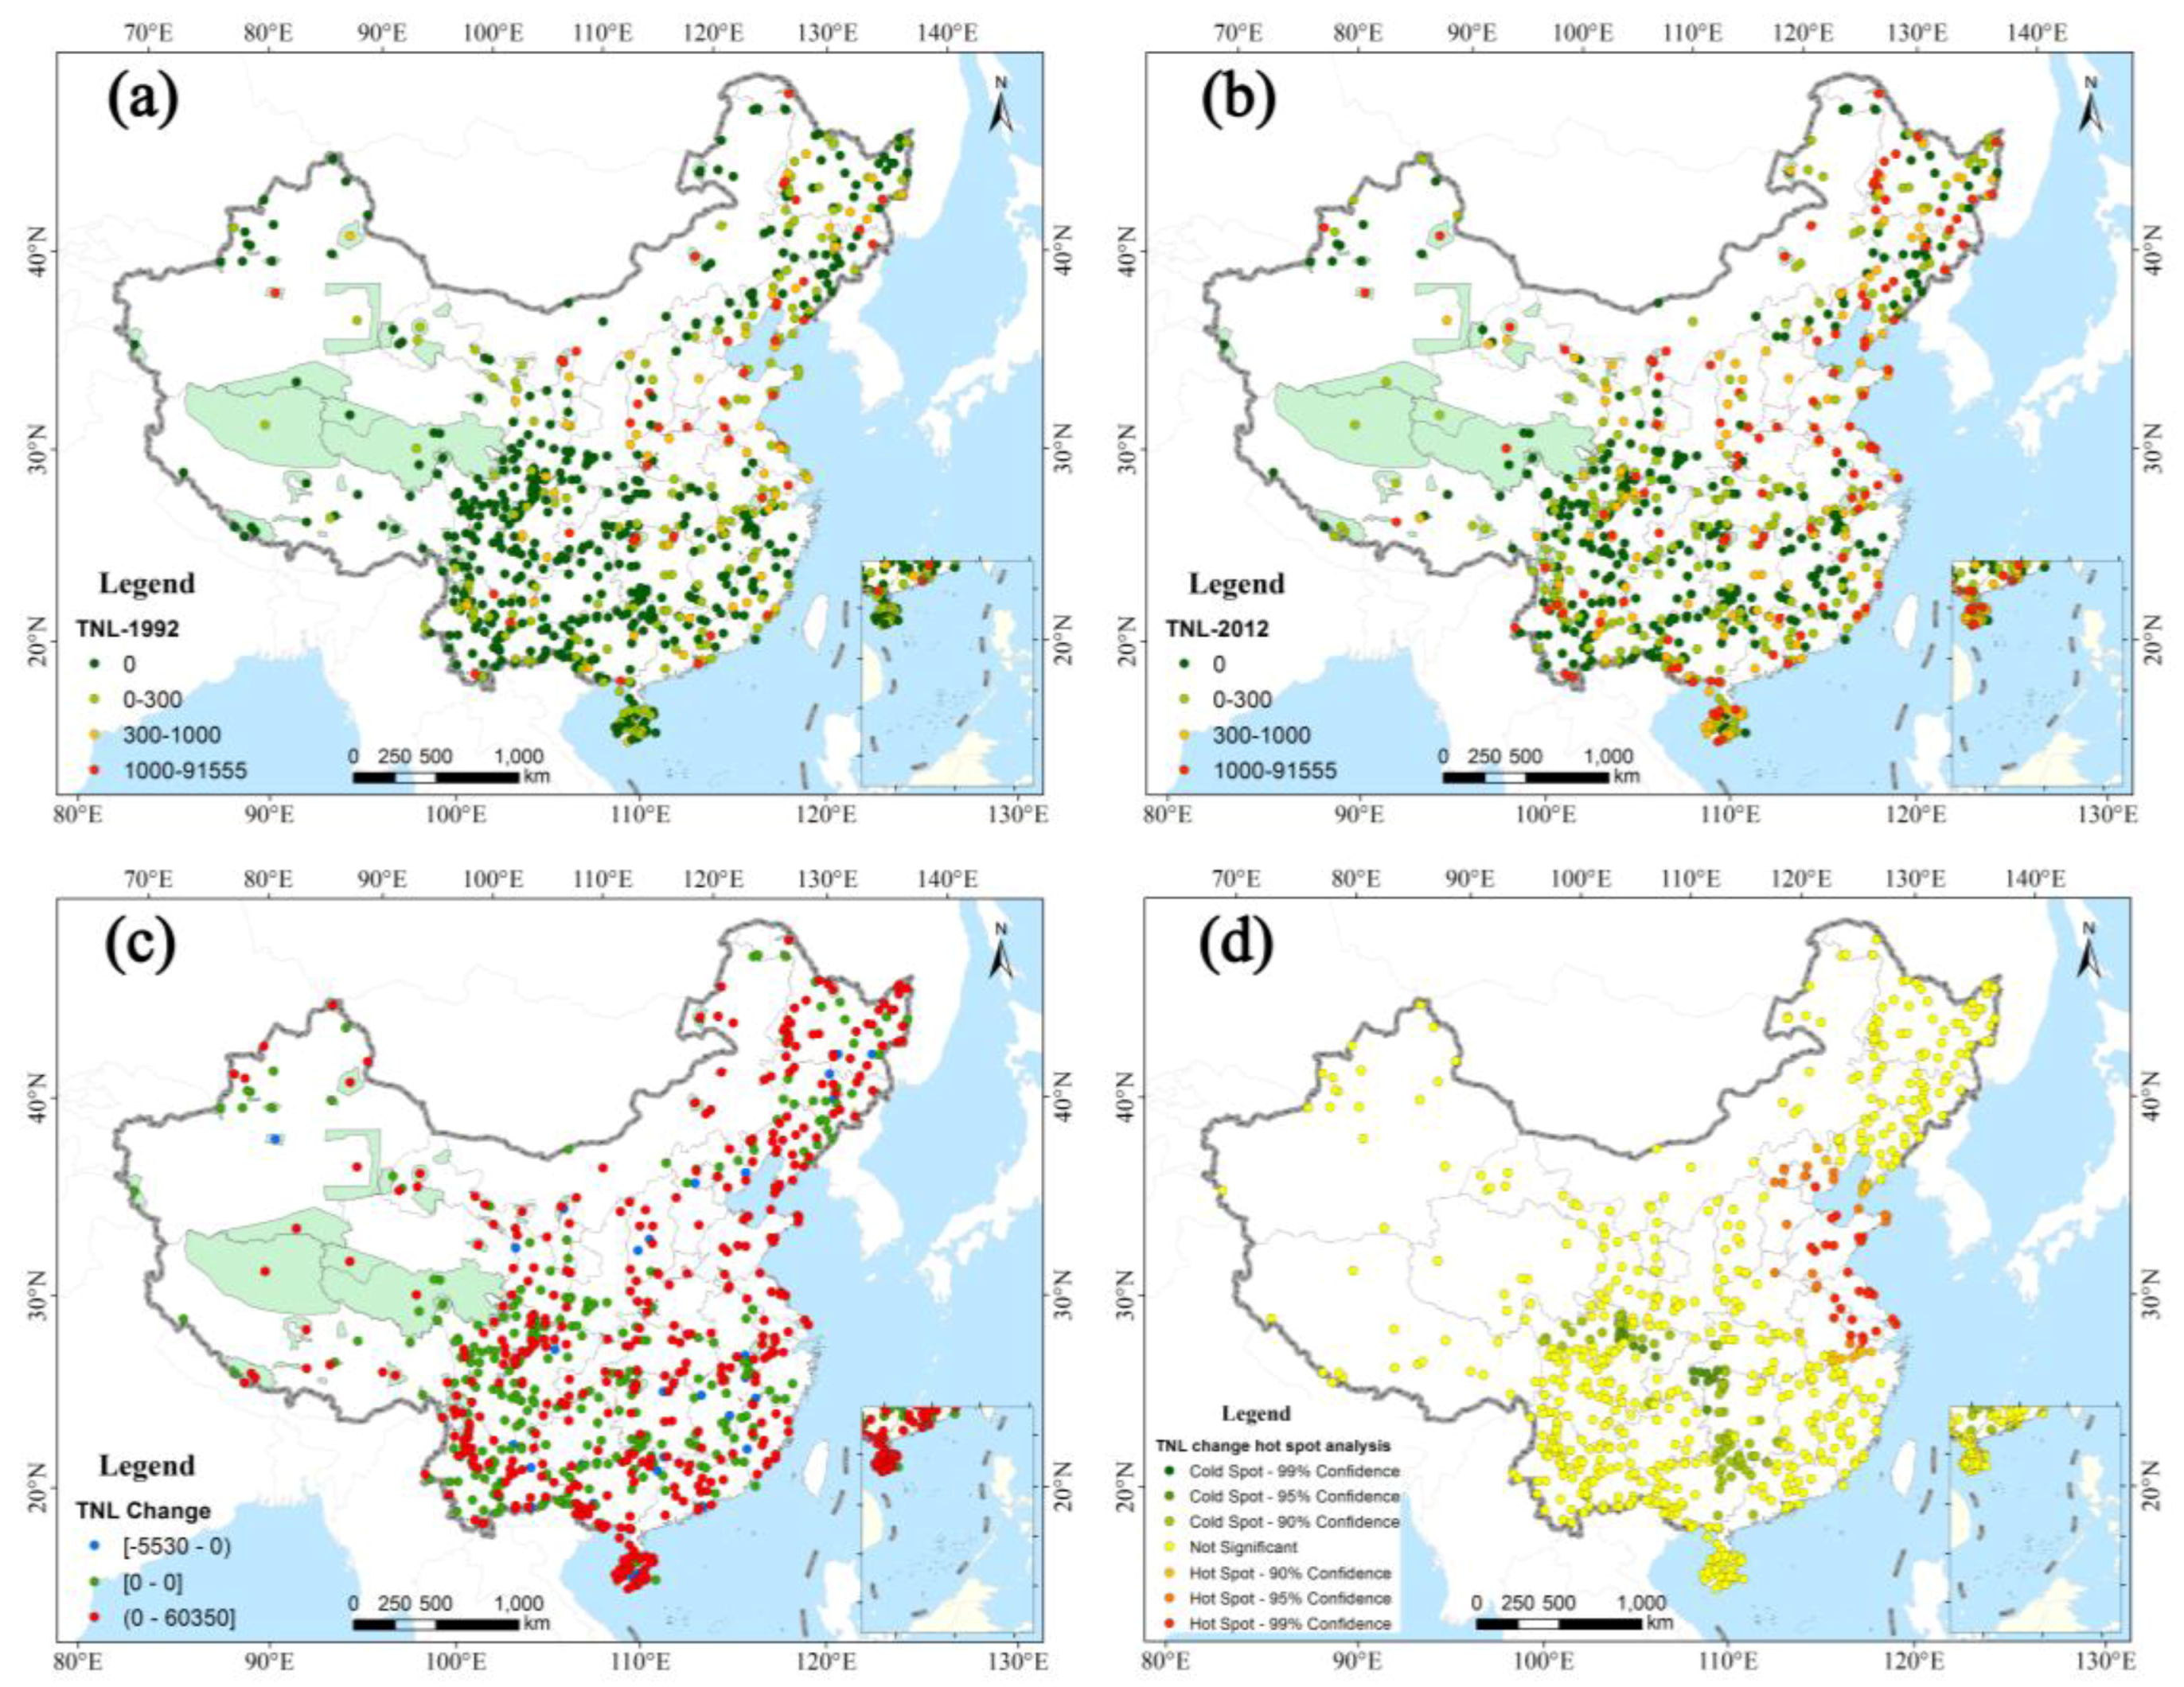
3.1. The Trends and Patterns of Light Pollution in PAs from 1992 to 2012

To clarify the trends and patterns of light pollution, a Chinese provincial map was generated with the names of the provinces, as shown in Figure 3.
The TNL indicator was calculated for each PA in 1992 and 2012 (Figure 4a,b, respectively). In 1992, 455 PAs were under dark conditions (TNL = 0), accounting for 62.59% of the total number of PAs. However, this percentage of dark PAs deceased to 40.50% in 2012. This result showed that more than 20% of the PAs were newly influenced by artificial light over the past 21 years. The percentage of low-level light pollution (0–300) slightly increased from 24.66% to 29.75%; however, the percentage of medium- and high-level light pollution (300–1000 and 1000–91,555, respectively) increased by 6.85% and 9.23%, respectively. Based on the observed spatial patterns, the high-level light pollution affected PAs located in Shandong, Jiangsu and Yunnan in 1992; in contrast, in 2012, the illuminated PAs were distributed nationwide. Figure 4c shows the change in TNL between 1992 and 2012; consequently, most PAs (57.30%) experienced an increase in light pollution. The remaining PAs showed either a decreasing trend or a stable trend, which accounted for 4.00% and 38.71%, respectively. Most of the lit PAs were located in eastern and central China, and some PAs located in western China experienced new light pollution.
Geostatistical methods combined with GIS technology were used to explore the spatial distribution characteristics and patterns of nighttime light pollution changes from 1992 to 2012. Z-scores with confidence greater than 99%, 95% and 90% were selected as hot spots, respectively. Figure 4d shows the distribution of hot spots and cold spots that represented changes in the TNL. The hot spots (red) represent aggregated PAs in which the TNL pollution increased, and the cold spots (green) represent aggregated PAs in which the TNL pollution decreased. Figure 4d shows that the spatial distribution of the TNL change has obvious agglomeration characteristics. The hot spots were mainly concentrated in eastern coastal areas, such as Shandong, Jiangsu, Anhui, Hebei, and Liaoning, which may be due to economic and urban development of coastal areas after the implementation of the reform and opening-up policy [35] and subsequent invasion of light pollution in PAs from human activities, thereby forming a hot spot where the TNL has increased. Cold spots were mainly concentrated in Guangxi, Hunan, Hubei and Sichuan. The 2008 Wenchuan earthquake in Sichuan Province caused serious damage to the city’s infrastructure and light source providers in the affected area, which may explain the reduction in light pollution [55]. Due to superior natural conditions, there are several nature reserves in these regions. Over recent years, the country has attached great importance to the natural environment and has issued a series of environmental protection measures, such as the resettlement of residents and the establishment of buffer zones [56]; these measures have reduced light pollution and formed the cold spots of the TNL.
Compared with TNL, NLM can reveal the density of light pollution by eliminating area factors. The NLM indicator was calculated for each PA in 1992 and 2012 (Figure 5a,b, respectively). In 1992, PAs with high NLM values were mainly concentrated in North China and South China; however, in 2012, PAs with high NLM values were distributed around eastern and southern China. The NLM values of PAs in the western region are relatively low, except for the NLM values of northwestern Xinjiang and southeastern Yunnan. The vast area and low population of the western region accounted for the low NLM; however, industrial development in Xinjiang has become increasingly prosperous, resulting in inevitable light pollution. Figure 5c shows the change in NLM between 1992 and 2012, which was similar to TNL, i.e., most PAs (57.30%) experienced an increase in NLM. The remaining PAs showed a decreasing trend or a stable trend, accounting for 4.00% and 38.71%, respectively. PAs with increased light pollution were mainly located in the eastern and southeastern regions, with only a portion of western PAs exhibiting an increased NLM.
The analysis of the spatial NLM pattern also used hot spot analysis methods. Figure 5d shows that the change pattern of the NLM had obvious spatial agglomeration characteristics. The hot spots were mainly concentrated in the coastal areas, such as Liaoning, Hebei, Beijing, Shandong, Jiangsu, Anhui, Zhejiang, Shanghai, Fujian, Guangdong, and Hainan. Compared to the TNL, the NLM eliminates the influence of the area factor. Therefore, some of the small-area nature reserves in Zhejiang, Fujian, Guangdong, and Hainan experienced strong changes in NLM. Cold spots were mainly located in the southwestern and central regions of China, including Sichuan, Yunnan, Guizhou, Chongqing, Hunan, Hubei, and Shanxi. The NLM eliminates the influence of area, and some small-area nature reserves with obvious changes in NLM were also reflected in the hot spot analysis. Therefore, compared to the TNL, the distributions of hot spots and cold spots of the NLM were larger, reflecting the spatial agglomeration characteristics of the light pollution density in PAs.

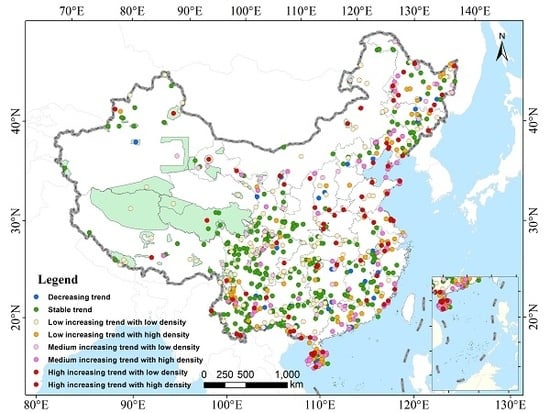
3.2. Classification of Light Pollution Change Levels in PAs

According to the criteria listed in Table 1, all PAs were classified into eight categories with two nighttime light indexes. Figure 6 shows the spatial distribution of the classification of PAs impacted by light pollution, and Figure 7 shows the proportions of the different classifications of PAs. In terms of spatial distribution, the ST accounted for a relatively high percentage, i.e., 41%. This category included PAs with no light pollution and PAs with no changes in light pollution, which were mainly distributed in the central region, the southwestern region, and a portion of the northeastern region. These regions also included a low number of PAs that had a decreasing trend, but these PAs accounted for only 4%. Since 1992, the economy in Northeast China, which was a heavy industrial base, has gradually declined. Affected by the cold environment, economic development has been slow, and a large number of talented people have left the region; thus, these factors may have reduced the nighttime light pollution in PAs. In the central and southwestern regions, slow economic development has led to the outflow of people, and most of the PAs in these regions are distributed in mountainous areas with few people. Therefore, light pollution has remained stable or has decreased. The remaining PAs showed an increasing trend; specifically, 31% showed a low increasing trend, and the percentages of medium and high increases were relatively small, accounting for 14% and 10%, respectively. Figure 5 shows that PAs with a high increasing trend are mainly concentrated in the southeastern coastal areas and a small portion of the central and western regions. The country first developed the eastern coastal areas from 1992 to 2012. Rapid economic development and favorable natural conditions have attracted many residents to the area, and the tourism industry has developed. Therefore, the nighttime light pollution of PAs has intensified. Among the PAs with a high increasing trend, most had a high increasing trend with high density; in contrast, only a small percentage (i.e., 1%) had a high increasing trend with low density. These were mainly PAs with large areas in the western region.

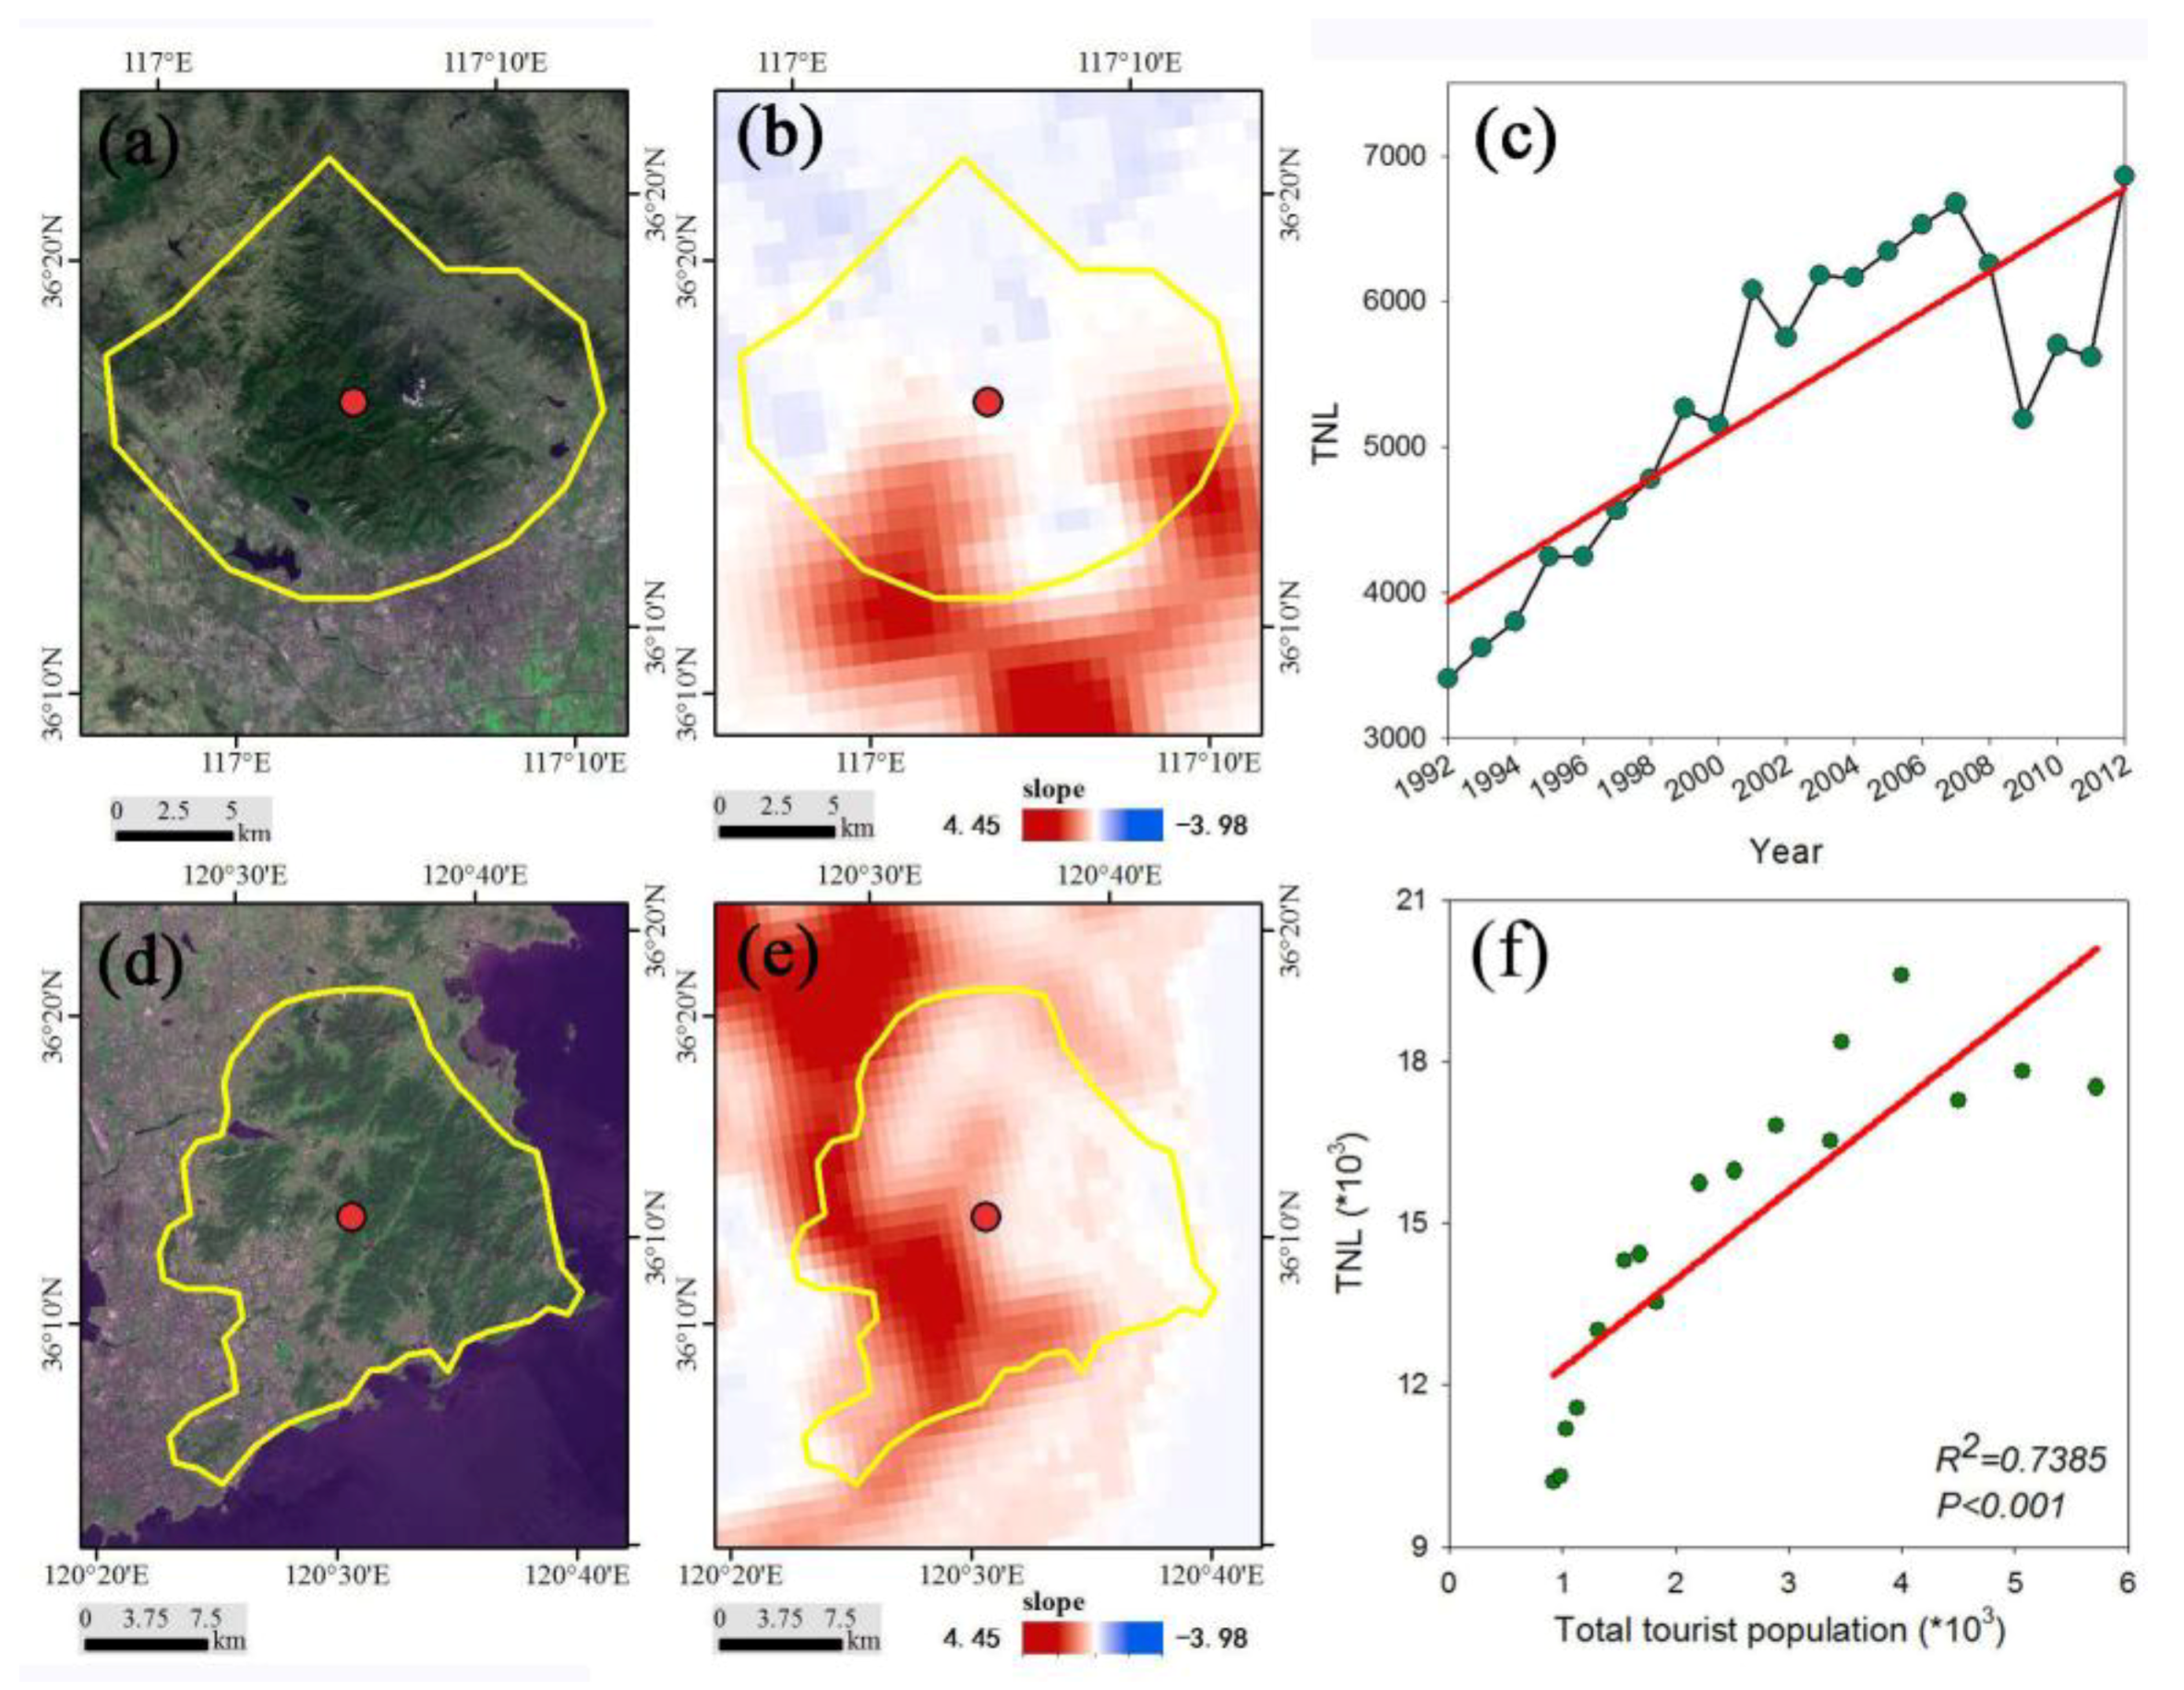
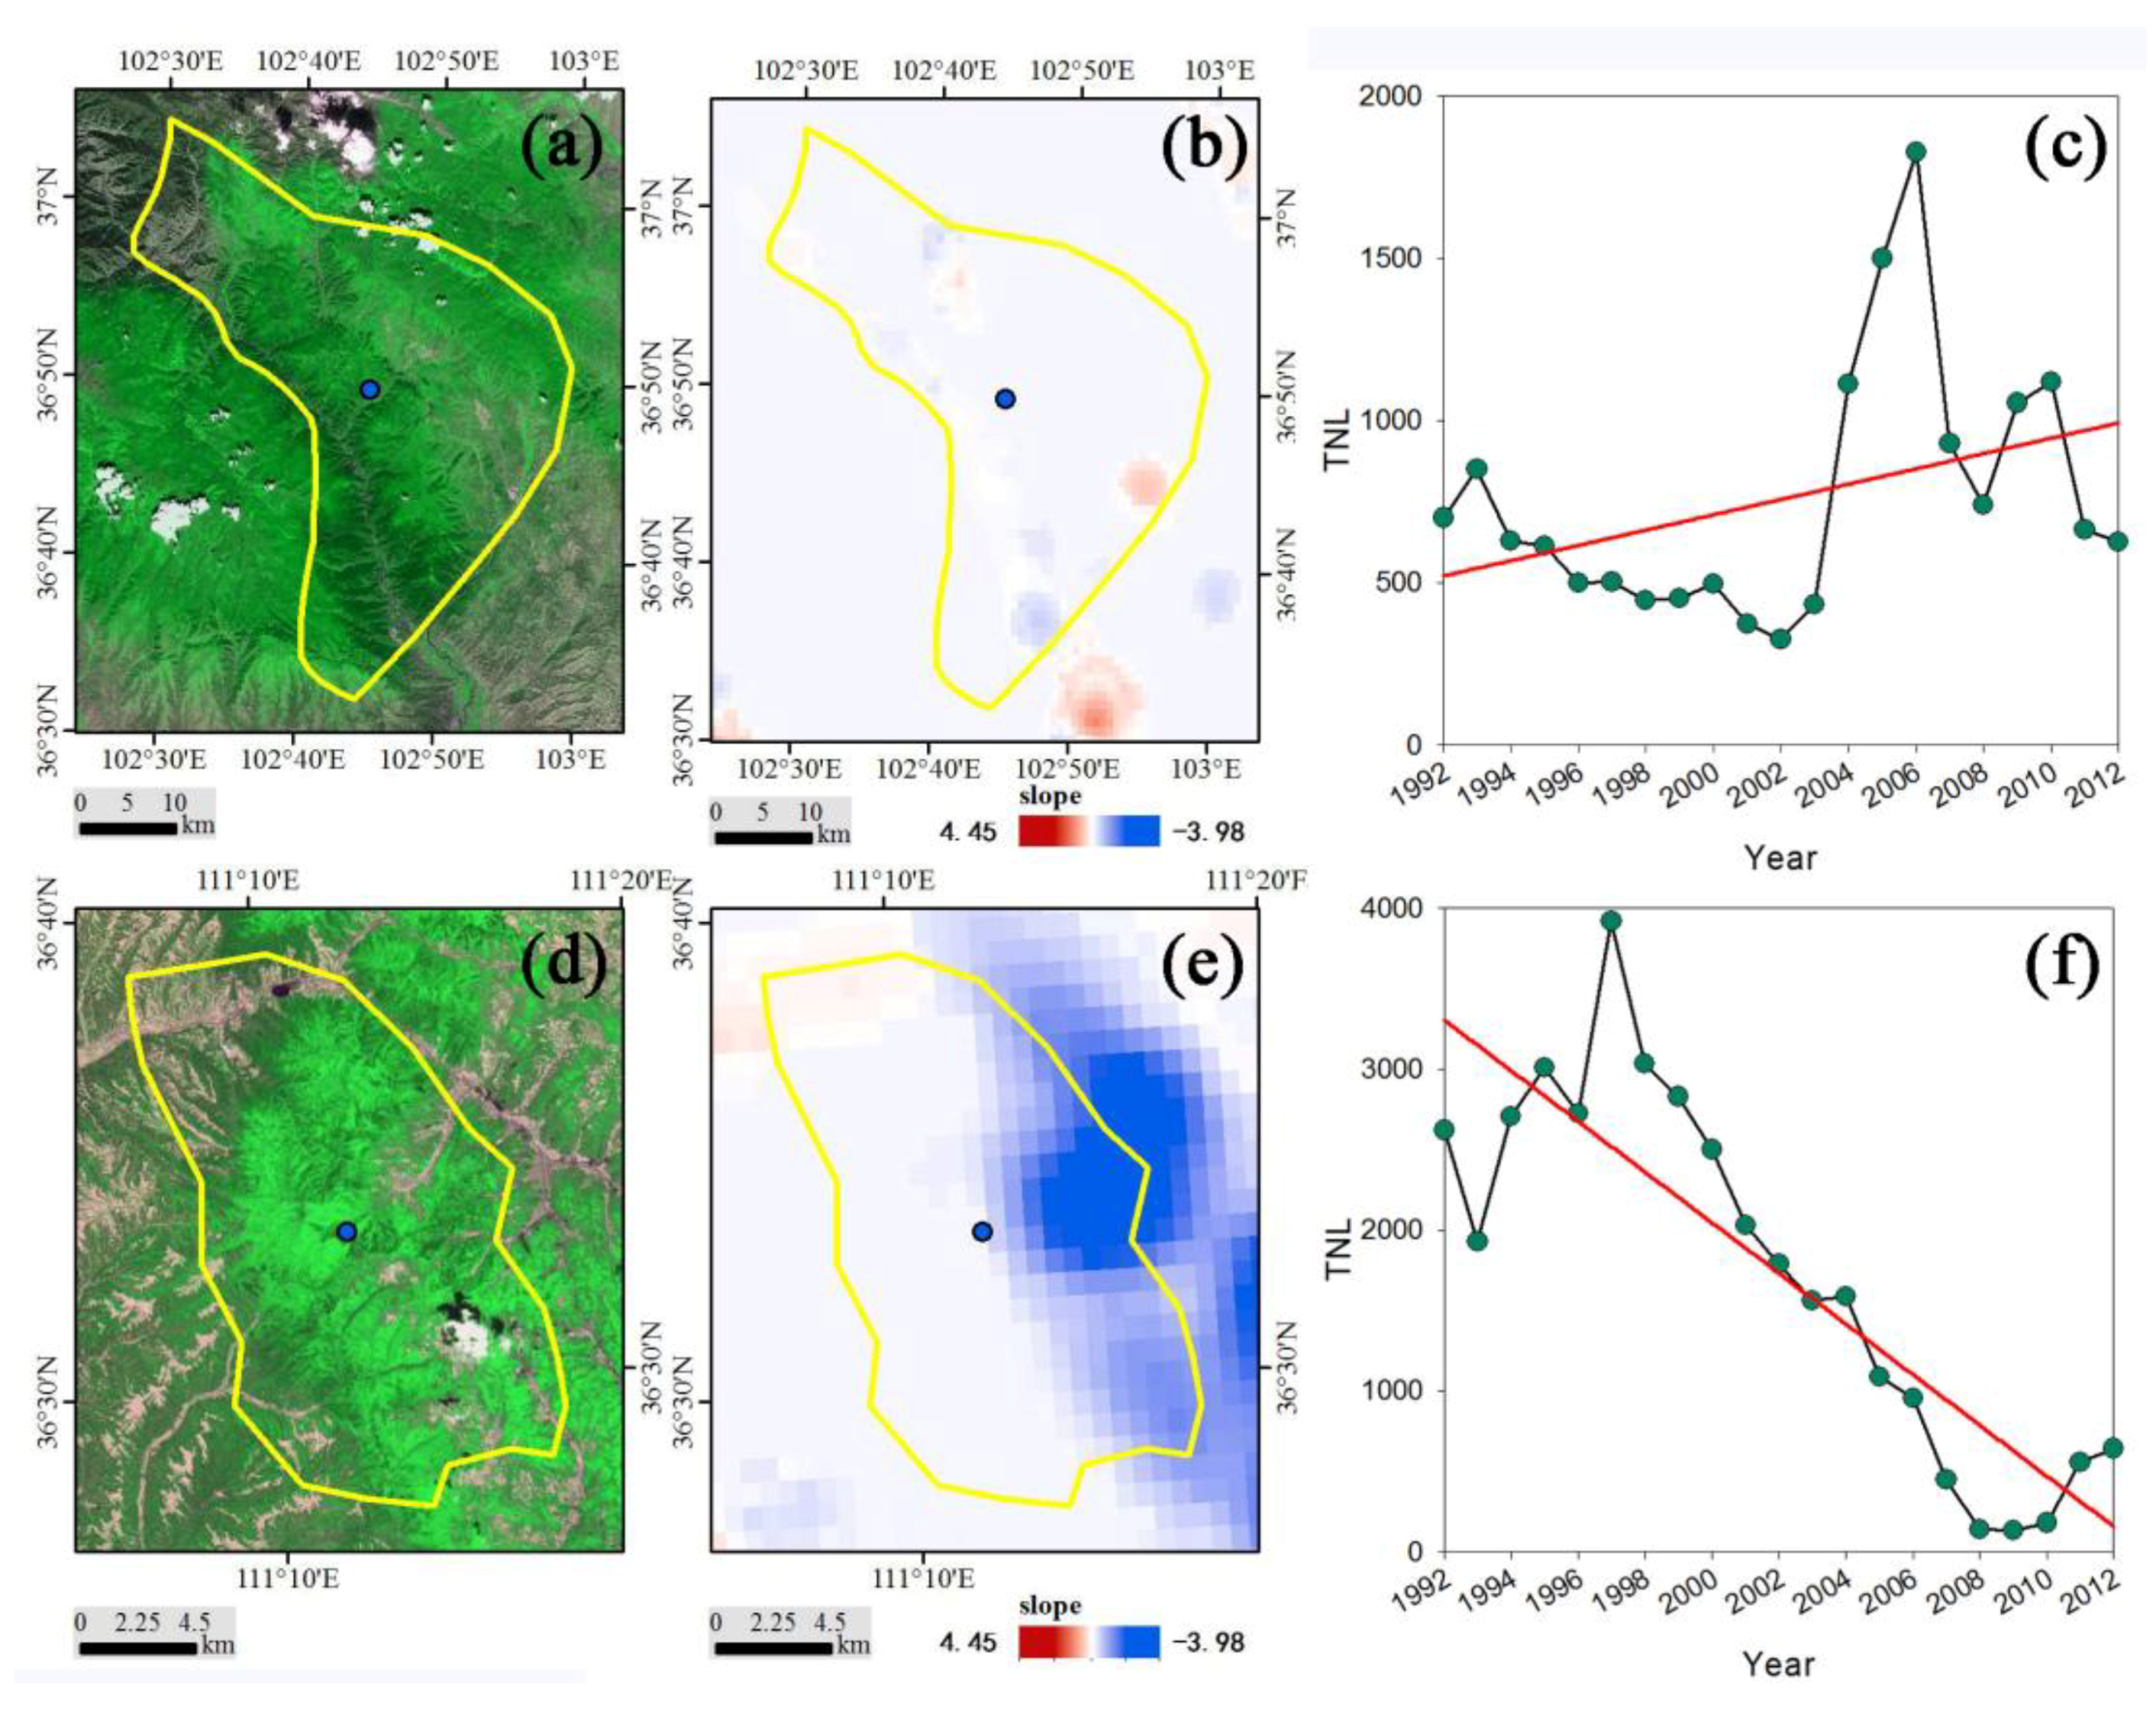
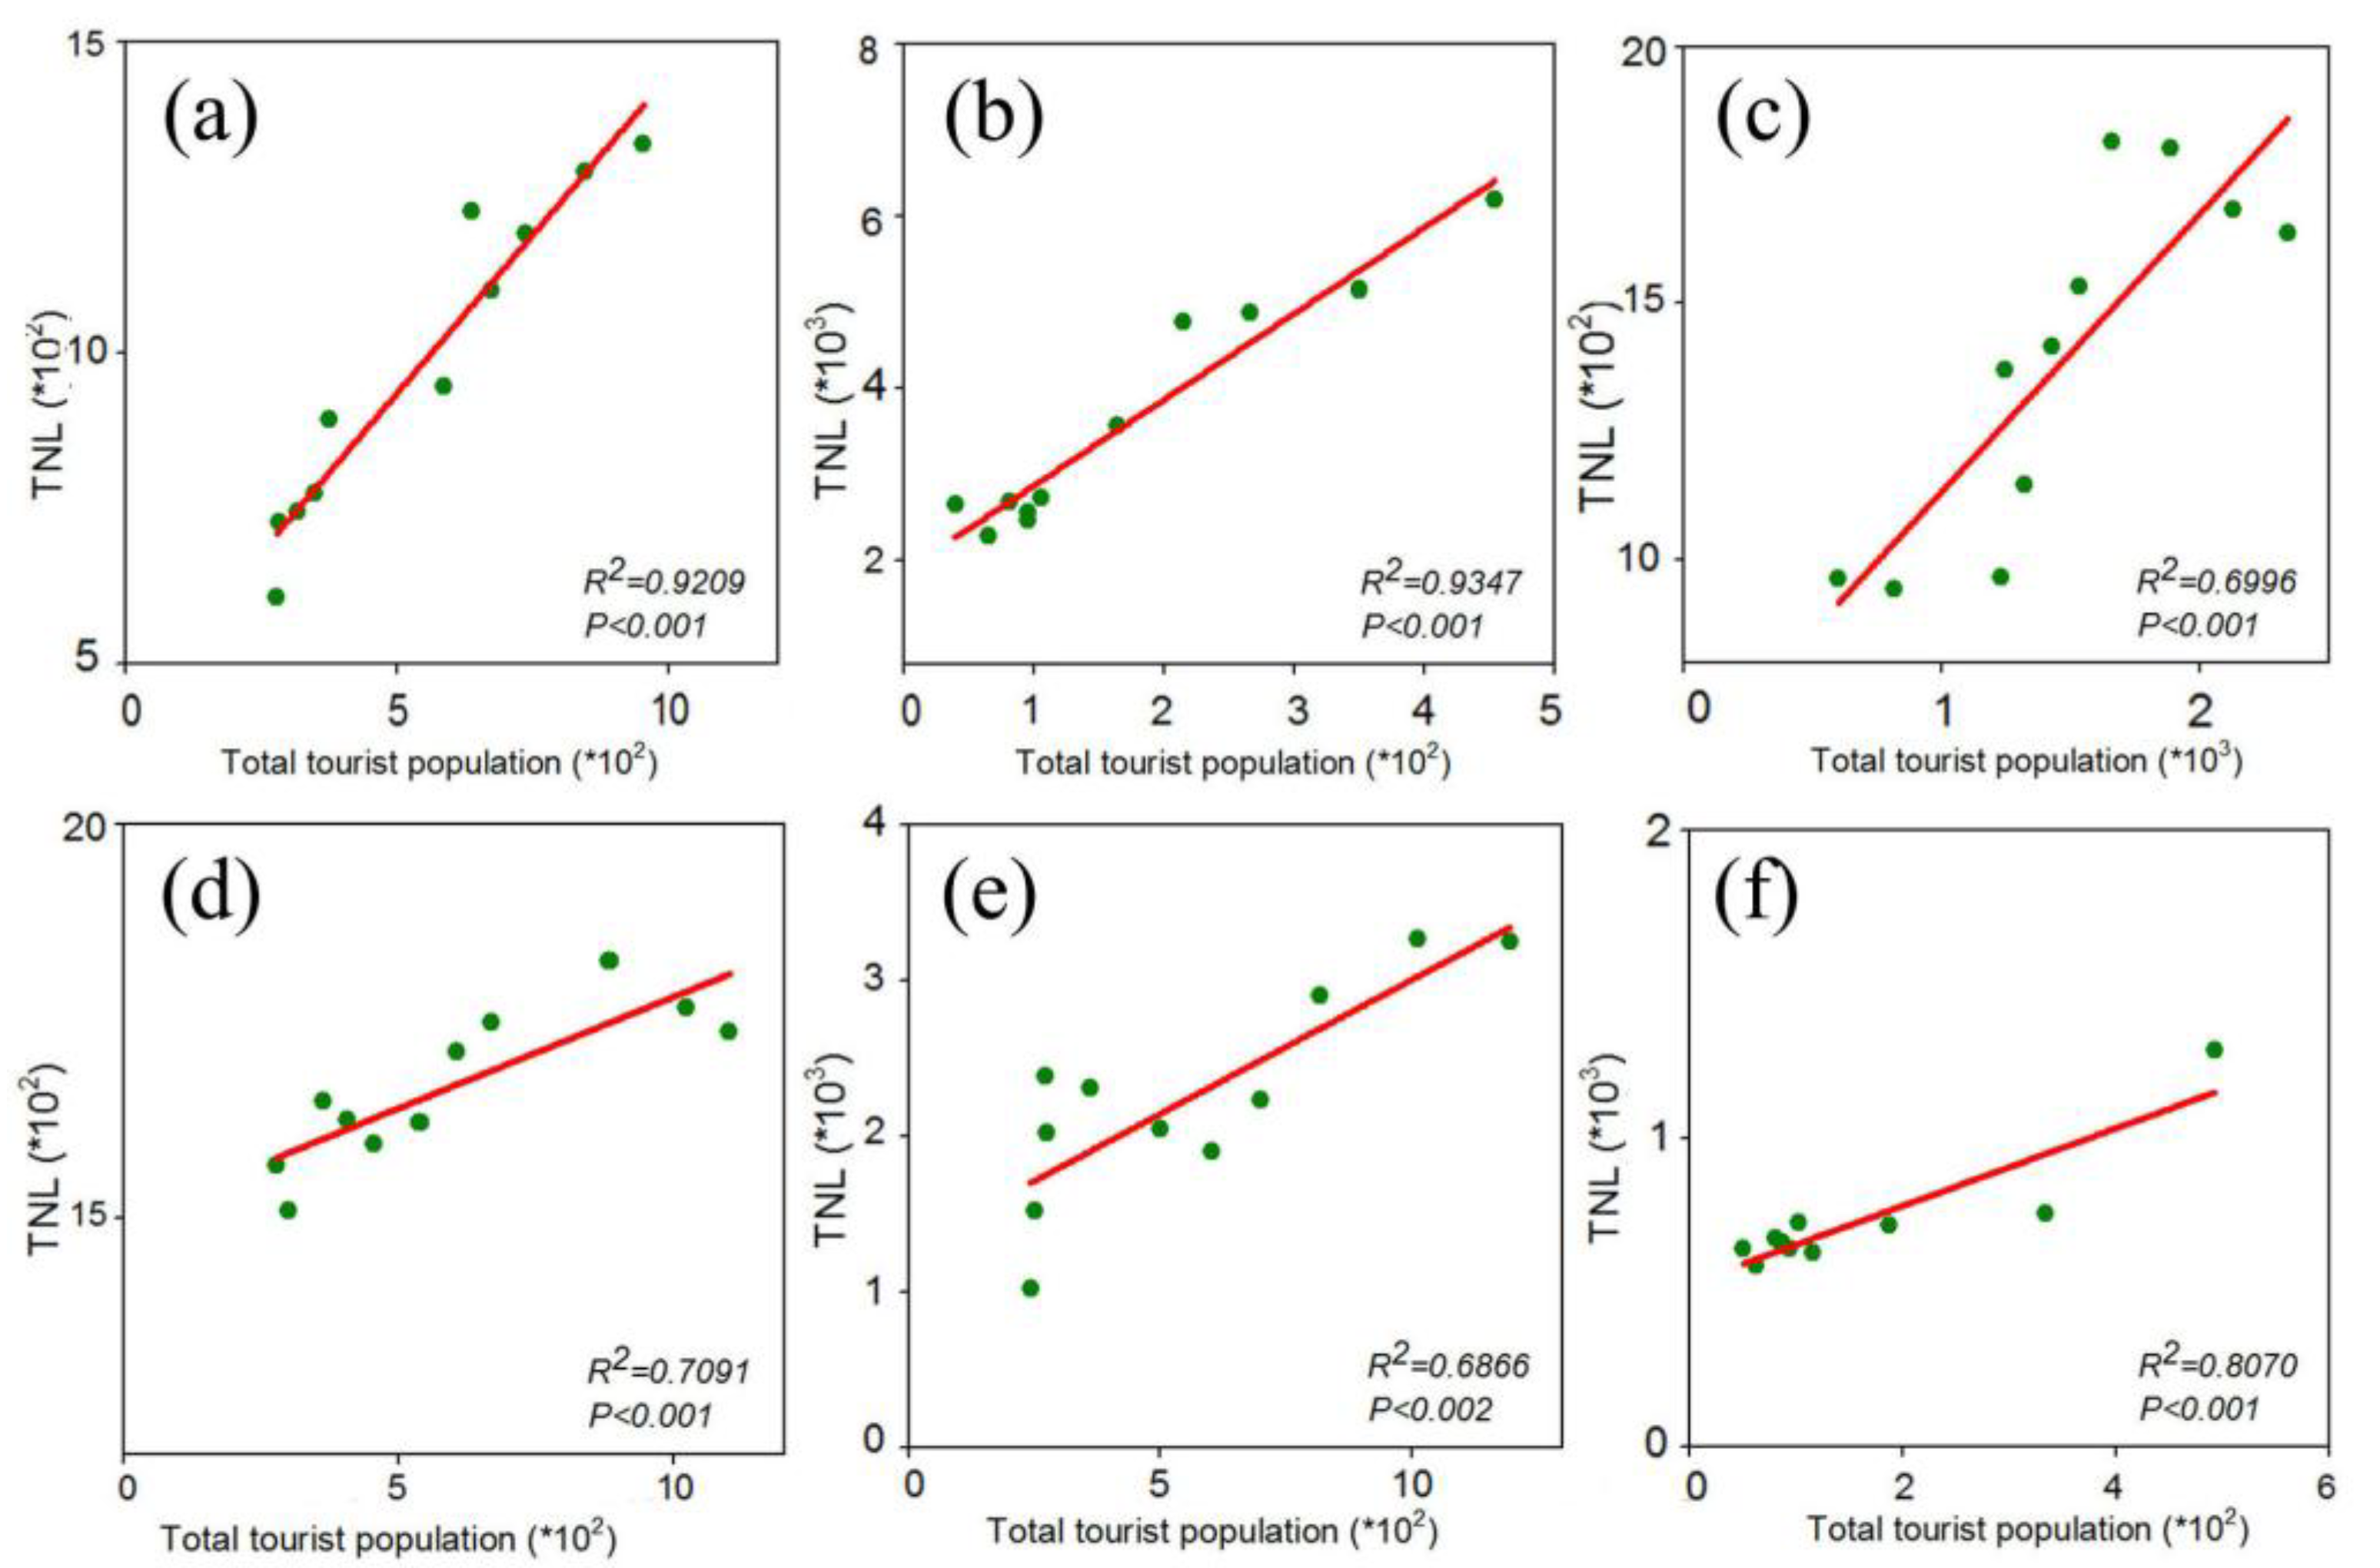
3.3. Cause Analysis of Light Pollution Change in PAs

Over the past 21 years, most PAs have experienced an increasing trend in light pollution. However, some PAs have still experienced declines in light pollution, and these are represented by the blue points in Figure 5. High-resolution satellite images and statistical data [57] were selected to analyze the reasons for the changes in light pollution in PAs. Figure 7 shows the Si Hong Xiangyang Reservoir and Huihe Nature Reserve. Both PAs are close to urban areas. With increases in the population and urban expansion, the nighttime light pollution of the PAs also increased. The line graphs (Figure 8c,f) show the nighttime light pollution changes in PAs and how light pollution increases with year. In general, the light pollution of PAs near urban area increased.
Figure 9 shows the Panzhihua Sutie Nature Reserve and the Xilin Gol Natural Grassland Reserve. Both PAs experienced mineral exploitation. The line graph (Figure 9c) shows that light pollution in Panzhihua Sutie Nature Reserve has increased since 1992. Therefore, mineral exploitation activity in this PA may have increased from 1992 to 2012. Regarding the Xilin Gol Natural Grassland Reserve, light pollution is mainly located in the area of mineral exploitation. The TNL increased sharply from 2003, which is consistent with the timeline of mineral development. Moreover, the correlation between raw coal production and TNL has been explored (Figure 9f), and the regression coefficient was found to be highly significant. The result showed that mineral exploitation had positive impacts on light pollution in the Xilin Gol Natural Grassland Reserve. These two examples illustrated that mineral exploitation increased nighttime light pollution in the PAs.
Figure 10 shows Mount Taishan and Laoshan National Forest Park, which are well-known scenic spots in the eastern coastal area. There are many visitors each year, which increased the development of the commercial and catering industries around the scenic area. The nighttime light trend (Figure 10b,e) results showed that light pollution exhibited an increasing trend. Moreover, the correlation between the total tourist population and TNL in Laoshan National Forest Park (Figure 10f) demonstrated that tourist development had significant positive impacts on light pollution in Laoshan National Forest Park. To prove general tendency of the impact of tourist development on light pollution, six PAs, i.e., Dongzhaigang Mangroves, Wudalianchi Volcano, Changli Gold Coast, Sanya Coral Reef National Nature Reserve, Xishuangbanna and Zhangye Heihe Wetland National Nature Reserve, are selected with collecting total tourist population to be investigated (Figure 11) and the multiple cases have widely confirmed the tourist development had significant positive impacts on light pollution in PAs.
Figure 12 shows the Liancheng Nature Reserve and the Wulushan Nature Reserve. The Liancheng Nature Reserve is located in the transitional zone between the Qilian Mountains and the Loess Plateau, which represents a special geographic location. Similar to the Wulushan Nature Reserve, the geographic environment is complex and diverse, and there are few people. In recent years, the State has issued a series of policies, such as the forced migration of residents, to protect these PAs [56]. Consequently, almost no human interference or activity occurs in these PAs. The line graphs (Figure 12c,f) also clearly show that resident migration caused a decreasing trend in light pollution in the PAs.

4. Discussion

Due to rapid urbanization and economic development, light pollution has become a non-negligible environmental issue. The establishment of PAs is of great significance to the sustainable development of the natural environment [58]. In recent years, the issue of light pollution and how it affects PAs has gained widespread attention [23,34]. Xiang’s research focused on spatial-temporal characteristics of light pollution for different zones rather than for the zone of each PA [59]. The article by Kaifang Shi focused on the area, total amount, and changing trends of light pollution in PAs as well as the changes in different regions [42]. This paper explores the patterns of light pollution change levels in PAs and classifies them. Moreover, the reasons for the changes in light pollution in the PAs are investigated based on high-resolution satellite images and statistical data.
Increasing trends were mainly related to human activity [35] and the distance between PAs and urban areas [40]. Commonly, nighttime lights from cities can be scattered into the sky [60]; thus, PAs located near a city will be illuminated. In addition, urban expansion into protected areas can also cause significant nighttime light pollution [25]. With increasing industrialization, the demand for raw materials in China has continuously increased [61] as well as the development of mineral resources, mainly in western regions where minerals are abundant. Since development began in 2000, the western region has entered a period of large-scale mineral exploitation [62]. Mineral exploitation is an intensive human activity. The correlation between the raw coal production and TNL in the Xilin Gol Natural Grassland Reserve has confirmed that mineral exploitation can cause a dramatic increase in light pollution. Tourism also promotes economic development and intensifies human activity. With the development of tourism in PAs, the number of tourists has increased dramatically, which has introduced major challenges to the management of PAs and has increased nighttime light pollution [63,64]. Fortunately, the rise of dark-sky tourism may alleviate light pollution in PAs [65].
Assessing the characteristics and trends of light pollution changes in PAs in China over the past 20 years is of great significance to the management and sustainable development of PAs. This study mainly focused on the trends and causes of light pollution characteristics in PAs across the entire country. Although light pollution in PAs has attracted widespread attention [18,23], a poor understanding of how light pollution affects animals, plants and ecosystems in the PAs remains [20,66,67]. Several long-term field observations may be necessary to investigate this mechanism across different scales [39,68].
Artificial lighting facilities provide safety, comfort, and convenience for cities and human life [43]. However, irrational use of lighting facilities incites serious light pollution. By analyzing the trends, patterns and causes of light pollution changes in PAs, strategies to limit light pollution across PAs in China can be considered from following three aspects. (1) The management of PAs should be strengthened, and unified management of national PAs should be implemented. Additionally, the division of management departments should be clarified to strengthen the prevention and control of light pollution; (2) The results showed that resident migration can significantly reduce light pollution. Therefore, buffer zones between the PAs and the urban regions should be established to limit human activities, especially in regions that highly influence PAs [39]; (3) Additional sustainable development measures combining remote sensing and ground observation should be implemented to prevent and control light pollution [35]. For example, light pollution in PAs should be measured nationwide, and the findings should be combined with current knowledge on ecosystem services and landscape ecology [69].

5. Conclusions

This paper selected time series-corrected DMSP-OLS nighttime light images from 1992 to 2012 to analyze trends, patterns, and classifications of light pollution changes in PAs in China using nighttime light indexes and the Getis-Ord Gi* method. High-resolution satellite images and statistical data were used to investigate the causes of light pollution changes in the PAs. The conclusions are as follows:
(1)
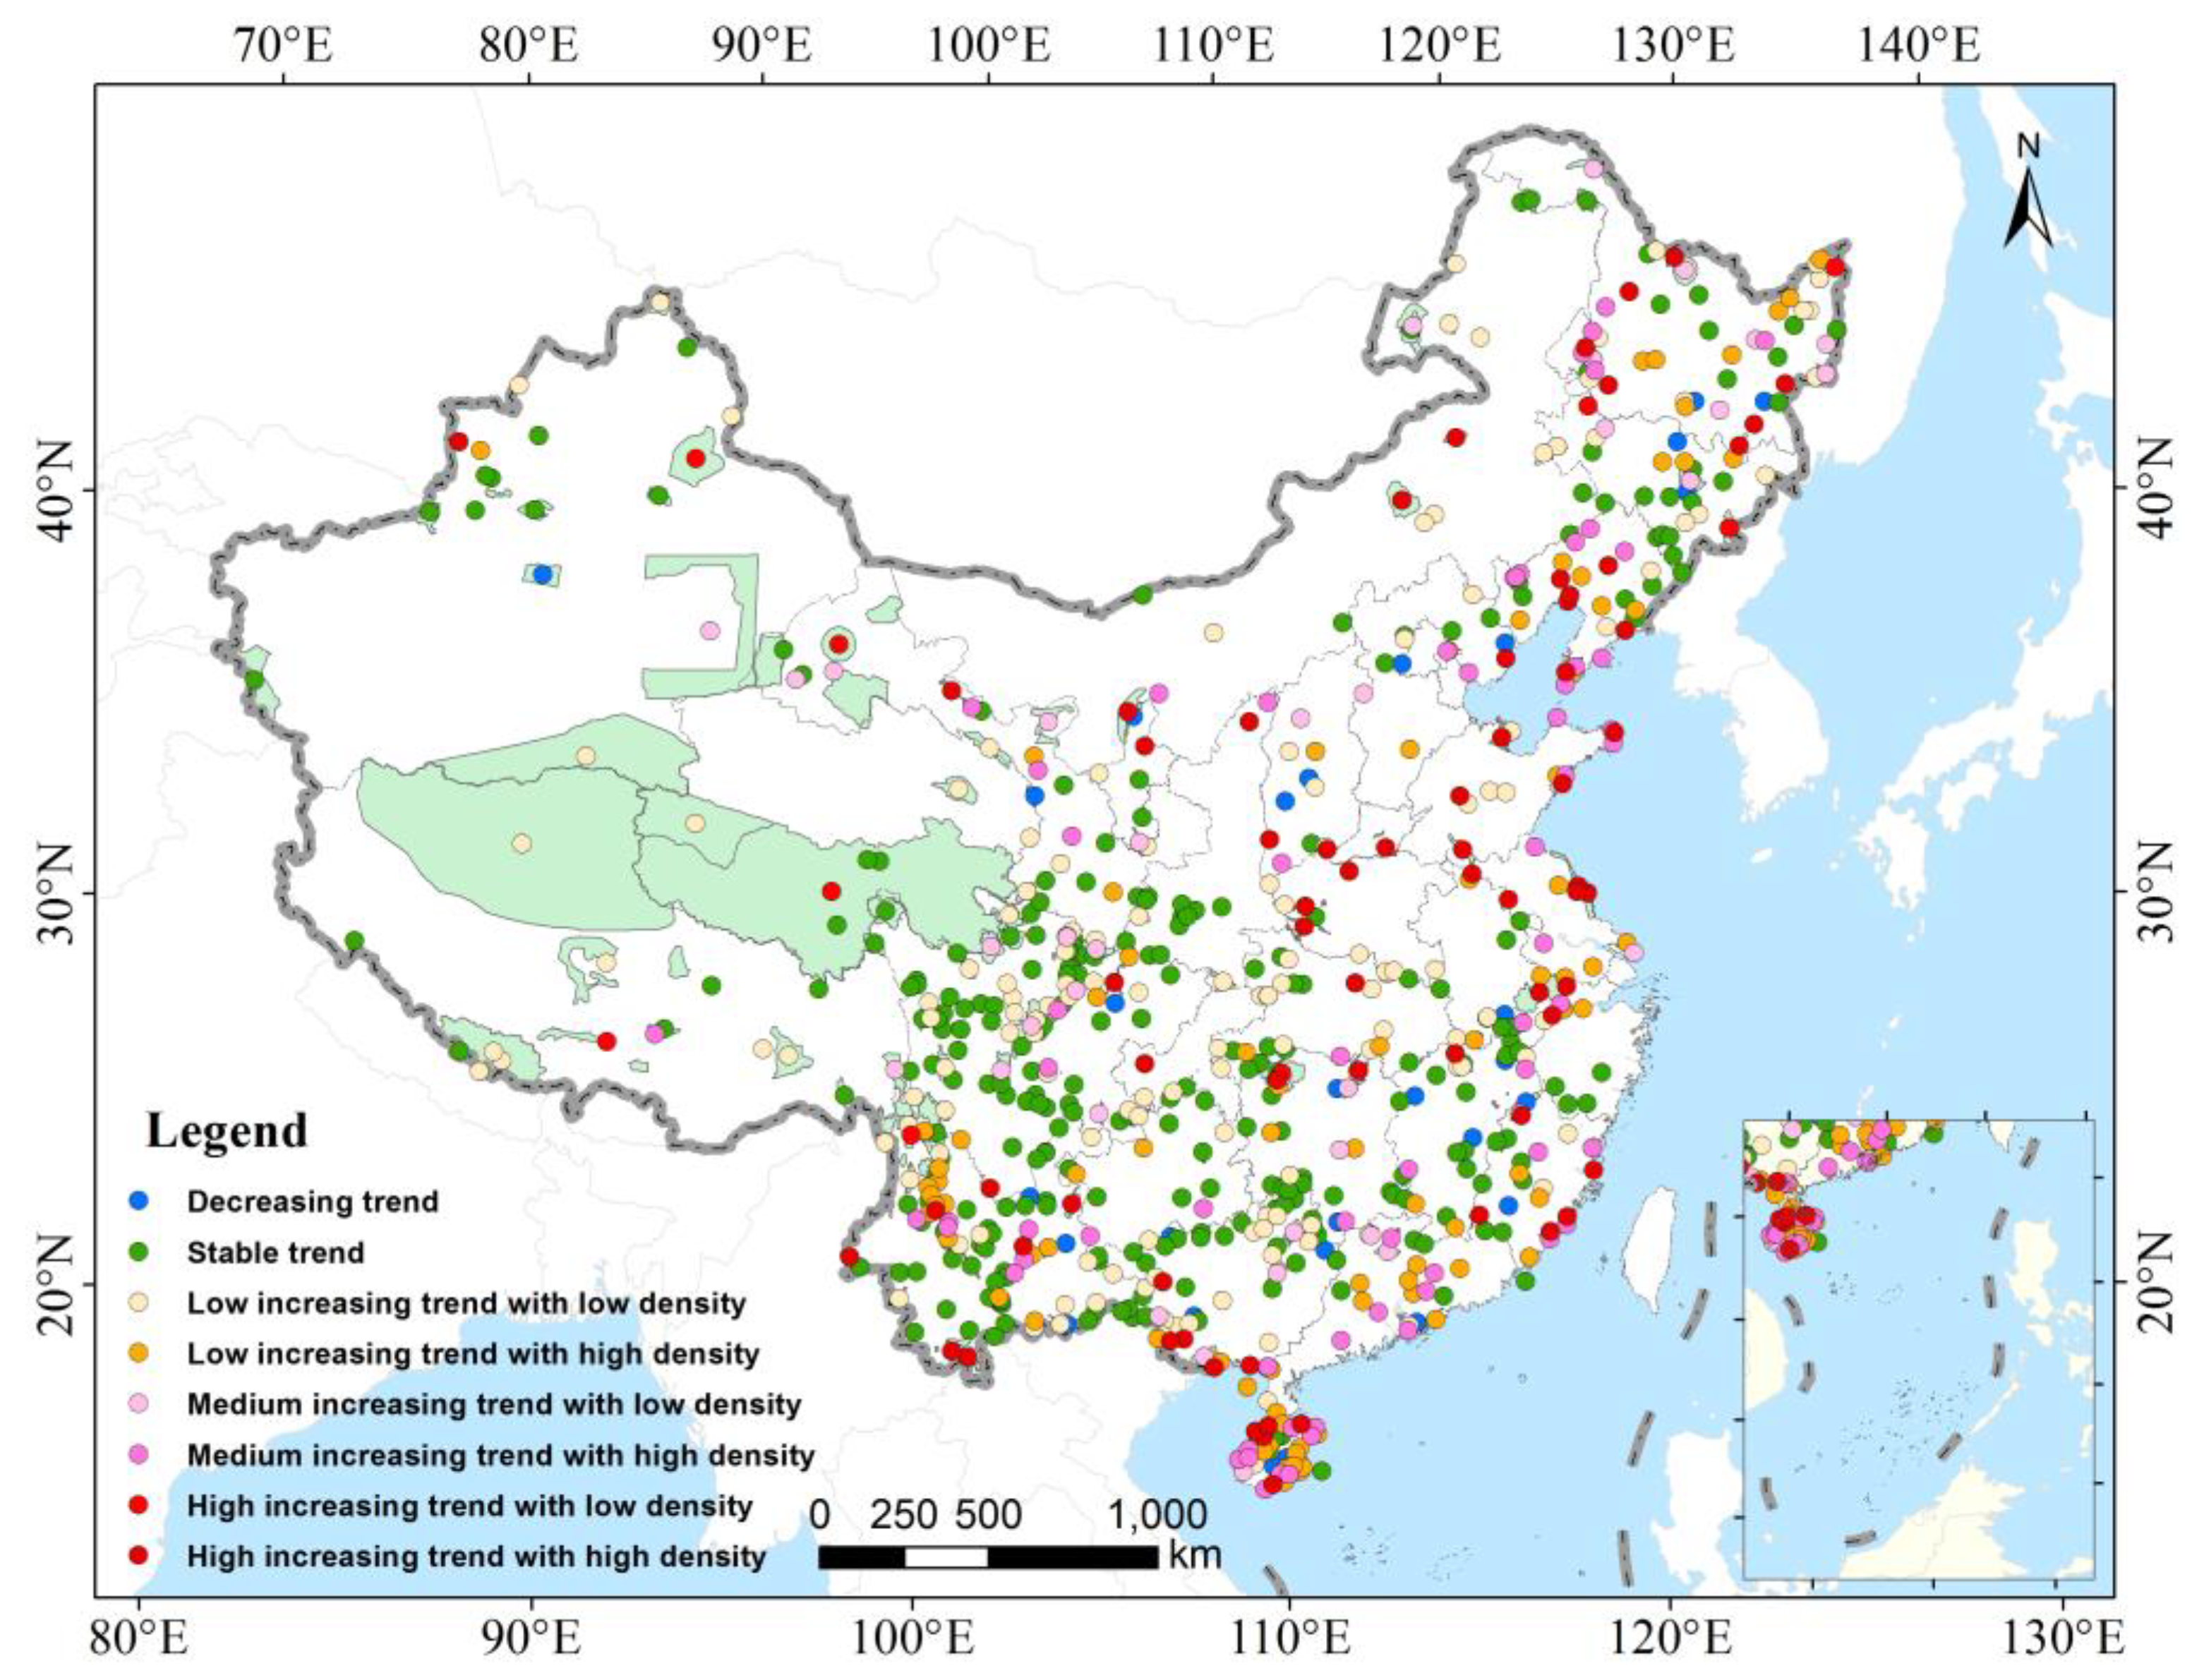
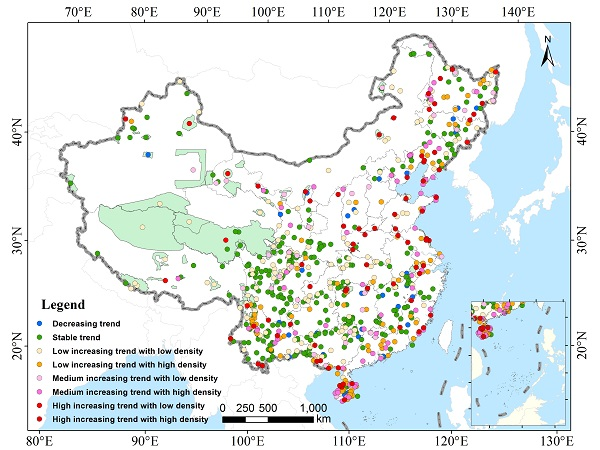
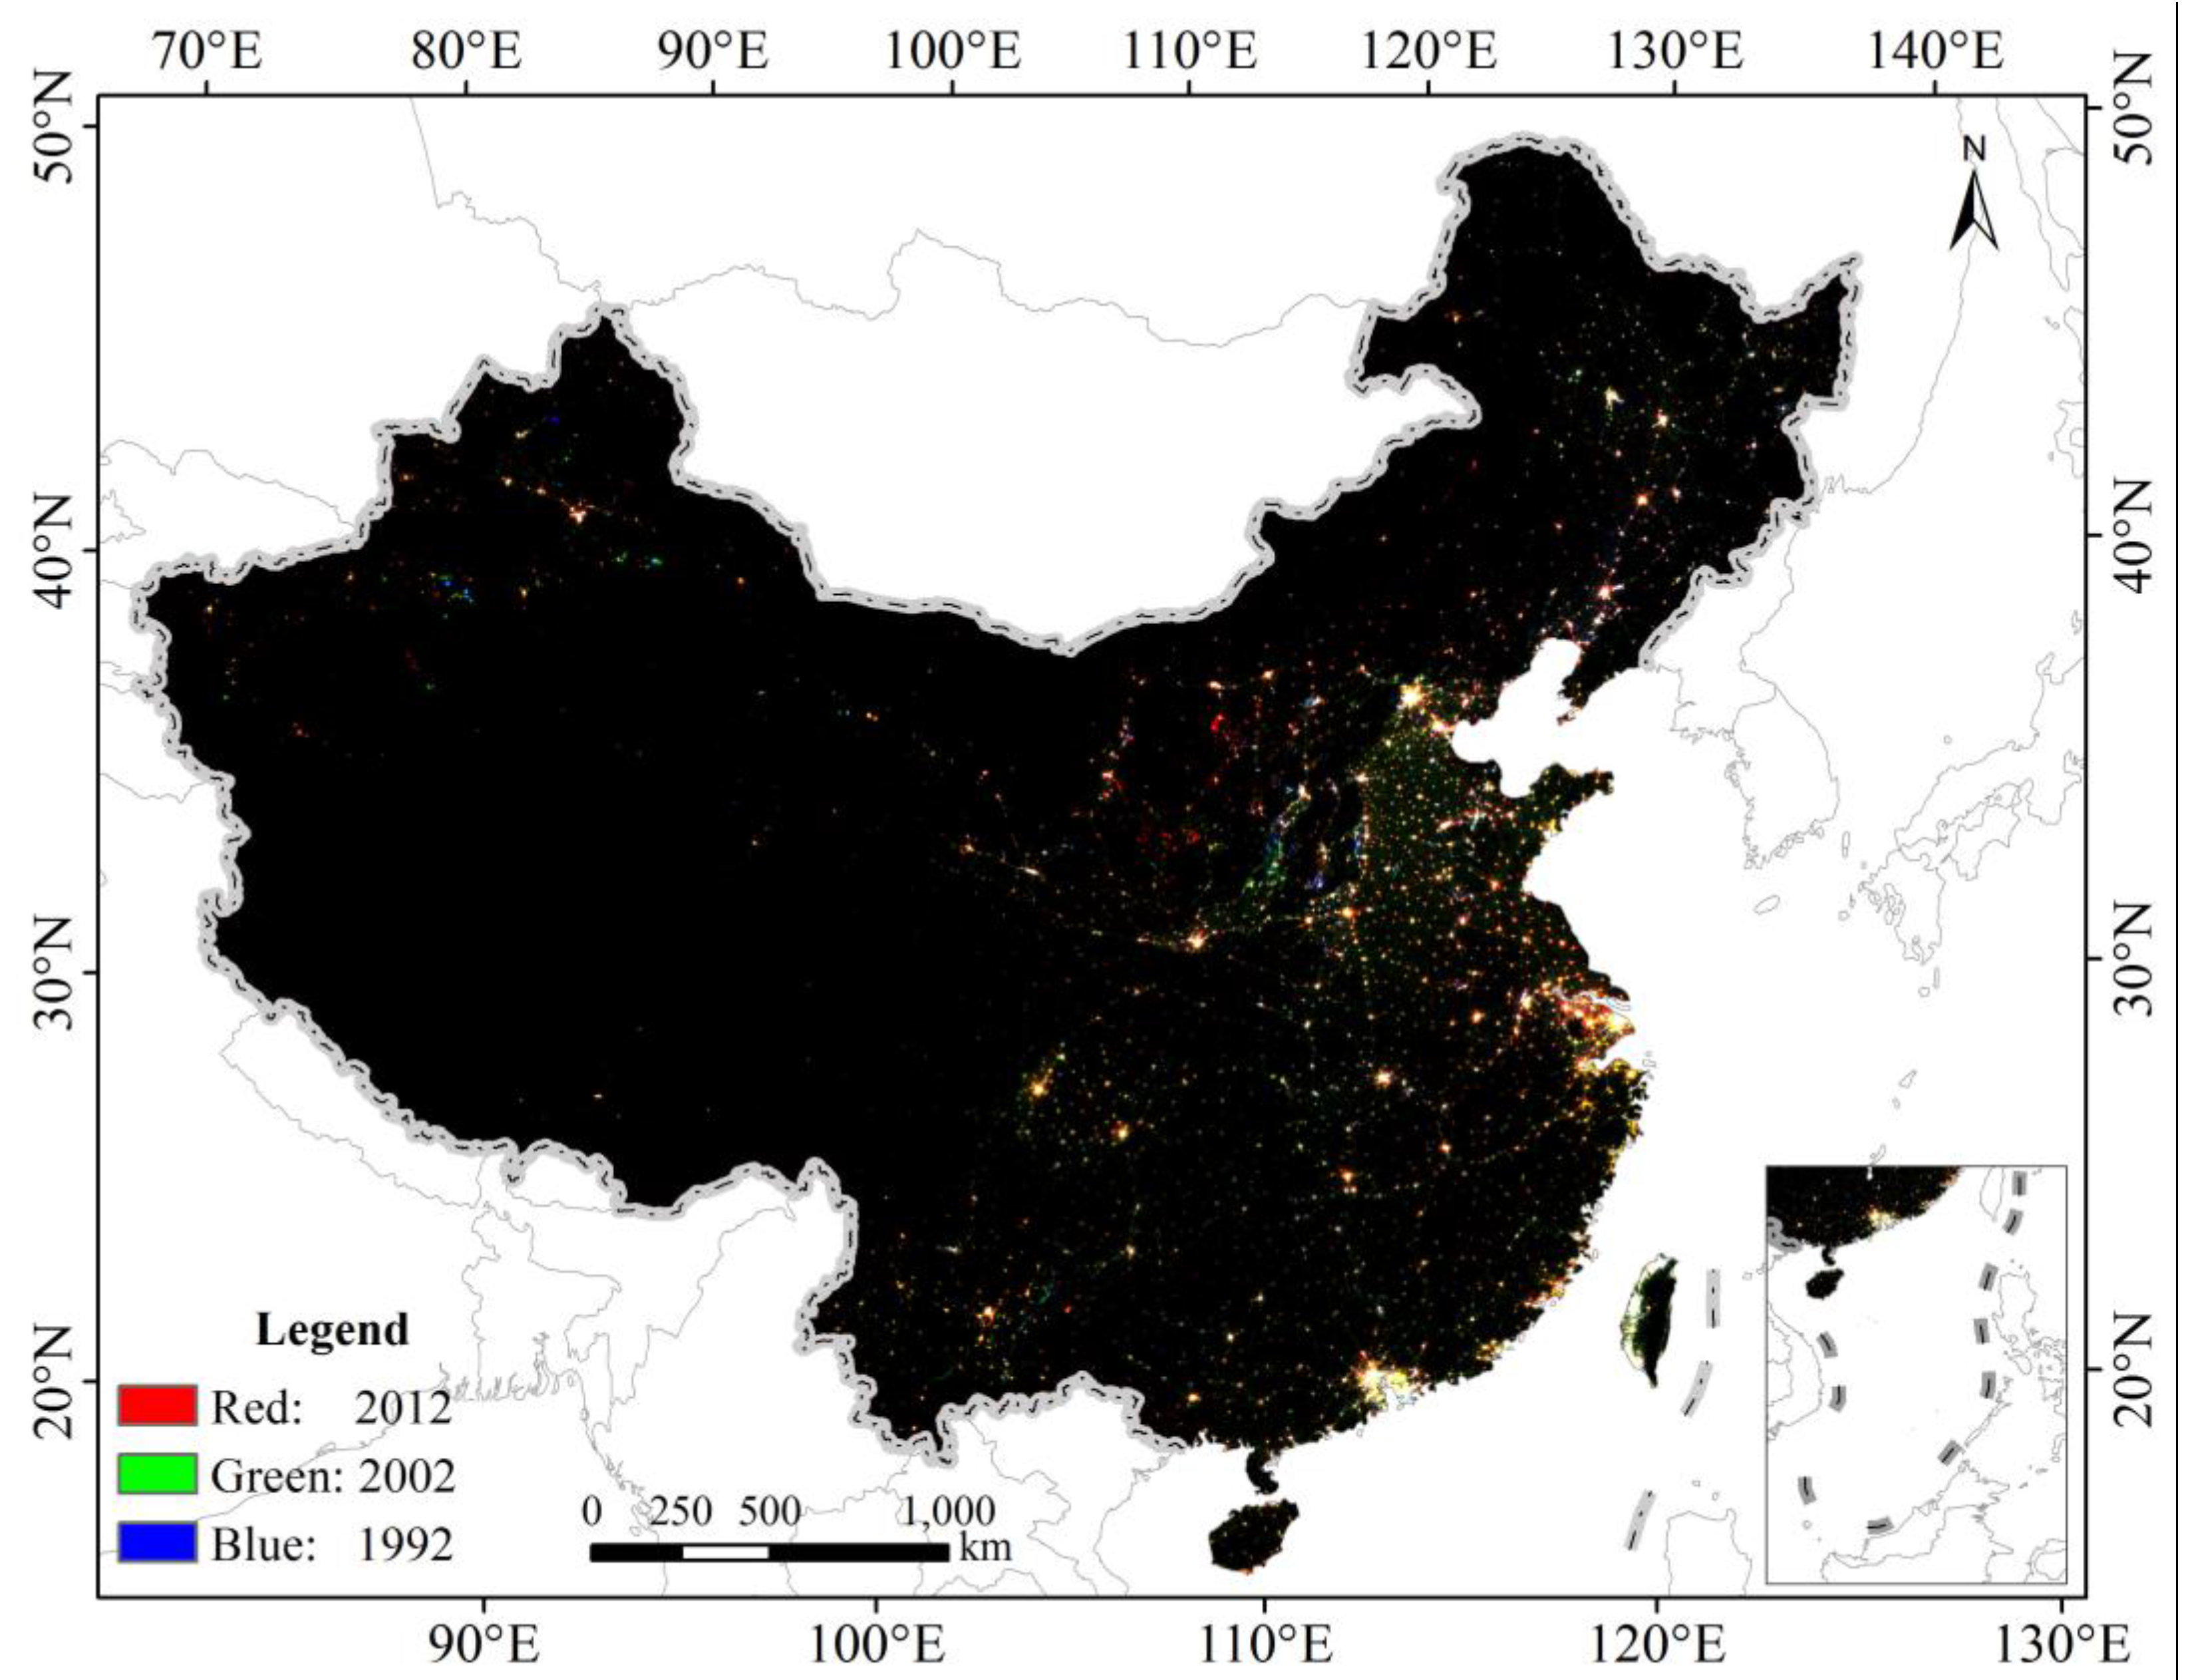
The TNL and NLM indexes were employed to analyze the trend in light pollution in the PAs from 1992 to 2012 across China. Compared with 1992, the percentage of dark PAs decreased by more than 20% by 2012. From 1992 to 2012, most PAs (57.30%) experienced an increase in light pollution, and these PAs were mainly located in eastern and central China and a small part of western China. According to the results of the hot spot analysis, the distribution of changes in TNL and NLM both had obvious spatial agglomeration characteristics.
(2)
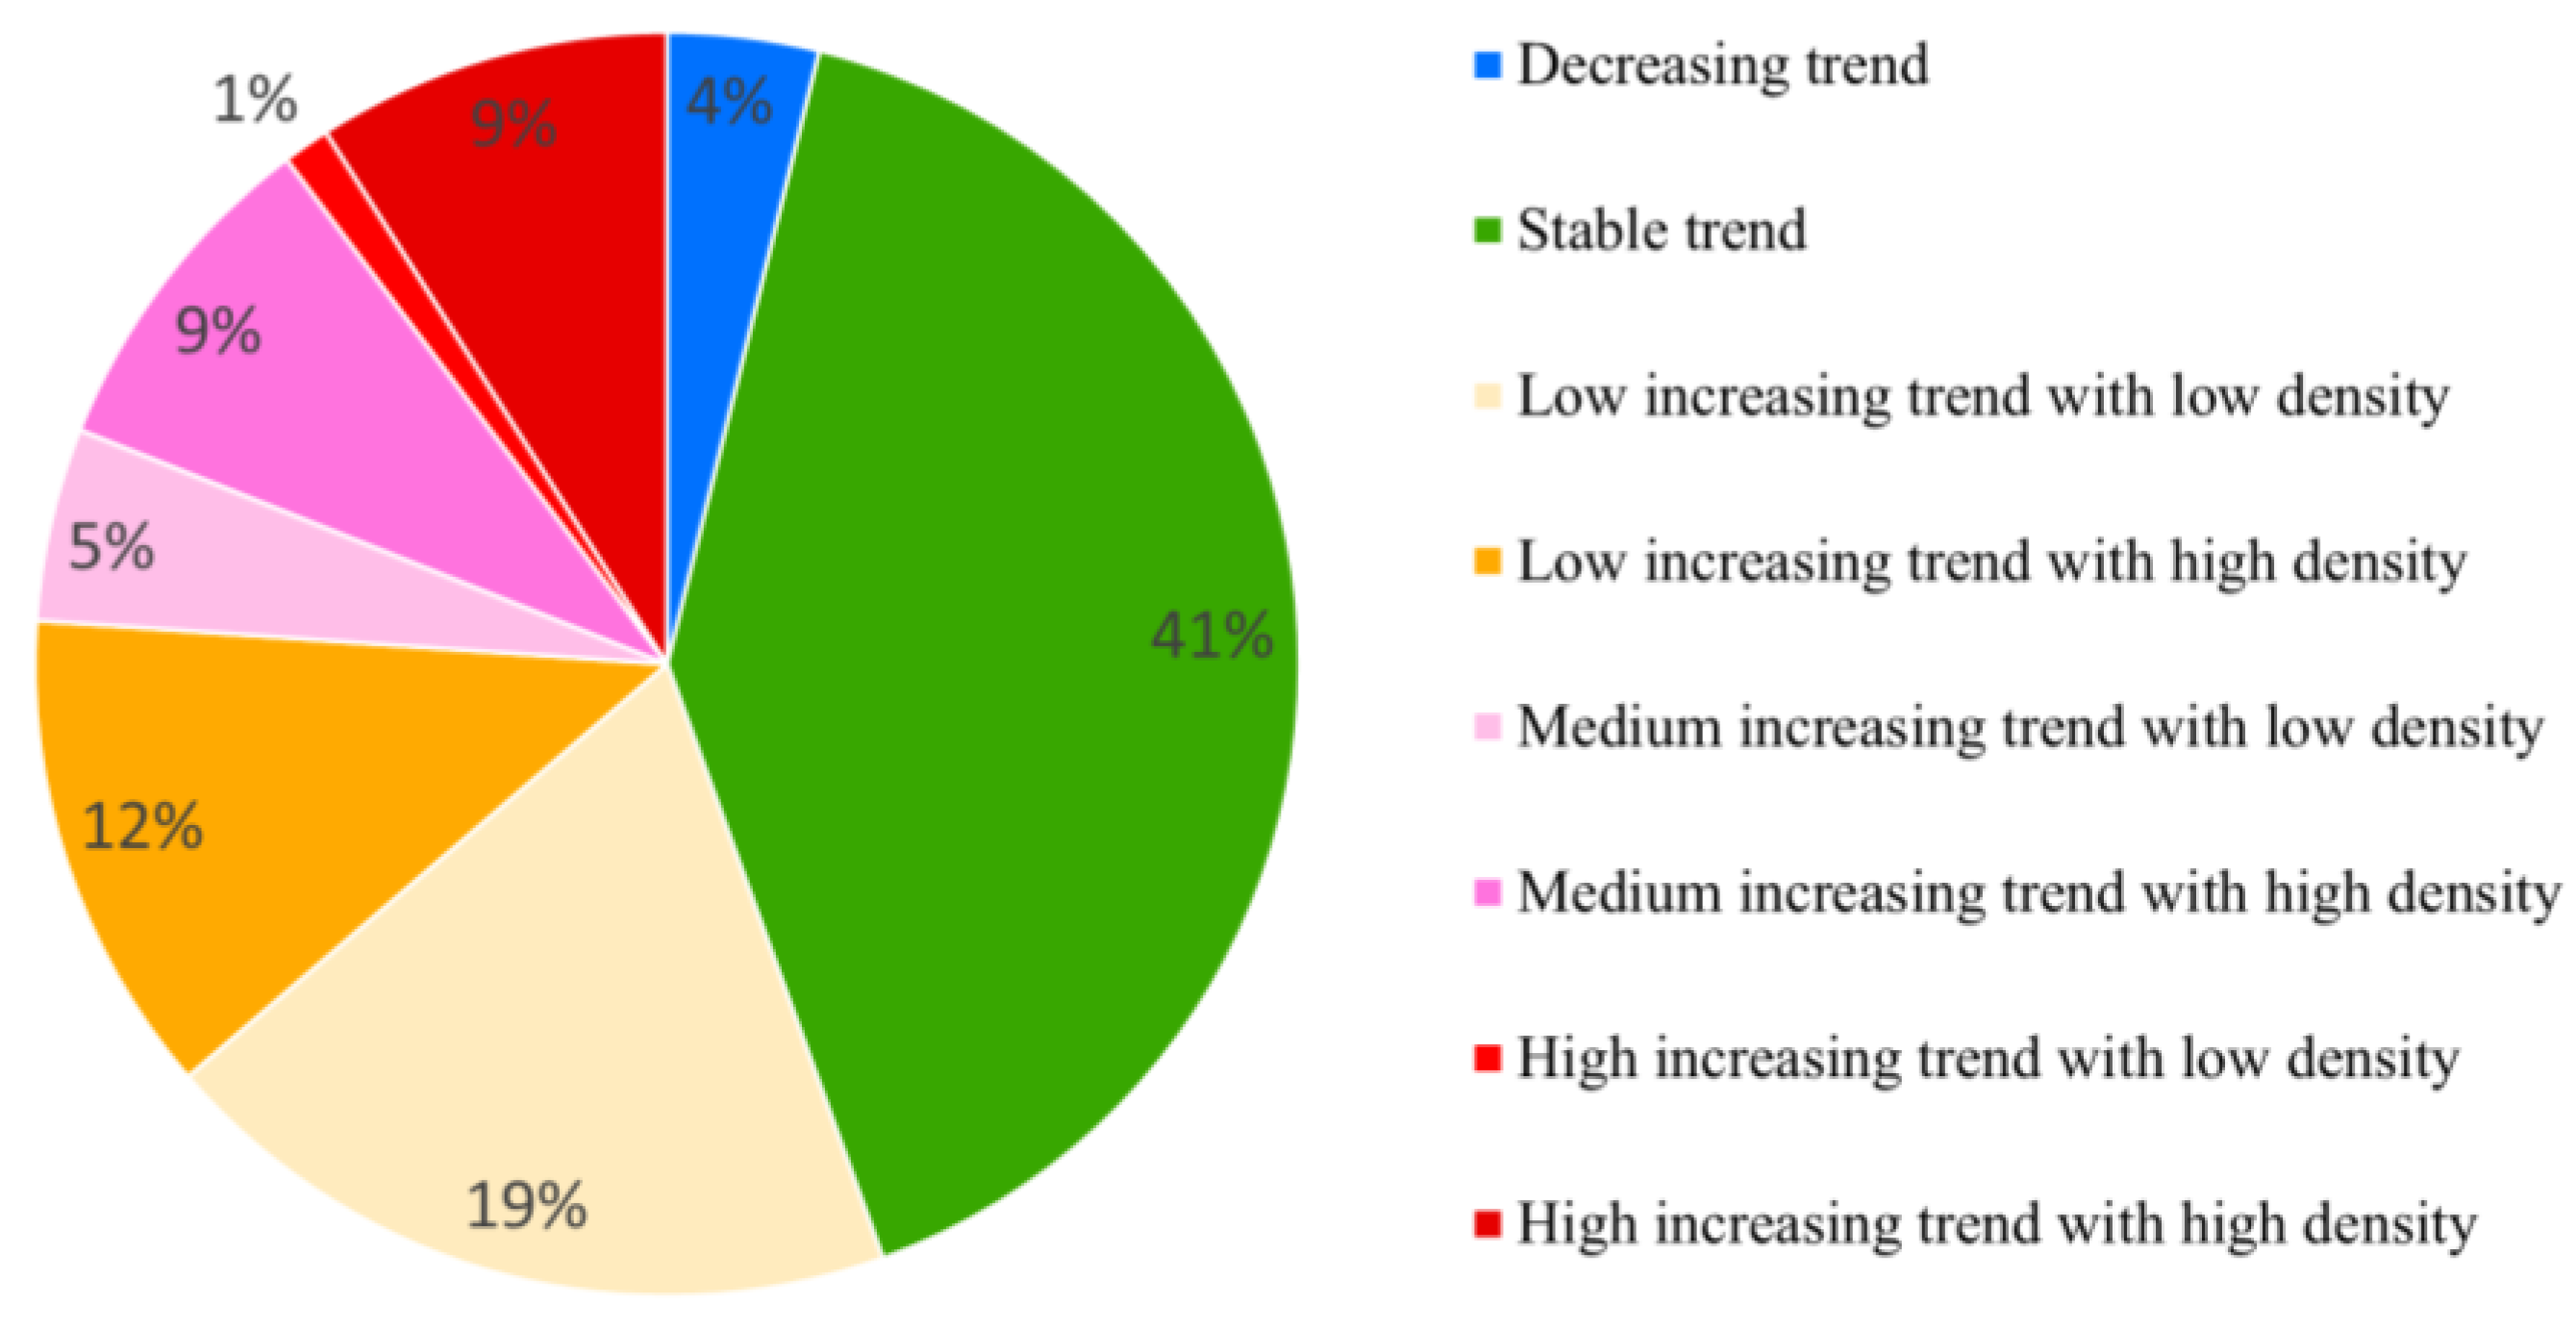
According to the TNL index and the NLM index, the PAs impacted by light pollution were divided into eight categories. Most PAs showed a stable trend (41%), but approximately 10% showed a high increasing trend; however, of those with a high increasing trend, those that had a high increasing trend with low density accounted for a small percentage, i.e., only 1%, and were mainly located in large-area PAs in western China.
(3)
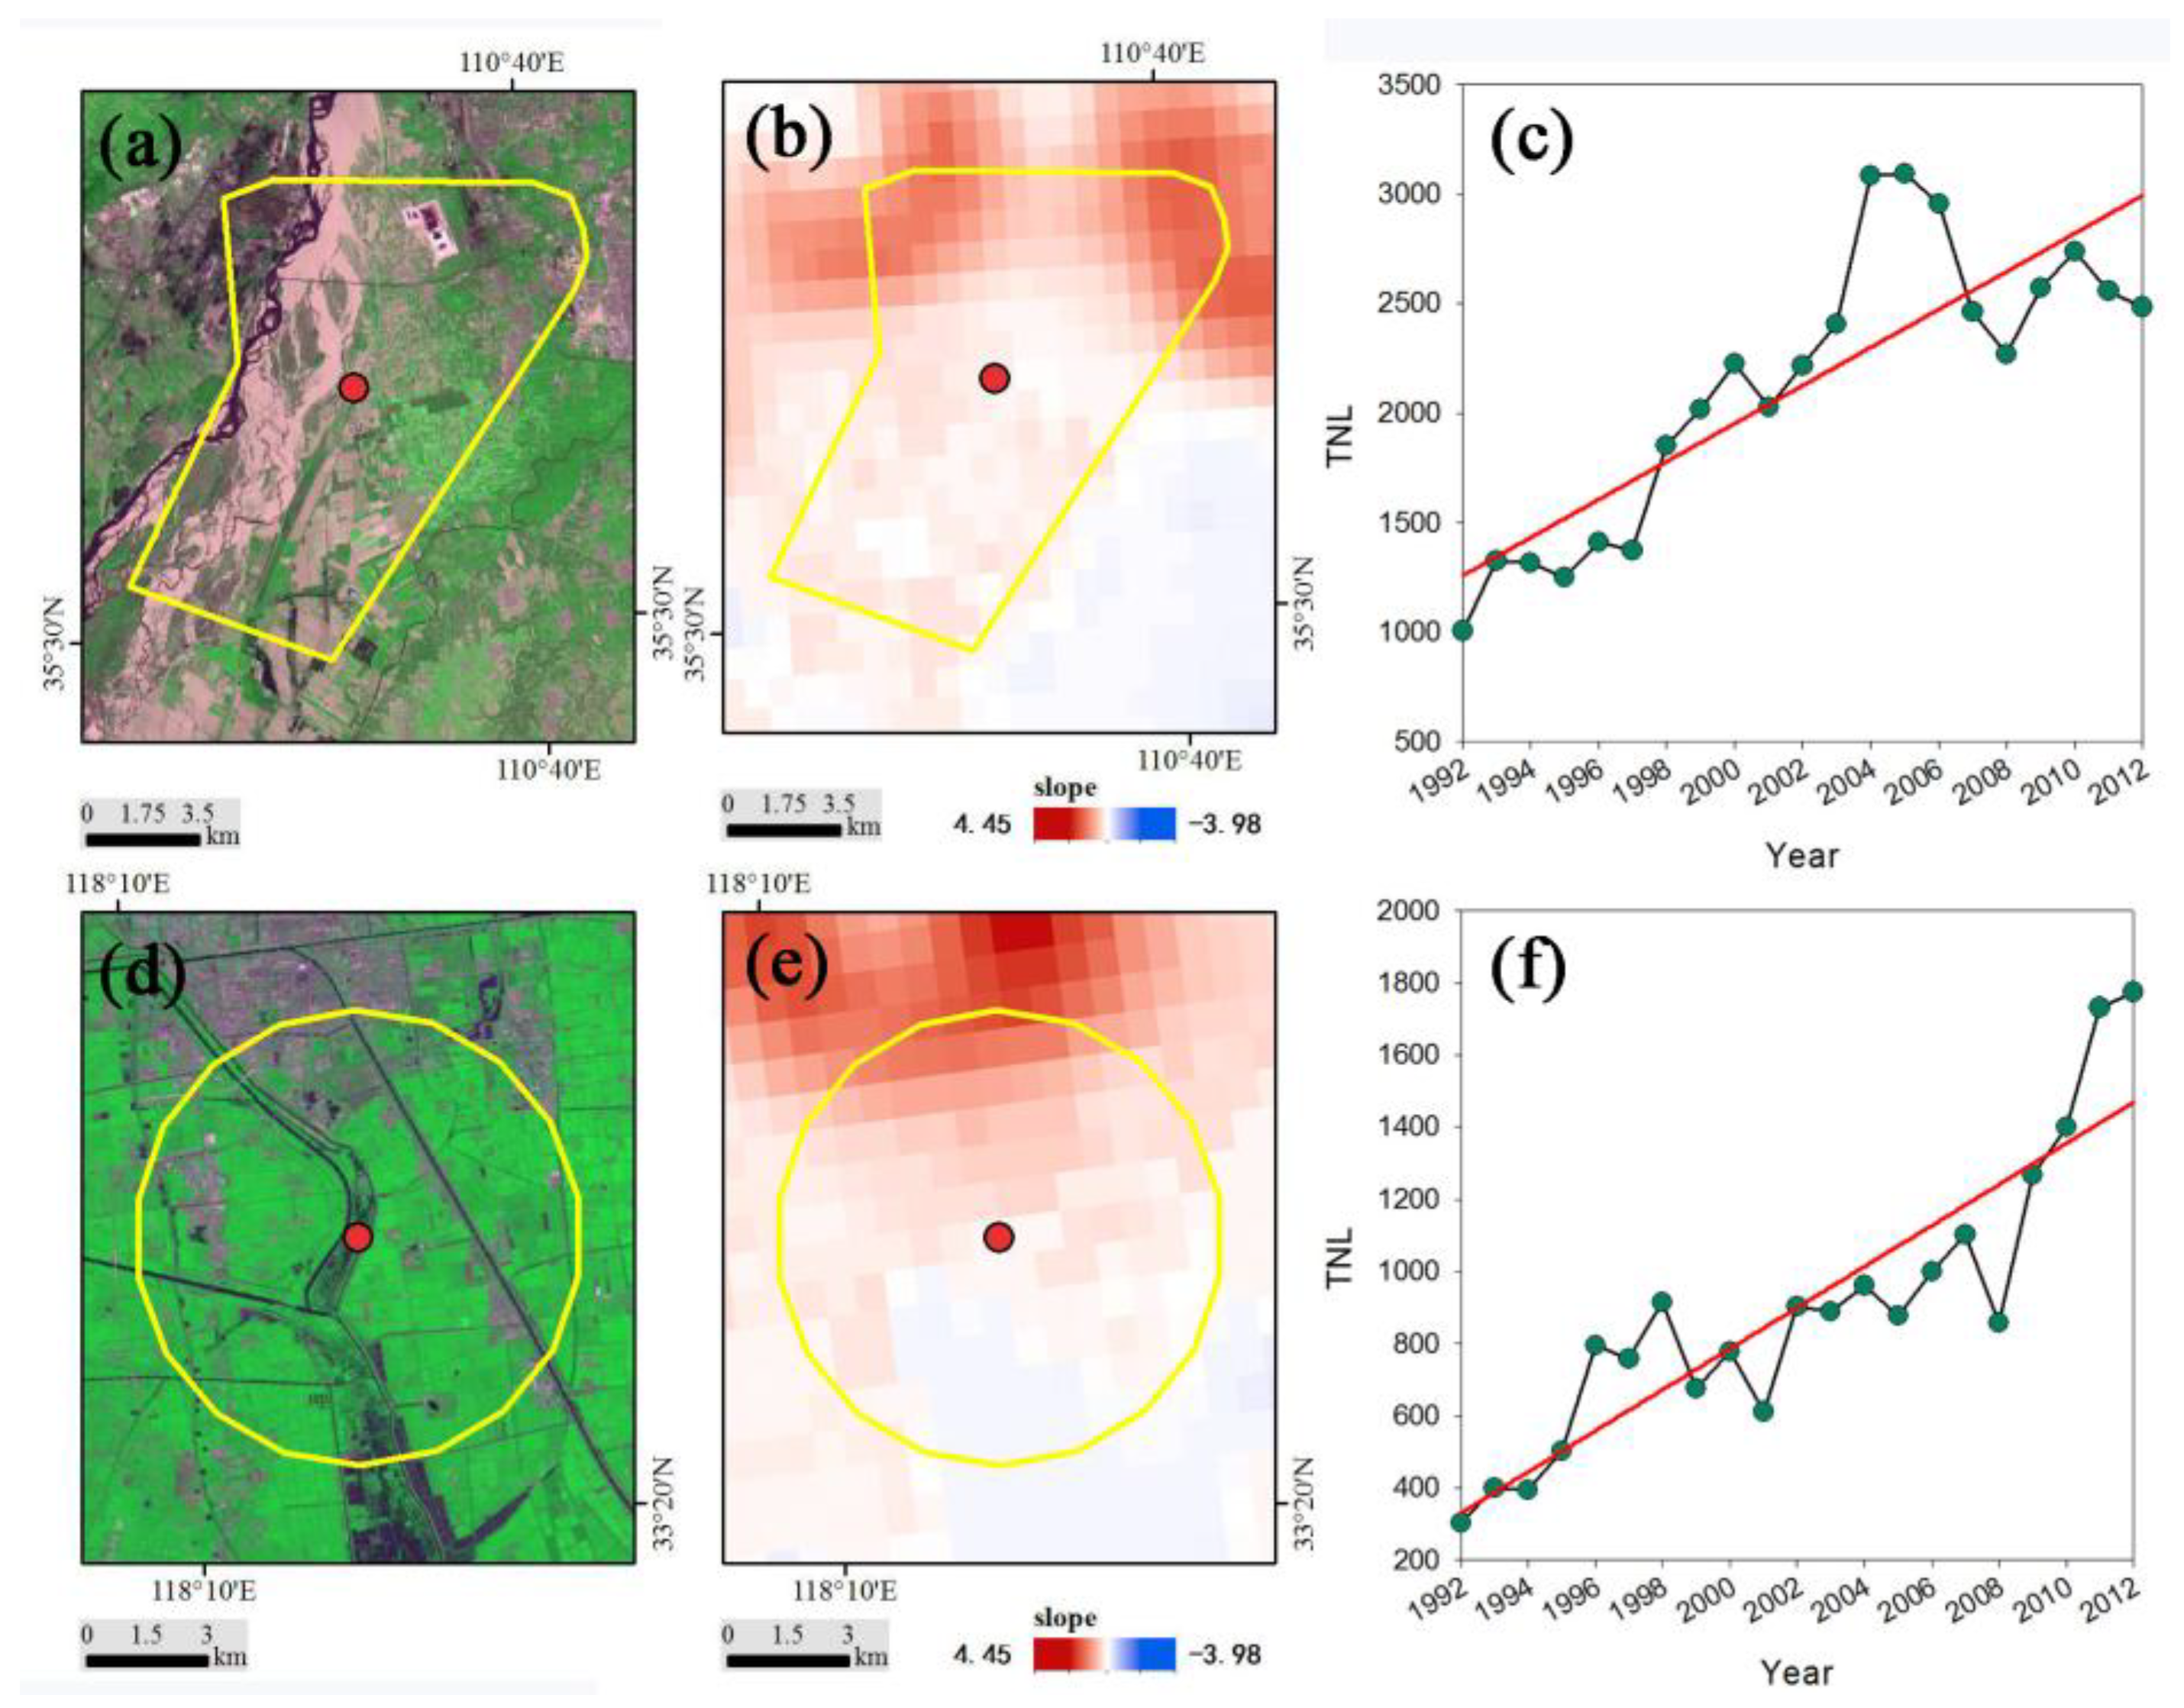
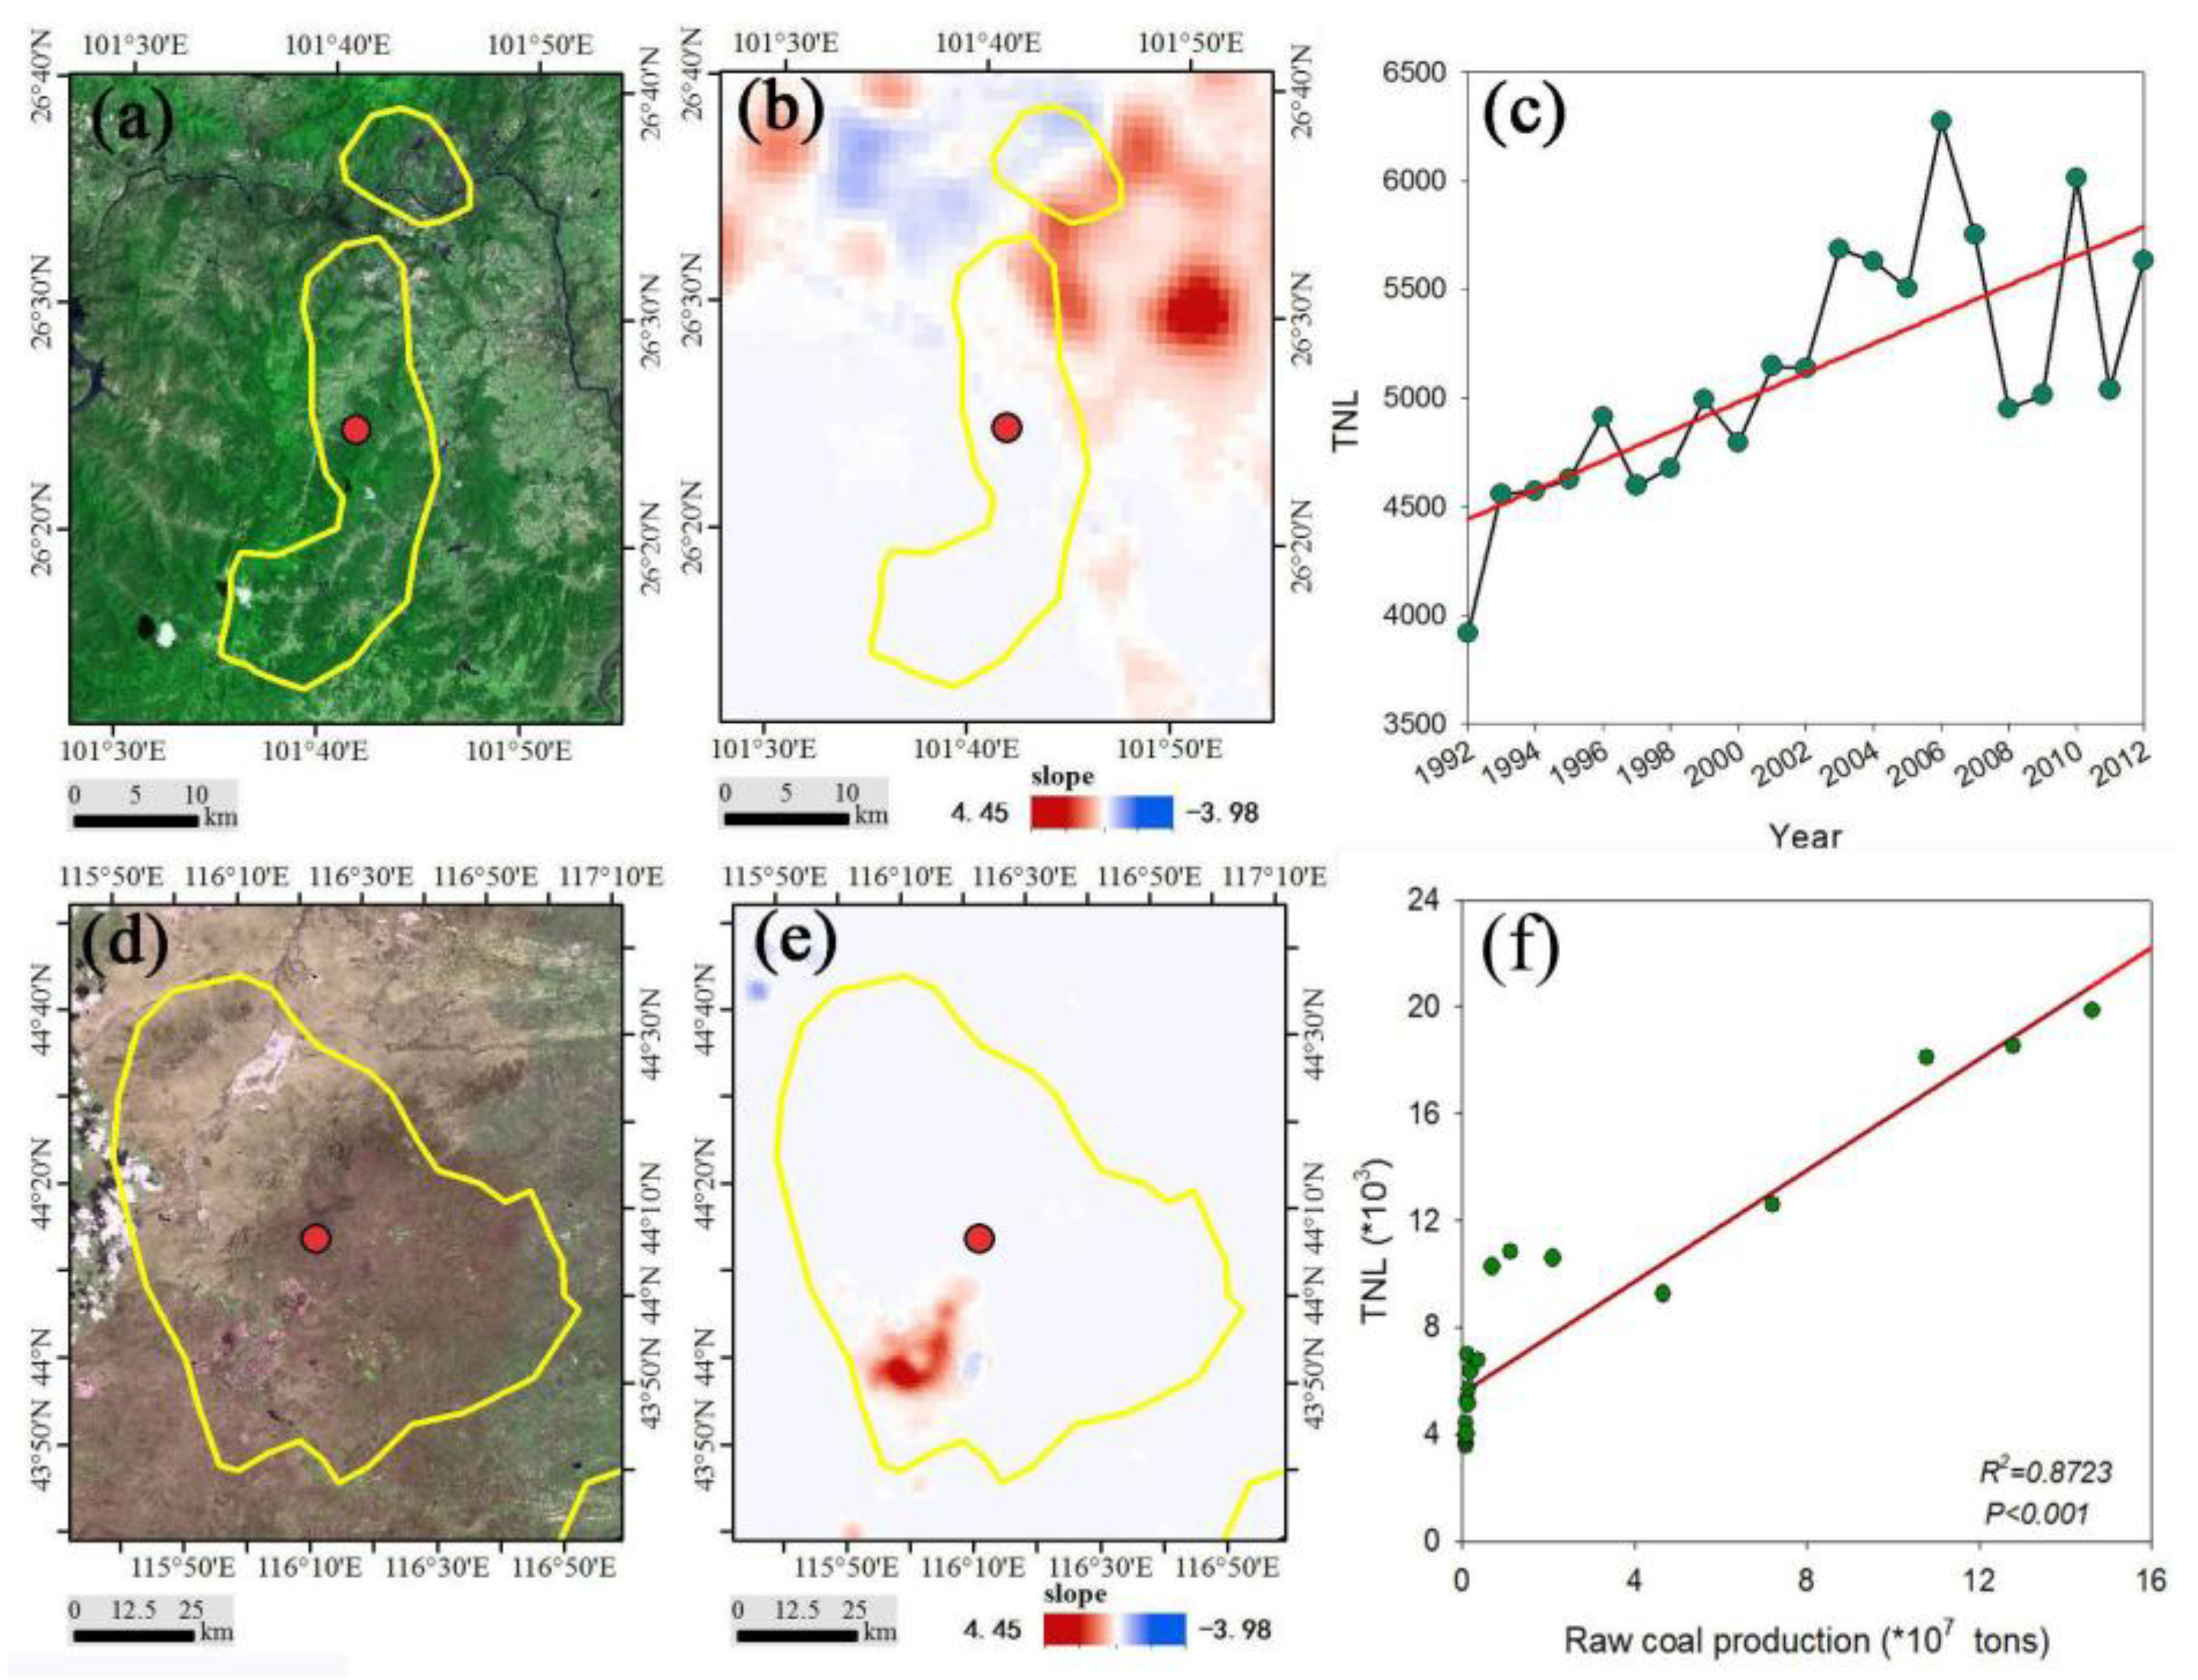
High-resolution satellite images and statistical data were selected to analyze the causes of light pollution changes in PAs. The results showed that decreasing distance to an urban area, mineral exploitation and tourism development may increase light pollution in PAs. In contrast, the migration of residents away from an area may be one explanation for the decrease in light pollution.
Based the results of this study, the urban expansion driven by rapid economic development and human activities contributed to the increasing trend in light pollution in PAs. Additionally, based on the causes of light pollution, measures to alleviate light pollution in PAs were proposed. The conclusions can help policy makers regulate light pollution in PAs and maintain the function and sustainable development of ecosystems in PAs.

Author Contributions

G.H., W.J. and T.L. conceived and designed the experiments. W.J., W.L. and H.G. performed the experiments. W.J. and T.L., G.W. analyzed the data. H.L., Y.P., and R.Y. provided assistance in preparing related graphs. W.J. wrote the whole paper, and all authors edited the paper. The authors thank the four anonymous reviewers and the editors for their valuable comments to improve our manuscript.

Funding

This research was financially supported by the National Natural Science Foundation of China (61731022 and 61701495), the National Key Research and Development Program of China—rapid production method for large-scale global change products (2016YFA0600302), the Strategic Priority Research Program of the Chinese Academy of Sciences (XDA190090300) and the Hainan Provincial Department of Science and Technology (grant numbers ZDKJ2016021 and ZDKJ2016015.

Conflicts of Interest

The authors declare no conflicts of interest.

References

  1. Betts, M.G.; Wolf, C.; Ripple, W.J.; Phalan, B.; Millers, K.A.; Duarte, A.; Butchart, S.H.M.; Levi, T. Global forest loss disproportionately erodes biodiversity in intact landscapes. Nature 2017, 547, 441–444. [Google Scholar] [CrossRef] [PubMed]
  2. Van Dover, C.L.; Ardron, J.A.; Escobar, E.; Gianni, M.; Gjerde, K.M.; Jaeckel, A.; Jones, D.O.B.; Levin, L.A.; Niner, H.J.; Pendleton, L.; et al. Biodiversity loss from deep-sea mining. Nat. Geosci. 2017, 10, 464–465. [Google Scholar] [CrossRef] [Green Version]
  3. Venter, O.; Fuller, R.A.; Segan, D.B.; Carwardine, J.; Brooks, T.; Butchart, S.H.M.; Di Marco, M.; Iwamura, T.; Joseph, L.; O’Grady, D.; et al. Targeting global protected area expansion for imperiled biodiversity. PLoS. Biol. 2014, 12, e1001891. [Google Scholar] [CrossRef] [PubMed]
  4. Butchart, S.H.M.; Scharlemann, J.P.W.; Evans, M.I.; Quader, S.; Arico, S.; Arinaitwe, J.; Balman, M.; Bennun, L.A.; Bertzky, B.; Besancon, C.; et al. Protecting important sites for biodiversity contributes to meeting global conservation targets. PLoS ONE 2012, 7, e32529. [Google Scholar] [CrossRef] [PubMed]
  5. Correia, R.A.; Malhado, A.C.M.; Lins, L.; Gamarra, N.C.; Bonfim, W.A.G.; Valencia-Aguilar, A.; Bragagnolo, C.; Jepson, P.; Ladle, R.J. The scientific value of amazonian protected areas. Biodivers. Conserv. 2016, 25, 1503–1513. [Google Scholar] [CrossRef]
  6. Cetas, E.R.; Yasue, M. A systematic review of motivational values and conservation success in and around protected areas. Conserv. Biol. 2017, 31, 203–212. [Google Scholar] [CrossRef] [PubMed]
  7. Vassallo, P.; Paoli, C.; Buonocore, E.; Franzese, P.P.; Russo, G.F.; Povero, P. Assessing the value of natural capital in marine protected areas: A biophysical and trophodynamic environmental accounting model. Ecol. Model. 2017, 355, 12–17. [Google Scholar] [CrossRef]
  8. Protected Planet Report 2014. Available online: http://wdpa.s3.amazonaws.com/WPC2014/protected_planet_report.pdf (accessed on 29 August 2017).
  9. Kobayashi, H.; Watando, H.; Kakimoto, M. A global extent site-level analysis of land cover and protected area overlap with mining activities as an indicator of biodiversity pressure. J. Clean. Prod. 2014, 84, 459–468. [Google Scholar] [CrossRef]
  10. Mutanga, C.N.; Vengesayi, S.; Muboko, N.; Gandiwa, E. Towards harmonious conservation relationships: A framework for understanding protected area staff-local community relationships in developing countries. J. Nat. Conserv. 2015, 25, 8–16. [Google Scholar] [CrossRef]
  11. Bruner, A.G.; Gullison, R.E.; Balmford, A. Financial costs and shortfalls of managing and expanding protected-area systems in developing countries. Bioscience 2004, 54, 1119–1126. [Google Scholar] [CrossRef]
  12. De Sherbinin, A. Is poverty more acute near parks? An assessment of infant mortality rates around protected areas in developing countries. Oryx 2008, 42, 26–35. [Google Scholar] [CrossRef]
  13. Tang, L.N.; Shao, G.F.; Piao, Z.J.; Dai, L.M.; Jenkins, M.A.; Wang, S.X.; Wu, G.; Wu, J.G.; Zhao, J.Z. Forest degradation deepens around and within protected areas in east Asia. Biol. Conserv. 2010, 143, 1295–1298. [Google Scholar] [CrossRef]
  14. Waite, T.A.; Corey, S.J.; Campbell, L.G.; Chhangani, A.K.; Rice, J.; Robbins, P. Satellite sleuthing: Does remotely sensed land-cover change signal ecological degradation in a protected area? Divers. Distrib. 2009, 15, 299–309. [Google Scholar] [CrossRef]
  15. Craigie, I.D.; Baillie, J.E.M.; Balmford, A.; Carbone, C.; Collen, B.; Green, R.E.; Hutton, J.M. Large mammal population declines in Africa’s protected areas. Biol. Conserv. 2010, 143, 2221–2228. [Google Scholar] [CrossRef]
  16. Laurance, W.F.; Useche, D.C.; Rendeiro, J.; Kalka, M.; Bradshaw, C.J.A.; Sloan, S.P.; Laurance, S.G.; Campbell, M.; Abernethy, K.; Alvarez, P.; et al. Averting biodiversity collapse in tropical forest protected areas. Nature 2012, 489, 290–294. [Google Scholar] [CrossRef] [PubMed] [Green Version]
  17. Geldmann, J.; Joppa, L.N.; Burgess, N.D. Mapping change in human pressure globally on land and within protected areas. Conserv. Biol. 2014, 28, 1604–1616. [Google Scholar] [CrossRef] [PubMed]
  18. Davies, T.W.; Duffy, J.P.; Bennie, J.; Gaston, K.J. Stemming the tide of light pollution encroaching into marine protected areas. Conserv. Lett. 2016, 9, 164–171. [Google Scholar] [CrossRef] [Green Version]
  19. Duffy, J.P.; Bennie, J.; Duran, A.P.; Gaston, K.J. Mammalian ranges are experiencing erosion of natural darkness. Sci. Rep. 2015, 5, 12042. [Google Scholar] [CrossRef] [PubMed] [Green Version]
  20. Rodriguez, A.; Rodriguez, B.; Negro, J.J. GPS tracking for mapping seabird mortality induced by light pollution. Sci. Rep. 2015, 5, 10670. [Google Scholar] [CrossRef] [PubMed]
  21. Lyytimaki, J. Nature’s nocturnal services: Light pollution as a non-recognised challenge for ecosystem services research and management. Ecosyst. Serv. 2013, 3, E44–E48. [Google Scholar] [CrossRef]
  22. De Freitas, J.R.; Bennie, J.; Mantovani, W.; Gaston, K.J. Exposure of tropical ecosystems to artificial light at night: Brazil as a case study. PLoS ONE 2017, 12, e0171655. [Google Scholar] [CrossRef] [PubMed]
  23. Falchi, F.; Cinzano, P.; Duriscoe, D.; Kyba, C.C.M.; Elvidge, C.D.; Baugh, K.; Portnov, B.A.; Rybnikova, N.A.; Furgoni, R. The new world atlas of artificial night sky brightness. Sci. Adv. 2016, 2, e1600377. [Google Scholar] [CrossRef] [PubMed] [Green Version]
  24. Light Pollution. Available online: http://darksky.org/light-pollution/ (accessed on 19 May 2018).
  25. Bennie, J.; Duffy, J.P.; Davies, T.W.; Correa-Cano, M.E.; Gaston, K.J. Global trends in exposure to light pollution in natural terrestrial ecosystems. Remote Sens. 2015, 7, 2715–2730. [Google Scholar]
  26. Gaston, K.J.; Bennie, J.; Davies, T.W.; Hopkins, J. The ecological impacts of nighttime light pollution: A mechanistic appraisal. Biol. Rev. 2013, 88, 912–927. [Google Scholar] [CrossRef] [PubMed]
  27. Raap, T.; Pinxten, R.; Eens, M. Light pollution disrupts sleep in free-living animals. Sci. Rep. 2015, 5, 13557. [Google Scholar] [CrossRef] [PubMed] [Green Version]
  28. Mazor, T.; Levin, N.; Possingham, H.P.; Levy, Y.; Rocchini, D.; Richardson, A.J.; Kark, S. Can satellite-based night lights be used for conservation? The case of nesting sea turtles in the Mediterranean. Biol. Conserv. 2013, 159, 63–72. [Google Scholar] [CrossRef]
  29. Shi, K.F.; Chen, Y.; Yu, B.L.; Xu, T.B.; Yang, C.S.; Li, L.Y.; Huang, C.; Chen, Z.Q.; Liu, R.; Wu, J.P. Detecting spatiotemporal dynamics of global electric power consumption using DMSP-OLS nighttime stable light data. Appl. Energy 2016, 184, 450–463. [Google Scholar] [CrossRef]
  30. Liu, Z.F.; He, C.Y.; Zhang, Q.F.; Huang, Q.X.; Yang, Y. Extracting the dynamics of urban expansion in china using DMSP-OLS nighttime light data from 1992 to 2008. Landsc. Urban. Plan. 2012, 106, 62–72. [Google Scholar] [CrossRef]
  31. Jiang, W.; He, G.J.; Long, T.F.; Liu, H.C. Ongoing conflict makes Yemen dark: From the perspective of nighttime light. Remote Sens. 2017, 9, 798. [Google Scholar] [CrossRef]
  32. Li, X.; Chen, F.; Chen, X. Satellite-observed nighttime light variation as evidence for global armed conflicts. IEEE J. Sel. Top. Appl. Earth. Obs. Remote Sens. 2013, 6, 2302–2315. [Google Scholar]
  33. Aubrecht, C.; Elvidge, C.D.; Longcore, T.; Rich, C.; Safran, J.; Strong, A.E.; Eakin, C.M.; Baugh, K.E.; Tuttle, B.T.; Howard, A.T.; et al. A global inventory of coral reef stressors based on satellite observed nighttime lights. Geocarto Int. 2008, 23, 467–479. [Google Scholar] [CrossRef]
  34. Bennie, J.; Davies, T.W.; Duffy, J.P.; Inger, R.; Gaston, K.J. Contrasting trends in light pollution across europe based on satellite observed night time lights. Sci. Rep. 2014, 4, 3789. [Google Scholar] [CrossRef] [PubMed] [Green Version]
  35. Jiang, W.; He, G.J.; Long, T.F.; Wang, C.; Ni, Y.; Ma, R.Q. Assessing light pollution in china based on nighttime light imagery. Remote Sens. 2017, 9, 135. [Google Scholar] [CrossRef]
  36. Cinzano, P.; Falchi, F.; Elvidge, C.D. The first world atlas of the artificial night sky brightness. Mon. Not. R. Astron. Soc. 2001, 328, 689–707. [Google Scholar] [CrossRef]
  37. Han, P.; Huang, J.; Li, R.; Wang, L.; Hu, Y.; Wang, J.; Huang, W. Monitoring trends in light pollution in china based on nighttime satellite imagery. Remote Sens. 2014, 6, 5541–5558. [Google Scholar] [CrossRef]
  38. Butt, M.J. Estimation of light pollution using satellite remote sensing and geographic information system techniques. GISci. Remote Sens. 2012, 49, 609–621. [Google Scholar] [CrossRef]
  39. Gaston, K.J.; Duffy, J.P.; Bennie, J. Quantifying the erosion of natural darkness in the global protected area system. Conserv. Biol. 2015, 29, 1132–1141. [Google Scholar] [CrossRef] [PubMed]
  40. Guetté, A.; Godet, L.; Juigner, M.; Robin, M. Worldwide increase in artificial light at night around protected areas and within biodiversity hotspots. Biol. Conserv. 2018, 223, 97–103. [Google Scholar] [CrossRef]
  41. Zhang, L.; Luo, Z.H.; Mallon, D.; Li, C.W.; Jiang, Z.G. Biodiversity conservation status in china’s growing protected areas. Biol. Conserv. 2017, 210, 89–100. [Google Scholar] [CrossRef]
  42. Shi, K.F.; Huang, C.; Chen, Y.; Li, L.Y. Remotely sensed nighttime lights reveal increasing human activities in protected areas of china mainland. Remote Sens. Lett. 2018, 9, 468–477. [Google Scholar] [CrossRef]
  43. Jiang, W.; He, G.; Ni, Y. Assessment of light pollution impact on protected areas in China. Int. Arch. Photogramm. Remote Sens. Spat. Inf. Sci. 2017, 42, 1307–1312. [Google Scholar] [CrossRef]
  44. Xu, W.H.; Xiao, Y.; Zhang, J.J.; Yang, W.; Zhang, L.; Hull, V.; Wang, Z.; Zheng, H.; Liu, J.G.; Polasky, S.; et al. Strengthening protected areas for biodiversity and ecosystem services in china. Proc. Natl. Acad. Sci. USA 2017, 114, 1601–1606. [Google Scholar] [CrossRef] [PubMed]
  45. Protected Area Profile for China from the World Database of Protected Areas. Available online: https://www.protectedplanet.net/country/CN (accessed on 29 August 2016).
  46. Protected Planet. Available online: https://www.protectedplanet.net/ (accessed on 19 May 2018).
  47. Version 4 DMSP-OLS Nighttime Lights Time Series. Available online: https://ngdc.noaa.gov/eog/dmsp/downloadV4composites.html (accessed on 16 June 2017).
  48. International Union for Conservation of Nature. Available online: https://www.iucn.org/ (accessed on 20 May 2018).
  49. UN Environment World Conservation Monitoring Centre. Available online: https://www.unep-wcmc.org/ (accessed on 21 May 2018).
  50. 2014 United Nations List of Protected Areas. Available online: http://wdpa.s3.amazonaws.com/WPC2014/2014_UN_LIST_REPORT_EN.pdf (accessed on 29 August 2016).
  51. Wang, Y.H.; Deng, X.M.; Marcucci, D.J.; Le, Y.E. Sustainable development planning of protected areas near cities: Case study in china. J. Urban Plan. Dev.-ASCE 2013, 139, 133–143. [Google Scholar] [CrossRef]
  52. Dudley, N.; MacKinnon, K.; Stolton, S. The role of protected areas in supplying ten critical ecosystem services in drylands: A review. Biodiversity 2014, 15, 178–184. [Google Scholar] [CrossRef]
  53. Liu, Q.P.; Yang, Y.C.; Tian, H.Z.; Zhang, B.; Gu, L. Assessment of human impacts on vegetation in built-up areas in china based on AVHRR, MODIS and DMSP_OLS nighttime light data, 1992–2010. Chin. Geogr. Sci. 2014, 24, 231–244. [Google Scholar] [CrossRef]
  54. Stow, D.; Petersen, A.; Hope, A.; Engstrom, R.; Coulter, L. Greenness trends of arctic tundra vegetation in the 1990s: Comparison of two NDVI data sets from NOAA AVHRR systems. Int. J. Remote Sens. 2007, 28, 4807–4822. [Google Scholar] [CrossRef]
  55. Li, X.; Zhan, C.; Tao, J.; Li, L. Long-term monitoring of the impacts of disaster on human activity using dmsp/ols nighttime light data: A case study of the 2008 Wenchuan, china earthquake. Remote Sens. 2018, 10, 588. [Google Scholar] [CrossRef]
  56. Ecological Resettlement of Tibetan Herders in the Sanjiangyuan: A Case Study in Madoi County of Qinghai. Available online: https://case.edu/affil/tibet/tibetanNomads/documents/ecologicalresettlementfortibetanherderinthesanjiangyuan.pdf (accessed on 19 May 2018).
  57. China Economic and Social Development Statistics Database. Available online: http://tongji.cnki.net/kns55/index.aspx (accessed on 19 May 2018).
  58. Loucks, C.; Ricketts, T.H.; Naidoo, R.; Lamoreux, J.; Hoekstra, J. Explaining the global pattern of protected area coverage: Relative importance of vertebrate biodiversity, human activities and agricultural suitability. J. Biogeogr. 2008, 35, 1337–1348. [Google Scholar] [CrossRef]
  59. Xiang, W.L.; Tan, M.H. Changes in light pollution and the causing factors in china’s protected areas, 1992–2012. Remote Sens. 2017, 9, 15. [Google Scholar] [CrossRef]
  60. Cinzano, P.; Falchi, F. Quantifying light pollution. J. Quant. Spectrosc. Radiat. Transf. 2014, 139, 13–20. [Google Scholar] [CrossRef]
  61. Gulley, A.L.; Nassar, N.T.; Xun, S. China, the United States, and competition for resources that enable emerging technologies. Proc. Natl. Acad. Sci. USA 2018, 115, 4111–4115. [Google Scholar] [CrossRef] [PubMed] [Green Version]
  62. Li, C.F.; Wang, A.J.; Chen, X.J.; Chen, Q.S.; Zhang, Y.F.; Li, Y. Regional distribution and sustainable development strategy of mineral resources in china. Chin. Geogr. Sci. 2013, 23, 470–481. [Google Scholar] [CrossRef]
  63. Lopes, P.F.M.; Mendes, L.; Fonseca, V.; Villasante, S. Tourism as a driver of conflicts and changes in fisheries value chains in marine protected areas. J. Environ. Manag. 2017, 200, 123–134. [Google Scholar] [CrossRef] [PubMed]
  64. Tolvanen, A.; Kangas, K. Tourism, biodiversity and protected areas—Review from Northern Fennoscandia. J. Environ. Manag. 2016, 169, 58–66. [Google Scholar] [CrossRef] [PubMed]
  65. Light Pollution and Dark Sky Tourism. Available online: http://www.griotsrepublic.com/light-pollution/ (accessed on 19 May 2018).
  66. Bennie, J.; Davies, T.W.; Cruse, D.; Gaston, K.J. Ecological effects of artificial light at night on wild plants. J. Ecol. 2016, 104, 611–620. [Google Scholar] [CrossRef] [Green Version]
  67. Altermatt, F.; Ebert, D. Reduced flight-to-light behaviour of moth populations exposed to long-term urban light pollution. Biol. Lett. 2016, 12, 20160111. [Google Scholar] [CrossRef] [PubMed] [Green Version]
  68. Gaston, K.J.; Visser, M.E.; Hoelker, F. The biological impacts of artificial light at night: The research challenge. Philos. Trans. R. Soc. B Sci. 2015, 370. [Google Scholar] [CrossRef] [PubMed]
  69. Kyba, C.; Kuester, T.; Sanchez de Miguel, A.; Baugh, K.; Jechow, A.; Holker, F.; Bennie, J.; Elvidge, C.; Gaston, K.; Guanter, L.; et al. Artificially lit surface of earth at night increasing in radiance and extent. Sci. Adv. 2017, 3, e1701528. [Google Scholar] [CrossRef] [PubMed]
Figure 1. The distribution of PAs in China.
Ijgi 07 00243 g001
Figure 2. Color composite of nighttime light in China (red: 2012, green: 2002 and blue: 1992).
Ijgi 07 00243 g002
Figure 3. Chinese provincial map.
Ijgi 07 00243 g003
Figure 4. Light pollution characteristics of PAs in China based on the TNL index ((a) TNL for each PA in 1992; (b) TNL for each PA in 2012; (c) TNL changes in PAs between 1992 and 2012; (d) Gi* statistic of TNL changes).
Ijgi 07 00243 g004
Figure 5. Light pollution characteristics of PAs in China based on the NLM index ((a) NLM for each PA in 1992; (b) NLM for each PA in 2012; (c) NLM change in PAs between 1992 and 2012; (d) Gi* statistic of NLM changes).
Ijgi 07 00243 g005
Figure 6. Classification of PAs impacted by light pollution.
Ijgi 07 00243 g006
Figure 7. Classification of PAs impacted by light pollution.
Ijgi 07 00243 g007
Figure 8. PAs close to the city. (ac) represent the high-resolution satellite image, light pollution trend and annual TNL of the Si Hong Xiangyang Reservoir (Jiangsu province), respectively; (df) represent the high-resolution satellite image, light pollution trend and annual TNL of the Huihe Nature Reserve (Inner Mongolia province).
Ijgi 07 00243 g008
Figure 9. Mineral exploitation within PAs. (ac) represent the high-resolution satellite image, light pollution trend and annual TNL of the Panzhihua Sutie Nature Reserve (Sichuan province), respectively; (df) represent the high-resolution satellite image, light pollution trend and annual TNL of the Xilin Gol Natural Grassland Reserve (Inner Mongolia province).
Ijgi 07 00243 g009
Figure 10. Tourism development. (ac) represent the high-resolution satellite image, light pollution trend and annual TNL of Mount Taishan (Shangdong province), respectively; (df) represent the high-resolution satellite image, light pollution trend and annual TNL of Laoshan National Forest Park (Shangdong province).
Ijgi 07 00243 g010
Figure 11. The correlation between the total tourist population and TNL. (af) represent the correlation result in Dongzhaigang Mangroves (Hainan province), Wudalianchi Volcano (Heilongjiang province), Changli Gold Coast (Heibei province), Sanya Coral Reef National Nature Reserve (Hainan province), Xishuangbanna (Yunnan province) and Zhangye Heihe Wetland National Nature Reserve (Gansu province).
Ijgi 07 00243 g011
Figure 12. Migration of residents. (ac) represent the high-resolution satellite image, light pollution trend and annual TNL of the Liancheng Nature Reserve (Gansu province), respectively; (df) represent the high-resolution satellite image, light pollution trend and annual TNL of the Wulushan Nature Reserve (Shanxi province), respectively).
Ijgi 07 00243 g012
Table 1. Criteria for PA classification based on the light pollution index.
ClassCriteriaDescription
Class 1TNL < 0NLM < 0Decreasing trend (DT)
Class 2TNL = 0NLM = 0Stable trend (ST)
Class 30 < TNL < 3000 < NLM < 1Low increasing trend with low density (LL)
Class 41 ≤ NLM < 40Low increasing trend with high density (LH)
Class 5300 ≤ TNL < 10000 < NLM < 1Medium increasing trend with low density (ML)
Class 61 ≤ NLM < 40Medium increasing trend with high density (MH)
Class 71000 ≤ TNL <61,0000 < NLM < 1High increasing trend with low density (HL)
Class 81 ≤ NLM < 40High increasing trend with high density (HH)

