Article

Research on a 3D Geological Disaster Monitoring Platform Based on REST Service

1
College of Cyber Security, Chengdu University of Technology, Chengdu 610059, China
2
State Key Laboratory of Geohazard Prevention and Geoenvironment Protection, Chengdu University of Technology, Chengdu 610059, China
3
Institute of Mountain Hazards and Environment, Chinese Academy of Sciences, Chengdu 610041, China
4
College of Software Engineering, Chengdu University of Information Technology, Chengdu 610225, China
5
College of Information Science and Technology, Chengdu University of Technology, Chengdu 610059, China
*
Author to whom correspondence should be addressed.
ISPRS Int. J. Geo-Inf. 2018, 7(6), 226; https://doi.org/10.3390/ijgi7060226
Submission received: 8 May 2018 / Revised: 8 June 2018 / Accepted: 18 June 2018 / Published: 19 June 2018

Abstract

:
Representational state transfer (REST) is a resource-based service architectural style. It abstracts data and services as resources and accesses them through a unique Uniform Resource Identifier (URI). Compared with traditional Simple Object Access Protocol (SOAP) methods, REST is more concise. It takes full advantage of HyperText Transfer Protocol (HTTP) and has better scalability and extensibility. Based on REST services, this article integrates geographic information, real-time disaster monitoring data, and warning services in a three-dimensional (3D) digital Earth infrastructure and establishes a three-dimensional geological disaster monitoring GIS platform with good service compatibility and extensibility. The platform visually displays geographical and geological information and real-time monitoring data in a three-dimensional Earth, accesses warning model services to implement disaster warnings, and realizes comprehensive information management, monitoring, and warnings of multiple types of geological disasters. This can provide decision support for disaster prevention and relief and improve the informatization of geological disaster prevention and control.

1. Introduction

China is a mountainous country with distinct landforms, a complex geological environment. Frequent severe weather events have resulted in widespread and serious geological disasters in this country. At present, there are more than one million geological hazard sites in China and more than 34,000 catastrophic geological hazard sites. The prevention and control of geological disasters are necessary and urgent [1,2]. In recent years, with the application of new technologies relevant to geological disaster investigation and monitoring, such as remote sensing, satellite positioning, drones, geographic information systems, and the Internet of Things, a variety of geological disaster data are available from multiple sources. These data have characteristics of multiple phases, uncertainties, heterogeneities, multiple scales, and multiple resolutions. Further, because of the diversity of types of geological disasters, real-time monitoring of geological disasters, and high-resolution dynamic updating of data from geological disaster surveys, the volume of geological disaster-related data has been growing exponentially [3,4,5,6,7].Therefore, the use of modern information technology to establish a general information integration platform can enable comprehensive management, monitoring, and warning of geological disaster information. This comprehensive data handling, along with data visualization, can provide assistance in disaster prevention and relief decision-making, and can improve the informatization level of geological disaster prevention and control work.
With the application of various advanced technologies and methods in the prevention and control of geological disasters and the increasing demand for forecasting of geological disasters, there are more and more types of data pertaining to geological disasters, and the amount of data is increasing. In traditional disaster information management systems, most data management is performed by accessing the database [8,9,10]. Due to the lack of a unified data integration framework, as the complexity of data increases, the adaptability and scalability of the system are reduced. In terms of data presentation, it is also difficult to achieve representative effects of a 3D platform using the traditional 2D GIS [4,11]. The traditional system has become increasingly insufficient to meet the requirements of geological disaster information management.
Representational state transfer (REST) is a lightweight web service software architectural style [12,13]. It defines a set of architectural principles that can be used to design web services centered on system resources. For example, map services, monitoring data services, and data warning model services required by the platform described in this article are all based on the REST architecture. Clients who use different languages can also handle and transmit resources through HTTP [14,15,16]. Information related to geological disaster monitoring and warning indicates a diversified trend. Using REST architecture to aggregate information services can realize collaborative services of multi-source data, provide a unified style of data services for the platform, and enhance platform scalability and service compatibility. All of the data services described in this article will be provided in a REST-style manner. The REST style can implement service aggregation across development platforms and eventually achieve service aggregation and data presentation through the 3D disaster monitoring GIS platform.
The three-dimensional geological disaster monitoring GIS platform proposed in this paper is aimed at the new requirements and development trends of current geological disaster information management, adopts the Client/Server (C/S) architecture, and combines the innovative design of REST service aggregation. This design method not only can make full use of local computational capacity to achieve smoother and richer three-dimensional display, but also has the advantages of openness and simple business maintenance in a B/S architecture. The REST-style services also tend to unify the data service style to enhance the platform’s business access capabilities. The platform allows implementation of effective organization, management, and integration of geological disaster information in various fields, states, and formats, and enables the realization of data visualization based on a three-dimensional digital Earth. The platform has the advantages of strong versatility, reliable performance, open and easy expansion, and excellent interoperability. It is also effective as a significant reference in enriching the functions of geological disaster information management systems, improving the efficiency of system work and data sharing.

2. Three-Dimensional GIS Platform Construction

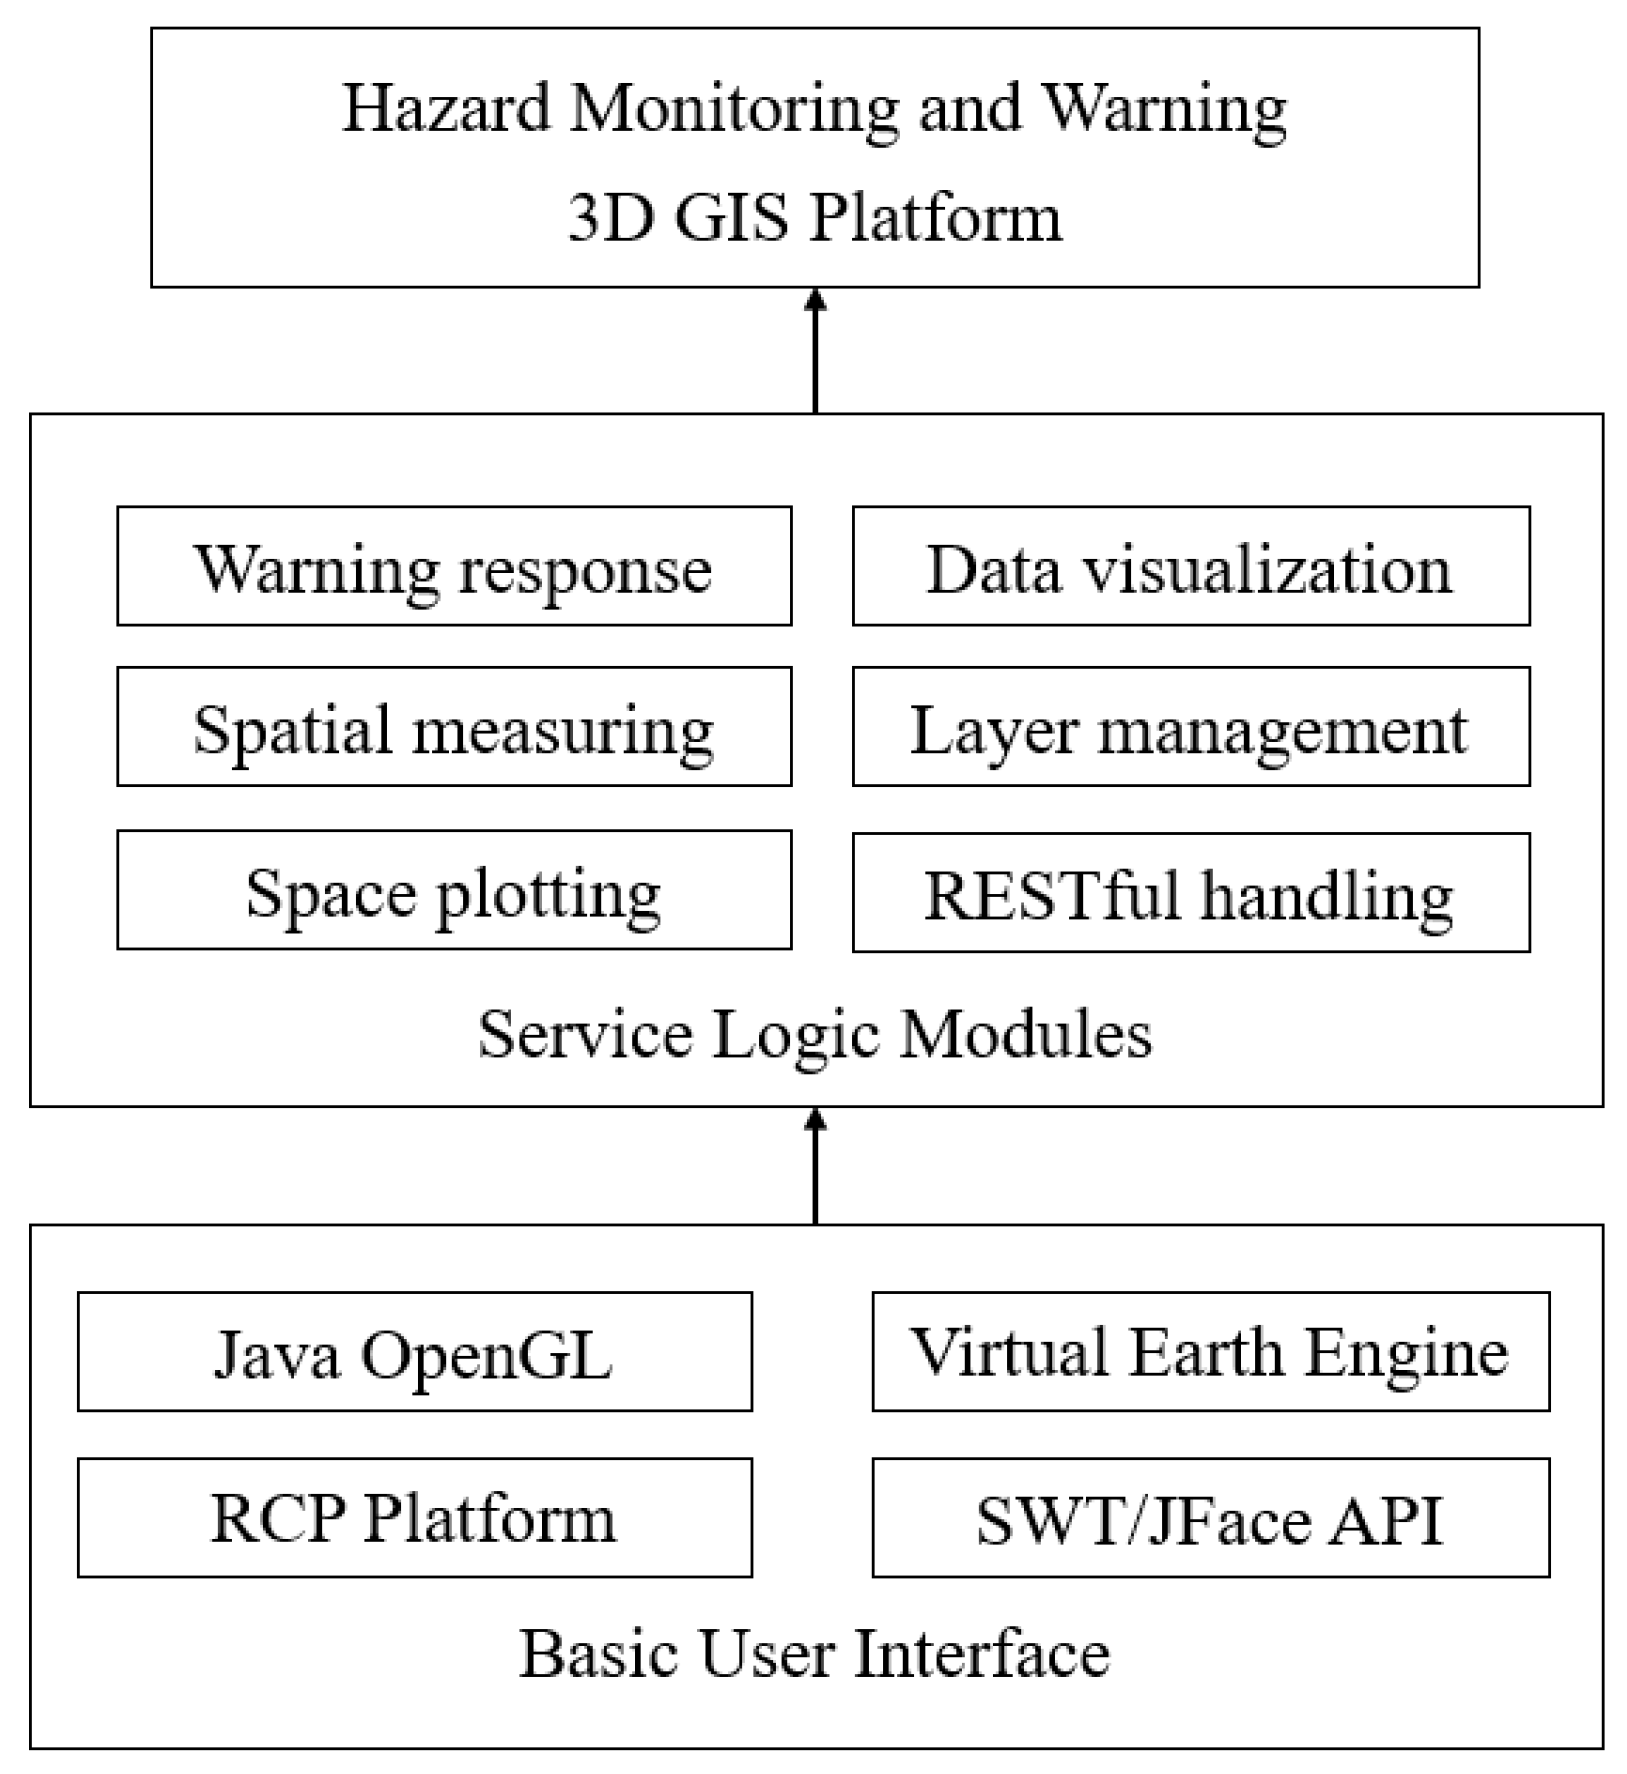
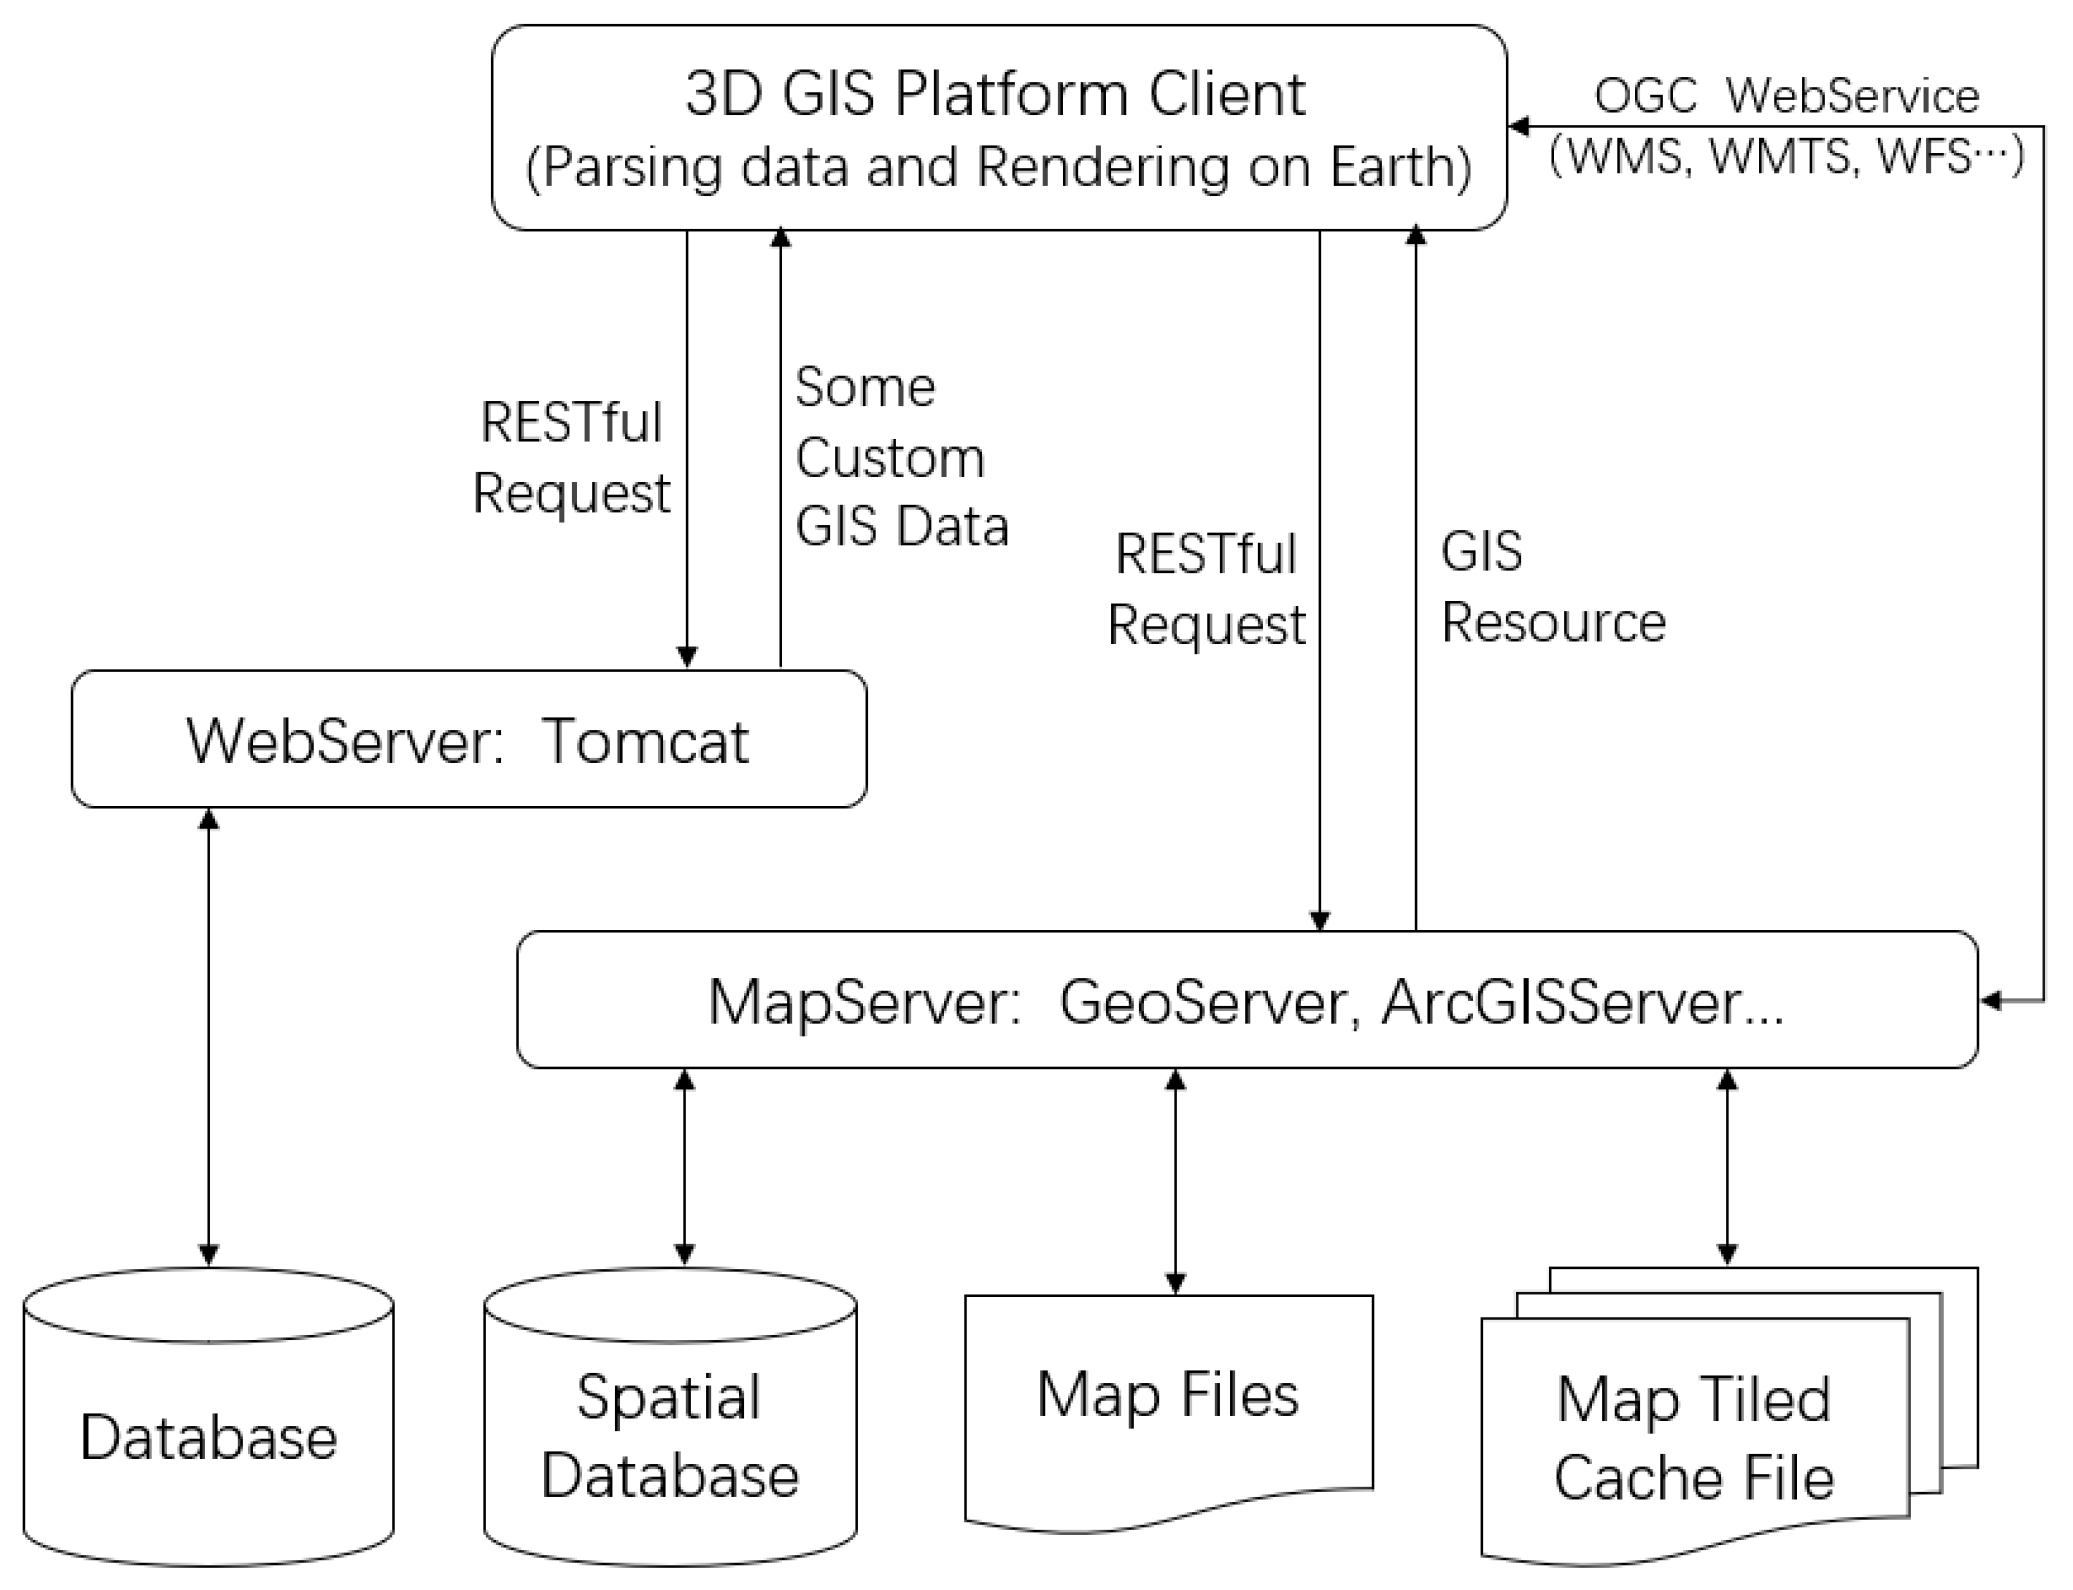
2.1. Basic Platform Architecture

The basic platform provides the base operating environment of the 3D GIS, including the basic functions of the Earth ellipsoid model construction, 3D scene browsing control, basic image display, data caching, and projection conversion. The platform also can be professionally applied to disaster monitoring through the expansion of business function modules.
To make full use of local computing power to better present 3D display effects, the platform has been developed using the desktop client in Java language combined with the Eclipse rich client platform (RCP) framework. RCP is a framework based on the Open Services Gateway initiative (OSGi) and enables a complete and dynamic component model. RCP possesses powerful local computing capabilities and a service-oriented object-oriented model. The framework has the advantages of easy expansion of B/S services, ease of deployment, and a thin client. It also has the advantages of rich User Interface (UI) for C/S, ability to run offline, and strong computing power. This framework is suitable for our platform, which requires client computing power as well as rich network services.
The platform’s basic user interface uses Java SWT/JFace API, and the 3D rendering uses the Java binding for OpenGL (JOGL) library. This combines the National Aeronautics and Space Administration (NASA) WorldWind 3D Digital Earth Engine to build a basic Earth structure. The business logic part of the platform includes functional modules such as image layer management, alarm processing, space measurement, space plotting, data visualization, and REST request processing according to system requirements. The basic user interface combined with the business logic module constitutes a three-dimensional GIS monitoring and warning platform. The overall structure is shown in Figure 1.
The core-class structure of the platform to achieve 3D GIS function design is shown in Figure 2, in which the basic class for acquiring the 3D spherical entity object is BaseEarthManager. The sphere implementation depends on the Java OpenGL GLCanvas class, and the canvas object is obtained in the singleton pattern in the GlobeFactory class. The basic sphere operation is defined in the AbstractGlobalManager class, which implements the iTuWindow interface that defines the 3D sphere core events and the underlying operations.

2.2. Data Organization Management

2.2.1. Vector Data Organization

The organization and description of vector data on this platform are mainly implemented based on eXtensible Markup Language (XML) markup language. This combines the Geography Markup Language (GML) and Keyhole Markup Language (KML) markup language specifications and describes the definition of heterogeneous spatial data, including the following:
(1) Spatial data description function
The spatial data description function provides descriptions of vector type data including points, lines, planes, and polygons, as well as descriptions of the appearances and styles.
(2) Functional description of geological disaster information
This is mainly used to realize the description of geological disaster-related information. At present, it mainly includes geological structure features, geological disaster classification, geological disaster point information description, and various types of monitoring data and map descriptions. This includes engineering geological maps and hydrogeological maps, in order to realize visualization on the geological disaster-related information platform.
(3) Geographic information annotation
The geographic information labeling function is used to implement the geo-tags in the form of labels on the 3D geographic information platform. This is compatible with HTML language expressions and stores the corresponding attribute information.
(4) Scene roaming control function
This function realizes the interaction and roaming in 3D geospatial space. It mainly realizes 3D positioning and perspective transformation by defining attributes such as position, angle of view, and direction angle of a viewpoint.
(5) Data integration description function
The data integration and description function integrates spatial data or services distributed on the network by describing spatial data files, spatial data sets, and services to achieve visualization or other applications.
The basic unit used to describe data is an element that is instantiated in the form of a tag. The child element can inherit the structure method of the parent element. In the instantiation, the inheritance relationship is defined by composite tag and single tag definitions. The inheritance relationship is shown in Figure 3. Through the group of tag definitions, most of the vector data definitions, such as the basic spatial data description of point, line, plane, location, and angle of view, in the platform can be realized, and the description of monitoring points and object areas for disaster areas can also be realized.

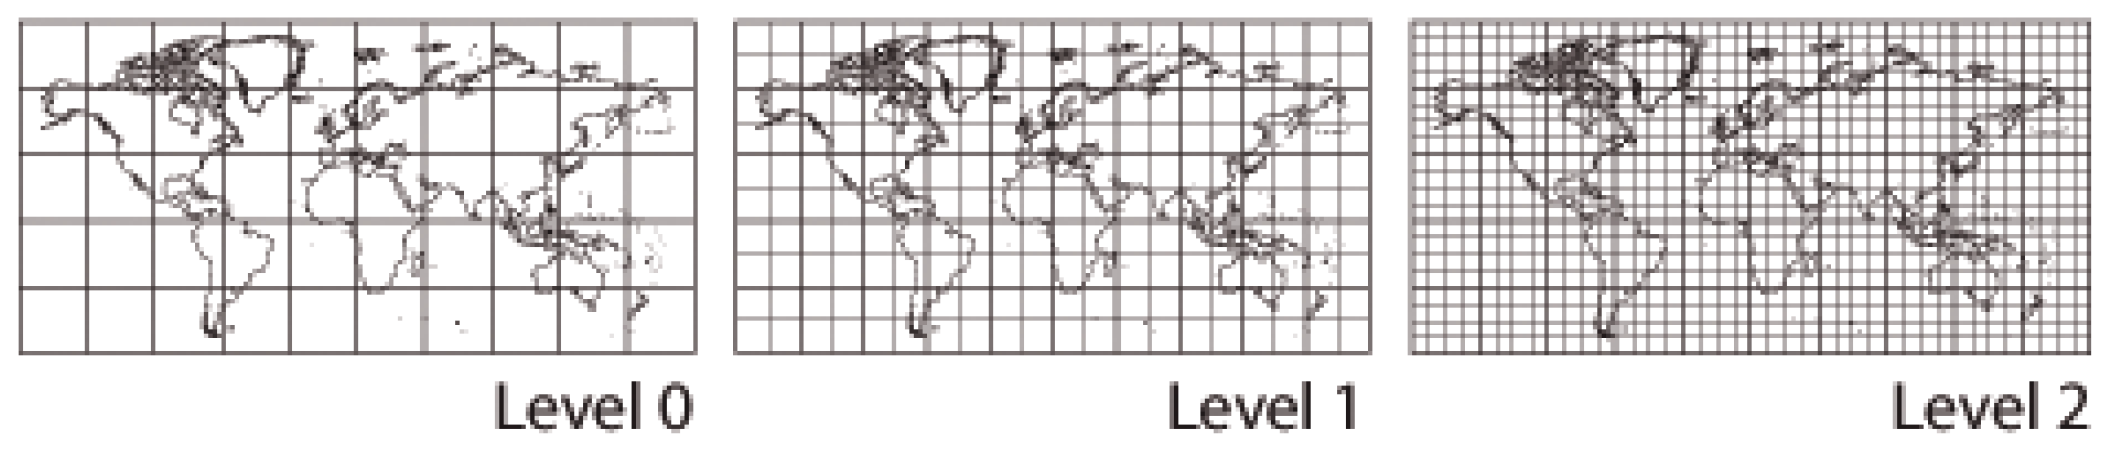
2.2.2. Terrain Data Organization

A Digital Elevation Model (DEM) is a solid ground model that represents the elevation of the ground by a set of ordered numerical arrays. The surface topography model was established with DEM to form the terrain surface. Then, the three-dimensional effect of the surface was formed by superimposing the image data.
In the realization of terrain 3D visualization, a regular grid model and irregular triangulation network model are often used [17,18].
(1) Triangulated Irregular Network (TIN)
This is a method of modeling the surface of a DEM based on triangles. A triangle represents a piece of an inclined surface. The mathematical expression of the plane (x, y) and elevation (Z) data sets is:
Z = a0 + a1x + a2y
Its characteristic is based on triangle surface modeling. The terrain surface is composed of a series of seamless triangles. The structure is simple and data for features such as fault lines can be easily integrated.
(2) Digital elevation regular grid model
This is a method based on a square grid to model the surface of the DEM. It consists of a four-dimensional elevation of the square grid to form a bilinear surface. The mathematical expression is:
Z = a0 + a1x + a2y + a3xy
Based on the square grid surface modeling, the terrain surface is composed of a series of bilinear surfaces that are adjacent to each other. It is the same as a raster map, and the data storage and processing are extremely simple. It is suitable for large-scale, continuous terrain and global DEM surface modeling. The DEM is based on sampling points of directly regular rectangular grids or from irregular discrete data points through interpolation. The computer processing of a two-dimensional matrix of regular grids is convenient. It can easily draw contours, calculate the gradient, aspect, and shadow of slopes, and automatically extract the topography of a basin according to elevation. These characteristics are suitable for the application of geological disaster monitoring system [8,19,20].
Based on the above characteristics, the system uses a .bil format raster file, which uses binary continuous storage of data, and the stored value is altitude relative to the sea level. In addition, the raster data-sliced format in the form of regular grid can be consistent with the way the platform organizes image data. This can conveniently implement unified data description, organization, and management, improve data loading efficiency, and facilitate data overlay on the client platform.

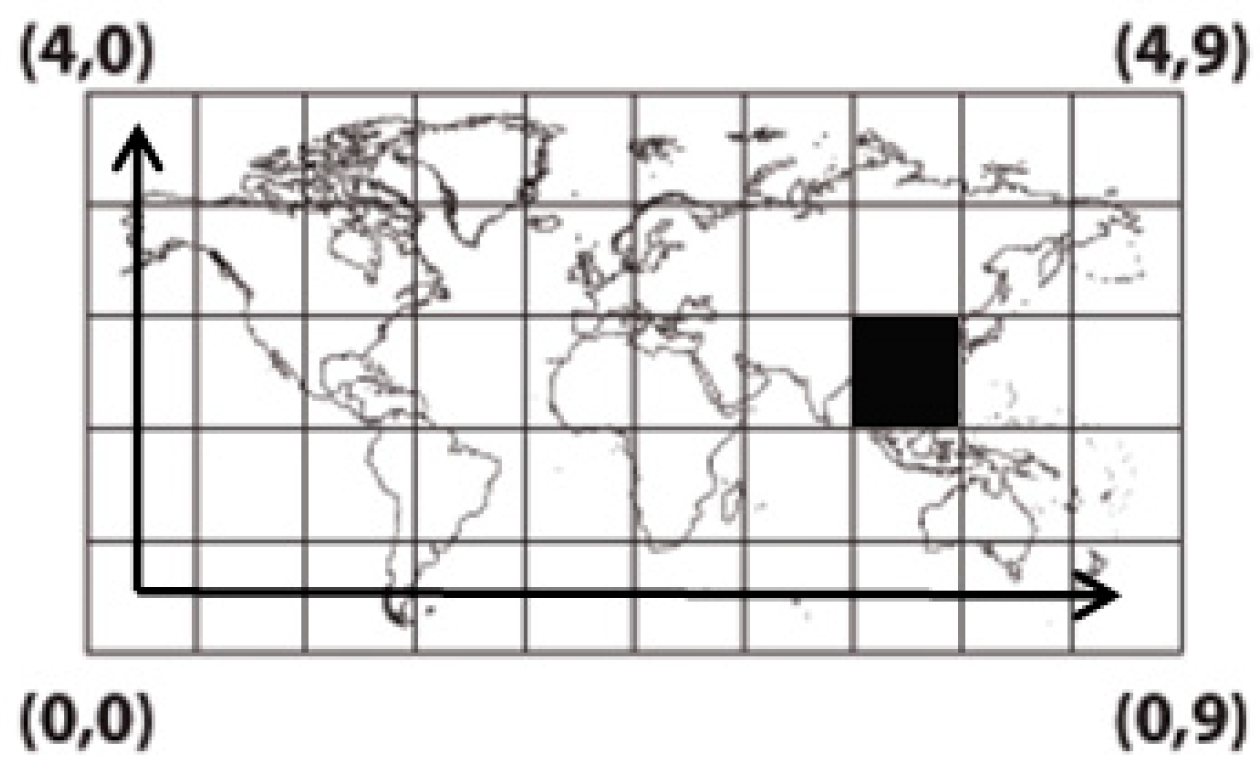
2.2.3. Image Data Organization

The realism of the constructed 3D GIS is achieved by DEM and Document Object Model (DOM) overlay. The higher the resolution, the better an actual scene can be restored, but a higher resolution means more data. To solve the problem of organization and scheduling of massive data, the local cache data of the system adopt a map tile pyramid structure. The tile pyramid model is multi-resolution and multi-level. The original data are resampled to generate multiple levels at different resolutions, and the data of the same level are evenly divided and sliced according to the specified grid size to obtain tiles. The resolution of the tiles from the bottom level to the top level decreases progressively although while the geographical range is not changed. For the construction of a tile pyramid, the initial task to perform is tile leveling on the map projection according to the degree; this is usually done by using square slices of the same size. Level N+1 to level N is always a quad tree inheritance relationship.
The platform slices the map into square tiles according to a quad tree structure and constructs a tile pyramid. When the original underlying data (i.e., the maximum resolution basemap) are of size w × h and the tile size is ts × ts pixels (e.g., 512 × 512), the fold change in magnification of two adjacent levels’ resolution is m (in this platform m = 2, that is, 2 × 2 pixels compose one pixel to generate the upper level tile matrix), and the total number of levels in the pyramid is calculated as follows:
ltot = max{[logm(w/ts)],[logm(h/ts)]}
Let the resolution of the original data be r0, and the latitude and longitude range of the 0-th tile is d. When the level is l (l ≤ ltot − 1), the data resolution is rl, and the relationship between the latitude and longitude range dl of a single tile and the number of tiles nl is as follows:
rl = r0/m ltot−l−1
dl = d/2l
nl = (180/d) × (90/d) × 4l
Taking level 0, degree of 36 as an example, the hierarchical relationship of map slices is shown in Figure 4 and Table 1.
This structure is based on multi-resolution levels that facilitate levels of detail (LOD) to improve display speed and performance, and it is also easy to implement tile positioning based on latitude and longitude through linear quad-tree indexing. The positioning method of tiles on this platform is as follows:
Using Cartesian coordinates, the origin (x = 0, y = 0) is at the bottom left of the projection coordinates, namely, the South Pole (−90, −180), as shown in Figure 5.
Based on the latitude and longitude coordinates (lat and lon, respectively), Level l, and the degree of the slice, the system can obtain the Cartesian coordinates of the corresponding image. The equations are as follows:
X = [(lon + 180)/degree] × 2l
Y = [(lat + 90)/degree] × 2l
Therefore, the system’s tile cache file storage follows the following rules:
.. LYX.png
Where L is the level number, Y is the row number in the coordinate system, and X is the name of the image. The storage location of the black picture in level 0, as shown in Figure 5, should be:
.. 002007.png

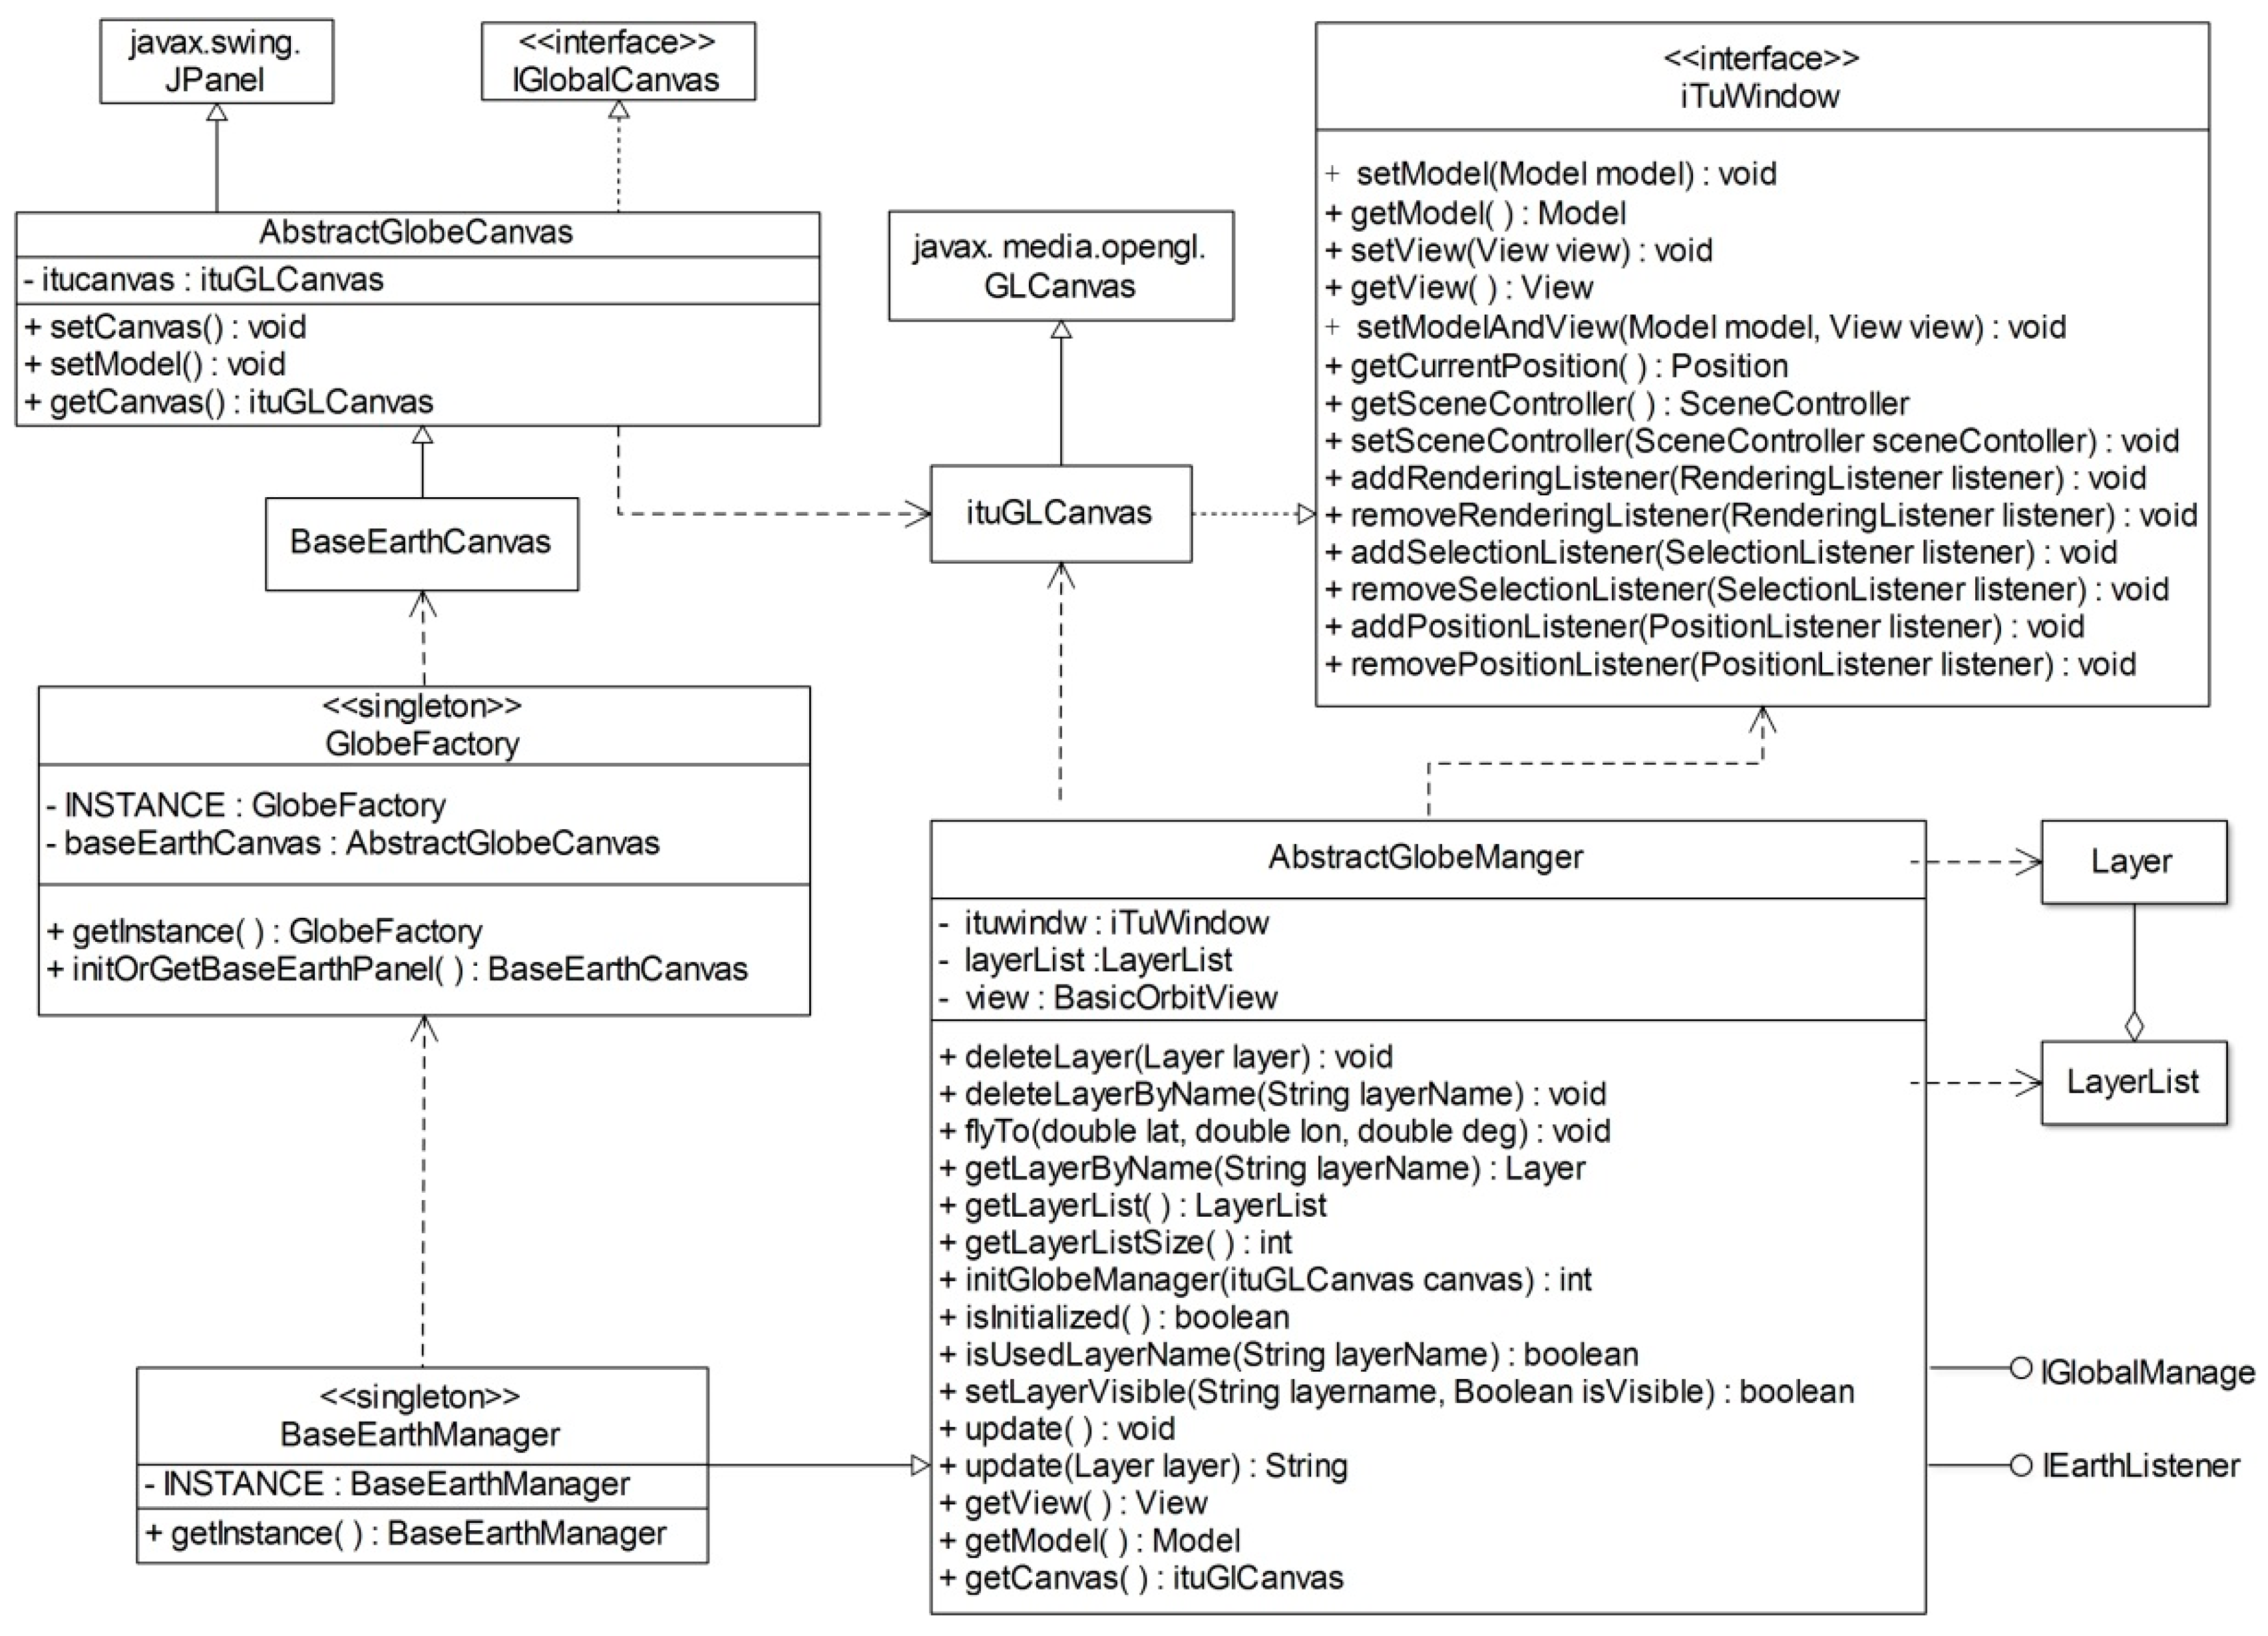
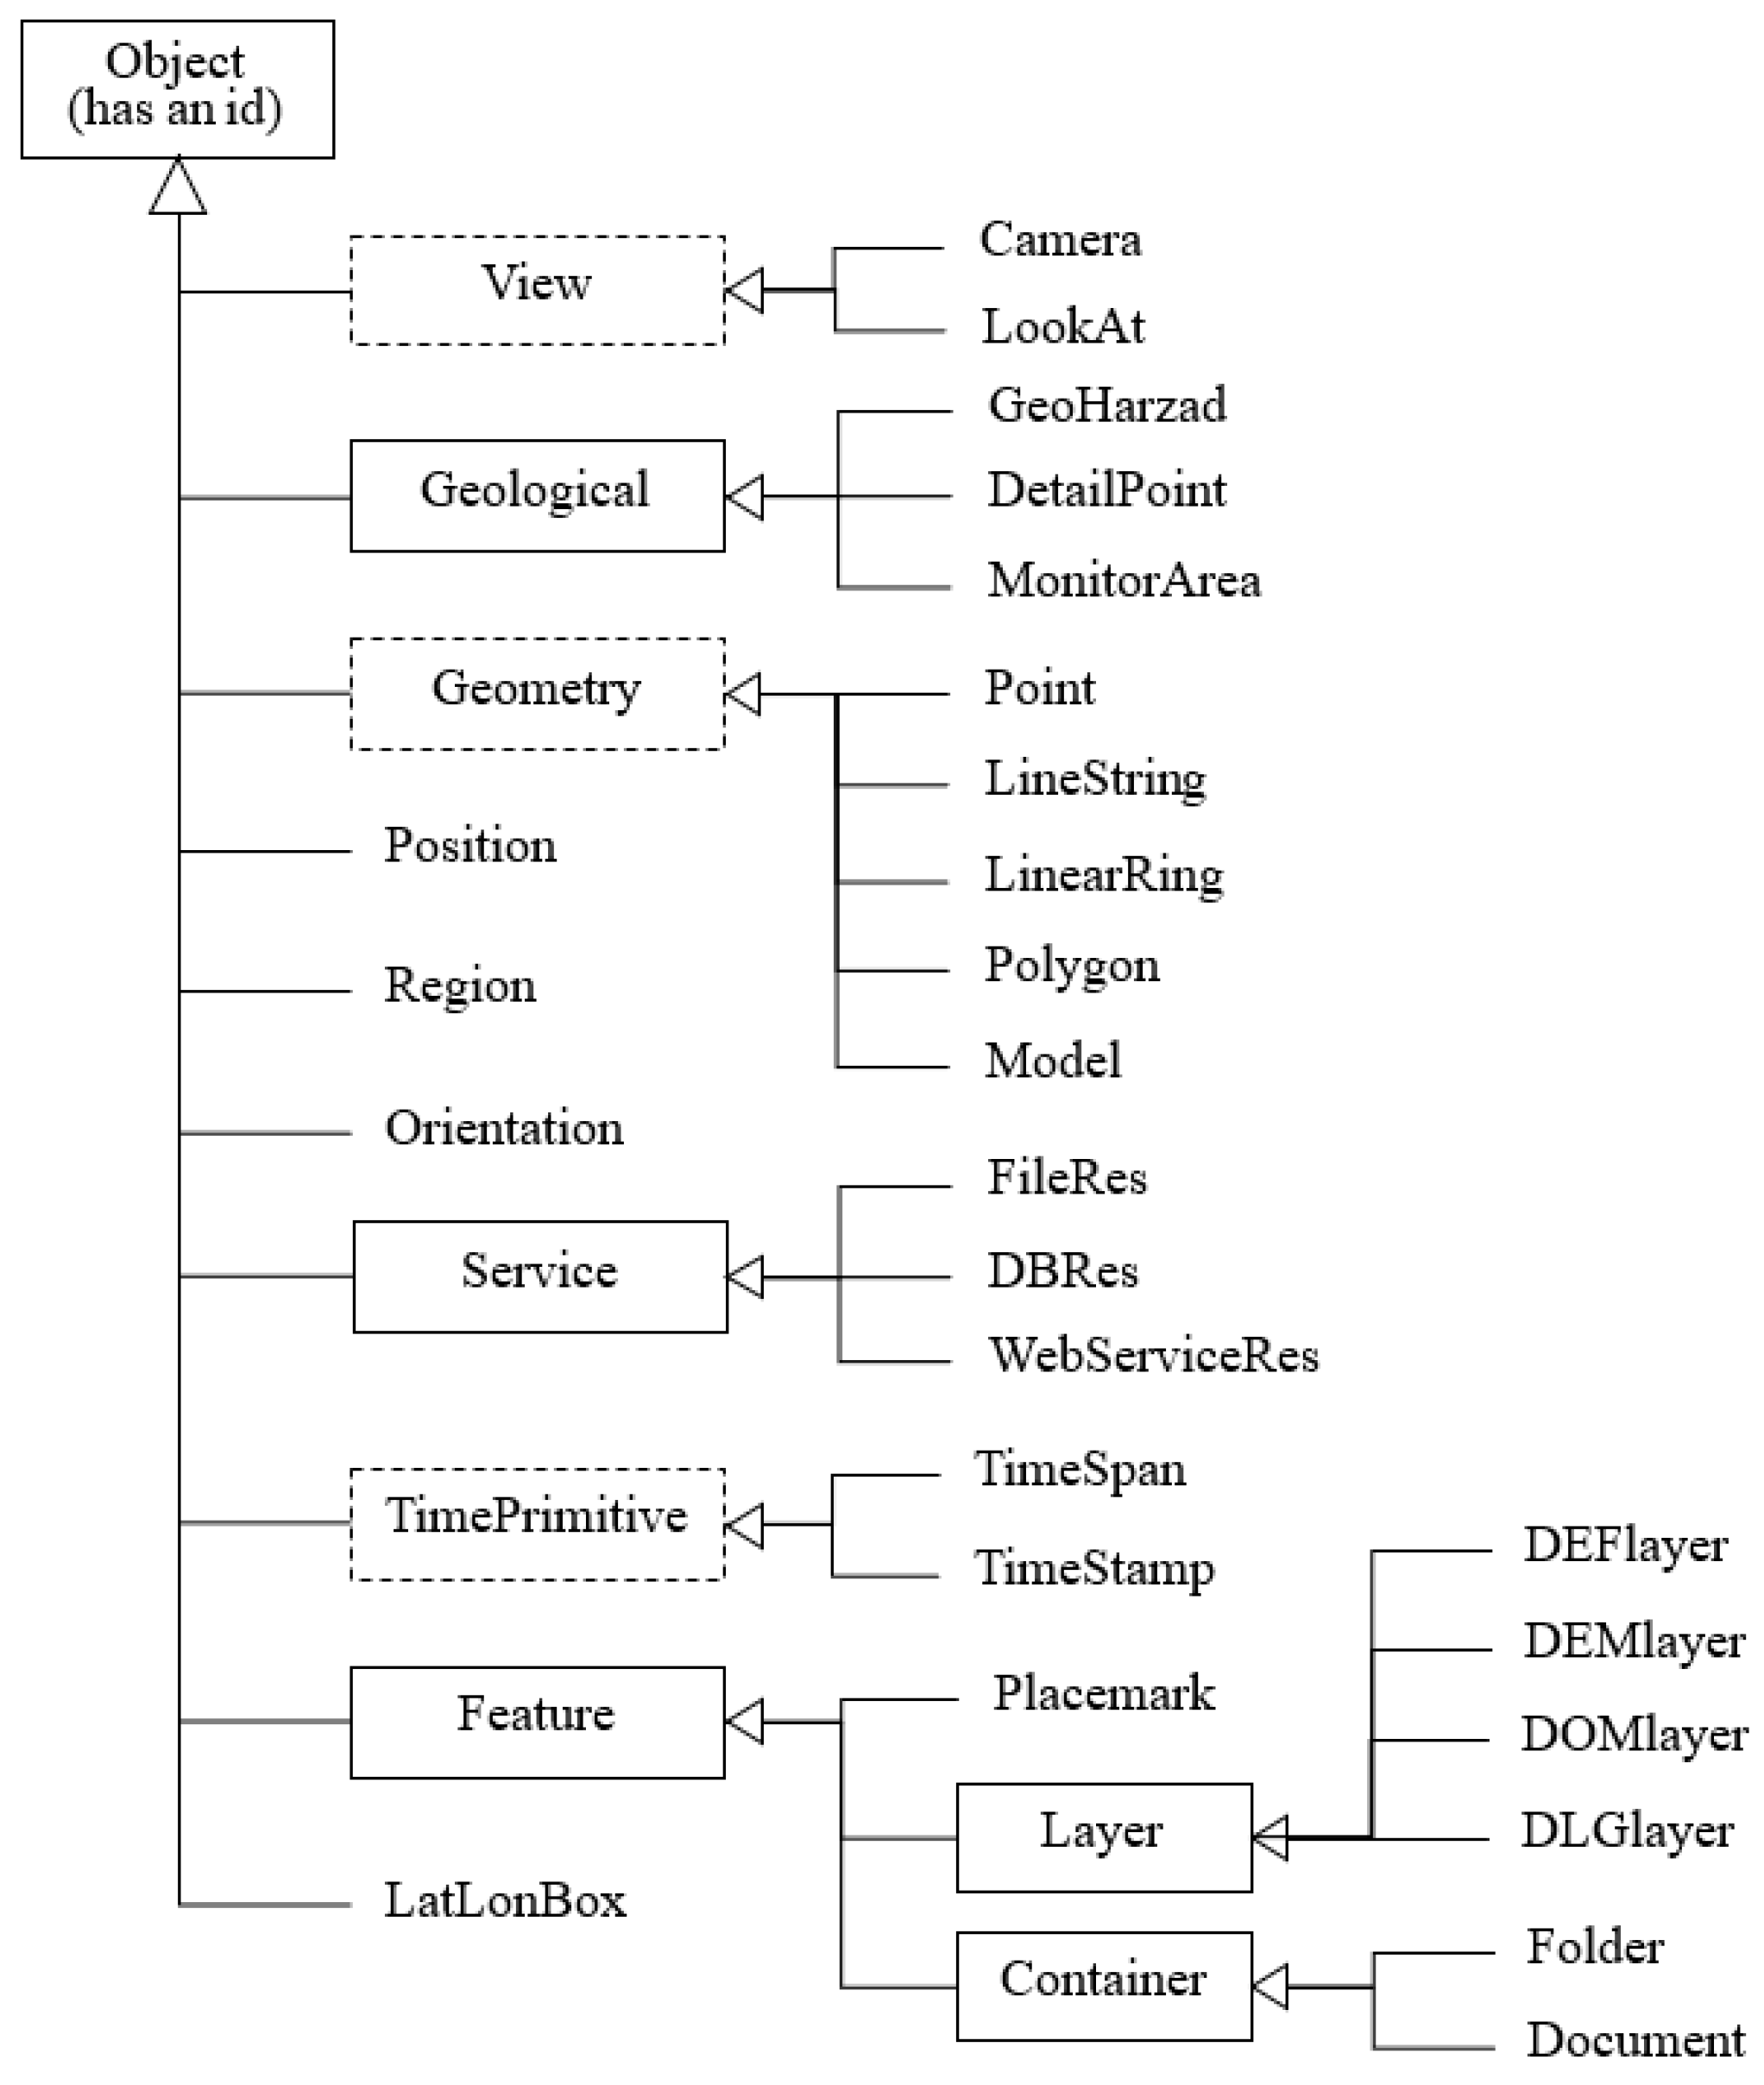
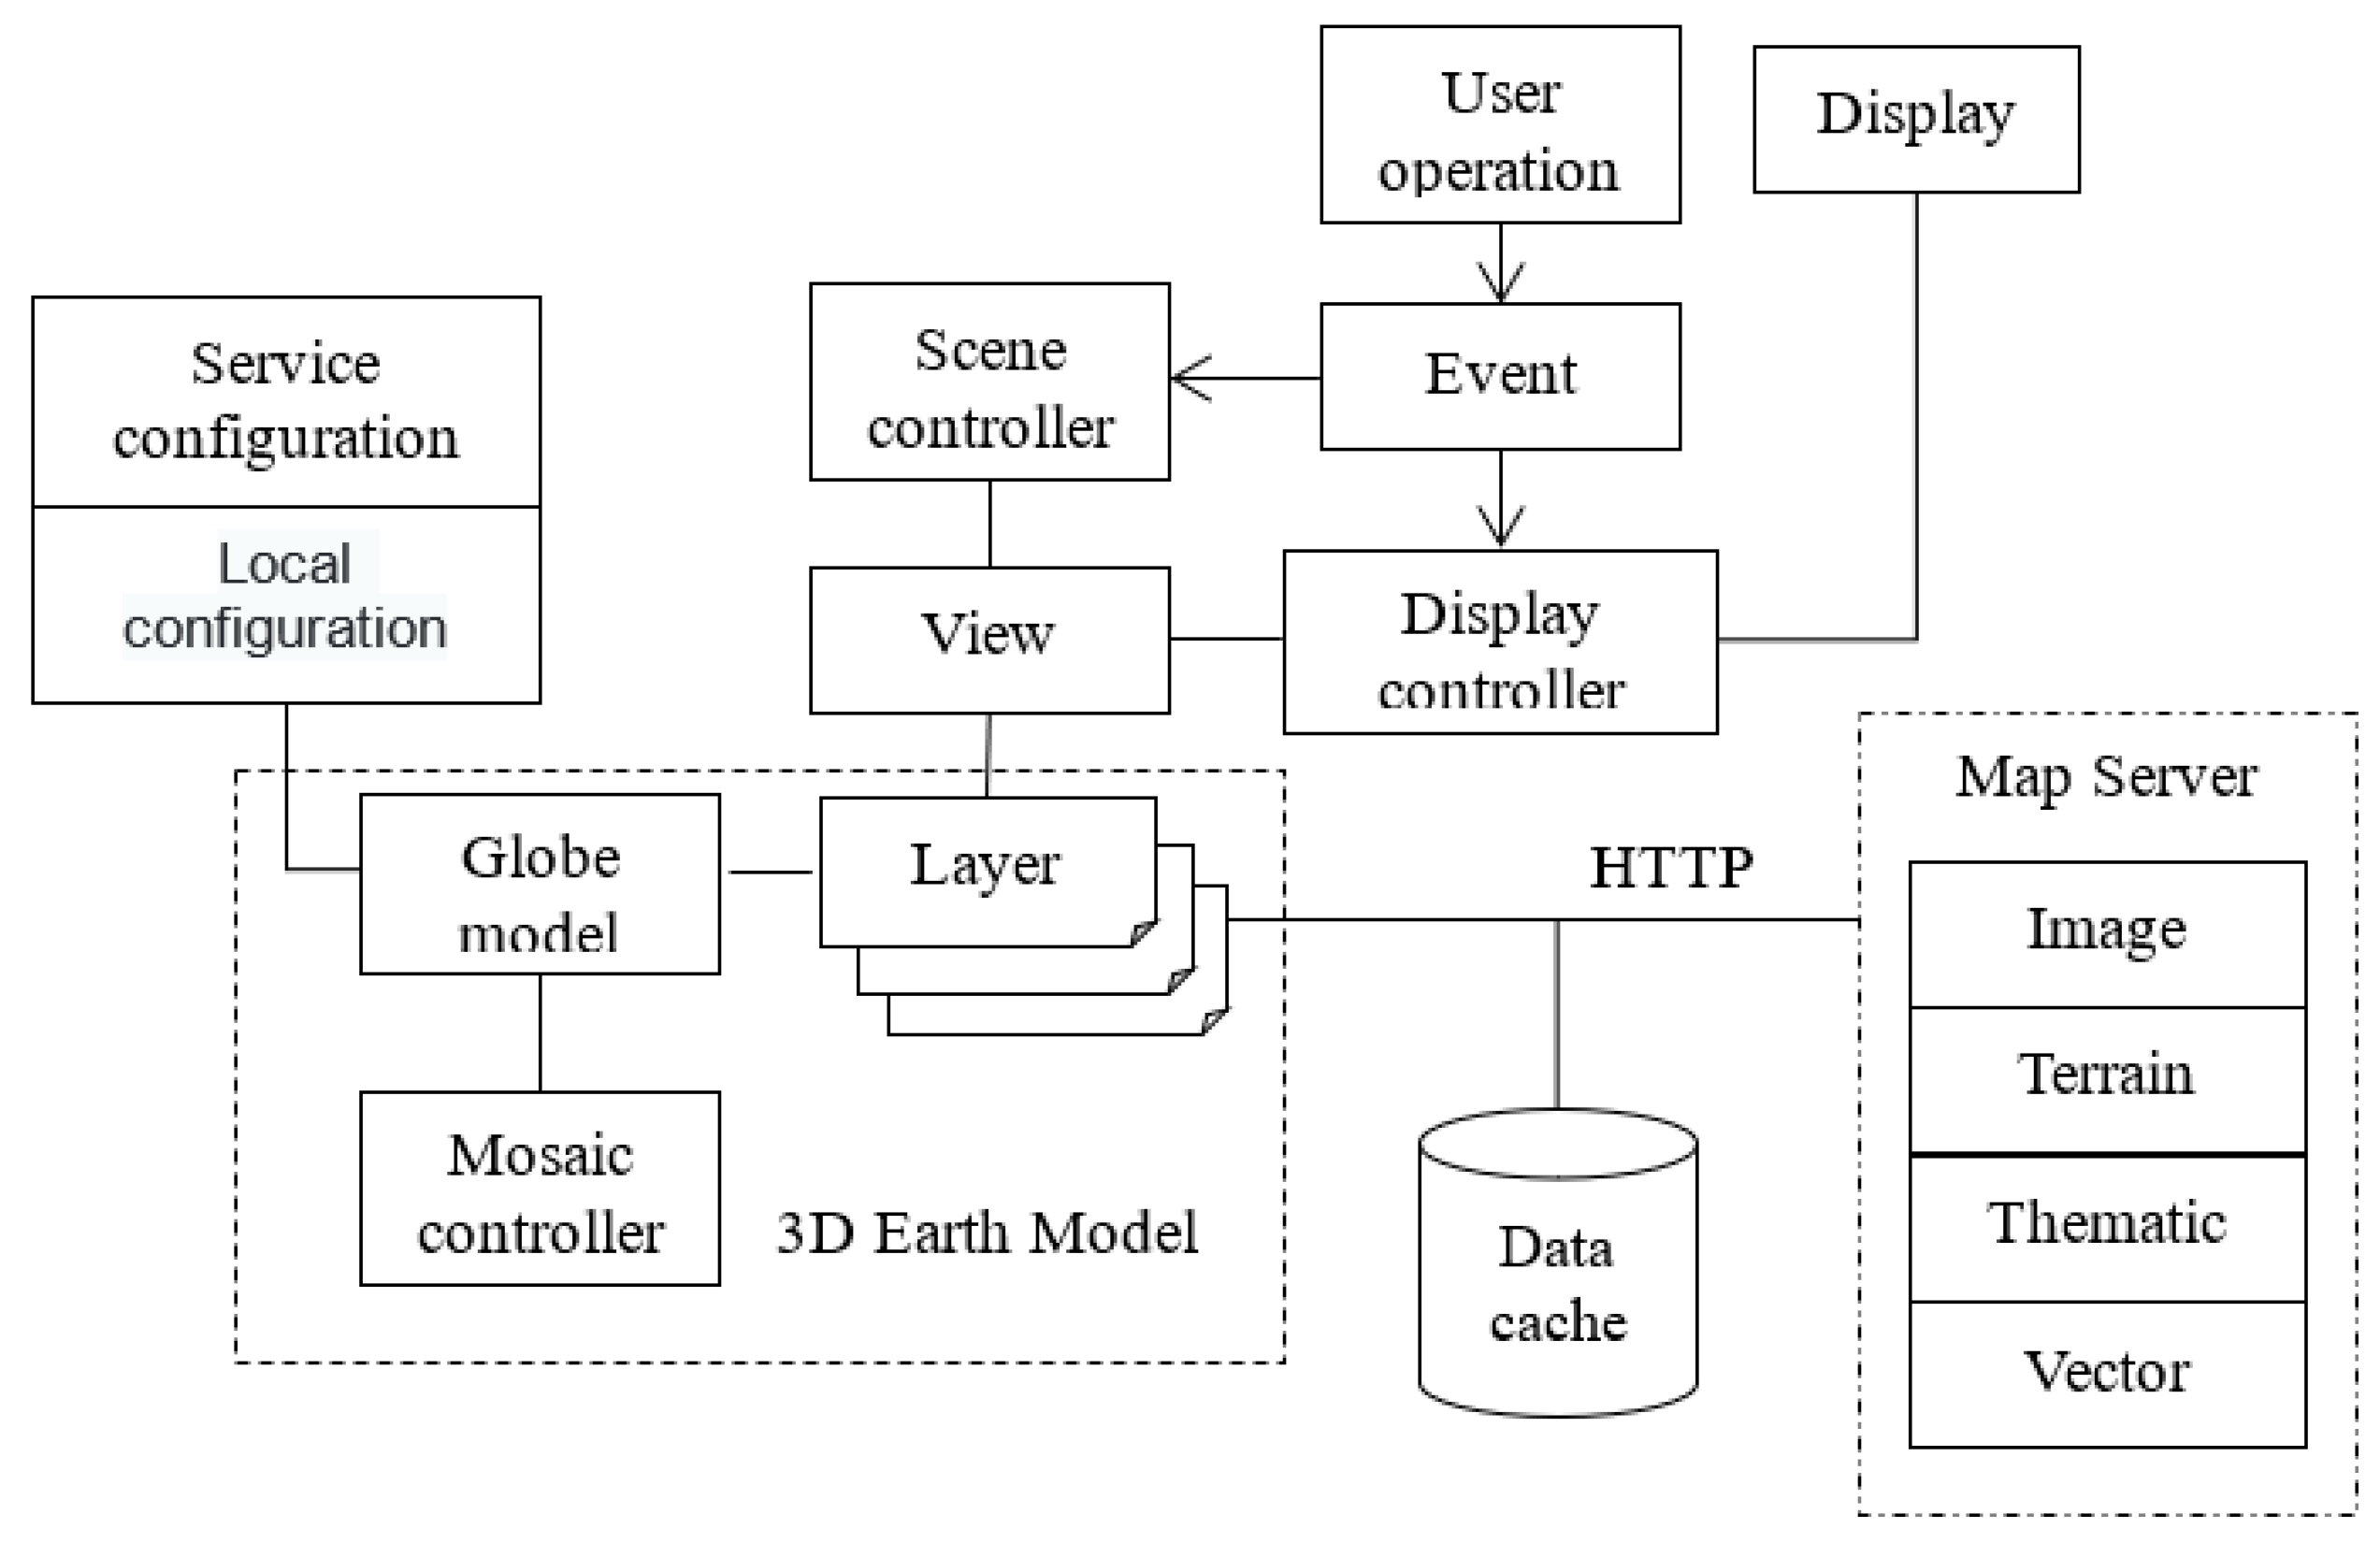
2.3. Three-Dimensional GIS Platform Application Model

The basic 3D GIS platform is mainly composed of 3D models, views, event monitoring, and data. The 3D model consists of a sphere model, image layers, and a stitching control. A view is created on the basis of a 3D model. The view is displayed by a display controller, and feedback to the view is provided through the scene control according to the user decisions. The event listener can listen to all events and call the corresponding program. The image layer data are obtained by accessing the map server via a local cache file or via an HTTP-based web service. The application model based on the three-dimensional platform is shown in Figure 6.
In addition to building a basic 3D sphere, the 3D GIS platform has the following main functions for GIS applications:
(1) Spatial reference system and coordinate system
The datum of the system is the average level of the Yellow Sea, with reference to the WGS84 ellipsoid setting, using the geographical coordinates of the Earth’s latitude and longitude. The plane map must be converted by projection before it can be loaded on the sphere.
(2) Map zoom and view control
The map zoom is used to control the current view display scale and determine the current display range and the corresponding scale image layer according to the zoom level. The 3D platform has three parameters that adjust the XYZ spatial coordinates. The viewing angle control is the main function of realizing 3D perception, and the current display range and the line of sight inclination can be determined according to the viewpoint.
(3) Basic geographic information query
The viewpoint height is acquired according to the current viewpoint position, and basic geographic information such as the altitude, longitude, and latitude at the mouse position can be picked up by the mouse.

3. Monitoring and Warning Design

3.1. Remote Monitoring

Geological disaster monitoring is the continuous and long-term measurement of the occurrence and development process of disasters through the use of multiple observation equipment. Based on the acquisition and use of certain monitoring data, detailed analysis, processing, and calculation are used to judge the stability of the disaster and its trend of development. The goals are to fully understand the deformation and development of disasters, capture the precursory information in a timely manner when the disaster occurs, and enhance the level of disaster reduction and prevention. The monitoring contents mainly include data on surface displacements, surface cracks, surface tilt, and deep tilt monitoring that can directly reflect the stability of geological disasters, as well as rainfall monitoring that reflects the causes of geological disasters and precursory infrasound monitoring [3,6,10,21].
The application process of remote monitoring in this system is shown in Figure 7.
In the system, the data acquisition layer uses various sensors such as rain gauges, inclinometers, and video surveillance to collect relevant data from the monitoring area. The collected information on relevant physical quantities are converted into electrical signals, converted into digital signals through analog-digital conversion, and the resulting data is transmitted through the internet.
In the next layer, the data processing layer, the received the monitoring data is decoded, significant noise signal rejection is performed, and data preprocessing work, such as data classification, formatting, and data interpolation, is conducted.
In the next layer, the pre-processed data are stored on the data server according to a unified rule by calling the persistent storage interface to perform operations such as database management or file storage.
The business logic encapsulation layer is responsible for encapsulating operations related to data such as databases pertaining to business logic requirements, including querying, adding, modifying, and deleting data, and publishes them as REST services and builds a service-oriented service provisioning layer, according to business logic requirements.

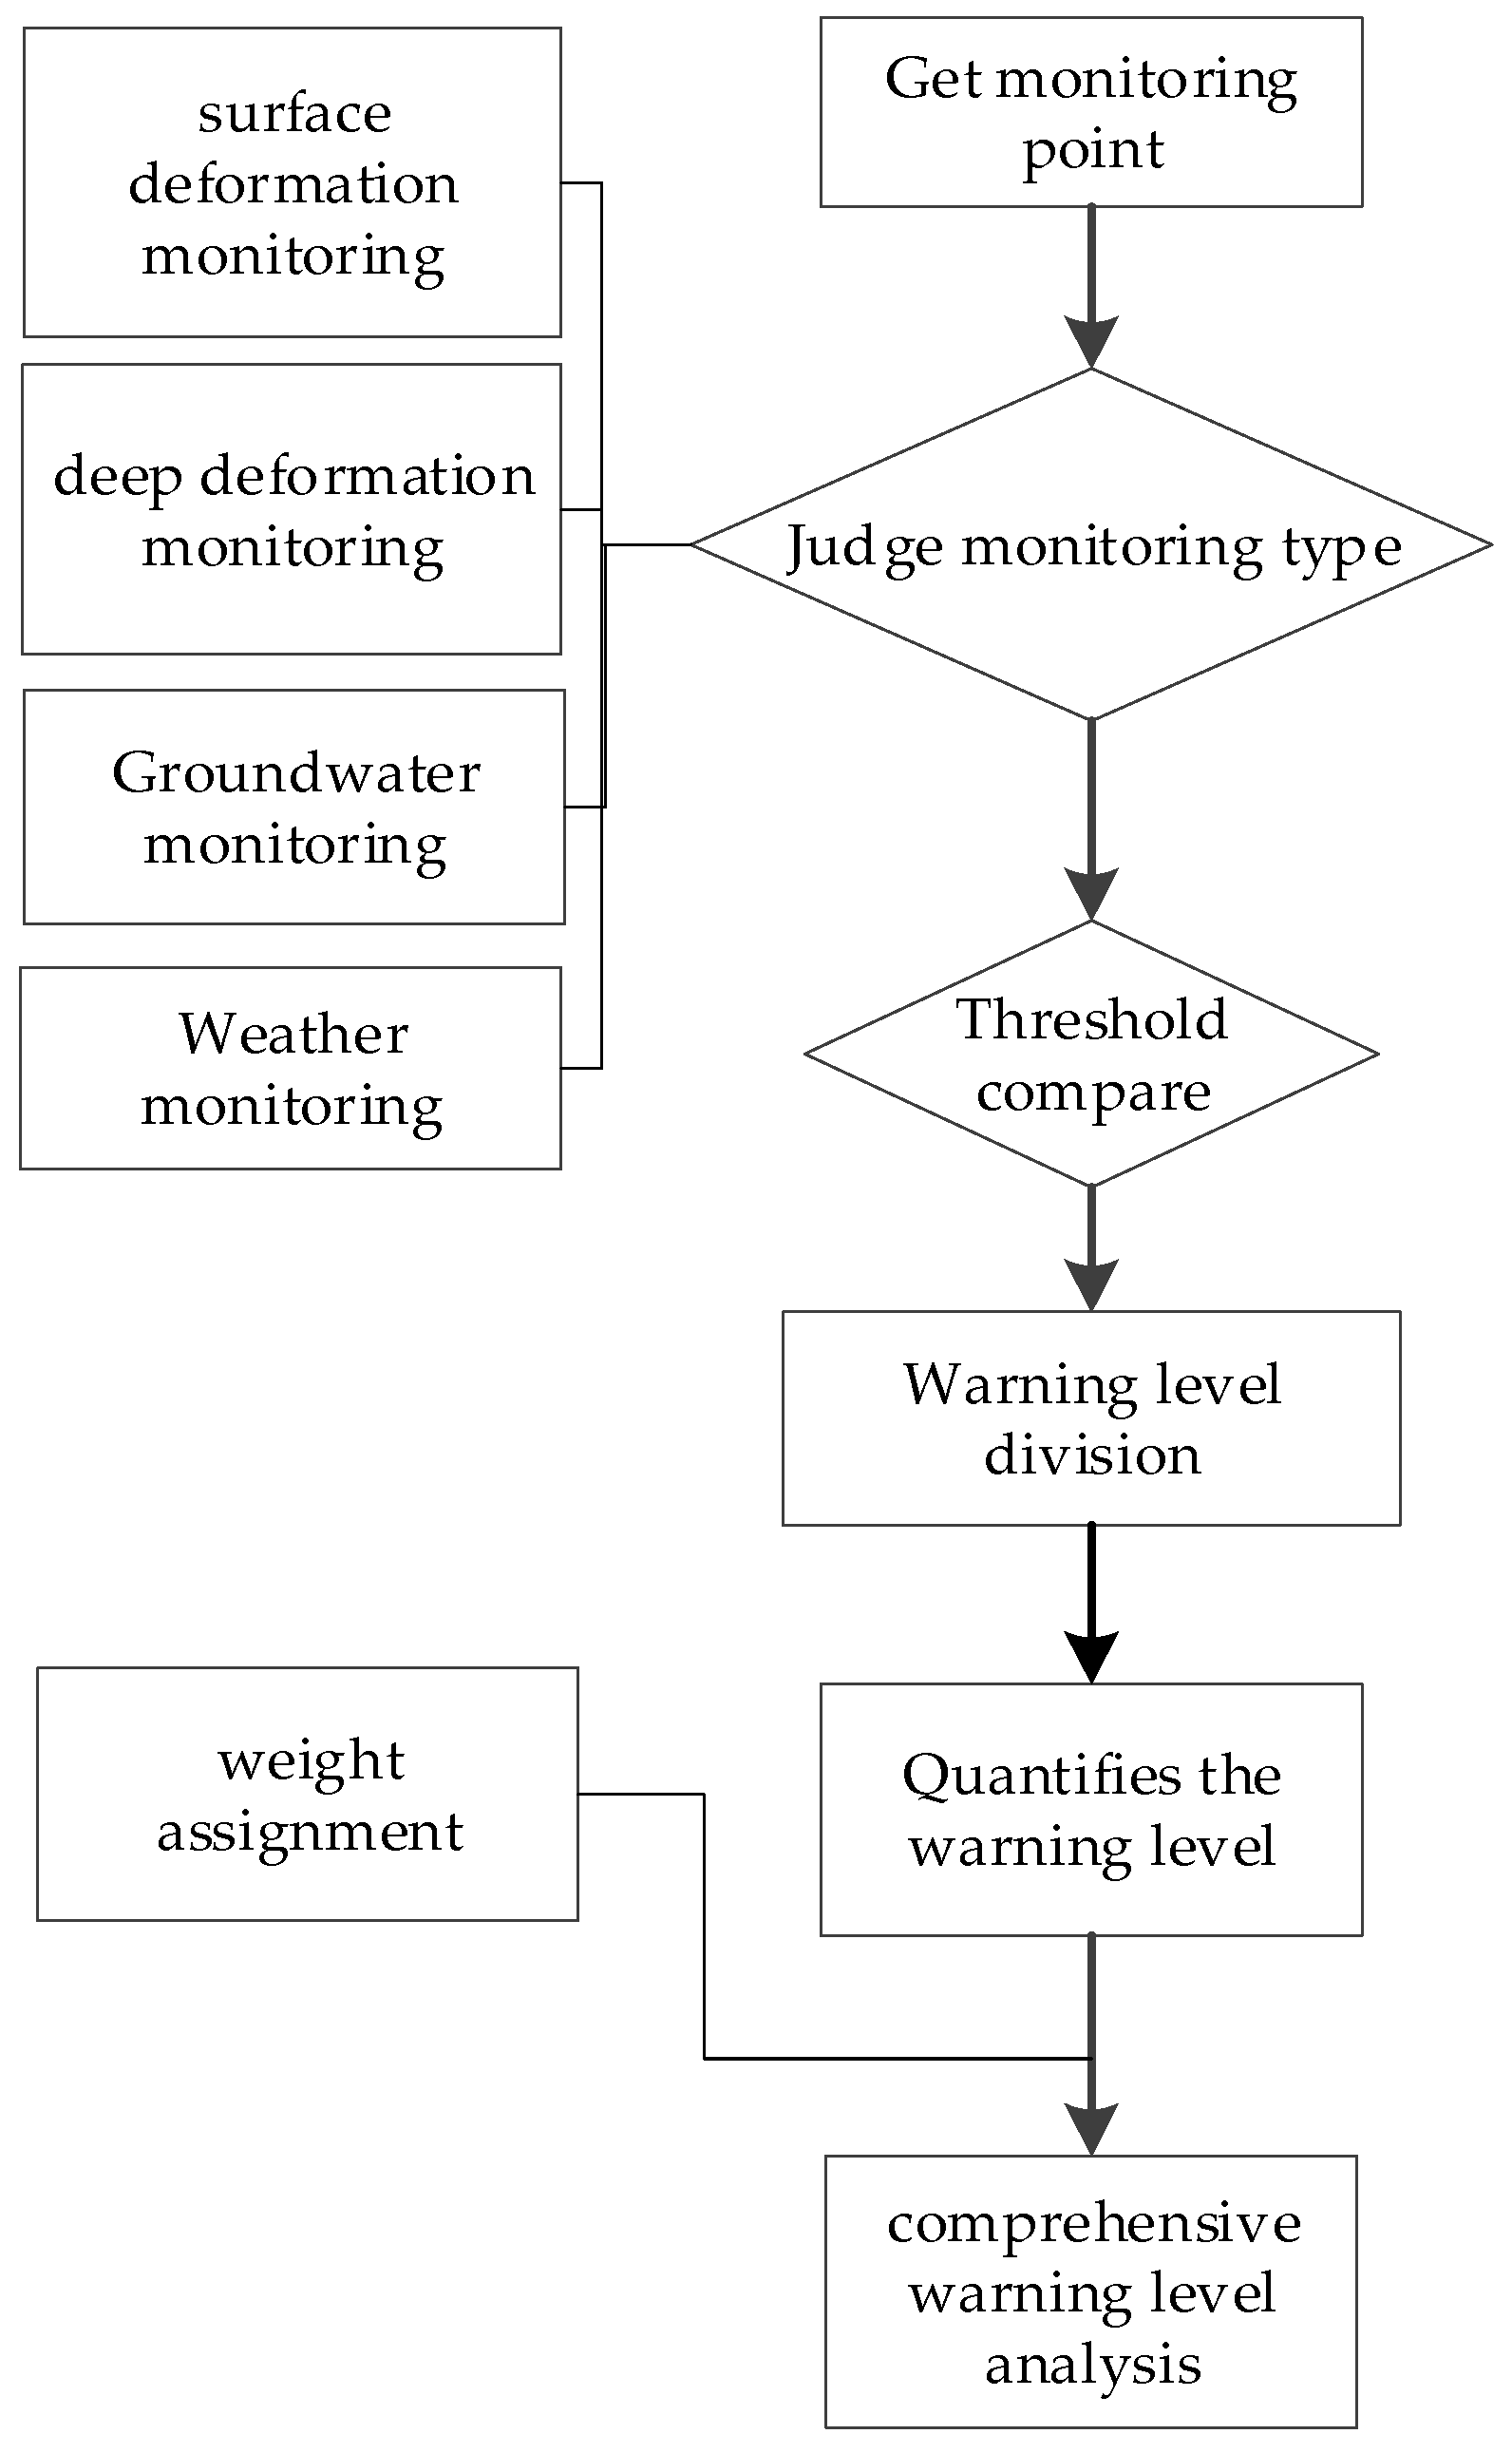
3.2. Warning Model Design

Geological disaster monitoring and warning objects can be classified into two types: single-unit geological disaster monitoring and warning, and regional geological disaster monitoring and warning. In practical applications, mid- and long-term forecasts are usually based on regions, while mid- and short-term warnings are dominated by single-unit warnings. The construction of the platform mainly considers short-term warning of single units through real-time monitoring data. It uses professional monitoring equipment to conduct real-time observations of disaster sites and establishes a mathematical model of geological disaster warning through the establishment of calculations of related index systems and uses this warning model to achieve single-unit monitoring of the objects being monitored [8].
Common monitoring content includes surface deformation, deep deformation, groundwater, and weather monitoring. Different monitoring contents will adopt different monitoring methods, as shown in Table 2.
For a monitoring object, multiple monitoring devices are usually used to collect monitoring data. For a particular disaster body, when using different quantitative values for different monitoring contents for warnings, multiple different warning results will be obtained. Most of the available short warning models are based on a major induced factor of disaster point, such as rainfall intensity, deformation rate, and displacement acceleration [22,23,24,25], through the given threshold for warning. These models are suitable for the specific conditions of disaster point. However, in this case, the model needs to be more adaptable, because the platform will manage different points. Therefore, the platform uses the comprehensive warning model under multiple conditions for warning, which establishes an evaluation model through different indicator weights to obtain more accurate warning results. The warning model building process is shown in Figure 8.
The monitoring level of the monitoring point is used to obtain the current warning level of each monitoring point (e.g., rainfall and osmotic pressure) deployed at the disaster point, and the level is divided according to the preset threshold of the monitoring point.
The comprehensive warning level analysis quantifies the warning level of each monitoring point, calculates the comprehensive warning level index according to the weight, and finally obtains the comprehensive warning level. The warning results are divided into four levels of blue, yellow, orange, and red according to standards, which correspond to the four levels of attention, caution, alert, and alarm. The comprehensive warning level index is calculated as:
R = i = 1 n W i × P i
The R value is the comprehensive warning level index, W i is the weight of the ith evaluation index, and Pi represents the univariate grading index of the ith evaluation index.
The overall process of warning is shown in Figure 9. The business layer acquires the monitoring data of the monitoring points from the database and provides the data acquisition interface in a service manner. By using the warning module developed based on the above calculation method, the comprehensive warning level is calculated and then stored in the corresponding form in the database by calling the corresponded service interface. The database listener pushes the warning results to the user.

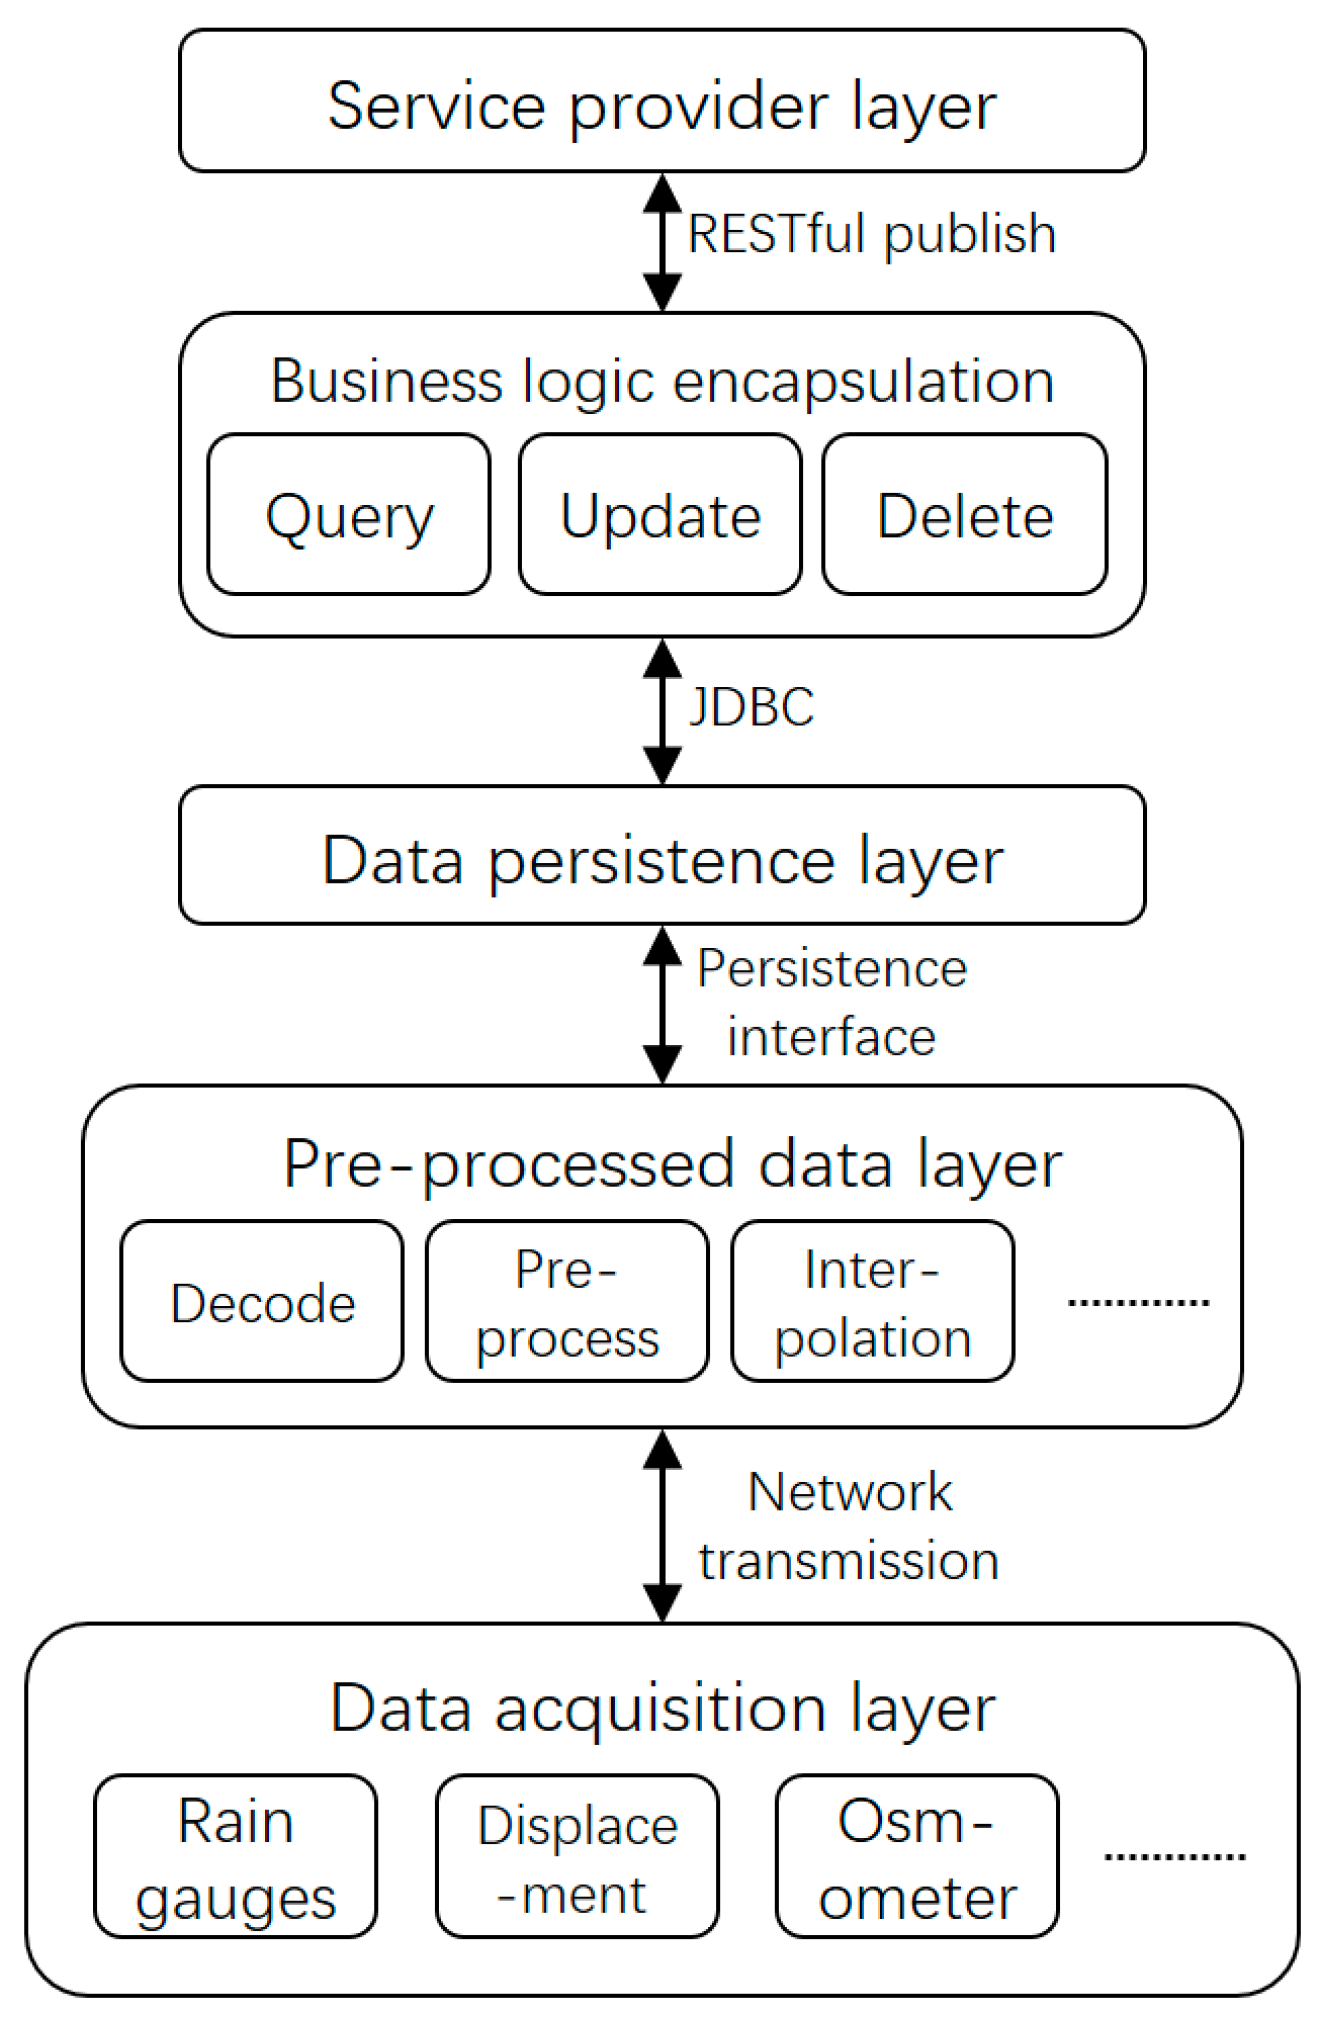
4. Rest Construction and Integration

4.1. REST Application Overview

4.1.1. REST Features

Web services based on the REST architecture follow these basic principles: (1) Set the address resource: one can use a web site to access any resource; (2) Universal interface: the standard Put, Get, Post, and Delete operations all require a request to complete; (3) Stateless messages: each request is independent and must include its own parameters to complete the operation; (4) Expression: the rendering of request results can be implemented in multiple forms such as maps, XML, and JavaScript Object Notation (JSON) [16,26,27].
Based on the above advantages of the REST architecture, the required data can be integrated through the REST service through the platform interface and can greatly improve the data service compatibility and accessibility of the platform. This also enables forming a unified, maintainable, and extensible service standard that is conducive to the further expansion of the platform functions. This enhances the practicality and continuity of engineering applications.

4.1.2. Application Mode

The REST interface application scheme in this platform is shown in Figure 10. The platform client will integrate multiple types of REST service data. To not affect the fluency of the overall running of the platform, the platform business logic layer will create a Java thread that operates a REST service using the HttpClient component to encapsulate the operation of the REST service. (The HttpClient component is a subproject of Apache Jakarta Common.) Compared to the URLConnection class provided by the traditional JDK, HttpClient has better usability and more flexibility) and issues service requests such as POST, GET, DELETE, and PUT through HTTP methods and Uniform Resource Identifier URIs. At the same time, it submits service return resources (mainly JSON) to the business logic layer for corresponding processing. The server side includes Tomcat as a web and application service container and a geographic information server (such as GeoServer, ArcGIS, etc.). After the server receives the service request of the REST rule, the corresponding service program parses and processes the request, performs corresponding operations on the database or spatial data, and returns the result to the requester.
According to the functional requirements of the platform, the background services mainly include monitoring data services, warning model services, and geographic information services. They provide the most important data services for the realization of the business functions of the platform.

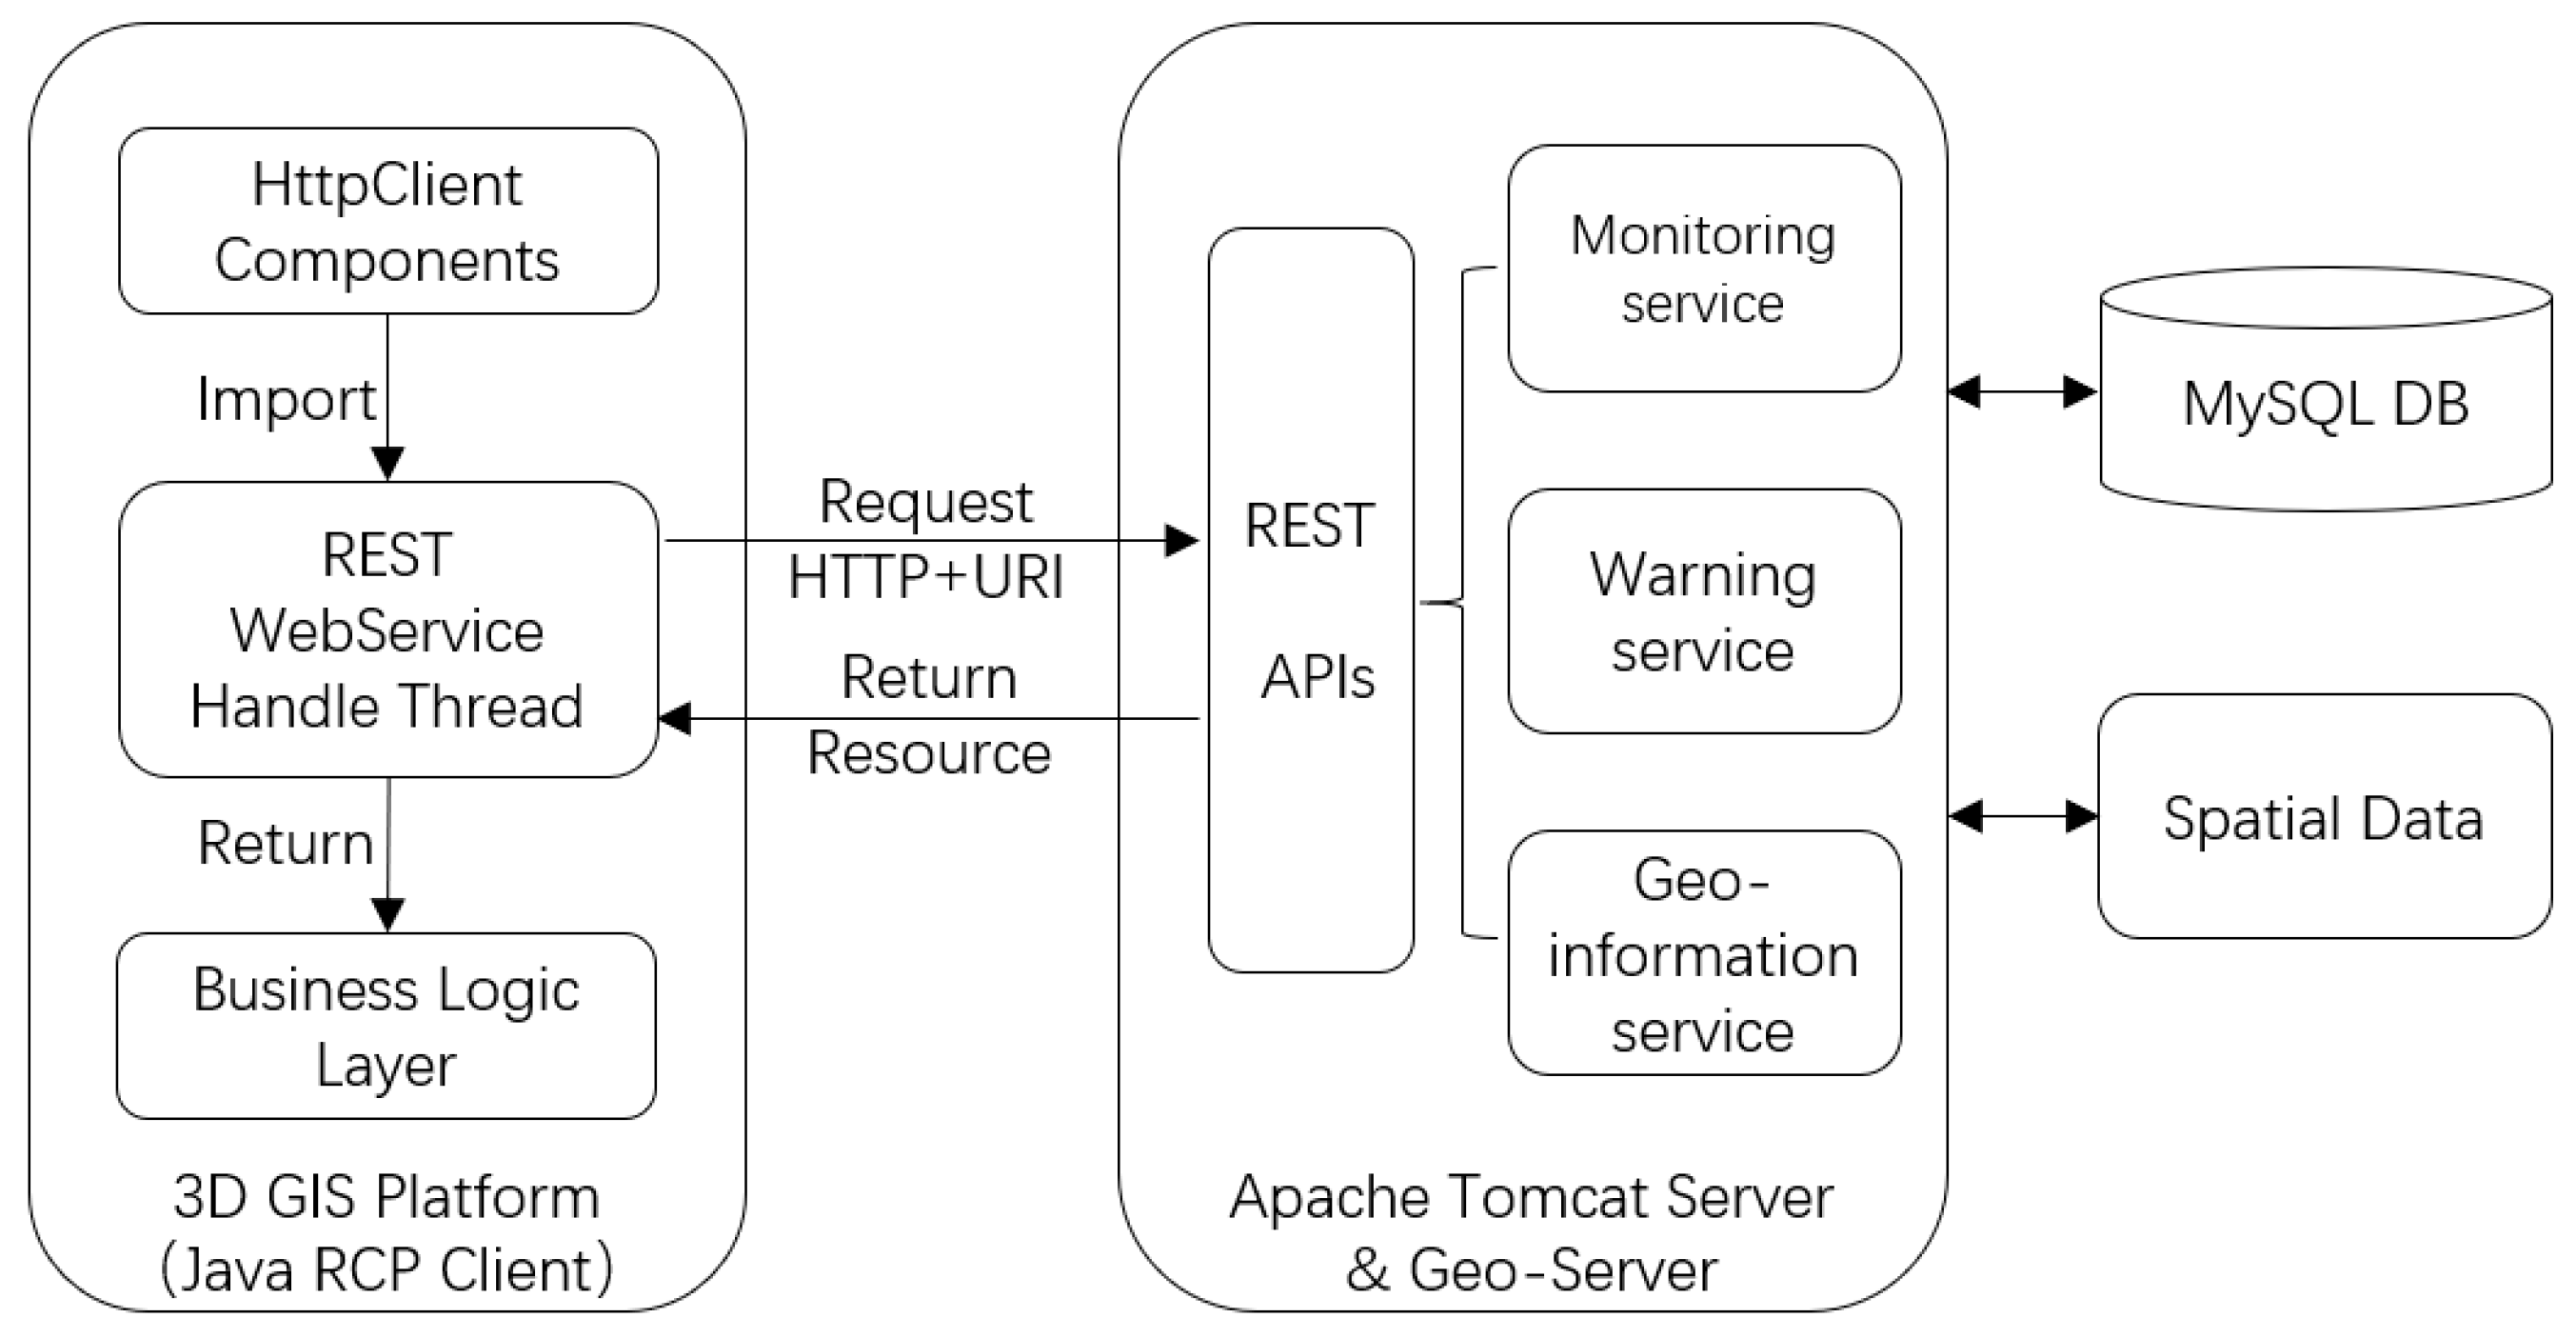
4.2. REST Service Integration

4.2.1. Geographic Information Integration

The geographic data needed by the platform mainly include sliced map data displayed as a base map, DEM elevation data for realizing 3D terrain, and some required space vector data. At present, most of the mainstream GIS server software have REST service capabilities, such as commercial software ArcGIS and SuperMap, and open source software GeoServer. Their REST APIs encapsulate major GIS functions, including maps and data. These GIS functions can be provided in the form of resources. The platform client can operate resources by writing REST interface programs to obtain the corresponding GIS capabilities. The service flow is shown in Figure 11.
The system is divided into three main parts: the client presentation layer, the geographic information service layer, and the geographic data layer. Among them, the geographic data layer serves as the geographic data source of the entire system, including a general relational database storing some geographical data, a spatial database accessed through a spatial database engine, map files, and tile map cache files.
The geographic information service layer includes map servers such as GeoServer, ArcGIS Server, SuperMap iServer, and Java web application servers such as Tomcat and JBoss. By receiving the REST request from the client, the service layer can provide the client with GIS data resources, including map data such as map image layers and vector layers, and custom GIS data of the monitoring point locations. In addition, the map server is compatible with Open Geospatial Consortium (OGC) web service requests, such as Web Map Service (WMS), Web Feature Service (WFS), and Web Map Tile Service (WMTS).
The client presentation layer can initiate REST service requests to the service layer to request relevant geographic data and can use the underlying graphical engine to render the acquired data on a 3D globe. This achieves basic digital Earth navigation operations, such as changing the viewing angle height and inclination.
To illustrate, consider the SuperMap map server iServer. The client requests the map resource from the server through a HTTP GET request. The request URI is as follows:
GET <URI>/iserver/services/map-tianditu/rest/maps/image/tileImage.png? scale=0.000000016761&x=7&y=1&width=256&height=256
After the map server responds to the request, the map resource is returned as shown in Figure 12.
After receiving the image, the client renders the image on the 3D sphere and continues to request other map image layers and data according to the current viewing angle range, and renders them in blocks.

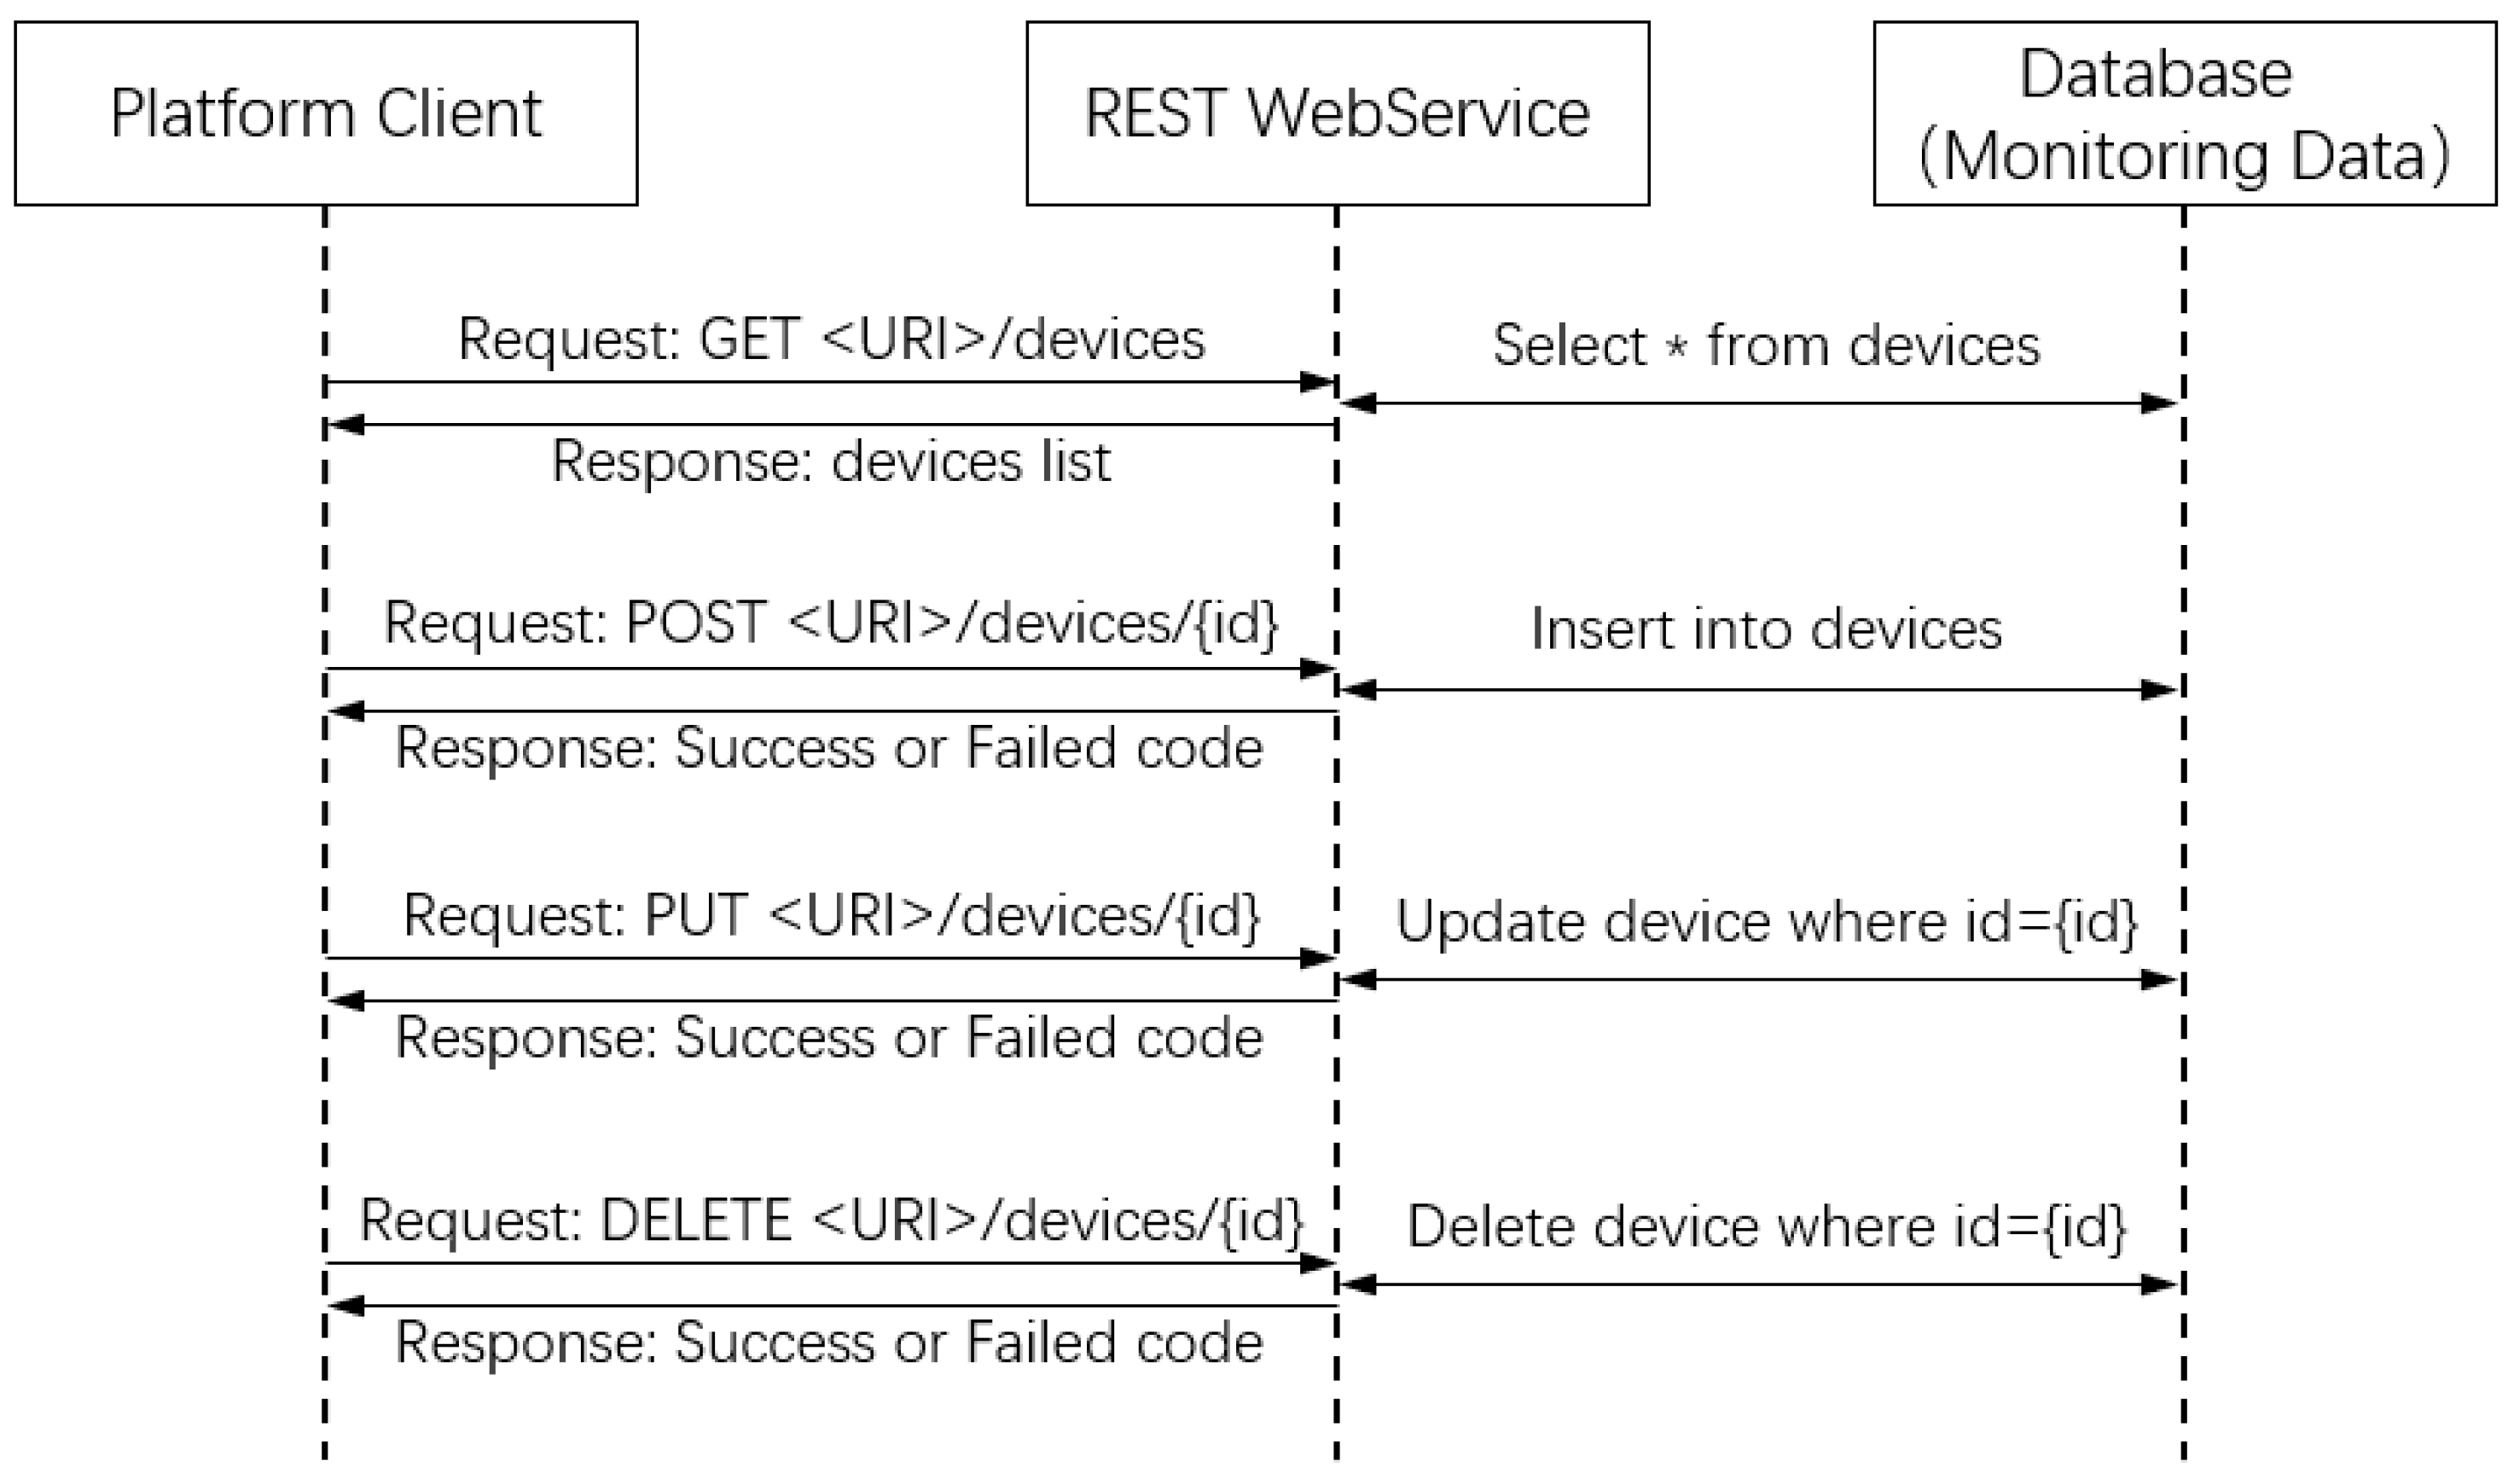
4.2.2. Monitoring Data Integration

Disaster monitoring data are stored in the database and published by the business logic layer. The publishing rules follow REST style specifications. Compared with traditional SOAP web services (that request callers and servers be closely coupled), REST is designed for resource interfaces and adopts HTTP as a unified interface. It has good scalability and extensibility, and it is more convenient for clients to integrate monitoring data.
On the server side, the business logic layer provides corresponding URIs and allowed HTTP operations (i.e., designed as RESTful APIs) for monitoring data operations. The client requests data services through URIs and HTTP methods to operate the corresponding monitoring data. The main operations include data query (GET), new (POST), update (PUT), and delete (Delete), and the corresponding database operation is Select, Create, Update, and Delete. Figure 13 shows the mapping relationship between URI requests and database operations. For example, to obtain the monitor device list, execute GET <URI>/devices. After the business logic layer parses the URI, it retrieves the device list in the database devices table through the Select method and returns it to the client. When adding a device through the client, the POST <URI>/devices/{id} request is appended, along with the description of the fields required to describe the device. The service program inserts the new device data into the devices table using the Insert method. Similarly, PUT and DELETE requests are used when modifying and deleting devices, and the device id parameters is used to operate the database through the Update and Delete methods.
After the client obtains the returned JSON data, the data are parsed, judged, and superimposed on the 3D GIS platform by latitude and longitude information according to the data type. The layered control of the program realizes the fusion display of related monitoring data and the 3D Earth platform.

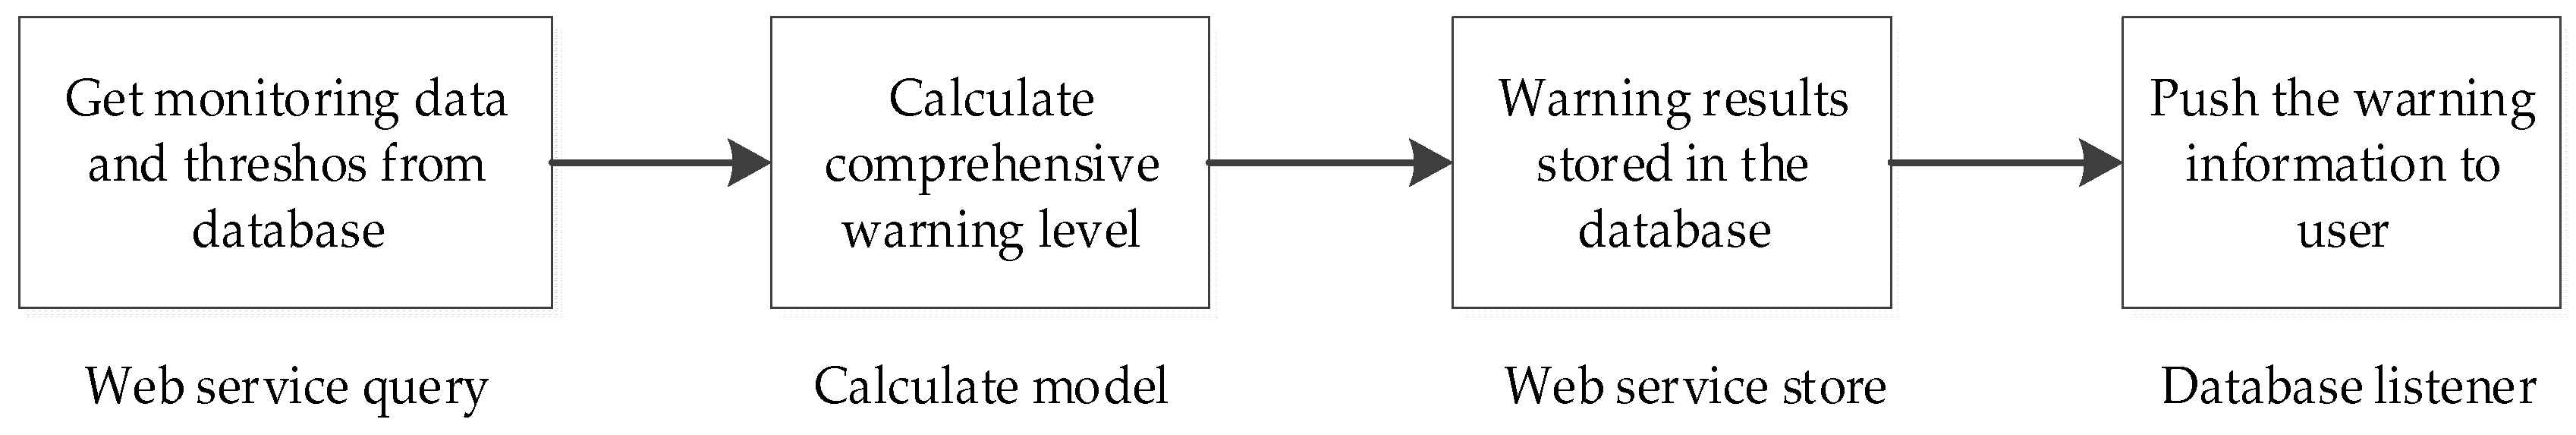
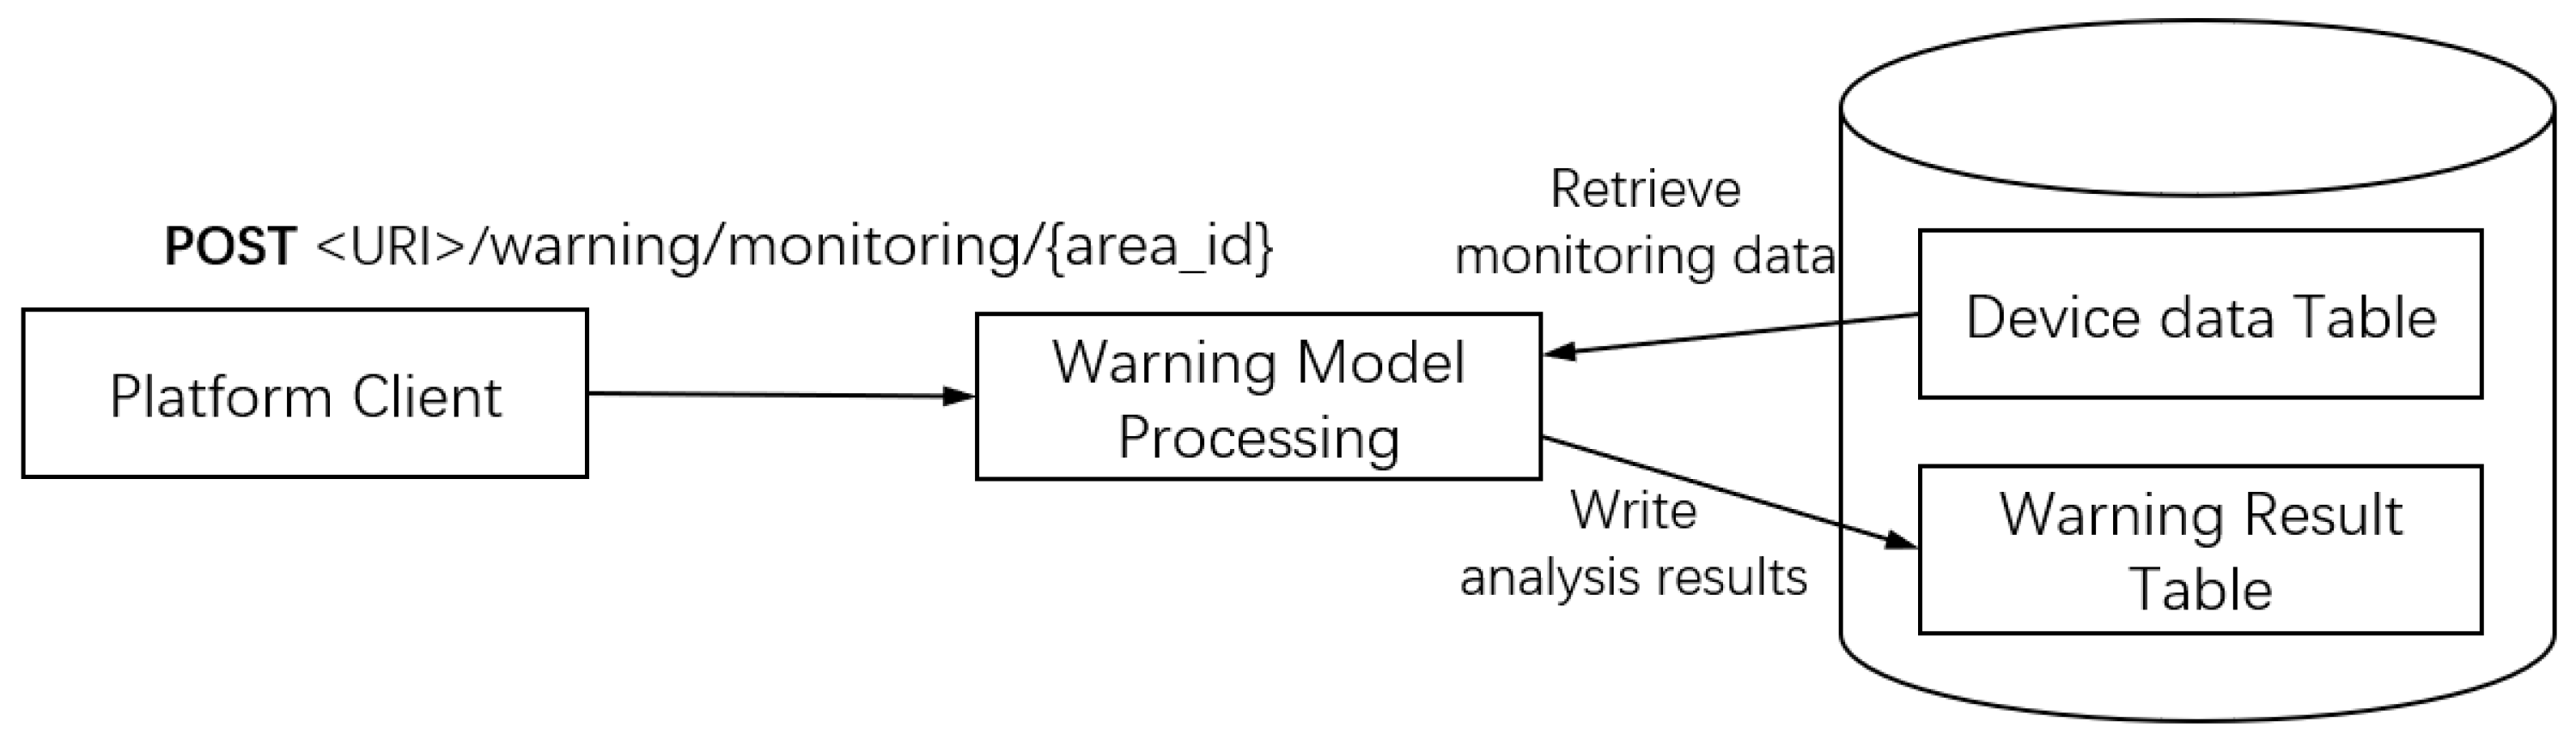
4.2.3. Warning Model Service Integration

The call of the warning model is invoked in the system through either active or timed triggers, and the calculation results of the warning model will be stored in the database. The timed mode is triggered by the background timing task (set by the administrator), and the execution result will be stored in the database alarm table.
In the active call mode, the client actively initiates a POST request <URI>/warning/monitoring/{areaid} to perform a warning calculation for a designated disaster monitoring area (monitoring area id={area_id}). After receiving the request, the server-side warning model queries the sensor monitoring data deployed in the database through the area_id. After the comprehensive operation is completed, the warning model writes the analysis result into the database table. The calling process is as shown in Figure 14.
The main storage fields of the warning analysis results are shown in Table 3.
The query of the warning result is initiated by the client’s GET request, and the query is returned by the business logic level, where:
(1) GET <URI>/warning/monitoring/{area_id}/{date}
This is used for the client to actively initiate the query for all the warning information at a specified monitoring point within a certain period of time; areaid represents the id of the monitoring point, date has the format of “startdate-enddate,” startdate and enddate represent the respective start and end dates of the query, and when date is empty, all the warning information of the monitoring point is queried.
(2) GET <URI>/warning/monitoring
This is used to query all unprocessed warning information. The client can initiate the query actively or regularly and display the unprocessed pretension information (the field isdisposed=‘N’). The processed warning information is modified by the client issuing the PUT request warning/monitoring/{id}/{isdisposed}.

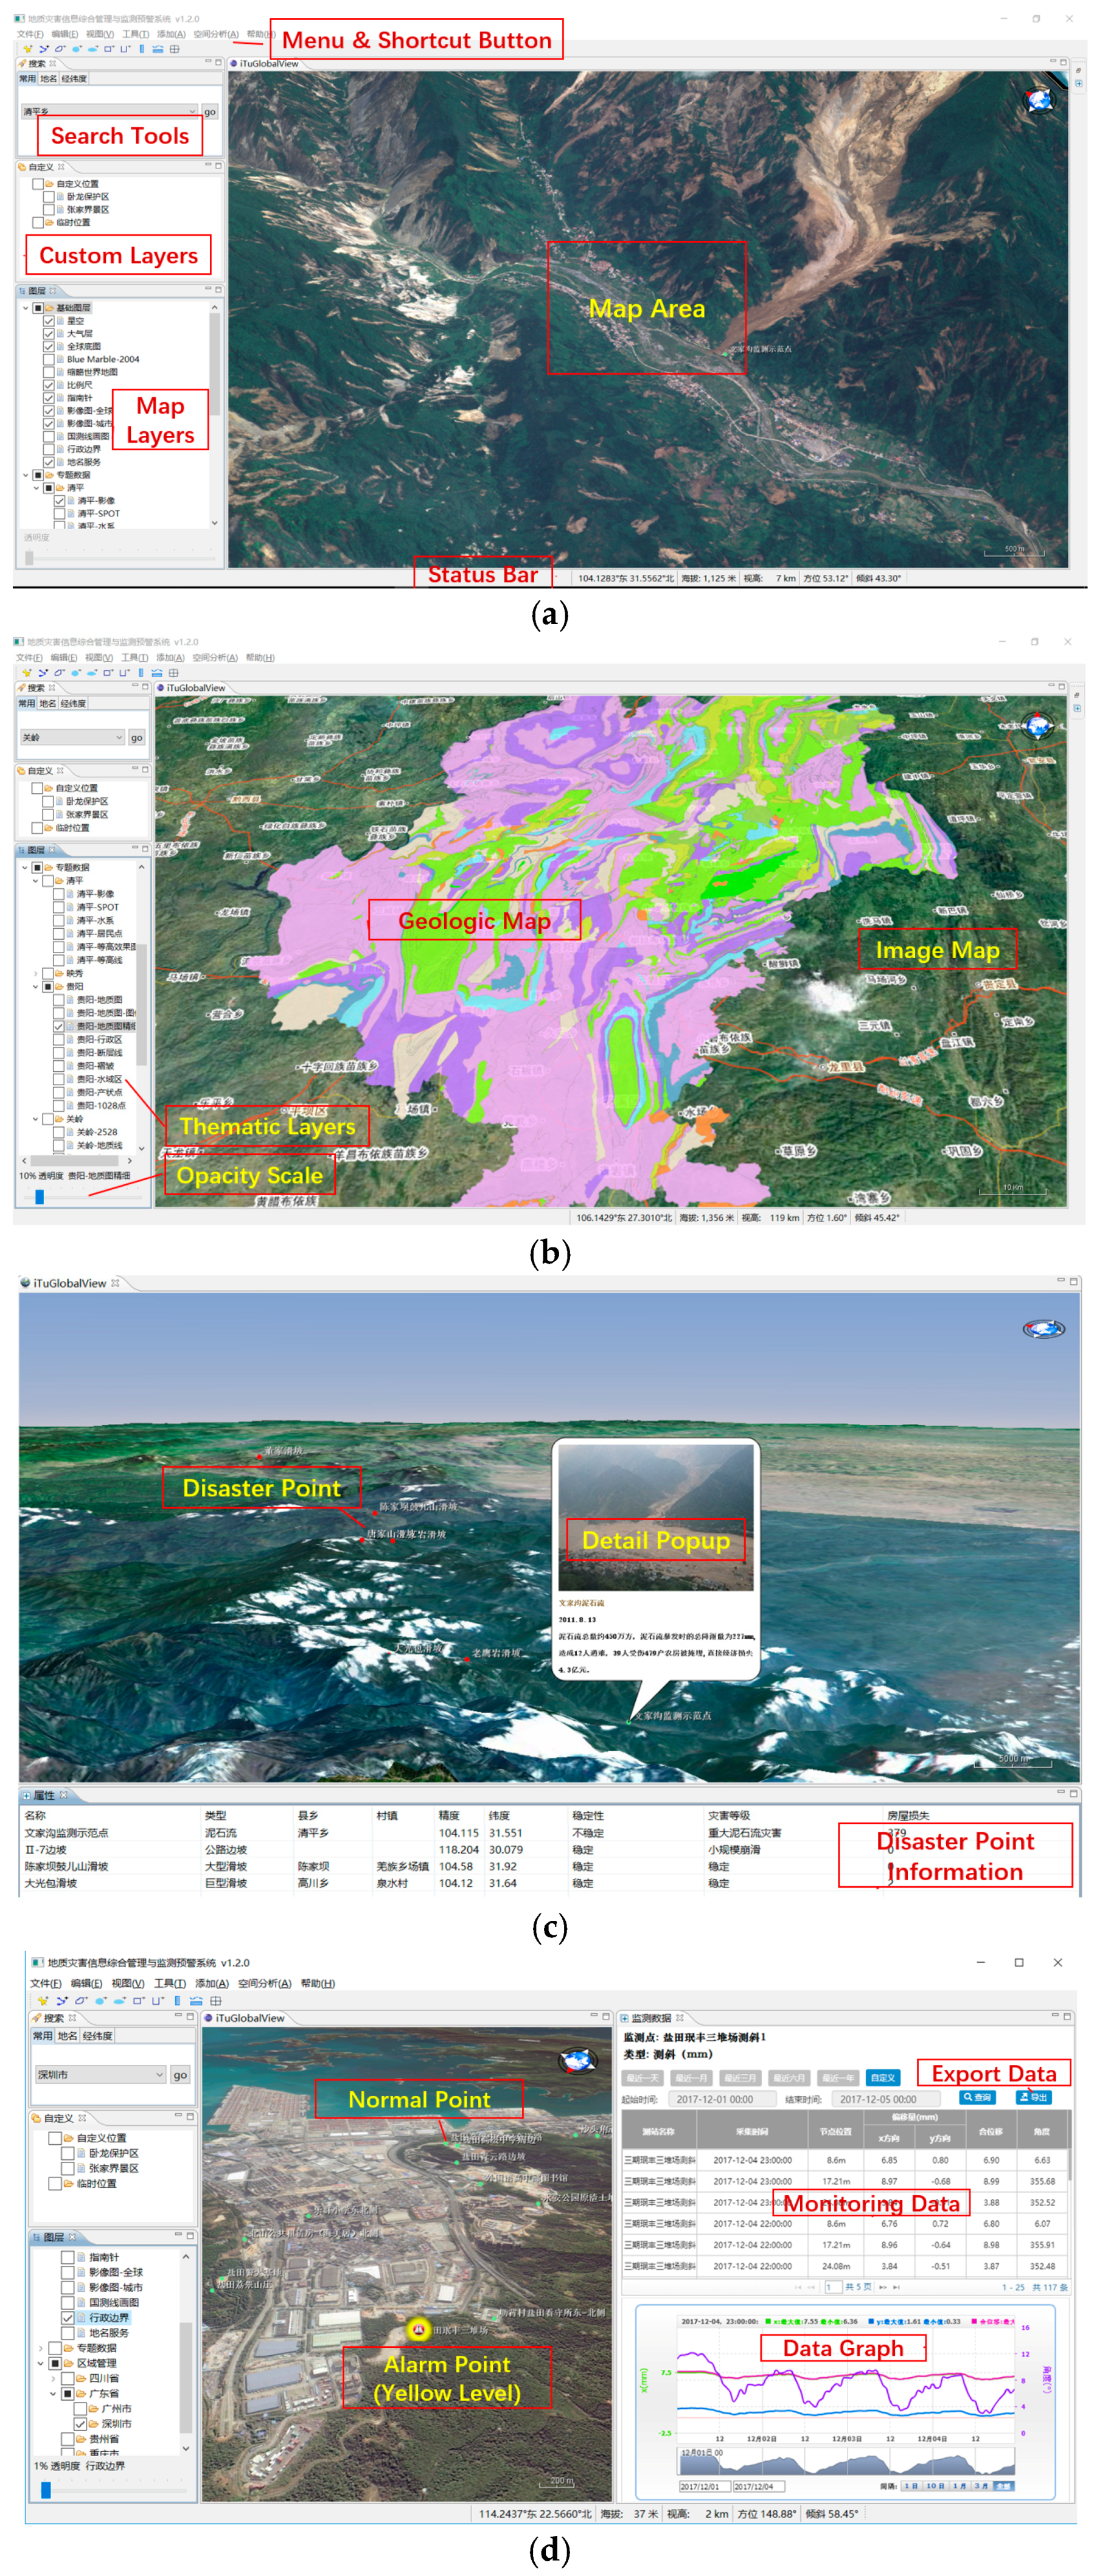
5. Platform Application

The platform is based on Java RCP and JOGL technologies and combines a three-dimensional GIS engine. It integrates geographic information, data monitoring, and warning model services using REST-style web services. This platform can perform the loading of vector and raster map data, as well as thematic data, and can monitor data access display and the model warning display function. Due to the adoption of RESTful services, the system has strong flexibility and compatibility and can access a variety of business services. At present, the overall operation of the system is in good condition, and the loading and display of three-dimensional geographic information and monitoring and warning data services are well implemented, which can provide good auxiliary decision-making functions for disaster prevention and control work.
The operating results of the platform are shown in Figure 15 following REST-style service integration. The platform can access terrain data services and images, vector data layers, and thematic layers. The display effect is presented based on 3D visualization, and can control the overlay and display of the layers. For example, in panel (a), Qingping Township’s high-definition image layers and 30-m DEM data are loaded to visualize real-world terrain effects. Panel (b) loads the geological map thematic layer based on the low-resolution image base map and can dynamically control the layer transparency. Based on the related functions of accessing geographic information layers, the platform integrates REST services for monitoring point information and monitoring and warning data. Panel (c) loads relevant 3D layer information to facilitate location-based disaster point information management, and panel (d) responds to the warning service and marks the highlights of the slopes in Shenzhen. The real-time monitoring data can be loaded to facilitate the evaluation of the monitoring points. In addition, the graphical presentation is intuitive for a user to visualize the development of the monitored target, and the platform can also export monitoring data into Excel file to facilitate analysis and evaluation.
As shown above, the platform already has rich functionality. Based on the compatibility of current design, in the future it may be possible to further integrate deeper business needs. According to the development of current disaster information management and applications, future expansions may be possible:
(1)
The platform can load Building Information Modeling (BIM) to realize 3D visualization and information management of surface building, and match the terrain data to assist in the assessment of emergency rescue and disaster damage.
(2)
Based on the local calculation ability, the platform can add drilling data to construct a 3D geological body model, which will have more intuitive and more accurate expression than traditional planar exploration maps and can be further extended to construct a 3D model of underground space and assist in engineering analysis and decision making.
(3)
The platform can add the function of remote sensing image interpretation, divide the danger zones, and realize regional risk assessment based on rainfall forecast data. In this way, the point and plane warning of disaster monitoring can be combined to enhance the practicability of the warning.

6. Conclusions

The REST architecture takes resources as the core idea and unifies the specification of network service constraints so that developers do not need to be concerned about the service provider’s underlying architecture or the differences between the interfaces and methods of different services. By using only URIs, the developer can obtain the corresponding services, making it easier to integrate access to multiple services such as geographic information, monitoring data, and warning services. With the client-based basic platform of 3D GIS, monitoring and warning can be intuitively presented in a three-dimensional perspective. Different from the traditional C/S or B/S architecture, a new method for the development and monitoring of geological disaster monitoring, and warning platforms is introduced. The practical application of the warning program also verifies the reliability and practicality of the design.

Author Contributions

Data curation, J.L.; Methodology, X.L.; Software, X.L., D.L., and Z.M.

Funding

This research was funded by the National Natural Science Foundation of China (NO.41501114), the General Project of Education Department in Sichuan Province (NO.16ZB0104), the Scientific Research Foundation of CUIT (NO.KYTZ201616), the Independent Project of the State Key Laboratory of Geohazard Prevention and Geoenvironment Protection (SKLGP2011Z003).

Conflicts of Interest

The authors declare no conflict of interest.

References

  1. Zhang, C.S.; Zhang, Y.C.; Hu, J.J.; Gao, Q.Z. Spatial and temporal distribution characteristics and forming conditions of Chinese geological disasters. Quat. Sci. 2000, 20, 559–566. (In Chinese) [Google Scholar]
  2. Yin, Y. Initial study on the hazard-relief strategy of geological hazard in China. Chin. J. Geol. Hazard Control 2004, 15, 1–8. (In Chinese) [Google Scholar]
  3. Yue, J.; Wang, B.; Liu, G.; Cai, H.C.; Zhou, Y.C.; Yu, G.W. Application study on early warning/forecast and information management system of geological disaster. J. Nat. Disasters 2008, 17, 60–63. (In Chinese) [Google Scholar]
  4. Dong, Y.; Zhang, S. Geological Disaster Monitoring and Early-warning Information Management System in Three Gorges Reservoir Area. Saf. Environ. Eng. 2008, 15, 6–9. (In Chinese) [Google Scholar]
  5. Wang, S.; Tang, C.; He, J.; Zhang, W.; Fang, Q.; Cheng, X. Use of unmanned aerial vehicle for precise investigation of geological hazard in strong seismic zone. J. Eng. Geol. 2016, 24, 713–719. (In Chinese) [Google Scholar]
  6. Zerger, A.; Smith, D.I. Impediments to using GIS for real-time disaster decision support. Comput. Environ. Urban Syst. 2003, 27, 123–141. [Google Scholar] [CrossRef]
  7. Zhu, S.Y.; Wang, B.J.; Shi, B.; Sun, Y. GIS based stability calculation and zoning of Majiagou landslide. J. Eng. Geol. 2014, 22, 1187–1193. (In Chinese) [Google Scholar]
  8. Huang, J.; Huang, R.; Ju, N.; Xu, Q.; He, C. 3D WebGIS-based platform for debris flow early warning: A case study. Eng. Geol. 2015, 197, 57–66. [Google Scholar] [CrossRef]
  9. Jiang, R.G.; Xie, J.C.; Li, J.-X. Research and application of 3D Early Warning Monitoring Platform for flood prevention. J. Hydraul. Eng. 2012, 134, 280–287. [Google Scholar]
  10. Jia, J.K.; MA, H.; Cai, X.W.; Chen, B.Q.; Shen, S.H. Geohazard Monitoring and Management System Based on IoT and 3D GIS. J. Yangtze River Sci. Res. Inst. 2016, 33, 142–144. [Google Scholar]
  11. Olyazadeh, R.; Aye, Z.C.; Jaboyedoff, M.; Derron, M.H. Prototype of an open-source web-GIS platform for rapid disaster impact assessment. Spat. Inf. Res. 2016, 24, 203–210. [Google Scholar] [CrossRef]
  12. Pautasso, C. RESTful Web service composition with BPEL for REST. Data Knowl. Eng. 2009, 68, 851–866. [Google Scholar] [CrossRef] [Green Version]
  13. Li, J.; Wu, Q. A Client Mashup Method for REST Geographic Service. J. Guizhou Univ. Nat. Sci. 2016, 33, 80–84. (In Chinese) [Google Scholar]
  14. Muracevic, D.; Kurtagic, H. Geospatial SOA using RESTful web services. In Proceedings of the ITI 2009 31st International Conference on Information Technology Interfaces, Dubrovnik, Croatia, 22–25 June 2009. [Google Scholar]
  15. Tang, R.; Bai, Y.; Wang, T. Research and Application of Risk Assessment in Urban Lifeline Systems Based on GIS and REST. In Proceedings of the 2010 Second World Congress on Software Engineering (WCSE), Wuhan, China, 19–20 December 2011; pp. 248–251. [Google Scholar]
  16. Li, J.G.; Tang, X.M.; Wang, H.B. Research and implementation of WebGIS Based on REST architecture. Sci. Surv. Mapp. 2011, 36, 85–87. (In Chinese) [Google Scholar]
  17. Yang, B.; Shi, W.; Li, Q. An integrated TIN and Grid method for constructing multi-resolution digital terrain models. Int. J. Geogr. Inf. Sci. 2005, 19, 1019–1038. [Google Scholar] [CrossRef]
  18. Axelsson, P. DEM Generation from Laser Scanner Data Using Adaptive TIN Models. Int. Arch. Photogramm. Remote Sens. 2000, 33, 110–117. [Google Scholar]
  19. Abdalla, R.; Tao, V. Applications of 3D Web-Based GIS in Earthquake Disaster Modeling and Visualization. J. Environ. Inform. 2004, 2, 814–817. [Google Scholar]
  20. Roy, D.C.; Coors, V. 3D Web-based GIS for Flood Visualization and Emergency Response. In Proceedings of the 73rd EAGE Conference and Exhibition Incorporating SPE EUROPEC 2011, Wien, Austria, 23 May 2011. [Google Scholar]
  21. Manchao, H.E. Real-time remote monitoring and forecasting system for geological disasters of landslides and its engineering application. Chin. J. Rock Mech. Eng. 2009, 28, 1081–1090. [Google Scholar]
  22. Zhang, Z.; Wang, S.; Wang, L. Principles of Engineering Geology Analysis; Geological Publishing House: Beijing, China, 1994. (In Chinese) [Google Scholar]
  23. Lin, X.; Guo, Y. A study on coupling relation between landslide and rainfall. J. Catastrophol. 2001, 16, 87–92. (In Chinese) [Google Scholar]
  24. Gaoshe, H.; Yuming, M.; Yuhai, L.; Shangqing, W. Study on prediction criterion of Xintan landslide. Chin. J. Geol. Hazard Control 1996, 7, 67–72. (In Chinese) [Google Scholar]
  25. Wu, F.; Wang, S. Application of Kalman filter method to Realtime deformation prediction on Lianziya dangerous rockbody. Chin. J. Geol. Hazard Control 1996, 7, 56–60. (In Chinese) [Google Scholar]
  26. Trilles, S.; Belmonte, O.; Díaz, L.; Huerta, J. Mobile Access to Sensor Networks by Using GIS Standards and RESTful Services. Sens. J. IEEE 2014, 14, 4143–4153. [Google Scholar] [CrossRef] [Green Version]
  27. Gou, L.; Zhu, M.; Li, Y. Study on web map tile service based on RESTful. Comput. Eng. Des. 2012, 33, 3609–3616. (In Chinese) [Google Scholar]
Figure 1. Platform infrastructure.
Ijgi 07 00226 g001
Figure 2. Platform design structure.
Ijgi 07 00226 g002
Figure 3. Vector data organization XML structure.
Ijgi 07 00226 g003
Figure 4. Sliced level relationship for Levels 0, 1, and 2.
Ijgi 07 00226 g004
Figure 5. Map slice coordinates.
Ijgi 07 00226 g005
Figure 6. Three-dimensional application model.
Ijgi 07 00226 g006
Figure 7. Remote monitoring application process.
Ijgi 07 00226 g007
Figure 8. Integrated warning model construction process.
Ijgi 07 00226 g008
Figure 9. Monitoring and warning process.
Ijgi 07 00226 g009
Figure 10. Representational state transfer (REST) application model in the design of this platform.
Ijgi 07 00226 g010
Figure 11. Geographic information service flow in this platform.
Ijgi 07 00226 g011
Figure 12. Map image data returned by REST request.
Ijgi 07 00226 g012
Figure 13. URI request and database operation mapping.
Ijgi 07 00226 g013
Figure 14. Alarm model call process.
Ijgi 07 00226 g014
Figure 15. Platform operation results, (a) Integrated loading of high-definition image layers and terrain data; Map Area is the main display area for a three-dimensional (3D) map, Search Tools can help users navigate quickly by place names or latitude and longitude, Map Layers can load or remove the map layers, Custom Layers can manage user-defined layers, and Status Bar can display the position parameters such as the latitude and longitude of the mouse, angle of view, azimuth, and inclination angle; (b) Integration and presentation of thematic layers; Thematic Layers can manage the geological map, river network map, contour map, and other thematic layers, all of which can be overlaid on the Image Map. Opacity Scale can adjust the transparency of the layer in order to present a better multi-layer fusion effect; (c) Location of disaster sites and basic information display; Disaster Point Information is displayed in the bottom table, and the Detail Popup window is triggered by clicking the disaster point, which contains the relevant pictures and the introduction of governance; (d) Access and monitoring data display of warning information; Normal Point is a green point that indicates the normal state on the map, Alarm Point will display the corresponding highlighted color according to the warning level, Data Graph area displays the data graphically, and the Export Data button can export the monitoring data to an Excel file.
Ijgi 07 00226 g015
Table 1. The hierarchical relationship between the Level and Degree and Tiles.
LevelDegreeTiles
Level 03650
Level 118200
Level 29800
.........
Level n36/2n50 × 4n
Table 2. Common monitoring methods in geological disaster warning.
Monitoring ContentMonitoring Method
Surface deformation monitoringGeodetic method
GPS method
Ground surface crack observation
Deep deformation monitoringDeep tilt monitoring
Slip surface displacement monitoring
Groundwater monitoringGroundwater level
Soil moisture content
Osmotic observation
Weather monitoringRainfall monitoring
Table 3. Warning result fields.
Field NameTypeDescription
IdInt(32)Warning information entry number
Warning_typeChar(1)Timed or active triggering
Warning_levelChar(1)Warning level 1–4
Warning_timeDatetimeWarning message creation time
area_idInt(32)ID of corresponding monitoring point
isdisposedChar(1)Has it been processed?

