A Formalized 3D Geovisualization Illustrated to Selectivity Purpose of Virtual 3D City Model


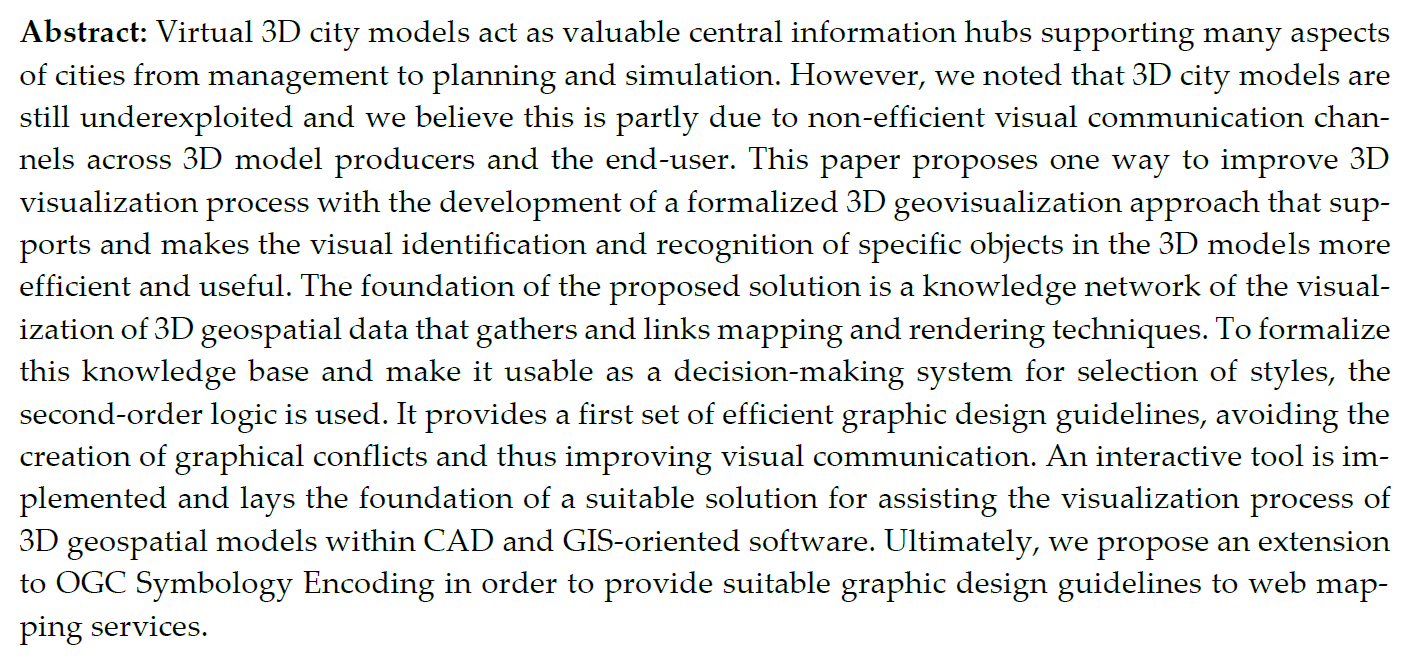
Abstract
:
1. Introduction
2. 3D Geovisualization of Virtual City Models
2.1. 3D Geovisualization
2.1.1. Definition
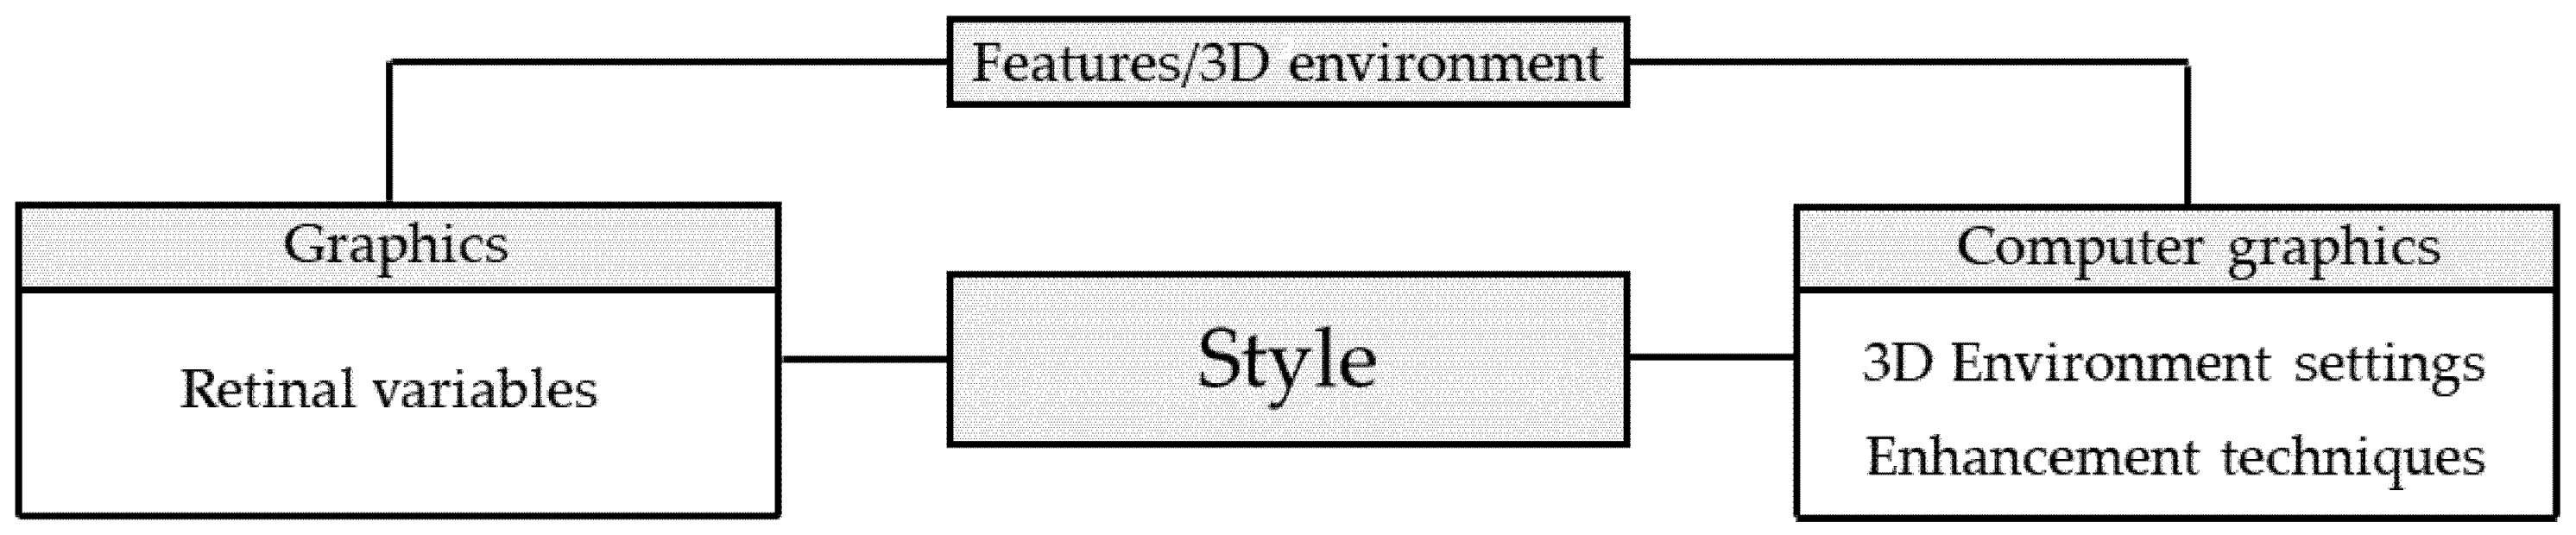
2.1.2. Graphics
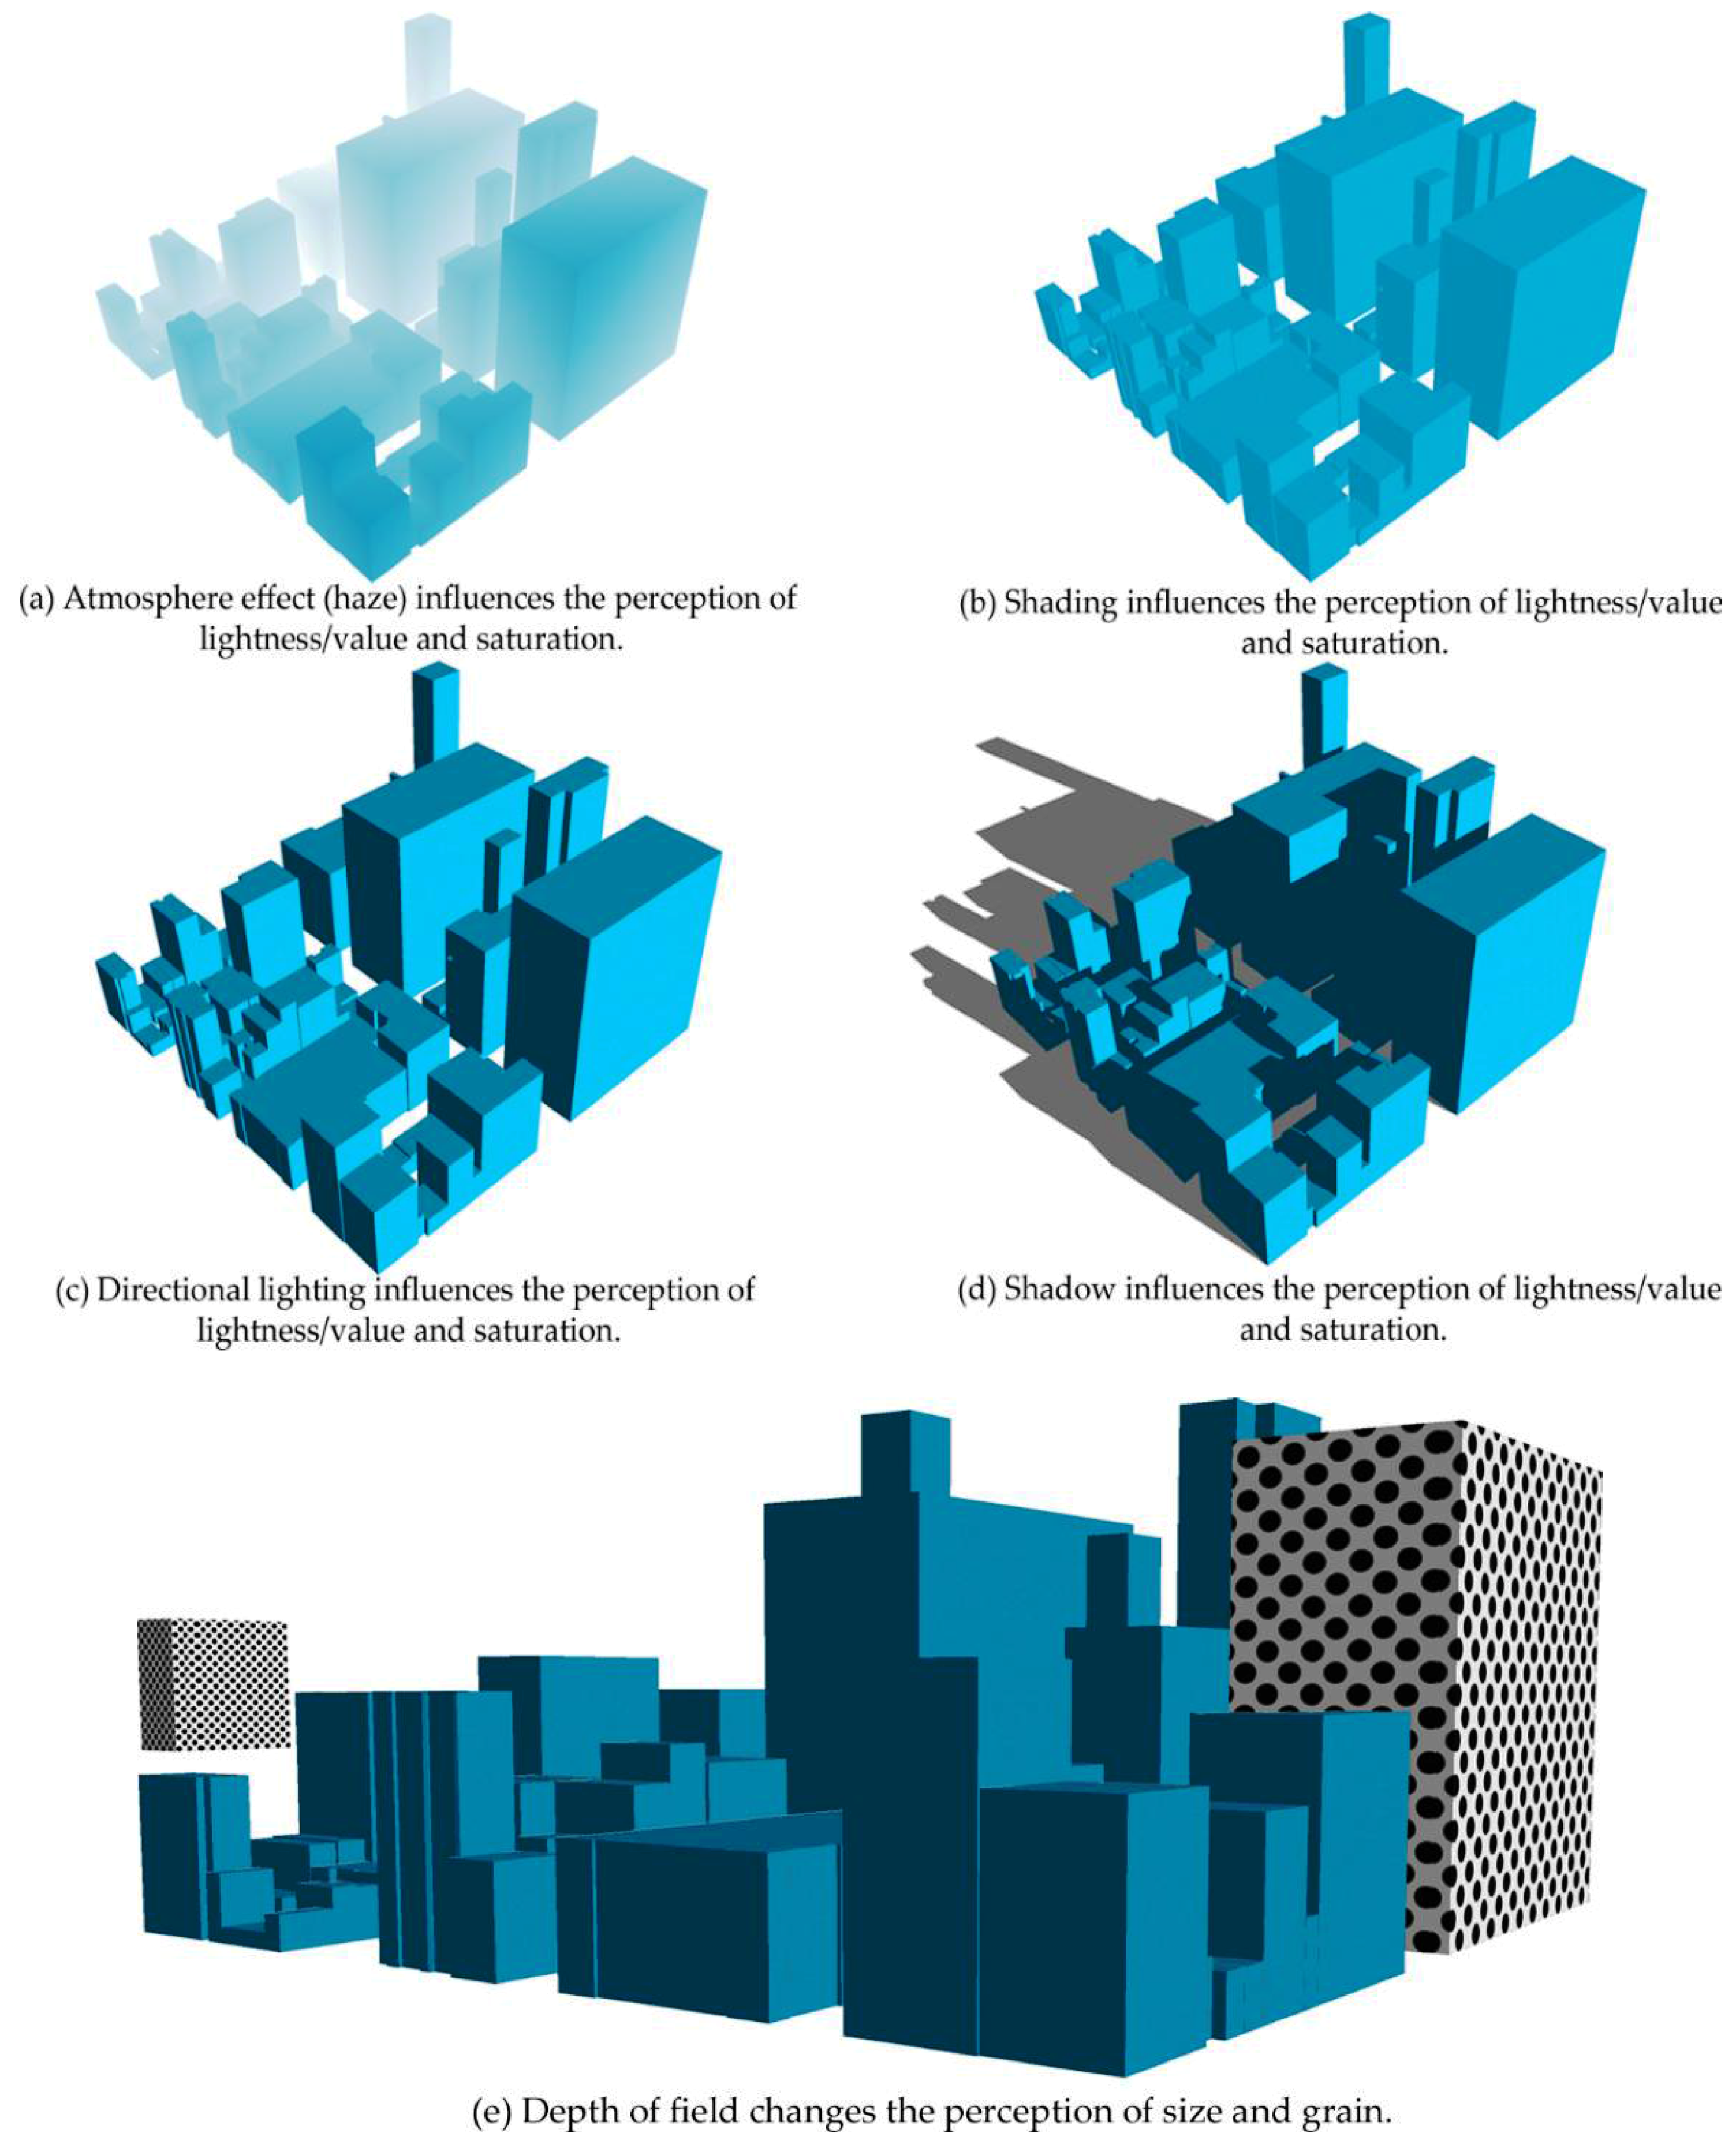
2.1.3. 3D Environment Settings
- Projection: parallel or perspective;
- Camera: position, orientation, and focal length;
- Lighting: direct, ambient, or artificial light;
- Shading;
- Shadow;
- Atmospheric effect.
2.1.4. Enhancement Techniques
2.2. Virtual 3D City Models
2.2.1. Definition and Benefits
- A higher cost for data acquisition due to the required higher quality of geometries and facade textures;
- A more difficult integration of thematic information owing to the visual predominance of textured facades, roofs, and road systems in the image space;
- A more complex visualization of multiple information layers on account of photorealistic details;
- A more complex display on lower-specification devices (e.g., mobile phones, tablets) that generally require a simplification and aggregation process to be efficiently visualized [56].
2.2.2. Semantic Driven Visualization
- The modelling of real-world phenomena, which can be carried out by different kinds of sensors: passive (photogrammetry), active (ground laser scanner, airborne LIDAR), or hybrid (imagery and laser range sensors, hybrid DSM, aerial image and 2D GIS) [70].
- The filtering stage to produce a primary landscape model where only the required information for further processing is selected.
- The mapping of the primary model to a cartographic model via symbolisation (i.e., the application of static retinal variables (e.g., hue, size, transparency) to selected objects).
- The rendering of the cartographic model; that is, the definition of 3D environment settings (e.g., projection, camera attributes, lighting, and atmospheric effects) and potentially the application of enhancement techniques.
- The perceptional aspects of the 3D graphic representation, such as the spatial and temporal coherence of mapping and rendering stages, as well as psychological and physiological cues. When used carefully, they facilitate the communication process [71].
3. Knowledge Network Configuration
3.1. Introduction
3.2. Mathematical Framework
3.2.1. Collections of Entities
3.2.2. Geometry-Related Functions
3.2.3. Geometry- and Attribute-Related Function
3.2.4. Attribute-Related Functions
3.3. Illustration with Static Retinal Variables and 3D Environment Parameters for Selectivity Purposes
3.3.1. Collection of Entities
3.3.2. Truth Values of Functions
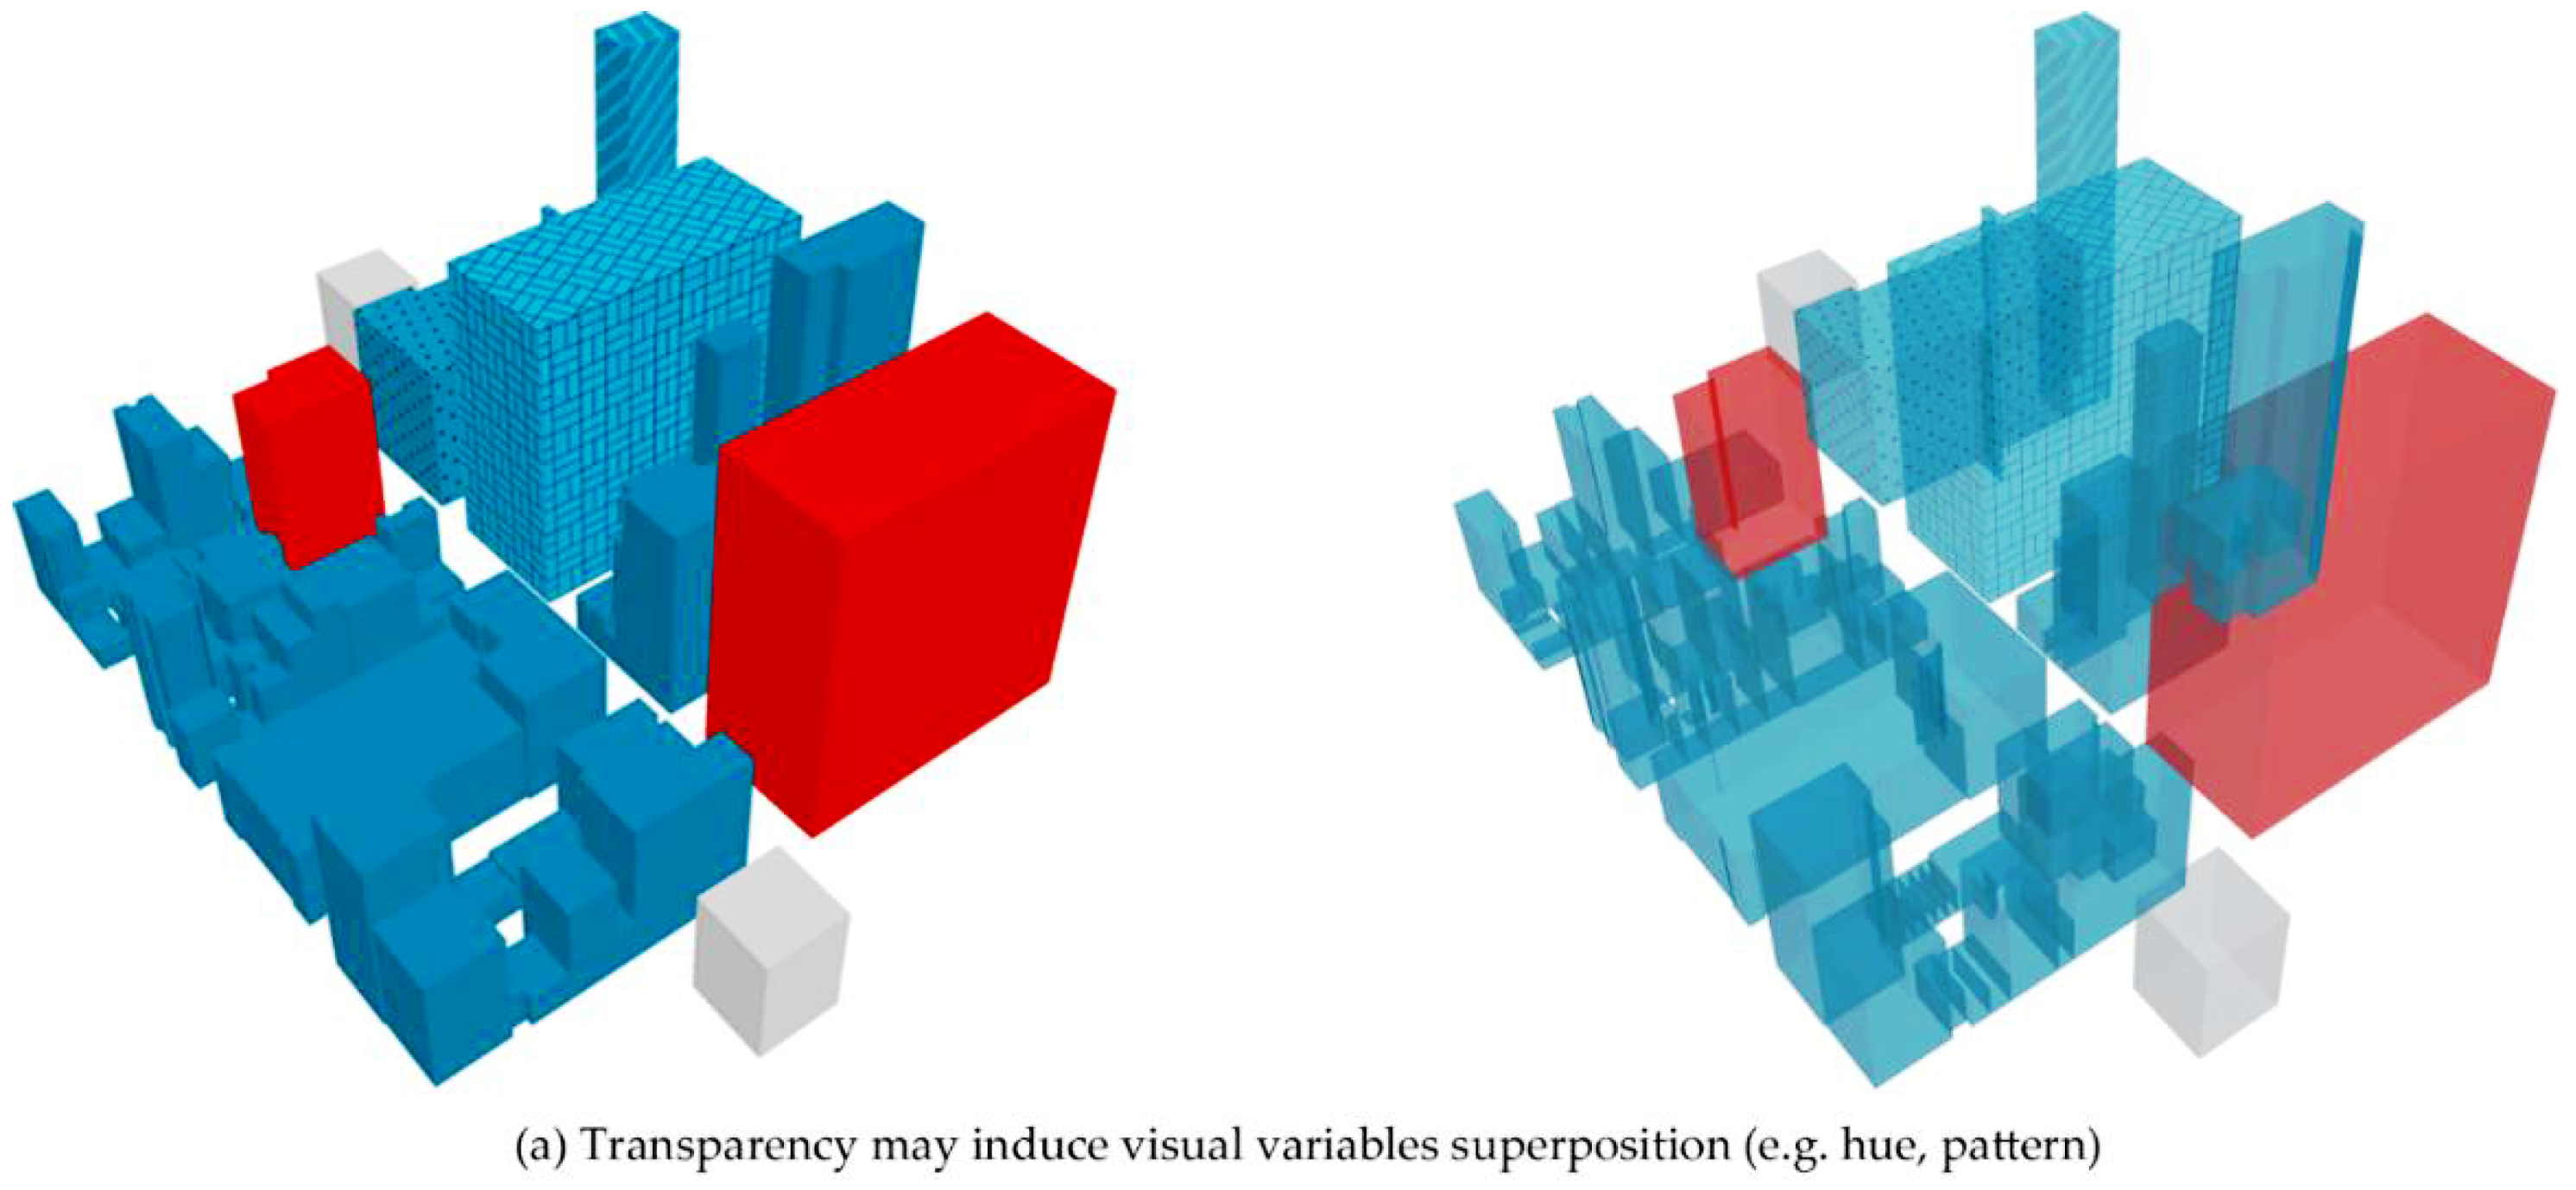
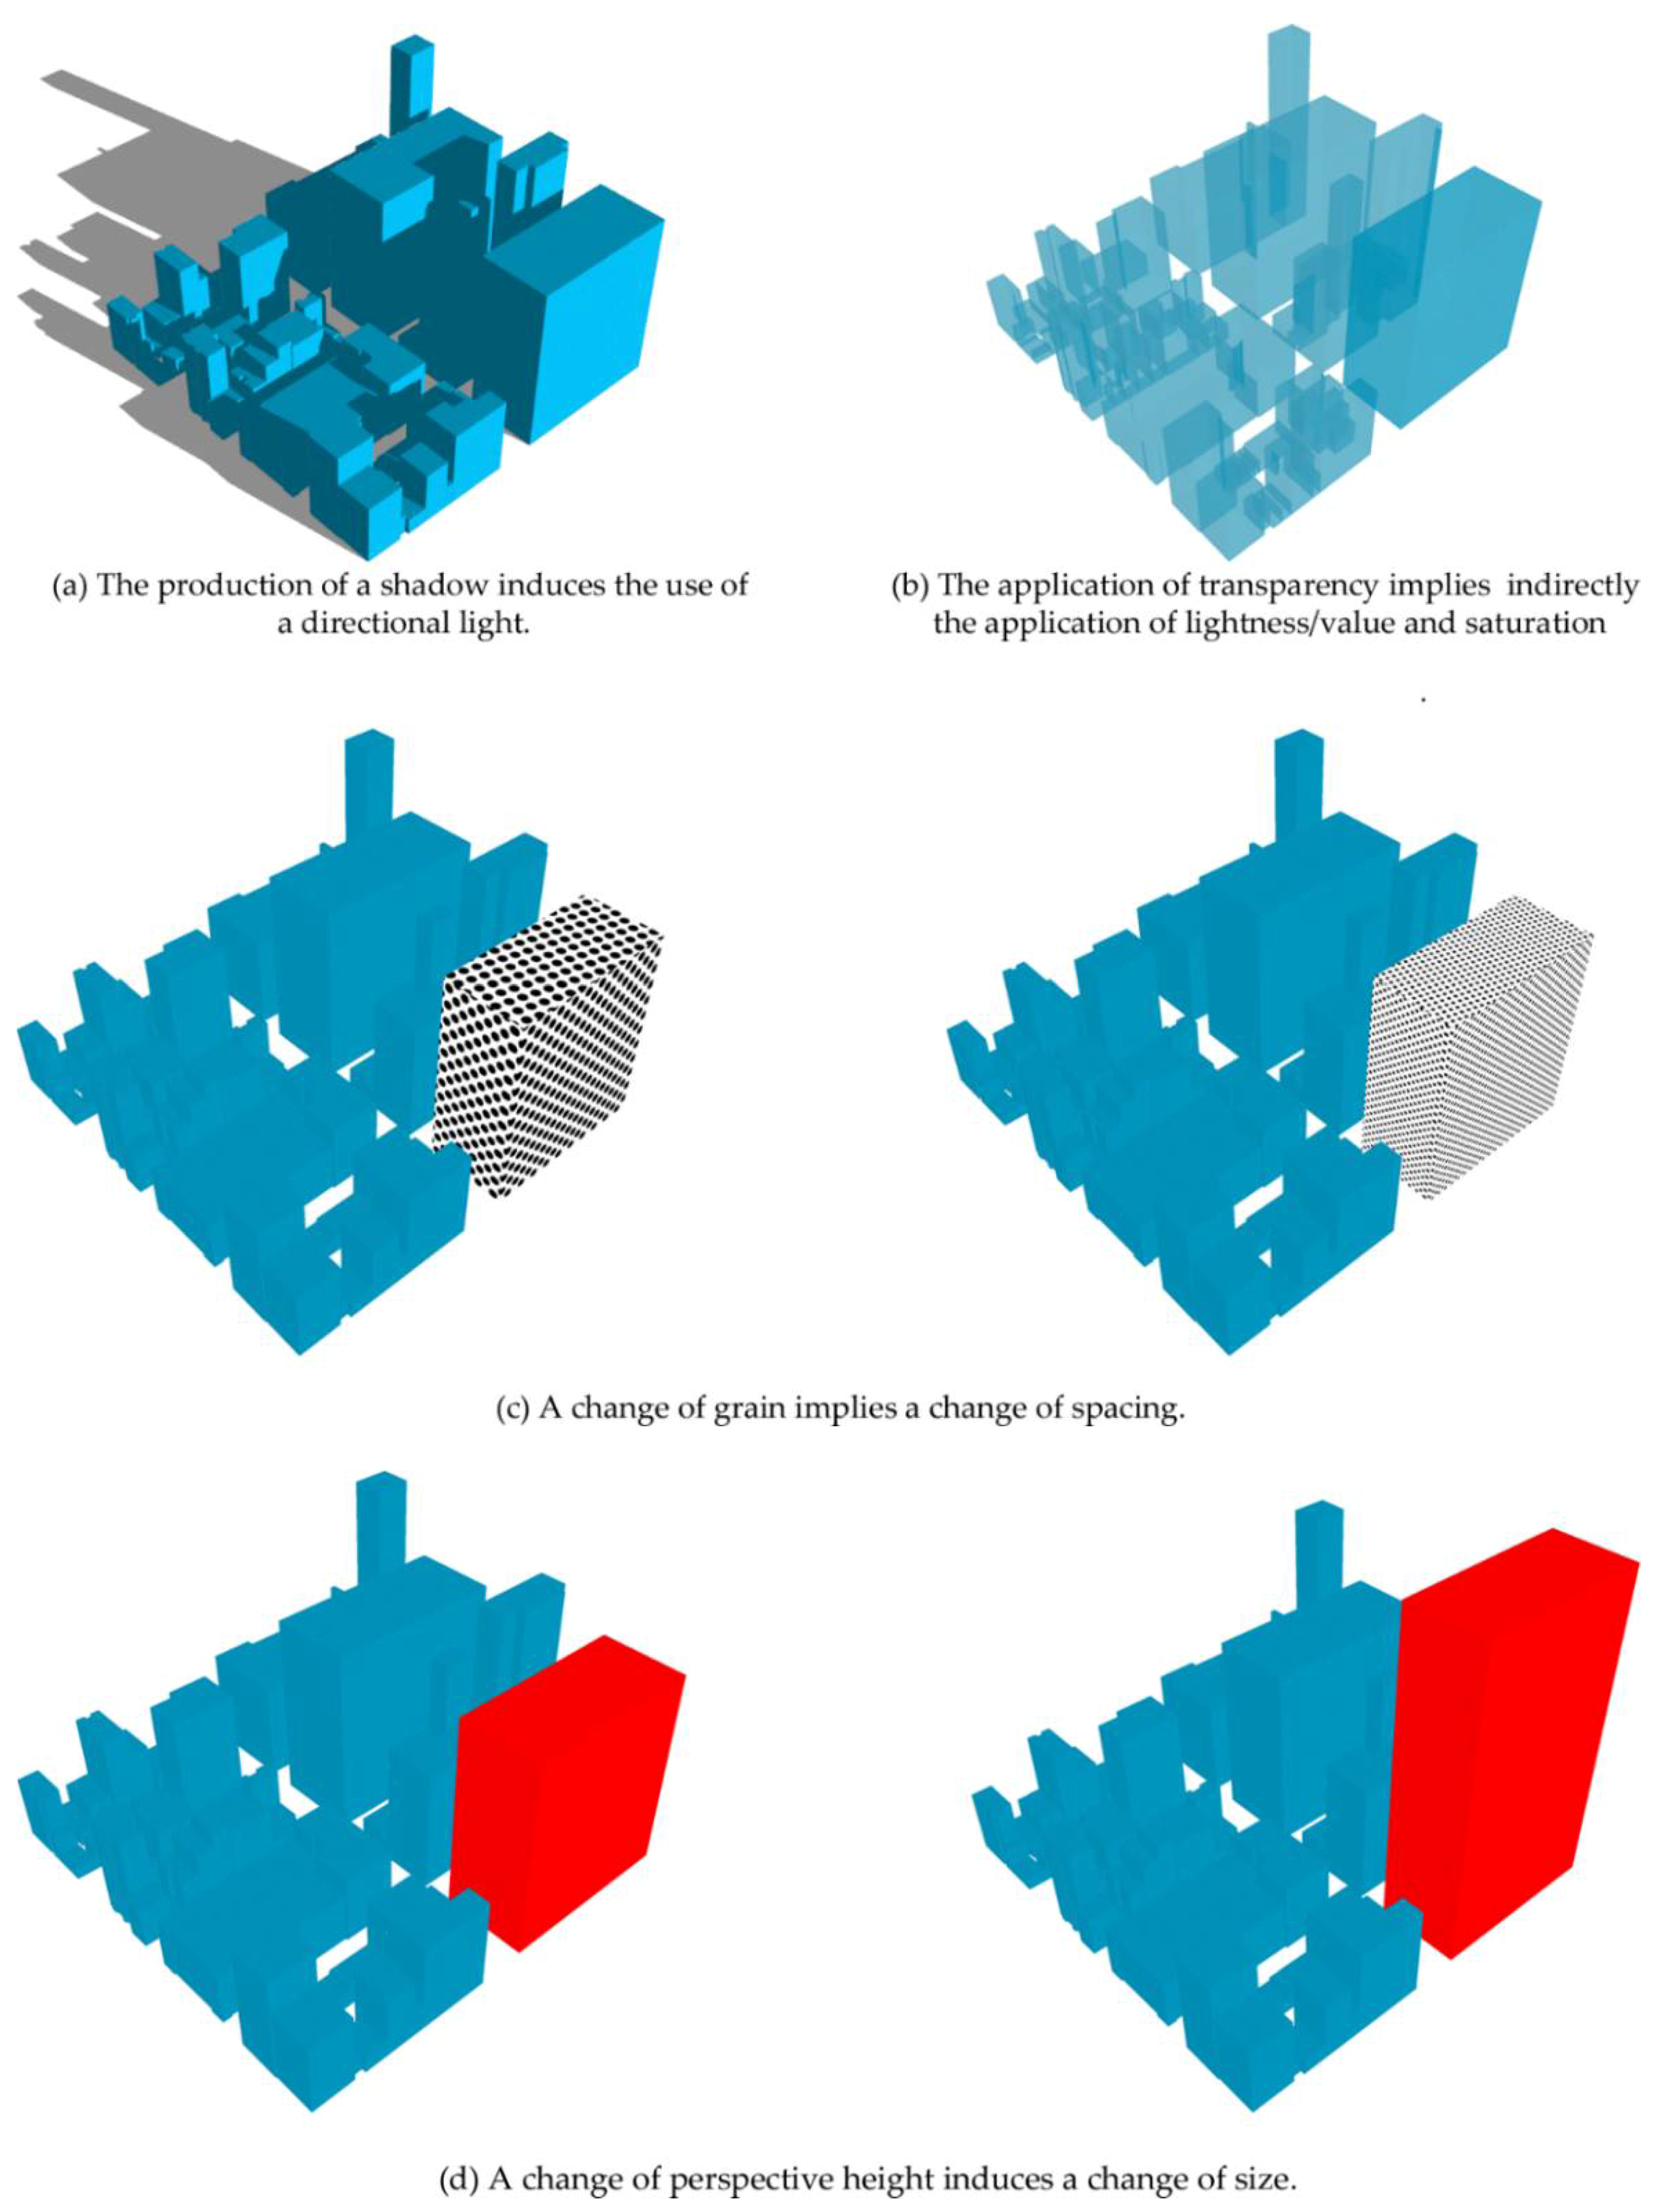
- the production of a shadow induces the use of a directional light (Figure 3a);
- the application of transparency indirectly implies the application of lightness/value and saturation (Figure 3b);
- the application of grain indirectly implies the application of spacing. In Figure 3c, two levels of grain are applied to the same building, which also implies a spacing variation between points.
- the application of perspective height indirectly induces the application of size. In Figure 3d, two different perspective heights are applied to the same red building, which also implies a size variation of this building.
4. Examples of Knowledge Network Application
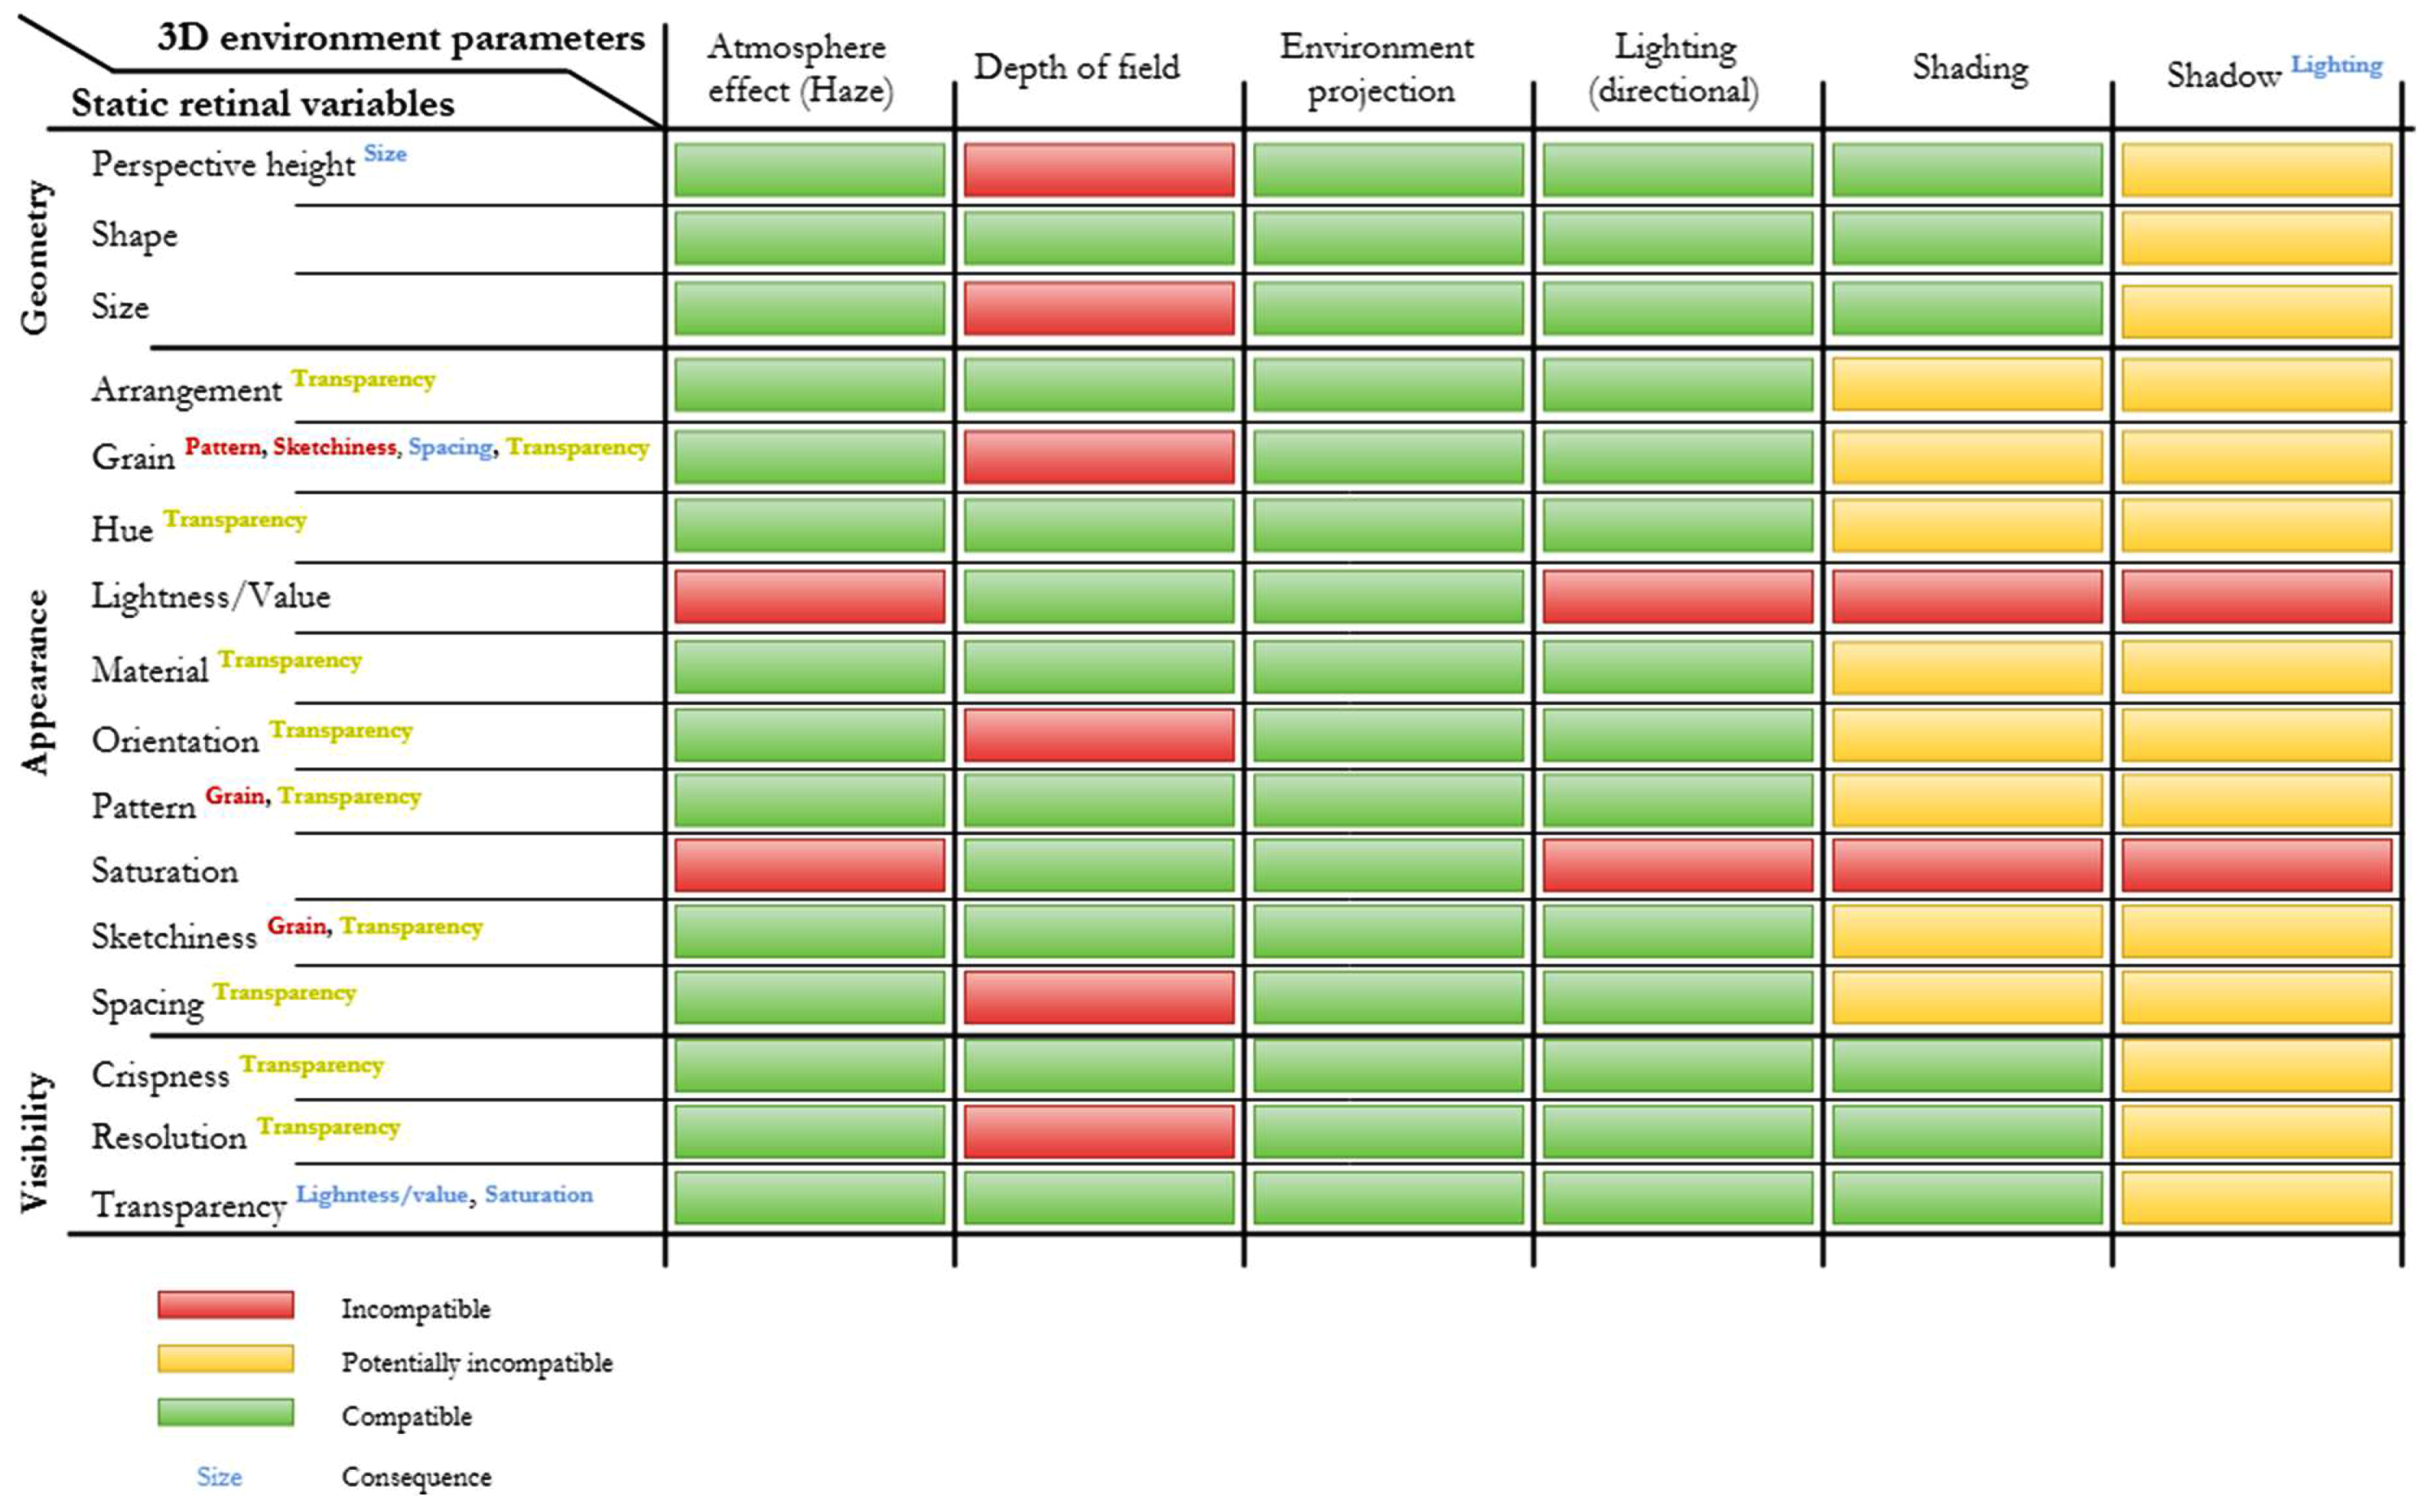
4.1. Application Chart
- Compatibility connection in green;
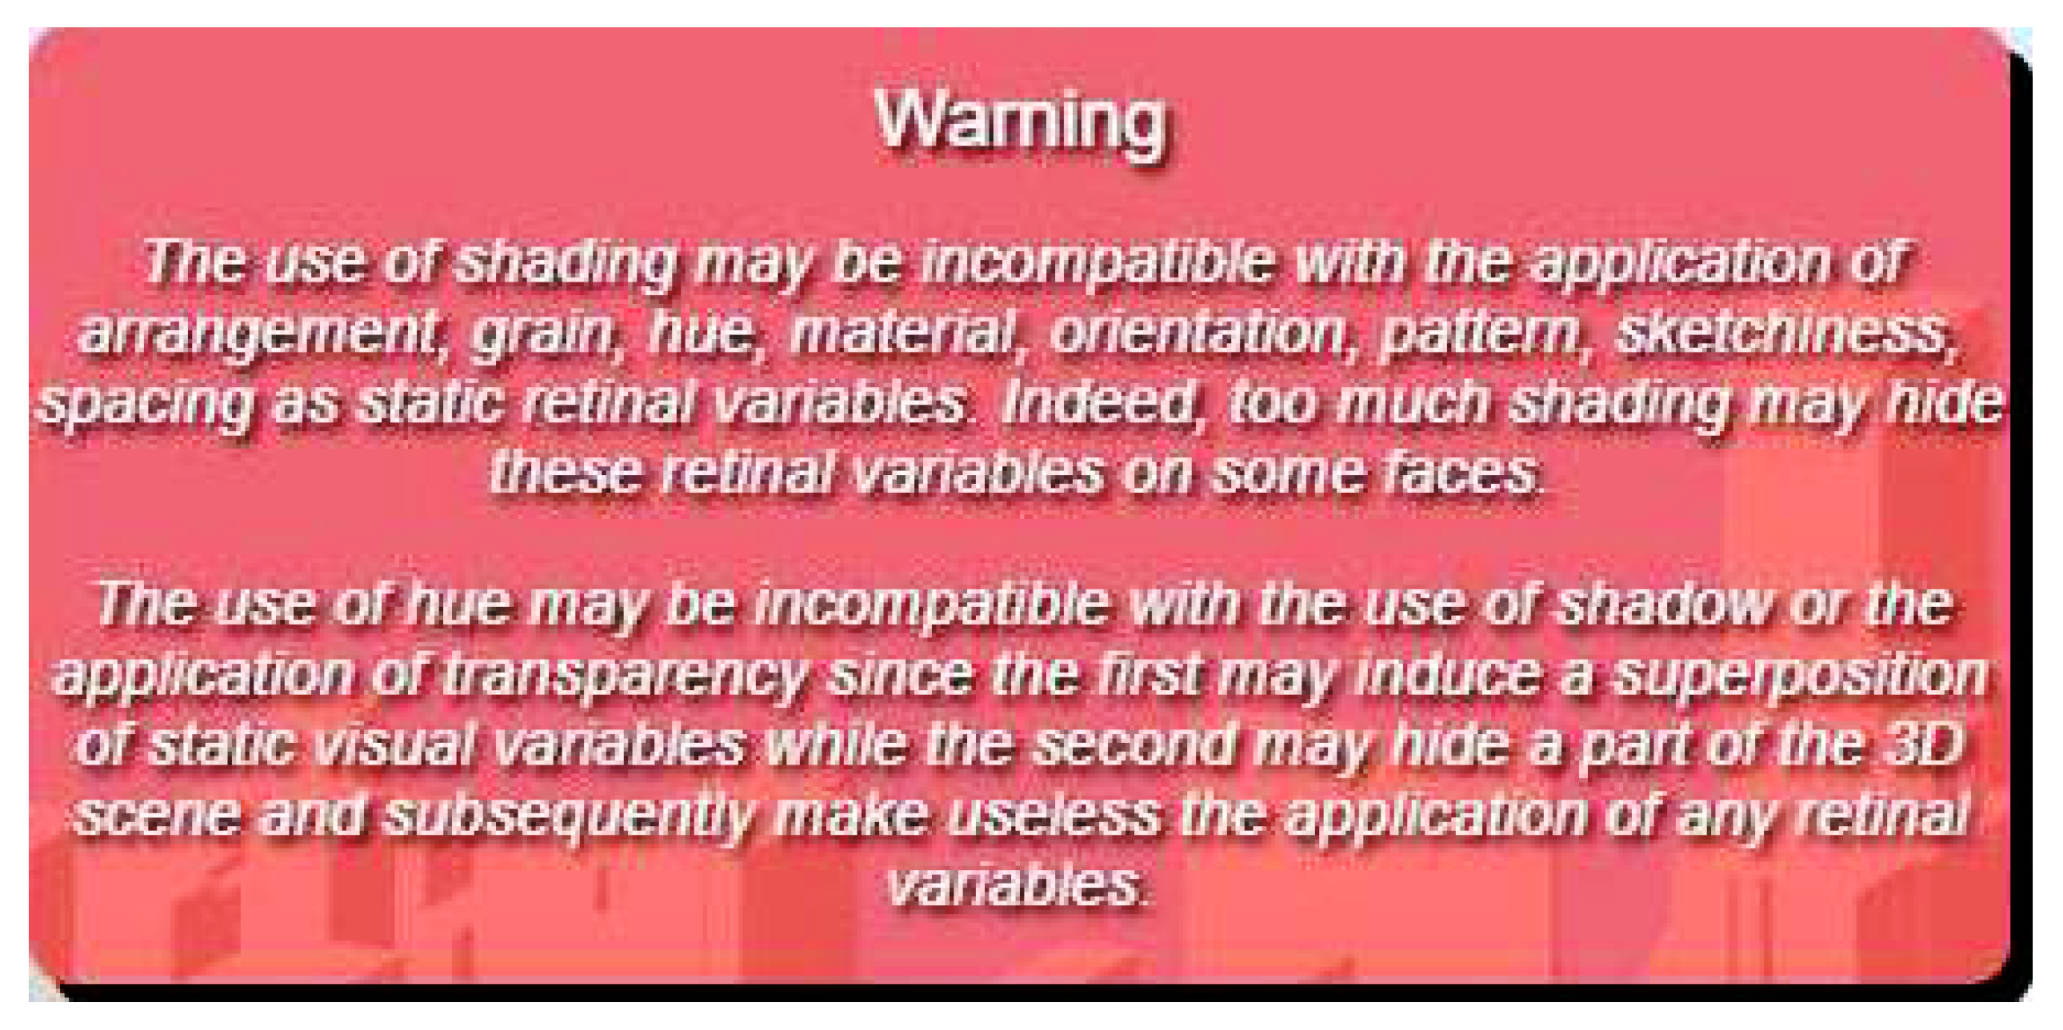
- Potential incompatibility connection in yellow; this refers to incompatibilities linked to the spatial distribution of 3D objects and/or the application level of static visual variables used simultaneously.
- Incompatibility connection in red;
- Consequence connection in blue.
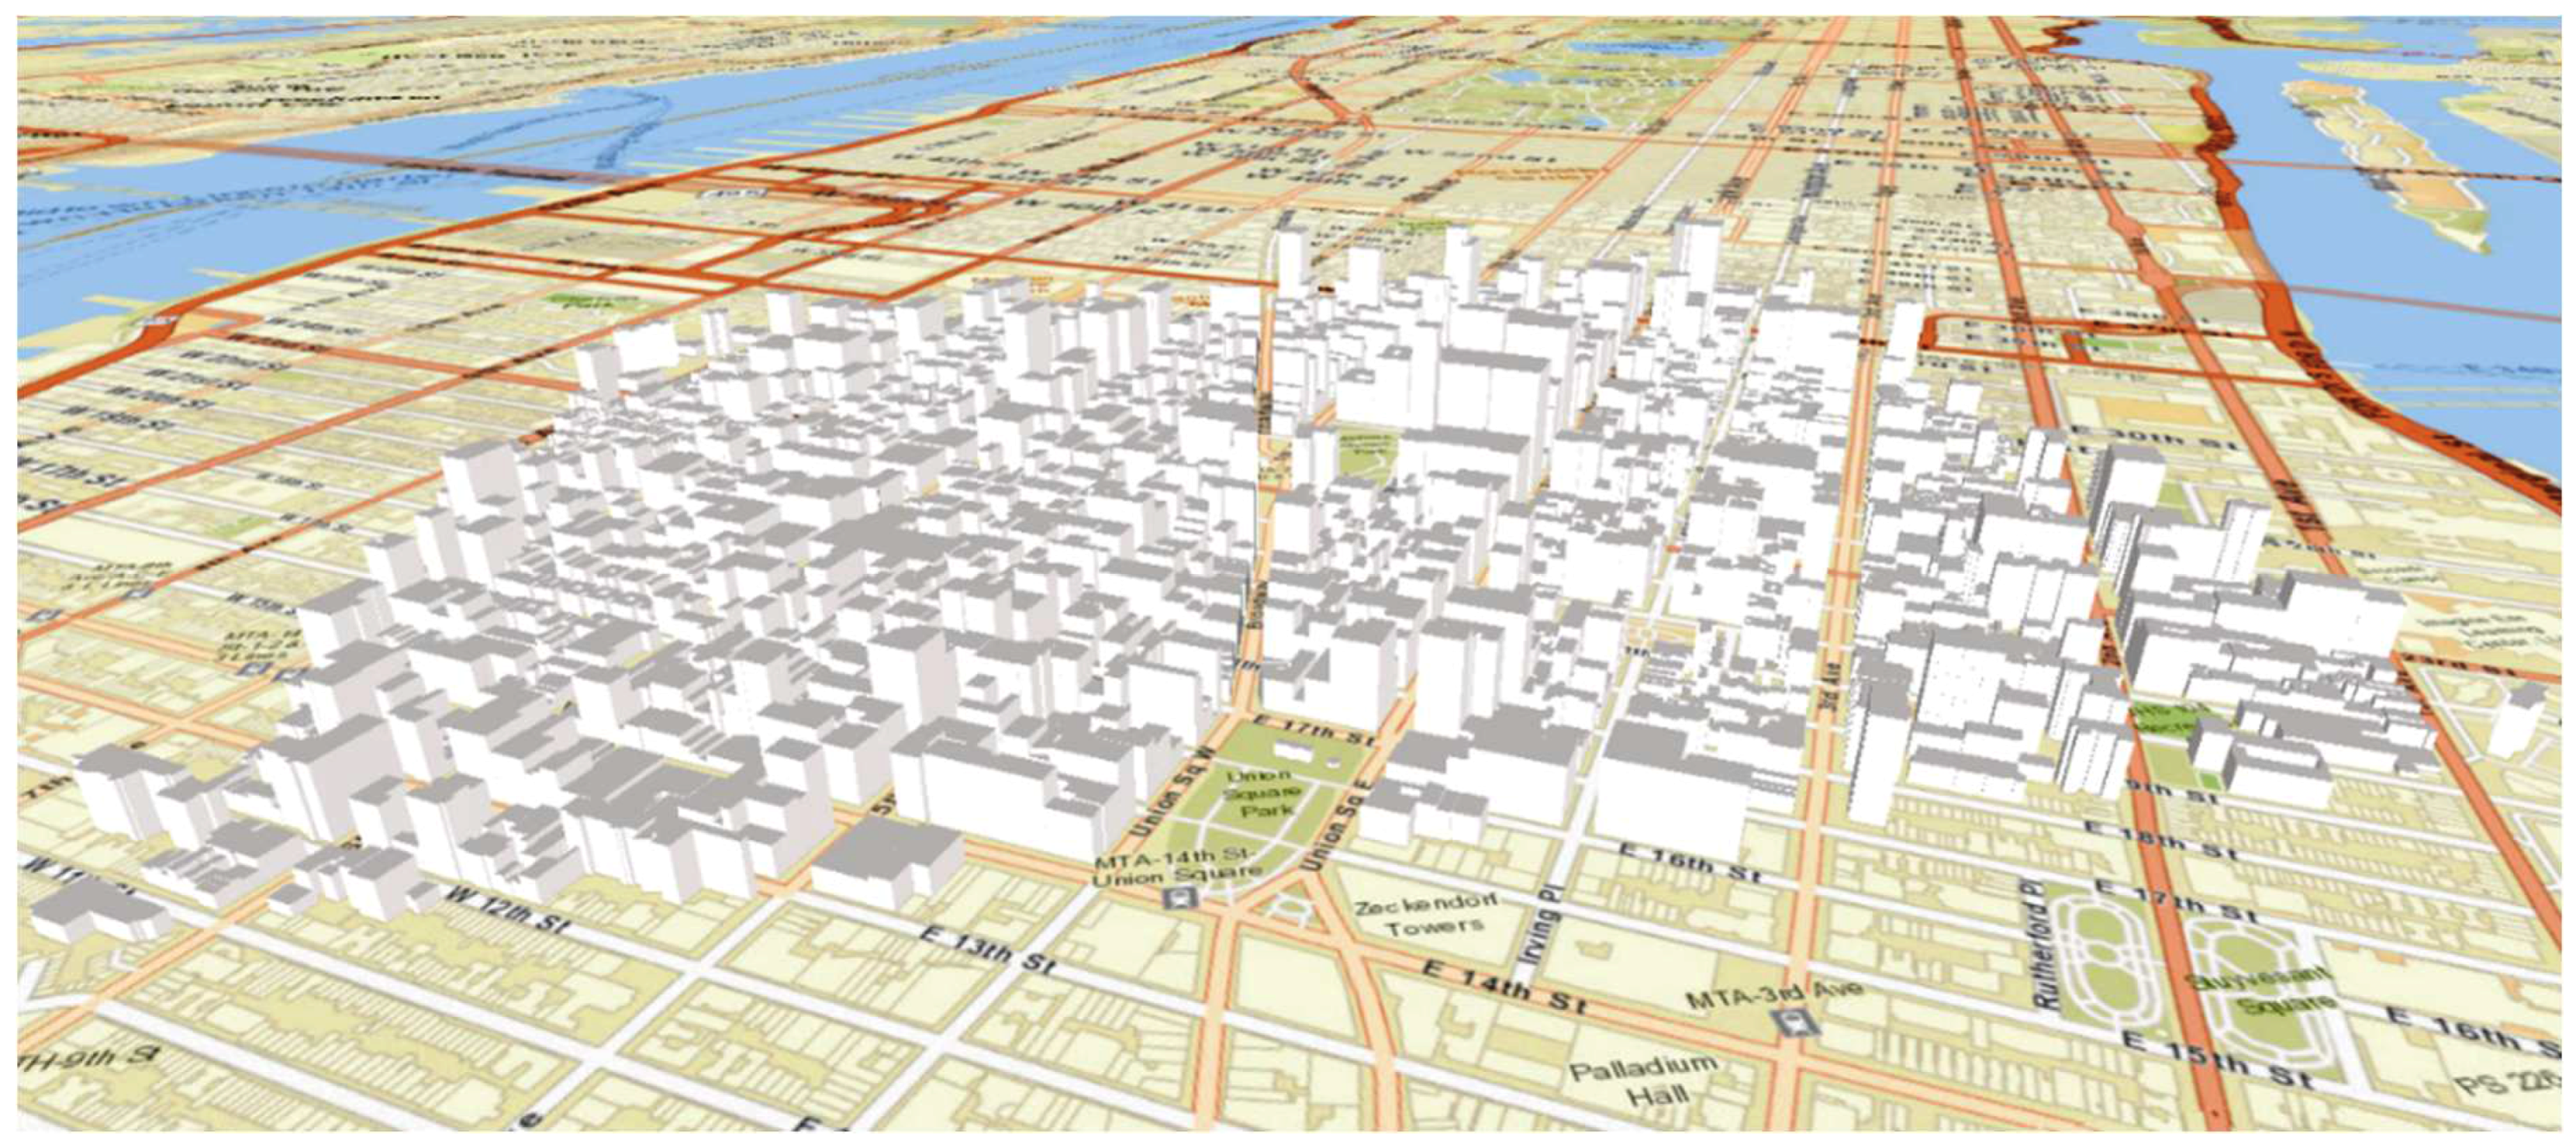
4.2. Dynamic WebGL Application
4.3. OGC Symbology Encoding Extension
<xsd:element name=”Suitability” type=”se:SuitabilityType”>
</xsd:element>
<xsd:complexType name=” SuitabilityType”>
<xsd:sequence>
     <xsd:element ref=”se:Name” minOccurs=”1”/>
     <xsd:element ref=”se:Description” minOccurs=”1”/>
     <xsd:element ref=”se:TargetedPurpose” minOccurs=”1” maxOccurs=”unbounded”/>
     <xsd:element ref=”se:Consequence” minOccurs=”0” maxOccurs=”unbounded”/>
     <xsd:element ref=”se:Incompatibility” minOccurs=”0” maxOccurs=”unbounded”/>
     <xsd:element ref=”se:PotentialIncompatibility” minOccurs=”0” maxOccurs=”unbounded”/>
</xsd:sequence>
</xsd:complexType>
<xsd:element name=” TargetedPurpose” type=”xsd:string”/>
<xsd:element name=”Consequence” type=”xsd:string”/>
<xsd:element name=”Incompatibility” type=”IncompatibilityType”>
</xsd:element>
<xsd:complexType name=“IncompatibilityType”>
     <xsd:simpleContent>
          <xsd:extension base=”xsd:string”>
               <xsd:attribute name=” TargetedPurposeFrom” type=”string” use=”optional”/>
               <xsd:attribute name=” TargetedPurposeTo” type=”string” use=”optional”/>
          </xsd:extension>
     </xsd:simpleContent>
</xsd:complexType>
<xsd:element name=”PotentialIncompatibility” type=”se:PotentialIncompatibilityType”>
</xsd:element>
<xsd:complexType name=” PotentialIncompatibilityType”>
     <xsd:sequence>
          <xsd:element name=”Technique” type=”xsd:string”/>
          <xsd:element name=”Explanation” type=”xsd:string”/>
     </xsd:sequence>
     <xsd:attribute name=” TargetedPurposeFrom” type=”string” use=”optional”/>
     <xsd:attribute name=” TargetedPurposeTo” type=”string” use=”optional”/>
</xsd:complexType>
<Suitability>
<Name>Hue</Name>
<Description>
<Title>Hue usage in urban visualization</Title>
</Description>
<TargetedPurposeFrom>Selectivity</TargetedPurposeFrom>
<PotentialIncompatibility>
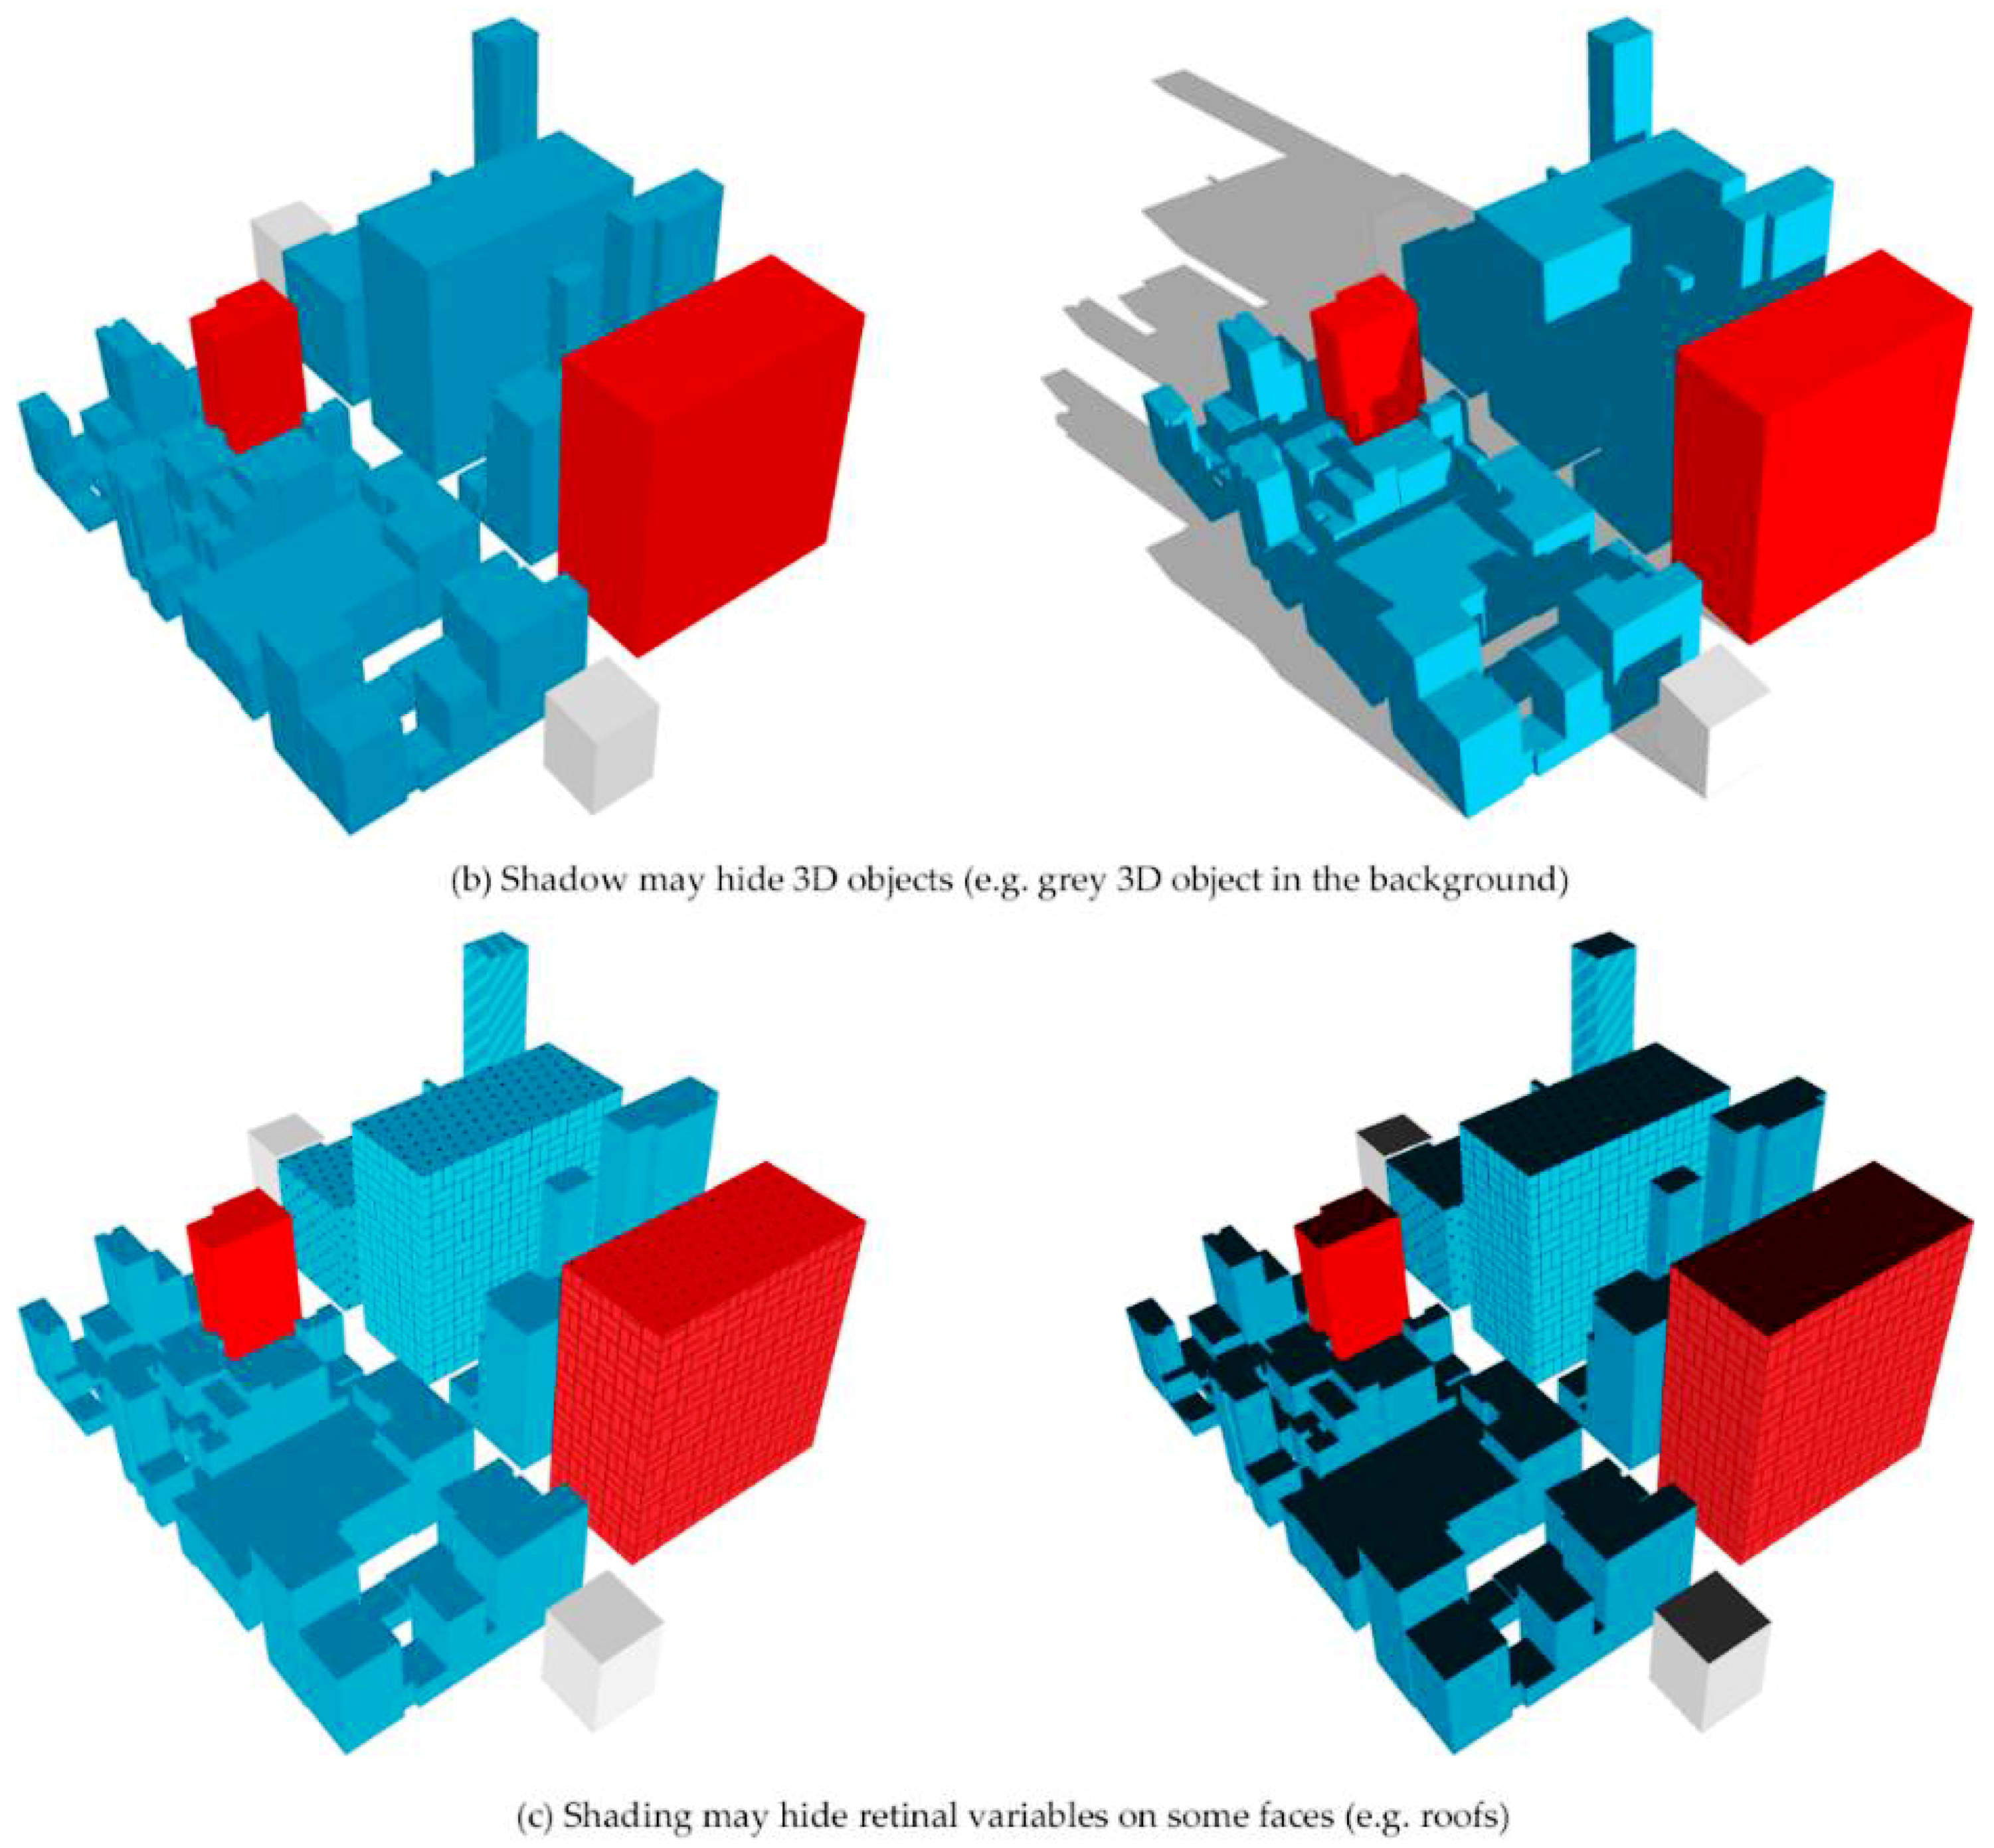
<Technique>Shading</Technique>
<Explanation>Too much shading may hide hue on some faces</Explanation>
</PotentialIncompatibility>
<PotentialIncompatibility>
<Technique>Shadow</Technique>
<Explanation>Shadow may hide 3D objects and subsequently hue</Explanation>
</PotentialIncompatibility>
</Suitability>
<Suitability>
<Name>Pattern</Name>
<Description>
<Title>Pattern usage in urban visualization</Title>
</Description>
<TargetedPurposeFrom>Selectivity</TargetedPurposeFrom>
<Incompatibility TargetedPurposeFromFrom=”Selectivity” TargetedPurposeFromTo=”Selectivity”>Grain</Incompatibility>
<PotentialIncompatibility>
<Technique>Shading</Technique>
<Explanation>Too much shading may hide pattern on some faces</Explanation>
</PotentialIncompatibility>
<PotentialIncompatibility>
<Technique>Shadow</Technique>
<Explanation>Shadow may hide 3D objects and subsequently pattern</Explanation>
</PotentialIncompatibility>
</Suitability>
5. Discussion and Conclusions
Author Contributions
Acknowledgments
Conflicts of Interest
References
- Abdul-Rahman, A.; Pilouk, M. Spatial Data Modelling for 3D GIS; Springer: Berlin/Heidelberg, Germany, 2008; pp. 1–13. [Google Scholar]
- Bandrova, T. Innovative technology for the creation of 3D maps. Data Sci. J. 2005, 4, 53–58. [Google Scholar] [CrossRef]
- Jazayeri, I.; Rajabifard, A.; Kalantari, M. A geometric and semantic evaluation of 3D data sourcing methods for land and property information. Land Use Policy 2014, 36, 219–230. [Google Scholar] [CrossRef]
- Carpendale, M.S.T.; Cowperthwaite, D.J.; Fracchia, F.D. Distortion viewing techniques for 3-dimensional data. In Proceedings of the IEEE Symposium on Information Visualization’96, San Francisco, CA, USA, 28–29 October 1996; pp. 46–53. [Google Scholar]
- Egenhofer, M.J.; Mark, D.M. Naive Geography; Springer: Berlin, Germany, 1995; pp. 1–18. [Google Scholar]
- Jobst, M.; Germanchis, T. The employment of 3D in cartography—An overview. In Multimedia Cartography; Springer: Berlin, Germany, 2007; pp. 217–228. [Google Scholar]
- Kwan, M.-P.; Lee, J. Emergency response after 9/11: The potential of real-time 3D GIS for quick emergency response in micro-spatial environments. Comput. Environ. Urban Syst. 2005, 29, 93–113. [Google Scholar] [CrossRef]
- Zlatanova, S.; Van Oosterom, P.; Verbree, E. 3D technology for improving Disaster Management: Geo-DBMS and positioning. In Proceedings of the XXth ISPRS Congress, Istanbul, Turkey, 12–23 July 2004. [Google Scholar]
- Meijers, M.; Zlatanova, S.; Pfeifer, N. 3D geoinformation indoors: Structuring for evacuation. In Proceedings of the Next Generation 3D City Models, Bonn, Germany, 21–22 June 2005; Volume 6. [Google Scholar]
- Döllner, J.; Baumann, K.; Buchholz, H. Virtual 3D City Models as Foundation of Complex Urban Information Spaces. In Proceedings of the 11th International Conference on Urban Planning and Spatial Development in the Information Society (REAL CORP), Vienna, Austria, 13–16 February 2006. [Google Scholar]
- Sinning-Meister, M.; Gruen, A.; Dan, H. 3D City models for CAAD-supported analysis and design of urban areas. ISPRS J. Photogramm. Remote Sens. 1996, 51, 196–208. [Google Scholar] [CrossRef]
- Döllner, J.; Kolbe, T.H.; Liecke, F.; Sgouros, T.; Teichmann, K. The Virtual 3D City Model of Berlin—Managing, Integrating and Communicating Complex Urban Information. In Proceedings of the 25th International Symposium on Urban Data Management, Aalborg, Denmark, 15–17 May 2006. [Google Scholar]
- Open Geospatial Consortium. Candidate OpenGIS® CityGML Implementation Specification (City Geography Markup Language); Open Geospatial Consortium: Wayland, MA, USA, 2006. [Google Scholar]
- Kolbe, T.H. Representing and exchanging 3D city models with CityGML. In 3D Geo-Information Sciences; Springer: Berlin, Germany, 2009; pp. 15–31. [Google Scholar]
- Ward, M.O.; Grinstein, G.; Keim, D. Interactive Data Visualization: Foundations, Techniques, and Applications; CRC Press: Boca Raton, FL, USA, 2010. [Google Scholar]
- Glander, T.; Döllner, J. Abstract representations for interactive visualization of virtual 3D city models. Comput. Environ. Urban Syst. 2009, 33, 375–387. [Google Scholar] [CrossRef]
- Batty, M.; Chapman, D.; Evans, S.; Haklay, M.; Kueppers, S.; Shiode, N.; Smith, A.; Torrens, P.M. Visualizing the city: Communicating urban design to planners and decision-makers. In Planning Support Systems, Models and Visualisation Tools; ESRI Press and Center Urban Policy Research, Rutgers Universtiy: London, UK, 2000. [Google Scholar]
- Métral, C.; Ghoula, N.; Silva, V.; Falquet, G. A repository of information visualization techniques to support the design of 3D virtual city models. In Innovations in 3D Geo-Information Sciences; Springer: Berlin, Germany, 2014; pp. 175–194. [Google Scholar]
- Brasebin, M.; Christophe, S.; Buard, É.; Pelloie, F. A knowledge base to classify and mix 3d rendering styles. In Proceedings of the 27th International Cartographic Conference, Rio de Janeiro, Brazil, 23–28 August 2015; p. 11. [Google Scholar]
- Neubauer, S.; Zipf, A. Suggestions for Extending the OGC Styled Layer Descriptor (SLD) Specification into 3D—Towards Visualization Rules for 3D City Models. In Proceedings of the 26th Urban and Regional Data Management, Stuttgart, Germany, 10–12 October 2007. [Google Scholar]
- Kraak, M.-J. Geovisualization illustrated. ISPRS J. Photogramm. Remote Sens. 2003, 57, 390–399. [Google Scholar] [CrossRef]
- Bleisch, S. 3D geovisualization–definition and structures for the assessment of usefulness. ISPRS Ann. Photogramm. Remote Sens. Spat. Inf. Sci. 2012, 1, 129–134. [Google Scholar] [CrossRef]
- MacEachren, A.M.; Kraak, M.-J. Research Challenges in Geovisualization. Cartogr. Geogr. Inf. Sci. 2001, 28, 3–12. [Google Scholar] [CrossRef]
- Heim, M. Virtual Realism; Oxford University Press: Oxford, UK, 2000. [Google Scholar]
- MacEachren, A.M.; Edsall, R.; Haug, D.; Baxter, R.; Otto, G.; Masters, R.; Fuhrmann, S.; Qian, L. Virtual environments for geographic visualization: Potential and challenges. In Proceedings of the 1999 Workshop on New Paradigms in Information Visualization and Manipulation in Conjunction with the Eighth ACM Internation Conference on Information and Knowledge Management, Kansas City, MO, USA, 2–6 November 1999; pp. 35–40. [Google Scholar]
- Milgram, P.; Kishino, F. A taxonomy of mixed reality visual displays. IEICE Trans. Inf. Syst. 1994, 77, 1321–1329. [Google Scholar]
- Billen, M.I.; Kreylos, O.; Hamann, B.; Jadamec, M.A.; Kellogg, L.H.; Staadt, O.; Sumner, D.Y. A geoscience perspective on immersive 3D gridded data visualization. Comput. Geosci. 2008, 34, 1056–1072. [Google Scholar] [CrossRef]
- Kwan, M.-P. Interactive geovisualization of activity-travel patterns using three-dimensional geographical information systems: A methodological exploration with a large data set. Transp. Res. Part C Emerg. Technol. 2000, 8, 185–203. [Google Scholar] [CrossRef]
- Philips, A.; Walz, A.; Bergner, A.; Graeff, T.; Heistermann, M.; Kienzler, S.; Korup, O.; Lipp, T.; Schwanghart, W.; Zeilinger, G. Immersive 3D geovisualization in higher education. J. Geogr. High. Educ. 2015, 39, 437–449. [Google Scholar] [CrossRef]
- Andrienko, G.; Andrienko, N.; Dykes, J.; Fabrikant, S.I.; Wachowicz, M. Geovisualization of Dynamics, Movement and Change: Key Issues and Developing Approaches in Visualization Research. Inf. Vis. 2008, 7, 173–180. [Google Scholar] [CrossRef]
- Eco, U. A Theory of Semiotics; Indiana University Press: Bloomington, Indiana, 1976. [Google Scholar]
- Stevens, S.S. On the Theory of Scales of Measurement. Science 1946, 103, 677–680. [Google Scholar] [CrossRef] [PubMed]
- Bertin, J. Sémiologie Graphique: Les Diagrammes, les Réseaux et les Cartes; Gauthier-Villars, Mouton & Cie.: Paris, France, 1967. [Google Scholar]
- Morrison, J.L. A theoretical framework for cartographic generalization with the emphasis on the process of symbolization. Int. Yearb. Cartogr. 1974, 14, 115–127. [Google Scholar]
- MacEachren, A.M. How Maps Work; Guilford.: New York City, NY, USA, 1995. [Google Scholar]
- Carpendale, M.S.T. Considering Visual Variables as a Basis for Information Visualization; Department of Computer Science, University of Calgary: Calgary, AB, Canada, 2003. [Google Scholar]
- Slocum, T.A.; McMaster, R.B.; Kessler, F.C.; Howard, H.H. Thematic Cartography and Geovisualization; Pearson Education LTD.: London, UK, 2010. [Google Scholar]
- Boukhelifa, N.; Bezerianos, A.; Isenberg, T.; Fekete, J.-D. Evaluating sketchiness as a visual variable for the depiction of qualitative uncertainty. IEEE Trans. Vis. Comput. Graph. 2012, 18, 2769–2778. [Google Scholar] [CrossRef] [PubMed]
- Pouliot, J.; Wang, C.; Fuchs, V.; Hubert, F.; Bédard, M. Experiments with Notaries about the Semiology of 3D Cadastral Models. ISPRS Int. Arch. Photogramm. Remote Sens. Spat. Inf. Sci. 2013, XL-2/W2, 53–57. [Google Scholar] [CrossRef]
- Pouliot, J.; Wang, C.; Hubert, F. Transparency Performance in the 3D Visualization of Bounding Legal and Physical Objects: Preliminary Results of a Survey. In Proceedings of the 4th International Workshop on 3D Cadastres, Dubai, UAE, 9–11 November 2014; pp. 173–182. [Google Scholar]
- Pouliot, J.; Wang, C.; Hubert, F.; Fuchs, V. Empirical Assessment of the Suitability of Visual Variables to Achieve Notarial Tasks Established from 3D Condominium Models. In Innovations in 3D Geo-Information Sciences; Isikdag, U., Ed.; Lecture Notes in Geoinformation and Cartography; Springer: Berlin, Germany, 2014; pp. 195–210. ISBN 978-3-319-00514-0. [Google Scholar]
- Wang, C.; Pouliot, J.; Hubert, F. Visualization Principles in 3D Cadastre: A First Assessment of Visual Variables. In Proceedings of the 3rd International Workshop on 3D Cadastres, Shenzhen, China, 25–26 October 2012. [Google Scholar]
- Rautenbach, V.; Coetzee, S.; Schiewe, J.; Çöltekin, A. An Assessment of Visual Variables for the Cartographic Design of 3D Informal Settlement Models. In Proceedings of the 27th International Cartographic Conference, Rio de Janeiro, Brazil, 23–28 August 2015. [Google Scholar]
- Elmqvist, N.; Tsigas, P. A taxonomy of 3D occlusion management techniques. In Proceedings of the Virtual Reality Conference 2007 (VR’07), Charlotte, NC, USA, 10–14 March 2007; pp. 51–58. [Google Scholar]
- Elmqvist, N.; Assarsson, U.; Tsigas, P. Employing dynamic transparency for 3D occlusion management: Design issues and evaluation. In Proceedings of the IFIP Conference on Human-Computer Interaction, Rio de Janeiro, Brazil, 10–14 September 2007; pp. 532–545. [Google Scholar]
- Coors, V. 3D-GIS in networking environments. Comput. Environ. Urban Syst. 2003, 27, 345–357. [Google Scholar] [CrossRef]
- Avery, B.; Sandor, C.; Thomas, B.H. Improving spatial perception for augmented reality X-ray vision. In Proceedings of the Virtual Reality Conference 2009 (VR 2009), Lafayette, LA, USA, 14–18 March 2009; pp. 79–82. [Google Scholar]
- Haeberling, C. 3D Map Presentation—A Systematic Evaluation of Important Graphic Aspects. In Proceedings of the ICA Mountain Cartography Workshop ‘Mount Hood’, Mt. Hood, OR, USA, 15–19 May 2002. [Google Scholar]
- Lorenz, H.; Trapp, M.; Döllner, J.; Jobst, M. Interactive multi-perspective views of virtual 3D landscape and city models. In The European Information Society; Springer: Berlin, Germany, 2008; pp. 301–321. [Google Scholar]
- Jobst, M.; Döllner, J. Better Perception of 3D-Spatial Relations by Viewport Variations. In Visual Information Systems. Web-Based Visual Information Search and Management; Sebillo, M., Vitiello, G., Schaefer, G., Eds.; Lecture Notes in Computer Science; Springer: Berlin/Heidelberg, Germany, 2008; pp. 7–18. ISBN 978-3-540-85890-4. [Google Scholar]
- Bazargan, K.; Falquet, G. Specifying the representation of non-geometric information in 3D virtual environments. In Proceedings of the International Conference on Human-Computer Interaction, San Diego, CA, USA, 19–24 July 2009; pp. 773–782. [Google Scholar]
- Trapp, M.; Beesk, C.; Pasewaldt, S.; Döllner, J. Interactive Rendering Techniques for Highlighting in 3D Geovirtual Environments. In Advances in 3D Geo-Information Sciences; Kolbe, T.H., König, G., Nagel, C., Eds.; Lecture Notes in Geoinformation and Cartography; Springer: Berlin/Heidelberg, Germany, 2011; pp. 197–210. ISBN 978-3-642-12669-7. [Google Scholar]
- Hajji, R.; Billen, R. Collaborative 3D Modeling: Conceptual and Technical Issues. Int. J. 3-D Inf. Model. 2016, 5, 47–67. [Google Scholar] [CrossRef]
- Stadler, A.; Kolbe, T.H. Spatio-semantic coherence in the integration of 3D city models. In Proceedings of the 5th International ISPRS Symposium on Spatial Data Quality ISSDQ 2007, Enschede, The Netherlands, 13–15 June 2007. [Google Scholar]
- Döllner, J.; Buchholz, H. Expressive virtual 3D city models. In Proceedings of the XXII International Cartographic Conference (ICC2005), A Coruña, Spain, 11–16 July 2005. [Google Scholar]
- Ellul, C.; Altenbuchner, J. Investigating approaches to improving rendering performance of 3D city models on mobile devices. Geo-Spat. Inf. Sci. 2014, 17, 73–84. [Google Scholar] [CrossRef]
- Liu, X.; Wang, X.; Wright, G.; Cheng, J.; Li, X.; Liu, R. A State-of-the-Art Review on the Integration of Building Information Modeling (BIM) and Geographic Information System (GIS). ISPRS Int. J. Geo-Inf. 2017, 6, 53. [Google Scholar] [CrossRef]
- Open Geospatial Consortium. OGC® IndoorGML: Corrigendum; Open Geospatial Consortium: Wayland, MA, USA, 2018. [Google Scholar]
- Kim, J.; Yoo, S.; Li, K. Integrating IndoorGML and CityGML for Indoor Space. In Web and Wireless Geographical Information Systems; Lecture Notes in Computer Science; Springer: Berlin/Heidelberg, Germany, 2014; Volume 8470. [Google Scholar]
- Löwner, M.-O.; Benner, J.; Gröger, G.; Häfele, K.-H. New concepts for structuring 3D city models—An extended level of detail concept for CityGML buildings. In Proceedings of the International Conference on Computational Science and Its Applications, Ho Chi Minh City, Vietnam, 24–27 June 2013; pp. 466–480. [Google Scholar]
- Biljecki, F.; Ledoux, H.; Stoter, J.; Zhao, J. Formalization of the level of detail in 3D city modelling. Comput. Environ. Urban Syst. 2014, 48, 1–15. [Google Scholar] [CrossRef]
- Biljecki, F.; Ledoux, H.; Stoter, J. An improved LOD specification for 3D building models. Comput. Environ. Urban Syst. 2016, 59, 25–37. [Google Scholar] [CrossRef]
- Biljecki, F. Level of Detail in 3D City Models; TU Delft: Delft, The Netherlands, 2017. [Google Scholar]
- Gröger, G.; Plümer, L. CityGML—Interoperable semantic 3D city models. ISPRS J. Photogramm. Remote Sens. 2012, 71, 12–33. [Google Scholar] [CrossRef]
- Luebke, D.; Reddy, M.; Cohen, J.D.; Varshney, A.; Watson, B.; Huebner, R. Level of Details for 3D Graphics; Morgan Kaufmann Publishers: Burlington, MA, USA, 2012. [Google Scholar]
- Zhu, Q.; Hu, M.; Zhang, Y.; Du, Z. Research and practice in three-dimensional city modeling. Geo-Spat. Inf. Sci. 2009, 12, 18–24. [Google Scholar] [CrossRef]
- Benner, J.; Geiger, A.; Leinemann, K. Flexible generation of semantic 3D building models. In Proceedings of the 1st International Workshop on Next Generation 3D City Models, Bonn, Germany, 21–22 June 2005; pp. 17–22. [Google Scholar]
- Jobst, M.; Dollner, J.; Lubanski, O. Communicating Geoinformation effectively with virtual 3D city models. In Handbook of Research on E-Planning: ICTs for Urban Development and Monitoring; IGI Global: Hershey, PA, USA, 2010. [Google Scholar]
- Semmo, A.; Trapp, M.; Jobst, M.; Döllner, J. Cartography-Oriented Design of 3D Geospatial Information Visualization—Overview and Techniques. Cartogr. J. 2015, 52, 95–106. [Google Scholar] [CrossRef]
- Hu, J.; You, S.; Neumann, U. Approaches to large-scale urban modeling. IEEE Comput. Graph. Appl. 2003, 23, 62–69. [Google Scholar]
- Buchroithner, M.; Schenkel, R.; Kirschenbauer, S. 3D display techniques for cartographic purposes: Semiotic aspects. Int. Arch. Photogramm. Remote Sens. 2000, 33, 99–106. [Google Scholar]
- Jobst, M.; Kyprianidis, J.E.; Döllner, J. Mechanisms on Graphical Core Variables in the Design of Cartographic 3D City Presentations. In Geospatial Vision; Moore, A., Drecki, I., Eds.; Springer: Berlin/Heidelberg, Germany, 2008; pp. 45–59. ISBN 978-3-540-70967-1. [Google Scholar]
- Häberling, C.; Bär, H.; Hurni, L. Proposed Cartographic Design Principles for 3D Maps: A Contribution to an Extended Cartographic Theory. Cartographica 2008, 43, 175–188. [Google Scholar] [CrossRef]
- Ware, C. Information Visualization Perception for Design, 3rd ed.; Interactive Technologies; Elsevier Science: Burlington, NJ, USA, 2012; ISBN 0-12-381464-2. [Google Scholar]
- Foerster, T.; Stoter, J.; Köbben, B. Towards a formal classification of generalization operators. In Proceedings of the 23rd International Cartographic Conference, Moscow, Russia, 4–10 August 2007. [Google Scholar]
- Ogao, P.J.; Kraak, M.-J. Defining visualization operations for temporal cartographic animation design. Int. J. Appl. Earth Obs. Geoinf. 2002, 4, 23–31. [Google Scholar] [CrossRef]
- Khan, M.; Khan, S.S. Data and information visualization methods, and interactive mechanisms: A survey. Int. J. Comput. Appl. 2011, 34, 1–14. [Google Scholar]
- Métral, C.; Ghoula, N.; Falquet, G. An Ontology of 3D Visualization Techniques for Enriched 3D City Models; Leduc, T., Moreau, G., Billen, R., Eds.; EDP Sciences: Les Ulis, France, 2012; p. 02005. [Google Scholar]
- Neuville, R.; Pouliot, J.; Poux, F.; Hallot, P.; De Rudder, L.; Billen, R. Towards a decision support tool for 3d visualisation: Application to selectivity purpose of single object in a 3d city scene. ISPRS Ann. Photogramm. Remote Sens. Spat. Inf. Sci. 2017, IV-4/W5, 91–97. [Google Scholar] [CrossRef]
- Stein, T.; Décoret, X. Dynamic Label Placement for Improved Interactive Exploration; ACM Press: New York, NY, USA, 2008; p. 15. [Google Scholar]
- Neuville, R.; Poux, F.; Hallot, P.; Billen, R. Towards a normalised 3D Geovisualisation: The viewpoint management. ISPRS Ann. Photogramm. Remote Sens. Spat. Inf. Sci. 2016, 4, 179. [Google Scholar] [CrossRef]
- Poux, F.; Neuville, R.; Hallot, P.; Van Wersch, L.; Luczfalvy Jancsó, A.; Billen, R. Digital Investigations of an Archaeological Smart Point Cloud: A Real Time Web-Based Platform To Manage the Visualization of Semantical Queries. Conservation Cultural Heritage in the Digital Era 2017. pp. 581–588. Available online: http://hdl.handle.net/2268/212353 (accessed on 1 March 2018).
- Poux, F.; Neuville, R.; Van Wersch, L.; Nys, G.-A.; Billen, R. 3D Point Clouds in Archaeology: Advances in Acquisition, Processing and Knowledge Integration Applied to Quasi-Planar Objects. Geosciences 2017, 7, 96. [Google Scholar] [CrossRef]


| Visual Variable | Author (Date) | Example |
|---|---|---|
| Arrangement | Morisson (1974) |  |
| Crispness | MacEachren (1995) |  |
| Grain | Bertin (1967) | 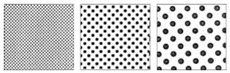 |
| Hue | Bertin (1967) |  |
| Lightness/Value | Bertin (1967) |  |
| Material | Carpendale (2003) |  |
| Orientation | Bertin (1967) |  |
| Pattern | Carpendale (2003) | 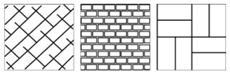 |
| Perspective height | Slocum et al. (2010) |  |
| Position | Bertin (1967) |  |
| Resolution | MacEachren (1995) |  |
| Saturation | Morisson (1974) |  |
| Shape | Bertin (1967) |  |
| Size | Bertin (1967) |  |
| Sketchiness | Boukhelifa et al. (2012) |  |
| Spacing | Slocum et al. (2010) |  |
| Transparency | MacEachren (1995) |  |
| Interpretation Task | Signification | Question |
|---|---|---|
| Selectivity | The capacity to extract categories | Does the retinal variable variation identify categories? |
| Associativity | The capacity to regroup similarities | Does the retinal variable variation group similarities? |
| Order perception | The capacity to compare several orders | Does the retinal variable variation identify a change in order? |
| Quantitative perception | The capacity to quantify a difference | Does the retinal variable variation quantify a difference? |
| Notation | Signification |
|---|---|
| a ∈ A | a is an element of A |
| |A| | Number of elements in A |
| A × B | A cross-product B = {(a, b) a ∈ A, b ∈ B} |
| Set of reals | |
| Set of integers | |
| + | Set of positive reals ([0; +∞]) |
| 3 | × × |
| ∪ | Union of two sets |
| ∩ | Intersection of two sets |
| ∨ | OR boolean operator |
| ∧ | AND boolean operator |
| → | IMPLICATION operator |
| ¬ | NOT operator |
© 2018 by the authors. Licensee MDPI, Basel, Switzerland. This article is an open access article distributed under the terms and conditions of the Creative Commons Attribution (CC BY) license (http://creativecommons.org/licenses/by/4.0/).
Share and Cite
Neuville, R.; Pouliot, J.; Poux, F.; De Rudder, L.; Billen, R. A Formalized 3D Geovisualization Illustrated to Selectivity Purpose of Virtual 3D City Model. ISPRS Int. J. Geo-Inf. 2018, 7, 194. https://doi.org/10.3390/ijgi7050194
Neuville R, Pouliot J, Poux F, De Rudder L, Billen R. A Formalized 3D Geovisualization Illustrated to Selectivity Purpose of Virtual 3D City Model. ISPRS International Journal of Geo-Information. 2018; 7(5):194. https://doi.org/10.3390/ijgi7050194
Chicago/Turabian StyleNeuville, Romain, Jacynthe Pouliot, Florent Poux, Laurent De Rudder, and Roland Billen. 2018. "A Formalized 3D Geovisualization Illustrated to Selectivity Purpose of Virtual 3D City Model" ISPRS International Journal of Geo-Information 7, no. 5: 194. https://doi.org/10.3390/ijgi7050194
APA StyleNeuville, R., Pouliot, J., Poux, F., De Rudder, L., & Billen, R. (2018). A Formalized 3D Geovisualization Illustrated to Selectivity Purpose of Virtual 3D City Model. ISPRS International Journal of Geo-Information, 7(5), 194. https://doi.org/10.3390/ijgi7050194