Evaluation of the Cartographical Quality of Urban Plans by Eye-Tracking


Abstract
1. Introduction
1.1. Urban Plan Standardization
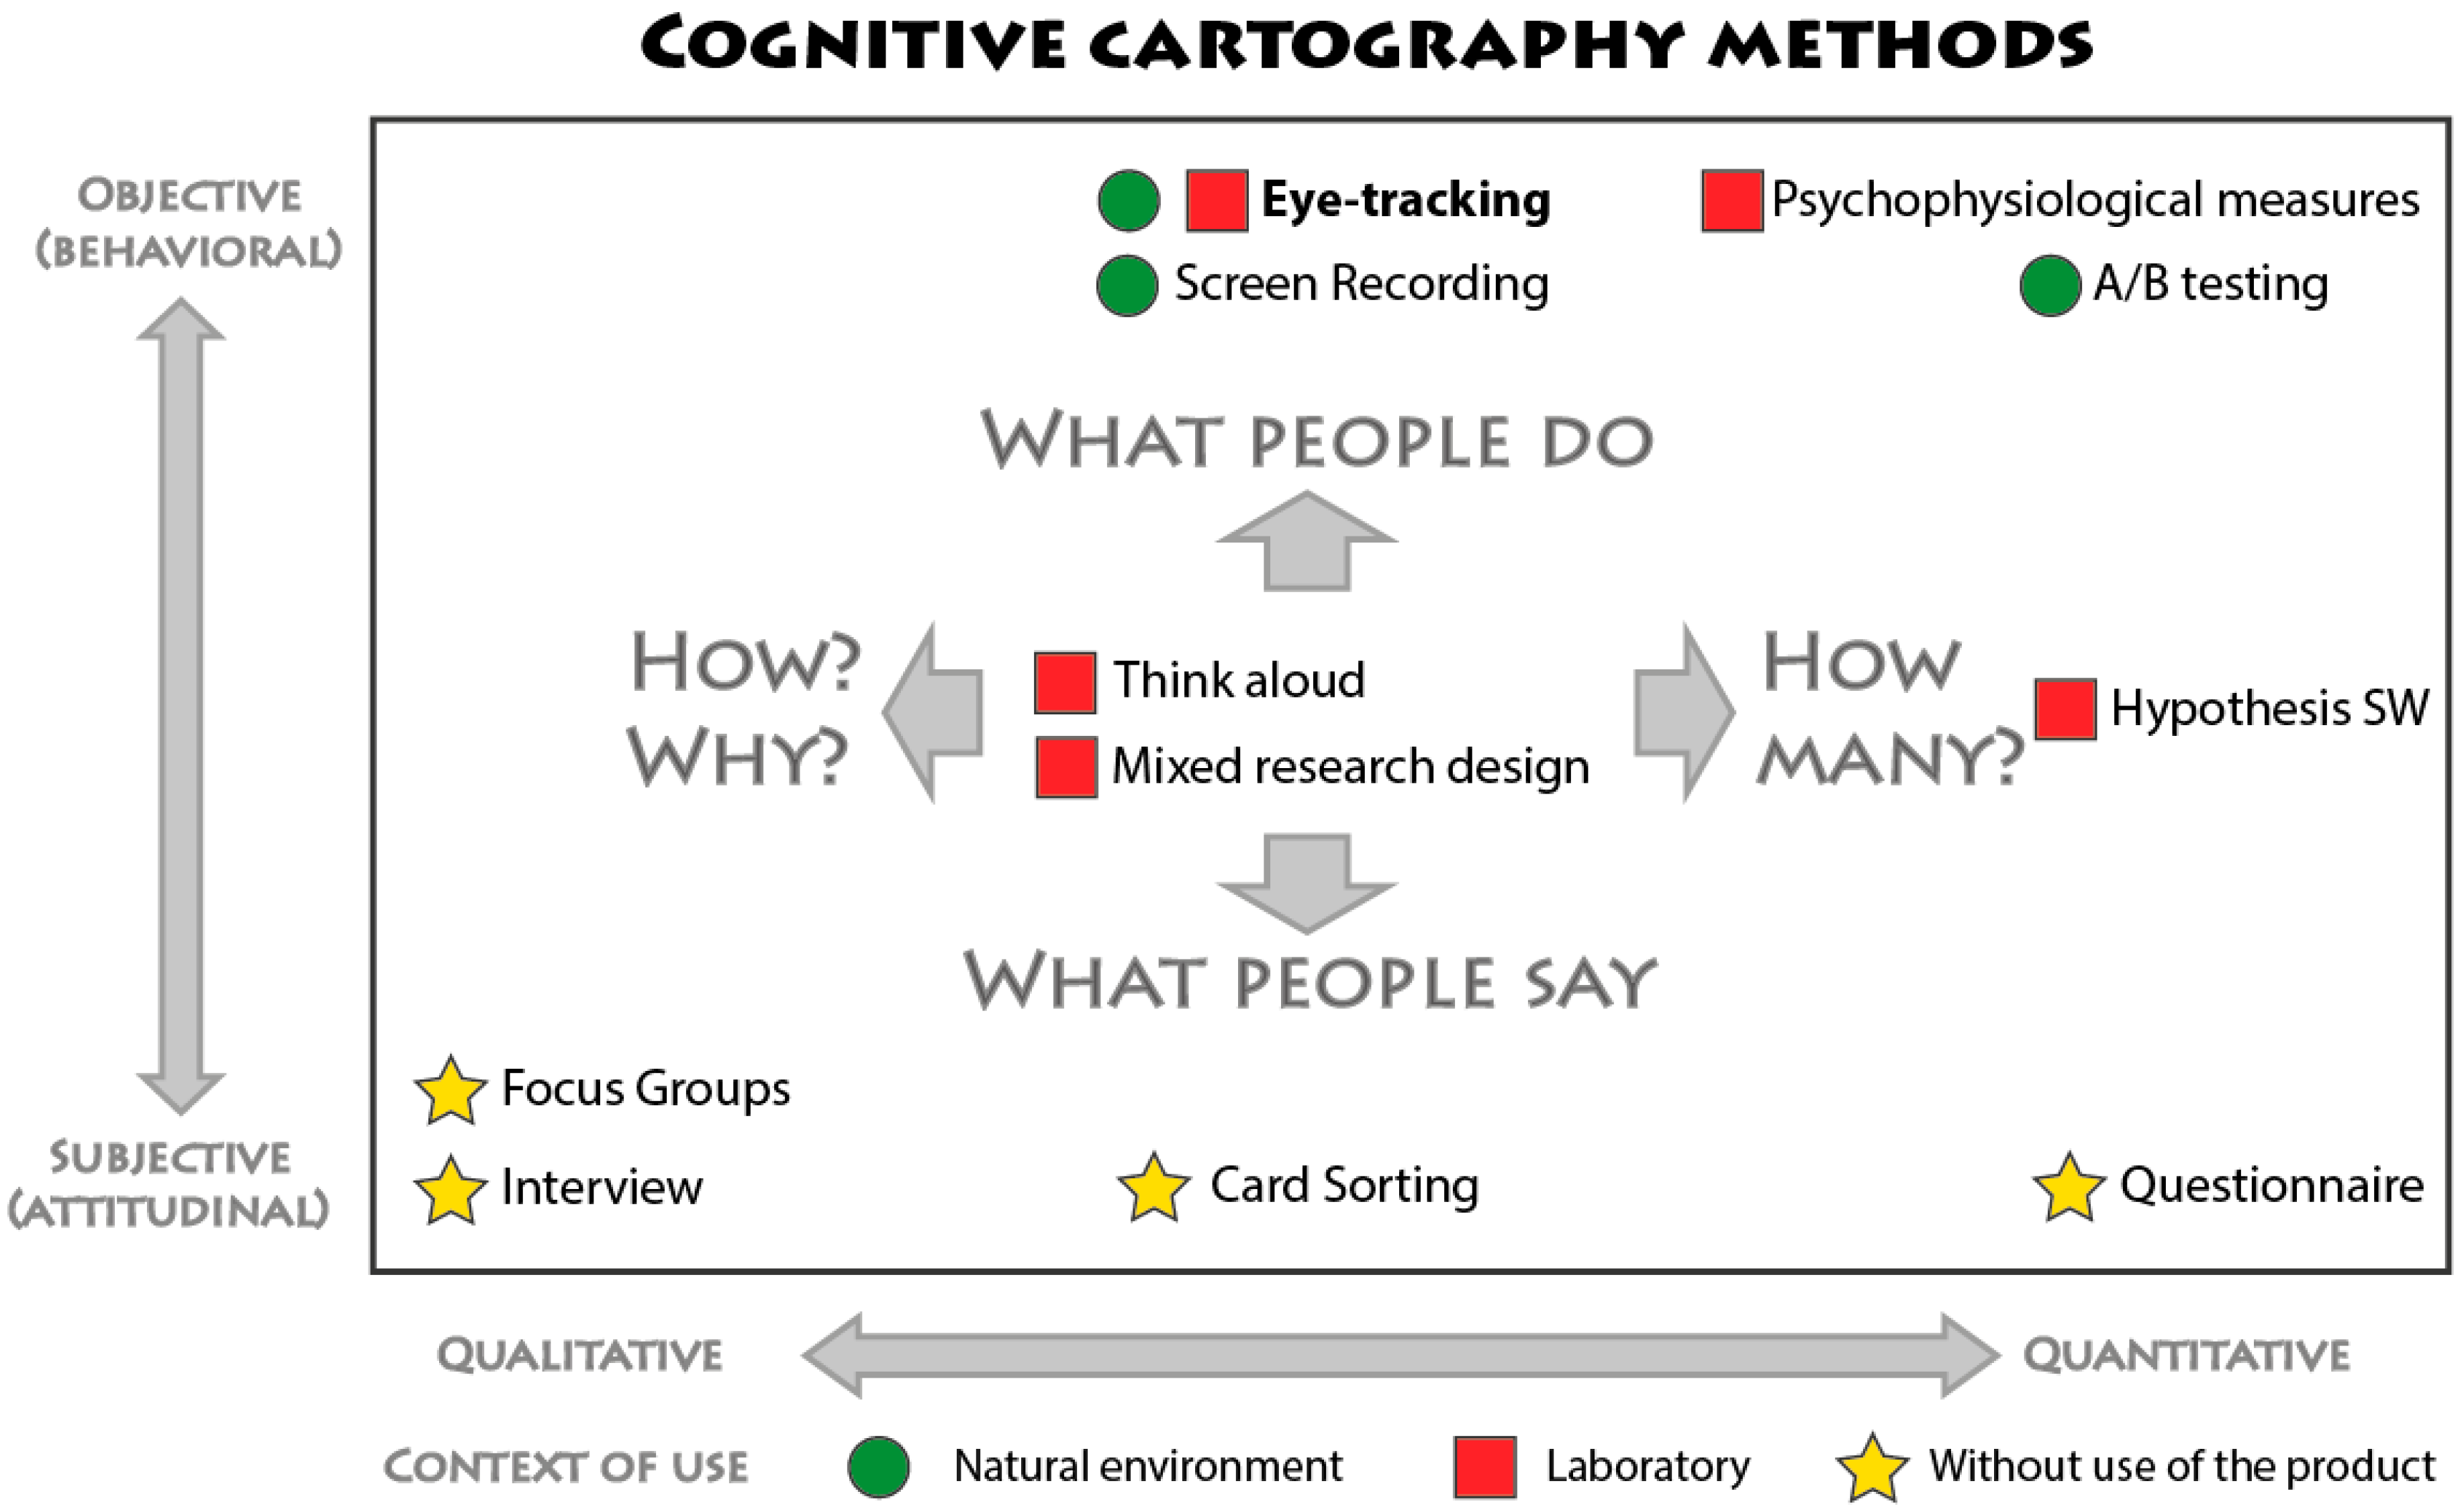
1.2. Urban Plans Evaluation
- Attitudinal vs. Behavioral (Subjective vs. Objective)
- Qualitative vs. Quantitative
- Context of Use
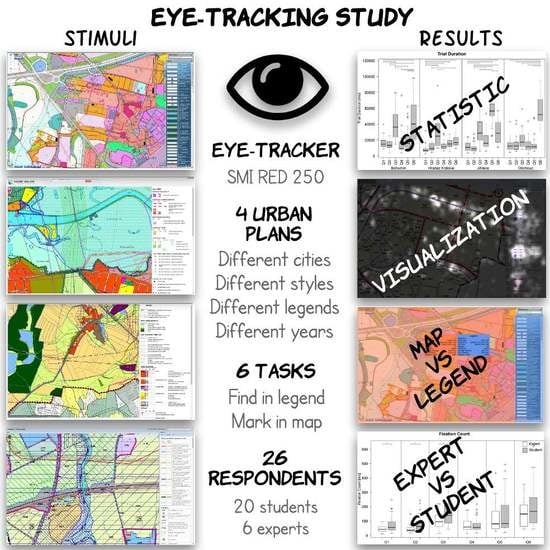
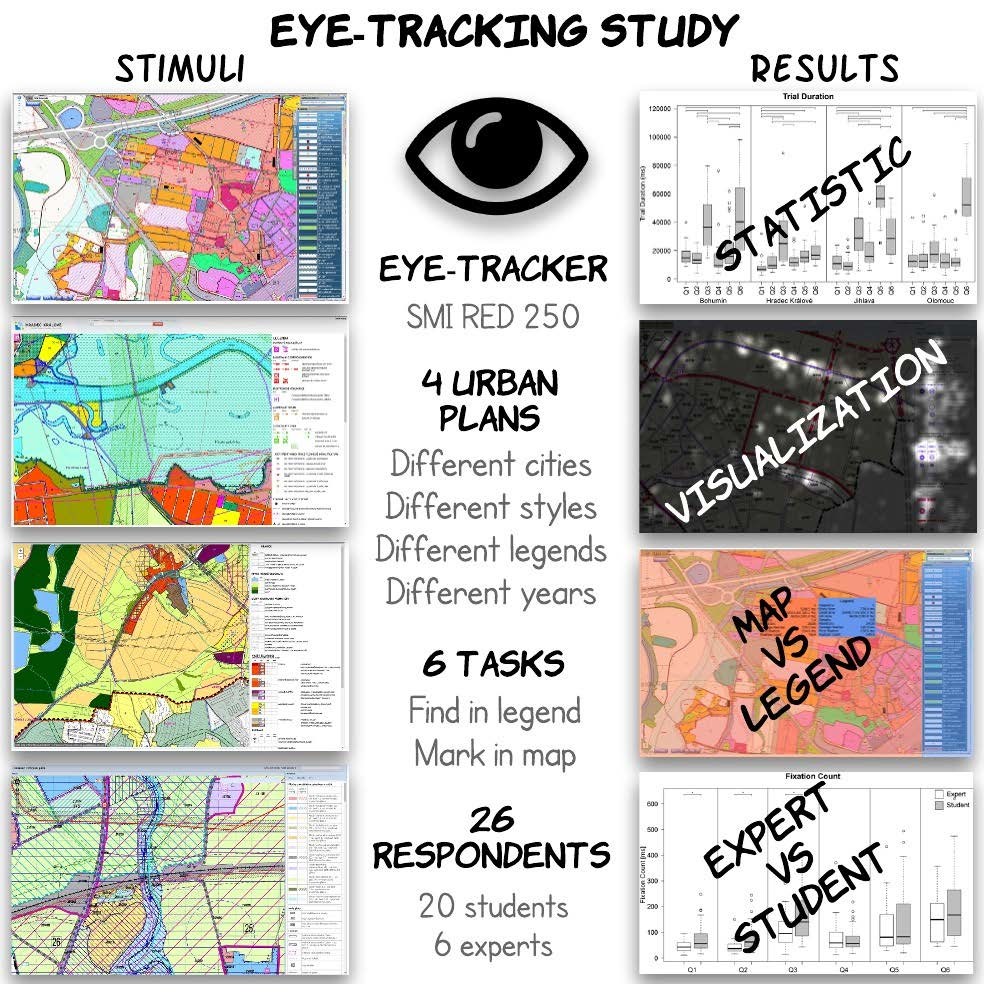
1.3. Eye-Tracking
- Map symbology (number of colors, map symbols, and features/layers on the map) significantly influences the legibility and understandability of plans, which will impact the duration and correctness of the tasks.
- Legend structure significantly influences the legibility and understandability of the plans, which will impact the number of fixations and length of dwell time in the Legend AOI.
- Differences between students and experts in how these groups read plans will impact the duration and correctness of the tasks.
2. Materials and Methods
2.1. Study Design
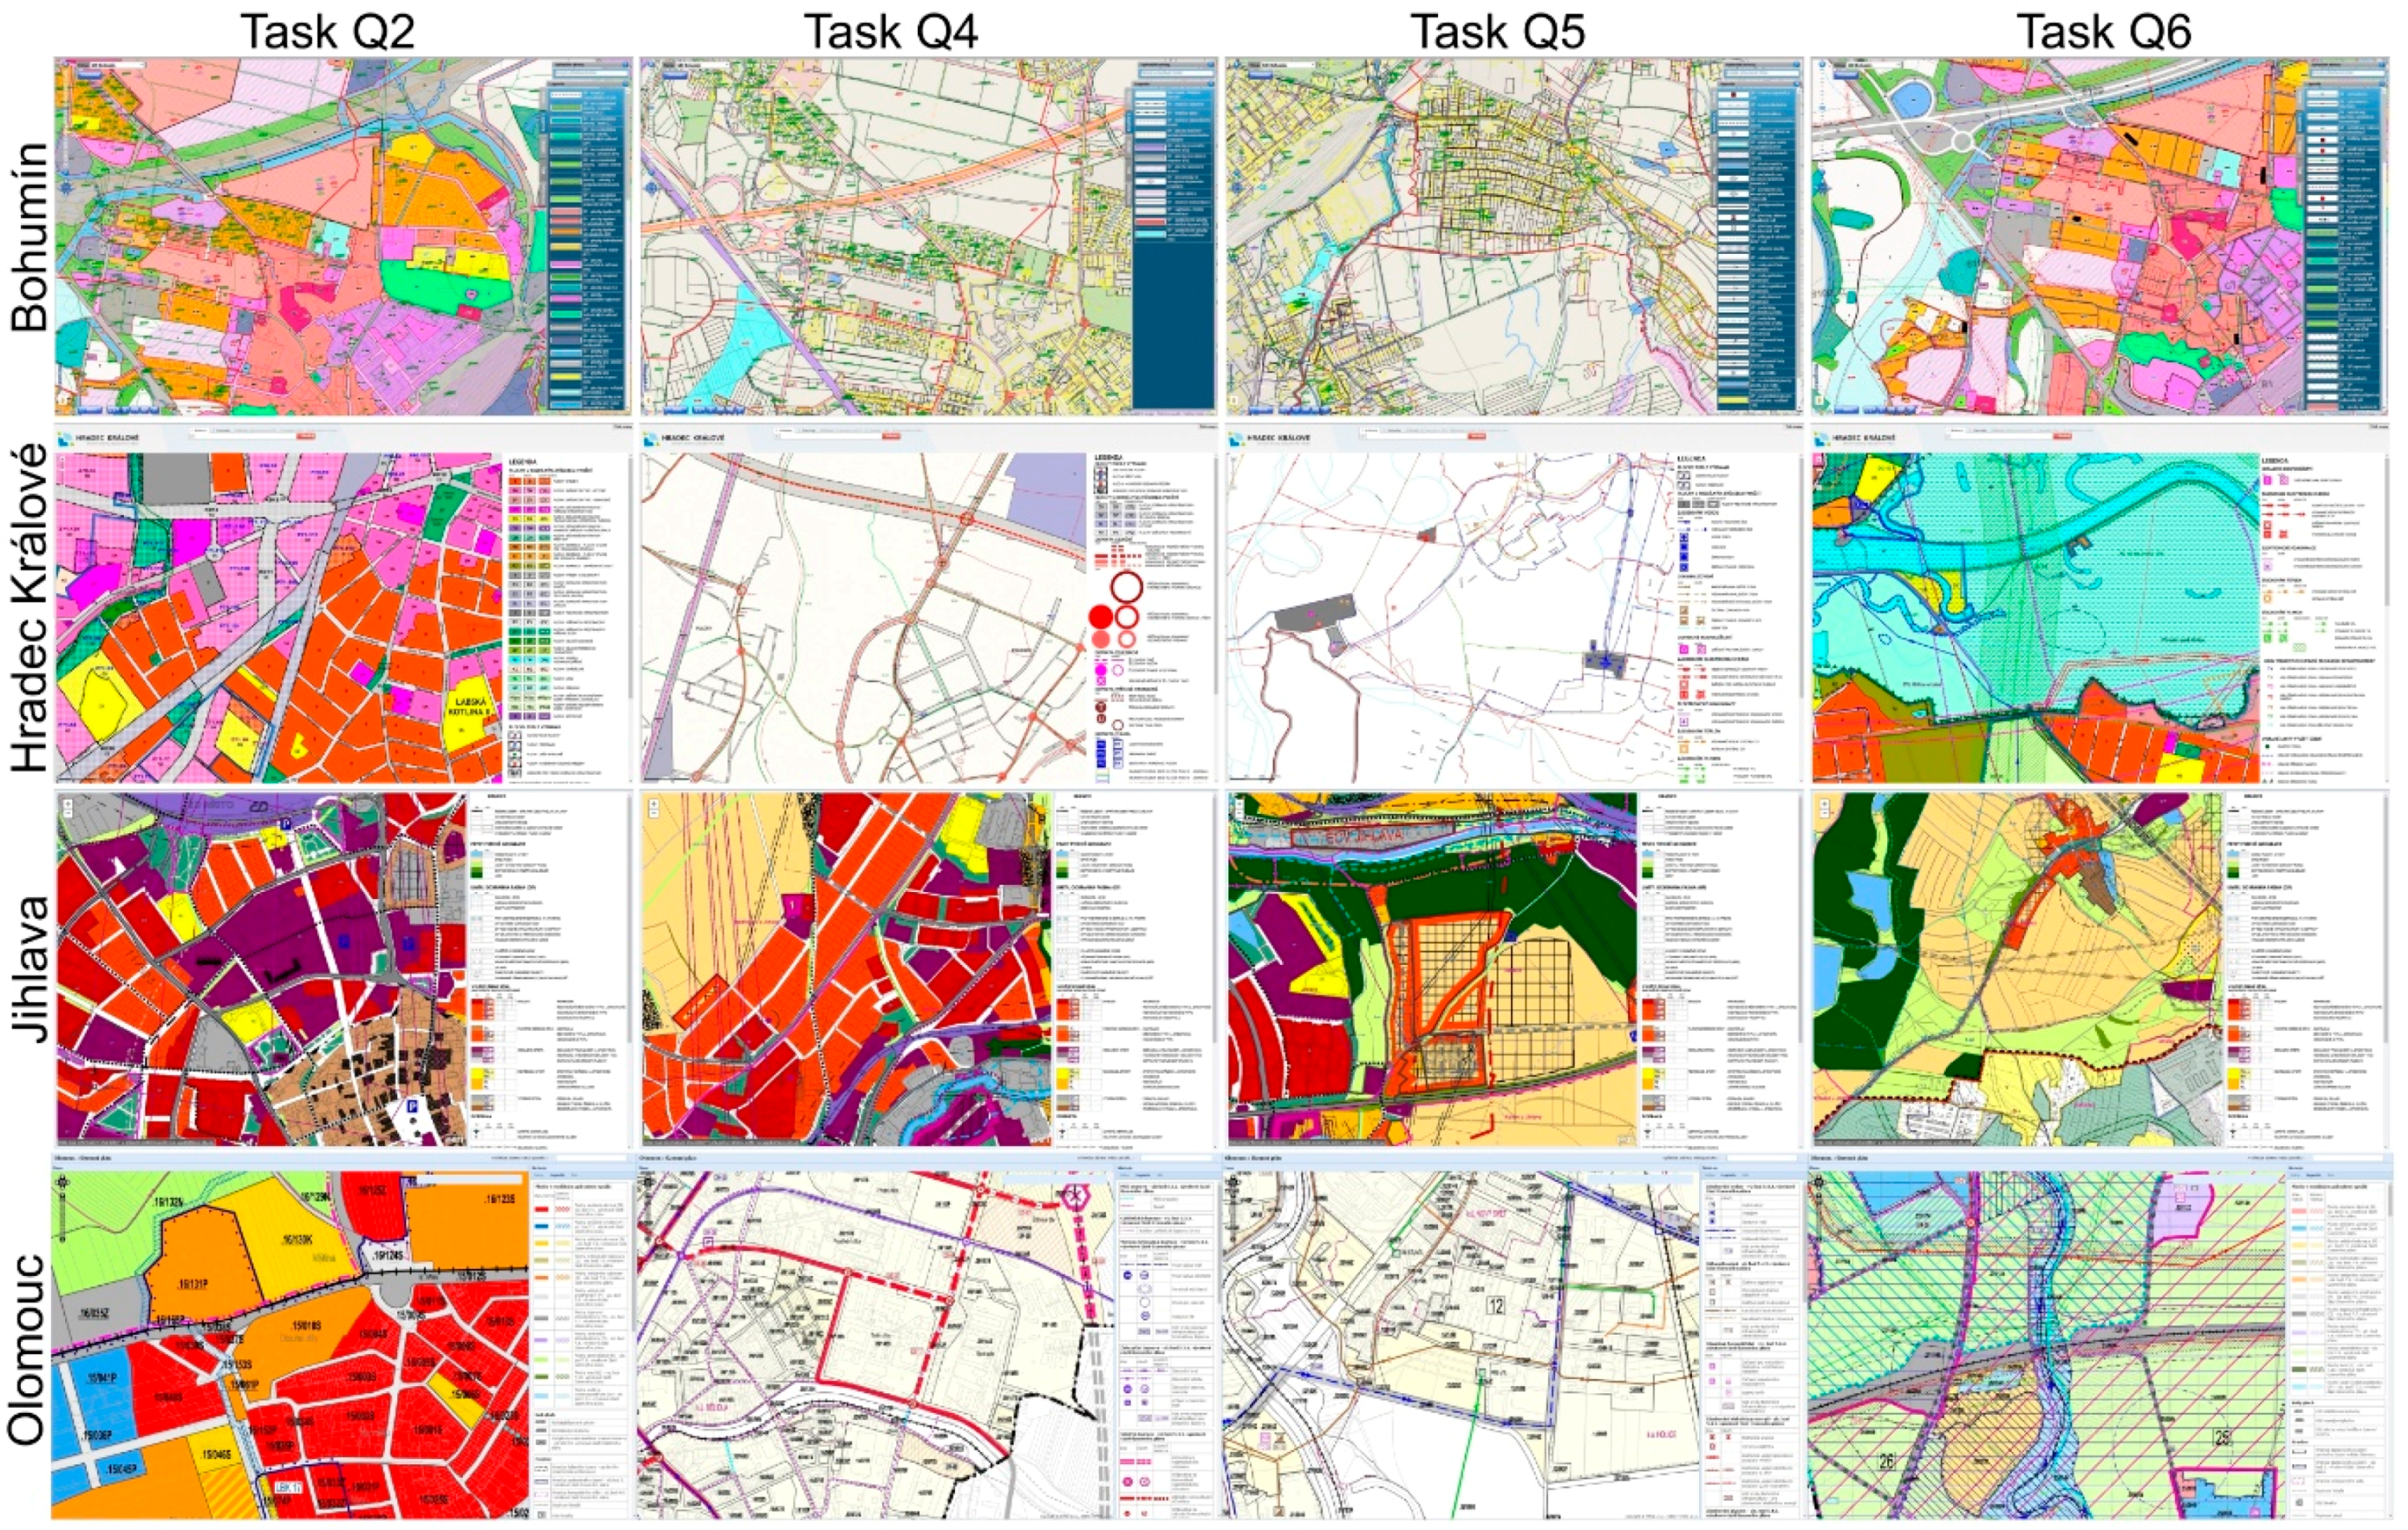
2.1.1. Selection of Plans
2.1.2. Selection of Tasks
- Q1: Mark an area for housing (Zoning map)
- Q2: Mark an area for sports or recreation (Zoning map)
- Q3: Mark an area for proposed public services (Zoning map)
- Q4: Mark a railroad (Transportation map)
- Q5: Mark a wastewater treatment plant (Utility networks map)
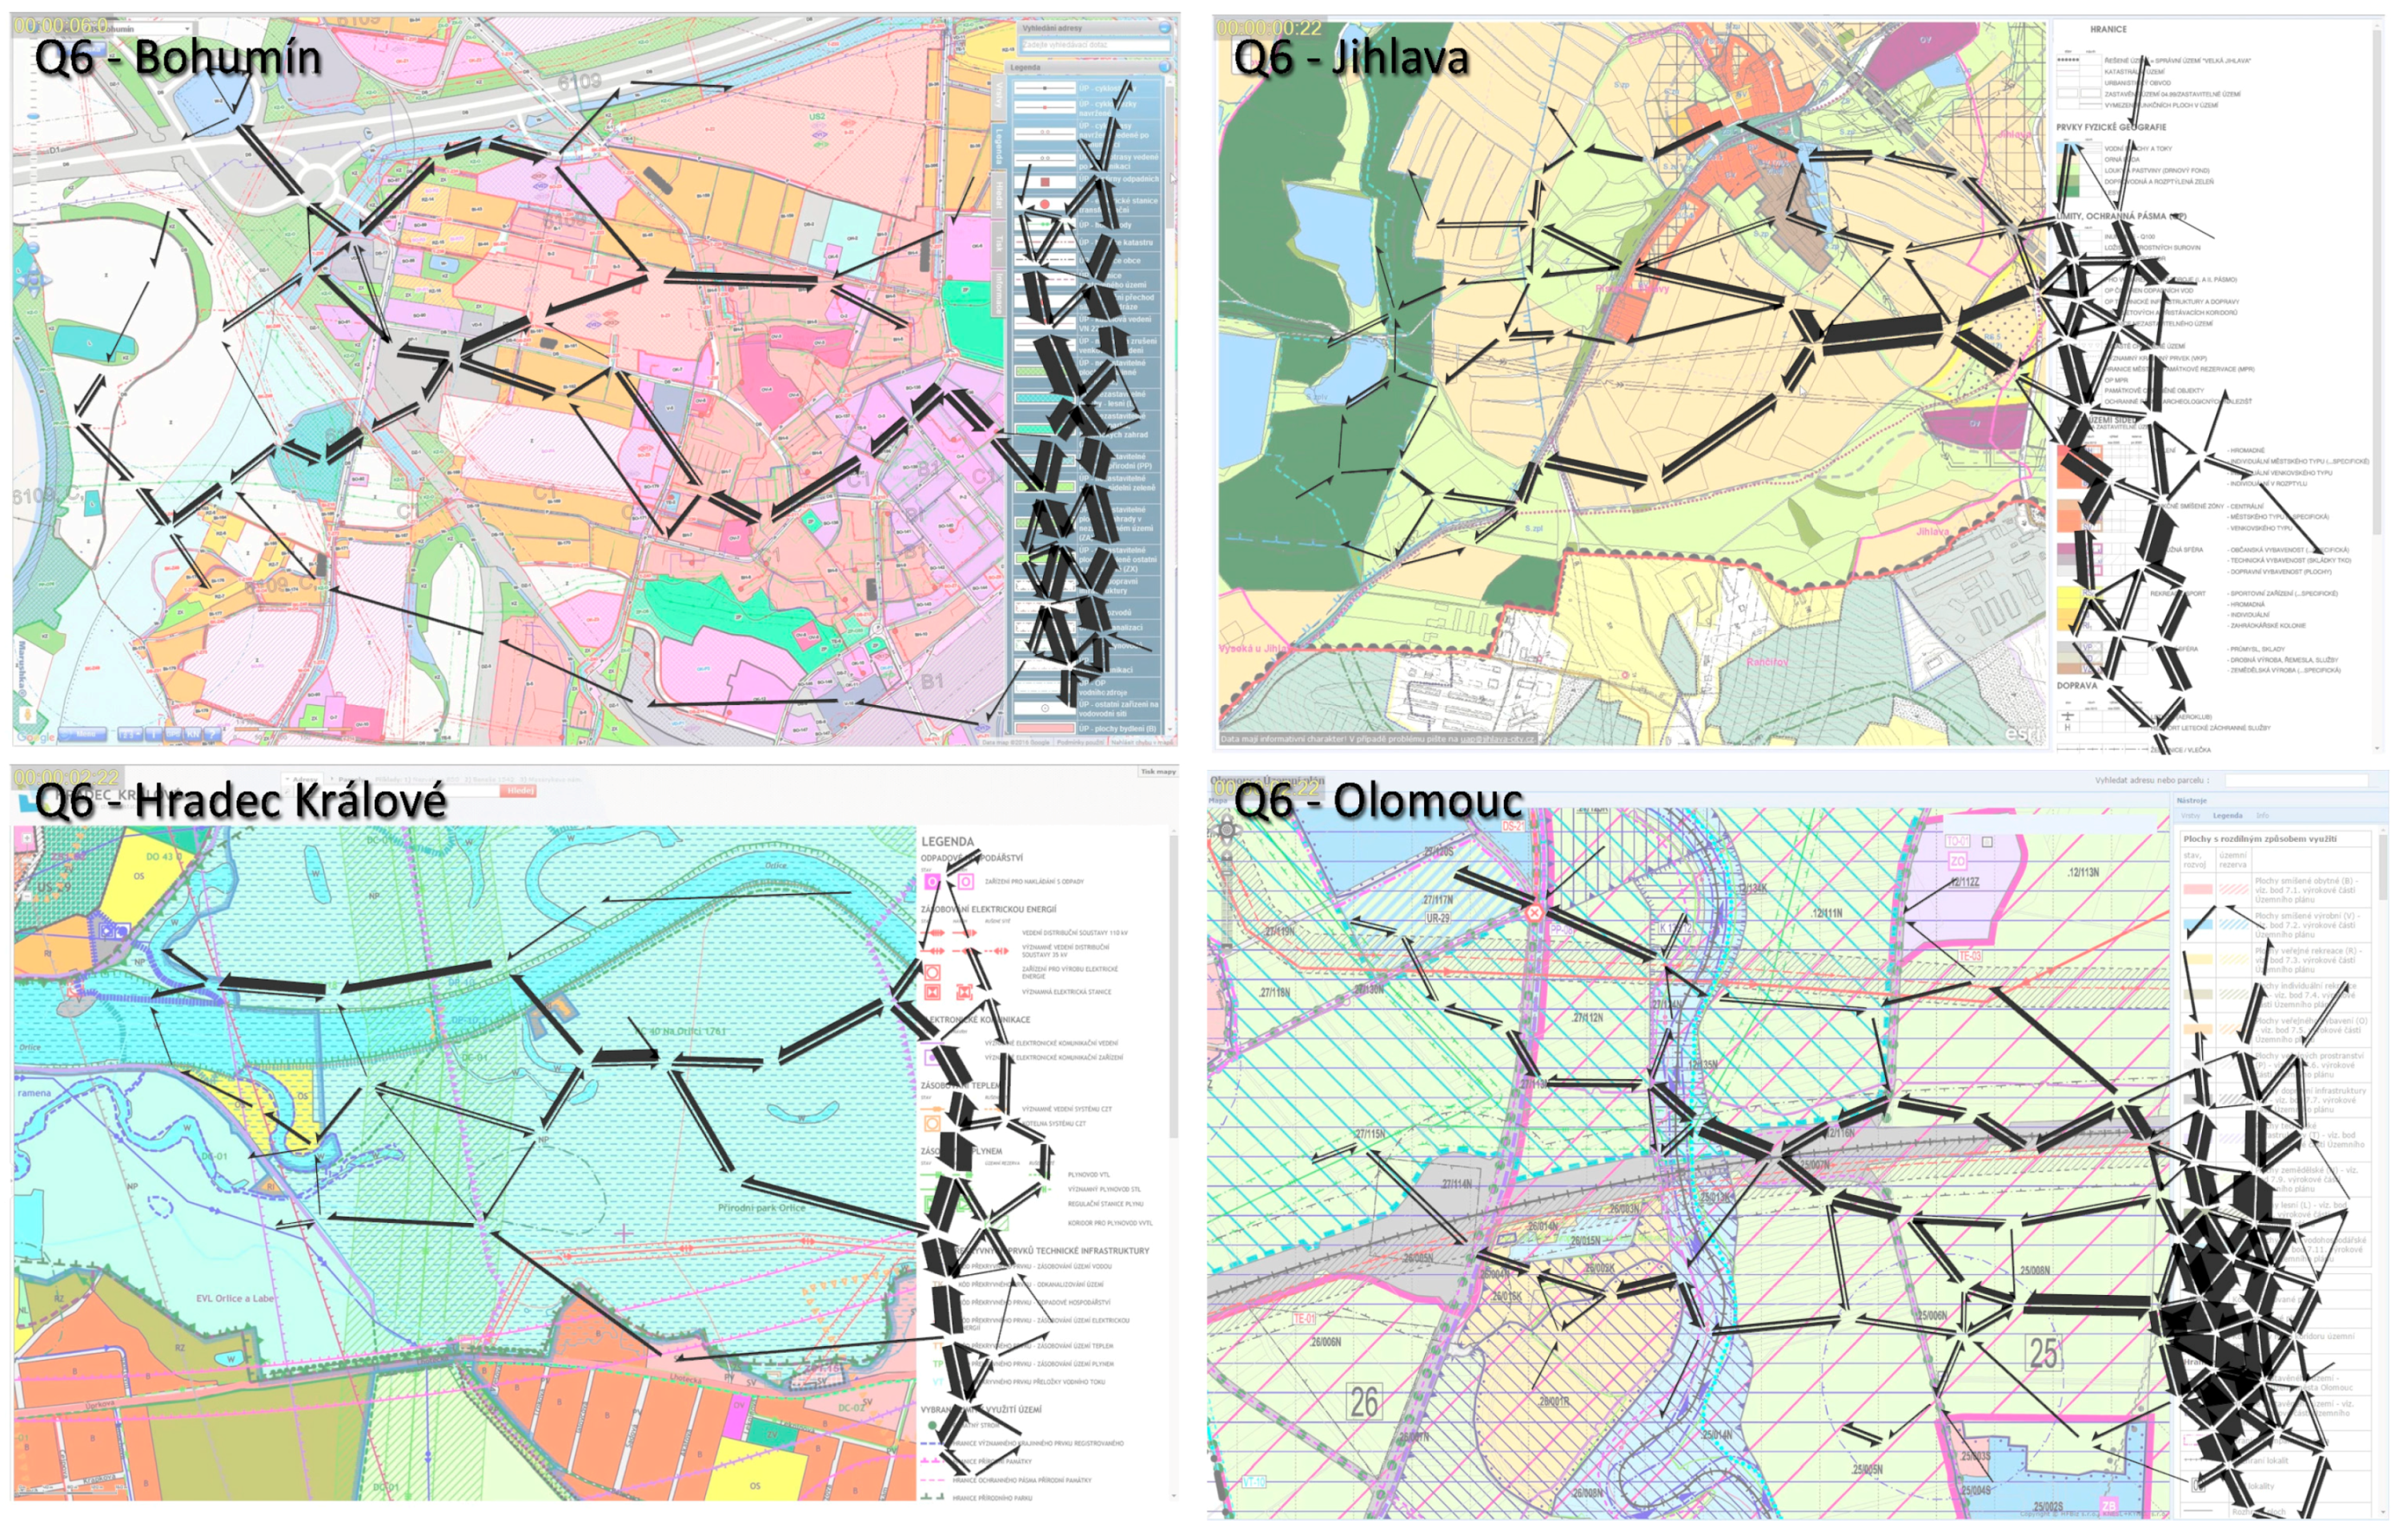
- Q6: Mark a protected area of water resources (Natural protection map)
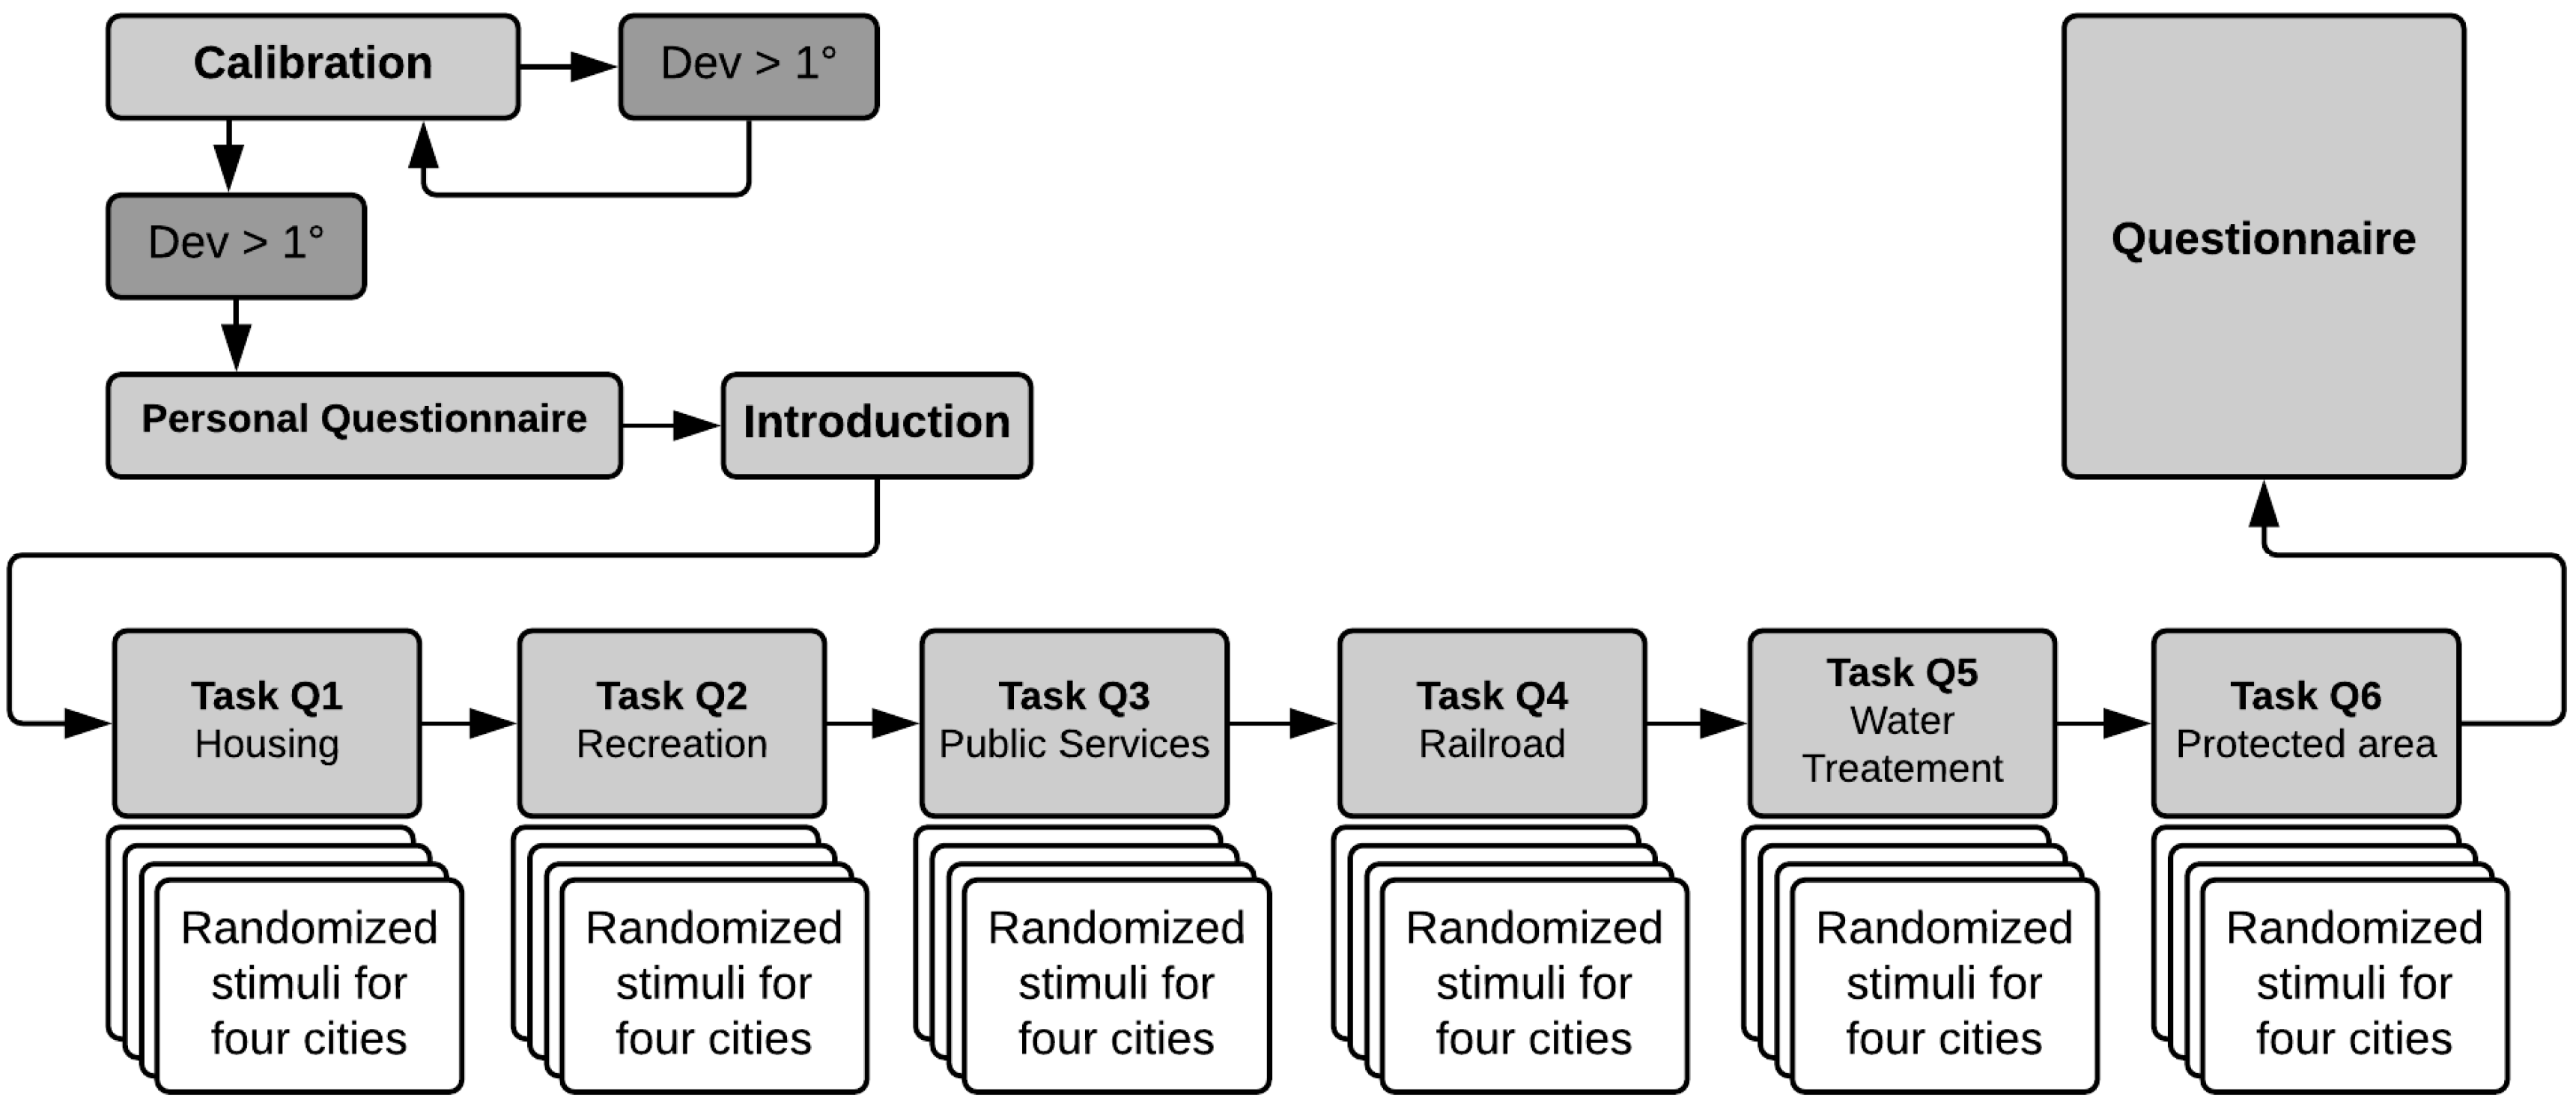
2.1.3. Procedure
2.1.4. Participants
2.2. Fixations and Their Detection
2.3. Methods of Data Analyses
3. Results
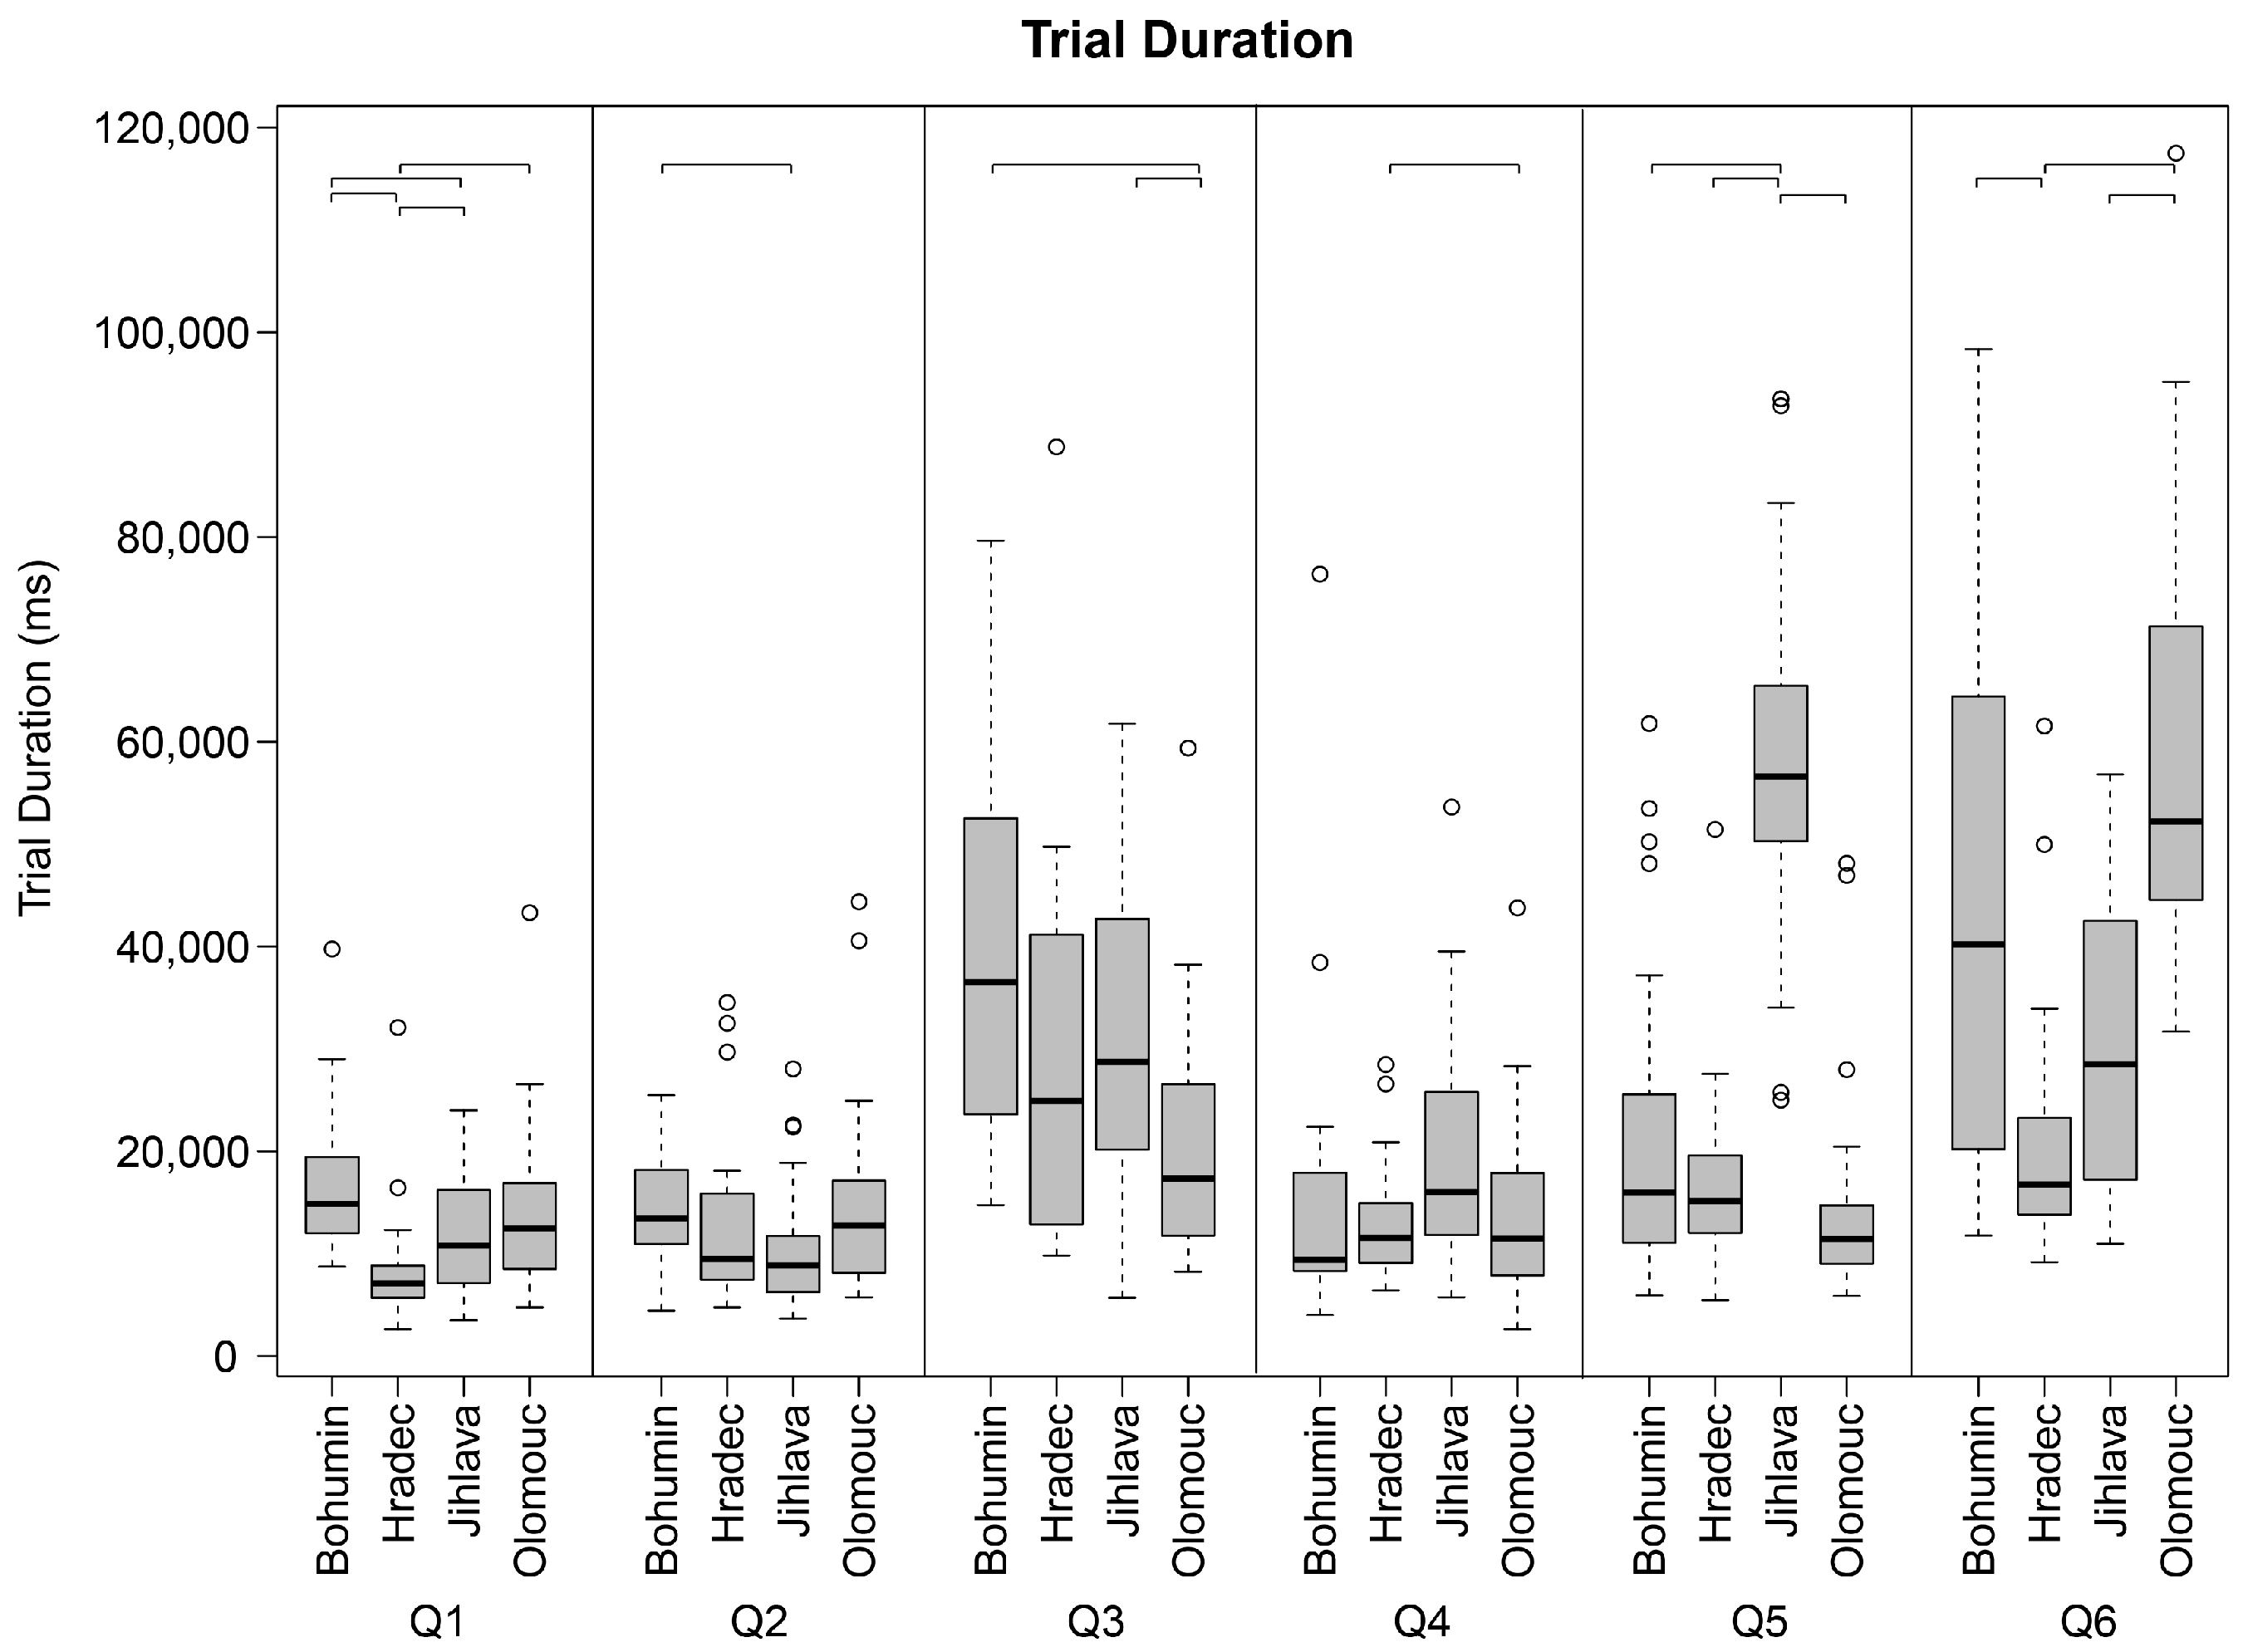
3.1. Trial Duration
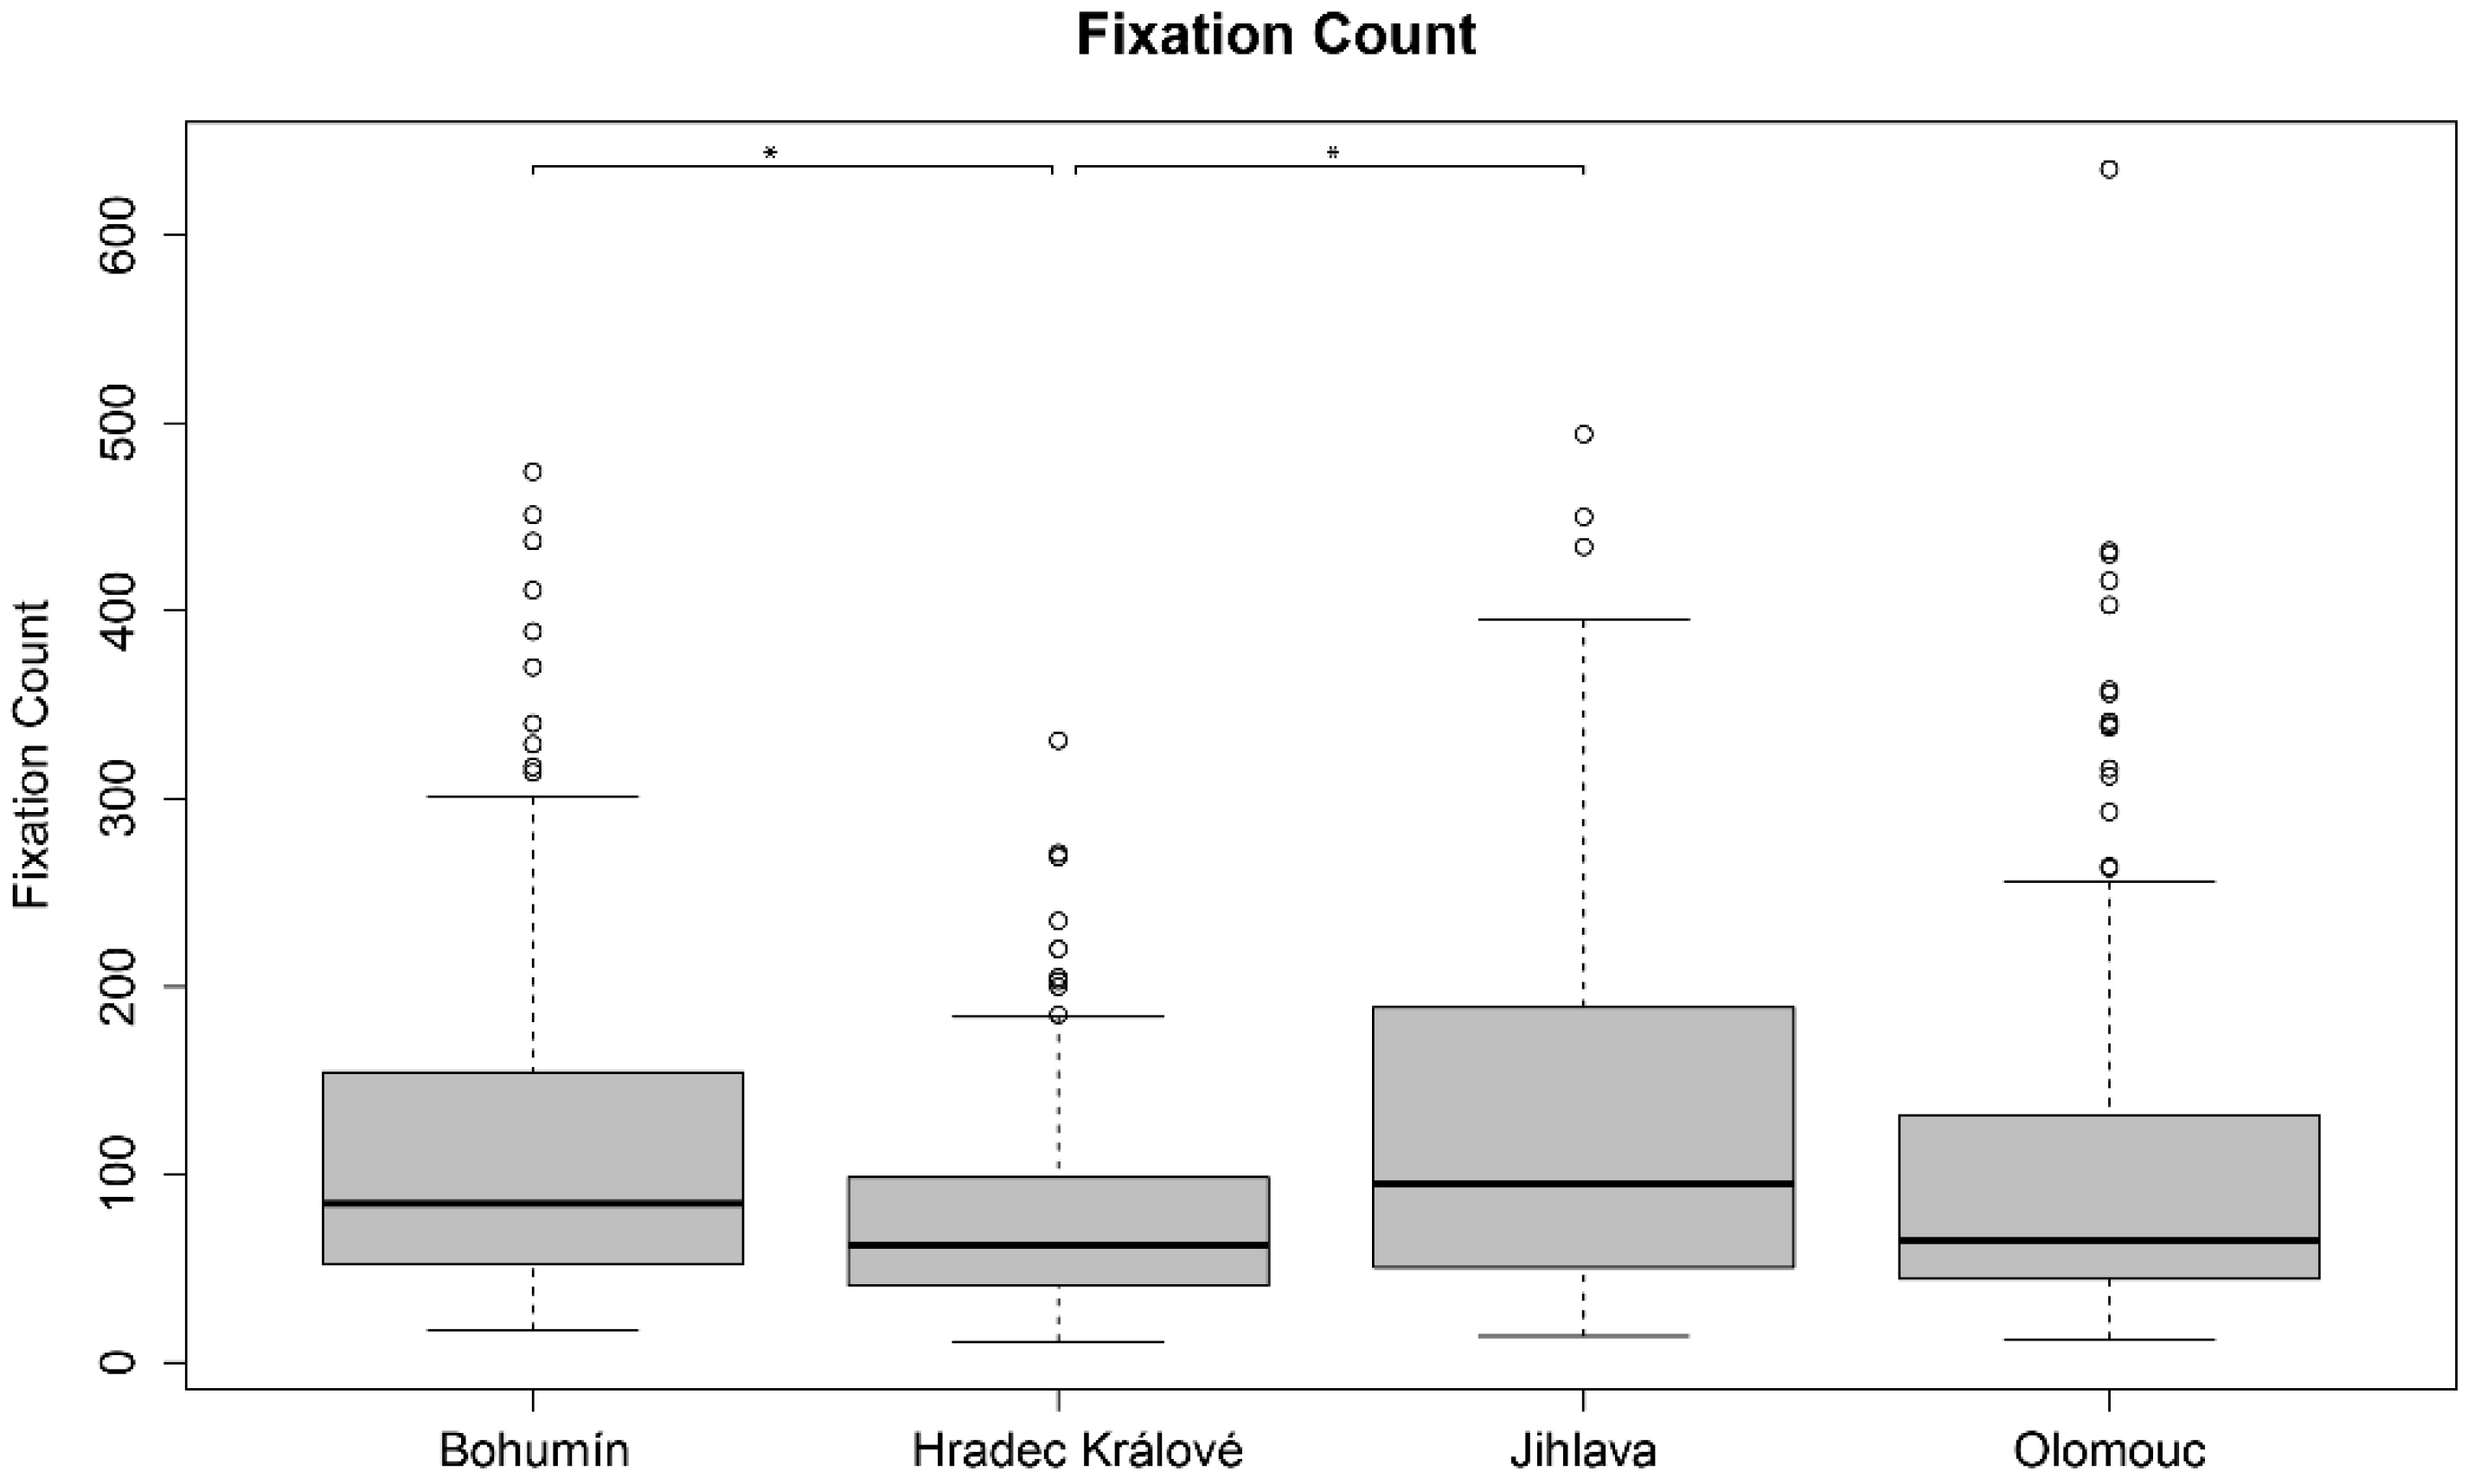
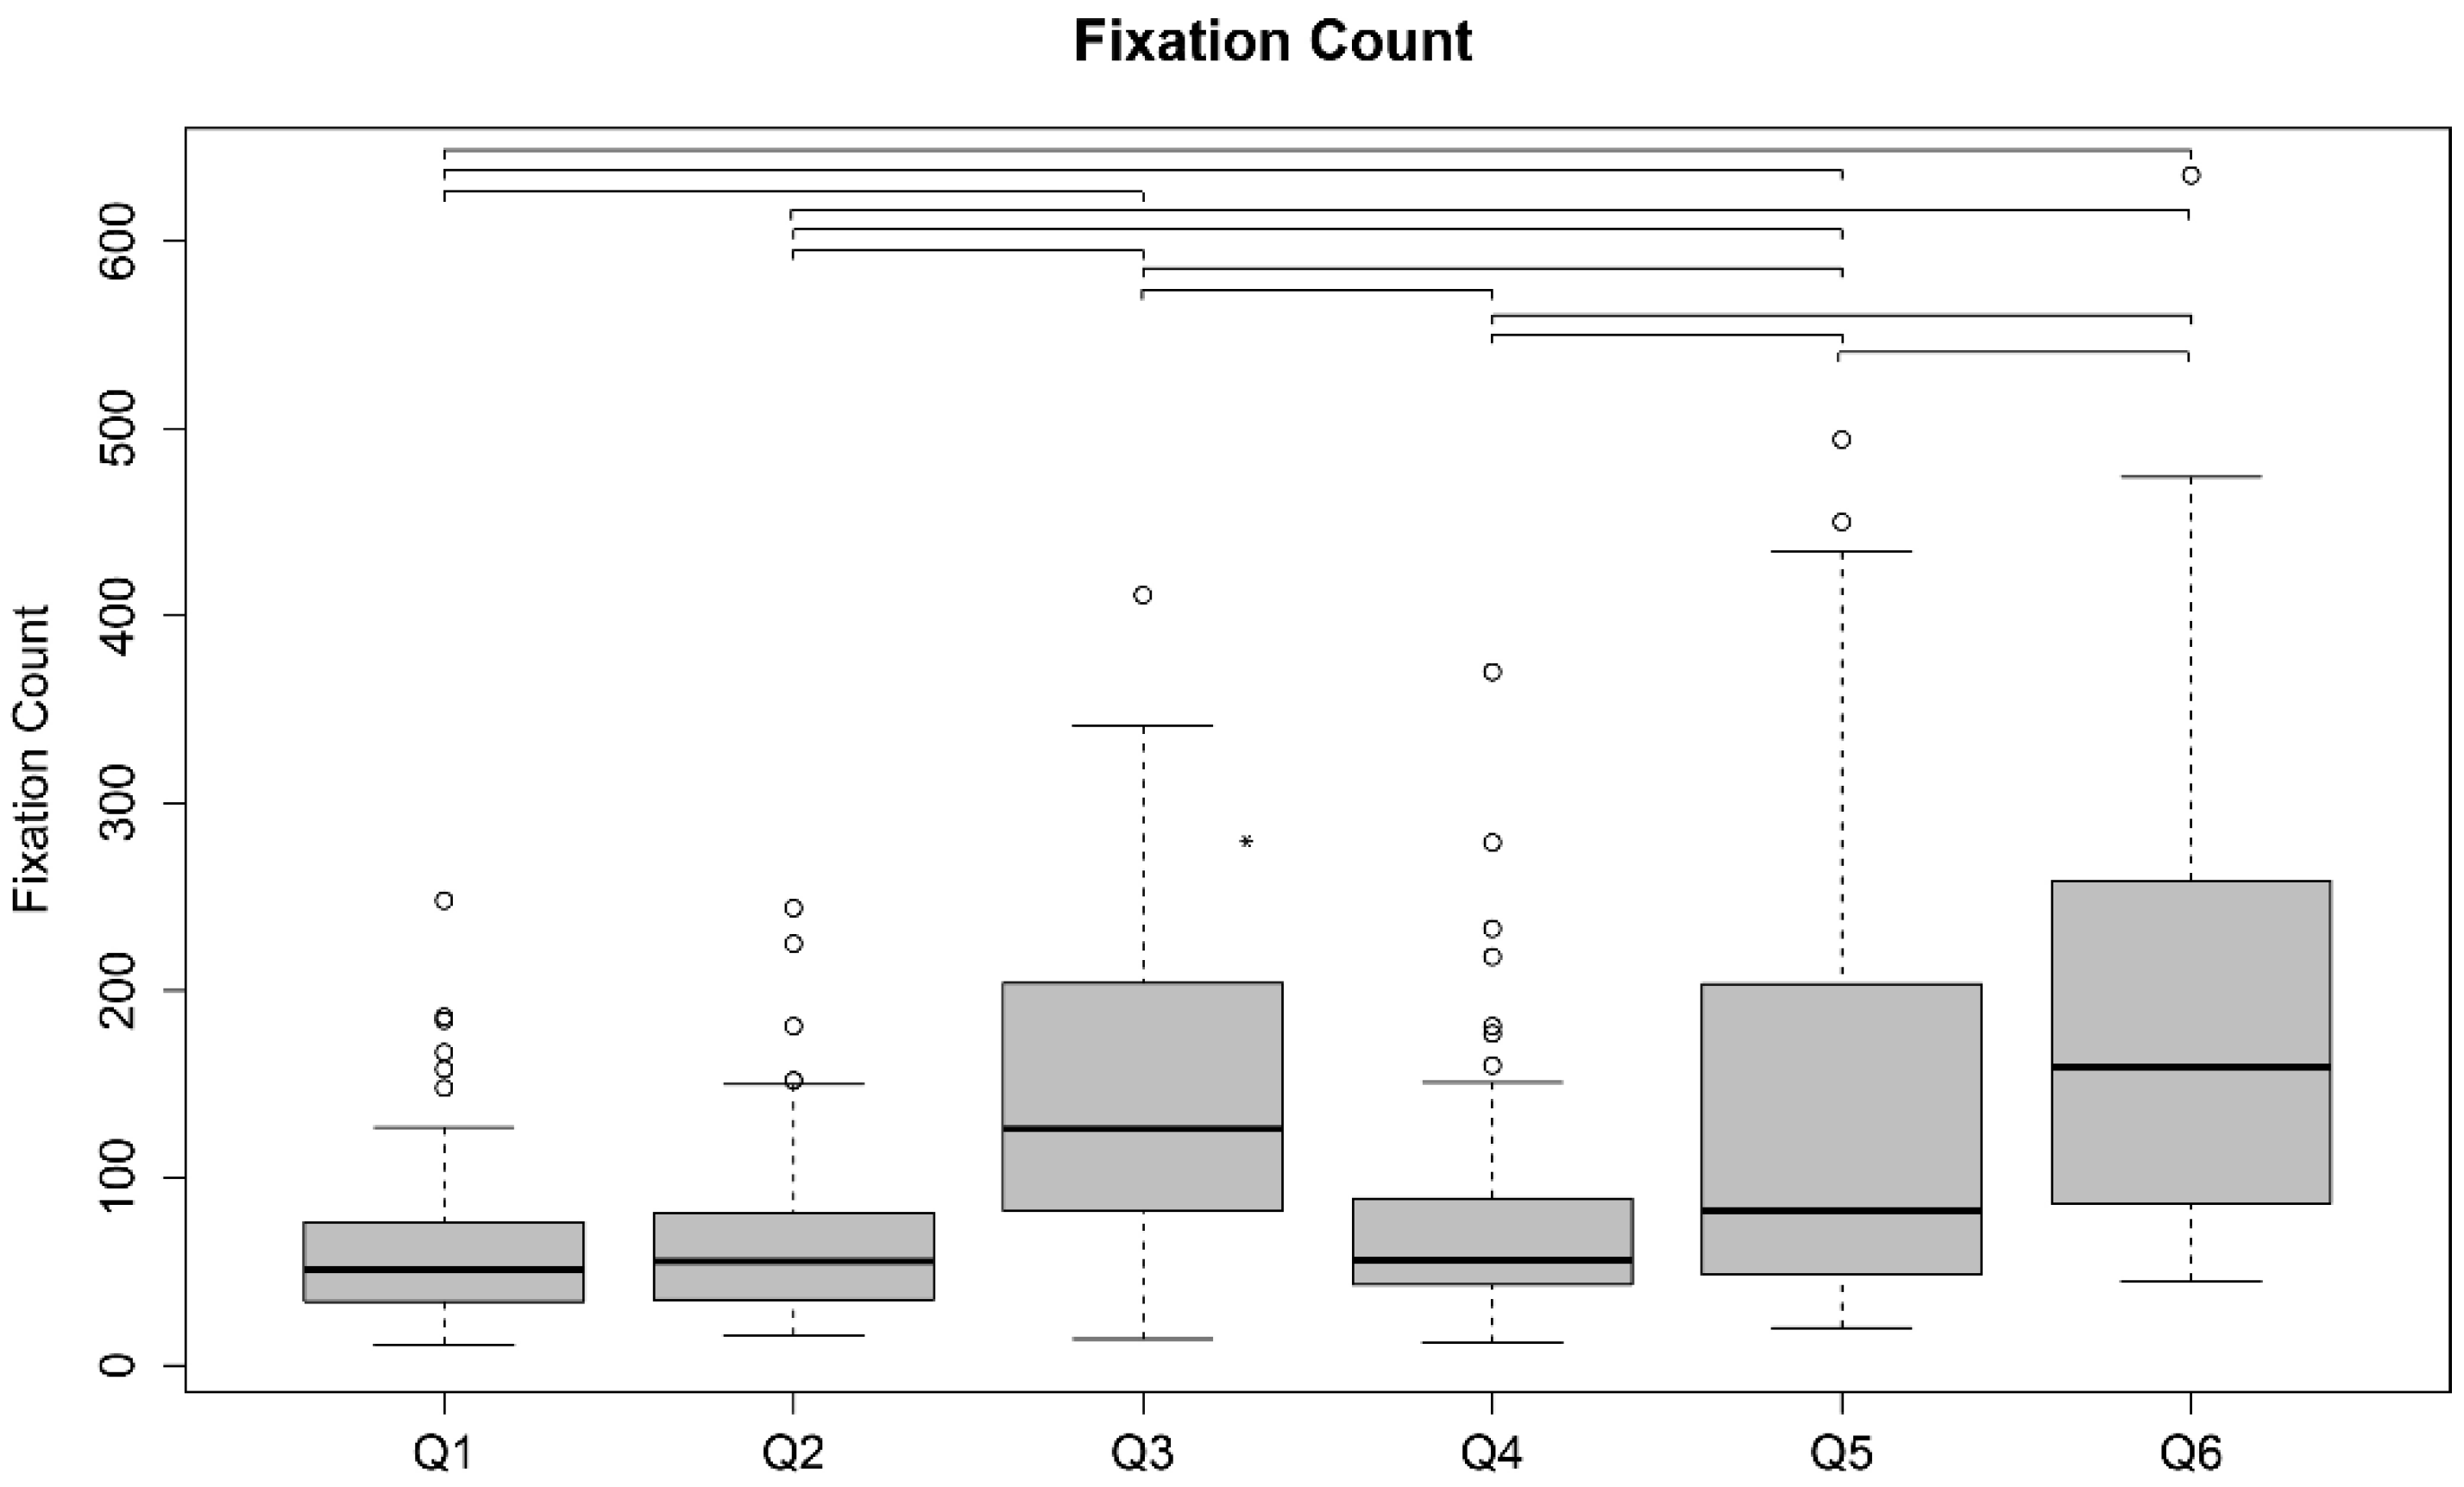
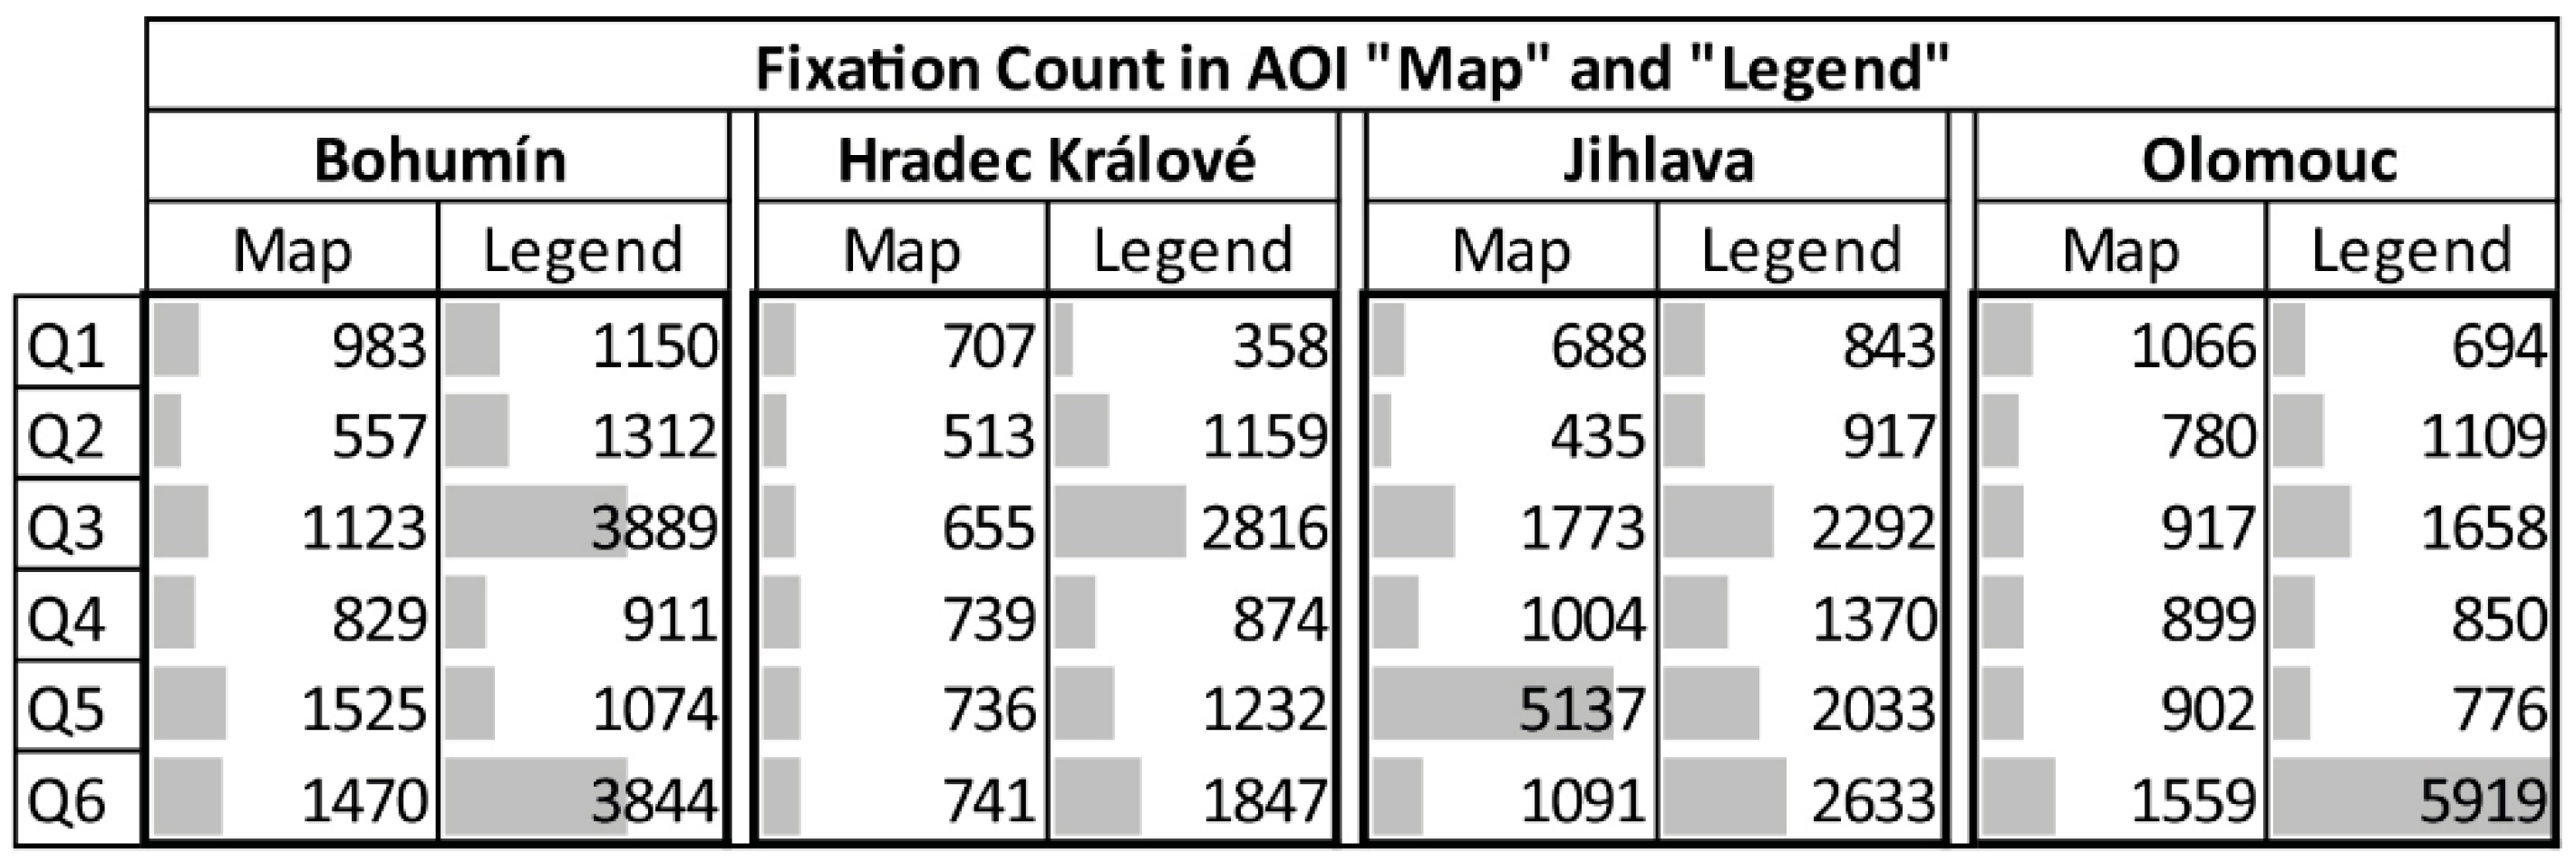
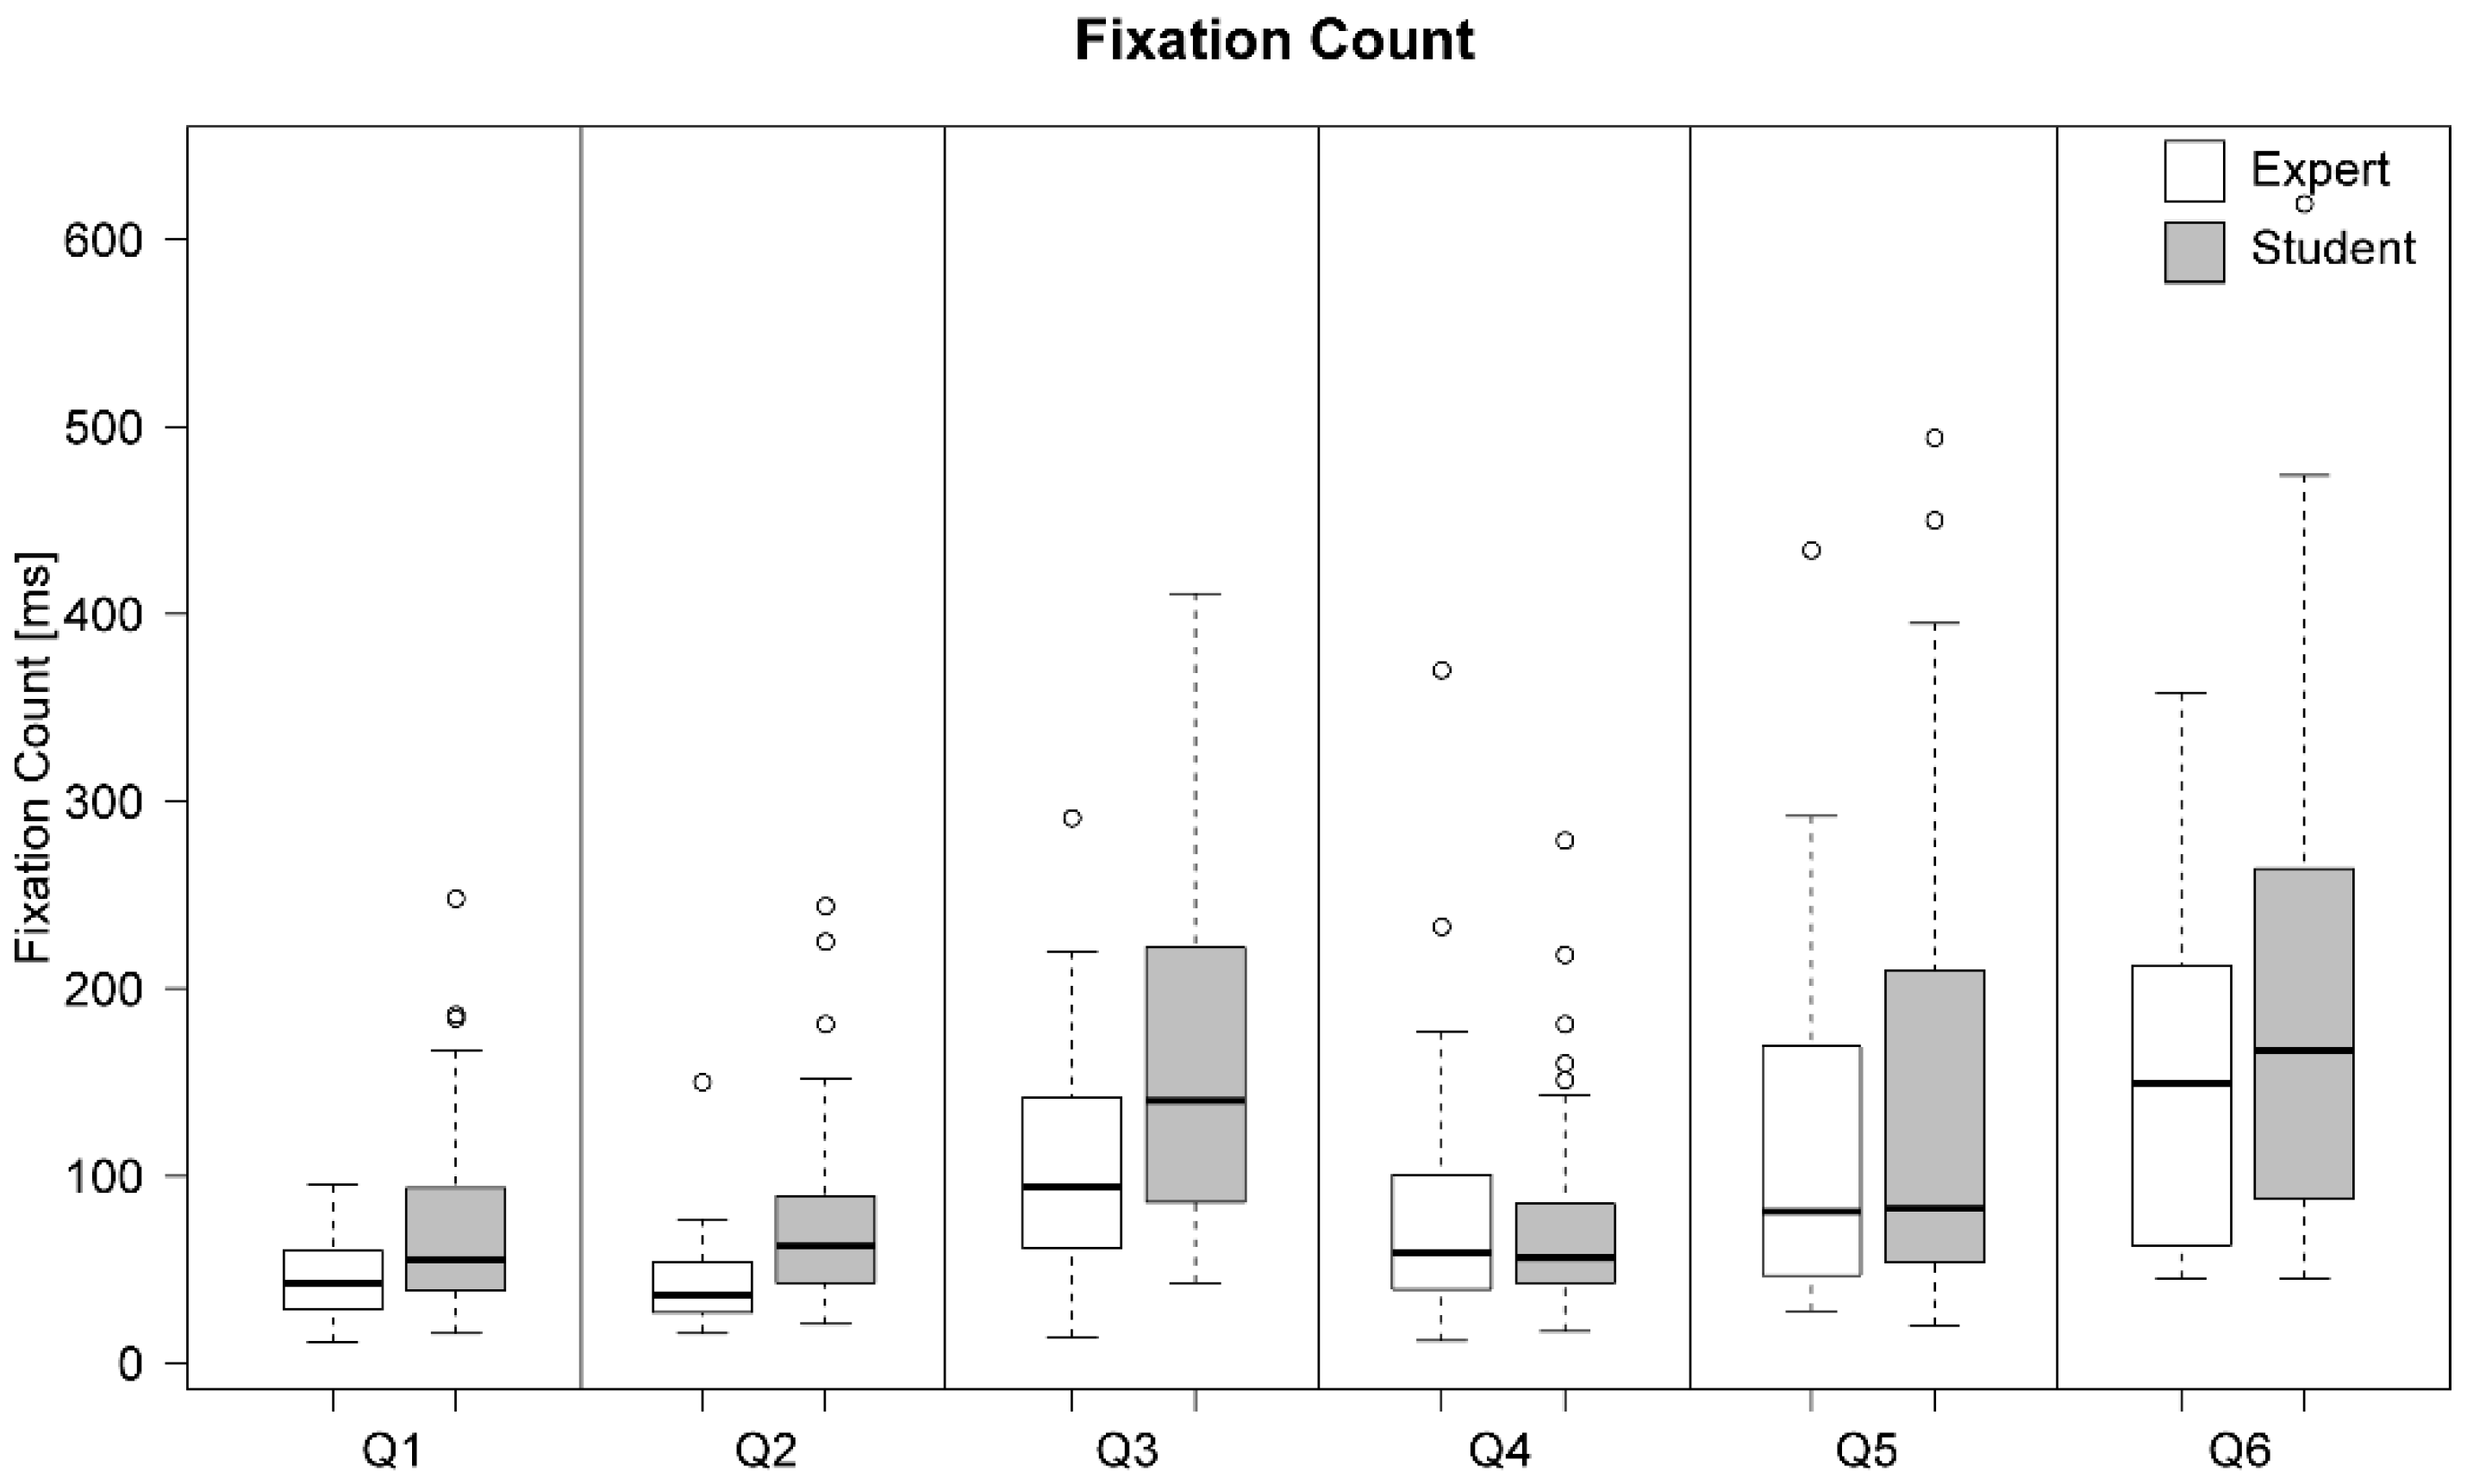
3.2. Fixation Count
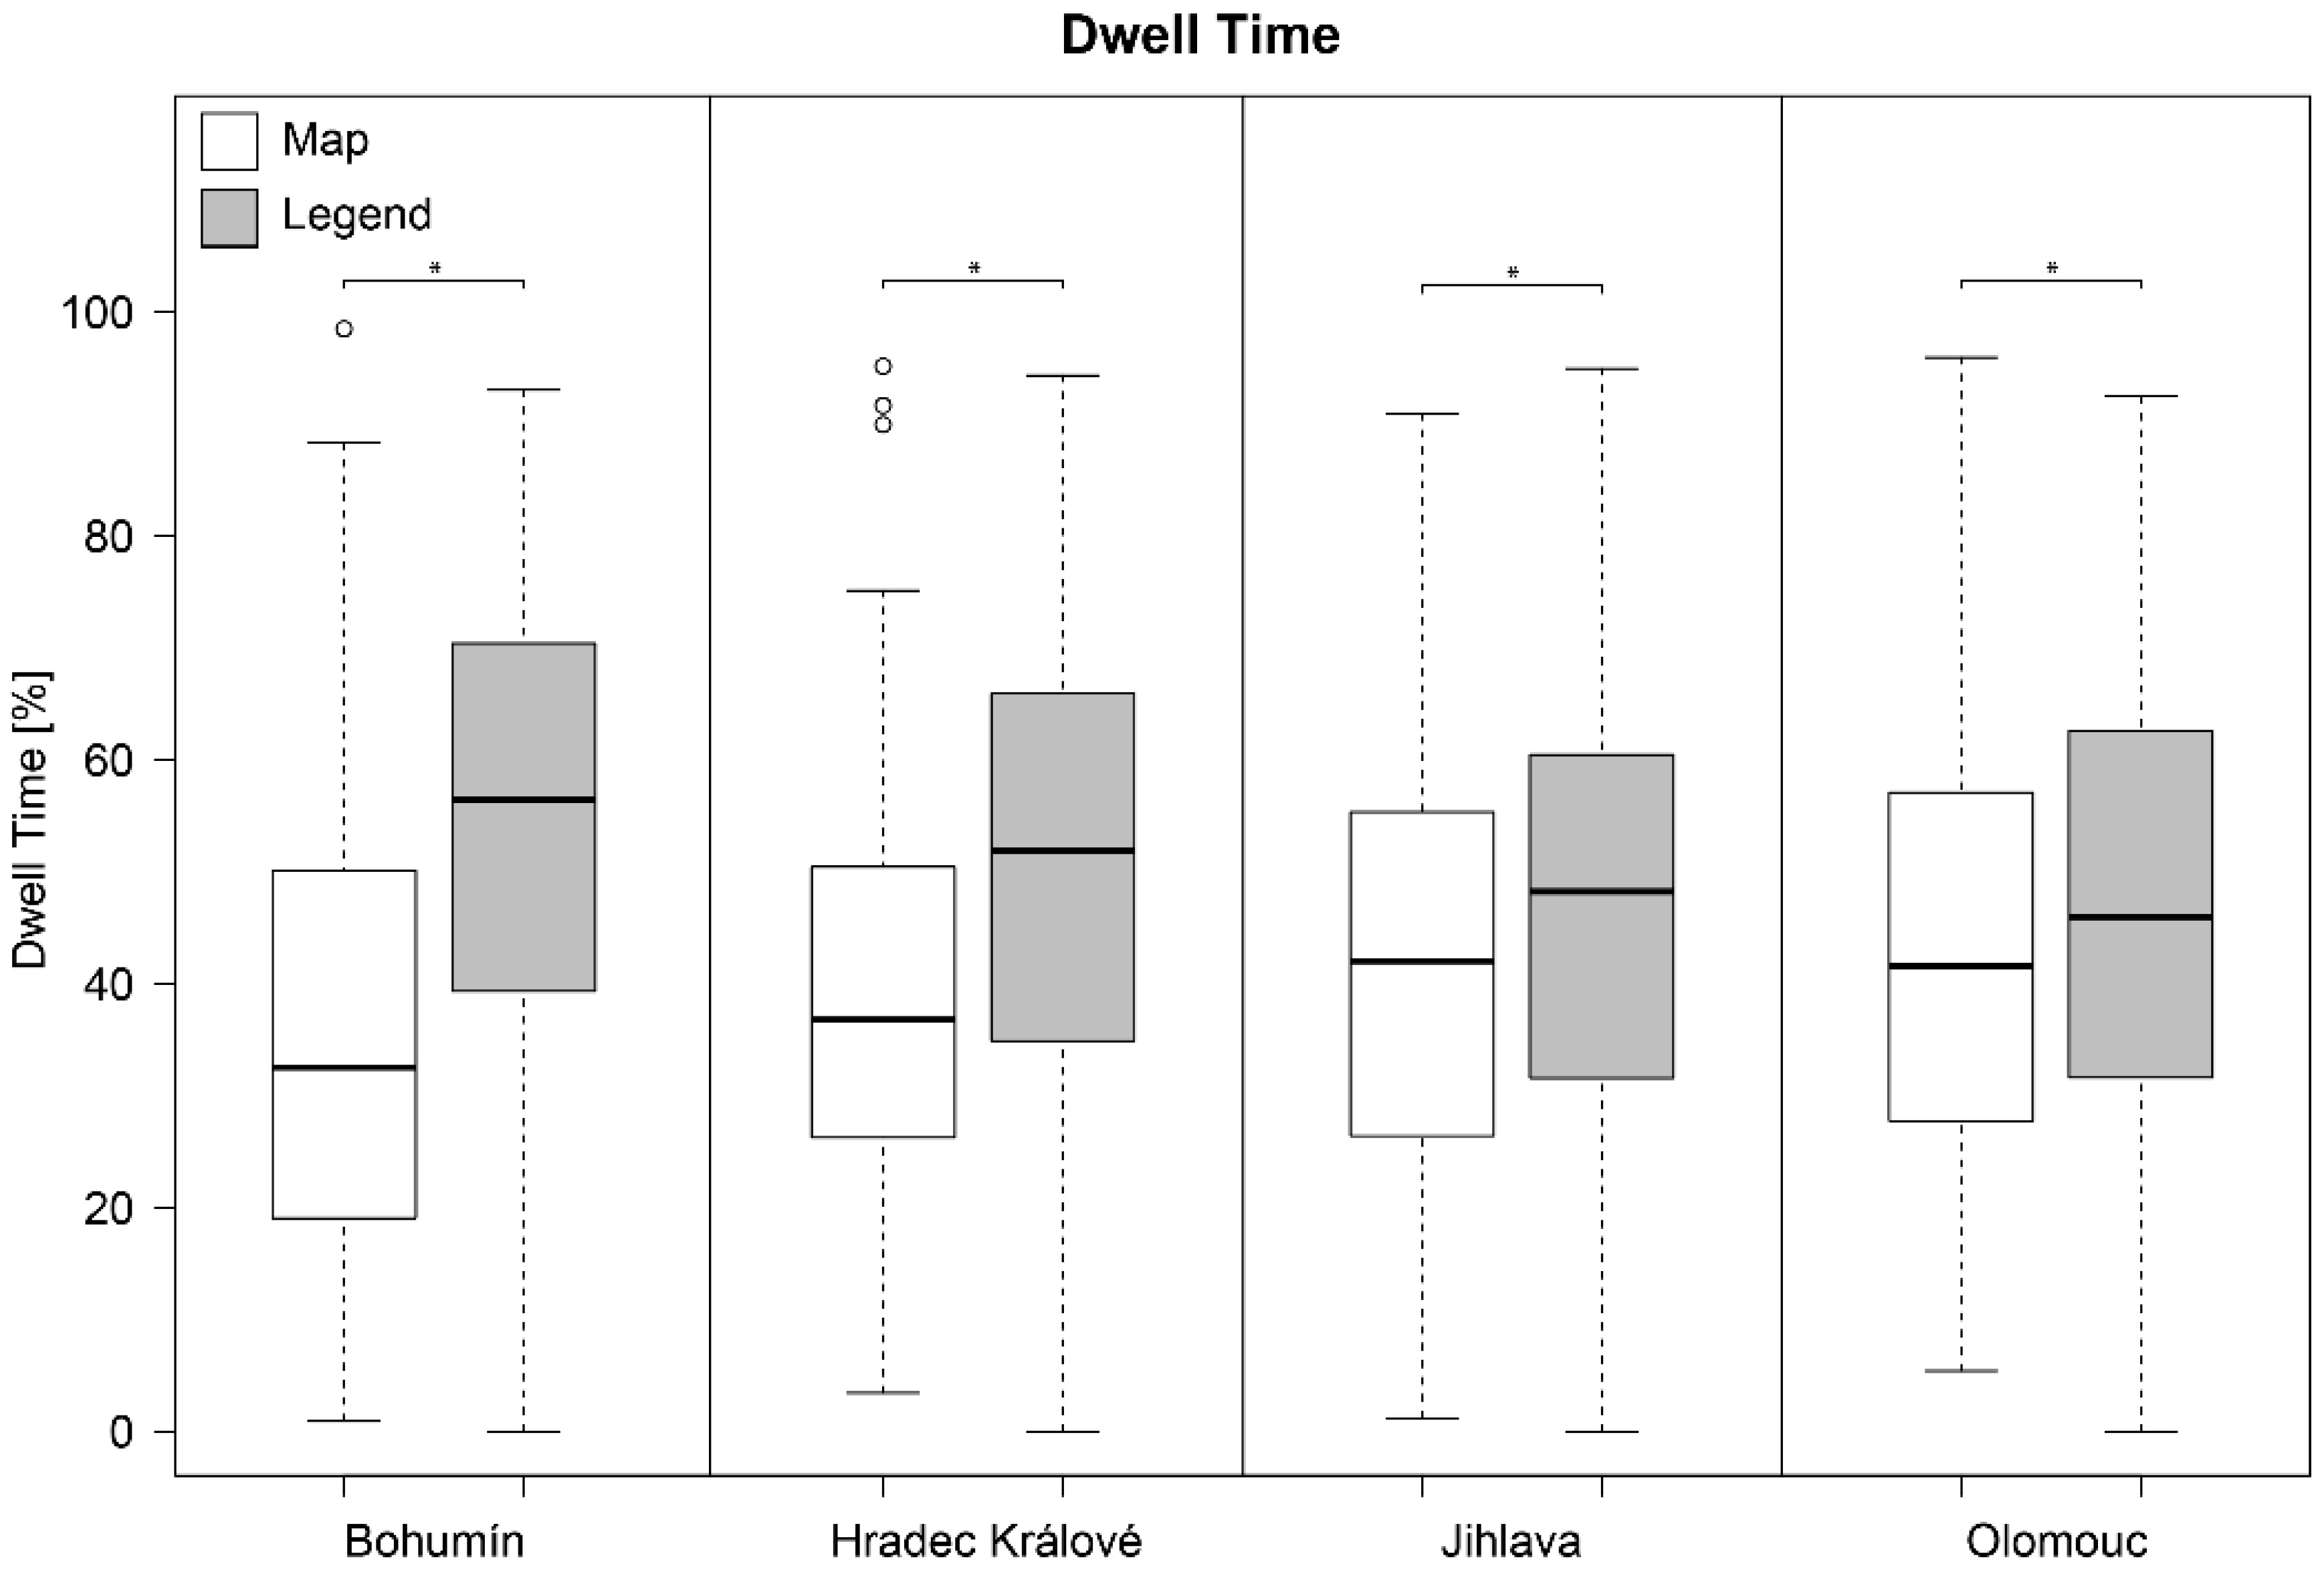
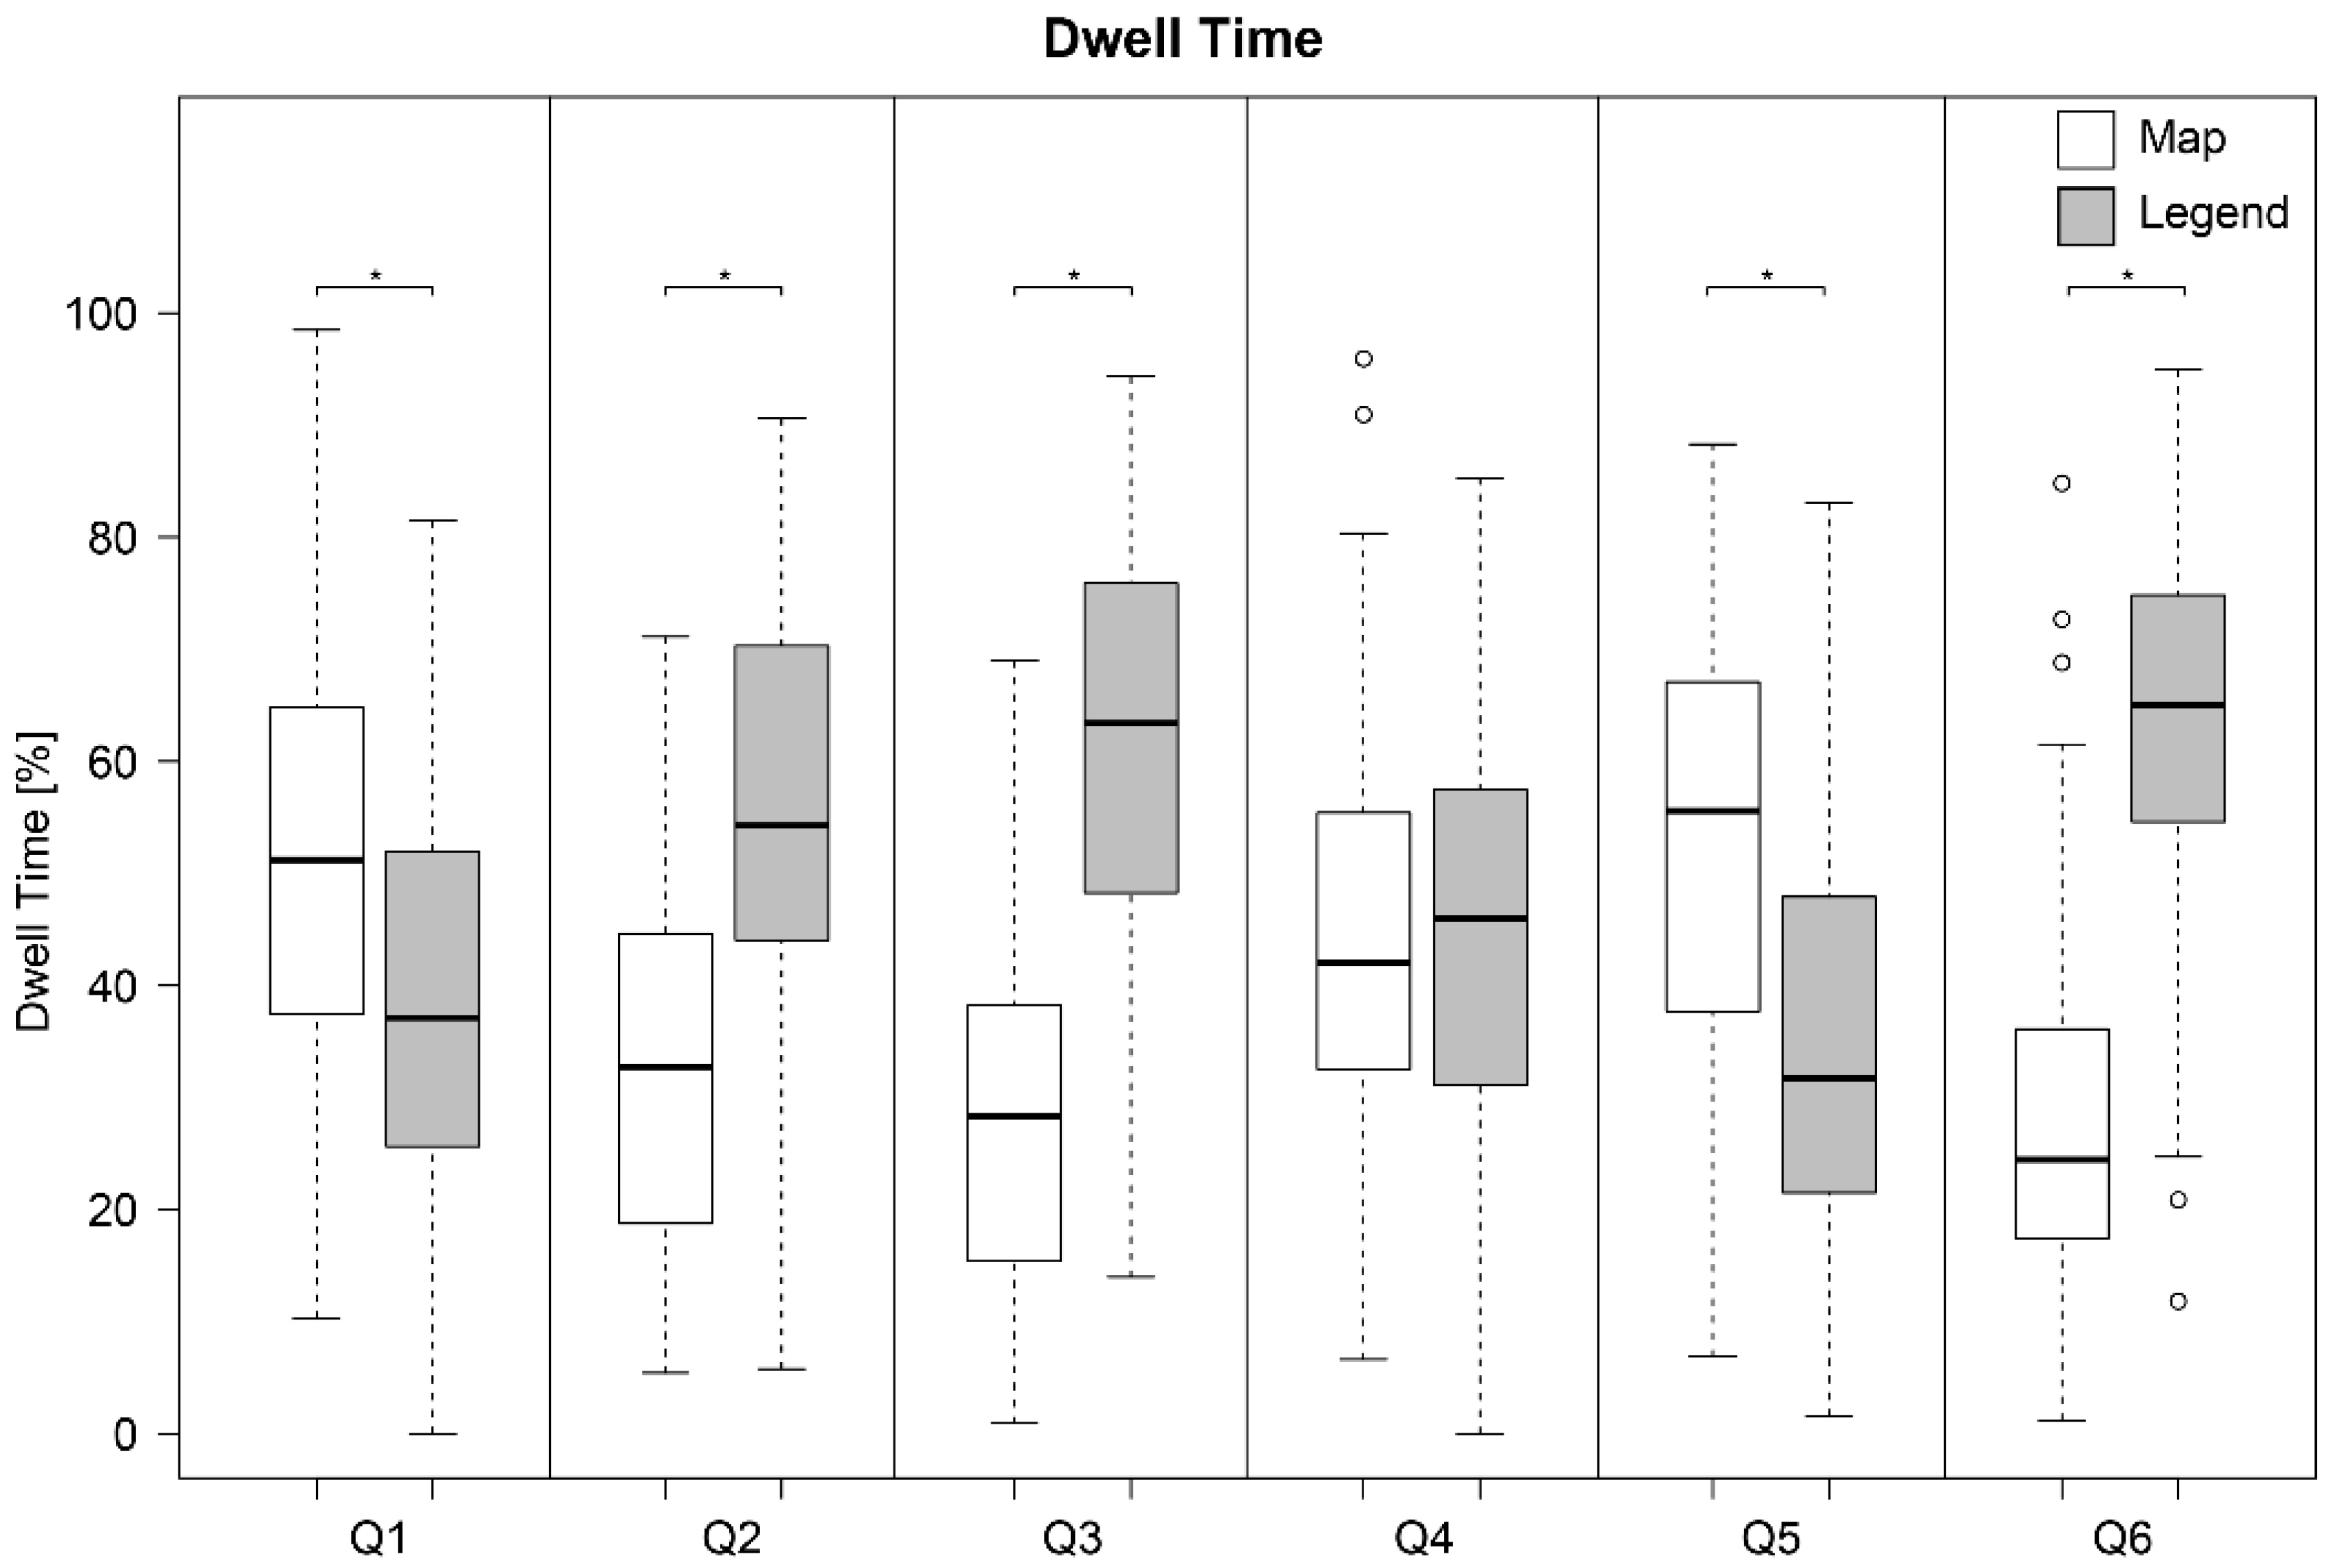
3.3. Differences between Map and Legend
3.4. Differences between Experts and Students
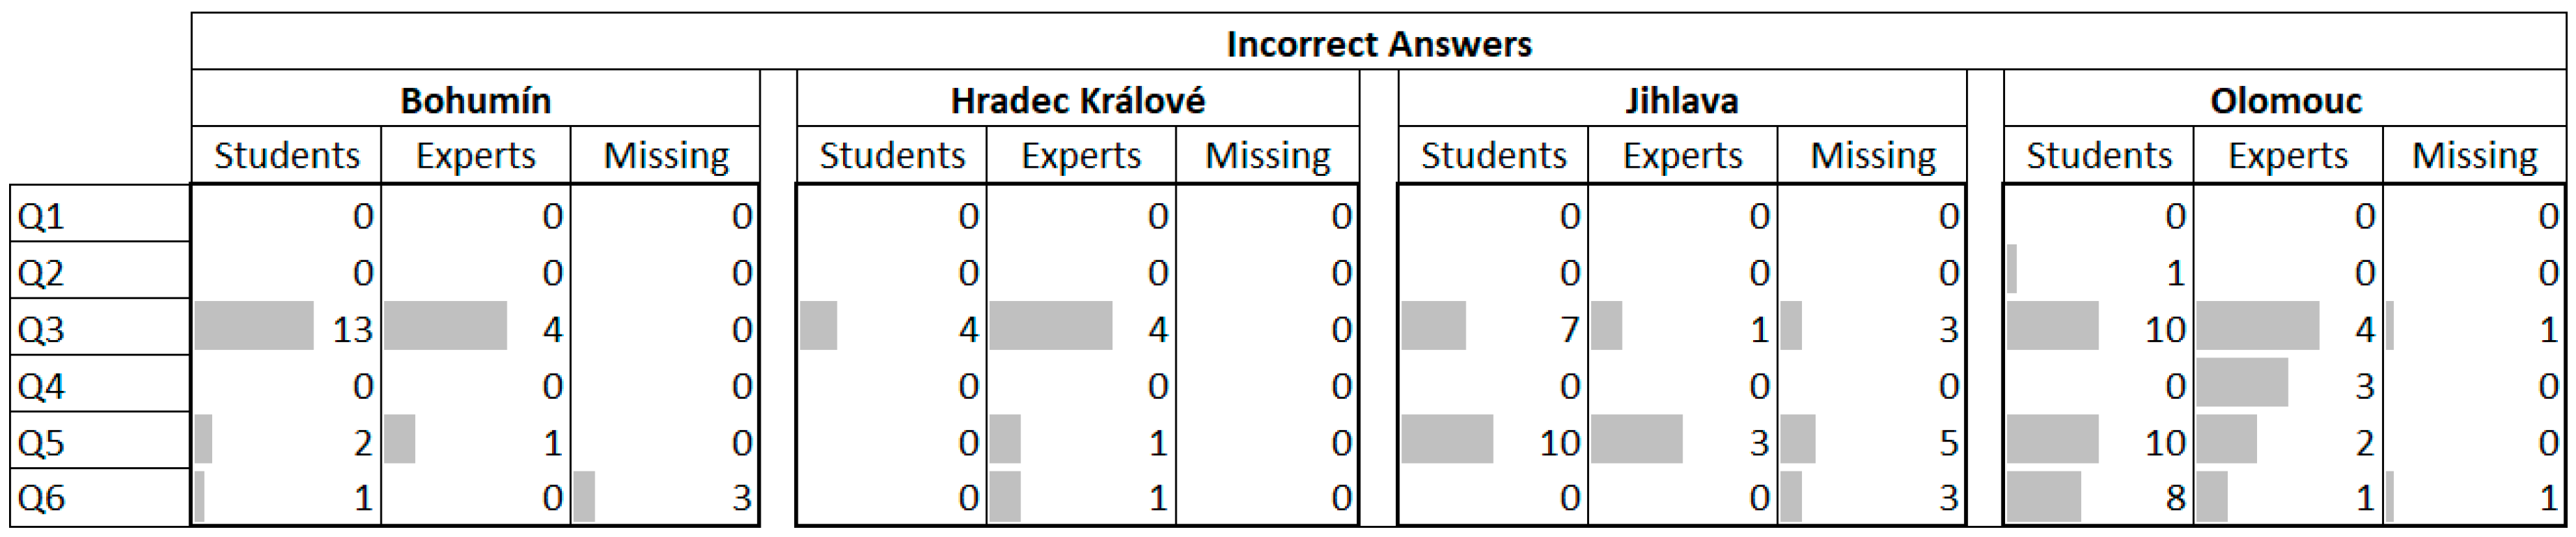
3.5. Accuracy of Answers
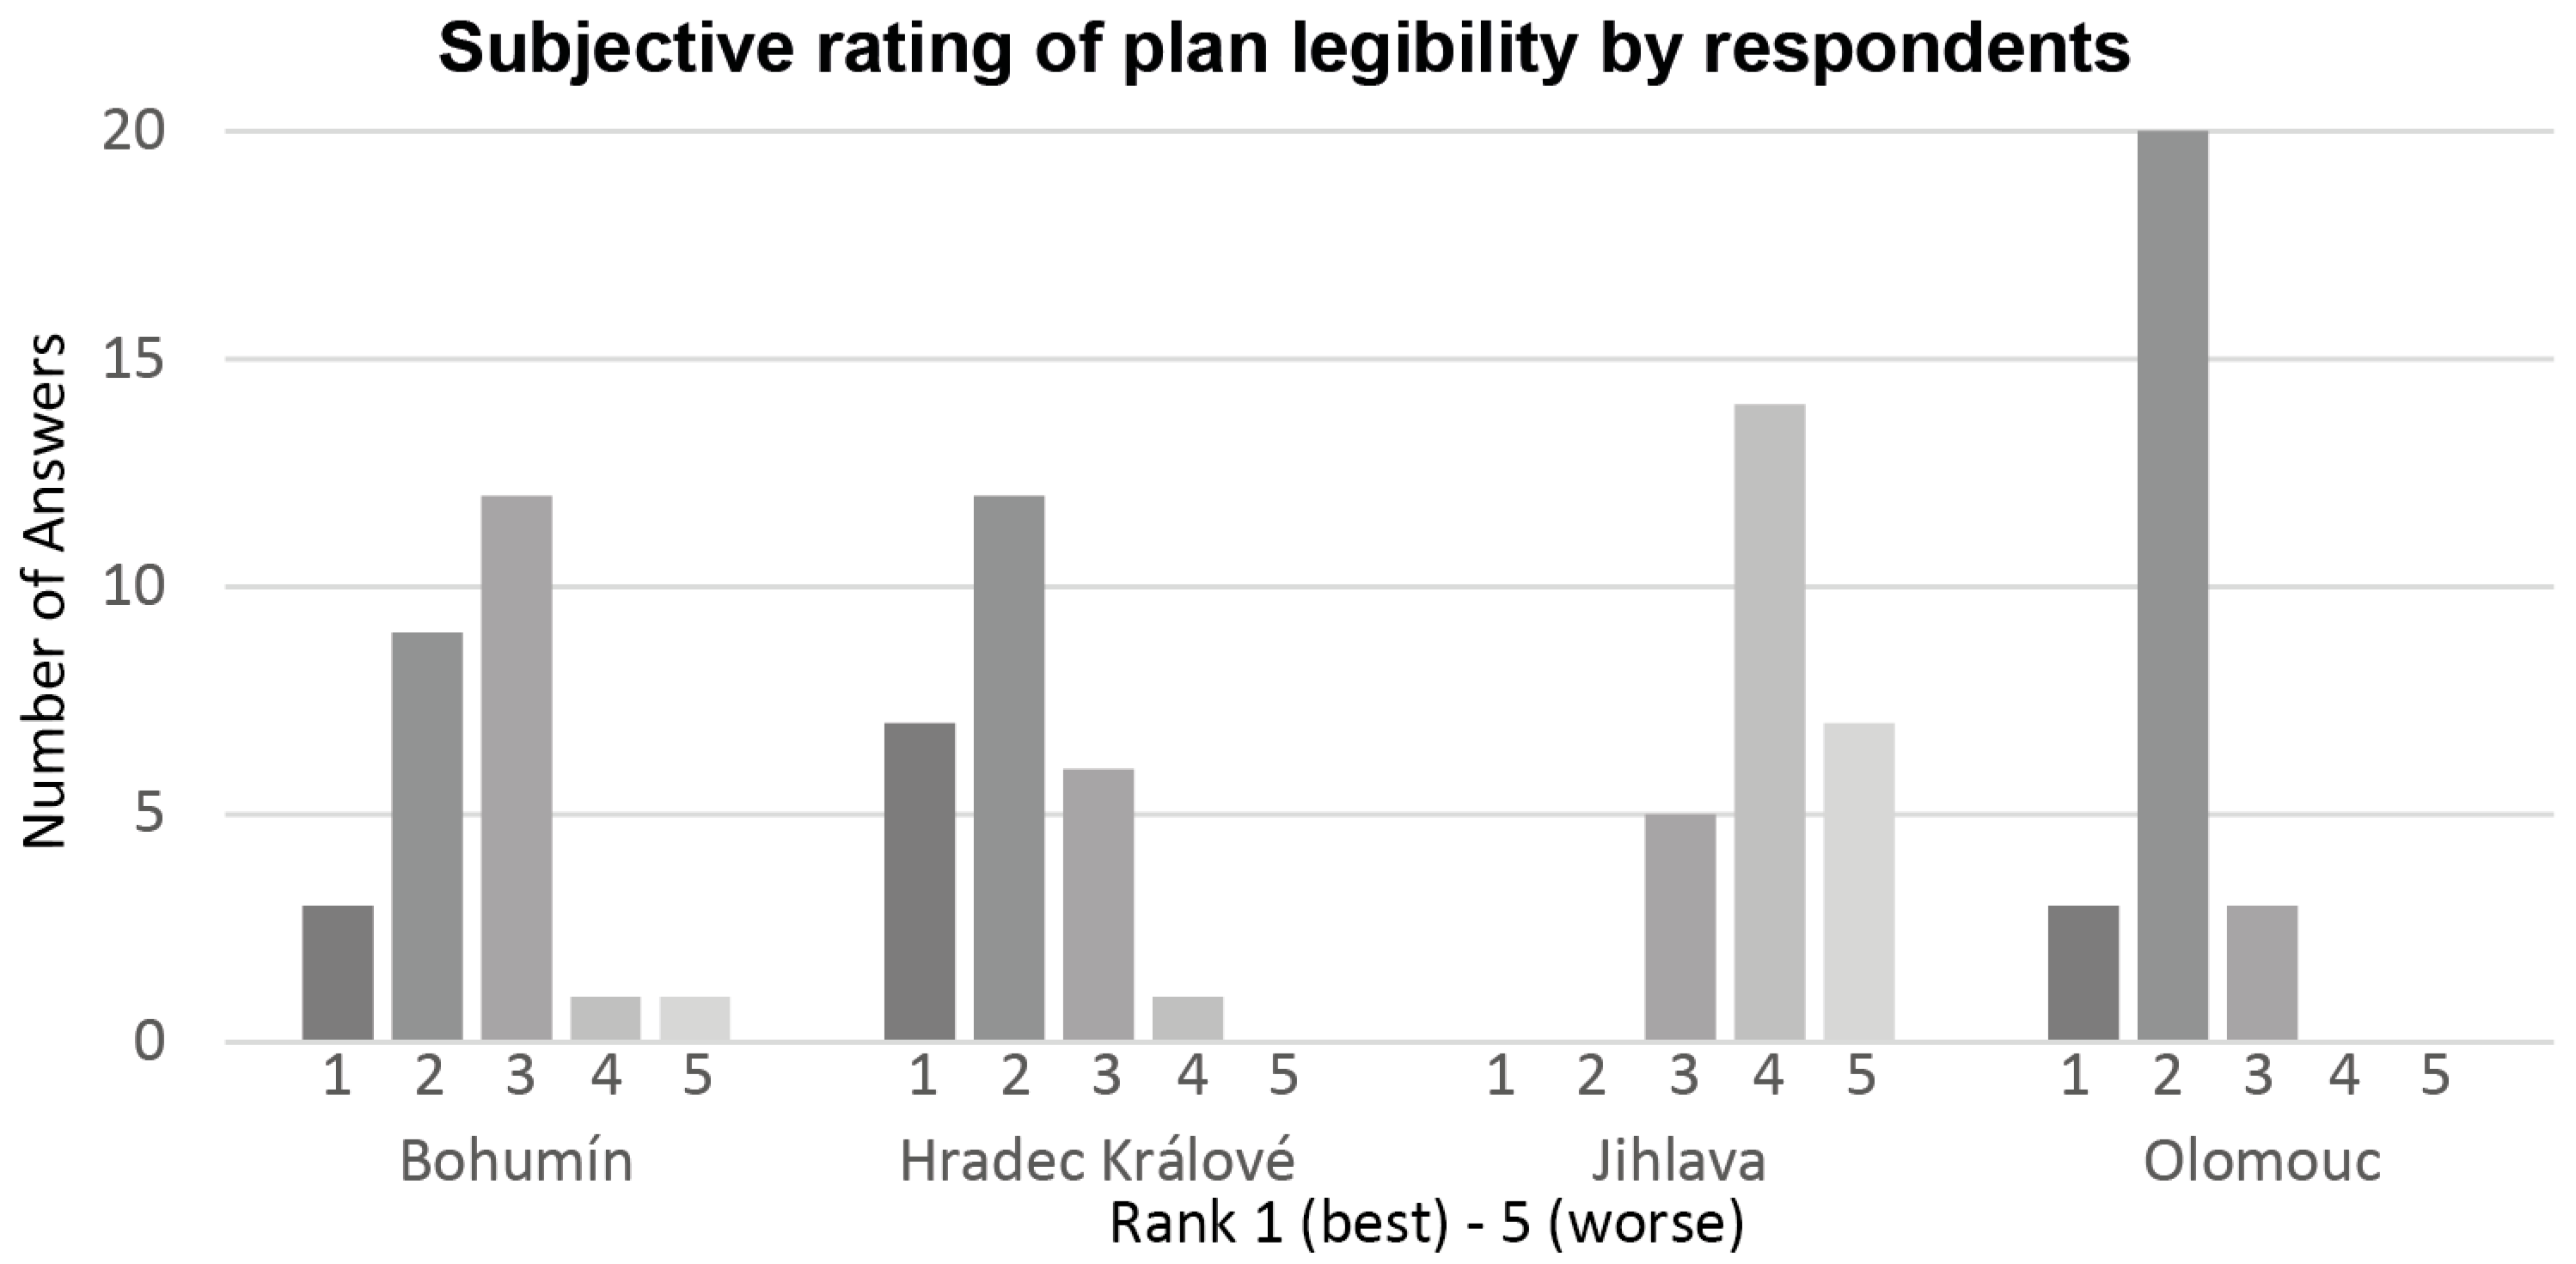
3.6. Results of the Questionnaire
4. Discussion
5. Conclusions
Supplementary Materials
Author Contributions
Acknowledgments
Conflicts of Interest
References
- Monmonier, M. How to Lie with Maps, 2nd ed.; University of Chicago Press: Chicago, IL, USA, 1996; p. 207. [Google Scholar]
- Churchill, R. Urban cartography and the mapping of Chicago. Geogr. Rev. 2004, 94, 1–22. [Google Scholar] [CrossRef]
- Burian, J.; Brychtová, A.; Vávra, A. Proposal of urban plan symbology standardization: Olomouc region case study. In Proceedings of the 15th International Multidisciplinary Scientific GeoConference Surveying Geology and Mining Ecology Management, Albena, Bulgaria, 16–25 June 2015; Volume 2, pp. 1051–1062. [Google Scholar]
- Dühr, S. The form, style, and use of cartographic visualisations in european spatial planning: Examples from england and germany. Environ. Plan. A 2004, 36, 1961–1989. [Google Scholar] [CrossRef]
- Jarvis, B. The arts of town planning. Plan. Pract. Res. 1995, 10, 111–120. [Google Scholar] [CrossRef]
- Neuman, M. Images as institution builders: Metropolitan planning in madrid. Eur. Plan. Stud. 1996, 4, 293–312. [Google Scholar] [CrossRef]
- Neuman, M. Communicate this! Does consensus lead to advocacy and pluralism? J. Plan. Educ. Res. 2000, 19, 343–350. [Google Scholar] [CrossRef]
- Lussault, M. La ville clarifiée. Essai d’analyse de quelques usages carto- et iconographiques en œuvre dans le projet urbain [the clarified city: An analytical essay on the use and impact of carto- and iconographics in the urban development project]. In La Cartographie en Débat, Représenter ou Convaincre; Cambrézy, L., Maximy, R., Eds.; Karthala-Orstom: Paris, France, 1995; pp. 157–193. [Google Scholar]
- Gabellini, P. Il Disegno Urbanistico [The Urban Drawing]; Nuova Italia Scientifica: Roma, Italy, 1996. [Google Scholar]
- Söderström, O. Des Images pour Agir: Le Visuel en Urbanisme; Payot: Lausanne, Switzerland, 2000; p. 139. [Google Scholar]
- Robinson, A.C.; Roth, R.E.; Blanford, J.; Pezanowski, S.; MacEachren, A.M. Developing map symbol standards through an iterative collaboration process. Environ. Plan. B Plan. Des. 2012, 39, 1034–1048. [Google Scholar] [CrossRef]
- Funkhouser, H.G. Historical Development of the Graphical Representation of Statistical Data; Saint Catherine Press: London, UK, 1937; p. 404. [Google Scholar]
- Burian, J.; Šťávová, Z. Kartografické a geoinformatické chyby v územních plánech [The difficulties of using urban plans for cartographers and geoinformatists]. Geografie 2009, 114, 179–191. [Google Scholar]
- Infrastructure, M.O. Regulation of the Minister of Infrastructure [Rozporządzenie Ministra Infrastruktury z Dnia 26 Sierpnia 2003 r. W Sprawie Wymaganego Zakresu Projektu Miejscowego Planu Zagospodarowania Przestrzennego]. Available online: https://www.google.com/url?sa=t&rct=j&q=&esrc=s&source=web&cd=1&ved=0ahUKEwiOjtCsz4vbAhWID8AKHeD2DGoQFggqMAA&url=http%3A%2F%2Fdziennikustaw.gov.pl%2FD1995029015101.pdf&usg=AOvVaw0fFOoHWp8KmsSXTEggvLSb (accessed on 10 April 2018).
- Pál, S. Different cartographic visualizations of spatial structure in the documents of hungarian spatial policies. In Proceedings of the RSA 2010 Annual International Conference, Regional Responses to Global Shifts: Actors, Institutions and Organisations, Pécs, Hungary, 24–26 May 2010; p. 15. [Google Scholar]
- Norvay, M.O.E.O. Reguleringsplan Bebyggelsesplan. Available online: https://www.google.com/url?sa=t&rct=j&q=&esrc=s&source=web&cd=1&cad=rja&uact=8&ved=0ahUKEwjQn9av0IvbAhVFF8AKHX0cD2EQFggnMAA&url=https%3A%2F%2Fwww.arkitektur.no%2F%3Fnid%3D157760%26lcid%3D1044%26pid%3DNAL-EcoPublication-Attachment&usg=AOvVaw0qYIQZ5raMczDSavJ1Ipzh (accessed on 10 April 2018).
- Burian, J.; Brychtová, A.; Vávra, A.; Hladišová, B. Analytical material for planning in olomouc, czech republic. J. Maps 2016, 12, 649–654. [Google Scholar] [CrossRef]
- Burian, J.; Brus, J.; Voženílek, V. Development of olomouc city in 1930–2009: Based on analysis of functional areas. J. Maps 2013, 9, 64–67. [Google Scholar] [CrossRef]
- Ministry of Regional Development of the Czechoslovakia. Act No.50/1976 Coll. on town & country planning and on building regulations (the Building Act); Ministry of Regional Development of the Czechoslovakia: Prague, Czechoslovakia, 1976.
- Ministry of Regional Development of the Czech. Uniform Standard of Map Symbology for a Main Regional Municipality Plan and the Regulatory Plan; Ministry of Regional Development of the Czech: Prague, Czech Republic, 1999; p. 12.
- Methodology of a Digital Processing of a Regional Municipality Plan for GIS in Public Administration for a District Council; Hydrosoft Veleslavín: Prague, Czech Republic, 2000; p. 52.
- The Minimal Standard for Digital Processing of Regional Municipality and Town Plans in GIS; Hydrosoft Veleslavín: Prague, Czech Republic, 2005; p. 52.
- T-MAPY. Methodology of Digital Processing of Rpd for Gis; T-MAPY: Hradec Králové, Czech Republic, 2001. [Google Scholar]
- T-MAPY. Integrated Approach for Digital Processing of Regional Municipality Plan for Gis; T-MAPY: Hradec Králové, Czech Republic, 2004. [Google Scholar]
- Štěrba, Z.; Šašinka, Č.; Stachoň, Z.; Štampach, R.; Morong, K. Selected Issues of Experimental Testing in Cartography; Masarykova Univerzita: Brno, Czech Republic, 2015. [Google Scholar]
- Rohrer, C. When to Use Which User-Experience Research Methods. Available online: https://www.nngroup.com/articles/which-ux-research-methods/ (accessed on 10 April 2018).
- Dühr, S. The Visual Language of Spatial Planning; Routledge: London, UK, 2007; p. 224. [Google Scholar]
- Harley, J.B. Deconstruction the map. Cartogr. Int. J. Geogr. Inf. Geovis. 1989, 26, 1–20. [Google Scholar]
- Pickles, J. Texts, hermeneutics and propaganda maps. In Writing Worlds. Discourse, Text and Metaphor in the Representation of Landscape; Barnes, J.T., Duncan, J.S., Eds.; Routledge: London, UK, 1992; pp. 193–230. [Google Scholar]
- Söderström, O. Paper cities: Visual thinking in urban planning. Cult. Geogr. 1996, 3, 249–281. [Google Scholar] [CrossRef]
- Dühr, S. Analysing cartographic representations in spatial planning. In The Routledge Handbook of Planning Research Methods; Silva, E.A., Healey, P., Harris, N., Eds.; Routledge, Taylor & Francis Group: London, UK, 2015; pp. 192–201. [Google Scholar]
- Tang, X.; Hurni, L. Regional spatial planning maps: A sino-swiss comparison of cartographic visualization methodologies. In Proceedings of the 24th International Cartographic Conferenc—The World’s GeoSpatial Solutions, Santiago, Chile, 15–21 November 2009; International Cartographic Association: Vienna, Austria, 2009; p. 14. [Google Scholar]
- Dühr, S. Spatial policies for regional sustainable development: A comparison of graphic and textual representations in regional plans in england and germany. Reg. Stud. 2005, 39, 1167–1182. [Google Scholar] [CrossRef]
- Goldberg, J.H.; Kotval, X.P. Computer interface evaluation using eye movements: Methods and constructs. Int. J. Ind. Ergon. 1999, 24, 631–645. [Google Scholar] [CrossRef]
- Steinke, T.R. Eye movement studies in cartography and related fields. Cartogr. Int. J. Geogr. Inf. Geovis. 1987, 24, 40–73. [Google Scholar] [CrossRef]
- Brychtova, A.; Popelka, S.; Dobesova, Z. Eye—Tracking methods for investigation of cartographic principles. In Proceedings of the 12th International Multidisciplinary Scientific GeoConference and EXPO, Varna, Bulgaria, 17–23 June 2012; Volume 2, pp. 1041–1048. [Google Scholar]
- Coltekin, A.; Heil, B.; Garlandini, S.; Fabrikant, S.I. Evaluating the effectiveness of interactive map interface designs: A case study integrating usability metrics with eye-movement analysis. Cartogr. Geogr. Inf. Sci. 2009, 36, 5–17. [Google Scholar] [CrossRef]
- Fabrikant, S.I.; Rebich-Hespanha, S.; Andrienko, N.; Andrienko, G.; Montello, D.R. Novel method to measure inference affordance in static small-multiple map displays representing dynamic processes. Cartogr. J. 2008, 45, 201–215. [Google Scholar] [CrossRef]
- Brychtova, A.; Popelka, S.; Vozenilek, V. The analysis of eye movement as a tool for evaluation of maps and graphical outputs from gis. In Proceedings of the 19th International Conference on Geography and Geoinformatics: Challenge for Practise and Education; Svobodova, H., Ed.; Masarykova Univerzita: Brno, Czech Republic, 2012; pp. 154–162. [Google Scholar]
- Ooms, K.; De Maeyer, P.; Fack, V. Study of the attentive behavior of novice and expert map users using eye tracking. Cartogr. Geogr. Inf. Sci. 2014, 41, 37–54. [Google Scholar] [CrossRef]
- Kubíček, P.; Šašinka, Č.; Stachoň, Z. Uncertainty visualization testing. In Proceedings of the 4th Conference on Cartography and GIS; Bandrova, T., Konečný, M., Zhelezov, G., Eds.; Bulgarian Cartographic Association: Sofia, Bulgaria, 2012; pp. 247–256. [Google Scholar]
- Kubíček, P.; Šašinka, Č.; Stachoň, Z.; Štěrba, Z.; Apeltauer, J.; Urbánek, T. Cartographic design and usability of visual variables for linear features. Cartogr. J. 2017, 54, 91–102. [Google Scholar] [CrossRef]
- Popelka, S.; Brychtova, A. Eye-tracking study on different perception of 2d and 3d terrain visualisation. Cartogr. J. 2013, 50, 240–246. [Google Scholar] [CrossRef]
- Popelka, S.; Dedkova, P. Extinct village 3d visualization and its evaluation with eye-movement recording. In Computational Science and Its Applications—ICCSA 2014; Lecture Notes in Computer Science (Including Subseries Lecture Notes in Artificial Intelligence and Lecture Notes in Bioinformatics); Springer: New York, NY, USA, 2014; Volume 8579 LNCS, pp. 786–795. [Google Scholar]
- Brychtova, A.; Coltekin, A. Discriminating classes of sequential and qualitative colour schemes. Int. J. Cartogr. 2015, 1, 62–78. [Google Scholar] [CrossRef]
- Taylor, R. Information theory and map evaluation. Int. Yearb. Cartogr. 1975, 15, 165–180. [Google Scholar]
- Garlandini, S.; Fabrikant, S.I. Evaluating the effectiveness and efficiency of visual variables for geographic information visualization. In Spatial Information Theory; Springer: New York, NY, USA, 2009; pp. 195–211. [Google Scholar]
- Petchenik, B.B. Cognition in cartography. Cartogr. Int. J. Geogr. Inf. Geovis. 1977, 14, 117–128. [Google Scholar] [CrossRef]
- Çöltekin, A.; Brychtová, A.; Griffin, A.L.; Robinson, A.C.; Imhof, M.; Pettit, C. Perceptual complexity of soil-landscape maps: A user evaluation of color organization in legend designs using eye tracking. Int. J. Dig. Earth 2017, 10, 560–581. [Google Scholar] [CrossRef]
- Fuchs, S.; Spachinger, K.; Dorner, W.; Rochman, J.; Serrhini, K. Evaluating cartographic design in flood risk mapping. Environ. Hazards 2009, 8, 52–70. [Google Scholar] [CrossRef]
- Dupont, L.; Antrop, M.; Van Eetvelde, V. Eye-tracking analysis in landscape perception research: Influence of photograph properties and landscape characteristics. Landsc. Res. 2013, 39, 417–432. [Google Scholar] [CrossRef]
- Kim, M.; Kang, Y.; Bakar, S.A. A nightscape preference study using eye movement analysis. Int. J. Sustain. Trop. Des. Res. Pract. 2013, 6, 85–99. [Google Scholar]
- Noland, R.B.; Weiner, M.D.; Gao, D.; Cook, M.P.; Nelessen, A. Eye-tracking technology, visual preference surveys, and urban design: Preliminary evidence of an effective methodology. J. Urban. Int. Res. Placemak. Urban Sustain. 2016, 10, 98–110. [Google Scholar] [CrossRef]
- Act No. 183/2006 Coll., Construction Act. Available online: https://www.cka.cz/en/chamber/legislation/building_act/building_act_aj (accessed on 10 April 2018).
- Beconyte, G. Cartographic styles: Criteria and parameters. In Proceedings of the 25th International Cartographic Conference (ICC 2011), Paris, France, 3–8 July 2011; pp. 3–8. [Google Scholar]
- Benová, A.; Pravda, J. Map style. In Cartography and Art; Springer: New York, NY, USA, 2009; pp. 1–10. [Google Scholar]
- Christophe, S. Cartographic styles between traditional and original (towards a cartographic style model). In Proceedings of the AutoCarto Conference, Columbus, OH, USA, 16–18 September 2012; pp. 16–18. [Google Scholar]
- Roth, R.E. Cartographic interaction primitives: Framework and synthesis. Cartogr. J. 2012, 49, 376–395. [Google Scholar] [CrossRef]
- Wehrend, S.; Lewis, C. A problem-oriented classification of visualization techniques. In Proceedings of the 1st Conference on Visualization’90, San Francisco, CA, USA, 23–26 October 1990; IEEE Computer Society Press: Washington, DC, USA, 1990; pp. 139–143. [Google Scholar]
- Holmqvist, K.; Nyström, M.; Andersson, R.; Dewhurst, R.; Jarodzka, H.; Van de Weijer, J. Eye Tracking: A Comprehensive Guide to Methods and Measures; Oxford University Press: Oxford, UK, 2011; p. 537. [Google Scholar]
- Hammoud, R.I.; Mulligan, J.B. Introduction to eye monitoring. In Passive Eye Monitoring; Springer: New York, NY, USA, 2008; pp. 1–19. [Google Scholar]
- Salvucci, D.D.; Goldberg, J.H. Identifying fixations and saccades in eye-tracking protocols. In Proceedings of the Symposium on Eye Tracking Research & Applications (ETRA 2000), Palm Beach Gardens, FL, USA, 6–8 November 2000; ACM: Palm Beach Gardens, FL, USA, 2000; pp. 71–78. [Google Scholar]
- Popelka, S. Optimal eye fixation detection settings for cartographic purposes. In Proceedings of the 14th SGEM GeoConference on Informatics, Geoinformatics and Remote Sensing, Albena, Bulgaria, 17–26 June 2014; Volume 1, pp. 705–712. [Google Scholar]
- Mann, H.B.; Whitney, D.R. On a test of whether one of two random variables is stochastically larger than the other. Ann. Math. Stat. 1947, 18, 50–60. [Google Scholar] [CrossRef]
- Kruskal, W.H.; Wallis, W.A. Use of ranks in one-criterion variance analysis. J. Am. Stat. Assoc. 1952, 47, 583–621. [Google Scholar] [CrossRef]
- Popelka, S. Decision scheme for the selection of the most appropriate method for analyses and visualization of eye-tracking data in cartographic research. In Proceedings of the 15th International Multidisciplinary Scientific GeoConference Surveying Geology and Mining Ecology Management, Albena, Bulgaria, 16–25 June 2015; Volume 2, pp. 803–810. [Google Scholar]
- Andrienko, N.; Andrienko, G. Exploratory Analysis of Spatial and Temporal Data; Springer: Berlin, Germany, 2006; p. 704. [Google Scholar]
- Andrienko, G.; Andrienko, N.; Burch, M.; Weiskopf, D. Visual analytics methodology for eye movement studies. IEEE Trans. Vis. Comput. Graph. 2012, 18, 2889–2898. [Google Scholar] [CrossRef] [PubMed]
- Mello-Thoms, C.; Nodine, C.F.; Kundel, H.L. What attracts the eye to the location of missed and reported breast cancers? In Proceedings of the 2002 Symposium on Eye Tracking Research & Applications, New Orleans, LA, USA, 25–27 March 2002; ACM: New York, NY, USA, 2002; pp. 111–117. [Google Scholar]
- Bianchetti, R.A. Looking Back to Inform the Future: The Role of Cognition in Forest Disturbance Characterization from Remote Sensing Imagery; The Pennsylvania State University: State College, PA, USA, 2014. [Google Scholar]
- Kiefer, P.; Straub, F.; Raubal, M. Location-aware mobile eye tracking for the explanation of wayfinding behavior. In Proceedings of the AGILE’2012 International Conference on Geographic Information Science, Avignon, France, 24–27 April 2012; p. 5. [Google Scholar]
- Alacam, Ö.; Dalci, M. Alacam, Ö.; Dalci, M. A usability study of webmaps with eye tracking tool: The effects of iconic representation of information. In New Trends in Human-Computer Interaction; Springer: New York, NY, USA, 2009; pp. 12–21. [Google Scholar]
- Ooms, K.; De Maeyer, P.; Fack, V. Analyzing eye movement patterns to improve map design. In Proceedings of the 18th International Research Symposium on Computer-Based Cartography and GIScience (AutoCarto 2010): Geospatial Data and Geovisualization for the Environments, Security, and Society, Orlando, FL, USA, 15–18 November 2010. [Google Scholar]
- Opach, T.; Nossum, A. Evaluating the usability of cartographic animations with eye-movement analysis. In Proceedings of the 25th International Cartographic Conference, Paris, France, 3–8 July 2011; pp. 1–11. [Google Scholar]
- Blascheck, T.; Kurzhals, K.; Raschke, M.; Burch, M.; Weiskopf, D.; Ertl, T. State-of-the-art of visualization for eye tracking data. In EuroVis; The Eurographics Association: Swansea, UK, 2014; Volume 2014, pp. 1–20. [Google Scholar]
- Krejtz, K.; Coltekin, A.; Duchowski, A.; Niedzielska, A. Using coefficient k to distinguish ambient/focal visual attention during map viewing. J. Eye Mov. Res. 2017, 10. [Google Scholar] [CrossRef]
- Dolezalova, J.; Popelka, S. Scangraph: A novel scanpath comparison method using visualisation of graph cliques. J. Eye Mov. Res. 2016, 9, 1–13. [Google Scholar]


© 2018 by the authors. Licensee MDPI, Basel, Switzerland. This article is an open access article distributed under the terms and conditions of the Creative Commons Attribution (CC BY) license (http://creativecommons.org/licenses/by/4.0/).
Share and Cite
Burian, J.; Popelka, S.; Beitlova, M. Evaluation of the Cartographical Quality of Urban Plans by Eye-Tracking. ISPRS Int. J. Geo-Inf. 2018, 7, 192. https://doi.org/10.3390/ijgi7050192
Burian J, Popelka S, Beitlova M. Evaluation of the Cartographical Quality of Urban Plans by Eye-Tracking. ISPRS International Journal of Geo-Information. 2018; 7(5):192. https://doi.org/10.3390/ijgi7050192
Chicago/Turabian StyleBurian, Jaroslav, Stanislav Popelka, and Marketa Beitlova. 2018. "Evaluation of the Cartographical Quality of Urban Plans by Eye-Tracking" ISPRS International Journal of Geo-Information 7, no. 5: 192. https://doi.org/10.3390/ijgi7050192
APA StyleBurian, J., Popelka, S., & Beitlova, M. (2018). Evaluation of the Cartographical Quality of Urban Plans by Eye-Tracking. ISPRS International Journal of Geo-Information, 7(5), 192. https://doi.org/10.3390/ijgi7050192