Article

Long-Term Changes of the Wildland–Urban Interface in the Polish Carpathians

1
Institute of Geography and Spatial Management, Jagiellonian University, Gronostajowa 7, 30-387 Kraków, Poland
2
SILVIS Lab, Department of Forest and Wildlife Ecology, University of Wisconsin-Madison, 1630 Linden Drive, Madison, WI 53706, USA
*
Author to whom correspondence should be addressed.
ISPRS Int. J. Geo-Inf. 2018, 7(4), 137; https://doi.org/10.3390/ijgi7040137
Submission received: 18 February 2018 / Revised: 16 March 2018 / Accepted: 26 March 2018 / Published: 1 April 2018
(This article belongs to the Special Issue Historic Settlement and Landscape Analysis)

Abstract

:
The Wildland–Urban Interface (WUI) is the area where houses and wildland vegetation meet or intermingle, which causes many environmental problems. The current WUI is widespread in many regions, but it is unclear how the WUI evolved, especially in regions where both houses and forest cover have increased. Here we compared WUI change in the Polish Carpathians for 1860 and 2013 in two study areas with different land use history. Our western study area experienced gradual forest increase and housing growth over time, while the eastern study area was subject to a shock due to post-war resettlements, which triggered rapid reforestation. We found that in both study areas WUI extent increased from 1860 to 2013 (41.3 to 54.6%, and 12.2 to 33.3%, in the west and east, respectively). However the causes of WUI growth were very different. In the western study area new houses were the main cause for new WUI, while in the eastern study area forest cover increase was more important. Our results highlight that regions with similar current WUI cover have evolved very differently, and that the WUI has grown rapidly and is widespread in the Polish Carpathians.

1. Introduction

The Wildland–Urban Interface (WUI) is the area, where human settlements and wildland vegetation meet or intermingle [1,2,3]. Studying the WUI is especially important in the context of wildfires, because human-induced fire ignitions are concentrated in the WUI, and because wildland vegetation in close proximity to houses provides fuels that allows wildfires to spread, thereby threatening inhabited areas [1,2,4,5]. Indeed, the WUI and wildfires are closely related in many regions including Argentina [6], Australia [7], South Africa [8], Southern Europe [4,5] and the US [2].
There are, however, many more ecological processes and interactions that are concentrated in the WUI, including exotic species introductions, disease transfers [9,10], and conflicts between predators and humans [11]. For example, American black bears that are recolonizing areas are more often found in WUI areas than in less densely populated rural areas [11]. On the other hand, pets living in houses in the WUI, can have a substantial impact wildlife populations. For example, in the US, domestic cats annually kill 1.3–4.0 billion birds, more than any other direct source of anthropogenic mortality, including collisions with windows, vehicles or pesticide poisoning [12]. Furthermore, scattered development can cause landscape fragmentation [10]. In Europe, the mean size of roadless patches is only 48 km2, considerably less than in other continents [13], with the highest levels of fragmentation found in Benelux countries, followed by Germany and France and Scandinavian countries, as the least fragmented in the EU [14]. The specific ecological effects of roads in the WUI depends on the proportion of vegetation around the houses, but houses in more vegetated areas generally require longer access roads to main roads [10]. Roads, in turn, bring about noise, pollution and non-native species invasions [13], similar to houses in the WUI. Indeed, rural housing density in Wisconsin, US, explains the abundance of non-native invasive plants in surrounding forests [15], and a similar pattern has occurred in New Zealand [16]. Last but not least, housing in the vicinity of wildlands is a source of light [17] and electromagnetic [18] pollution, with negative implications for many species. In summary, while the WUI was initially defined in a wildfire context, it now has much wider ramifications, and that is why there is a need to detect and monitor WUI areas and understand how these change over time.
When mapping the WUI, one challenge is that WUI definitions differ among regions and studies [1,4,5,19,20], but there is consensus that: (a) both settlements and forests or other wildland vegetation are necessary components of the WUI, (b) there are different types of WUI, depending on the spatial arrangement and density of forests and settlements. Irrespective which WUI definition is used, two largely unresolved questions are (a) how the WUI is changing, and (b) what causes WUI growth. Ultimately, because both houses and wildland vegetation are necessary elements of the WUI [21], it is changes in either that can result in the creation of new WUI, plus there can be additional housing growth in areas that are already WUI. However, especially vegetation change typically occurs over decades, and this means that understanding WUI change requires long-term data on land use patterns. WUI assessment is especially important in mountain areas, because many of them are biodiversity hotspots, and because mountain areas often experience fairly rapid land use changes [22] both in the form of housing growth due to amenity migration, and in the form of reforestation as marginal agricultural areas are abandoned.
Our goal here was thus to (a) map long-term WUI change, and (b) identify either housing growth or forest cover increase were responsible for WUI growth. We conducted our study in two areas in the Polish Carpathians.

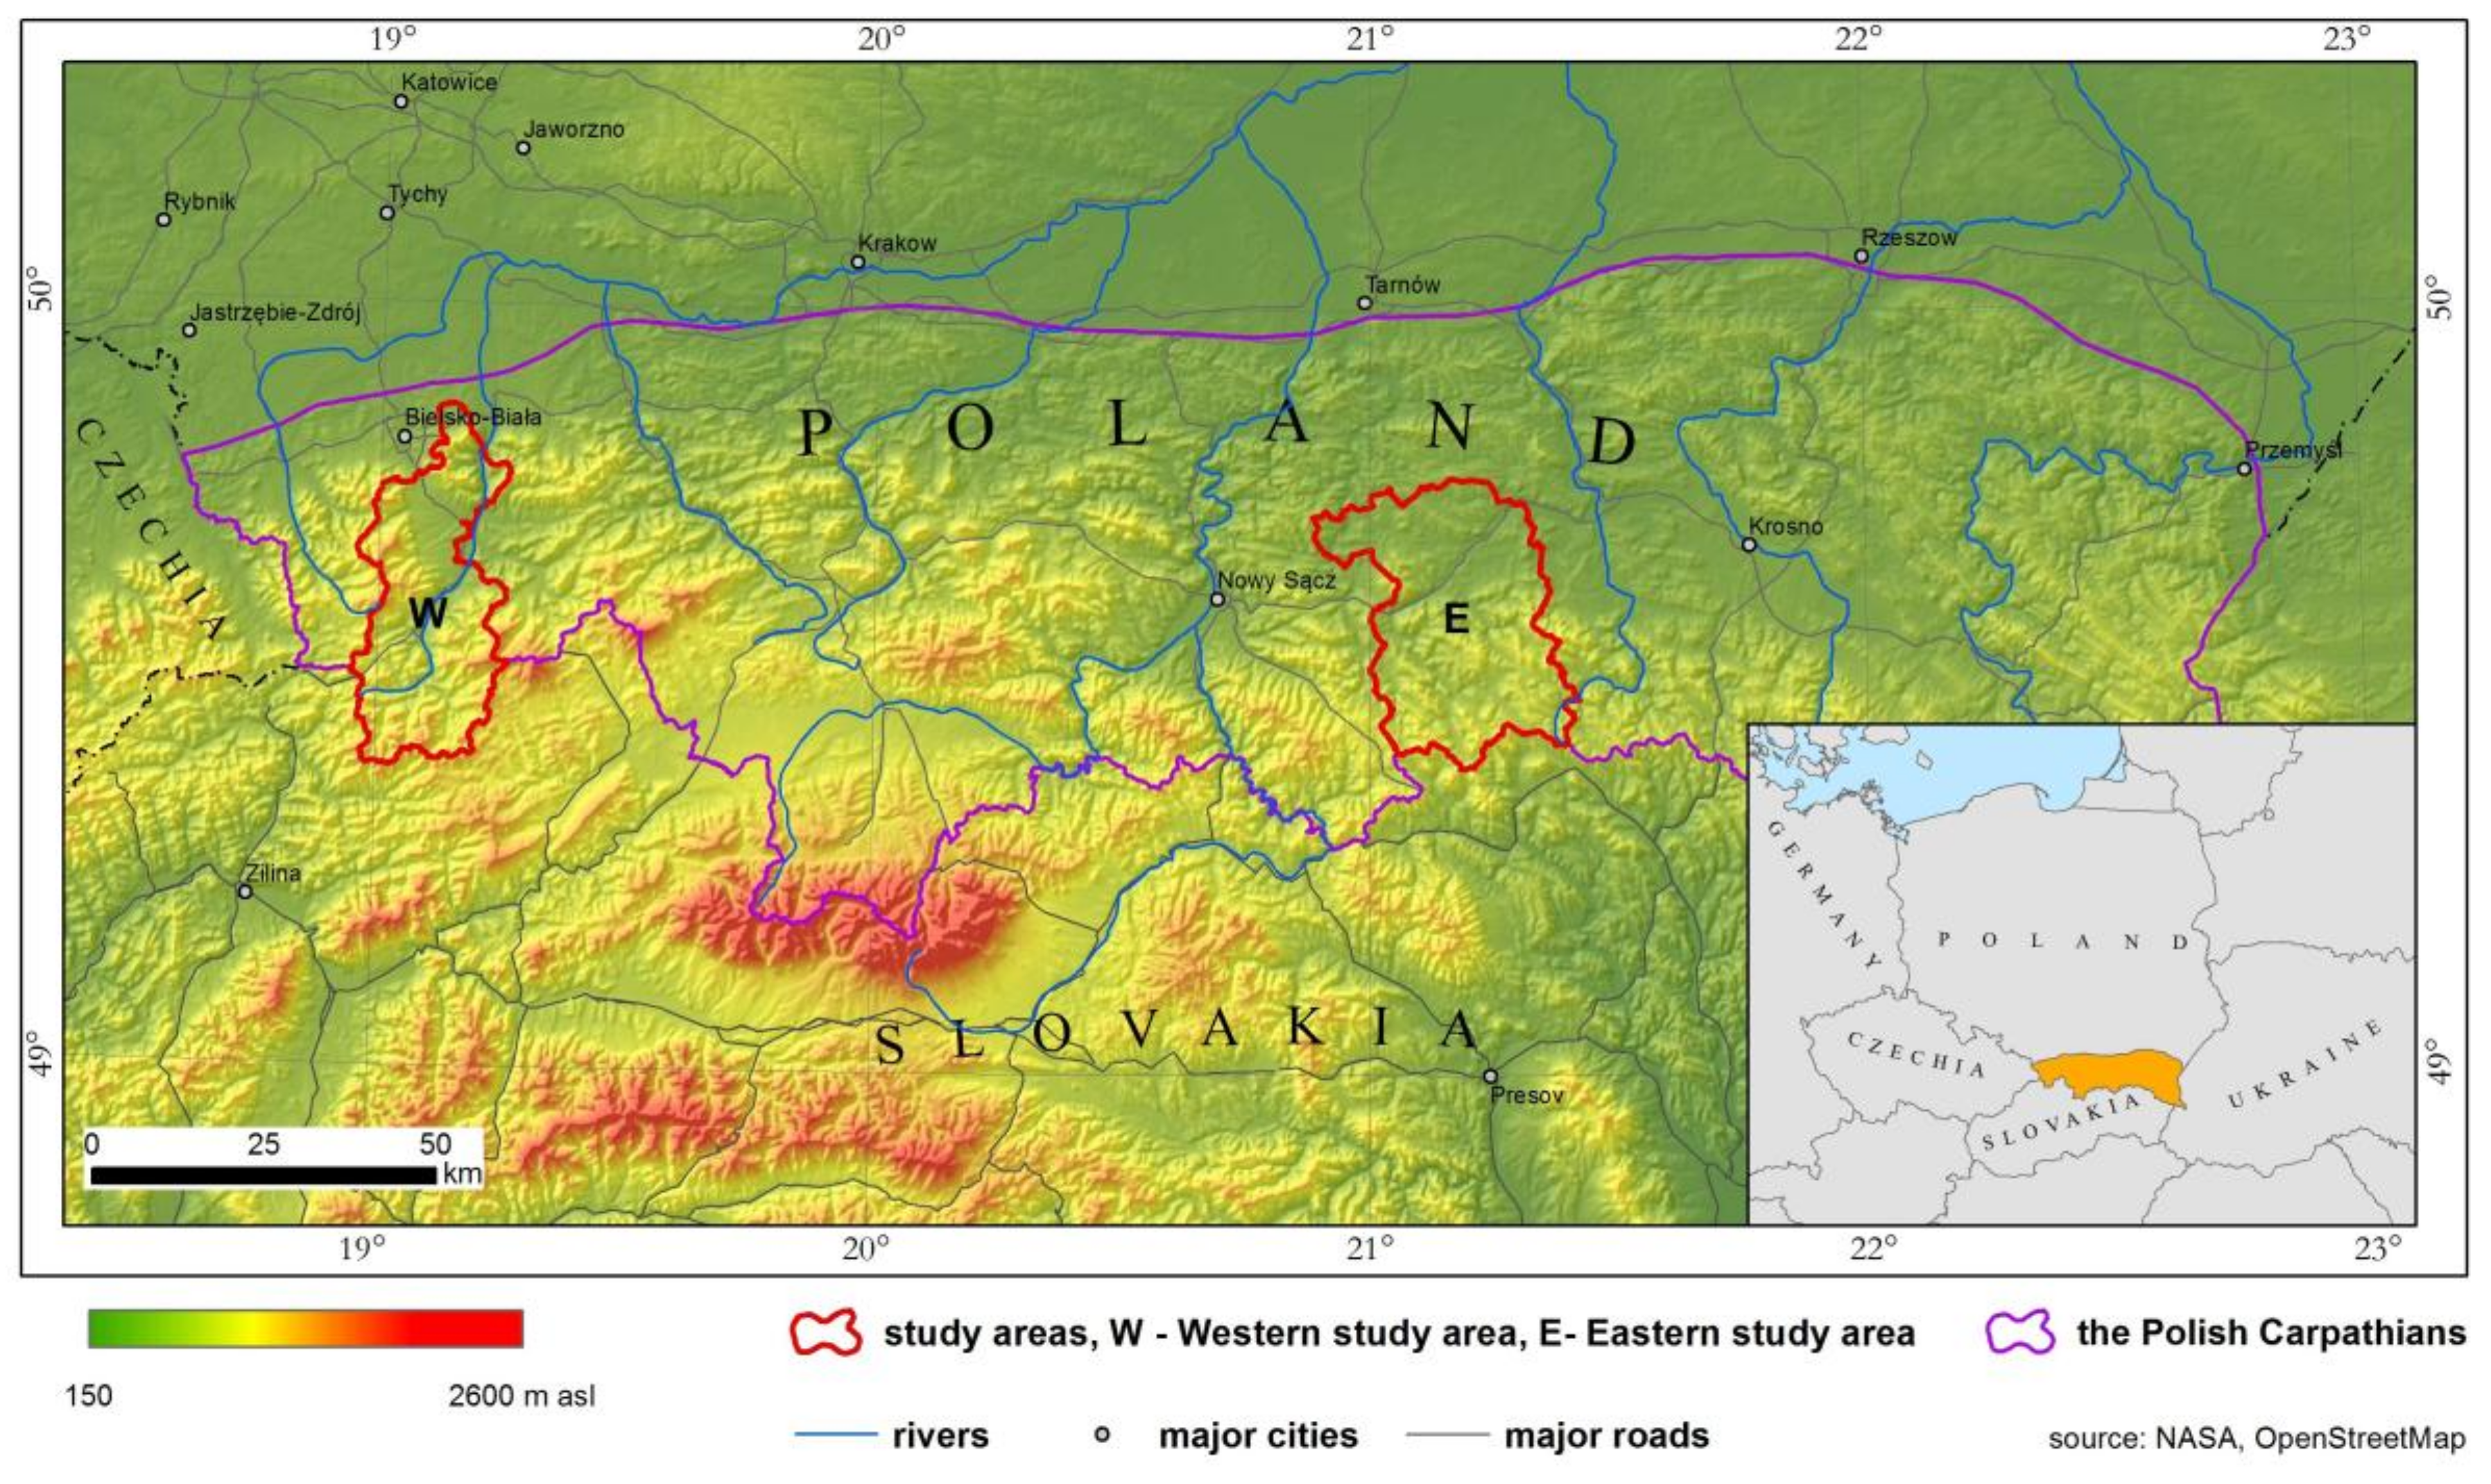
2. Study Areas in the Polish Carpathians

The Polish Carpathians are a prime example of an area that has witnessed both forest cover increase [23,24], which has improved the habitat for large mammals [25], but also the growth of settlements and the construction of houses in the forests [26]. Due to the scattered nature of the settlements, which typical for the Polish Carpathians [27], the area is particularly likely to contain WUI. Furthermore, the western and the eastern parts of the Polish Carpathians experienced very different types of land use changes during the 20th century making it interesting to compare the two [28,29]. In the eastern part, the Ruthenians, an ethnic minority, were resettled after World War II, and that triggered rapid forest cover increase due to the disappearance of mountain settlements [30,31,32]. Although many of the villages were rebuilt at a later stage, their spatial pattern differed [31,33]. In contrast, in the western part of the Polish Carpathians, it was the transformation of the rural economy that triggered land abandonment and resulted in forest cover increase, accompanied by the increase in settlements [24,26,28,29], partly due to the construction of second homes for recreational purposes [34]. Comparing annual forest cover change rates after World War II based on several case studies, in the eastern part of the Polish Carpathians it was 0.38–2.15%, while in the western part it was 0.08–0.77% [28]. This highlights that while housing growth and forest cover increase were the dominant and common land use changes across the Polish Carpathians, different historical processes played an important role in shaping the current land use pattern in the eastern and western part.
We conducted our analyses in two case studies over a long term period, in order to detect the influence of substantial land use changes on current WUI patterns. Specifically, we compared the forest cover and building locations from mid-19th century (1860) with the contemporary (2013) patterns. Our first study area was the western part of the Carpathians, covering >75,000 ha, in both Żywiec district (poviat, NUTS 4 unit) and the mountainous, rural part of Bielsko–Biała district (Figure 1). Our second case study area was in the eastern part, where we analyzed Gorlice district, covering >96,000 ha (Figure 1).

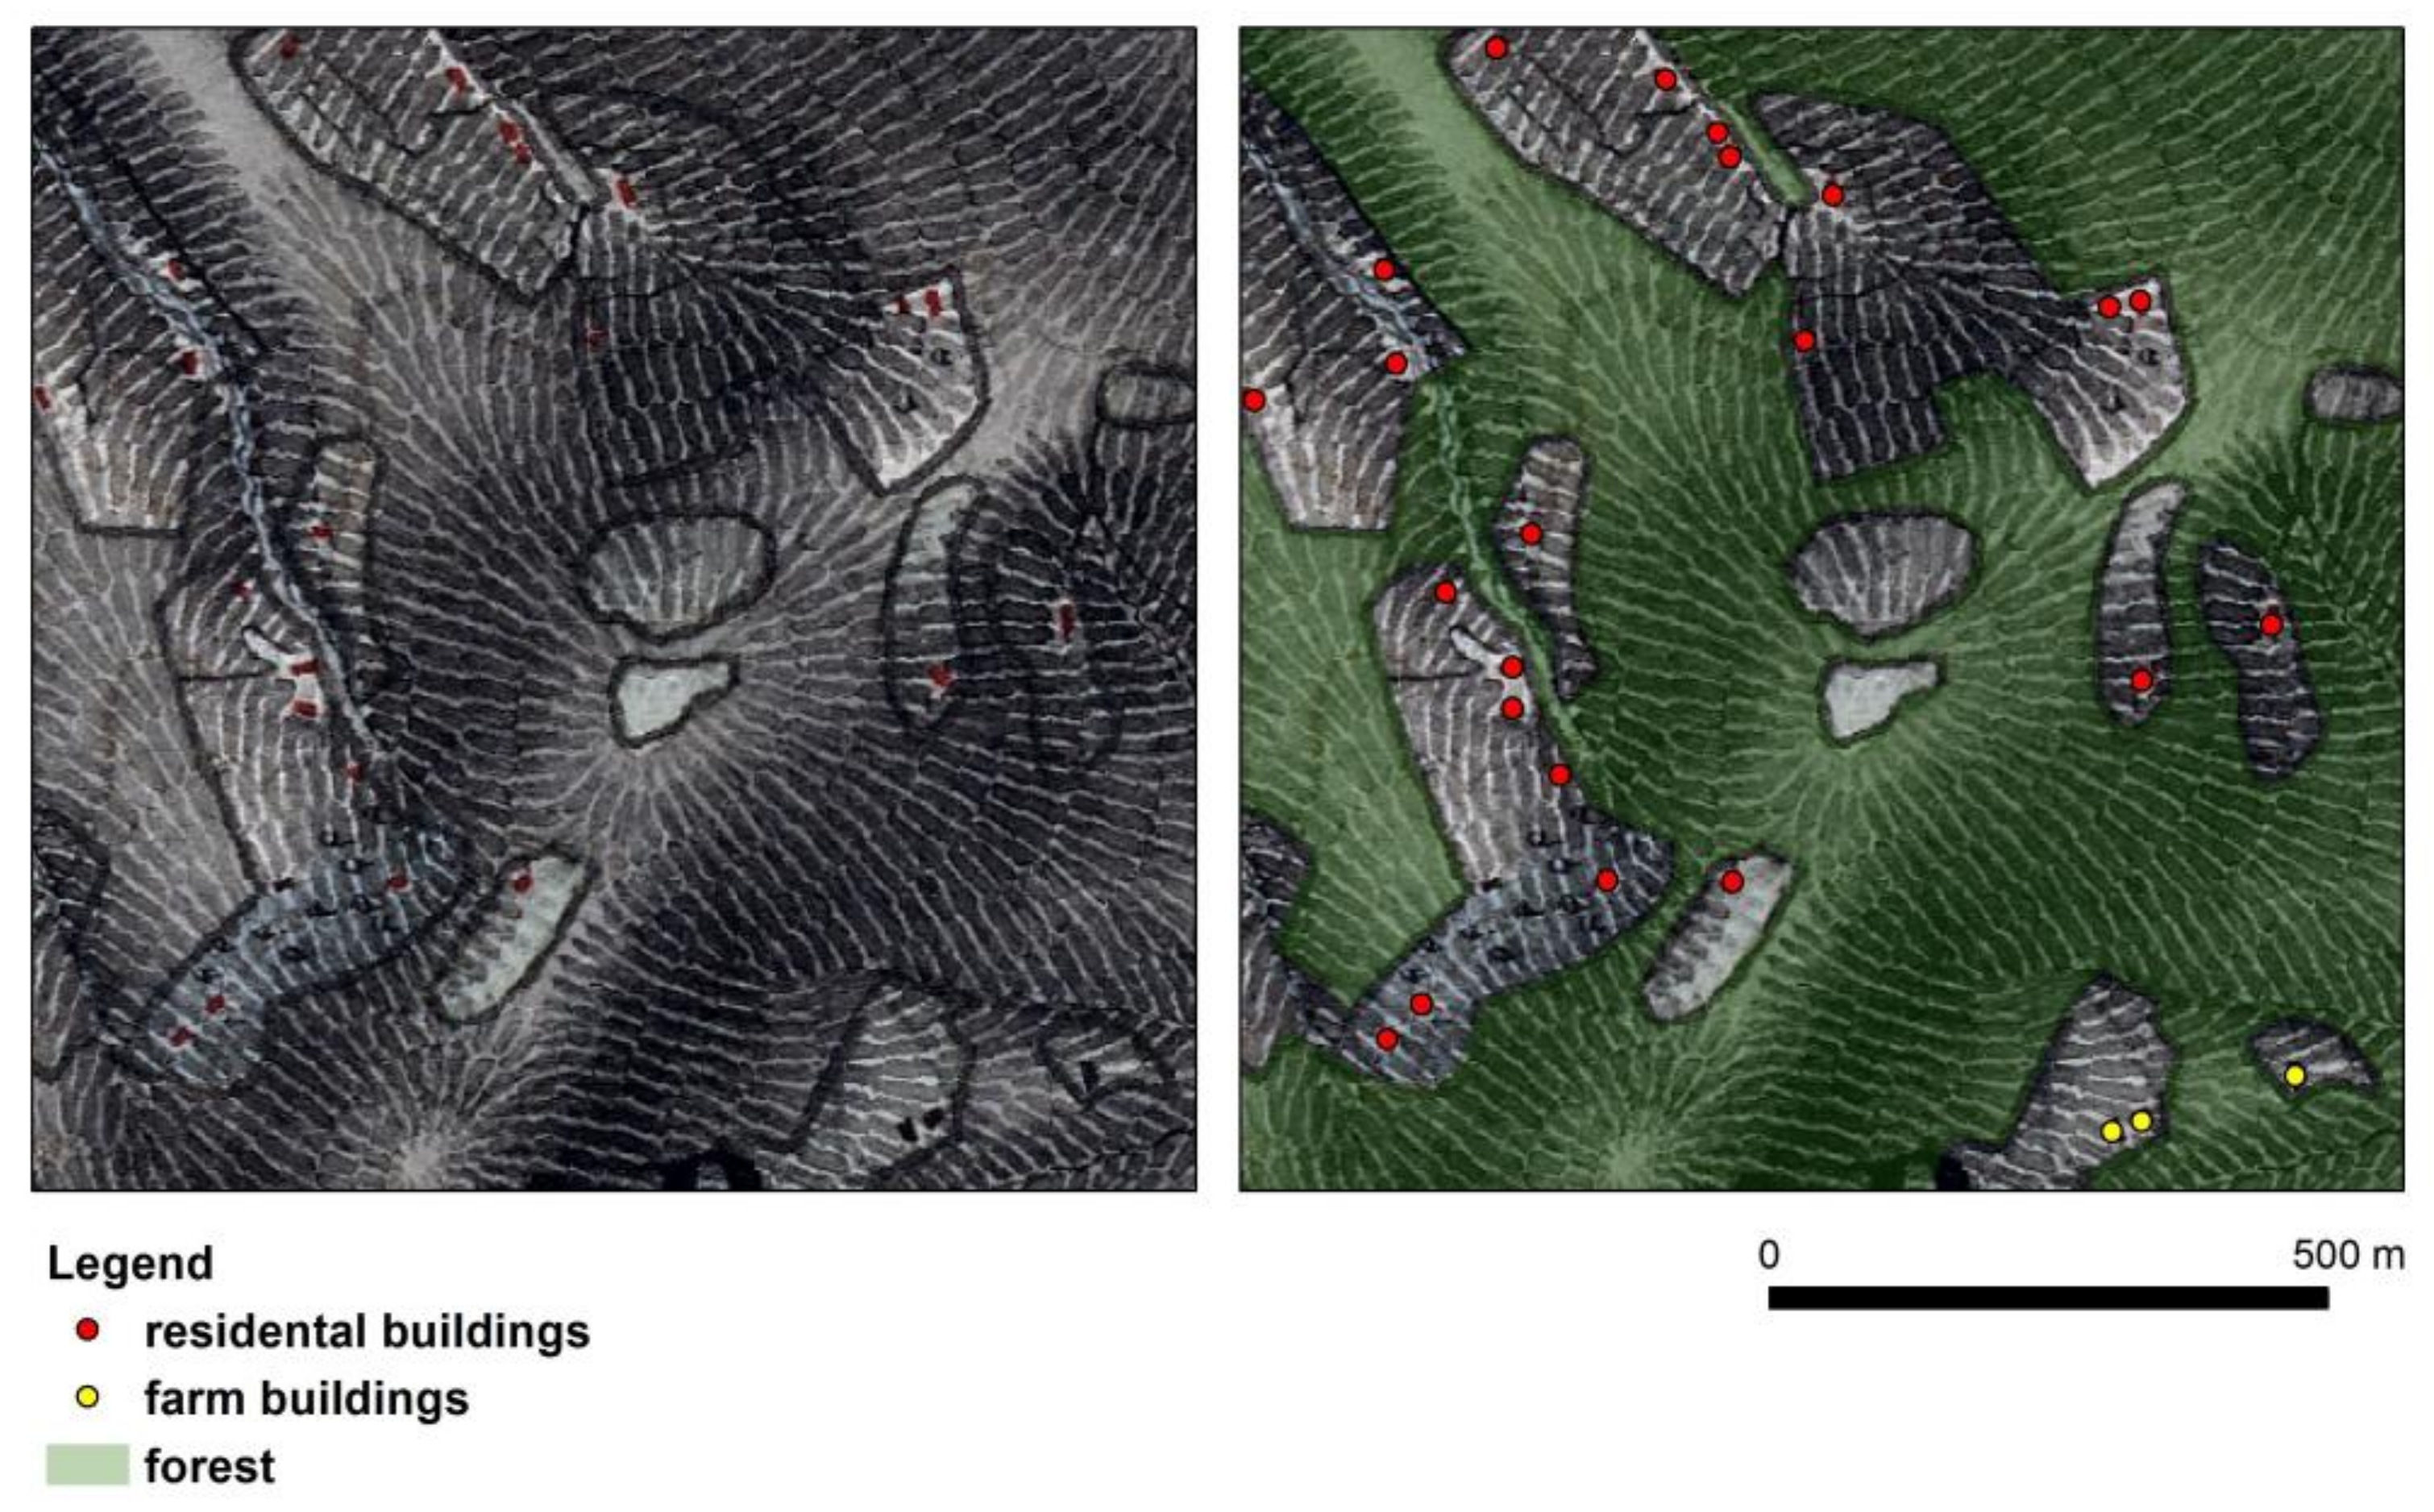
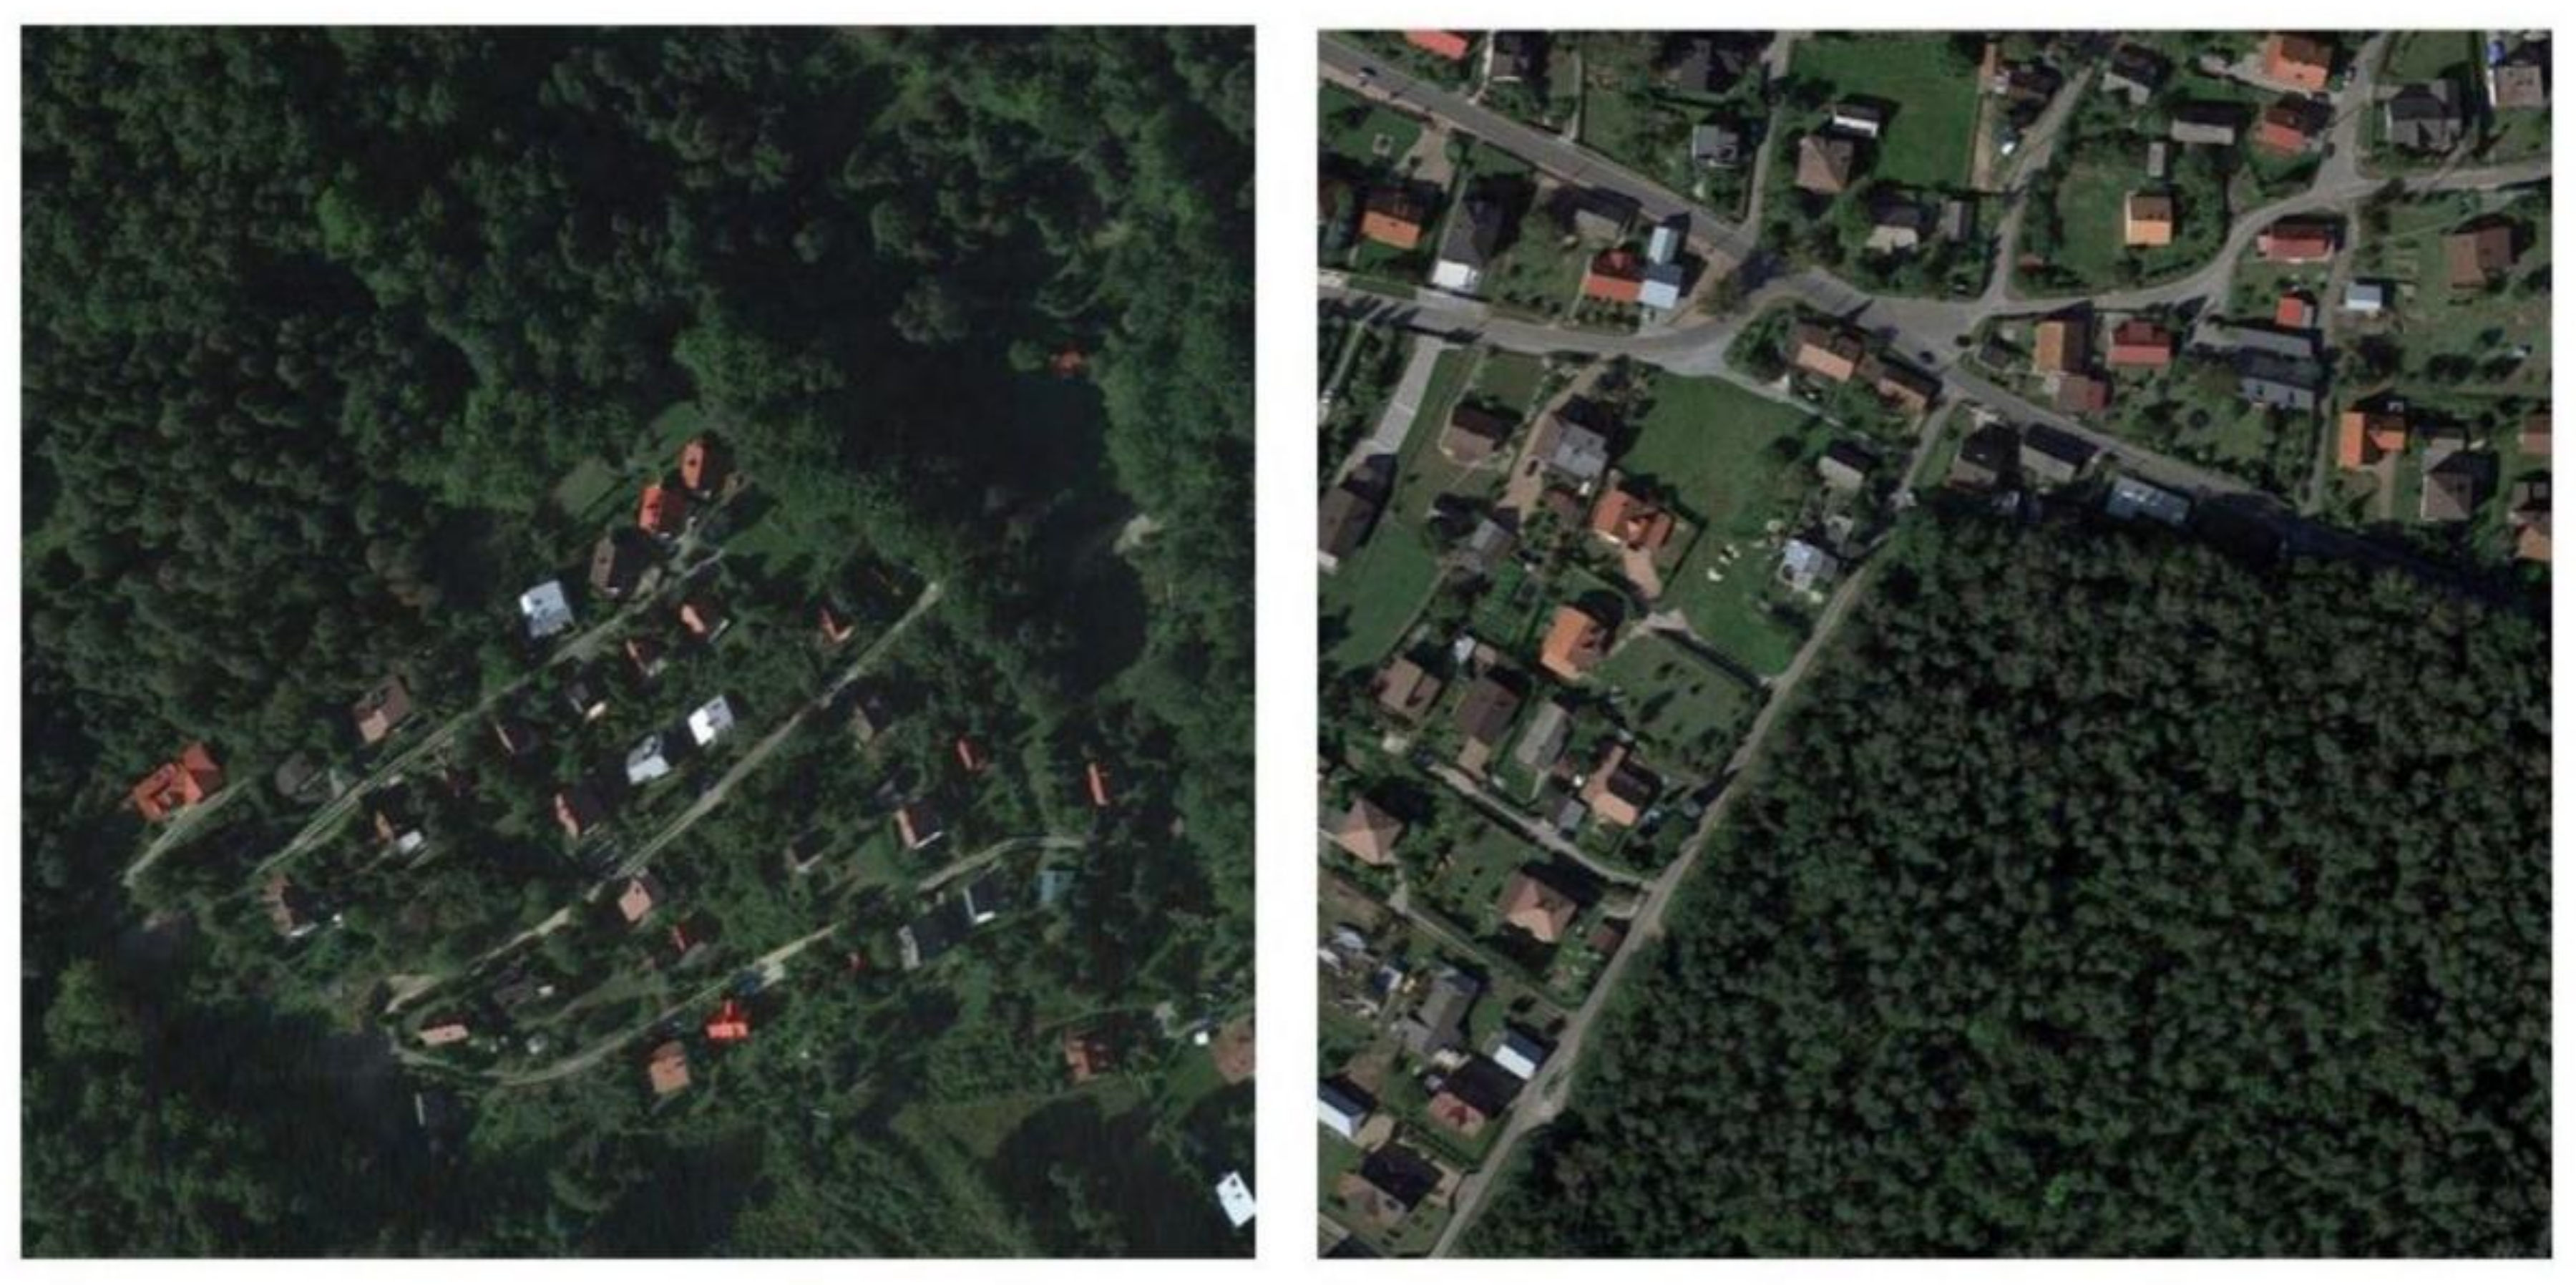
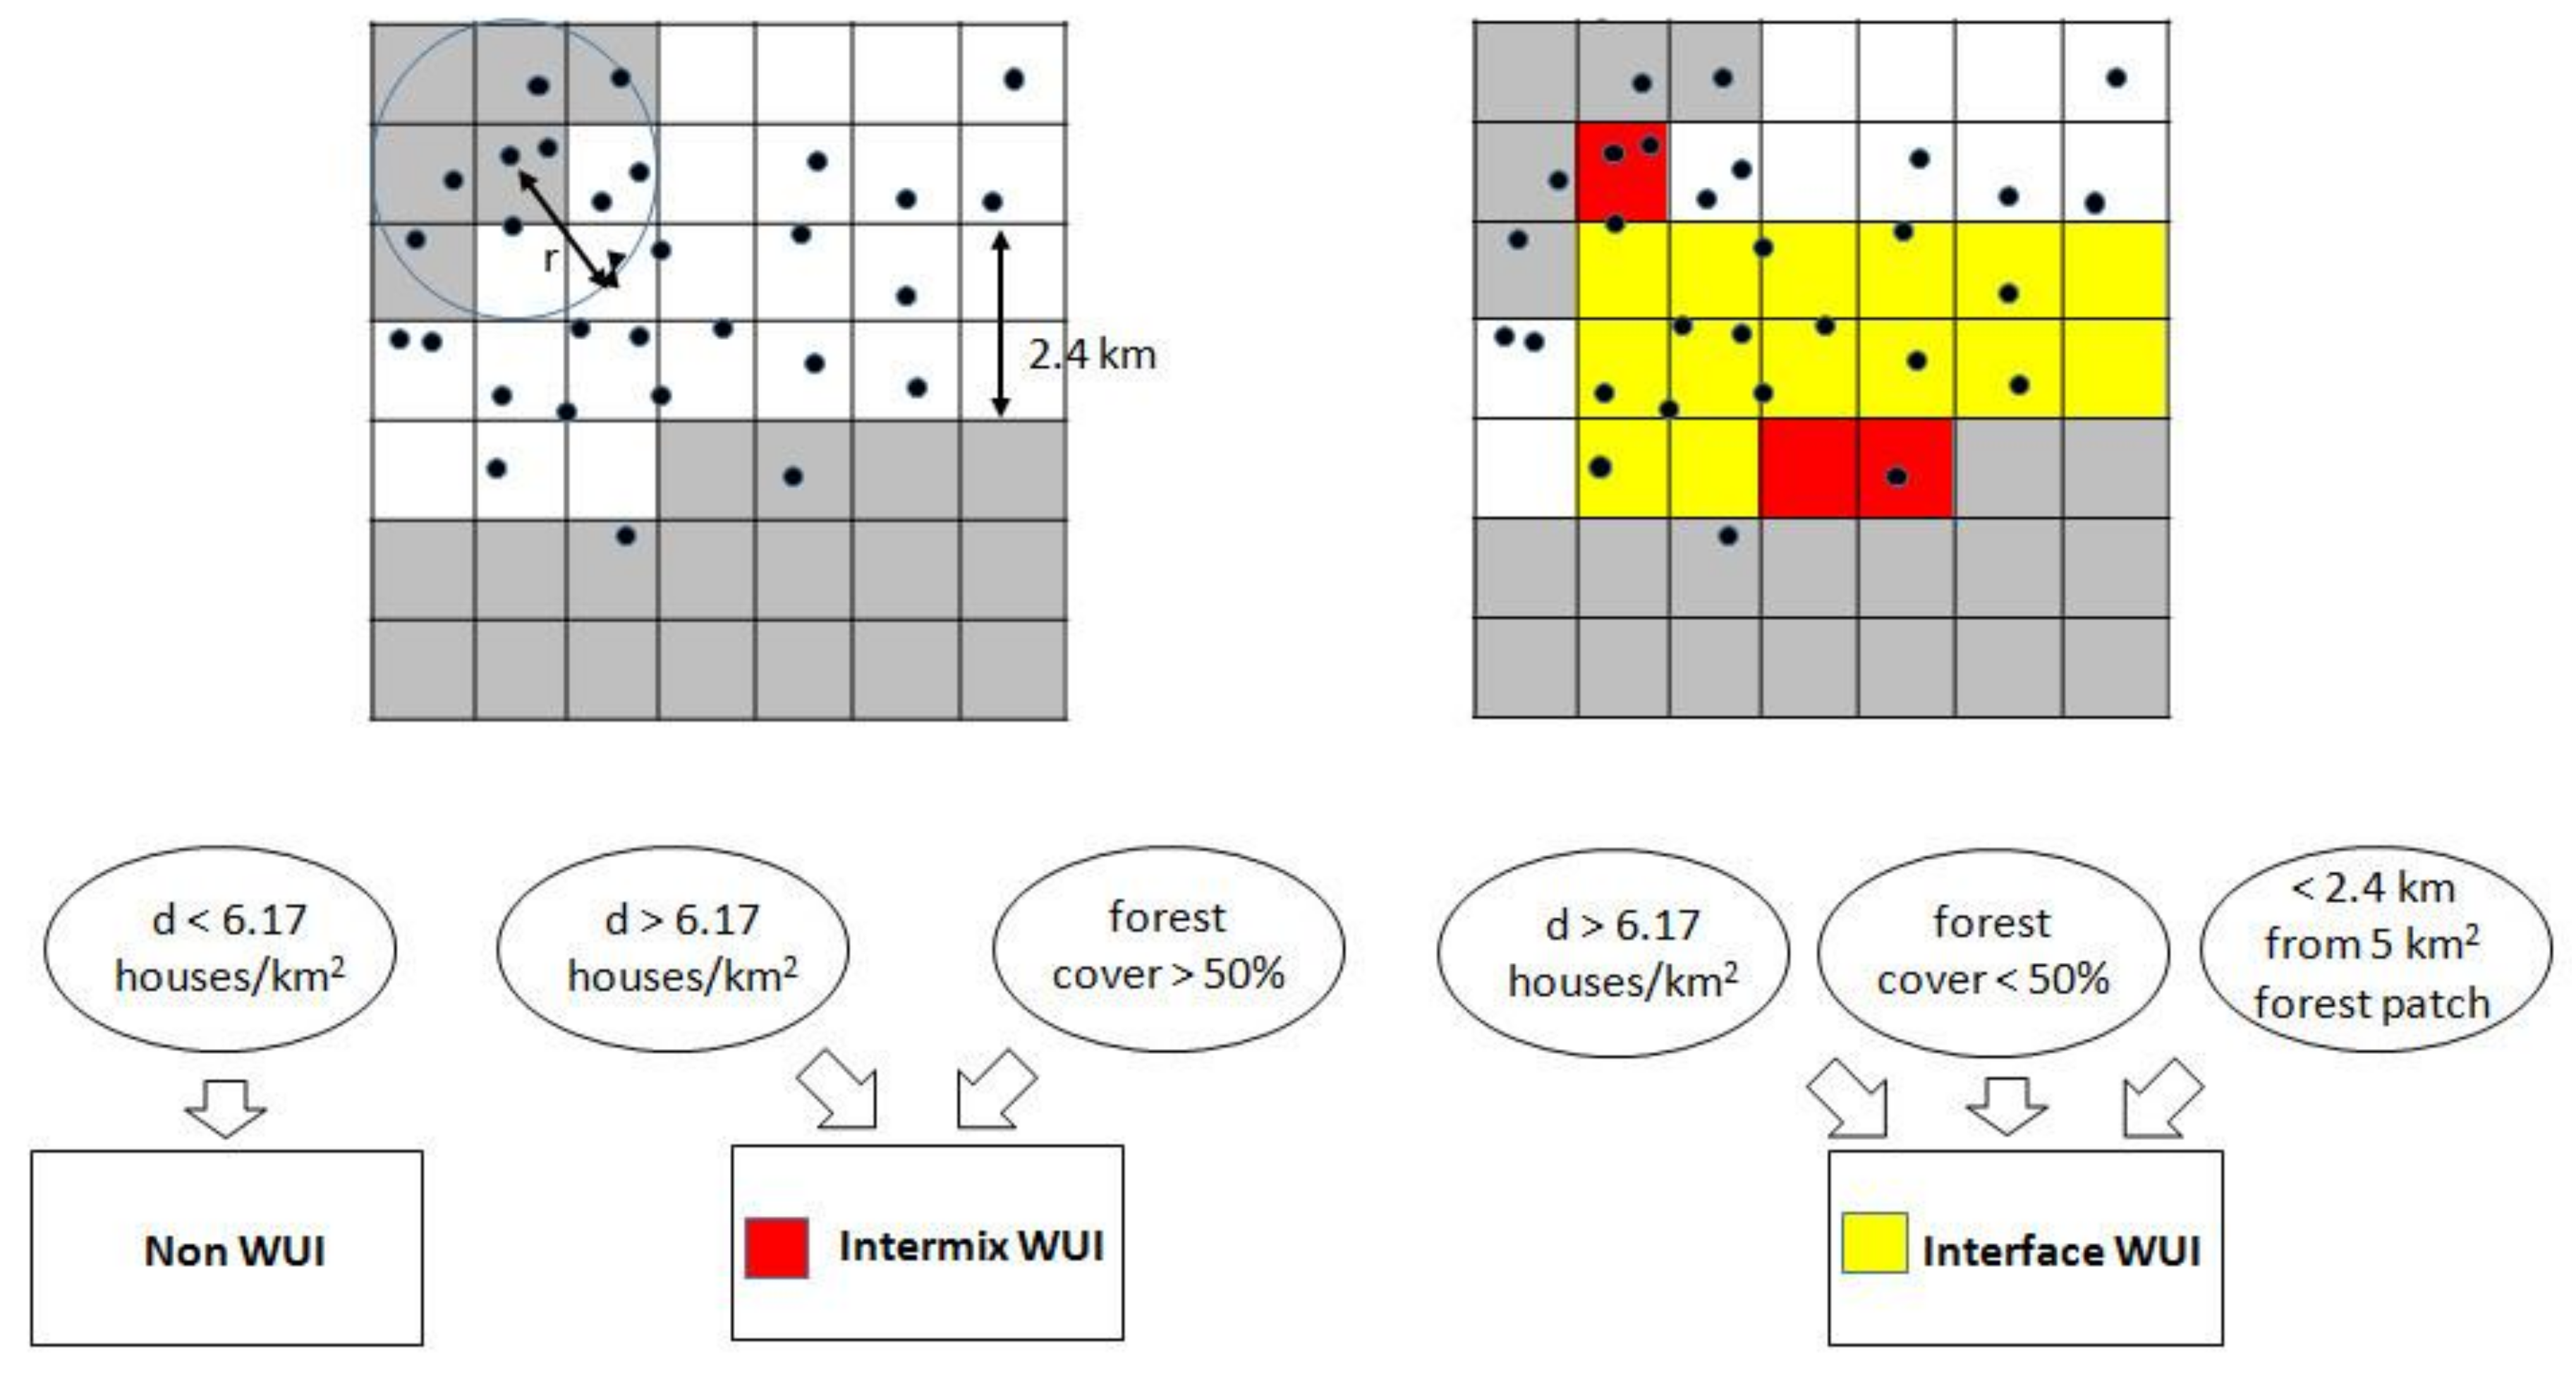
3. Materials and Methods

We collected the historical data based on the Austrian Second Military Survey maps (1:28,800), which are the generalized form of the cadastral mapping (1:2880). Both the forest cover and the historical building locations were manually digitized on screen (Figure 2). The maps are well known for their high quality and are a widely used source for land use information in the Central Europe during the 19th century [23,35,36,37]. The positional accuracy of the historical maps, measured by Root Mean Square Error (RMSE) value, was <30 m [38].
The current (2013) forest and building locations data were obtained from the Polish National Topographic Database, prepared for the scale 1:10,000 [39]. In addition, we updated the forest mask based on data from several other national agencies (including the State Forests IT System (SILP), the Agency for Restructuring and Modernisation of Agriculture (ARiMR), and the Central Statistical Office (GUS), and via the visual interpretation of aerial imagery in order to make it comparable to the 19th century forest mask [40].
In our analyses, we included all buildings shown in the historical maps and available in the current database. While the historical maps distinguished buildings based on their use (i.e., residential versus farm buildings), many of the farm buildings in the mountains were also used for residential purposes in summer [41]. The current database, offered an even wider range of functions in building description, but they did not correspond directly to the classification in the historic maps. Furthermore, our analysis was not focused on any particular type of human influence on the landscape, and each type of building may be, e.g., the source of noise and other pollutions.
The mid-19th century, i.e., the time when the historical map were created, was for many areas in the Polish Carpathians when forest cover reached its lowest point [29,42], partly due to very intense sheep grazing activities, which triggered the construction of many buildings at higher elevations that are no longer there today [43,44]. However, due to differences in culture and in environmental conditions (e.g., maximal elevations are 1366 m asl. in the west versus 997 m asl. in the east, and topography is characterized by parallel valleys and ridges in the east versus a complex valley system in the west), sheep grazing in the western case study was one of the most developed in the Carpathians but occurred mainly at high elevations [43], while the eastern case study was a region where sheep grazing was occurring mainly near the villages in the valleys [45]. The western study area is located mainly in the mountains (86%), with a small portion in the lowlands (14%). The eastern study area consist of mountains (65%), foothills (20%), and lowlands (15%).
We decided to map WUI according to the methodology developed by Radeloff et al. [1] and Bar Massada et al. [46], which is based on the official US Federal Register [47]. According to this methodology, there are two kinds of WUI, a) interface WUI where the settlement abuts the wildland vegetation, and b) intermix, where scattered houses intermingle with wildland vegetation [1,2]. More specifically, an area is considered as intermix WUI, when housing density is >6.17 houses/km2 (or 1 house/40 acres in US context) and wildland vegetation (in our case forest) is >50%, and as interface WUI when housing density is >6.17 houses/km2, wildland vegetation is <50%, but the area is within 2.4 km of a forest patch >5 km2 (Figure 3). The 2.4 km distance is directly connected to the fire risk, and corresponds to the distance a firebrand can fly [1]. We decided to use the same threshold to be consistent with the original definition, and because many environmental processes operate at similar scales. We mapped WUI areas based on the methods designed for building locations [46] (Figure 4). This means that in the first step, we calculated buildings density, using a moving window approach with a 500 m circle. If the density was >6.17 houses/km2, the area was considered to be potentially WUI, depending on the vegetation criterion. In the second step, we calculated within 500 m buffer, similarly to the threshold used in building density analysis. If forest area was >50%, we mapped the area as intermix WUI. In the third step, we identified all forest patches >5 km2 and mapped the areas that were within 2.4 km, and that had >6.17 houses/km2 and <50% vegetation as interface WUI.
In order to analyze WUI change, our first goal, we assessed the WUI for both 1860 and 2013, and compared the two maps. In order to answer our second question, i.e., whether housing growth or forest increase was the most important cause for WUI growth over time, we modeled also two counterfactual scenarios for both study areas. In the first scenario, we modeled WUI change based on forest change since 1860 alone. Specifically, we mapped the WUI for 2013 based on 2013 forest cover, but with the 1860 building locations. In the second counterfactual scenario, we mapped the 2013 WUI based on 2013 building locations, but with the 1860 forest cover. We then compared both scenarios with the actual 1860 and 2013 WUI extent for the two study areas. Additionally, we calculated the correlations between areas of 2013 WUI and areas of WUI in each of the counterfactual scenarios for municipalities located in western (n = 12) and eastern (n = 10) case studies, respectively. We reported only the strongest one, considering it was statistically significant (p < 0.05).

4. Results

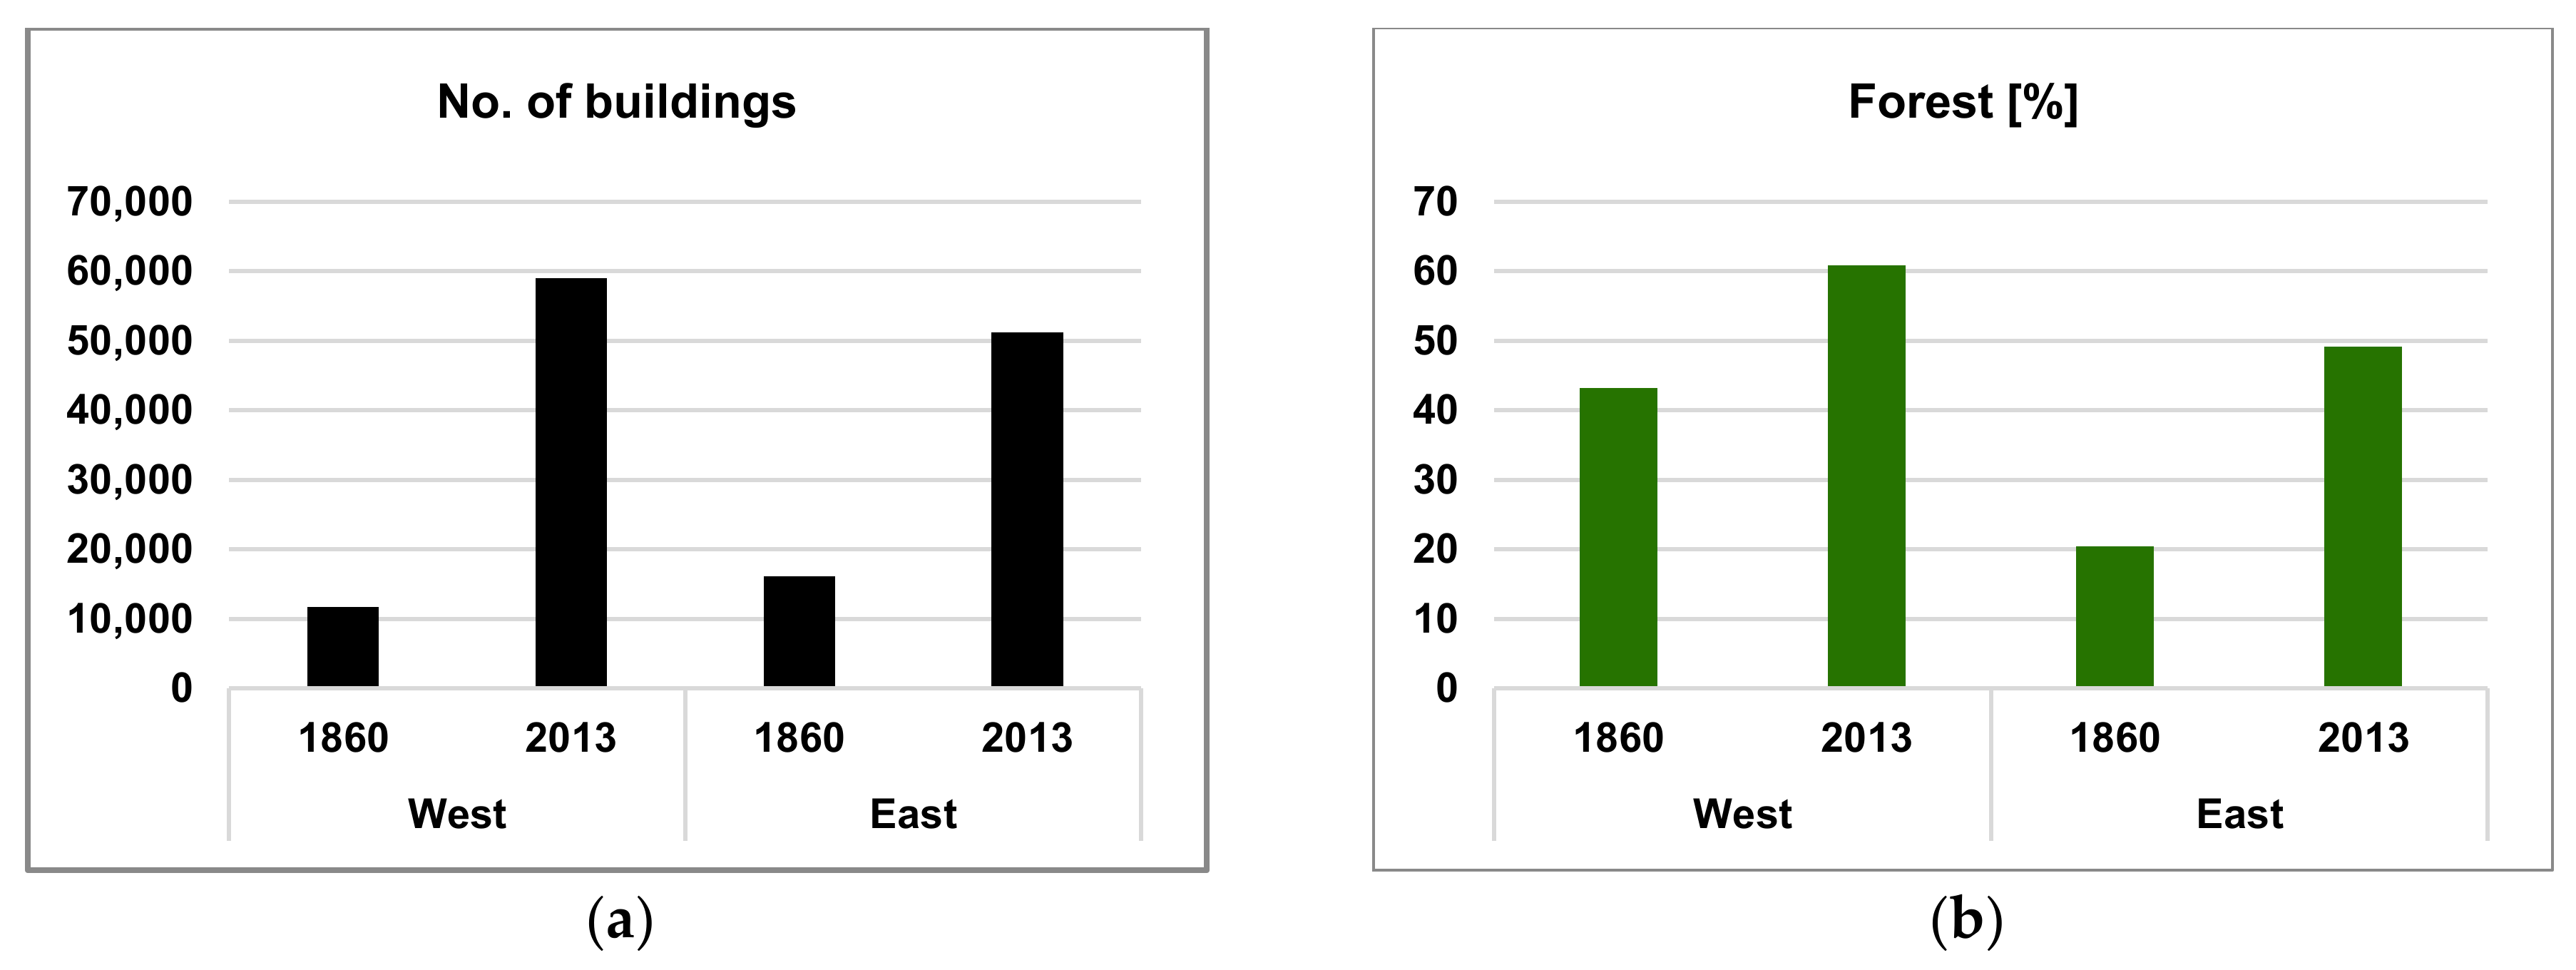
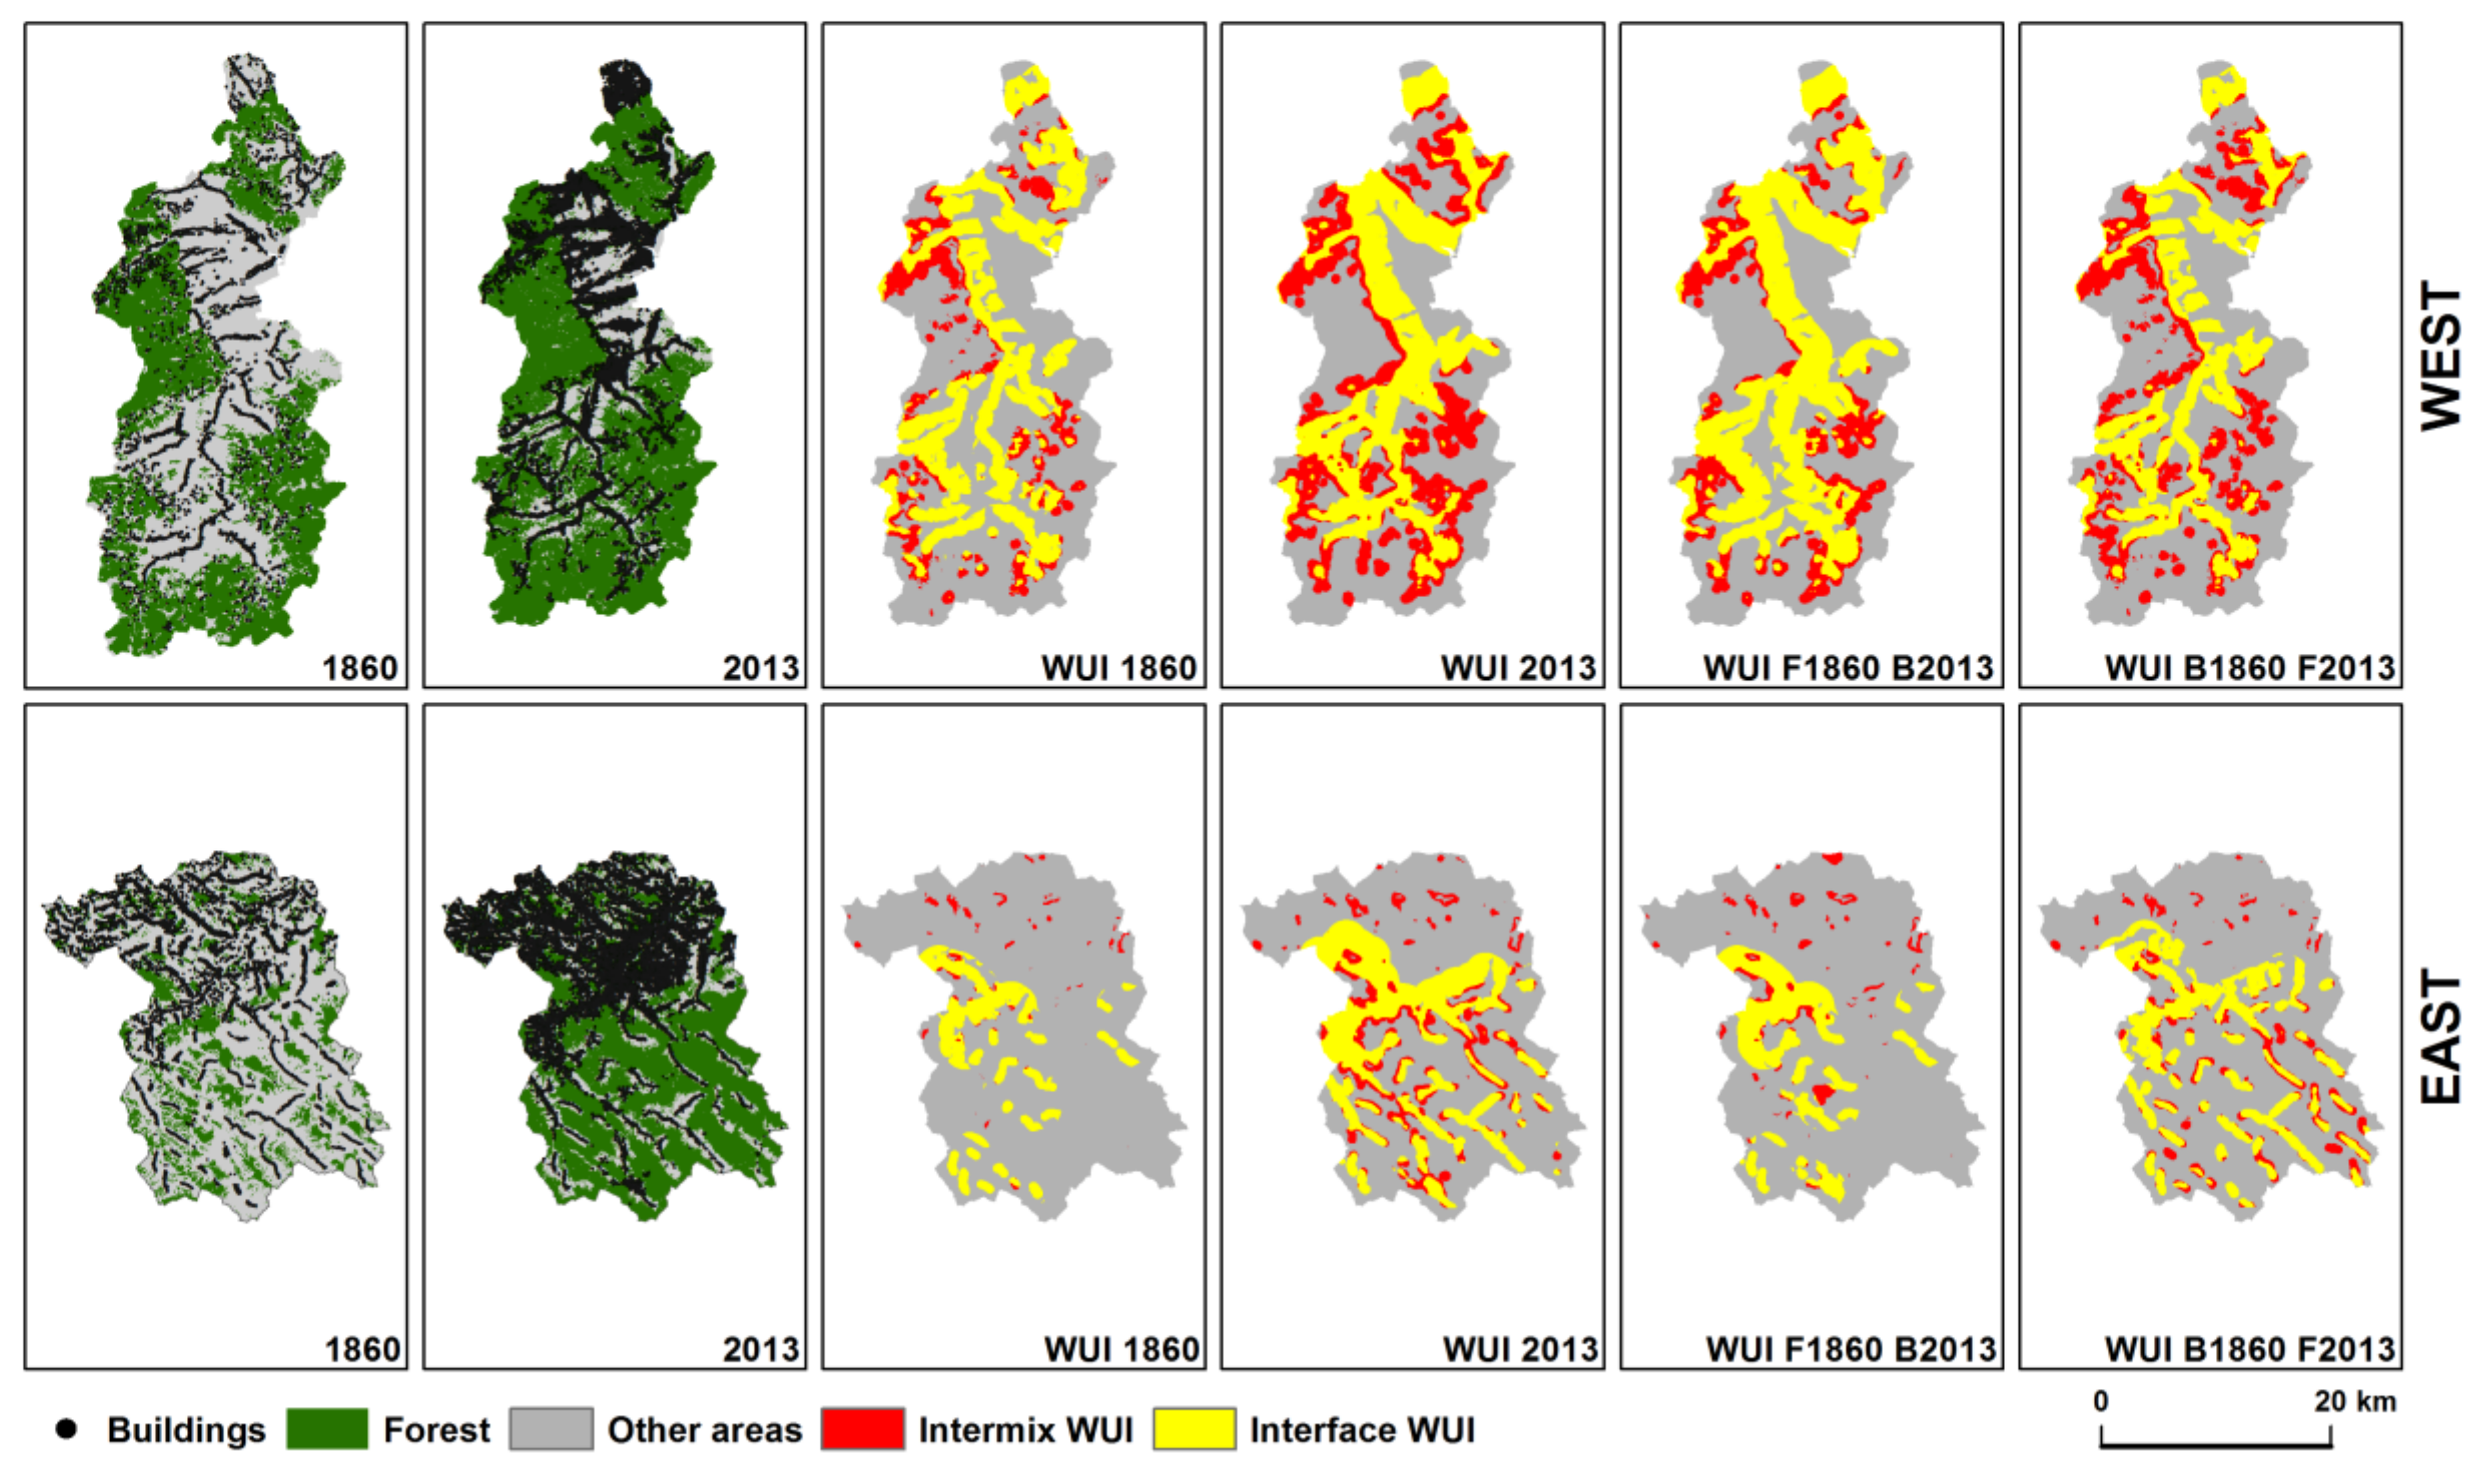
4.1. Land Use and WUI Changes over Time

In 1860, forests covered 43% and 20% of western and eastern case study areas, respectively (Figure 5b), and the number of buildings was 11,734 and 16,083 respectively (Figure 5a). In 2013 the proportion of forest was 61% and 49% for western and eastern study areas, respectively, and the number of buildings increased to 58,958, and 51,206 respectively (Figure 5a). In 1860 WUI covered 41.3% and 12.2% of the western and eastern study areas, respectively (Table 1). In 2013 it was 54.6% and 33.3%, respectively (Table 1). In both case study areas and at all times, Interface WUI covered more area than Intermix, however, the proportions differed between the study areas (Table 1). Furthermore, while Intermix covered less area than Interface, it grew much faster in both case study areas.
In 1860 83% of all buildings were within WUI in the western case study area, and 74% in Interface WUI. In contrast, in the eastern case study area only 23% of all building were in the WUI, and 22% in Interface WUI. In 2013 it was 89% in the west and 44% in the east, again with the vast majority in the Interface WUI (79% and 41% respectively).
WUI areas were remarkably stable over time (Table 2). This means that most of the 1860 Intermix was still Intermix in 2013, and the same is true for the 1860 Interface. In both study areas more Interface, than Intermix WUI were created, however while the difference in the west was relatively low, in the east it was over two times more Interface than Intermix, which appeared by 2013 in the areas that were Non-WUI in 1860 areas (Table 2). The number of houses in the area covered by 1860 WUI increased substantially from 9692 in 1860 to 44,427 in 2013 on the west and from 3760 to 9868 on the east.

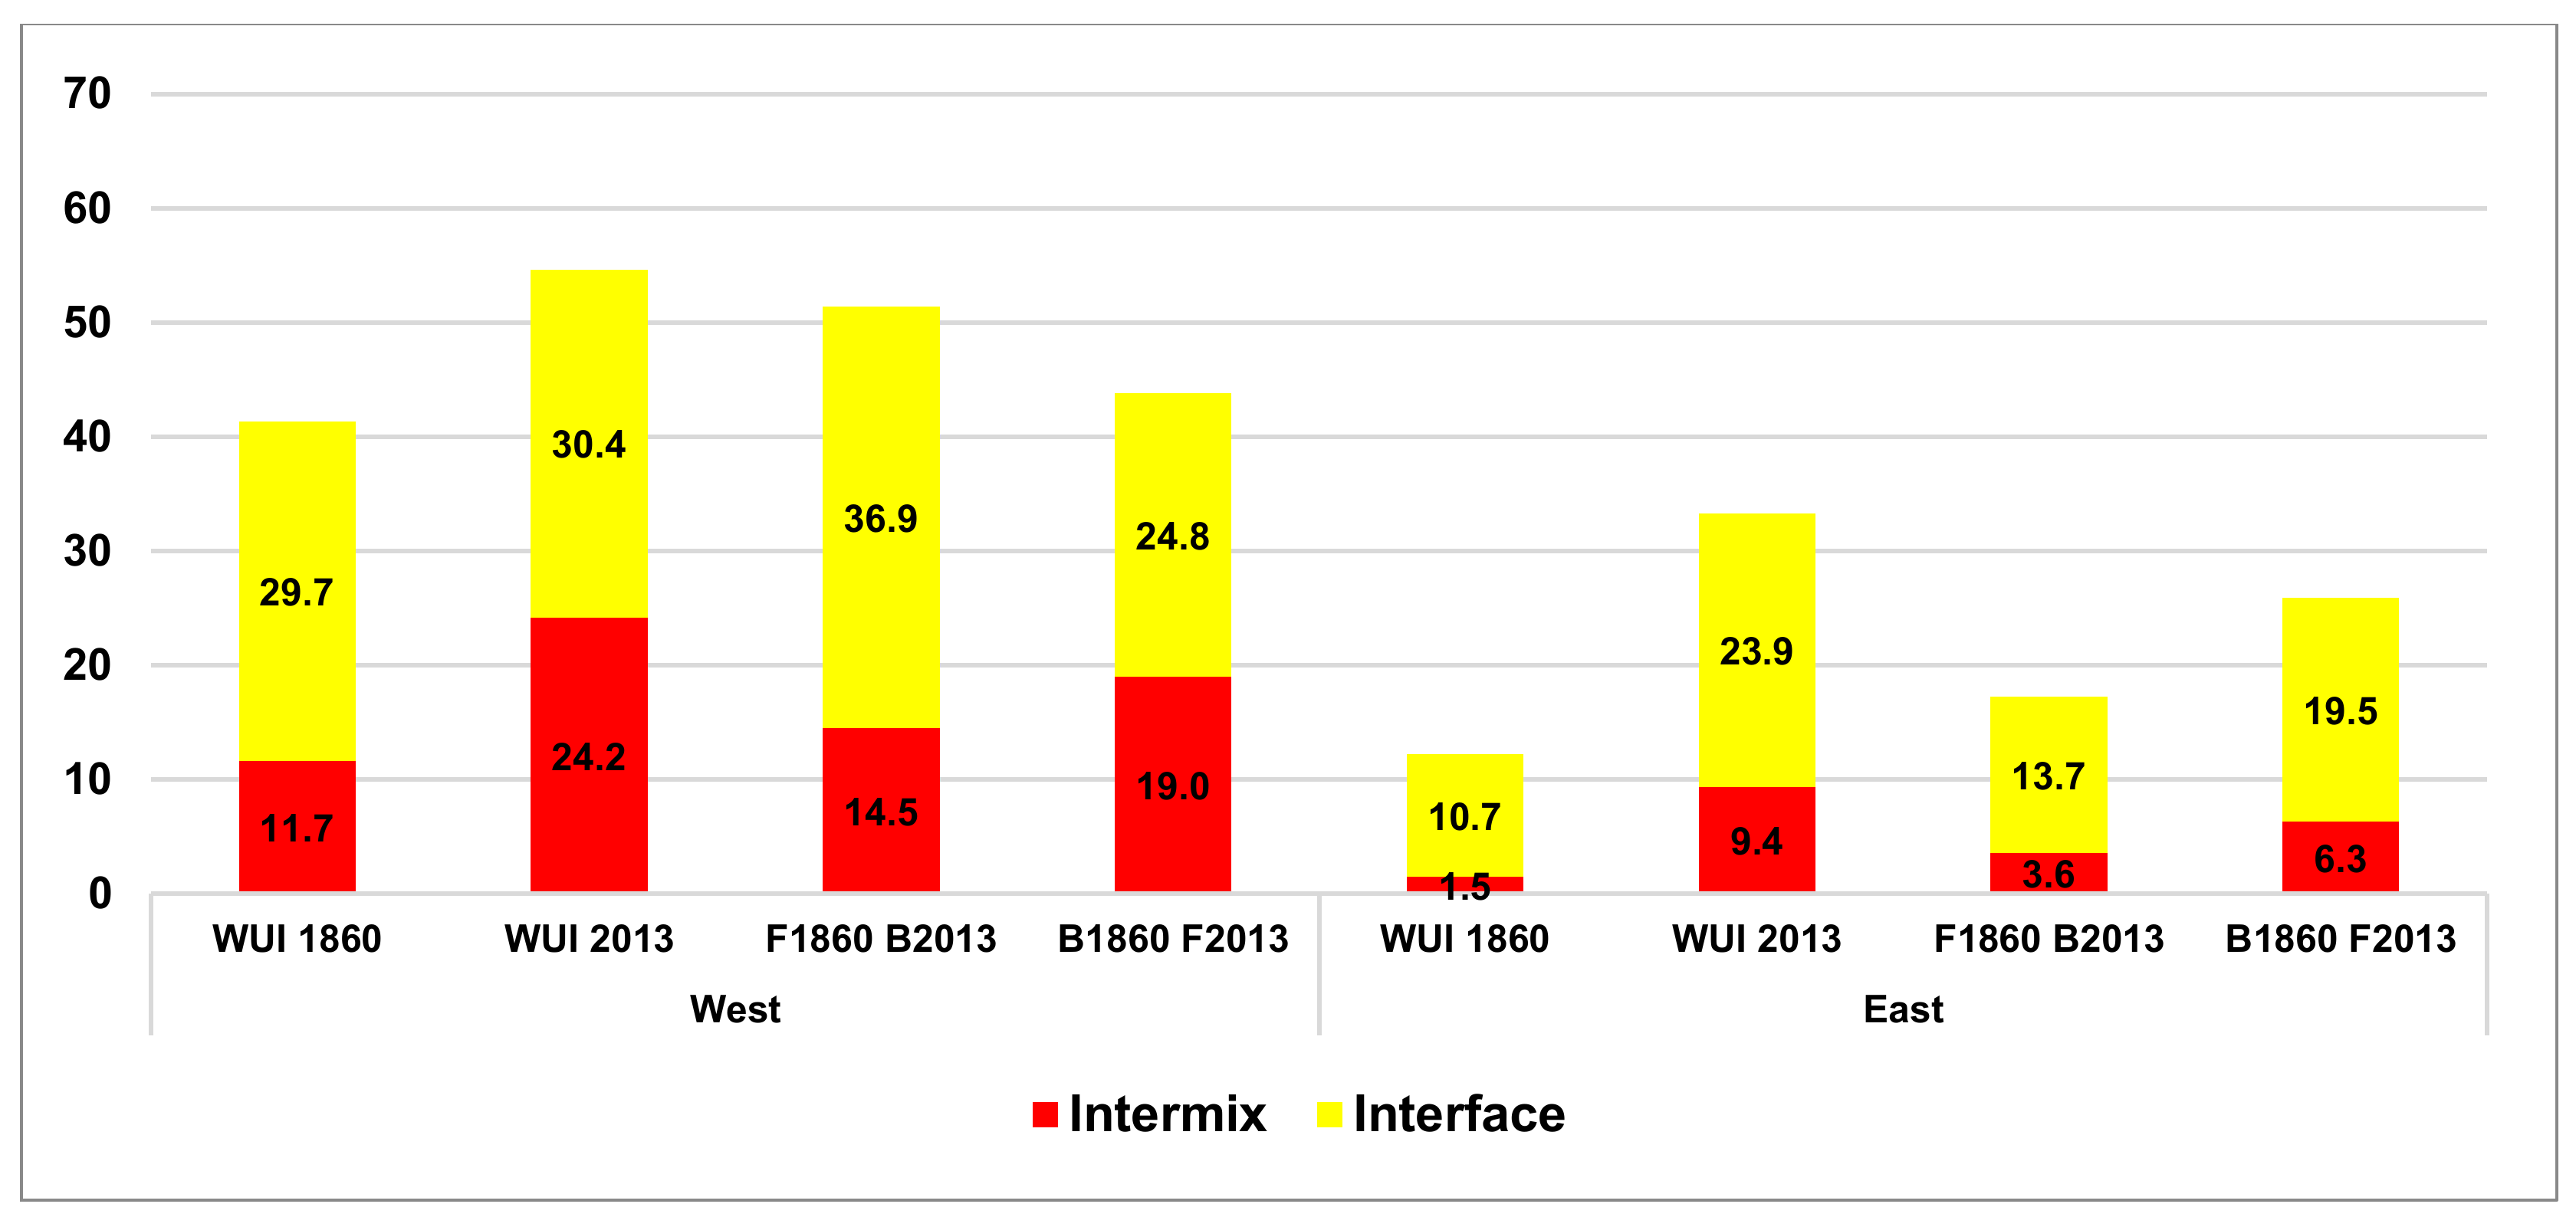
4.2. Conterfactual Scenarios to Identify Causes of WUI Growth

We modeled two counterfactual scenarios of WUI growth for each case study area to identify the main cause of WUI growth, i.e., housing growth or forest increase. Visually, in the western case study area the scenario based on 1860 forests and 2013 buildings resulted in a WUI map that was very similar to the actual 2013 WUI map, but the map based on 2013 forests and 1860 houses looked quite different (Figure 6). This suggests that in the western case study area, new buildings were the main cause for WUI growth.
In the eastern case study area, however, we found the opposite (Figure 6). Here, the counterfactual scenario based on based on 2013 forests and 1860 houses was quite similar to the actual 2013 map, whereas the other scenario, based on 1860 forests and 2013 buildings was quite different. This suggest that forest increases were indeed the main cause for WUI growth in the east.
When comparing the total WUI area (Figure 7), the same basic pattern occurred, in that the counterfactual scenario based on 1860 forests and 2013 buildings was closest to the actual 2013 WUI, whereas the scenario based on 2013 forests and 1860 houses was closest in the east. Last but not least, we correlated the actual WUI maps with the counterfactual scenario WUI maps. Again, in the west, 2013 WUI was most strongly correlated with 1860 forests and 2013 building scenario (r = 0.97, p < 0.05), while in the east the 2013 WUI was most strongly correlated with the 1860 buildings and 2013 forests scenario (r = 0.97, p < 0.05).

5. Discussion

We found that the WUI is widespread in the Polish Carpathians, and that the WUI grew considerably in both of our case study areas. In 1860, we found a strong difference in the amount of WUI area in the two study areas, but by 2013, this difference was considerably less visible. In 1860, the number of buildings in the east was 37% higher than in the west, but the opposite was true for forest proportion, which was only 20% of the eastern study area, but 43% of the west, resulting in far less WUI area in the east. It is important to add, that impact of WUI on the environment in 1860s and currently has changed substantially. Historically most of the buildings were wooden houses and most of the roads were unpaved, while currently the soil sealing is substantially higher. However, it was beyond our study to quantify such changes.
In 1860, not only the land use proportions, but also the spatial pattern of forests and buildings were important in shaping WUI extent similar to, e.g., California [48]. Most of the 1860 buildings in the western study area that were close to forests, were built to support sheep grazing at high elevations [43]. In contrast, in the eastern study area buildings were mainly located in the valleys, because there was almost no grazing at the higher elevations [45]. Furthermore, forest covered the mountain ridges of the east, so the potential for WUI was lower there than in the west. This is particularly apparent when examining the Intermix WUI, which covered in mid-19th century almost four times more area in the west than in the east (Figure 7). Similarly, the number of buildings in WUI in 1860 historically was much higher in the west than in the east (83% vs. 23%, respectively), highlighting that historical land use practices, especially sheep grazing, modified by environmental conditions and cultural practices were important factors for historical WUI patterns in the Polish Carpathians.
We also found that while the WUI was growing in area, the already existing WUI in 1860 was relatively stable in time. In other words, most of the 1860 WUI was still WUI 150 years later, despite the substantial land use changes that took place in the region. This highlights the importance of historical land use legacies in the region on current land use patterns. Indeed, in many cases the historical land use composition is more important in explaining current species distribution than the current one [49,50]. On the other hand, current WUI extent, because of its substantial effects on surrounding areas, may become a major cause for many future environmental problems. Examples from the Carpathian ecoregion highlight the general importance of the land use legacies both from the past on the presence [51,52], but also from the presence on the future [53], and we expect that the same will be true when focusing on the WUI.
When we analyzed the major causes of WUI growth based on our counterfactual scenarios, we found again the importance of historical land use on the current WUI, but WUI changes depended on past land use processes. In the western study area, if there had been only building increase, but no forest change, there would be more WUI, than in counterfactual scenario and slightly less than today. This highlight that building growth was clearly the most important causes for WUI growth in the west since 1860. In the east, by contrast, forest increase was clearly the more important cause for WUI growth (Figure 6).
The difference in the causes of WUI growth between the western and eastern case study areas was likely due to their land use history after World War II. In the west, dynamic, but gradual land use changes occurred [28,44]. In contrast, the east experienced a dramatic shock after the war when forced resettlements resulted in the disappearance of villages and widespread land abandonment [30,31,33]. This confirms the importance of the impact of non-linear land use changes, which are often due to institutional or political changes [29,54,55]. It also highlights that because many land use changes occur over decades, especially because forest increase is generally slower than housing growth, short-term studies may falsely attribute WUI growth to new settlements only. Nevertheless in relatively short and stable conditions of US 1990–2010, 97% of new WUI areas were caused by new housing [56]. However, when shock events cause major land use changes, then forest change may also be detected as a major cause of WUI growth, even when the study period is shorter. In our context, forests were increasing over time across the Polish Carpathians, but especially rapidly in the eastern study area where forests were rare in 1860. Looking ahead, it is difficult to predict where additional new WUI areas may appear. Potentially the most WUI-prone areas may be located both in the relative proximity to urban centers, where suburbanization may cause new WUI [57], and in rural areas where forests continue to increase [26,58].

6. Conclusions

Our results show that WUI areas in the Polish Carpathians increased rapidly over the last 150 years. Depending on the land use legacies in the region, it was either housing growth or forest cover increase, what triggered WUI growth in the Polish Carpathians. While in the western study area, settlement development was more important for WUI creation over time, it was quite opposite in the eastern study area. Sudden resettlement taking place in 1940s in the eastern part of the study area, was kind of shock influencing rapid forest cover increase combined with the partial villages removal. Although many of the villages were rebuilt later on, forest cover increase observed in the area was found to be more important WUI driver than the settlement development. Indicating forest cover increase, as a main driver of WUI growth is rather rare, contrary to housing growth [56]. Taking into account that forest cover increase and settlement development are widespread processes in many European mountain areas, and because of the large range of environmental problems associated with the WUI, there is a need to monitor WUI also in other mountain ranges. It might be especially important in the context of climate change, as it may trigger new processes and interactions in mountainous regions.

Acknowledgments

This research was funded, and cost of the open access publication was covered, by the Ministry of Science and Higher Education, Republic of Poland under the frame of “National Programme for the Development of Humanities” 2015–2020, as a part of the GASID project (Galicia and Austrian Silesia Interactive Database 1857–1910, 1aH 15 0324 83). The forest cover map was developed within FORECOM project (Forest cover changes in mountainous regions—drivers, trajectories and implications, PSRP 008/2010) supported by a grant from Switzerland through the Swiss contribution to the enlarged European Union. VR gratefully acknowledges support by the NASA LCLUC program.

Author Contributions

D.K and V.C.R. conceived and designed the research; D.K., M.S., M.D. and K.O. performed data acquisition; D.K. and M.S. analyzed the data and performed the study; D.K., V.C.R., M.S., M.D. and K.O. wrote the paper.

Conflicts of Interest

The authors declare no conflict of interest.

References

  1. Radeloff, V.C.; Hammer, R.B.; Stewart, S.I.; Fried, J.S.; Holcomb, S.S.; McKeefry, J.F. The Wildland-Urban Interface in the United States. Ecol. Appl. 2005, 15, 799–805. [Google Scholar] [CrossRef]
  2. Hammer, R.B.; Radeloff, V.C.; Fried, J.S.; Stewart, S.I. Wildland-urban interface housing growth during the 1990s in California, Oregon, and Washington. Int. J. Wildland Fire 2007, 16, 255–265. [Google Scholar] [CrossRef]
  3. Lampin-Maillet, C.; Long-Fournel, M.; Ganteaume, A.; Jappiot, M.; Ferrier, J.P. Land cover analysis in wildland-urban interfaces according to wildfire risk: A case study in the South of France. For. Ecol. Manag. 2011, 261, 2200–2213. [Google Scholar] [CrossRef]
  4. Lampin-Maillet, C.; Jappiot, M.; Long, M.; Bouillon, C.; Morge, D.; Ferrier, J.-P. Mapping wildland-urban interfaces at large scales integrating housing density and vegetation aggregation for fire prevention in the South of France. J. Environ. Manag. 2010, 91, 732–741. [Google Scholar] [CrossRef] [PubMed] [Green Version]
  5. Conedera, M.; Tonini, M.; Oleggini, L.; Vega Orozco, C.; Leuenberger, M.; Pezzatti, G.B. Geospatial approach for defining the Wildland-Urban Interface in the Alpine environment. Comput. Environ. Urban Syst. 2015, 52, 10–20. [Google Scholar] [CrossRef]
  6. Argañaraz, J.P.; Radeloff, V.C.; Bar-Massada, A.; Gavier-Pizarro, G.I.; Scavuzzo, C.M.; Bellis, L.M. Assessing wildfire exposure in the Wildland-Urban Interface area of the mountains of central Argentina. J. Environ. Manag. 2017, 196, 499–510. [Google Scholar] [CrossRef] [PubMed]
  7. Buxton, M.; Haynes, R.; Mercer, D.; Butt, A. Vulnerability to Bushfire Risk at Melbourne’s Urban Fringe: The Failure of Regulatory Land Use Planning. Geogr. Res. 2011, 49, 1–12. [Google Scholar] [CrossRef]
  8. Van Wilgen, B.W.; Forsyth, G.G.; Prins, P. The Management of Fire-Adapted Ecosystems in an Urban Setting: The Case of Table Mountain National Park, South Africa. Ecol. Soc. 2012, 17, 108. [Google Scholar] [CrossRef]
  9. Larsen, A.E.; MacDonald, A.J.; Plantinga, A.J. Lyme disease risk influences human settlement in the wildland-urban interface: Evidence from a longitudinal analysis of counties in the northeastern United States. Am. J. Trop. Med. Hyg. 2014, 91, 747–755. [Google Scholar] [CrossRef] [PubMed]
  10. Bar-Massada, A.; Radeloff, V.C.; Stewart, S.I. Biotic and Abiotic Effects of Human Settlements in the Wildland-Urban Interface. Bioscience 2014, 64, 429–437. [Google Scholar] [CrossRef]
  11. Evans, M.J.; Rittenhouse, T.A.G.; Hawley, J.E.; Rego, P.W. Black bear recolonization patterns in a human-dominated landscape vary based on housing: New insights from spatially explicit density models. Landsc. Urban Plan. 2017, 162, 13–24. [Google Scholar] [CrossRef]
  12. Loss, S.R.; Will, T.; Marra, P.P. The impact of free-ranging domestic cats on wildlife of the United States. Nat. Commun. 2013, 4, 1396. [Google Scholar] [CrossRef] [PubMed]
  13. Ibisch, P.L.; Hoffmann, M.T.; Kreft, S.; Pe’er, G.; Kati, V.; Biber-Freudenberger, L.; DellaSala, D.A.; Vale, M.M.; Hobson, P.R.; Selva, N. A global map of roadless areas and their conservation status. Science 2016, 354, 1423–1427. [Google Scholar] [CrossRef] [PubMed]
  14. Joint, E.F. Landscape Fragmentation in Europe; EEA Report; Europe Environment Agency: Copenhagen, Denmark, 2011; ISBN 9789292132156. [Google Scholar]
  15. Gavier-Pizarro, G.I.; Radeloff, V.C.; Stewart, S.I.; Huebner, C.D.; Keuler, N.S.; Gavier-Pizarro, G.I.; Radeloff, Á.V.C.; Stewart, S.I.; Huebner, C.D.; Keuler, N.S. Rural housing is related to plant invasions in forests of southern Wisconsin, USA. Landsc. Ecol. 2010, 25, 1505–1518. [Google Scholar] [CrossRef]
  16. Sullivan, J.J.; Timmins, S.M.; Williams, P.A. Movement of exotic plants into coastal native forests from gardens in northern New Zealand. N. Z. J. Ecol. 2005, 29, 1–10. [Google Scholar]
  17. Gaston, K.J.; Bennie, J.; Davies, T.W.; Hopkins, J. The ecological impacts of nighttime light pollution: A mechanistic appraisal. Biol. Rev. 2013, 88, 912–927. [Google Scholar] [CrossRef] [PubMed]
  18. Balmori, A. Electromagnetic pollution from phone masts. Effects on wildlife. Pathophysiology 2009, 16, 191–199. [Google Scholar] [CrossRef] [PubMed]
  19. Platt, R.V. The Wildland-Urban Interface: Evaluating the Definition Effect. J. For. 2010, 108, 9–15. [Google Scholar]
  20. Sirca, C.; Casula, F.; Bouillon, C.; García, B.F.; Fernández Ramiro, M.M.; Molina, B.V.; Spano, D. A wildfire risk oriented GIS tool for mapping Rural-Urban Interfaces. Environ. Model. Softw. 2017, 94, 36–47. [Google Scholar] [CrossRef]
  21. Chas-Amil, M.L.; Touza, J.; García-Martínez, E. Forest fires in the wildland-urban interface: A spatial analysis of forest fragmentation and human impacts. Appl. Geogr. 2013, 43, 127–137. [Google Scholar] [CrossRef]
  22. Gurung, A.B.; von Dach, S.W.; Price, M.F.; Aspinall, R.; Balsiger, J.; Baron, J.S.; Sharma, E.; Greenwood, G.; Kohler, T. Global Change and the World’s Mountains—Research Needs and Emerging Themes for Sustainable Development. Mt. Res. Dev. 2012, 32, S47–S54. [Google Scholar] [CrossRef]
  23. Kaim, D.; Kozak, J.; Kolecka, N.; Ziółkowska, E.; Ostafin, K.; Ostapowicz, K.; Gimmi, U.; Munteanu, C.; Radeloff, V.C. Broad scale forest cover reconstruction from historical topographic maps. Appl. Geogr. 2016, 67, 39–48. [Google Scholar] [CrossRef]
  24. Bucała-Hrabia, A. Long-term impact of socio-economic changes on agricultural land use in the Polish Carpathians. Land Use Policy 2017, 64, 391–404. [Google Scholar] [CrossRef]
  25. Chapron, G.; Kaczensky, P.; Linnell, J.D.C.; von Arx, M.; Huber, D.; Andrén, H.; López-Bao, J.V.; Adamec, M.; Álvares, F.; Anders, O.; et al. Recovery of large carnivores in Europe’s modern human-dominated landscapes. Science 2014, 346, 1517–1519. [Google Scholar] [CrossRef] [PubMed]
  26. Kaim, D. Land cover changes in the Polish Carpathians based on repeat photography. Carpath. J. Earth Environ. Sci. 2017, 12, 485–498. [Google Scholar]
  27. Kowalewski, J.; Mordasewicz, J.; Osiatyński, J.; Regulski, J.; Stępień, P.; Śleszyński, P. Raport o Ekonomicznych Stratach i Społecznych Kosztach Niekontrolowanej Urbanizacji w Polsce; PAN IGiPZ: Warszawa, Poland, 2013. [Google Scholar]
  28. Kozak, J. Forest Cover Changes and Their Drivers in the Polish Carpathian Mountains Since 1800. In Reforesting Landscapes: Linking Pattern and Process; Nagendra, H., Southworth, J., Eds.; Landscape Series; Springer Netherlands: Dordrecht, The Netherlands, 2010; Volume 10, pp. 253–273. ISBN 978-1-4020-9656-3. [Google Scholar]
  29. Munteanu, C.; Kuemmerle, T.; Boltiziar, M.; Butsic, V.; Gimmi, U.; Lúboš, H.; Kaim, D.; Király, G.; Konkoly-Gyuró, É.; Kozak, J.; et al. Forest and agricultural land change in the Carpathian region—A meta-analysis of long-term patterns and drivers of change. Land Use Policy 2014, 38, 685–697. [Google Scholar] [CrossRef]
  30. Kozak, J.; Estreguil, C.; Troll, M. Forest cover changes in the northern Carpathians in the 20th century: A slow transition. J. Land Use Sci. 2007, 2, 127–146. [Google Scholar] [CrossRef]
  31. Kaim, D. Zmiany pokrycia terenu na pograniczu polsko-słowackim na przykładzie Małych Pienin. Prz. Geogr. 2009, 81, 93–106. [Google Scholar] [CrossRef]
  32. Affek, A. Spatially explicit changes in land ownership through 3 socio-political systems: A case study from southeast Poland. Geogr. Pol. 2015, 88, 519–530. [Google Scholar] [CrossRef]
  33. Angelstam, P.; Elbakidze, M.; Axelsson, R.; Čupa, P.; Halada, L.; Molnar, Z.; Pătru-Stupariu, I.; Perzanowski, K.; Rozulowicz, L.; Standovar, T.; et al. Maintaining Cultural and Natural Biodiversity in the Carpathian Mountain Ecoregion: Need for an Integrated Landscape Approach. In The Carpathians: Integrating Nature and Society Towards Sustainability; Kozak, J., Ostapowicz, K., Bytnerowicz, A., Wyżga, B., Eds.; Springer: Berlin/Heidelberg, Germany, 2013; pp. 393–424. ISBN 978-3-642-12724-3. [Google Scholar]
  34. Mika, M. Spatial Patterns of Second Homes Development in the Polish Carpathians. In The Carpathians: Integrating Nature and Society Towards Sustainability SE 35; Kozak, J., Ostapowicz, K., Bytnerowicz, A., Wyżga, B., Eds.; Springer: Berlin Heidelberg, Germany, 2013; pp. 497–512. ISBN 978-3-642-12724-3. [Google Scholar]
  35. Timár, G.; Biszak, S.; Székely, B.; Molnár, G. Digitized Maps of the Habsburg Military Surveys—Overview of the Project of ARCANUM Ltd. (Hungary). In Preservation in Digital Cartography; Springer: Berlin/Heidelberg, Germany, 2010; pp. 273–283. [Google Scholar]
  36. Feurdean, A.; Munteanu, C.; Kuemmerle, T.; Nielsen, A.B.; Hutchinson, S.M.; Ruprecht, E.; Parr, C.L.; Perşoiu, A.; Hickler, T. Long-term land-cover/use change in a traditional farming landscape in Romania inferred from pollen data, historical maps and satellite images. Reg. Environ. Chang. 2017, 17, 2193–2207. [Google Scholar] [CrossRef]
  37. Munteanu, C.; Kuemmerle, T.; Boltiziar, M.; Lieskovský, J.; Mojses, M.; Kaim, D.; Konkoly-Gyuró, É.; Mackovčin, P.; Műller, D.; Ostapowicz, K.; et al. Nineteenth-century land-use legacies affect contemporary land abandonment in the Carpathians. Reg. Environ. Chang. 2017, 17, 2209–2222. [Google Scholar] [CrossRef]
  38. Kaim, D.; Kozak, J.; Ostafin, K.; Dobosz, M.; Ostapowicz, K.; Kolecka, N.; Gimmi, U. Uncertainty in historical land-use reconstructions with topographic maps. Quaest. Geogr. 2014, 33, 55–63. [Google Scholar] [CrossRef]
  39. Dz.U. Rozporządzenie MSWiA z Dnia 17 Listopada 2011 r. w Sprawie Bazy Danych Obiektów Topograficznych Oraz Bazy Danych Obiektów Ogólnogeograficznych, a Także Standardowych Opracowań Kartograficznych; Dziennik Ustaw: Warsaw, Poland, 2011. [Google Scholar]
  40. Dobosz, M.; Kozak, J. Problem integracji danych przestrzennych na przykładzie szacowania współczesnej powierzchni lasów w Karpatach Polskich. In XXV Konferencja PTIP; Biblioteka Narodowa: Warsaw, Poland, 2015. [Google Scholar]
  41. Reinfuss, R. Próba charakterystyki etnograficznej Rusi Szlachtowskiej na podstawie niektórych elementów kultury materialnej. Lud 1947, 37, 160–235. [Google Scholar]
  42. Troll, M.; Ostafin, K. Use of late 18th and early 19th century cadastral data to estimate past forest cover change—A case study of Zawoja village. Pr. Geogr. 2016, 146, 31–49. [Google Scholar] [CrossRef]
  43. Kubijowicz, W. Życie pasterskie w Beskidach Magórskich. Pr. Kom. Etnogr. PAU 1927, 2, 1–65. [Google Scholar]
  44. Sobala, M.; Rahmonov, O.; Myga-Piatek, U. Historical and contemporary forest ecosystem changes in the Beskid Mountains (southern Poland) between 1848 and 2014. iFor. Biogeosci. For. 2017, 10, 939. [Google Scholar] [CrossRef]
  45. Dobrowolski, K. Studia nad kulturą pasterską w Karpatach północnych. Typologia wędrówek pasterskich od XIV–XX wieku. Wierchy 1960, 29, 7–51. [Google Scholar]
  46. Bar-Massada, A.; Stewart, S.I.; Hammer, R.B.; Mockrin, M.H.; Radeloff, V.C. Using structure locations as a basis for mapping the wildland urban interface. J. Environ. Manag. 2013, 128, 540–547. [Google Scholar] [CrossRef] [PubMed]
  47. USDA and USDI. Urban wildland interface communities within vicinity of Federal lands that are at high risk from wildfire. Fed. Reg. 2001, 66, 751–777. [Google Scholar]
  48. Syphard, A.D.; Clarke, K.C.; Franklin, J. Simulating fire frequency and urban growth in southern California coastal shrublands, USA. Landsc. Ecol. 2007, 22, 431–445. [Google Scholar] [CrossRef]
  49. Sullivan, J.J.; Williams, P.A.; Cameron, E.K.; Timmins, S.M. People and Time Explain the Distribution of Naturalized Plants in New Zealand. Weed Technol. 2004, 18, 1330–1333. [Google Scholar] [CrossRef]
  50. Gavier-Pizarro, G.I.; Radeloff, V.C.; Stewart, S.I.; Huebner, C.D.; Keuler, N.S. Housing is positively associated with invasive exotic plant species richness in New England, USA. Ecol. Appl. 2010, 20, 1913–1925. [Google Scholar] [CrossRef] [PubMed]
  51. Main-Knorn, M.; Hostert, P.; Kozak, J.; Kuemmerle, T. How pollution legacies and land use histories shape post-communist forest cover trends in the Western Carpathians. For. Ecol. Manag. 2009, 258, 60–70. [Google Scholar] [CrossRef]
  52. Munteanu, C.; Kuemmerle, T.; Keuler, N.S.N.S.; Müller, D.; Balázs, P.; Dobosz, M.; Griffiths, P.; Halada, L.; Kaim, D.; Király, G.; et al. Legacies of 19th century land use shape contemporary forest cover. Glob. Environ. Chang. 2015, 34, 83–94. [Google Scholar] [CrossRef]
  53. Price, B.; Kaim, D.; Szwagrzyk, M.; Ostapowicz, K.; Kolecka, N.; Schmatz, D.R.; Wypych, A.; Kozak, J. Legacies, socio-economic and biophysical processes and drivers: The case of future forest cover expansion in the Polish Carpathians and Swiss Alps. Reg. Environ. Chang. 2017, 17, 2279–2291. [Google Scholar] [CrossRef]
  54. Hostert, P.; Kuemmerle, T.; Prishchepov, A.; Sieber, A.; Lambin, E.F.; Radeloff, V.C. Rapid land use change after socio-economic disturbances: The collapse of the Soviet Union versus Chernobyl. Environ. Res. Lett. 2011, 6, 1–8. [Google Scholar] [CrossRef]
  55. Baumann, M.; Kuemmerle, T. The impacts of warfare and armed conflict on land systems. J. Land Use Sci. 2016, 11, 672–688. [Google Scholar] [CrossRef]
  56. Radeloff, V.C.; Helmers, D.; Kramer, A.; Mockrin, M.H.; Alexandre, P.; Bar-Massada, A.; Butsic, V.; Hawbaker, T.J.; Martinuzz, S.; Syphard, A.D.; et al. Rapid growth of the US wildland-urban interface raises wildfire risk. Proc. Natl. Acad. Sci. USA 2018. [Google Scholar] [CrossRef] [PubMed]
  57. Grădinaru, S.R.; Iojă, C.I.; Onose, D.A.; Gavrilidis, A.A.; Pătru-Stupariu, I.; Kienast, F.; Hersperger, A.M. Land abandonment as a precursor of built-up development at the sprawling periphery of former socialist cities. Ecol. Indic. 2015, 57, 305–313. [Google Scholar] [CrossRef]
  58. Kolecka, N.; Kozak, J.; Kaim, D.; Dobosz, M.; Ostafin, K.; Ostapowicz, K.; Wężyk, P.; Price, B. Understanding farmland abandonment in the Polish Carpathians. Appl. Geogr. 2017, 88, 62–72. [Google Scholar] [CrossRef]
Figure 1. Study area.
Ijgi 07 00137 g001
Figure 2. Historical data acquisition—result of manual vectorization of forest (in grey on the original map on the left and green as a result of vectorisation on the right) and building locations (red or black dots on the original map on the left and red and yellow as a result of vectorisation on the right).
Ijgi 07 00137 g002
Figure 3. Intermix (left) and Interface (right) Wildland–Urban Interface (WUI); image: Google Maps.
Ijgi 07 00137 g003
Figure 4. WUI defining based on point (buildings) and raster (forest) data; based on: [46].
Ijgi 07 00137 g004
Figure 5. Number of buildings (a) and forest proportion [%] (b) in the western and eastern case study areas in 1860 and 2013.
Ijgi 07 00137 g005
Figure 6. Land use and WUI changes over time; F1860 B2013—scenario with 1860 forest extent and 2013 buildings; B1860 F2013—scenario with 1860 buildings and 2013 forest extent.
Ijgi 07 00137 g006
Figure 7. WUI proportions [% of study area] for real and modeled extents; F1860 B2013—scenario with 1860 forest extent and 2013 buildings; B1860 F2013—scenario with 1860 buildings and 2013 forest extent.
Ijgi 07 00137 g007
Table 1. WUI areas as a percentage of the study area (%).
Study AreaYearIntermix WUI (%)Interface WUI (%)Total (%)
West186011.729.741.3
201324.230.454.6
East18601.510.712.2
20139.423.933.3
Table 2. WUI transition matrices 1860–2013 (%).
2013
Non-WUIIntermixInterface
1860WestNon-WUI42.17.78.9
Intermix0.622.46.7
Interface2.70.38.6
EastNon-WUI65.76.715.4
Intermix0.31.20.03
Interface0.71.58.5

