Abstract
Charitable foundations are a critical part of public services. However, there is a large gap between the locations and expenditures of charitable foundations and the real population needs for most nations. Three types of Chinese local charity foundations, i.e., those for poverty, education and medical assistance, are used as examples to explore the distinct gaps. The spatial distributions of local charity foundations are characterized by spatial scan statistics and spatial autocorrelation models. The local population needs of charitable assistance for poverty, education and medical services are quantified with their respective weighted proxy indexes of the current conditions. Thus, the nonlinear relationships between population needs and the expenditures of local charitable foundations are described with generalized additive models. The results show that both the participation rate and the charity expenditures of the foundations are highly clustered within a few cities where the population needs are relatively small and are furthermore rare among the other cities. The charity expenditures of local foundations are nonlinearly correlated with the current conditions of socioeconomic development, education and medical levels due to the diverse development stages of the cities. This study provides quantitative evidence for local authorities and charitable foundations to make targeted and constructive decisions to gradually reduce the distinct gaps.
1. Introduction
Charitable foundations play a critical role in offering grants to charitable organizations for public services [1,2,3]. Charitable organizations include nongovernment organizations (NGOs), nonprofit organizations (NPOs), and charitable foundations, who undertake charitable activities and implement their own charitable programs [4,5]. An accurate and clear understanding of the distributions of charitable foundations and their expenditures lead to better decision making by governmental authorities, policy makers, private donors, and charitable foundations themselves in targeting areas where people need support the most. It is also essential to make the best use of limited resources and to reduce duplicated and concentrated resource allocation [6].
The location of charitable foundations and programs has drawn the attention of more researchers in recent years with the increased development of charitable organizations globally. The ideal location of charitable foundations and programs is in the communities and areas where the need is relatively large but support is limited. Thus, in previous studies, a series of quantitative analyses have been performed to understand the spatial distributions and locations of charitable foundations and programs. A primary finding is that the locations of charitable foundations are largely inconsistent with the distribution of need. For instance, NGOs have an extremely unbalanced distribution in the Andes in South America, and few of them are located at the most impoverished areas [6]. Similar results also appear in the studies of South Asia and Africa. A study of Bangladesh shows that there was no direct association between the number of NGOs and the needs of the communities from 1995 to 2000 [7]. In South Africa, human immunodeficiency virus (HIV) related NGOs are not located in the areas where the HIV prevalence rate is the highest, such as Cape Town [8]. Furthermore, a few studies also find that there is a large gap between charity expenditures and the real needs of communities, in addition to the unbalanced locations. Spatial analysis of the Temporary Assistance for Needy Families (TANF) program in the Rustbelt states of the United States shows that the higher income counties are more likely to receive benefits from human services expenditures than the lower income counties [9]. A study across 44 countries in sub-Saharan Africa also indicates a large gap and mismatch between the expenditures of conservation NGOs and community needs [10].
In addition, an increasing number of studies try to explain the root causes of the unbalanced distribution of charitable foundations. The study of comparing NGO distributions among different countries in Africa reveals that the NGOs are much more likely to be located in more democratic countries, which means that the locations of charitable foundations are dependent not only on the population needs but also on the political atmosphere [11]. A global comparison study of the distributions of human rights transnational NGOs shows that the human rights organizations are likely to exist in the countries with a larger population and more democracy [12]. The exploration of NGO distributions in Bolivia using a geographical information system (GIS) method demonstrates that the highly unbalanced distributions are not significantly correlated with population needs but associated with population size, levels of urbanization, and conditions of the health care system [13].
Generally, even though previous studies have revealed the unbalanced distributions of charitable foundations and population needs to a certain extent, the studies on the following three aspects are very limited: First, a primary gap is that the quantitative analysis methods are relatively simple, leading to a superficial understanding of the unbalanced distributions. Most of the quantitative studies prefer methods such as descriptive analysis and statistical testing, but few of them utilize spatial statistical methods to further understand the deep and sophisticated associations between the unbalanced distributions and potential factors. Next, studies of the locations of charitable foundations are primarily concerned with investigating the unbalanced distributions, but they lack the integration of location and attribute information to fully visualize the spatial distribution of charitable foundations. Charitable foundation expenditures on public services is a critical attribute of the contributions of the foundations. Finally, Africa and South America are the primary study areas due to the relatively large poor population and undeveloped areas, while studies are limited in the developing nations with a relatively large gap between rich and poor and in nations with uneven development across different regions, such as China. These nations should be a focus, since it is more likely that the charitable foundations are unevenly distributed and that charitable spending and resources are clustered within developed regions where the population needs are relatively small.
This study aims to understand the current gaps between the expenditure distributions of local charitable foundations and the population needs in China. This study is the first geospatial analysis of charitable foundations and their expenditures in China. To capture the spatial distributions and characteristics of the local charitable foundations, the charity type, participation rate, income and expenditures of 361 local charitable foundations for poverty, education and medical assistance were collected from 289 administrative cities in China. Correspondingly, the local population needs for assistance with poverty, education and medical services are characterized from the perspective of socioeconomic development, education and medical levels, respectively. In addition to the locations of charitable foundations, the distribution of their expenditures is targeted and analyzed because the expenditures can more accurately explain the gaps between charitable foundations and local population needs. Thus, in this study, spatial clustering analysis is performed to explore the spatial clusters and gaps between the distribution of local charitable foundations and population needs. Then, nonlinear relationships among three types of local charitable foundations and population needs are investigated using location-calibrated generalized additive models (GAMs), which describe the nonlinear relationship between variables and responses through nonparametric smoothing functions [14].
2. Data and Methods
2.1. Charitable Foundation Data
In this paper, the data of 361 local charitable foundations for poverty, education and medical assistance distributed among 289 administrative cities in China were collected from the Research Infrastructure of Chinese Foundation [15,16] (Figure 1). Since the data of local charitable foundations and the corresponding local population needs data are not available in other areas, the study area in this study is the 289 administrative cities in China. The administrative cities include most of the eastern regions and all provincial capital cities, where 92.82% of the population live even though it covers only 49.90% of the area in China. Thus, the study area and data are reasonable and representative to be used to assess the gaps between charitable foundations and the local population needs. Local charitable foundations are utilized for spatial statistical analysis since almost all of the expenditures are for public services in local regions instead of other regions; thus, the spatial analysis reasonably reflects the associations between local expenditures and local population needs. In this paper, the primary attributes of local foundations (LFs) consist of four aspects. First, according to the sources of donations, the LFs are generally classified as nonprofit and public offering foundations to differentiate the nature (NTR) of the foundation. Public offering foundations can directly fund-raise from the public, but nonprofit foundations cannot. Next, a staff number is used to reflect the scale of participants, including the number of full-time employees (NFE) and the number of volunteers (NV). Third, the size of funds is described by the annual donation income (ADI), total annual expenses (TAE), expenditure for charitable purpose (ECP) and expenditure for other purposes (EOP). EOP might be expenses for benefits and salaries of full-time staff and administrative costs.
Figure 1.
Population and economic distributions in the study area (A) and charity expenditures of local foundations (B).
2.2. Local Population Need Data
Local population needs for assistance with poverty, education and medical services are characterized from the perspective of socioeconomic development, education and medical levels, respectively, which means that a higher population need index indicates a lower current condition, and vice versa. Table 1 lists the proxy variables that are used to describe the local population needs or current conditions. Figure 1 also shows the basic socioeconomic information of population and per capita gross regional product (PCGRP) in the study area and the ECP of LFs. The three clustering regions of the LFs are I. Beijing, II. Jiangsu, Shanghai and Zhejiang, and III. Fujian and Guangdong.
Table 1.
Variables and indexes for describing local population needs.
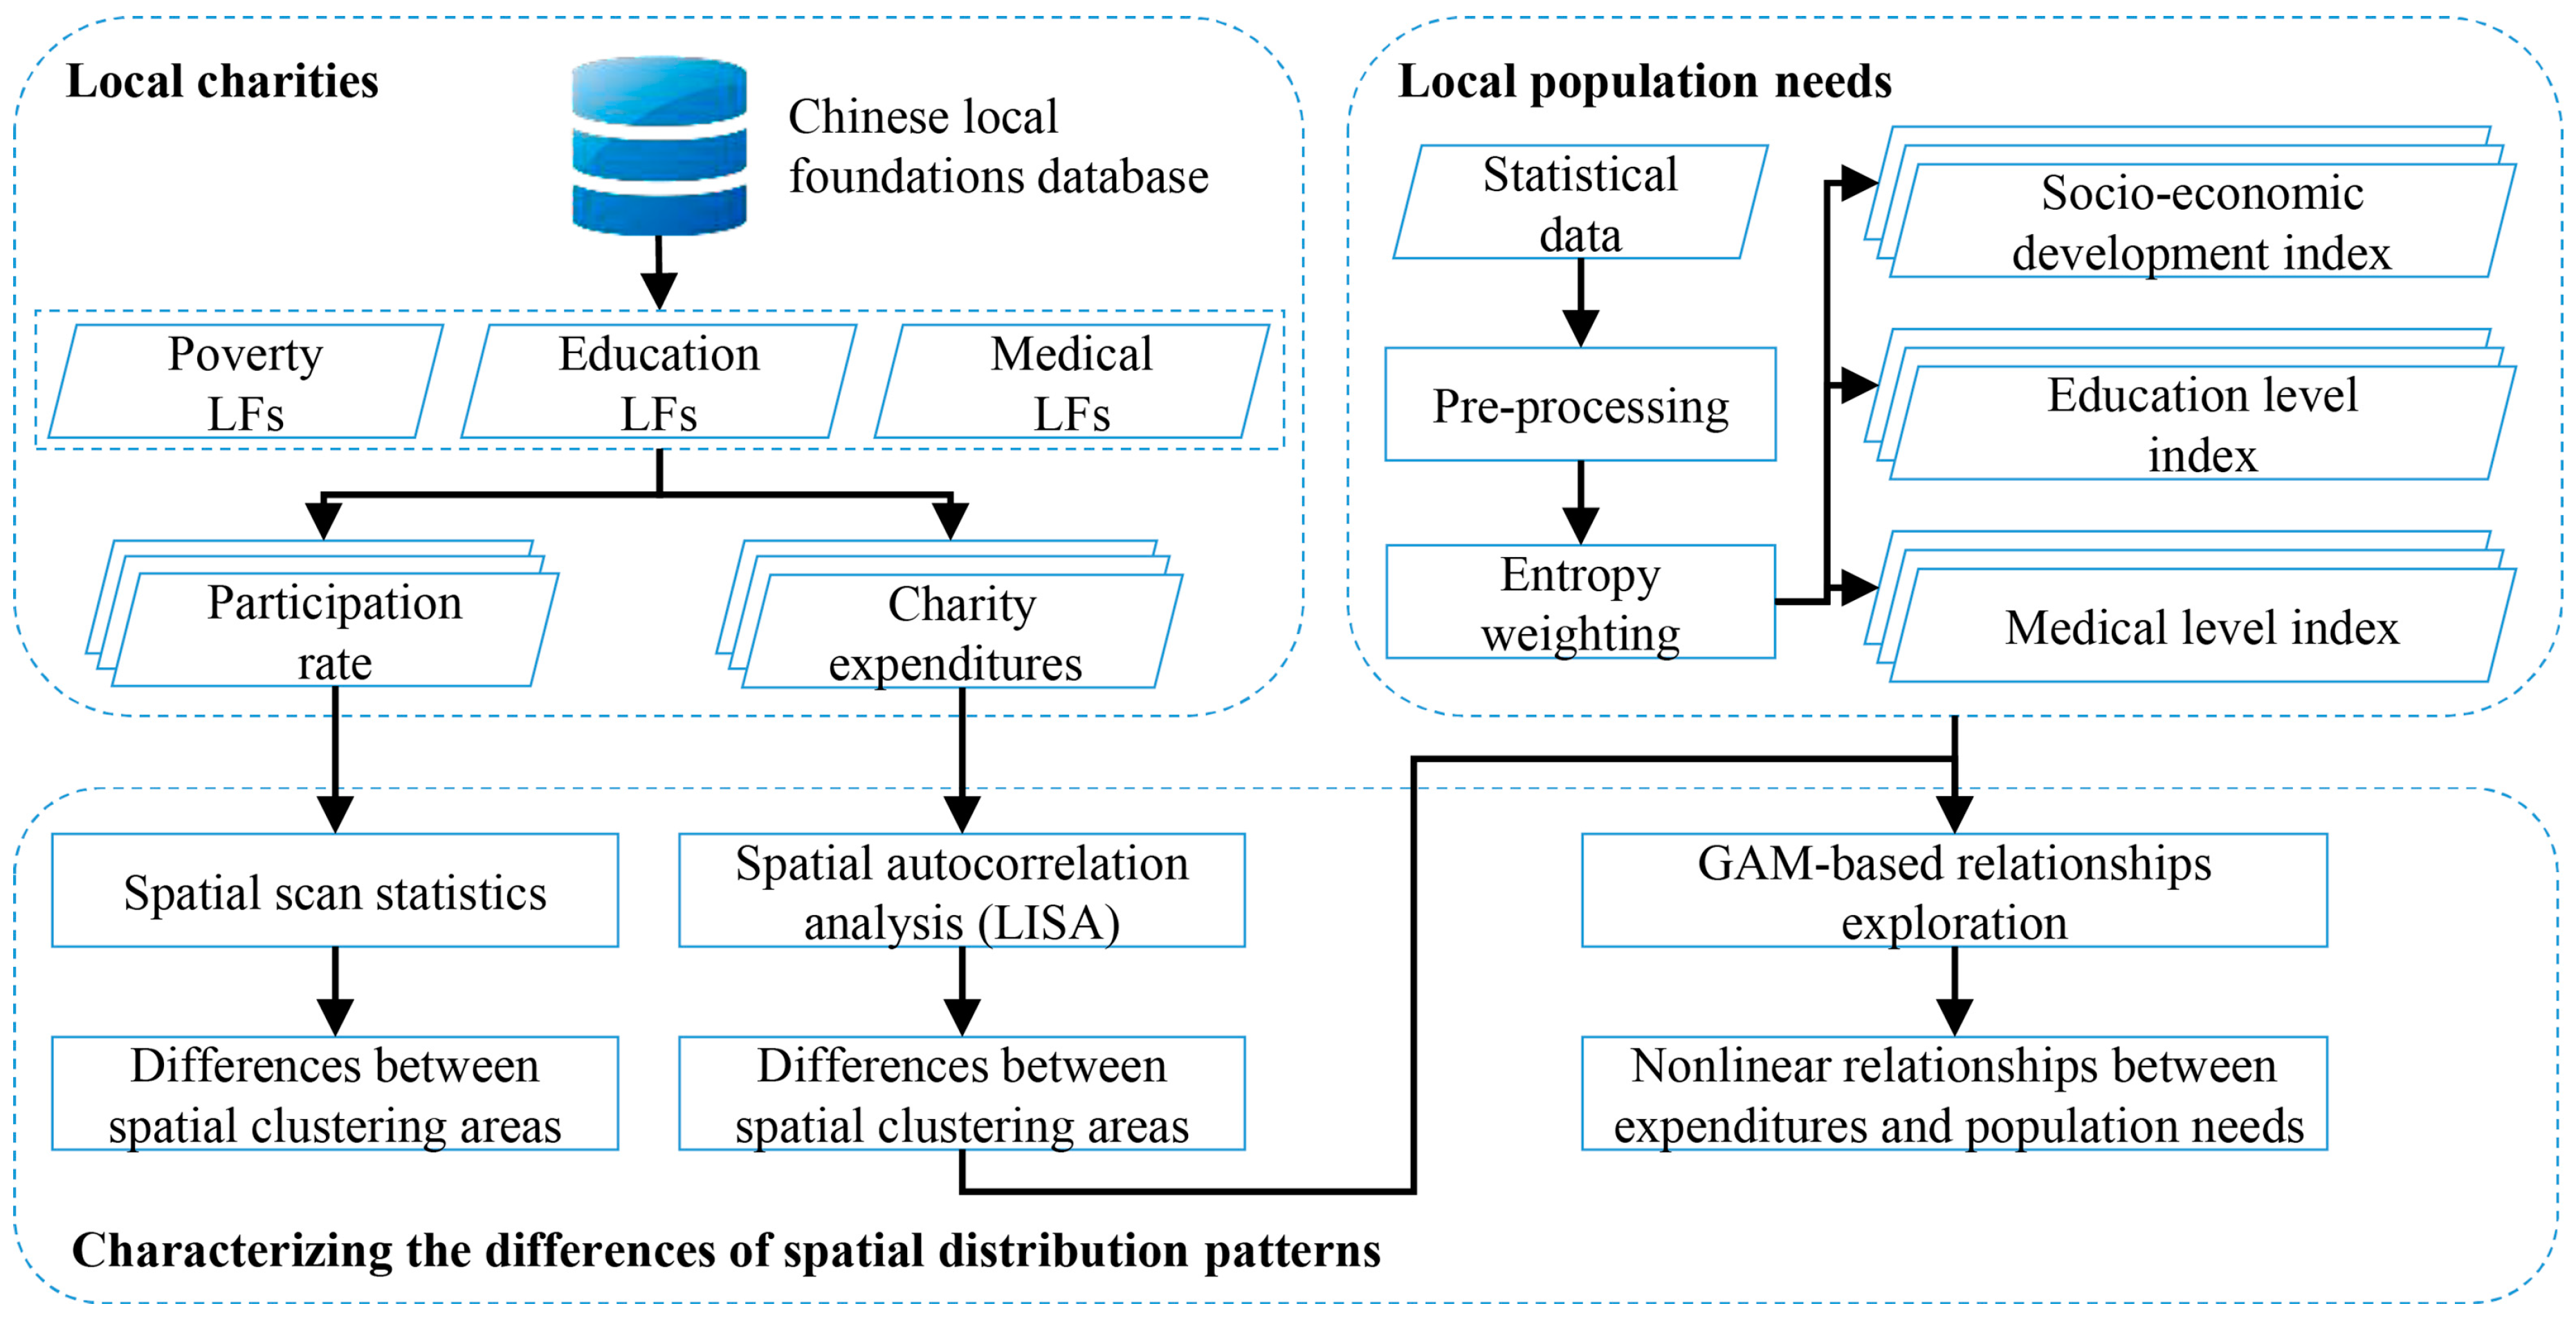
2.3. Spatial Analysis Methods
Both statistical and spatial statistical methods are utilized to characterize the distinct gaps between the distributions of three kinds of local charity foundations, namely, poverty, education and medical assistance, and city-level local population needs in China. Figure 2 shows the steps for data processing, including exploring local charities, detecting local population needs and characterizing the differences in the spatial distribution patterns. The methods used in these steps are introduced below.
Figure 2.
Schematic flowchart of the geospatial analysis for gaps between the distribution of local foundations and population needs.
The first step is a statistical summary and pre-processing of the local charitable foundations data. The attributes of three types of local charity foundations, i.e., those for poverty, education and medical assistance, are studied in this paper. The two main attributes are charity participation rate, derived from NFE and NV, and charity incomes (ADI) and expenditures (ECP and EOP). Both participation rate and charity incomes and expenditures are statistically summarized for nonprofit and public offering LFs, respectively. For a better understanding of the spatial patterns of local charities, all attributes are summarized to the spatial unit of an administrative city in China.
Then, local population needs are described by the entropy weighted indexes of current local population conditions. Corresponding to the LFs for poverty, education and medical assistance, three types of indexes of the current local population conditions are proposed: the socioeconomic development, education level and medical level indexes. A lower index of current local population conditions means a higher local population need. All three indexes are computed by the combination of their entropy weighted proxy variables. Before the weight determination, all variables should be standardized to compare the assessment variables as dimensionless. The variables that positively correlate with the index are standardized by Equation (1), and variables that negatively correlate with the index are standardized according to Equation (2).
where () is the original value, is the standardized result of the th () proxy variable, and and are the maximum and minimum of , respectively. According to the definition of entropy, the entropy of the th proxy variable is computed by:
where
The entropy weight of the th proxy variable is calculated by:
The entropy weight represents the useful information of the variable, so the larger the entropy weight of the proxy variable is, the more useful the information of the variable.
Third, the spatial clusters are analyzed for charity participation rate and the charity expenditures of local foundations. Spatial scan statistics are used to identify and quantify the cluster regions of high charity participation rate given the number of participants including full-time employees and volunteers in each city [17]. Briefly, a moving scan window in the study area is built as increasing concentric circles around the centroid of each city, and the window size is the ratio of the population in the window to the total population. Additionally, the total number of actual cases and the number of expected cases both in and out of the window are calculated. Then, the difference between the rate of the event in and out of the window is estimated using a log likelihood ratio , which is computed by:
where is the number of actual cases in the moving window and is an indicator function determined by:
The size and location of the window are dynamically changed, and the is recalculated until a maximum is selected; then, the window becomes the cluster window of high participation rate. The result of the spatial scan statistical analysis is the accurate areas of high participation rate. This analysis is performed using SaTScan 9.4.4 with the settings of a discrete Poisson model and a circular moving window with a maximum window size of 50% of the total population.
The clusters of charity expenditures are explored using the local spatial autocorrelation method of the local indicator of spatial association (LISA) [18]. The spatial cluster areas are identified by local index values and classified as a cluster of high values (H-H), a cluster of low values (L-L), a high-value outlier surrounded by low values (H-L) and a low-value outlier surrounded by high values (L-H), together with the statistically significant levels measured by p-values. Thus, a city in the H-H cluster region is one that has an elevated charity expenditure, and the neighboring cities primarily have elevated charity expenditure. Hotspot regions include high-high (H-H) and high-low (H-L) regions where a certain spatial unit with a high value is surrounded by high-value units or low-value units, and cold-spot regions include low-low (L-L) and low-high (L-H) regions where a certain spatial unit with a low value is surrounded by low-value units or high-value units, respectively. This process is performed using GeoDa 1.8.16 [19].
Finally, the relationships between charity expenditures of local foundations and local population conditions are investigated. The relationship between charity expenditure of LFs for poverty, education or medical assistance and the corresponding local population condition is constructed by a generalized additive model (GAM), which describes the nonlinear relationship between variables and responses through nonparametric smoothing functions [14]. To improve the model performance, the sub-indexes and geographical locations of cities are added in the model. GAM is constructed as:
where is the charity expenditure of LF; represents the type of LF, such as LF for poverty, education and medical assistance; is a continuous nonlinear variable; and are variables for the longitude and latitude of a city, respectively; is an unknown coefficient; and are nonparametric smoothing functions between and nonlinear variables; and is the normally distributed random error term. GAM is also a flexible and reliable spatial estimation model [20], so a tensor product of longitude and latitude is constructed to depict the spatial distributions of charity expenditures. GAM is performed using the R mgcv package. The parameters of the smoothing functions are computed automatically by the generalized cross-validation (GCV) criterion, since the calculation efficiency is improved and a better GCV score is derived through the integrative process [21].
3. Results
The distinct gaps between distributions of the three kinds of local charitable foundations, namely, poverty, education and medical assistance, and the respective population needs are explored by both statistical and spatial statistical methods. For the consistency of the spatial unit, the attributes of LFs are summarized at the city level. The results are presented based on five aspects in this section. In Section 3.1, the attributes of charitable foundations are summarized with statistical methods to describe the basic information and differences among various categories of local foundations. Section 3.2 and Section 3.3 present the spatial distributions of charity expenditures and the spatial clusters of participants and charity expenditures, respectively. In Section 3.4, the local population needs are characterized based on three aspects: socioeconomic conditions, education level and medical level. Finally, Section 3.5 assesses the relationships between charity expenditures and local population needs.
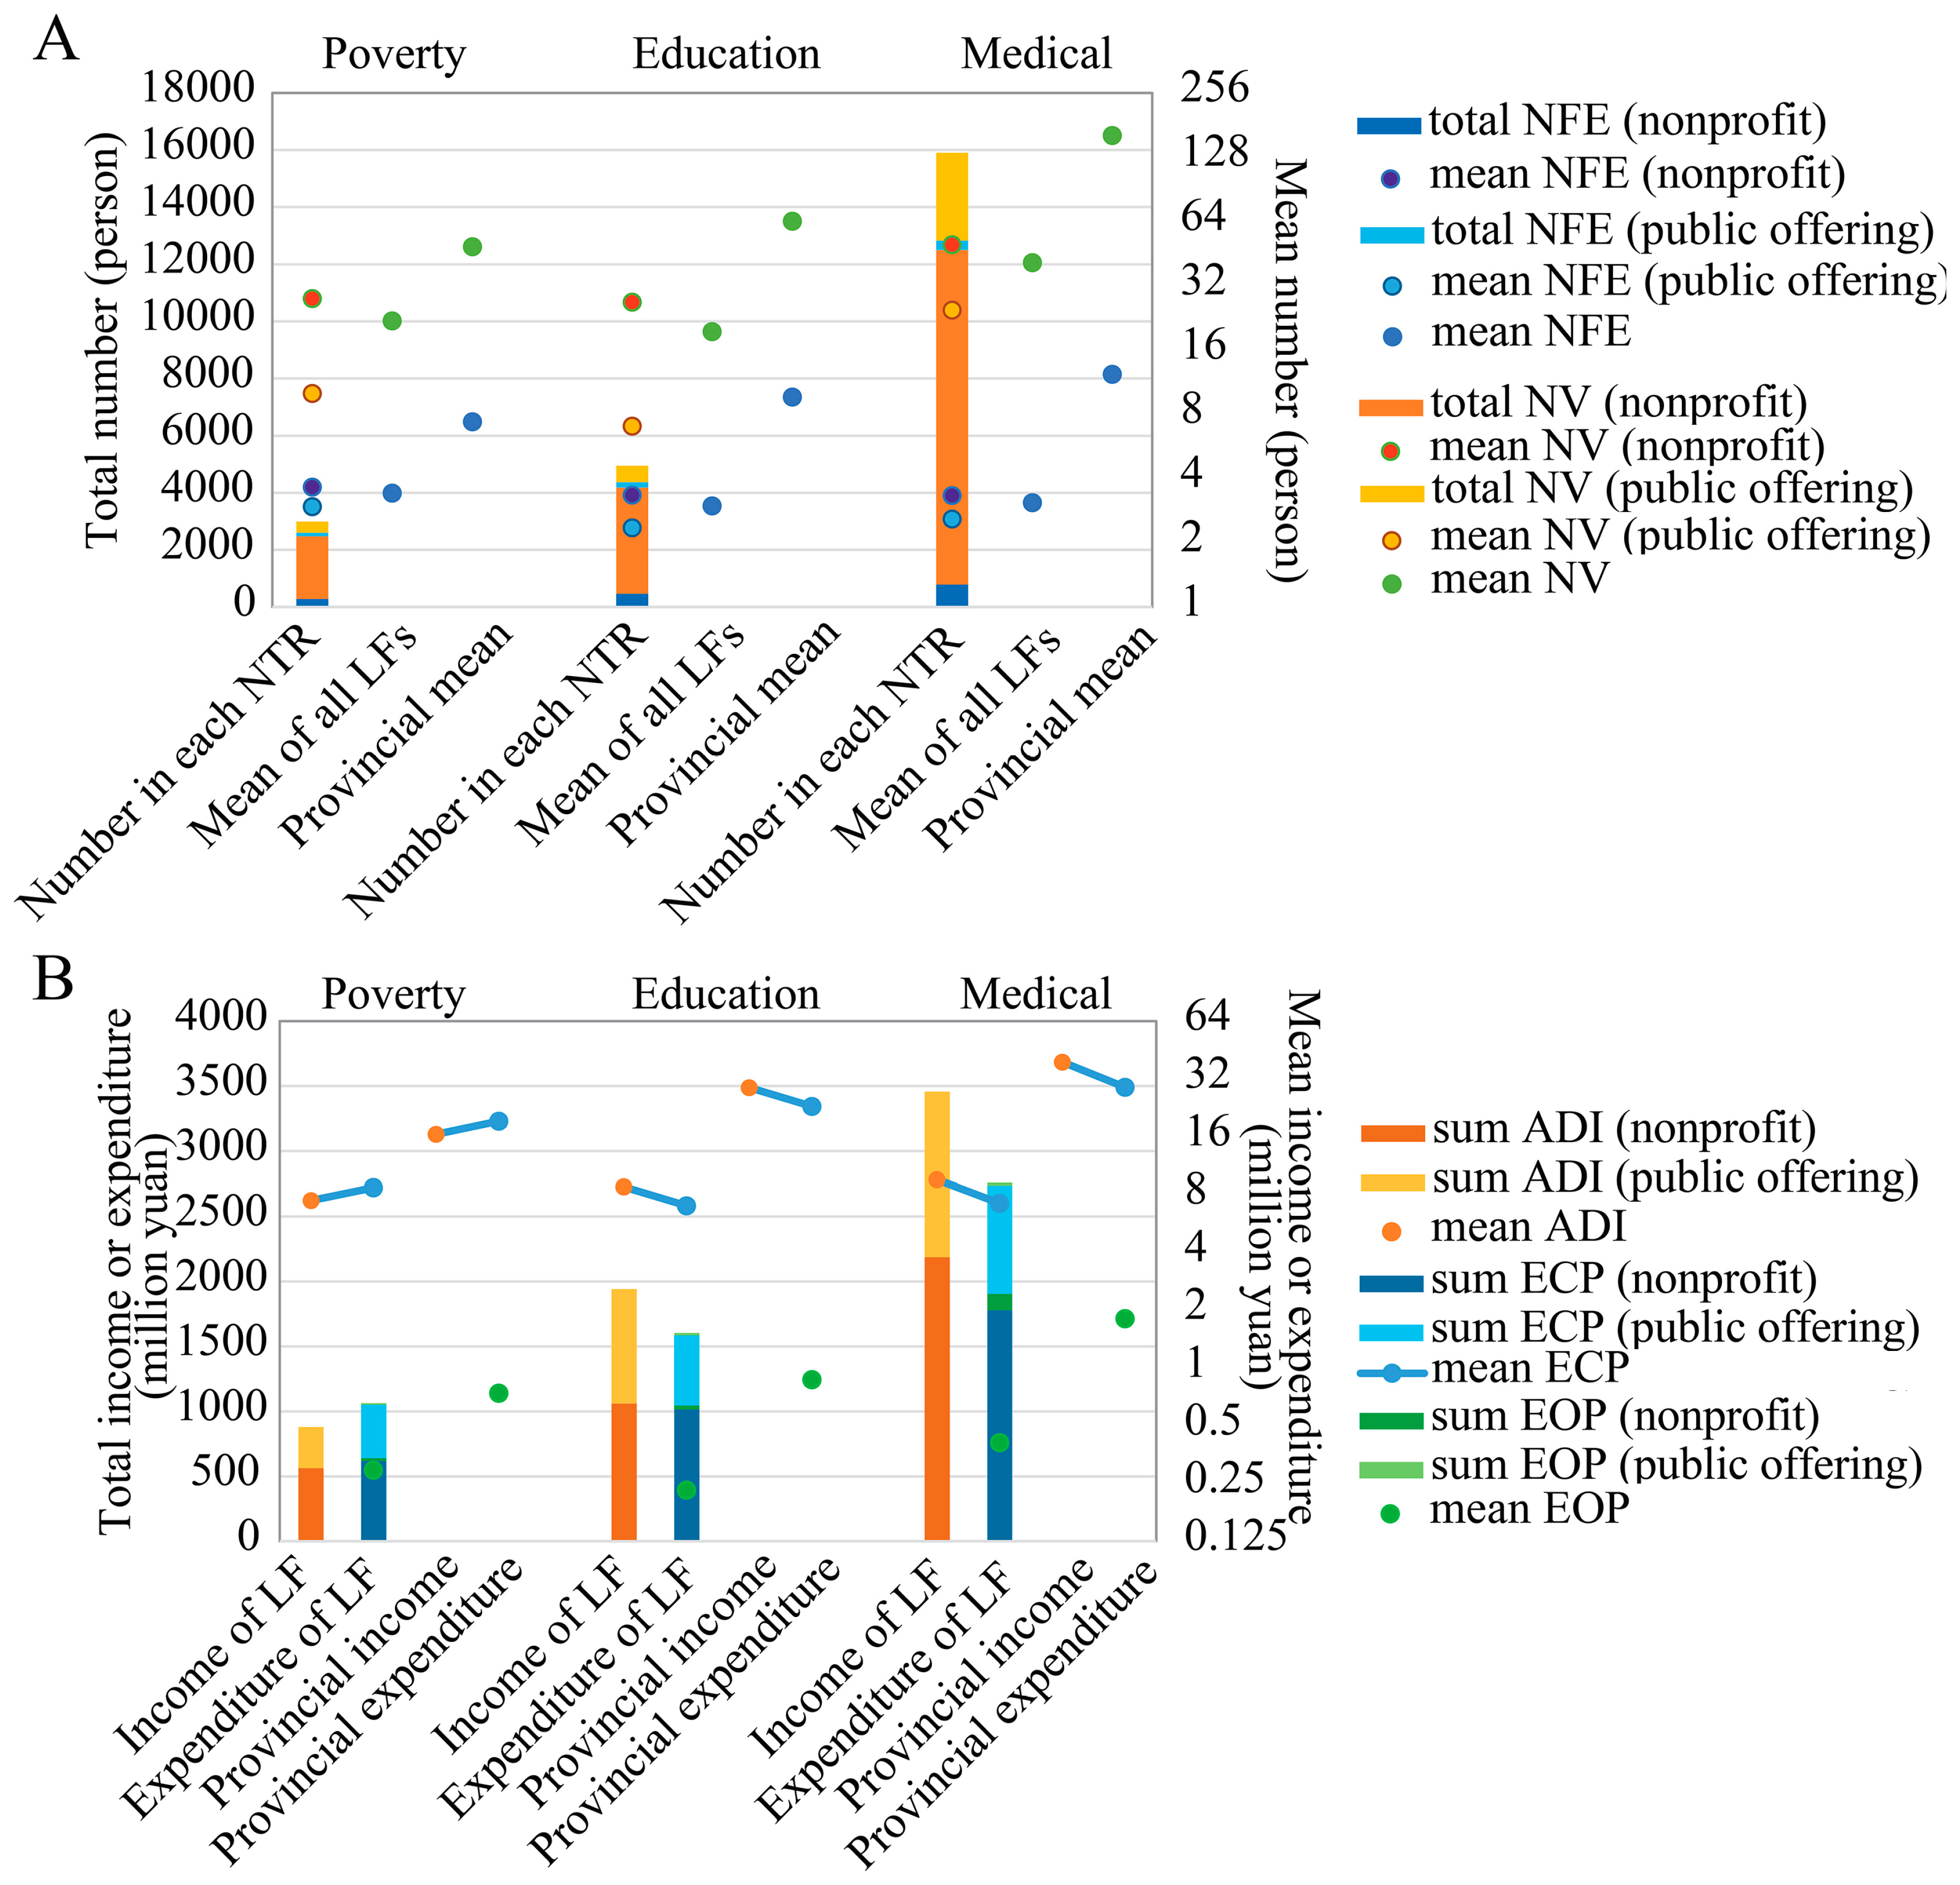
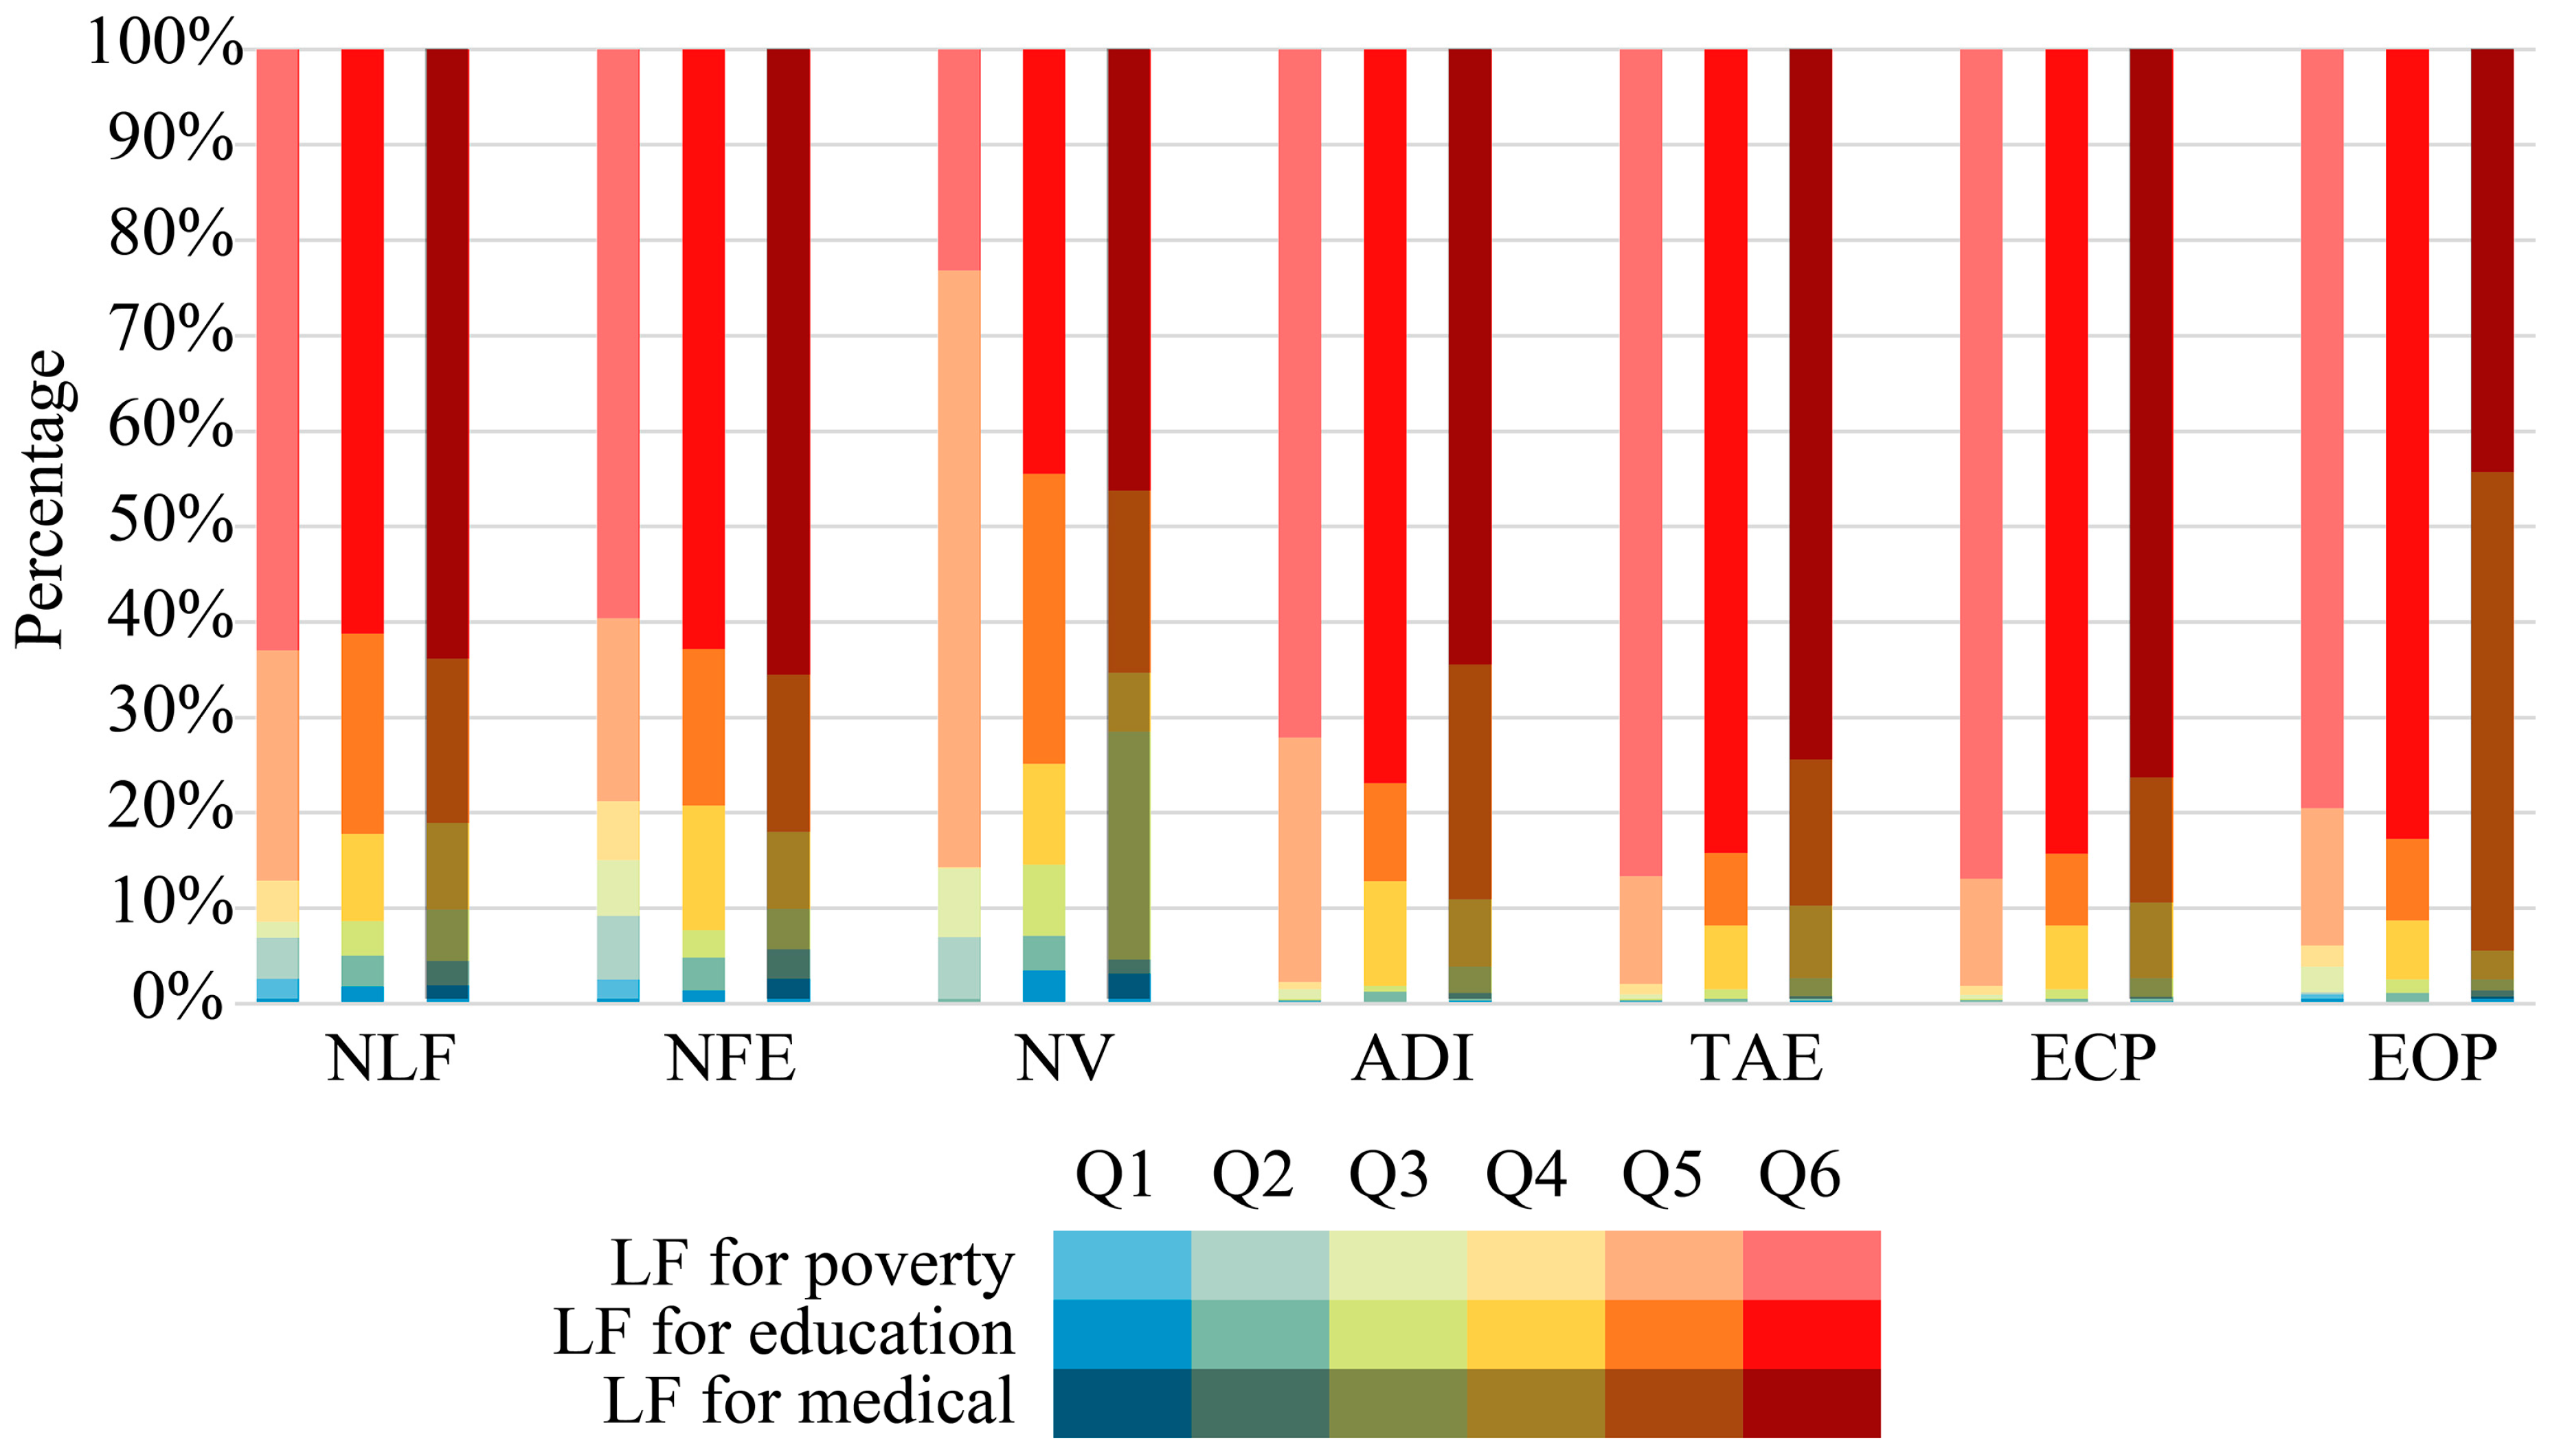
3.1. Statistical Summary of the Attributes of Charitable Foundations
Figure 3 shows the statistical summary of the numbers of participants, including employees and volunteers, and annual incomes and expenditures for both nonprofit and public offering LFs. In general, 118 LFs for poverty assistance, with 79 nonprofit and 39 public offering LFs, are distributed among 53 cities; 221 LFs for education assistance, with 139 nonprofit and 82 public offering LFs, are among 67 cities; and 361 LFs for medical assistance, with 236 nonprofit and 125 public offering LFs, are among 87 cities in China. This means that the number of nonprofit LFs is two times larger than that of public offering LFs and that the LFs are merely distributed among less than 30% of the cities in China. Figure 3A shows that the total participant number of LFs for medical assistance is much larger than that for poverty and education. Additionally, the total participant numbers of nonprofit LFs for poverty, education and medical assistance are 4.92, 5.44 and 3.68 times larger than those of public offering LFs, respectively, and the numbers of volunteers are 6.43, 6.55 and 13.34 times larger than those of full-time employees for the three kinds of LFs, respectively. Figure 3B demonstrates that charity expenditure is higher than donation income for poverty assistance, but it is lower for education and medical assistance.
Figure 3.
Statistical summary of the employee and volunteer numbers (A) and the incomes and expenditures (B) of local foundations.
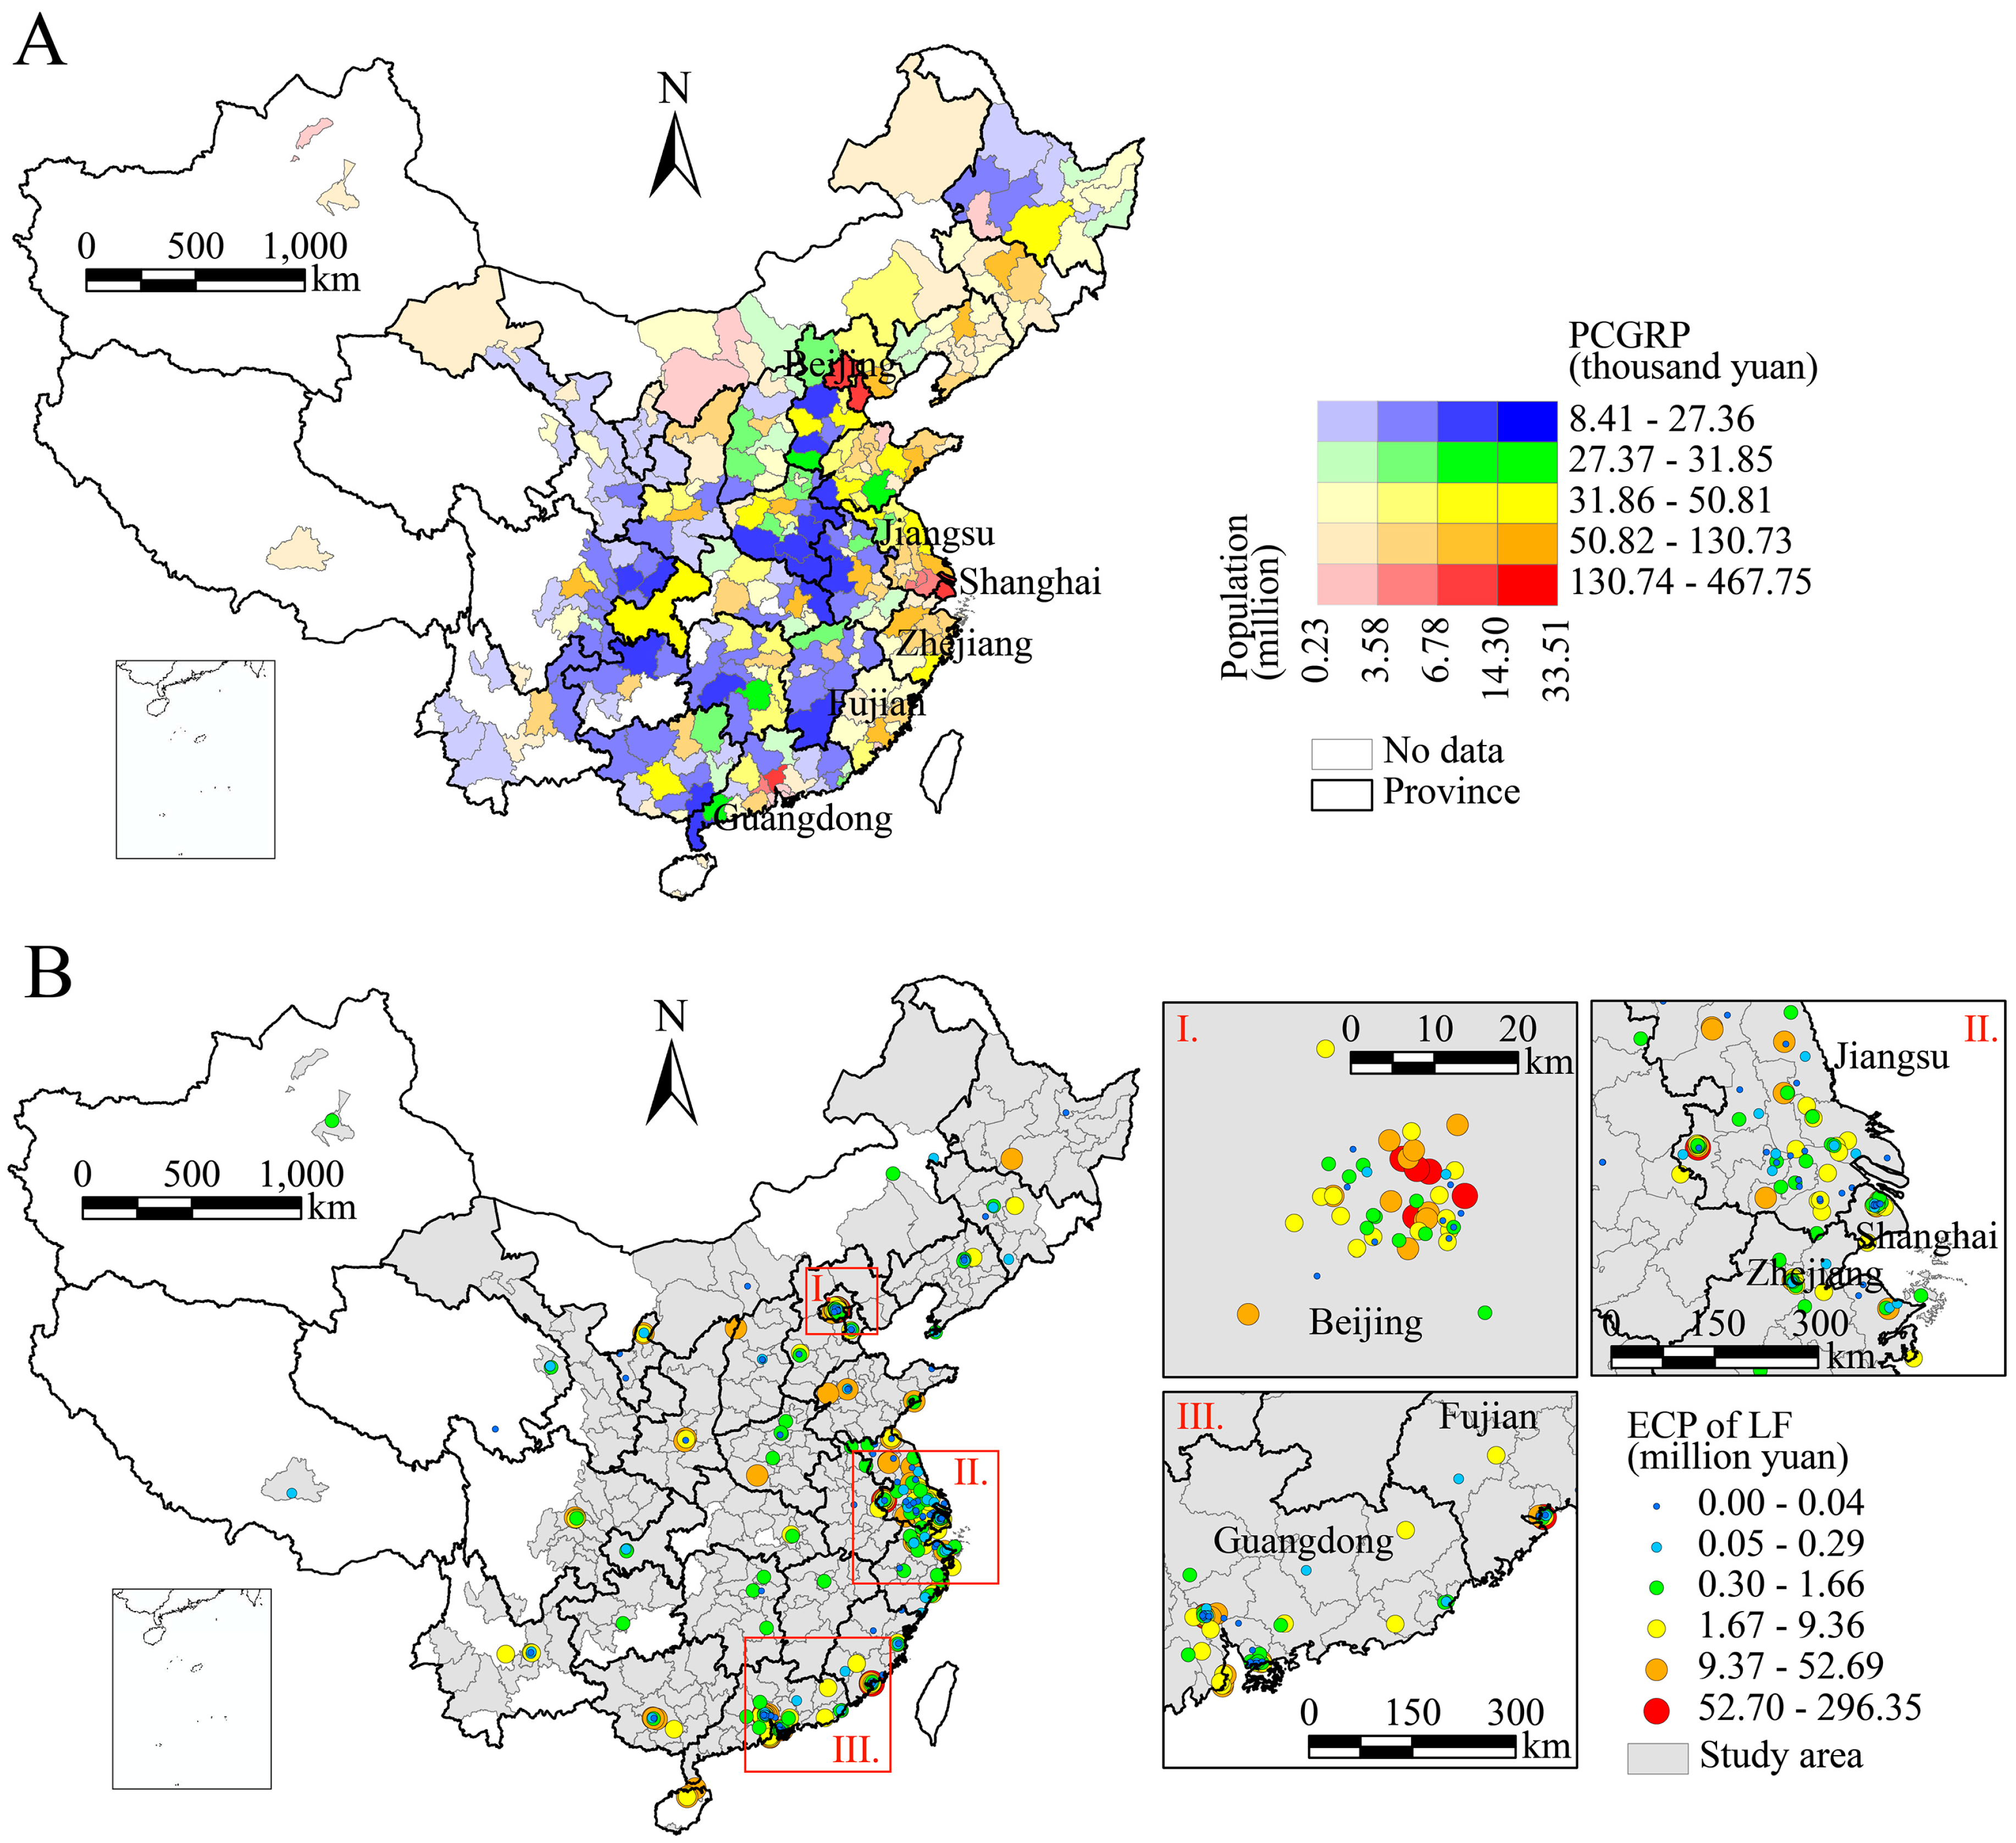
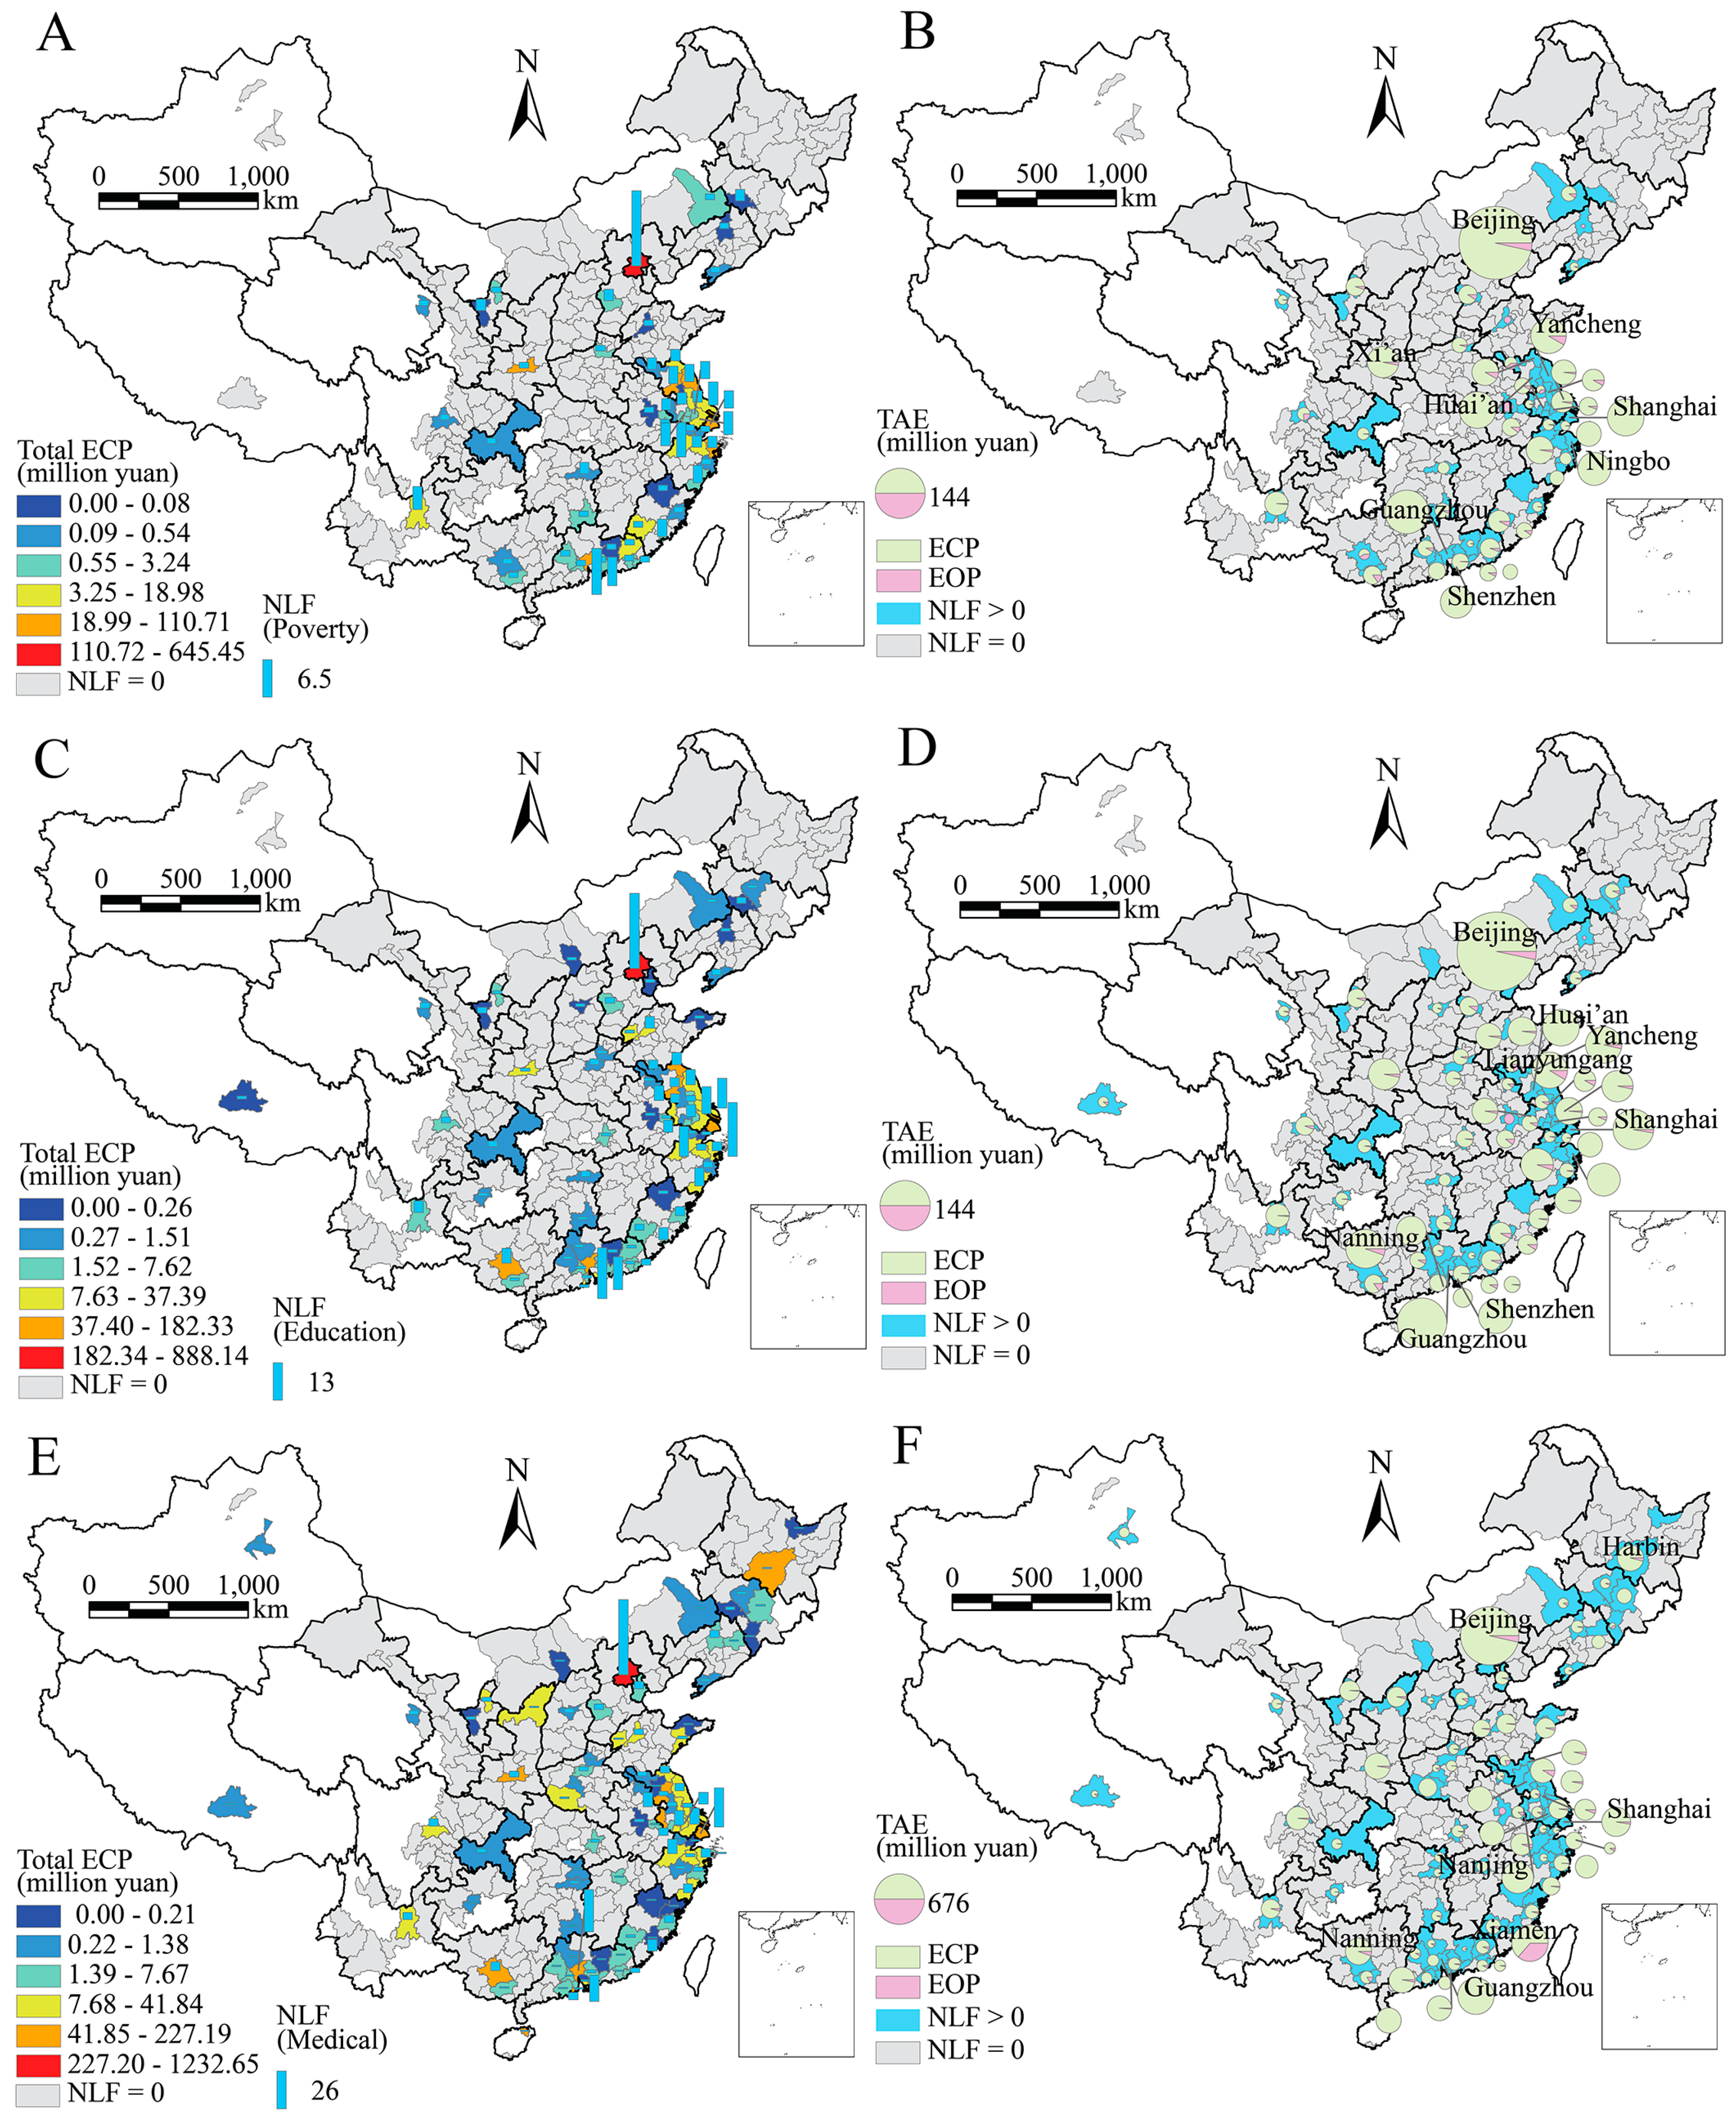
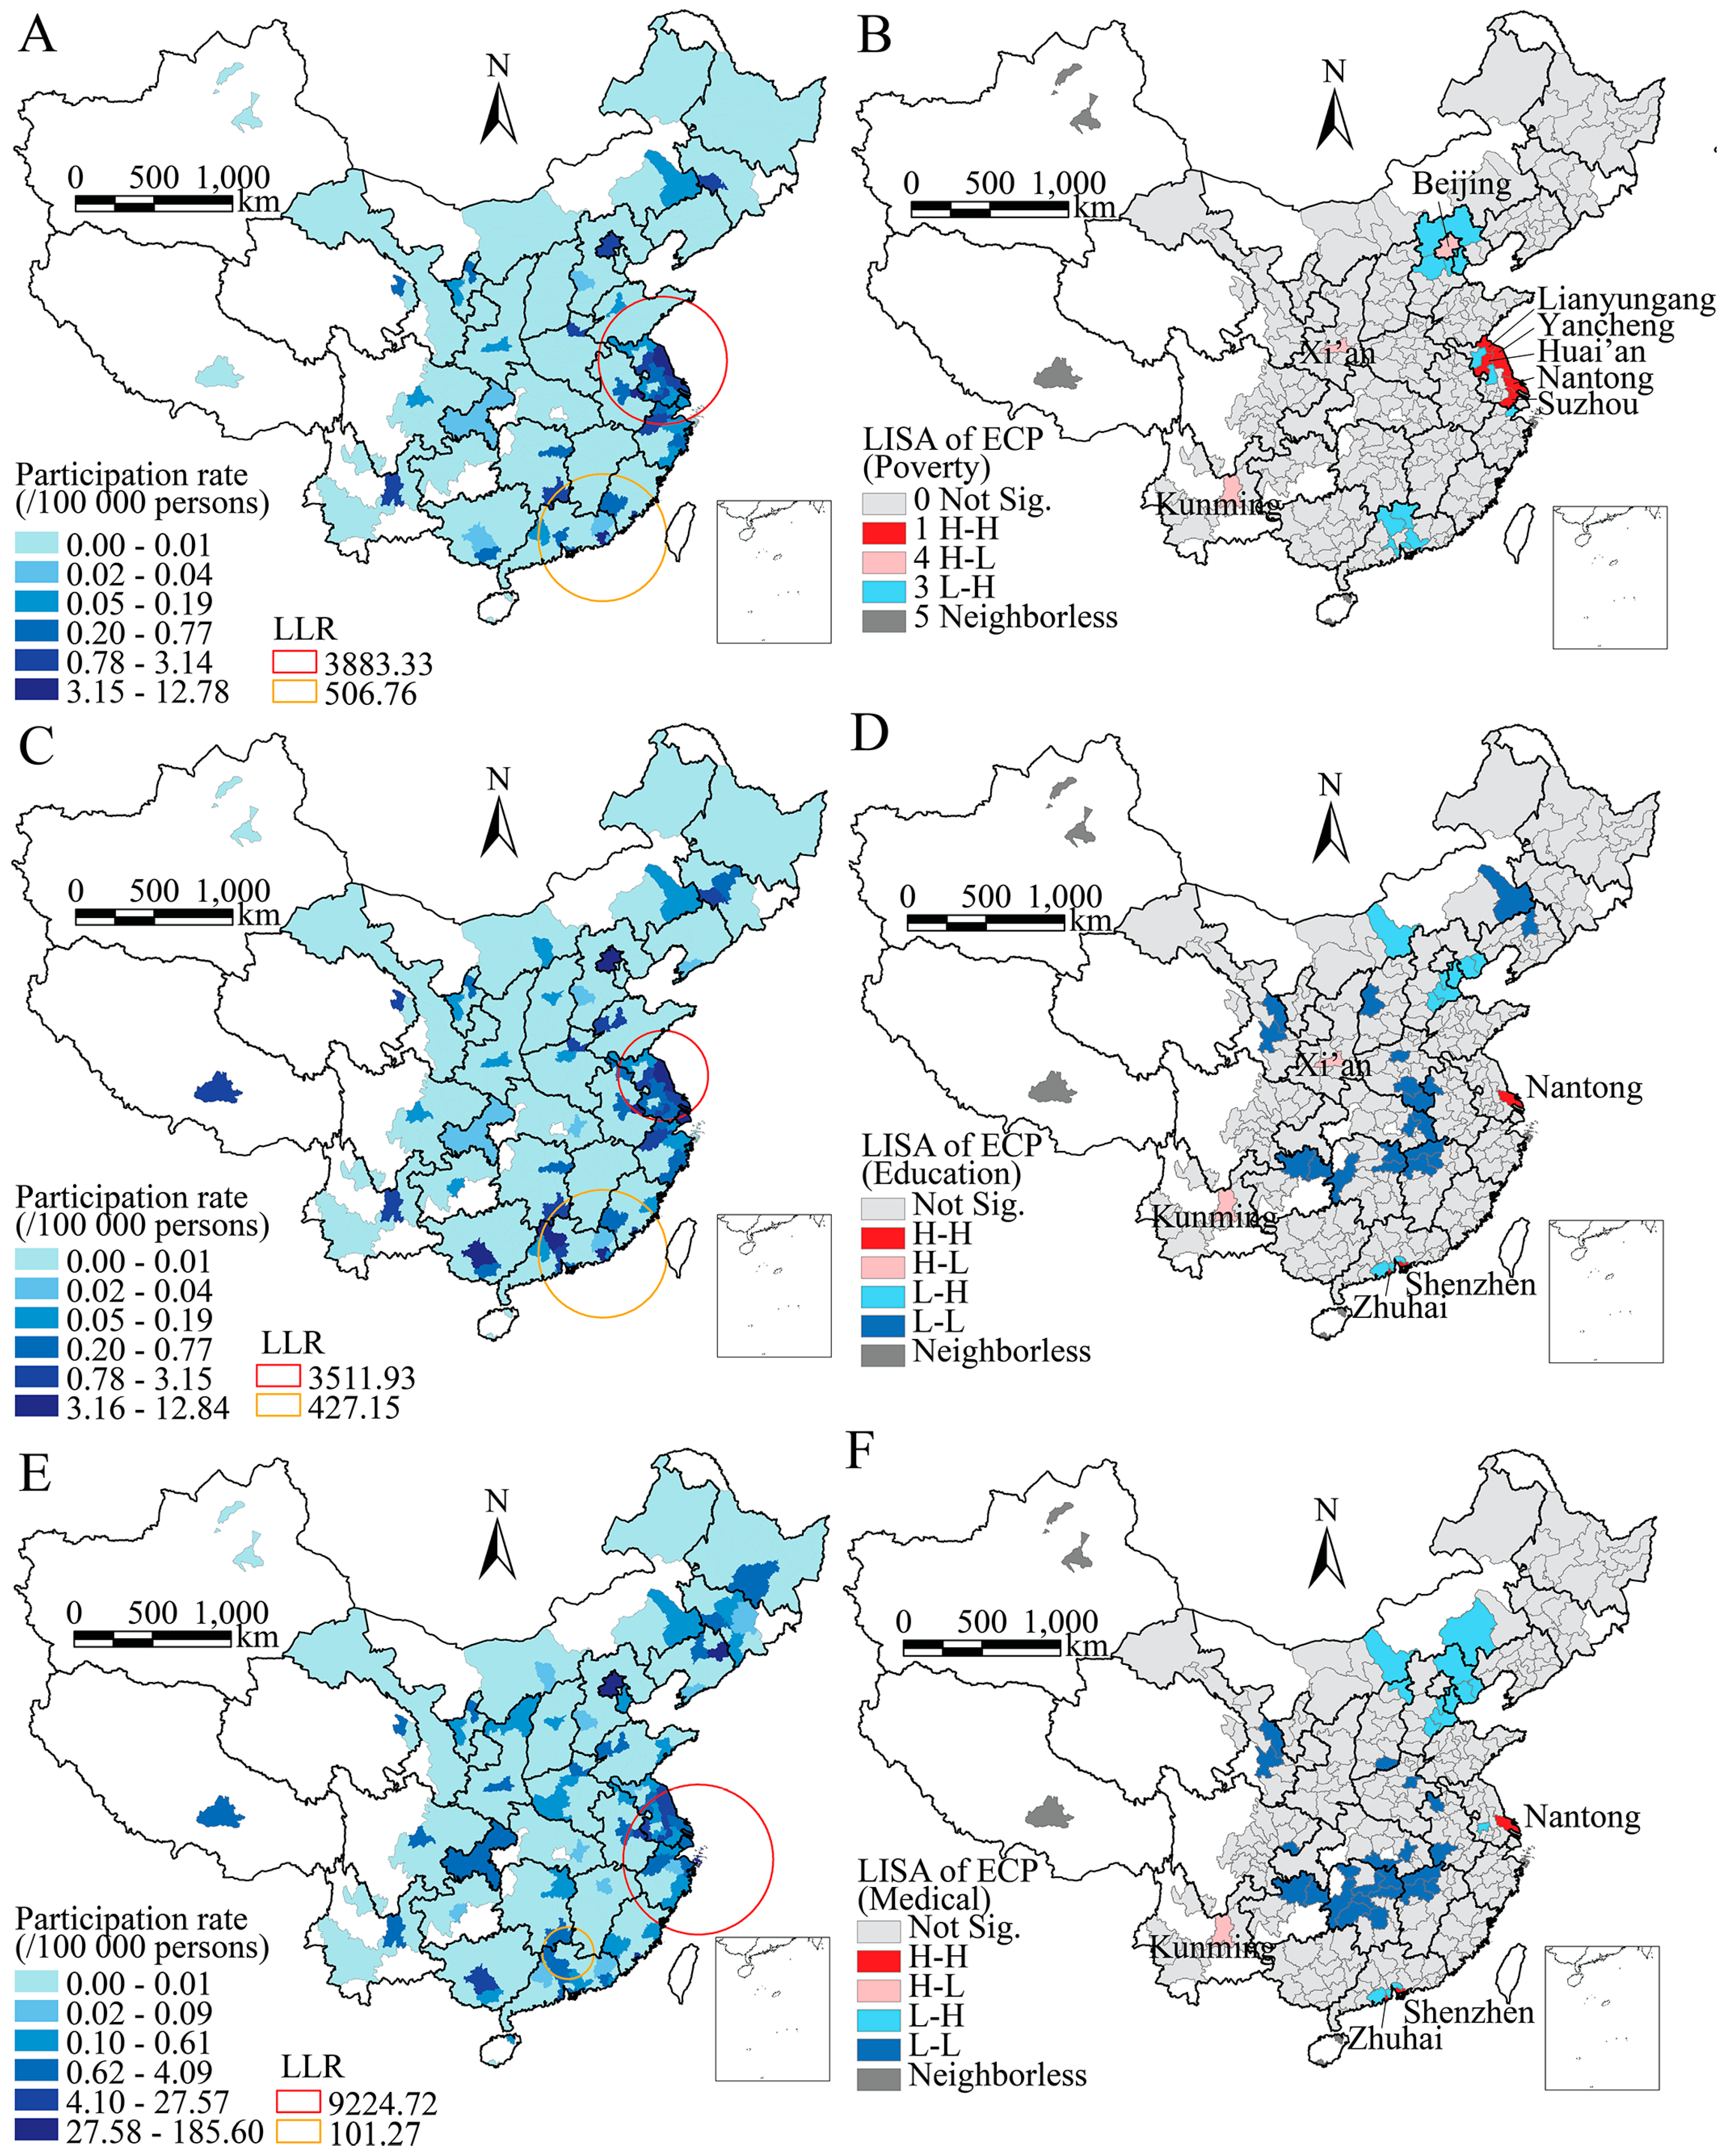
3.2. Spatial Distribution of Charity Expenditures
Figure 4 shows the geospatial distribution of the provincial total charity expenditures and their percentages of LFs in China. As the capital city of China, Beijing is the city with the highest number of LFs (NLF) and the highest total ECP and TAE among all cities. NLFs for poverty, education and medical assistance in Beijing account for 11.01%, 11.31% and 14.40% of all charitable foundations, respectively, but their ECPs reach 62.74%, 57.26% and 47.21%. ECPs in Beijing account for approximately 96% for all three kinds of LF, and other expenditures such as benefits and salaries for employees and administrative costs account for 4%. In addition, the expenditures in eastern and southern coastal areas and provincial capital cities are much higher than those in other cities. Cities with a total ECP for poverty assistance larger than 20 million yuan, for education assistance larger than 30 million yuan and for medical assistance larger than 50 million yuan are labeled on the maps. They are all coastal or provincial capital cities.
Figure 4.
Distributions of provincial total charity expenditures (A,C,E) and their percentages (B,D,F) of local foundations in China.
3.3. Spatial Clusters of Participants and Expenditures of Charitable Foundations
To fully understand the spatial clustering phenomenon of the distributions of charitable foundations, the spatial clusters of participation rates, including both full-time staff and volunteers, are explored by spatial scan statistics [17,22,23], and the spatial clustering patterns of charity expenditures are detected using LISA [18]. Both the hotspot regions (high-high H-H and H-L) and cold-spot regions (L-L and L-H) can be statistically explored by LISA [24]. Figure 5 show the results of both kinds of spatial clusters for LFs for poverty, education and medical assistance. Correspondingly, Table 2 and Table 3 show the statistical summaries of charity participation rate and charity expenditures in the spatial clustering regions, respectively. The results show that high charity participation rates are primarily clustered in the provinces of Jiangsu, Shanghai, Zhejiang, Fujian and Guangdong, among which Jiangsu, Shanghai and Zhejiang are of the first hierarchy of clustering. The total number of participants in the first hierarchy of the cluster regions accounts for 59.72%, 45.45% and 37.18% among all participants nationally for LFs for poverty, education and medical assistance, respectively, and the participation rates are 3.79, 4.76 and 3.52 times higher than the respective national rates.
Figure 5.
Spatial clusters of charity participation rate explored by spatial scan statistics (A,C,E) and the charity expenditures of local foundations detected by local indicator of spatial association (LISA) (B,D,F).
Table 2.
Statistical summary of the charity participation rate in spatial cluster areas.
Table 3.
Statistical summary of charity expenditures in local cluster regions.
The distributions of charity expenditures of LFs are also significantly unbalanced. In the LISA maps of ECP, spatial clustering regions are distinguished by clusters of H-H, L-L, H-L and L-H with a statistical significance level of 0.05. The results show that only a few cities are in hotspot regions, whereas many cities are in cold-spot regions. The ECPs in the H-H cluster regions account for 9.85%, 4.69% and 1.50% of the national total ECPs of LFs for poverty, education and medical assistance, respectively, and their regional mean values are 5.69, 4.52 and 4.34 times higher than the respective national mean ECPs. However, in the cold-spot regions, the ratios of regional to national total ECPs are all lower than 0.40%, and the mean ECPs are less than one-tenth of the national mean values.
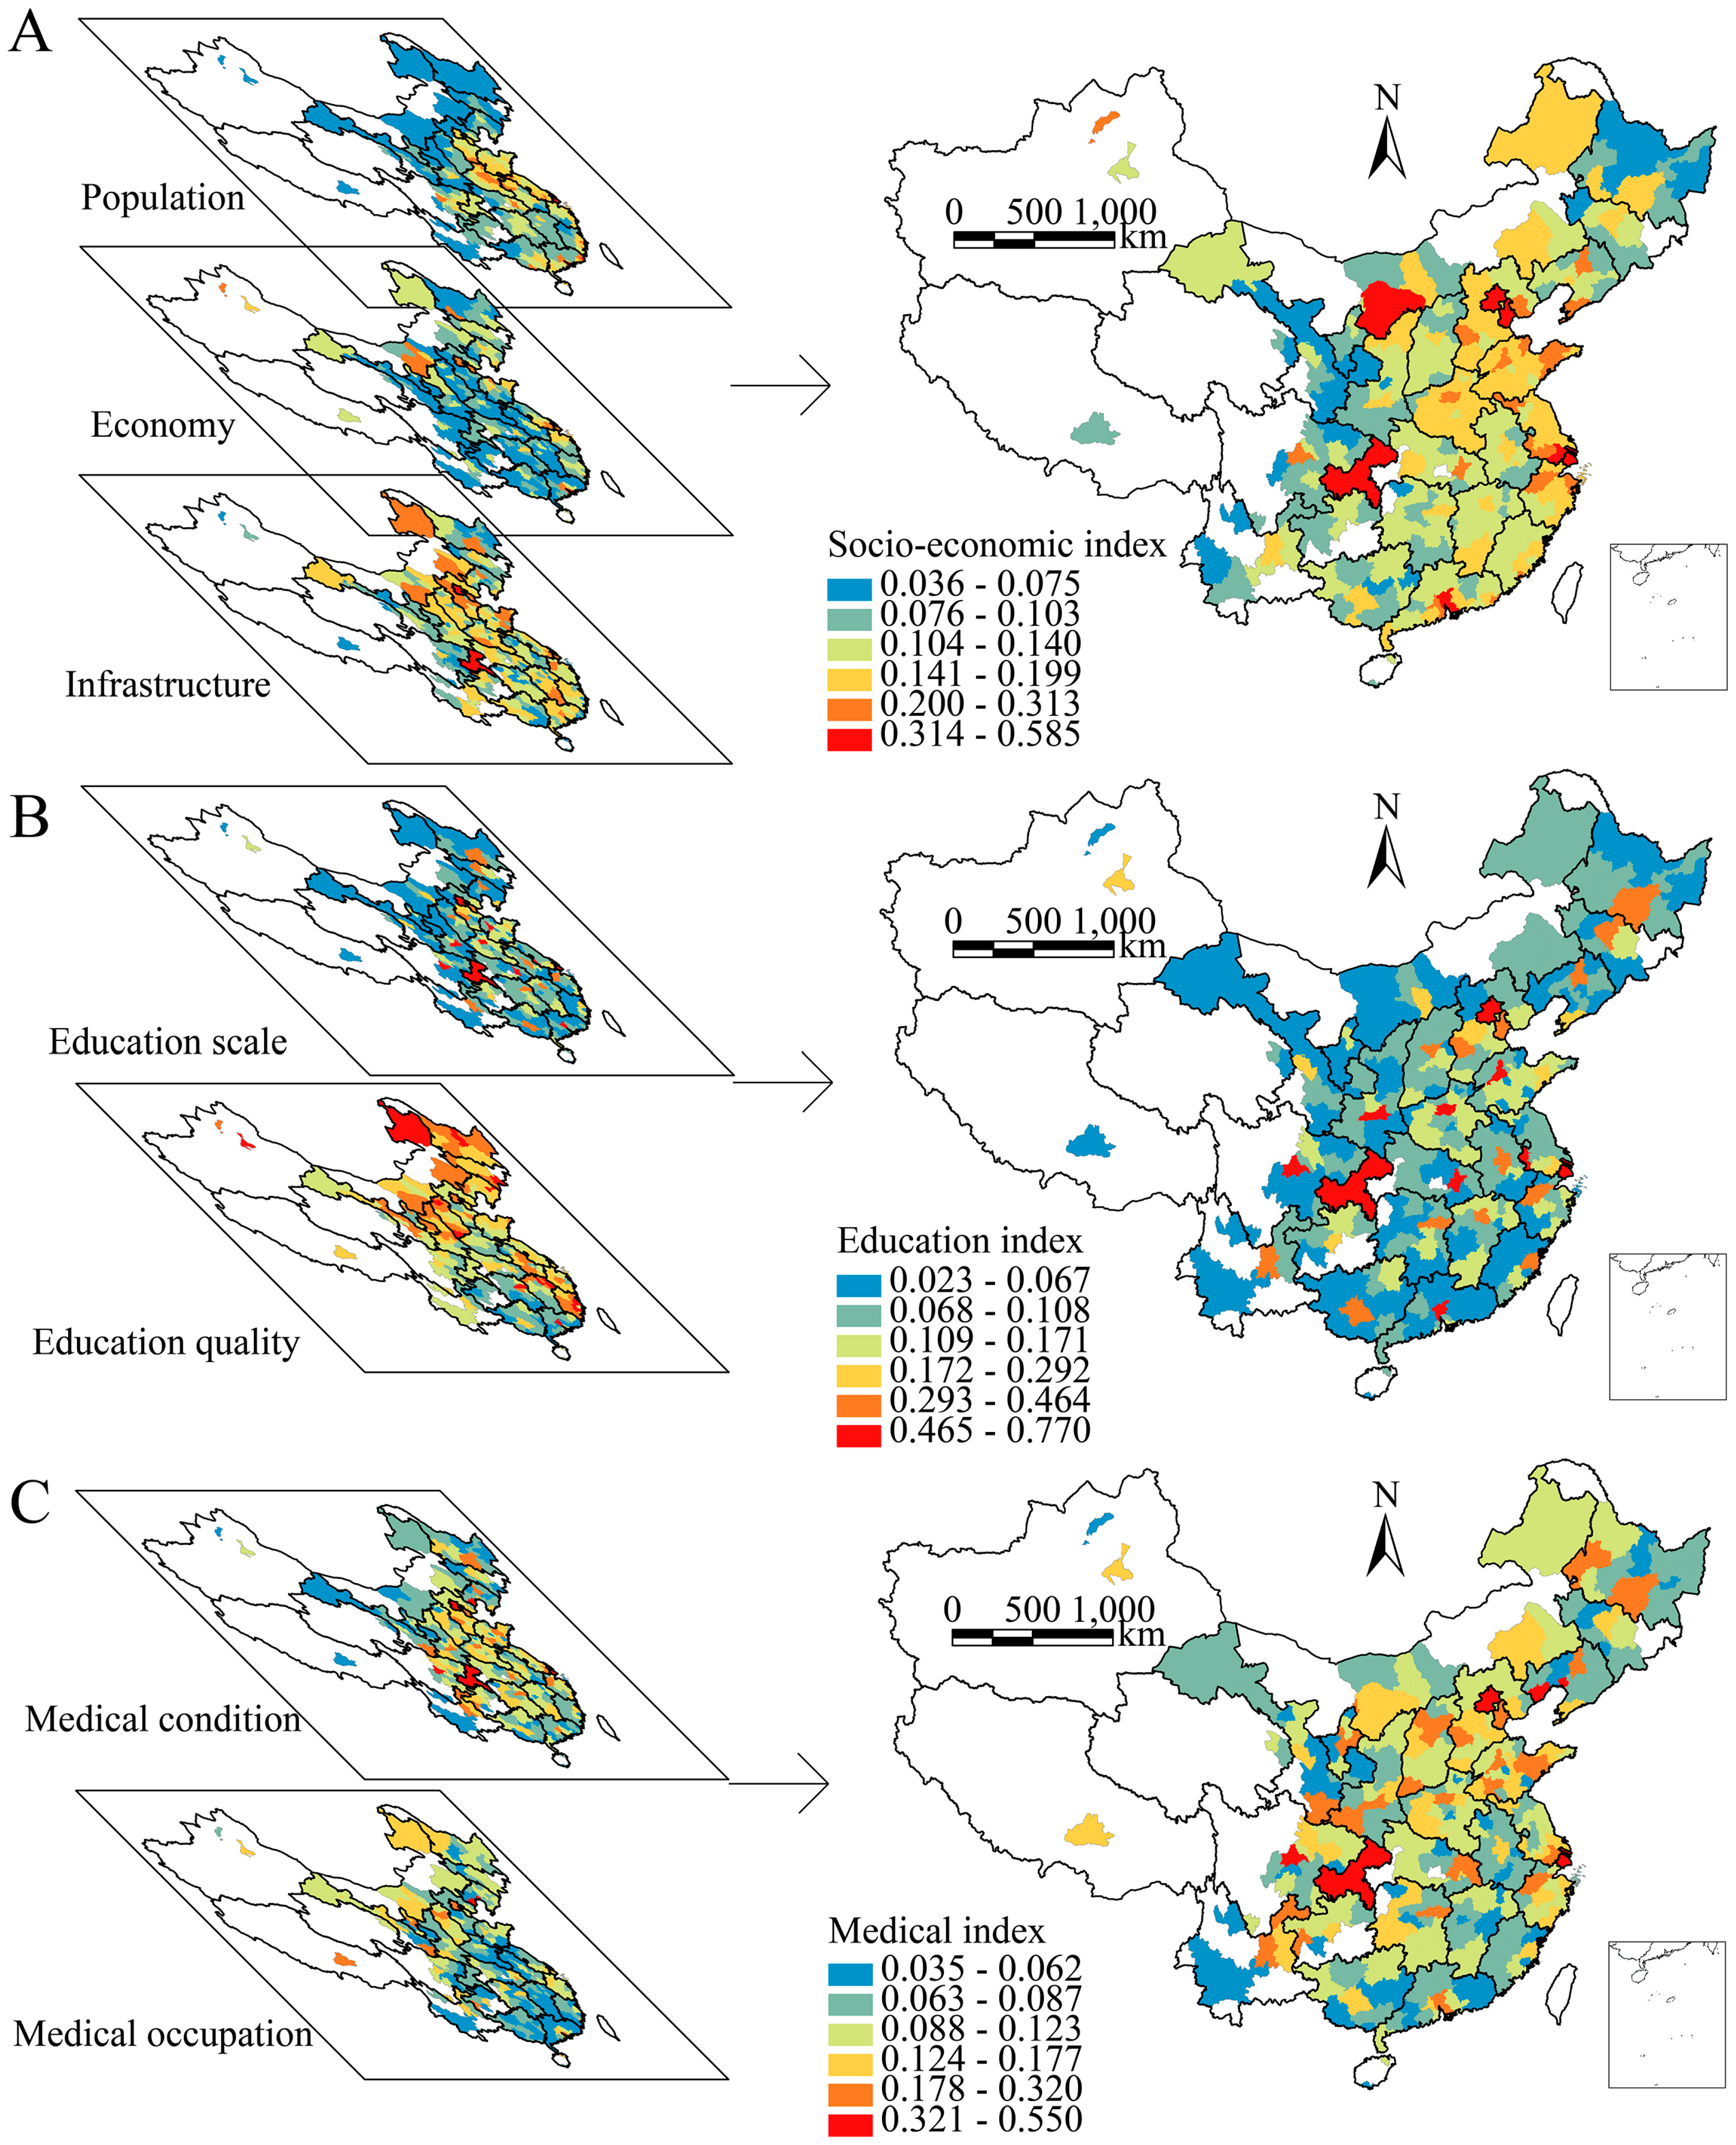
3.4. Characterizing Local Population Needs
Further, the distributions of local charitable foundations seem to be much more unbalanced with the consideration of local population needs. In this paper, the population needs of charity assistance for poverty, education and medical services are characterized using the entropy weighted indexes of local population conditions including socioeconomic development, education and medical levels with their respective proxy statistical variables. Table 4 shows the weights of sub-indexes and the corresponding variables for the computation of the three indexes. For the index of socioeconomic development level, population, economy and infrastructure are approximately equally weighted, and PCGRP is the variable with the highest weight of 0.384. The education scale has a weight of 0.901, where the scale of college education weighs much higher than education quality for assessing education level. The assessment of the medical level depends on both medical condition (weight is 0.621) and occupation (weight is 0.379). Figure 6 shows the spatial distribution maps of the socioeconomic index, education index and medical index, together with the distributions of their respective sub-indexes. The gradual changes from low values (blue) to high values (red) present the conditions of indexes or sub-indexes get better. These distributions demonstrate that the socioeconomic development level is higher in eastern China than in western and northwestern China and that the education and medical levels are much higher in provincial capital cities than in other cities.
Table 4.
The weights of indexes for local socioeconomic development, education and medical levels.
Figure 6.
Distributions of entropy weighted socioeconomic development level index (A), education level index (B) and medical level index (C). The gradual changes from low values (blue) to high values (red) present the conditions get better.
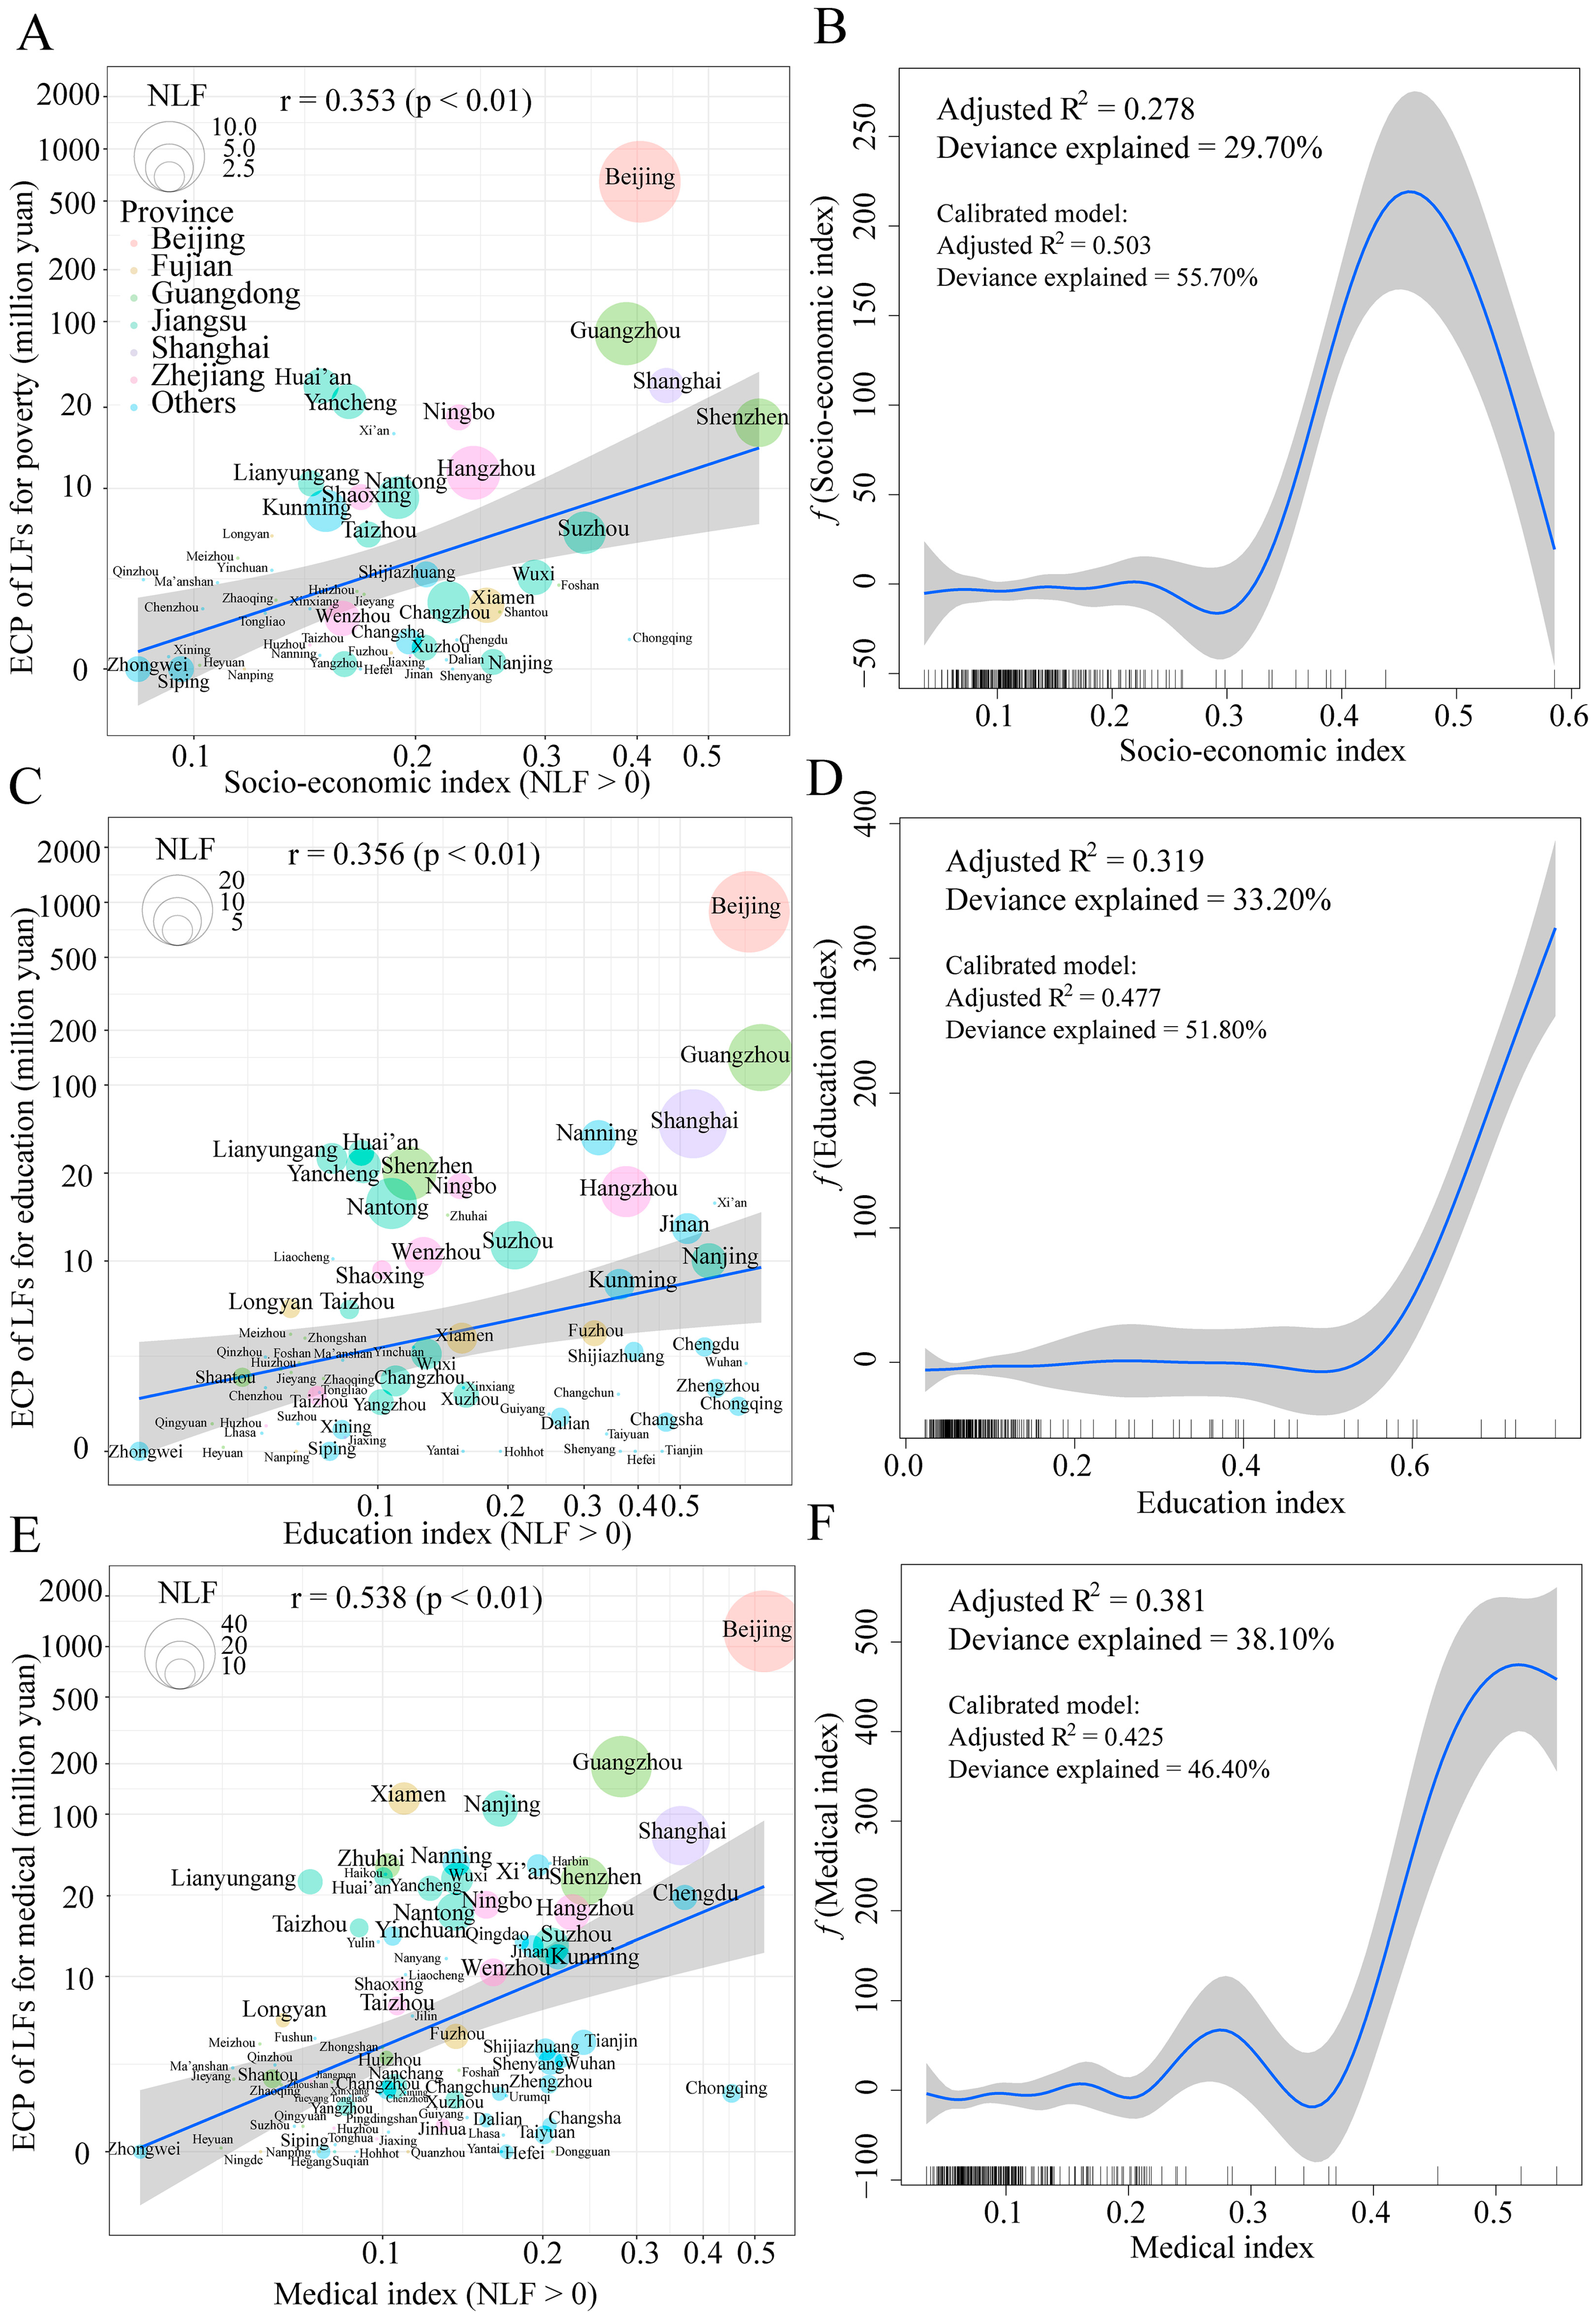
3.5. Relationships between Charity Expenditures and Local Population Needs
Figure 7 shows the relationships between the charity expenditures of foundations and local population conditions. Since not all cities have LFs in China, where the LFs for poverty assistance are distributed in 18.34% of the cities, the LFs for education assistance are in 23.18% of the cities, and the LFs for medical assistance are in 30.10% of the cities, the relationships are considered from two aspects: the cities have LFs, and all cities. First, the cities have LFs are extracted for the analysis that the cities without LFs are removed. In this analysis, the general associations between charity expenditures and local population conditions can be investigated. A general trend is that more LFs and LFs with more charity expenditures are located in cities with better local population conditions. In addition, the conditions in all cities are also explored, where a great amount of zero values of charity expenditures are involved. Linear models are failed to investigate data in this condition, since the relationships between the expenditures of local foundations and the local population conditions are nonlinear. In the GAMs, the nonparametric function for variable pair of location information is used to calibrate the models and improve model performance. As a result, 16.0%, 18.6% and 8.3% of the deviances explained by the variables are improved by the calibration of location information for the models of socio-economic, education and medical indexes, respectively. In detail, when the indexes of local population conditions are relative low, the charity expenditures tend to be constant with increasing indexes. When the indexes continuously increase, however, the charity expenditures are significantly increased, but for LFs for poverty assistance, the impact of the socioeconomic index on charity expenditure decreases when the index increases to a certain extent.
Figure 7.
Linear (A, C and E) and nonlinear (B, D and F) relationships between the charity expenditures of local foundations and local population conditions.
Figure 8 shows the summaries of local charitable foundation attributes, including NLF, NFE, NV, ADI, TAE, ECP and EOP, within the six quantiles of indexes of local population conditions, namely, socioeconomic development, education and medical level indexes. It is apparent that most of the local charity resources from human resources to donation incomes and charity expenditures are concentrated in the top two of the six quantiles.
Figure 8.
Summaries of local charity foundation attributes within six quantiles of indexes of local population conditions, socio-economic development, education and medical levels indexes.
4. Discussion and Conclusions
Community needs should always be the priority for the spending allocation of charitable foundations, but in reality, this is often not the case. It is surprising to see from the results that there is such a distinct gap and misalignment between the distributions of spending of charitable foundations and population needs, which are explored by spatial statistical models. The expenditures of charitable foundations are concentrated in economically developed areas such as Beijing, Shanghai, Guangdong, and their nearby areas in China. However, the allocation of expenditures in the western and central areas of China is very limited and is only concentrated in capital cities. People from a more economically developed area are more likely to receive benefits from a charitable foundation compared with people from a less economically developed area. The current conditions are inconsistent with the mission of charitable foundations, which is to deliver resources to the people in need.
Therefore, when charitable foundations are making decisions on where their expenditures should be distributed, it is critical for the local authorities and organizations to adjust the strategies of charitable resource allocation based on quantitative analysis of population needs to narrow the current gaps and misalignments. This research provides implications for future research to examine additional possible factors that affect the current gap and misalignment and to understand why charitable foundations have not been spending money in the right areas. According to this research, the charity expenditures of local foundations are nonlinearly correlated with current conditions of socioeconomic development, education and medical levels due to the diverse development stages of the cities. The spatial analysis results are helpful to ensure a more reasonable allocation of charity expenditures in the future and to encourage new charity foundations to obtain stakeholders from multiple backgrounds, such as government, charitable foundations, NGOs, and representatives from the communities.
Based on this study, future research about the spatial analysis of charitable foundations is recommended. First, narrowing the gaps between charity expenditures and local population needs is also a complicated process because donors are considering not only population needs but also other factors. In addition to the level of the cities’ economic development, there are other possible factors that could affect the gap, such as local government policy, local infrastructure to undertake charitable activities, and the capacities of local NGOs, as well as local cultural attitudes to charitable activities. Due to the lack of explanatory variables data in the regions outside of the administrative cities, only the data in the administrative cities are analyzed. Even though the data used in this study is representative, a nationwide database of both charitable foundations and the potential factors need to be built for more comprehensive studies. This research is a start to understand the current problem and to encourage more research to examine influential factors and to propose more effective solutions. Second, from the decision-making perspective, data driven and quantitative evaluation systems on the effectiveness of charitable foundations should be built or improved, especially in identifying target population needs. Finally, the communications among stakeholders should also be enhanced. More community-based surveys and research should be performed by charitable foundations to understand the timely and real population needs and to better identify the target population in need.
Acknowledgments
This study was supported by the Chinese Youth Charity Scholar “Bamboo Plan” (2016ZLJH-143). The funders had no role in the study design, data collection and analysis, decision to publish, or preparation of the manuscript. We acknowledge the Research Infrastructure of Chinese Foundation (RICF) for their roles in making the data set of the Chinese charitable foundations available.
Author Contributions
Y.S. and L.F. designed the majority of experiments and wrote the manuscript. Y.S. performed the data analysis. All authors reviewed and approved the manuscript.
Conflicts of Interest
The authors have declared that they have no competing interests.
References
- Bugg-Levine, A.; Kogut, B.; Kulatilaka, N. A new approach to funding social enterprises. Harv. Bus. Rev. 2012, 90, 118–123. [Google Scholar]
- Rijpma, A. Funding Public Services through Religious and Charitable Foundations in the Late-Medieval Low Countries; Utrecht University: Utrecht, The Netherlands, 2012. [Google Scholar]
- Xiaoming, F. China’s charitable foundations: Development and policy-related issues. Chin. Econ. 2015, 48, 130–154. [Google Scholar] [CrossRef]
- Spielman, D.J.; Kolady, D.E.; Ward, P.S. The prospects for hybrid rice in India. Food Secur. 2013, 5, 651–665. [Google Scholar] [CrossRef]
- Almog-Bar, M.; Schmid, H. Advocacy activities of nonprofit human service organizations: A critical review. Nonprofit Volunt. Sect. Q. 2014, 43, 11–35. [Google Scholar] [CrossRef]
- Bebbington, A. NGOs and uneven development: Geographies of development intervention. Prog. Hum. Geogr. 2004, 28, 725–745. [Google Scholar] [CrossRef]
- Fruttero, A.; Gauri, V. The strategic choices of NGOs: Location decisions in rural Bangladesh. J. Dev. Stud. 2005, 41, 759–787. [Google Scholar] [CrossRef]
- Kareithi, R.; Flisher, A. Location of development NGOs providing HIV and AIDS services to young people in Cape Town, South Africa. J. Soc. Dev. Afr. 2009, 24. [Google Scholar] [CrossRef]
- Never, B.; Westberg, D. Place Matters: The Spatial Effects of Human Service Expenditures. In Nonprofit Policy Forum; De Gruyter: Berlin, Germany, 2016. [Google Scholar]
- Holmes, G.; Scholfield, K.; Brockington, D. A comparison of global conservation prioritization models with spatial spending patterns of conservation nongovernmental organizations. Conserv. Biol. 2012, 26, 602–609. [Google Scholar] [CrossRef] [PubMed]
- MacLean, L.M.; Brass, J.N.; Carley, S.; El-Arini, A.B.; Breen, S. Democracy and the distribution of NGOs promoting renewable energy in Africa. J. Dev. Stud. 2015, 51, 725–742. [Google Scholar] [CrossRef]
- Zhou, M. Global Distribution of Transnational Human Rights NGOs: The Effects of Domestic Resources and Institutions. Sociol. Inq. 2015, 85, 576–599. [Google Scholar] [CrossRef]
- Galway, L.P.; Corbett, K.K.; Zeng, L. Where are the NGOs and why? The distribution of health and development NGOs in Bolivia. Glob. Health 2012, 8, 38. [Google Scholar] [CrossRef] [PubMed]
- Hastie, T.J.; Tibshirani, R.J. Generalized Additive Models; CRC Press: Boca Raton, FL, USA, 1990; Volume 43. [Google Scholar]
- Ma, J.; Wang, Q.; Dong, C.; Li, H. The research infrastructure of Chinese foundations, a database for Chinese civil society studies. Sci. Data 2017, 4, 170094. [Google Scholar] [CrossRef] [PubMed]
- Research Infrastructure of Chinese Foundation. Research Infrastructure of Chinese Foundation Database. 2017. Available online: http://ricf.org.cn/ (accessed on 17 February 2017).
- Kulldorff, M. A spatial scan statistic. Commun. Stat. Theory Methods 1997, 26, 1481–1496. [Google Scholar] [CrossRef]
- Anselin, L. Local indicators of spatial association—LISA. Geogr. Anal. 1995, 27, 93–115. [Google Scholar] [CrossRef]
- Anselin, L.; Syabri, I.; Kho, Y. GeoDa: An introduction to spatial data analysis. Geogr. Anal. 2006, 38, 5–22. [Google Scholar] [CrossRef]
- Song, Y.-Z.; Yang, H.L.; Peng, J.H.; Song, Y.R.; Sun, Q.; Li, Y. Estimating PM 2.5 Concentrations in Xi’an City Using a Generalized Additive Model with Multi-Source Monitoring Data. PLoS ONE 2015, 10, e0142149. [Google Scholar] [CrossRef] [PubMed]
- Wood, S. Generalized Additive Models: An Introduction with R; CRC Press: Boca Raton, FL, USA, 2006. [Google Scholar]
- Song, Y.; Ge, Y.; Wang, J. Spatial distribution estimation of malaria in northern China and its scenarios in 2020, 2030, 2040 and 2050. Malar. J. 2016, 15, 345. [Google Scholar] [CrossRef] [PubMed]
- Zhang, T.; Lin, G. Asymptotic properties of spatial scan statistics under the alternative hypothesis. Bernoulli 2017, 23, 89–109. [Google Scholar] [CrossRef]
- Ge, Y.; Song, Y.; Wang, J.; Lu, B. Geographically weighted regression-based determinants of malaria incidences in northern China. Trans. GIS 2017, 21, 934–953. [Google Scholar] [CrossRef]
© 2018 by the authors. Licensee MDPI, Basel, Switzerland. This article is an open access article distributed under the terms and conditions of the Creative Commons Attribution (CC BY) license (http://creativecommons.org/licenses/by/4.0/).