Abstract
This study aims to develop a method to estimate chlorophyll-a concentration (Chla) in tropical freshwater lake waters using in situ data of Chla, water reflectance, and concurrent Sentinel 2A MSI imagery (S2A) over Lake Ba Be, a Ramsar site and the largest natural freshwater lake in Vietnam. Data from 30 surveyed sampling sites over the lake water in June 2016 and May 2017 demonstrated the appropriateness of S2A green-red band ratio (band 3 versus band 4) for estimating Chla. This was shown through a strong correlation of corresponded field measured reflectance ratio with Chla by an exponential curve (r2 = 0.68; the mean standard error of the estimates corresponding to 5% of the mean value of in situ Chla). The small error between in situ Chla, and estimated Chla from S2A acquired concurrently, confirmed the S2A green-red band ratio as the most suitable option for monitoring Chla in Lake Ba Be water. Resultant Chla distribution maps over time described a partially-seasonal pattern and also displayed the spatial dynamic of Chla in the lake. This allows a better understanding of the lake’s limnological processes to be developed and provides an insight into the factors that affect lake water quality. The results also confirmed the potential of S2A to be used as a free tool for lake monitoring and research due to high spatial resolution data (10 m pixel size).
1. Introduction
Chlorophyll-a concentration (Chla) is considered an indicator of phytoplankton abundance and biomass in lake waters and can be used to determine the water quality, biophysical status and eutrophication level of a water body. Therefore, Chla is commonly used to assess the trophic level of lakes [1,2,3], and also to measure the water quality [4,5].
Estimation of Chla is one of the most well-established scientific applications of remote sensing [6]. Remote sensing has long been recognized as a tool with significant potential for monitoring Chla in lake waters as it is both time and financially efficient [7]. However, remote sensing for estimating Chla in inland waters faces many challenges, not only in terms of the science underpinning the retrieval of the water’s physical and biogeochemical properties, but also of the available sensors’ specifications [8].
Most approaches for remote estimation of Chla are based on empirical relationships between the reflectance in the sensors’ narrow bands or band ratios and Chla [9]. Various algorithms have been developed and utilized successfully to map Chla in oceans, estuaries, and fresh water bodies [10,11,12,13]. However, several studies have also shown that the broad wavelength spectral data available on current satellites (i.e., Landsat, SPOT) does not allow the estimation of Chla in high turbidity waters, due to the dominance of the spectral signal from the suspended sediments [9,14,15]. Among various algorithms for estimating Chla, algorithms based on the relationship between Chla and reflectance at the “red edge” of the visible spectrum [16] have shown a strong correlations between Chla and the difference of reflectance between near-infrared (NIR) and red regions. These regions correspond to low and high absorption ranges of Chla, even in waters with high presences of suspended sediment and colored dissolved organic matter (CDOM) [17,18].
The first satellite of the Sentinel-2 constellation, Sentinel-2A MSI (S2A), was successfully launched on 23 June 2015 with a multi-spectral imager (MSI), an optical imager with 13 spectral bands spanning from the blue to the shortwave infrared (SWIR), with 10, 20, or 60 m ground resolution. The MSI on S2A has a high potential for monitoring Chla in coastal and inland waters due to its red-edge band near 705 nm (band 5) and near the second peak of Chla absorption in the red band (band 4: 665 nm) [19,20]. However, the selection of a Chla estimation algorithm depends on the optical properties of studied water (i.e., ocean, coastal or inland waters). Therefore, the S2A band algorithms for estimation of Chla need to be evaluated for each type of water. Furthermore, performance of the red and NIR band ratio algorithms for estimation of Chla using the S2A red-edge and red bands needs be examined to appropriately evaluate the potential of S2A data for monitoring Chla in tropical inland lake waters.
This study demonstrates the capability of S2A data in monitoring Chla in Lake Ba Be water using the correlation between reflectance ratio of S2A green band (band 3) versus red band (band 4) (termed: S2A-B3/B4), and concurrent in situ Chla measured in June 2016 and May 2017. In the study, the performance of commonly used algorithms for Chla estimation based on S2A bands was evaluated through analysis of water reflectance spectra and the relationship between in situ Chla and field-measured reflectance. Results of the application of the model to time series S2A images provide the seasonal and spatial distributions of Chla in the lake water, to better understand the lake’s aquatic ecosystem health and water quality status.
2. Materials and Methods
2.1. Study Area
Lake Ba Be is the largest natural freshwater lake in Vietnam. The lake is situated at an altitude of 178 m, in a karst terrain that was formed from the destruction of the South-East Asia continental mass at the end of Cambria era (about 200 Ma). The lake is now permanently filled, while world karst lakes are empty, or only with water for one season [21]. Lake Ba Be has a water area of approximately 500 ha, including three sub-basins that spread over 8 km from North to South. The width of the lake ranges from 70 m, at the inlet connecting the northern basin, Pe Lam, with the two southern basins, to 1300 m at the center (Figure 1). The average depth varies from 17 to 23 m.
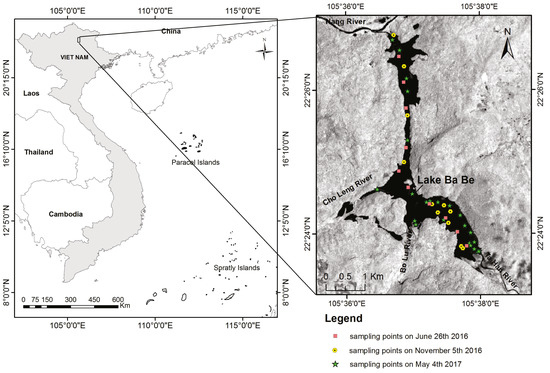
Figure 1.
Location of Ba Be Lake in Vietnam and water sampling points over the lake water on three surveyed dates: (1) 4 May 2017; (2) 5 November 2016; and (3) 26 June 2016.
Lake Ba Be is an open hydrological system as it is fed by three local rivers; the Ta Han, Bo Lu, and Cho Leng Rivers. The lake then discharges into the Nang River through several subterranean caves and waterfalls. In 2011, Lake Ba Be was recognized as the third Ramsar site of Vietnam due to its richness in freshwater biological ecosystems and its important role in the water supply for local communities [22]. Huong et al. [23] classified the lake as a meso-trophic water based on its total nitrogen and phosphorus concentrations. Research into the phytoplankton component of the lake [24] also supported this conclusion. The lake region has a tropical monsoon climate, often humid with two distinct seasons. The season with high rainfall and hot and humid weather lasts from May to October, while the dry season lasts from November to early April of the following year and is generally cold and dry. This seasonal variation leads to significant variability in the Chla.
2.2. Field Measurement and Sampling
The in situ dataset of Chla in Lake Ba Be was collected on 26 June 2016, 5 November 2016, and 4 May 2017, within one hour before and after the designated time that the Sentinel-2A acquired local scenes. Water samples at 20 sites were collected on 4 May 2017, along with 10 sites on 26 June 2016 and 11 sites on 5 November 2016. The sites were located with a Global Positioning System (GPS) receiver and are shown in Figure 1. The samples were taken at a depth of 50 cm using a Van Dorn water sampler (Alpha Bottle Kit - 2.2L Horizontal, Wildco, Yulee, FL, USA), preserved in 1-L cleaned, dark-colored bottles, and then refrigerated.
In the laboratory, Chla and total suspended solids concentration (TSS) of the water samples were determined, following the standard method of the American Public Health Association [25]. For determination of Chla, the water samples were filtered using a pre-washed 47 mm glass fiber filter and then extracted into 90% acetone. The Chla of the extracts was determined spectrophotometrically using a using a Labomed UV–VIS RS model UV-2502 spectrometer (Labomed Inc., Los Angeles, CA, USA), which utilized a 2 nm spectral bandwidth and optically-matched 13 mm diameter cuvettes 6. Chla was calculated accordingly, using the following equation:
where V1 is the extract volume in liters (L), V0 is the sample volume in cubic meter (m3), and Ca is Chla pigment in the extract. The Chla pigmented, Ca, is calculated as:
where D664, D647, and D630 are optical density at 664, 647, and 630 nm, respectively.
Chla (μg/L) = (Ca × V1)/V0
Ca = 11.85 × D664 − 1.54 × D647 − 0.08 × D630
Field water reflectance measurements were taken at 20 water-sampled sites on 4 May 2017 and 10 sites on 26 June 2016 over Lake Ba Be using the SVC (Spectra Vista Corporation, New York, NY, USA) GER1500 spectroradiometer, a field portable spectroradiometer covering the UV, visible, and NIR wavelengths from 350 to 1050 nm, with the 1.5 nm bandwidth by the above-water measurement method [26]. In situ reflectance at each measured point Rrs(λ)was calculated using the following equation:
where Rp is the reflectance of the ASD standard reference panel, Lw(λ) is the radiance of water-viewing, Lsky(λ) is radiance of the sky measured sequentially at 40–45 degrees from nadir and zenith, respectively, and 135 degrees from the Sun in azimuth [27], ρ is the air-water interface reflectance with a value of 0.022, and Lp is the radiance of the reference panel.
Rrs(λ) = Rp × {[Lw(λ) − ρ × Lsky(λ)]/π × Lp}
The glint effects on the field radiometry data were then removed using the method proposed by Kutser et al. [28] to obtain the water reflectance spectra for further interpretation.
Along with water sampling, water clarity was measured concurrently in the field using a standard 20-cm plastic Secchi disk (Wildco, Yulee, FL, USA). The Secchi depth data (SD) was used in the field as a reference to select the sampling points avoiding the effects of the lake bottom on water reflectance data.
2.3. Image Pre-Processing
S2A acquired data over Lake Ba Be at approximately 3:40 GMT (corresponding to 10:40 local time) at UTM zone 48N with 10, 20, and 60 m resolution. Level-1C (L1C) MSI data downloaded from Sentinels Scientific Data Hub [29] contained orthorectified, georeferenced, and radiometrically calibrated top-of-atmosphere (TOA) reflectances in Universal Transverse Mercator (UTM) projection with the WGS84 datum. The S2A Toolbox in the Sentinel Application Platform (SNAP) version 5.0 on Windows 10 (64-bit) was used to resample the images to 10 m resolution. Then, the mean values of the 3 × 3 cloud-free pixels extracted from each sampling point situated in the middle of the lake were used for analyses.
With satellite monitoring, Chla is often inaccurate if inappropriate atmospheric correction methods are used. The Sen2cor atmospheric correction procedure in the Sentinel-2 toolbox was not designed for water bodies [20] and was proven inappropriate for estimating reflectances within the NIR region, particularly for reflectance at 705 nm (S2A band 5). Although ACOLITE, an atmospheric correction method for water bodies [19], provided a better estimation for the NIR region, the estimation was not always stable and accurate for visible region [30]. Therefore, the traditional empirical line method (ELM), which was recognized as the most precise method for atmospheric correction, particularly for atmospheric correction over water areas [31,32,33], was used in this study. The ELM uses a linear regression of each S2A band TOA reflectance with concurrently measured surface reflectance to subtract the atmospheric effect with an assumption that the atmosphere is constant over the entire lake. In this study, the obtained linear regression functions, using field-measured reflectance at 20 points over Lake Ba Be and corresponding pixel values of TOA reflectance from the S2A scene acquired concurrently on 4 May 2017, were used to correct the atmosphere effects on seven S2A scenes acquired under the same atmospheric conditions as on 4 May 2017, with a clear sky and calm winds, to map the distribution of Chla over the lake water in the other time periods.
2.4. Algorithms for Estimation of Chla
Most remote sensing algorithms for Chla estimation in waters have been based on the principles of water absorption responding to algae pigments that match the content of Chla in the water, where a high content of Chla leads to an increase of water absorption at 443 nm and near 675 nm [6]. Among the many band-reflectance ratio algorithms that have been proposed for Chla estimation in lake waters, algorithms based on spectral band ratios are the more preferred because they help reduce the irradiance, atmospheric and air-water surface effects on reflectance [14,34]. Three commonly-used algorithms are based on the ratios of: (1) reflectances within the first peak of strong absorption at the blue region between 440 and 510 nm, to reflectances at the minimum absorption at the green region between 550 and 555 nm [35,36]; (2) reflectances at the minimum absorption at the NIR region between 685 and 710 nm, to reflectances at the second peak of absorption at the red region between 670 and 675 nm [16,18]; and (3) reflectances at the minimum absorption at the green region between 550 and 555 nm, to reflectances at the second peak absorption at the red region between 670 and 675 nm [33,37]. In addition to two-band ratio algorithms, three-band ratio algorithms also have been widely used to estimate Chla in turbid productive waters using two reflectances in the NIR region (720 and 750 nm) and one at near-670 nm [38], particularly when based on MERIS data using the ratio of the two NIR bands at 708 nm and 748 nm [17]. Similar to the MERIS data, S2A has two NIR bands (centered at 705 nm and 740 nm) and one red band (centered at 665 nm), thus providing the potential for estimating Chla using the three-band ratio algorithm.
In this study, S2A has two bands within the blue region, which are centered at 443 nm (band 1) and 490 nm (band 2); one band within the green region (band 3, centered at 560 nm); one band within the red region (band 4, centered at 665 nm) and five bands within NIR regions (bands 5, 6, 7, 8a, and 8, centered at 705 nm, 740 nm, 783 nm, 856 nm, and 842 nm, respectively). Consequently, all available band ratios commonly used for Chla estimation were evaluated in this study, including two green-blue band ratios (B3/B1 and B3/B2, respectively) one green-red band ratio (B3/B4), five NIR-red band ratios (B5/B4, B6/B4, B7/B4, B8a/B4, and B8/B4), and one three-band ratio ((B5 + B6)/B4).
3. Results and Discussion
3.1. Lake Ba Be Water Features
The measured reflectance spectra (range of 400–900 nm) of the surveyed sampling points in Lake Ba Be are shown in Figure 2a,b for data obtained in early May 2017 and late June 2016, respectively. The hyperspectral reflectance differed slightly between the two datasets by a higher reflectance of water at 400 nm measured in June 2016, compared to the measurement in May 2017. Nevertheless, in both surveyed datasets, it was possible to identify spectral features similar to reflectance spectra previously observed for clear waters [39,40]. This involved a depression at 440 nm, a prominent peak around 565 nm and a slight trough at 665 nm. A small reflectance peak appeared weakly near 690 nm (within 685 to 695 nm, that corresponded to a natural fluorescence signal) indicating the low Chla contained in the lake water [41].
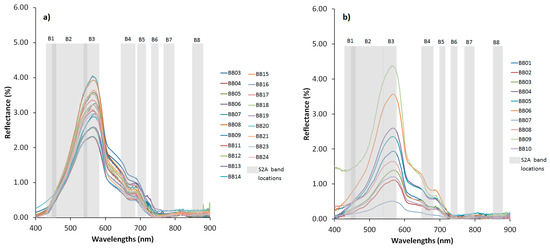
Figure 2.
Reflectance spectra curves of water sampling points over Lake Ba Be measured on 4 May 2017 (a) and 26 June 2016 (b) overlaid with S2A visible to NIR bands (band 1: B1 to 8a: B8a) locations showing the coincidences of the S2A green and red bands to the peak and trough of the water reflectances, respectively.
Chla, TSS, and SD in the surveyed sampling points exhibited small variability (Table 1) over time and space. Chla ranged between 1.58 and 4.61 μg/L (average value of 2.92 μg/L) in early May, between 1.90 and 3.23 μg/L in late June (average value of 2.61 μg/L), and between 2.00 and 6.00 μg/L in November (average value of 3.77 μg/L). TSS varies slightly over the lake on surveyed dates, from 20.5 to 23.2 mg/L on 26 June 2016 and 18.0 to 22.0 mg/L on 5 November 2016. SD ranged from 4.5 to 7 m in early May, from 2.5 to 7.5 m in late June and from 2 to 7 m in November. The low SD surveyed points were mostly distributed in the Pe Lam basin where lake water interacts strongly with the Nang River, through local underground limestone cave systems. In situ Chla and SD were found to have no significant correlation in all three times of measurements (the Pearson correlation coefficient, R, were 0.45, 0.33 and 0.30, respectively). TSS correlated moderately to both Chla and SD in both surveys in June and November 2016, with R being 0.56 and 0.59, respectively.

Table 1.
Descriptive statistics of water parameters obtained in three surveys.
Cross-comparisons of Chla with in situ reflectances of S2A band response-averaged means (N = 30) show that Chla correlated weakly to S2A visible bands (R = 0.19, −0.22, 0.18, and −0.25 for bands 1–4, respectively) and moderately to S2A NIR bands (R = −0.38, −0.42, −0.19, 0.36, and 0.50 for bands 5–8 and 8a, respectively).
In all cross-regression analyses between Chla with in situ reflectance that corresponded to the selected S2A band ratios, the exponential function mostly obtains smaller errors compared to linear and logarithm functions (Table 2). This feature, once again, confirmed the appropriateness of the exponential model for estimating water constituents, such as TSS, Chla, and CDOM, as proposed by Ha and Koike [42] through the physical based consideration of the propagation and reflection of EM waves in shallow waters.
Table 2.
Performances of selected Chla estimation algorithms and results of the best-fit curve analyses using in situ Chla and reflectance (N = 30) measured concurrently on 26 June 2016 and 4 May 2017.
Figure 3 shows the cross-relationship of Chla and in situ S2A band ratios, with the strongest correlation detected between Chla and B3/B4 (r2 = 0.68; standard error of the estimate = 0.14 μg/L corresponded to 5% of the mean value of in situ Chla; Figure 3c). The S2A red-edge band at 705 nm (band 5) and its ratio with red band (band 4), B5/B4, show a moderate correlation with Chla with r2 = 0.29, respectively. The standard error of the estimate by B5/B4 was 0.79 μg/L and higher than one of the estimates by B3/B4. Therefore, B3/B4 was selected as the best ratio for estimating Chla in Lake Ba Be water in this study. Chla can be calculated from in situ B3/B4 by following equation:
Chla = 0.80 × exp(0.35 × B3/B4)
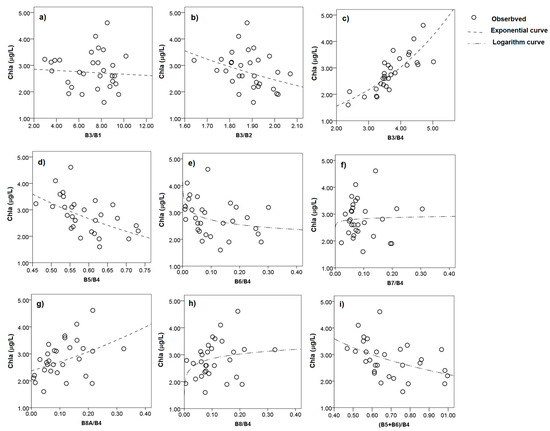
Figure 3.
Cross-relationships of in situ Chla and in situ reflectances corresponding to the S2A band ratios as commonly used to estimate Chla in the reviewed literature (green-to-blue band ratios (a,b); green-to-red band ratio (c); NIR-to-red band ratios (d,e,f,g,h,i)). Abbreviations of the S2A band 1 to band 8a corresponded to B1 to B8a. The highest correlation and the smallest error of S2A B3/B4 with in situ Chla confirmed the appropriateness of using this two-band ratio for estimating Chla in Lake Ba Be water (c).
Figure 4 presents the differences of in situ reflectances (Figure 4a) and S2A TOA reflectances (Figure 4b), and bottom-of-atmosphere (BOA) reflectance (Figure 4c,d) of 20 water sampling points over the Lake Ba Be on 4 May 2017. The simple dark object subtraction (DOS) method [43] which was proven to be efficient for removing the atmospheric effects over the water body using the S2A data [44] was applied and compared with the ELM method. The DOS procedure in this study used the dark values extracted from the minimum values of each S2A image band. Results from DOS (Figure 4c) and ELM methods (Figure 4d) confirmed the appropriateness of the ELM method in atmospheric effect removals. The BOA reflectances yielded by the ELM method matched the in situ reflectances well and, therefore, the ELM method with the same regression coefficients was used to remove atmospheric effects on the seven S2A images of the lake acquired under similar weather conditions to those on 4 May 2017 (clear sky; sunshine; temperature: 23–28 °C; humidity: 70–75%; wind speed: ≤2 m/s [45]).
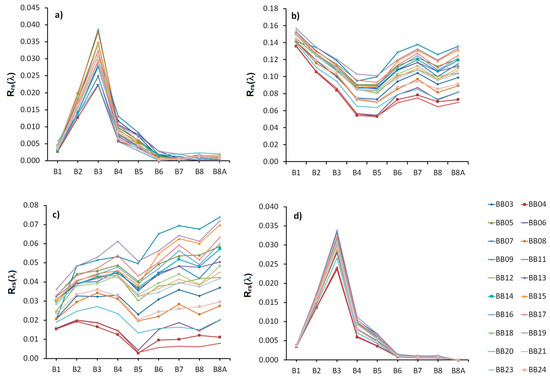
Figure 4.
Features of in situ reflectance based on S2A band response-averaged mean values (a); TOA reflectance extracted from S2A level 1C (b); bottom-of-atmosphere reflectance after using DOS atmospheric correction method (c); and bottom-of-atmosphere reflectance after using ELM method (d) of pixels that correspond to water sampling points on 5 May 2017. Twenty lines correspond to reflectance spectra curves of 20 water sampling points on 5 May 2017.
The standard error means of in situ reflectances of band 3 and band 4 with the ELM outputs (0.0011 and 0.00054, corresponding to 3.6% and 6.4% of the in situ mean values) again confirmed the suitability of the ELM method (Figure 5). For both band 3 and band 4, the DOS method shows less accurate results than the ELM method and, therefore, is not appropriate for use in this study.
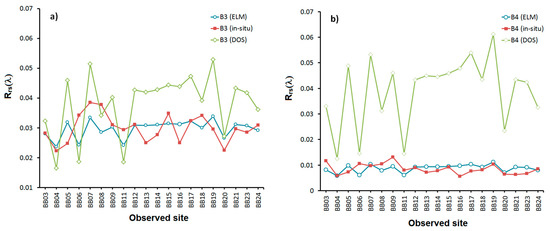
Figure 5.
Comparisons between in situ, DOS and ELM output reflectances of band 3 (a) and band 4 (b) show the suitability of the ELM method for removing atmospheric effects.
Comparisons of in situ Chla and estimated Chla from S2A using Equation (4) obtained on 4 May 2017 and 5 November 2016 are shown in Figure 6. It is clear that estimated Chla has small MSE values compared to in situ Chla, (MSE = 0.25 to 0.75 mg/L, corresponded to 7.5% to 15% of in situ mean Chla) confirming the appropriateness of Equation (4) for estimating Chla in Lake Ba Be water when the acquisition times differed.
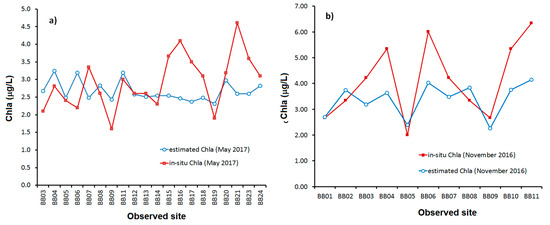
Figure 6.
Comparisons between in situ Chla and: (a) estimated Chla using Equation (4) and the S2A image acquired on 4 May 2017; and (b) the estimated Chla using Equation (4) and the S2A image acquired on 5 November 2016.
3.2. Distribution of Chla in Lake Ba Be Water in Space and Time
Seven S2A images acquired under the same weather conditions as the surveyed date, 4 May 2017, were used to correct for the atmospheric effects in order to estimate Chla using Equation (4). Figure 7 shows the resultant distribution of estimated Chla in Lake Ba Be water over space and time. Chla in Lake Ba Be ranged from 1.52 μg/L (in June 2017) to 8.76 μg/L (in November 2016) with mean values ranging from 2.08 μg/L (in July 2016) to 6.03 μg/L (in November 2016). Spatially, Chla tended to be present at a higher mean value in the lake center and at a lower mean value in areas in close proximity to local discharge streams and rivers. This distribution trend can be seen clearly in Chla maps estimated from the S2A scenes acquired during the rainy season (from May to October). The highest estimated Chla is often distributed in the center of Pe Lam and Pe Lu basins, reaching over 8 μg/L in mid-autumn (October) to late autumn and early winter (November). From these maps of Chla distribution, the effect of discharges of local rivers on lake water quality was observed, particularly in early summer (from May to June). Strong water exchange through the subterranean karst hydro-system with the Nang River in the northern part of the lake caused a significant reduction of Chla in Pe Lam basin water. Water discharge from the Ta Han River in the southern part of the lake diluted Chla in the Pe Leng basin water, making Chla in the Pe Leng basin lower than in the Pe Lu basin.
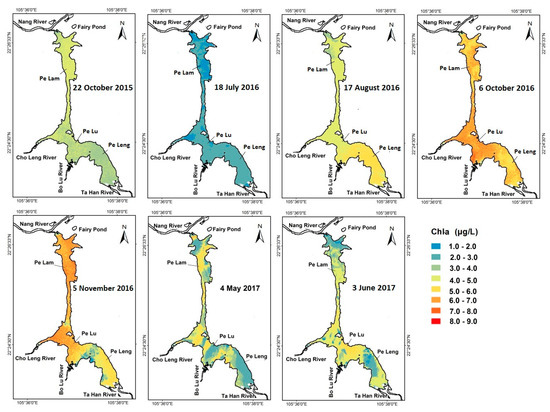
Figure 7.
Chla distribution estimated from Equation (4) and the seven S2A images acquired on seven dates (day/month/year) with clear sky and calm wind conditions over Lake Ba Be since 2015.
To gain further understanding of the temporal dynamics of Chla, pixels of all S2A available images without cloud cover over Lake Ba Be were explored using the same above-mentioned methods to estimate Chla in the lake water. Figure 8 clarifies the temporal change in the mean values of Chla distribution over Lake Ba Be by assuming that the Chla estimated in the same month are similar to the general trend in the images acquired in the years 2015 to 2017. Over the course of a year, Chla was low in the months of spring (January to May), increased to peak in late summer to early autumn (September to early October), and then gradually decreased to a low level during late autumn to winter (November to December). This feature conforms to the seasonal pattern of Chla in mesotrophic lakes located below 29° N latitude [46].
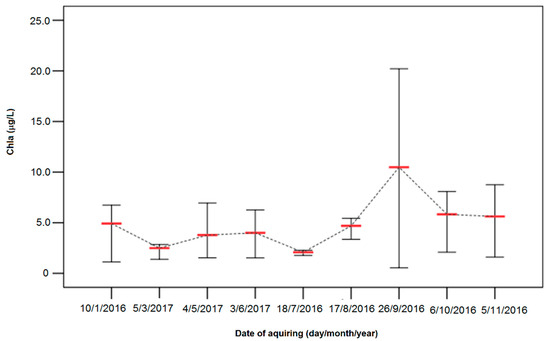
Figure 8.
Temporal change in minimum, mean, and maximum values of Chla in Lake Ba Be water estimated from clear pixels of eleven S2A images by assuming that the Chla estimated in the same month all follow the same general trend in the image acquisition years 2015 to 2017.
Estimated Chla has low correlations with local monthly average temperatures and precipitation (R = 0.13 and −0.10, respectively) because the Chla estimated from small number of available S2A images, as in this study, may not reflect the general trends in distribution and monthly mean levels of Chla in the lake water. The range of Chla values over the year increased gradually each month except for July and August. Chla estimated from the images acquired on 18 July 2016 (Figure 7 and Figure 8) was dramatically low compared to the general seasonal trend of Chla in tropical lakes [45]. The cause of this feature is due to heavy rain occurring during consecutive days from 1 July 2017 to 10 July 2017 throughout the study area. This heavy rainfall diluted the content of lake water constituents, including Chla, as measured after rainy days. Therefore, future work on longer-term monitoring of Chla in the lake water should be carried out to characterize the seasonal pattern of Chla and its related limnological processes.
3.3. Consistency of the Band Ratioselection
As previously mentioned, a wide range of band ratios has been developed for retrieving Chla [16,17,18,34,35,36,37,38]. The successful selection of these ratios depends largely on the biogeochemical characteristics of the water body, clearly shown by the water reflectance spectrum. The proportion of optically-significant constituents in the studied waters (i.e., algae, CDOM, and inorganic suspended solids) should be considered in the selection of a band ratio. For example, to estimate Chla in ocean waters, the blue-to-green ratio of remote sensing reflectance has been widely used because phytoplankton is usually the predominant constituent in the waters rather than inorganic suspended solids (ISS) and dissolved organic matter (DOM). The challenges for this ratio in estimating Chla in inland and coastal waters are the presences of ISS and CDOM with higher values and their concentrations do not always correlate with Chla [8]. Hence, the NIR-to-red ratio and the green-to-red ratio were developed for estimating Chla in highly-turbid waters to subtract the overlaps of the absorption of CDOM and ISS in the blue region of the spectrum. Additionally, different satellite sensors measure water reflectances at various wavelengths: a uniform algorithm lacks versatility for accurately estimating Chla due to this diversity. For example, the positions of the spectral bands of Landsat ETM+ and OLI were proven not to be applicable for estimating Chla using the NIR-to-red ratio [47,48]. Furthermore, to avoid the large errors of an empirical model for monitoring at various times, the best selection ratio for the estimation of Chla should be based on the physical principle of the reflectance absorption of Chla in water [48].
As in many lakes in the tropical region, the DOM in Lake Ba Be water ranges widely over the seasons [49]. The DOM in water has been estimated remotely through CDOM, whose absorbance spectrum overlaps with the Chla absorption at 443 nm. Consequently, the blue-to-green ratio is inappropriate for estimating Chla in common inland waters [6]. Water reflectance spectra of Lake Ba Be water in the two measurements (Figure 2) showed a difference of reflectances within the blue region between the data in May and June, which demonstrates the large variation of CDOM in the lake water. Therefore, in selecting band ratios to estimate Chla in waters like Lake Ba Be water, where Chla present is mostly lower than 10 μg/L, the blue-to-green ratio should be eliminated to avoid the effect of CDOM on the estimates.
The NIR-to-red band ratios were successfully used for turbid waters where ISS was the predominant water constituent, through confirming that the reflectance peak near 700 nm of water was less affected by ISS than the reflectance peak within the green region [6]. According to the obtained data (Table 1), TSS in Lake Ba Be water was sufficiently low, ranging from 20.5 to 23.2 mg/L (average value of 21.2 mg/L) in the rainy season (June 2016) and from 18 to 22 mg/L (average value of 20.5 mg/L) in the dry season (November 2016). Therefore, this lake may be the most suitable for passive remote sensing under the weather conditions of clear sky and calm wind. This assumption was supported by the notable values of SD measured on the surveyed dates evidencing a high potential of the reflectance peak in the green region for estimating Chla in the lake water due to the negligible effect of ISS on this peak. Moreover, the second reflectance peak near 700 nm was unclear and lower than the reflectance at 670 nm at several surveyed points (Figure 2), thus demonstrating why the NIR-to-red band ratio (r2 = 0.29; SE = 0.21 to 0.59 μg/L) was much less appropriate than the green-to-red band ratio (r2 = 0.68; SE = 0.14 μg/L) in the estimation (Table 2).
4. Conclusions
This study developed a method to estimate and map Chla in a tropical freshwater lake using S2A imagery. Evaluation on the performance of commonly-used band-ratio algorithms for estimating Chla in inland waters using field spectral data, and concurrently measured Chla from 30 surface water points in Lake Ba Be, demonstrated the appropriateness of the green-to-red two-band ratio to estimate Chla in the lake using S2A data (r2 = 0.68 with a corresponding error of 5% of the mean value of in situ Chla). The model for estimating Chla using the S2A green-red band ratio by an exponential function was well matched with in situ Chla measured in the lake water on 5 November 2016 (MSE was lower than 20%), thus confirming the efficiency of the proposed method. The spatial distribution of Chla in Lake Ba Be, estimated from seven S2A images acquired under clear sky and calm wind conditions since 2015, was successfully mapped, clarifying the trend that Chla is often at a high level in the lake center, and at a lower mean value in areas in front of local river and stream mouths. Spatially, Chla in Pe Lu basin water is often higher than in the other two basins due to comparatively less water exchange with local rivers. Despite a small number of S2A images being available for this study, the seasonal temporal dynamic of Chla in Lake Ba Be water has been able to be further clarified, as Chla tends to be low during months in the spring, rising to a peak in September, then gradually decreasing in end year months. This temporal trend conforms with the general, seasonal pattern of Chla in lakes in tropical regions, once again confirming the suitability of the proposed method and the potential of S2A data for monitoring Chla in water bodies that have similar features to Lake Ba Be.
Acknowledgments
This study was funded by the National Foundation for Science and Technology of Vietnam, coding NAFOSTED 105.08-2013.12. The authors thank ESA for providing Sentinel 2A data and VNU University of Science’s CARGIS for accommodating us with the field spectroradiometer. We are grateful to Michael Parsons for his help with language editing of our manuscript. Sincere thanks are extended to two anonymous reviewers for their valuable comments and suggestions that helped improve the clarity of the manuscript.
Author Contributions
Nguyen Thi Thu Ha, Katsuaki Koike, and Mai Trong Nhuan planned and designed the research; Nguyen Thi Thu Ha and Nguyen Thien Phuong Thao performed the field experiments and analyzed the data; and Nguyen Thi Thu Ha and Katsuaki Koike wrote the manuscript.
Conflicts of Interest
The authors declare no conflict of interest.
References
- Carlson, R.E. A trophic state index for lakes. Limnol. Oceanogr. 1977, 22, 361–369. [Google Scholar] [CrossRef]
- Baban, S.M.J. Trophic classification and ecosystem checking of lakes using remotely sensed information. Hydrol. Sci. J. 1996, 41, 939–957. [Google Scholar] [CrossRef]
- Kasprzak, P.; Padisák, J.; Koschel, R.; Krienitz, L.; Gervais, F. Chlorophyll a concentration across a trophic gradient of lakes: An estimator of phytoplankton biomass? Limnol. Ecol. Manag. Inland Waters 2008, 38, 327–338. [Google Scholar] [CrossRef]
- U.S. Environmental Protection Agency (USEPA). National Lakes Assessment: A Collaborative Survey of the Nation’s Lakes; EPA 841-R-09-001; U.S. Environmental Protection Agency, Office of Water and Office of Research and Development: Washington, DC, USA, 2009; 103p. Available online: https://www.epa.gov/sites/production/files/2013-11/documents/nla_newlowres_fullrpt.pdf (assessed on 4 July 2017).
- UNEP. Review of Existing Water Quality Guidelines for Freshwater Ecosystems and Application of Water Quality Guidelines on Basin Level to Protect Ecosystems. In Proceedings of the First International Environment Forum for Basin Organizations towards Sustainable Freshwater Governance, Nairobi, Kenya, 26–28 November 2014; Available online: https://wedocs.unep.org/rest/bitstreams/35090/retrieve (assessed on 4 July 2017).
- Schalles, J.F. Optical remote sensing techniques to estimate phytoplankton chlorophyll a concentrations in coastal waters with varying suspended matter and CDOM concentrations. In Remote Sensing and Digital Image Processing; Springer International: Dordrecht, The Netherlands, 2006; Volume 9, pp. 27–79. [Google Scholar]
- Bukata, R.P. Retrospection and introspection on remote sensing of inland water quality: “Like Déjà Vu All Over Again”. J. Gt. Lakes Res. 2013, 39, 2–5. [Google Scholar] [CrossRef]
- Palmer, S.C.J.; Kutser, T.; Hunter, P.D. Remote sensing of inland waters: Challenges, progress and future directions. Remote Sens. Environ. 2015, 157, 1–8. [Google Scholar] [CrossRef]
- Ritchie, J.C.; Zimba, P.V.; Everitt, J.H. Remote Sensing Techniques to Assess Water Quality. Photogramm. Eng. Remote Sens. 2003, 69, 695–704. [Google Scholar] [CrossRef]
- Schalles, J.F.; Gitelson, A.A.; Yacobi, Y.Z.; Kroenke, A.E. Estimation of chlorophyll a from time series measurements of high spectral resolution reflectance in an eutrophic lake. J. Phycol. 1998, 34, 383–390. [Google Scholar] [CrossRef]
- O’Reilly, J.E.; Maritorena, S.; Mitchell, B.G.; Siegel, D.A.; Carder, K.L.; Garver, S.A.; Kahru, M.; McClain, C. Ocean color chlorophyll algorithms for SeaWiFS. J. Geophys. Res. 1998, 103, 24937–24953. [Google Scholar] [CrossRef]
- Kallio, K.; Koponen, S.; Pulliainen, J. Feasibility of airborne imaging spectrometry for lake monitoring—A case study of spatial chlorophylla distribution in two meso-eutrophic lakes. Int. J. Remote Sens. 2003, 24, 3771–3790. [Google Scholar] [CrossRef]
- D’Sa, E.J.; Miller, R.L. Bio-optical properties in waters influenced by the Mississippi River during low flow conditions. Remote Sens. Environ. 2003, 84, 538–549. [Google Scholar] [CrossRef]
- Dekker, A.G.; Peters, S.W.M. The use of the Thematic Mapper for the analysis of eutrophic lakes: A case study in the Netherlands. Int. J. Remote Sens. 1993, 14, 799–821. [Google Scholar] [CrossRef]
- Ritchie, J.C.; Schiebe, F.R.; Cooper, C.M.; Harrington, J.A. Chlorophyll Measurements in the Presence of Suspended Sediment Using Broad Band Spectral Sensors Aboard Satellites. J. Freshw. Ecol. 1994, 9, 197–206. [Google Scholar] [CrossRef]
- Gitelson, A. The peak near 700 nm on radiance spectra of algae and water: Relationships of its magnitude and position with chlorophyll concentration. Int. J. Remote Sens. 1992, 13, 3367–3373. [Google Scholar] [CrossRef]
- Gitelson, A.A.; Dall’Olmo, G.; Moses, W.; Rundquist, D.C.; Barrow, T.; Fisher, T.R.; Gurlin, D.; Holz, J. A simple semi-analytical model for remote estimation of chlorophyll-a in turbid waters: Validation. Remote Sens. Environ. 2008, 112, 3582–3593. [Google Scholar] [CrossRef]
- Gitelson, A.A.; Gurlin, D.; Moses, W.J.; Barrow, T. A bio-optical algorithm for the remote estimation of the chlorophyll-aconcentration in case 2 waters. Environ. Res. Lett. 2009, 4, 045003. [Google Scholar] [CrossRef]
- Vanhellemont, Q.; Ruddick, K. ACOLITE for Sentinel-2: Aquatic Applications of MSI Imagery. In Proceedings of the 2016 ESA Living Planet Symposium, Prague, Czech Republic, 9–13 May 2016. [Google Scholar]
- Toming, K.; Kutser, T.; Laas, A.; Sepp, M.; Paavel, B.; Nõges, T. First Experiences in Mapping Lake Water Quality Parameters with Sentinel-2 MSI Imagery. Remote Sens. 2016, 8, 640. [Google Scholar] [CrossRef]
- UNESCO. Ba Be-Na Hang Natural Heritage Area. Available online: http://whc.unesco.org/fr/ listesindicatives/6262/ (assessed on 31 May 2017).
- Ramsar Secretariat. Celebrations for the Listing of Vietnam’s 3rd Ramsar Site. Available online: http://archive.ramsar.org/cda/fr/ramsar-news-archives-2011-vietnam-celebration/main/ramsar/1-26-45-489%5E25167_4000_1 (assessed on 31 May 2017).
- Huong, L.L. Application of Mathematical Model to Evaluate and Report the Eutrophication of Ba Be Lake, BacKan Province; Project QT-04-33 Report; Vietnam National University: Hanoi, Vietnam, 2005; Available online: http://tainguyenso.vnu.edu.vn/xmlui/handle/123456789/8080 (assessed on 31 May 2017).
- Hai, H.T.; Khanh, N.H.; Duong, D.H.; Toan, T.D. Some Characteristics of Environmental Ecology in Ba Be Lake. In Proceedings of the Scientific Conference on Environmental Protection for Lake Ba Be (BacKan Province), Bac Kan, Vietnam, 26–27 August 2002; Labour Publishing House: Hanoi, Vietnam, 2003. [Google Scholar]
- APHA. Standard Methods for the Examination of Water and Wastewater; American Public Health Association, American Water Works Association, Water Environment Federation: Washington, DC, USA; Available online: https://www.mwa.co.th/download/file_upload/SMWW_1000-3000.pdf (assessed on 1 May 2017).
- Mueller, J.L.; Morel, A.; Frouin, R.; Davis, C.; Arnone, R.; Carder, K.; Lee, Z.P.; Steward, R.G.; Hooker, S.; Mobley, C.D.; et al. Volume III: Radiometric Measurements and Data Analysis Protocols; Mueller, J.L., Giulietta, S.F., McClain, C.R., Eds.; Goddard Space Flight Space Center: Greenbelt, MD, USA, 2003.
- Mobley, C.D. Estimation of the remote-sensing reflectance from above-surface measurements. Appl. Opt. 1999, 38, 7442–7455. [Google Scholar] [CrossRef] [PubMed]
- Kutser, T.; Vahtmäe, E.; Praks, J. A sun glint correction method for hyperspectral imagery containing areas with non-negligible water leaving NIR signal. Remote Sens. Environ. 2009, 113, 2267–2274. [Google Scholar] [CrossRef]
- ESA. The Copernicus Open Access Hub. Available online: https://scihub.copernicus.eu/ (accessed on 12 September 2017).
- Martins, V.; Barbosa, C.; Carvalho, L.; Jorge, D.; Lobo, F.; Novo, E. Assessment of Atmospheric Correction Methods for Sentinel-2 MSI Images Applied to Amazon Floodplain Lakes. Remote Sens. 2017, 9, 322. [Google Scholar] [CrossRef]
- Smith, G.M.; Milton, E.J. The use of the empirical line method to calibrate remotely sensed data to reflectance. Int. J. Remote Sens. 1999, 20, 2653–2662. [Google Scholar] [CrossRef]
- Gerace, A.D.; Schott, J.R.; Nevins, R. Increased potential to monitor water quality in the near-shore environment with Landsat’s next-generation satellite. J. Appl. Remote Sens. 2013, 7. [Google Scholar] [CrossRef]
- Ioannou, I.; Gilerson, A.; Ondrusek, M.; Foster, R.; Bastani, K.; Ahmed, S. Algorithms for the remote estimation of chlorophyll-a in the Chesapeake Bay. In Proceedings of the SPIE 9111 Ocean Senseing Monitoring VI, Baltimore, MD, USA, 23 May 2014. [Google Scholar] [CrossRef]
- Lillesand, T.; Kiefer, R.K.; Chipman, J. Remote Sensing and Image Interpretation, 7th ed.; Wiley: Hoboken, NJ, USA, 2015. [Google Scholar]
- Carder, K.L.; Chen, F.R.; Cannizzaro, J.P.; Campbell, J.W.; Mitchell, B.G. Performance of the MODIS semi-analytical ocean color algorithm for chlorophyll-a. Adv. Space Res. 2004, 33, 1152–1159. [Google Scholar] [CrossRef]
- Ha, N.T.T.; Koike, K.; Nhuan, M.T. Improved Accuracy of Chlorophyll-a Concentration Estimates from MODIS Imagery Using a Two-Band Ratio Algorithm and Geostatistics: As Applied to the Monitoring of Eutrophication Processes over Tien Yen Bay (Northern Vietnam). Remote Sens. 2013, 6, 421–442. [Google Scholar] [CrossRef]
- Oliveira, E.N.; Fernandes, A.M.; Kampel, M.; Cordeiro, R.C.; Brandini, N.; Vinzon, S.B.; Grassi, R.M.; Pinto, F.N.; Fillipo, A.M.; Paranhos, R. Assessment of remotely sensed chlorophyll-a concentration in Guanabara Bay, Brazil. J. Remote Sens. 2016, 10, 026003. [Google Scholar] [CrossRef]
- Dall’Olmo, G.; Gitelson, A.A.; Rundquist, D.C.; Leavitt, B.; Barrow, T.; Holz, J.C. Assessing the potential of SeaWiFS and MODIS for estimating chlorophyll concentration in turbid productive waters using red and near-infrared bands. Remote Sens. Environ. 2005, 96, 176–187. [Google Scholar] [CrossRef]
- Tiwari, S.P.; Shanmugam, P.; Ahn, Y.H.; Ryu, J.H. A Reflectance Model for Relatively Clear and Turbid Waters. ETASR Eng. Technol. Appl. Sci. Res. 2003, 3, 325–337. [Google Scholar]
- Yu, G.; Yang, W.; Matsushita, B.; Li, R.; Oyama, Y.; Fukushima, T. Remote Estimation of Chlorophyll-a in Inland Waters by a NIR-Red-Based Algorithm: Validation in Asian Lakes. Remote Sens. 2014, 6, 3492–3510. [Google Scholar] [CrossRef]
- Gitelson, A.A.; Yacobi, Y.Z. Reflectance in the red and near infra-red ranges of the spectrum as tool for remote chlorophyll estimation in inland waters-Lake Kinneret case study. In Proceedings of the Eighteenth Convention of IEEE Electrical and Electronics Engineers in Israel, Tel Aviv, Israel, 7–8 March 1995. [Google Scholar]
- Ha, N.T.T.; Koike, K. Integrating satellite imagery and geostatistics of point samples for monitoring spatio-temporal changes of total suspended solids in bay waters: Application to Tien Yen Bay (Northern Vietnam). Front. Earth Sci. 2011, 5, 305–316. [Google Scholar] [CrossRef]
- Chavez, P.S. An improved dark-object subtraction technique for atmospheric scattering correction of multispectral data. Remote Sens. Environ. 1988, 24, 459–479. [Google Scholar] [CrossRef]
- Lantzanakis, G.; Mitraka, Z.; Chrysoulakis, N. Comparison of physically and image based atmospheric correction methods for Sentinel-2 satellite imagery. In Proceedings of the SPIE 9688, the Fourth International Conference on Remote Sensing and Geoinformation of the Environment (RSCy2016), Paphos, Cyprus, 12 August 2016. [Google Scholar] [CrossRef]
- Bac Kan Provincial Department of Natural Resources and Environment. BacKan Province Weather News. Available online: http://tnmtbackan.gov.vn/index.php?language=vi&nv=news&op=Du-bao-thoi-tiet (accessed on 25 August 2017).
- Brown, C.D.; Canfield, D.E.; Bachmann, R.W.; Hoyer, M.V. Seasonal Patterns of Chlorophyll, Nutrient Concentrations and Secchi Disk Transparency in Florida Lakes. Lake Reserv. Manag. 1998, 14, 60–76. [Google Scholar] [CrossRef]
- Gholizadeh, M.H.; Melesse, A.M.; Reddi, L. A Comprehensive Review on Water Quality Parameters Estimation Using Remote Sensing Techniques. Sensors 2016, 16, 1298. [Google Scholar] [CrossRef] [PubMed]
- Ha, N.T.T.; Koike, K.; Nhuan, M.T.; Canh, B.D.; Thao, N.T.T.P.; Parsons, M. Landsat 8/OLI two bands ratio algorithm for chlorophyll-a concentration mapping in hypertrophic waters: An application to West Lake in Hanoi (Vietnam). IEEE J. Sel. Top. Appl. Earth Obs. Remote Sens. 2017. [Google Scholar] [CrossRef]
- Lindell, M.J.; Granéli, H.W.; Bertilsson, S. Seasonal photoreactivity of dissolved organic matter from lakes with contrasting humic content. Can. J. Fish. Aquat. Sci. 2000, 57, 875–885. [Google Scholar] [CrossRef]


© 2017 by the authors. Licensee MDPI, Basel, Switzerland. This article is an open access article distributed under the terms and conditions of the Creative Commons Attribution (CC BY) license (http://creativecommons.org/licenses/by/4.0/).