1. Introduction
The World Meteorological Organization (WMO) estimates that the disaster reduction rate owing to decision support systems (DSS) accounts for approximately 10–15% of the total benefits of global disaster reduction 1. Therefore, the construction of DSS is a matter of great urgency. The secondary development phase of most emergency command systems based on geographic information systems (GIS) has been established, so the DSS itself needs to display, insert, and process a large amount of spatial data. With the rapid development of Web technology and GIS, GIS technology based on the Web plays an increasingly important role in DSS. Independent of clients, a Web-based display terminal has a simple interactive interface and a simple deployment of B/S (browser/server) architecture. Except for the requirement of server performance, its advantages include low hardware cost, separately arranged modules and data, and easy upgrading and data sharing.
In recent years, there has been a large amount of research into Web- and GIS-based decision support systems. Engel built a Web–DSS system based on Oracle and MapServer GIS Web with an L-THIA model [
1]. The system provides the functions of map display, data statistics, and so on, which provides technical support for the user’s hydrological decision. By computer software and hardware conditions, the computing power is poor and lacks pertinence [
2]. Salah used Apache to build a water pollution management decision system (WaterDSS), building a calculation module based on PHP, which is a popular general-purpose scripting language that is especially suited to web development, to communicate with the Ajax-based foreground program. This system achieves the inclusion of water resources data and map display functionality [
3]. Kulkarni established a hydrological model for the Koparkhairane and Kalamboli watersheds, and created a browser-based city waterlogging assessment and decision system named the integrated flood assessment model (IFAM) [
4], the advantages of which include high usability and expansibility, though its simulation scope covers too small an area (5 km). Chen [
5] constructed a disaster management platform based on an ArcGIS server and Twitter which can identify different disasters through query and provide a hot map preview. Based on the big data of Twitter, the system has a certain functionality for emergency disaster management, but it still needs manual updating, and its lack of a keywords filter consequently leads it to misjudge the subjective assessments of Twitter users. With the application of the ArcGIS network analysis function, Zhang et al. [
6] created a Jingjiang flood decision support system though which people who live in a flood-relief area can plan for transfer routes and estimated times of arrival, and the system can also provide real-time traffic guidance. Wu [
7] analogously designed a system named the weather service product generation system (WSPGS); through geoprocessing services, it can design workflow according to the demands of the users. Although WSPGS is used primarily to output maps on the basis of meteorological data, it can be seen as a prototype of DSS. In order to ensure its timeliness, the ArcGIS server is used to deploy geoprocessing services. This system has the huge advantage of receiving remote sensing data through the Internet [
8,
9,
10], and works using geoprocessing services, defining its process online with selected attributes of geoprocessing services, and ensuring high efficiency and stability.
In recent years, there has been much research on Web-based DSS technology, but most of the systems that have been developed have the same problem: their functionality is simple and their expansibility is poor [
11,
12]. About 10 years ago, most scholars published their models by rewriting PHP or JS [
13]. In recent years, many GIS companies have released their server products to reduce the difficulty of building GIS systems, while also enhancing the stability of those systems. However, research into building GIS-based DSS systems is rare [
14]. The main difficulty lies in improving the efficiency and stability of the system logic [
15,
16,
17]. After referring to previous work, we designed a DSS based on geoprocessing services. The method of contrasting current data to historical maximum rainfall data is applied here to locate rainstorm areas. Therefore, our system can provide early warning timeliness, determining the warning area in time and ensuring the stability and timeliness of the system.
The strong ability to manage spatial data is expanded according to its rainfall warning model, and some basic tools about processing geographic information are designed [
18]; thus, the rainfall warning model of DSS has been established. By virtue of its feature of simplicity, easy customization, and deployment, we created a set of decision support systems which can meet the requirements of data integration, task scheduling, and high stability. This paper first introduces the real-time rainfall warning module of the emergency command system in Sichuan Province, then introduces the algorithm foundation, deployment, and application. This example has been run in the emergency command system Intranet of Sichuan Province, and the operation effect is good. Research shows that, thanks to the high stability and scalability of ArcGIS Server, with the use of the assembled geoprocessing (GP) services in the background, you can achieve the needs of most DSS functional requirements.
2. Research Area and System Introduction
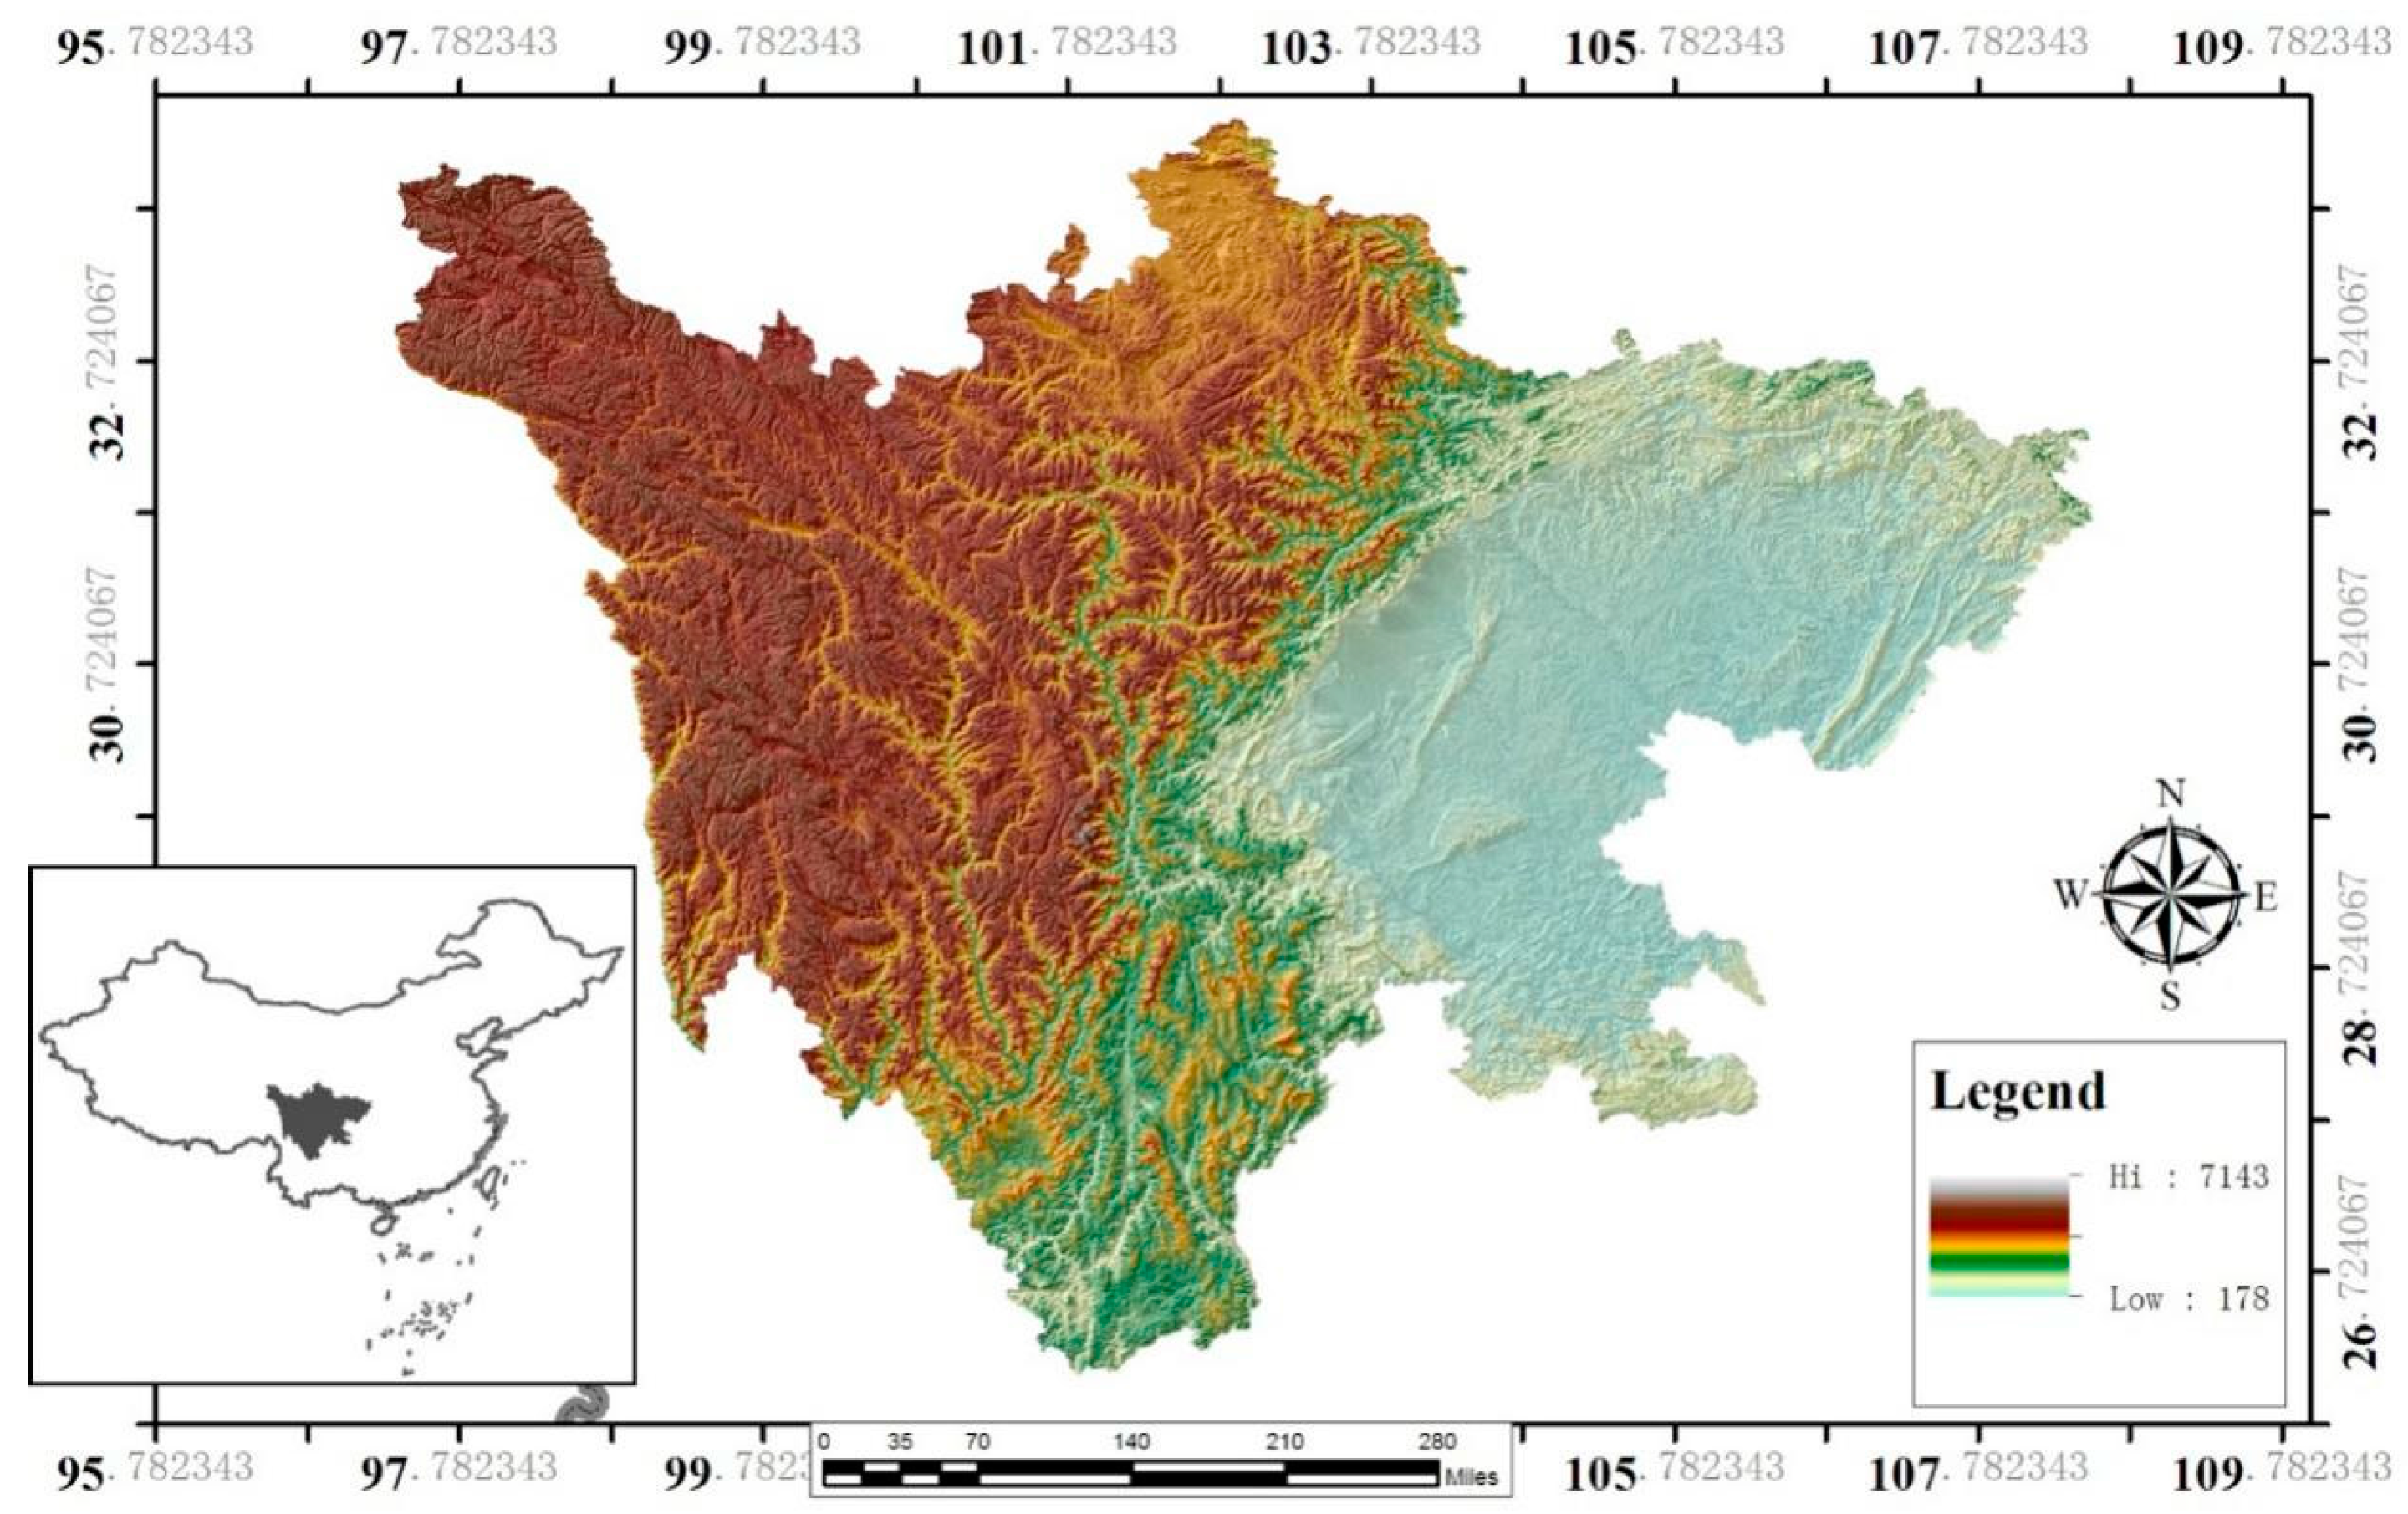
Sichuan Province (
Figure 1) has a total land area of 485 thousand km
2, which renders it the fifth broadest land area among 31 provinces. Located in western China, Sichuan has extraordinarily abundant landscape types, of which the main ones contain not only plains and mountains but also hilly and plateau terrain. Sichuan Province is located in a subtropical region, and there are three terrains: the Sichuan Basin, Southwest Sichuan Mountain, and the mountain climate zone of northwest Sichuan. The climate of Sichuan is complex and varied. Drainage in Sichuan Province is distributed widely; the number of rivers whose drainage area covers more than 100 km
2 is more than 1000. Because of its location in the medium of the North–South Seismic Belt, seismic activity frequency in Sichuan Province is relatively high. Sichuan Province has suffered many kinds of disasters in history, including lightning, flood burst, earthquake, hail, and forest fires. Causing great loss to the national economy, these disasters are big threats to life and property to various extents, and also test the local government’s emergency management ability. There were seven large-scale heavy rainfalls in 2007, including a hundred-year storm in one local area in July. In 2010, Sichuan Province repeatedly suffered heavy rains and floods, especially the ‘7.15’, ‘7.22’ rainstorm and flood disasters, and ‘8.13‘, the most serious flash flood and debris flow. In 2011, north and east Sichuan continuously suffered rainstorm and flood disasters which caused 119 people to die and 50 people to go missing; 15 heavy rainfalls and 5 regional rainstorms hit Sichuan Province in the flood season of 2012, and the average number of rainy days was 95. As a result, 31,540,000 people were affected, including 163 people dead. From 29 June to 17 July in 2013, the province suffered four strong rainfalls and 469 rainstorms.
In 2007, the law on emergency response in the People’s Republic of China was officially promulgated and implemented, laying a legal foundation for developing an emergency industry. This emergency industry has been accepted by the central government, and has been highly valued. In response to the characteristics of natural disasters in Sichuan Province, in 2014, the Sichuan provincial geological disaster emergency headquarters was set up. At the same time, the Sichuan provincial geological disaster emergency management GIS system was established online.
Developed by Adobe Flex, the Sichuan DSS client communicates with geoprocessing by ESRI for Flex API. ESRI is the company that built ArcGIS, the world’s most powerful mapping and spatial analytics software. The principle of geoprocessing has been implemented by ArcGIS products from ESRI Corporation, which also provides Model Builder and Workflow Manager tools to support normal geographical tasks. The fundamental idea of geoprocessing aims at automatically finishing GIS tasks by using multiple-step procedures known as workflows. Automation is realized by a series of tools and a mechanism of combining these tools by a sequence of operations by using models and even scripts. Each geoprocessing tool performs a small but essential operation on geographical data, such as interpolating the data set from a point data set, clipping a territory by using another polygon shape, or creating a buffer zone around features. Geoprocessing normally contains an advanced looping and branching model to support the simulation of reality.
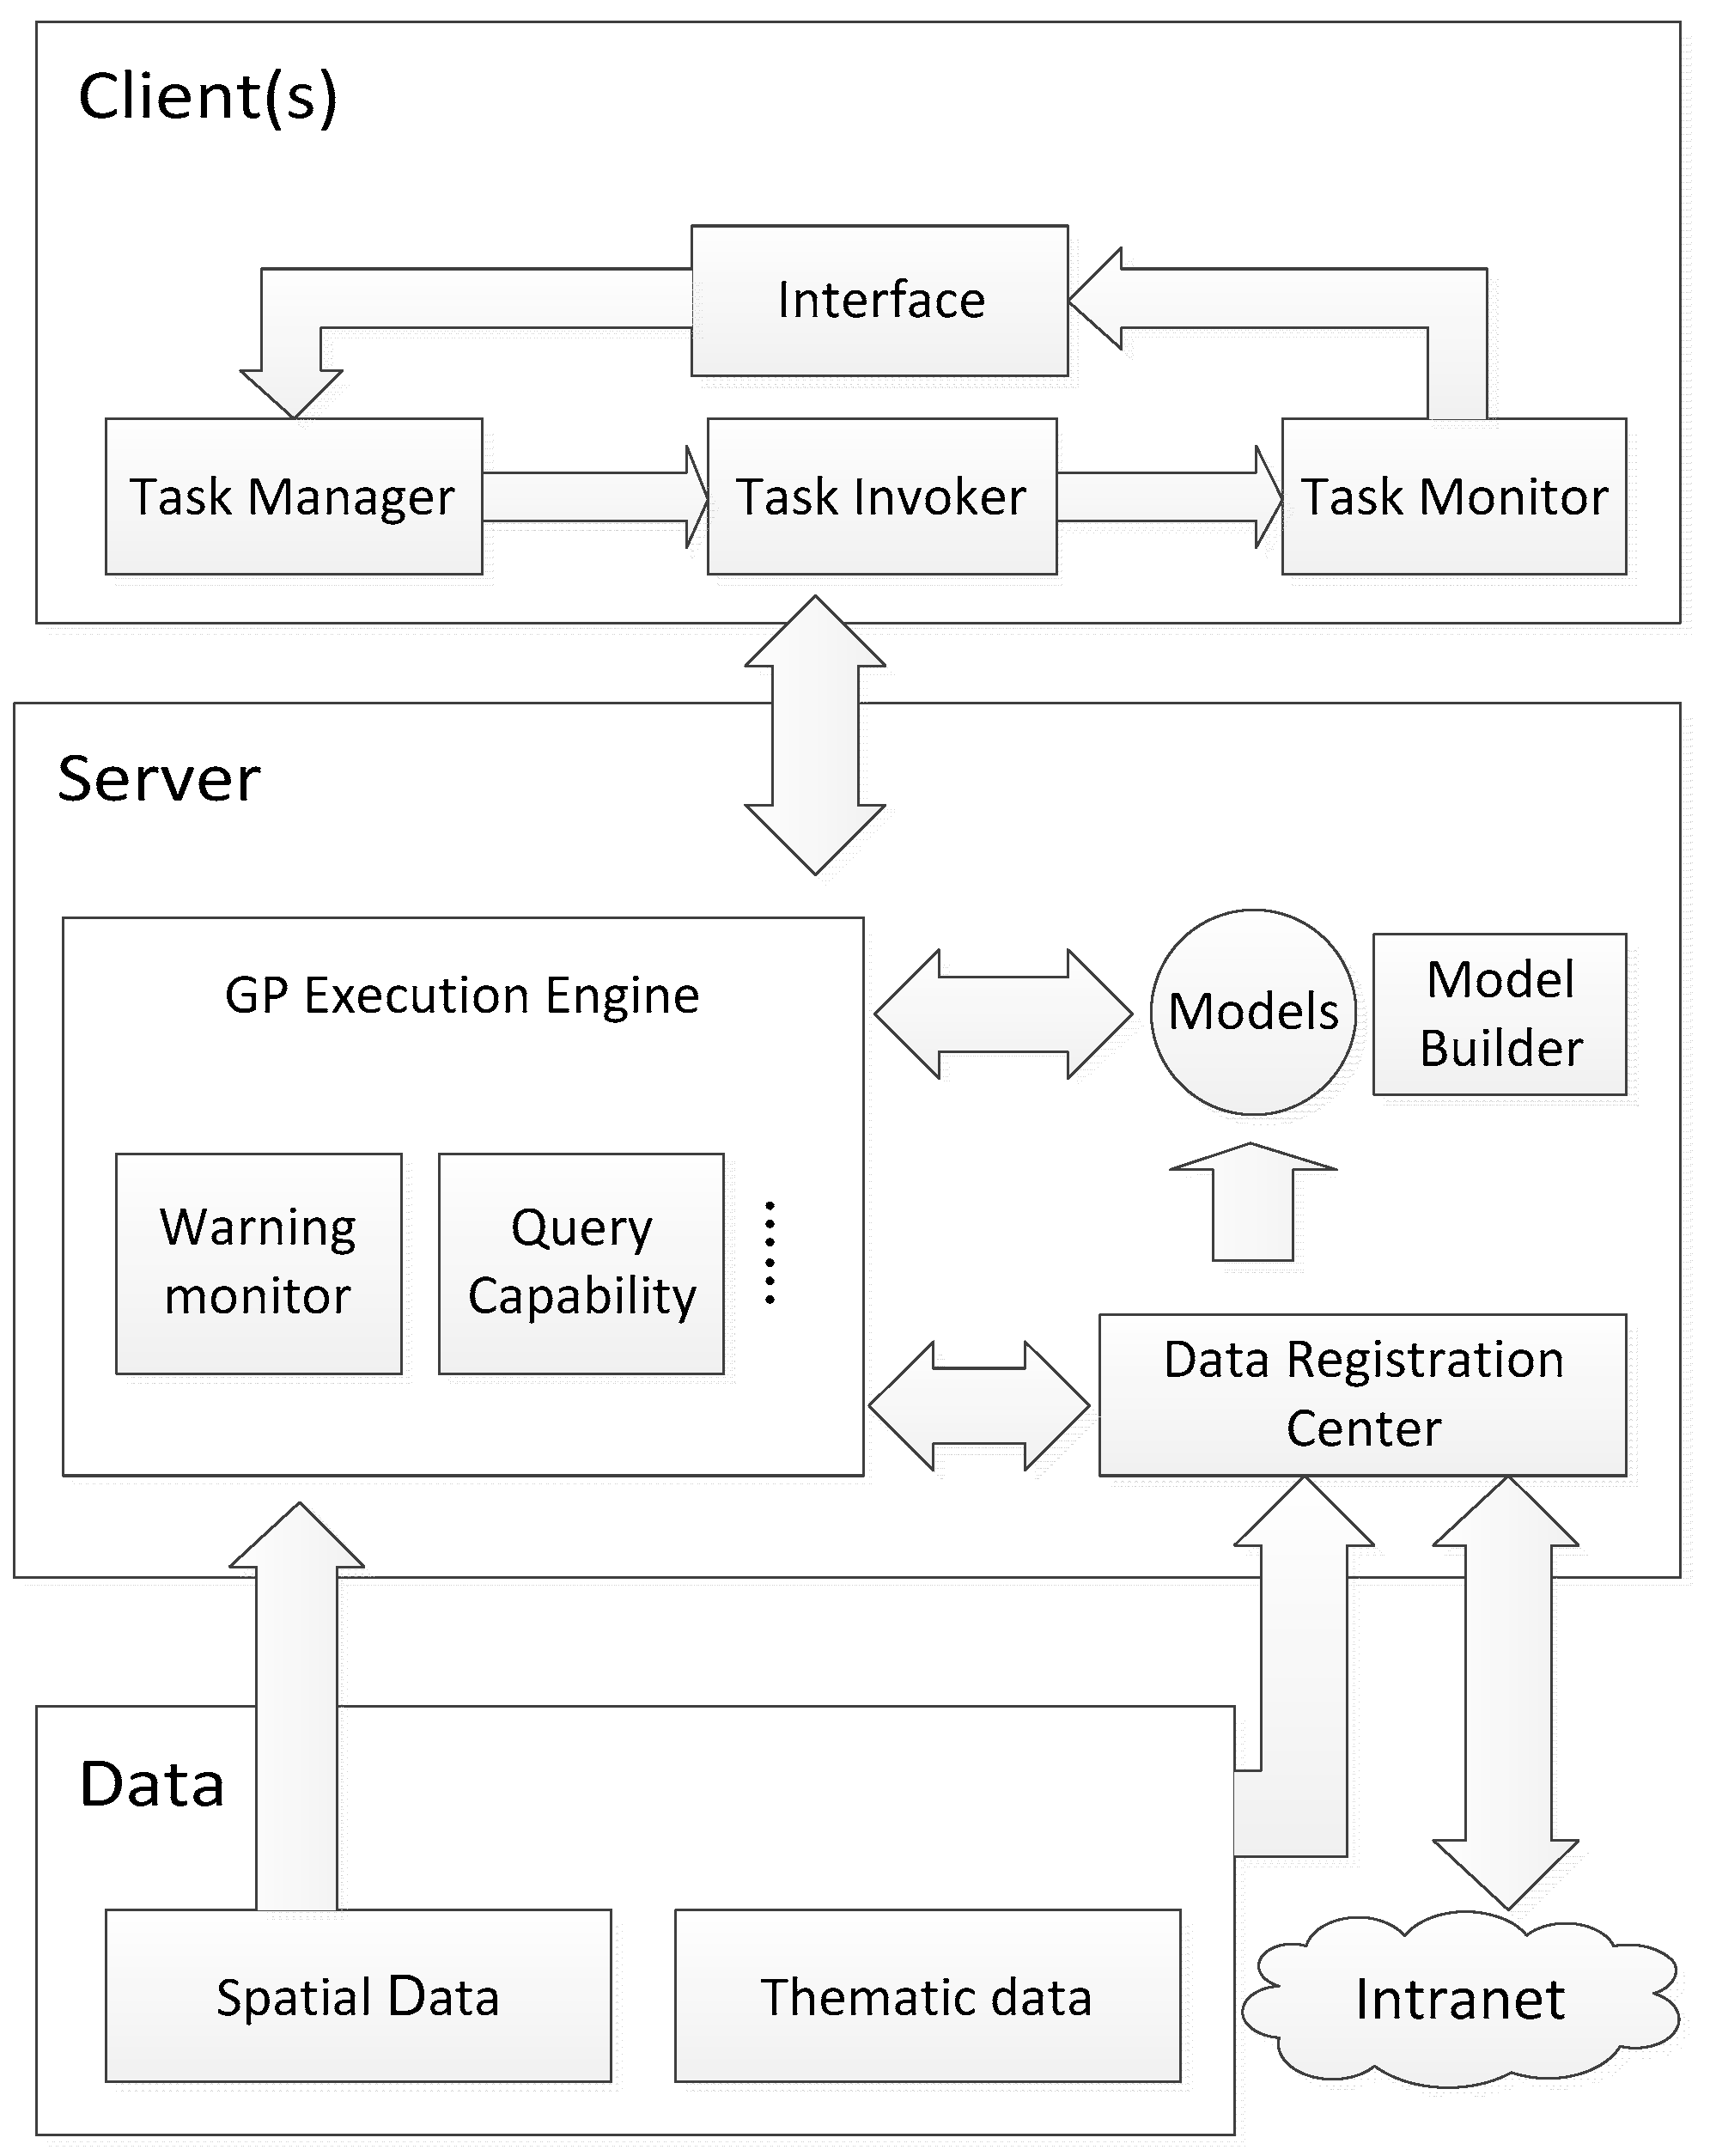
The system utilizes a layered architecture, and the data registration center (DRC) accomplishes centralized management of all data, including Internet data, spatial data, and thematic data. The server layer is mainly composed of a geoprocessing services executor and model builder. The client page launches a task request to the invoker, then the invoker calls different data according to different task instructions for different geoprocessing processes, and provides feedback on task progress to Task Monitor in real time. At the end of the task, the result or index will be sent back to the foreground in JSON format. Different function modules in DSS call for different geoprocessing services and different data. Benefiting from geoprocessing services deployment and expansion, and data management by the DRC, the function and application of DSS has been greatly improved.
Figure 2 shows the architecture diagram of DSS.
4. Design and Implementation
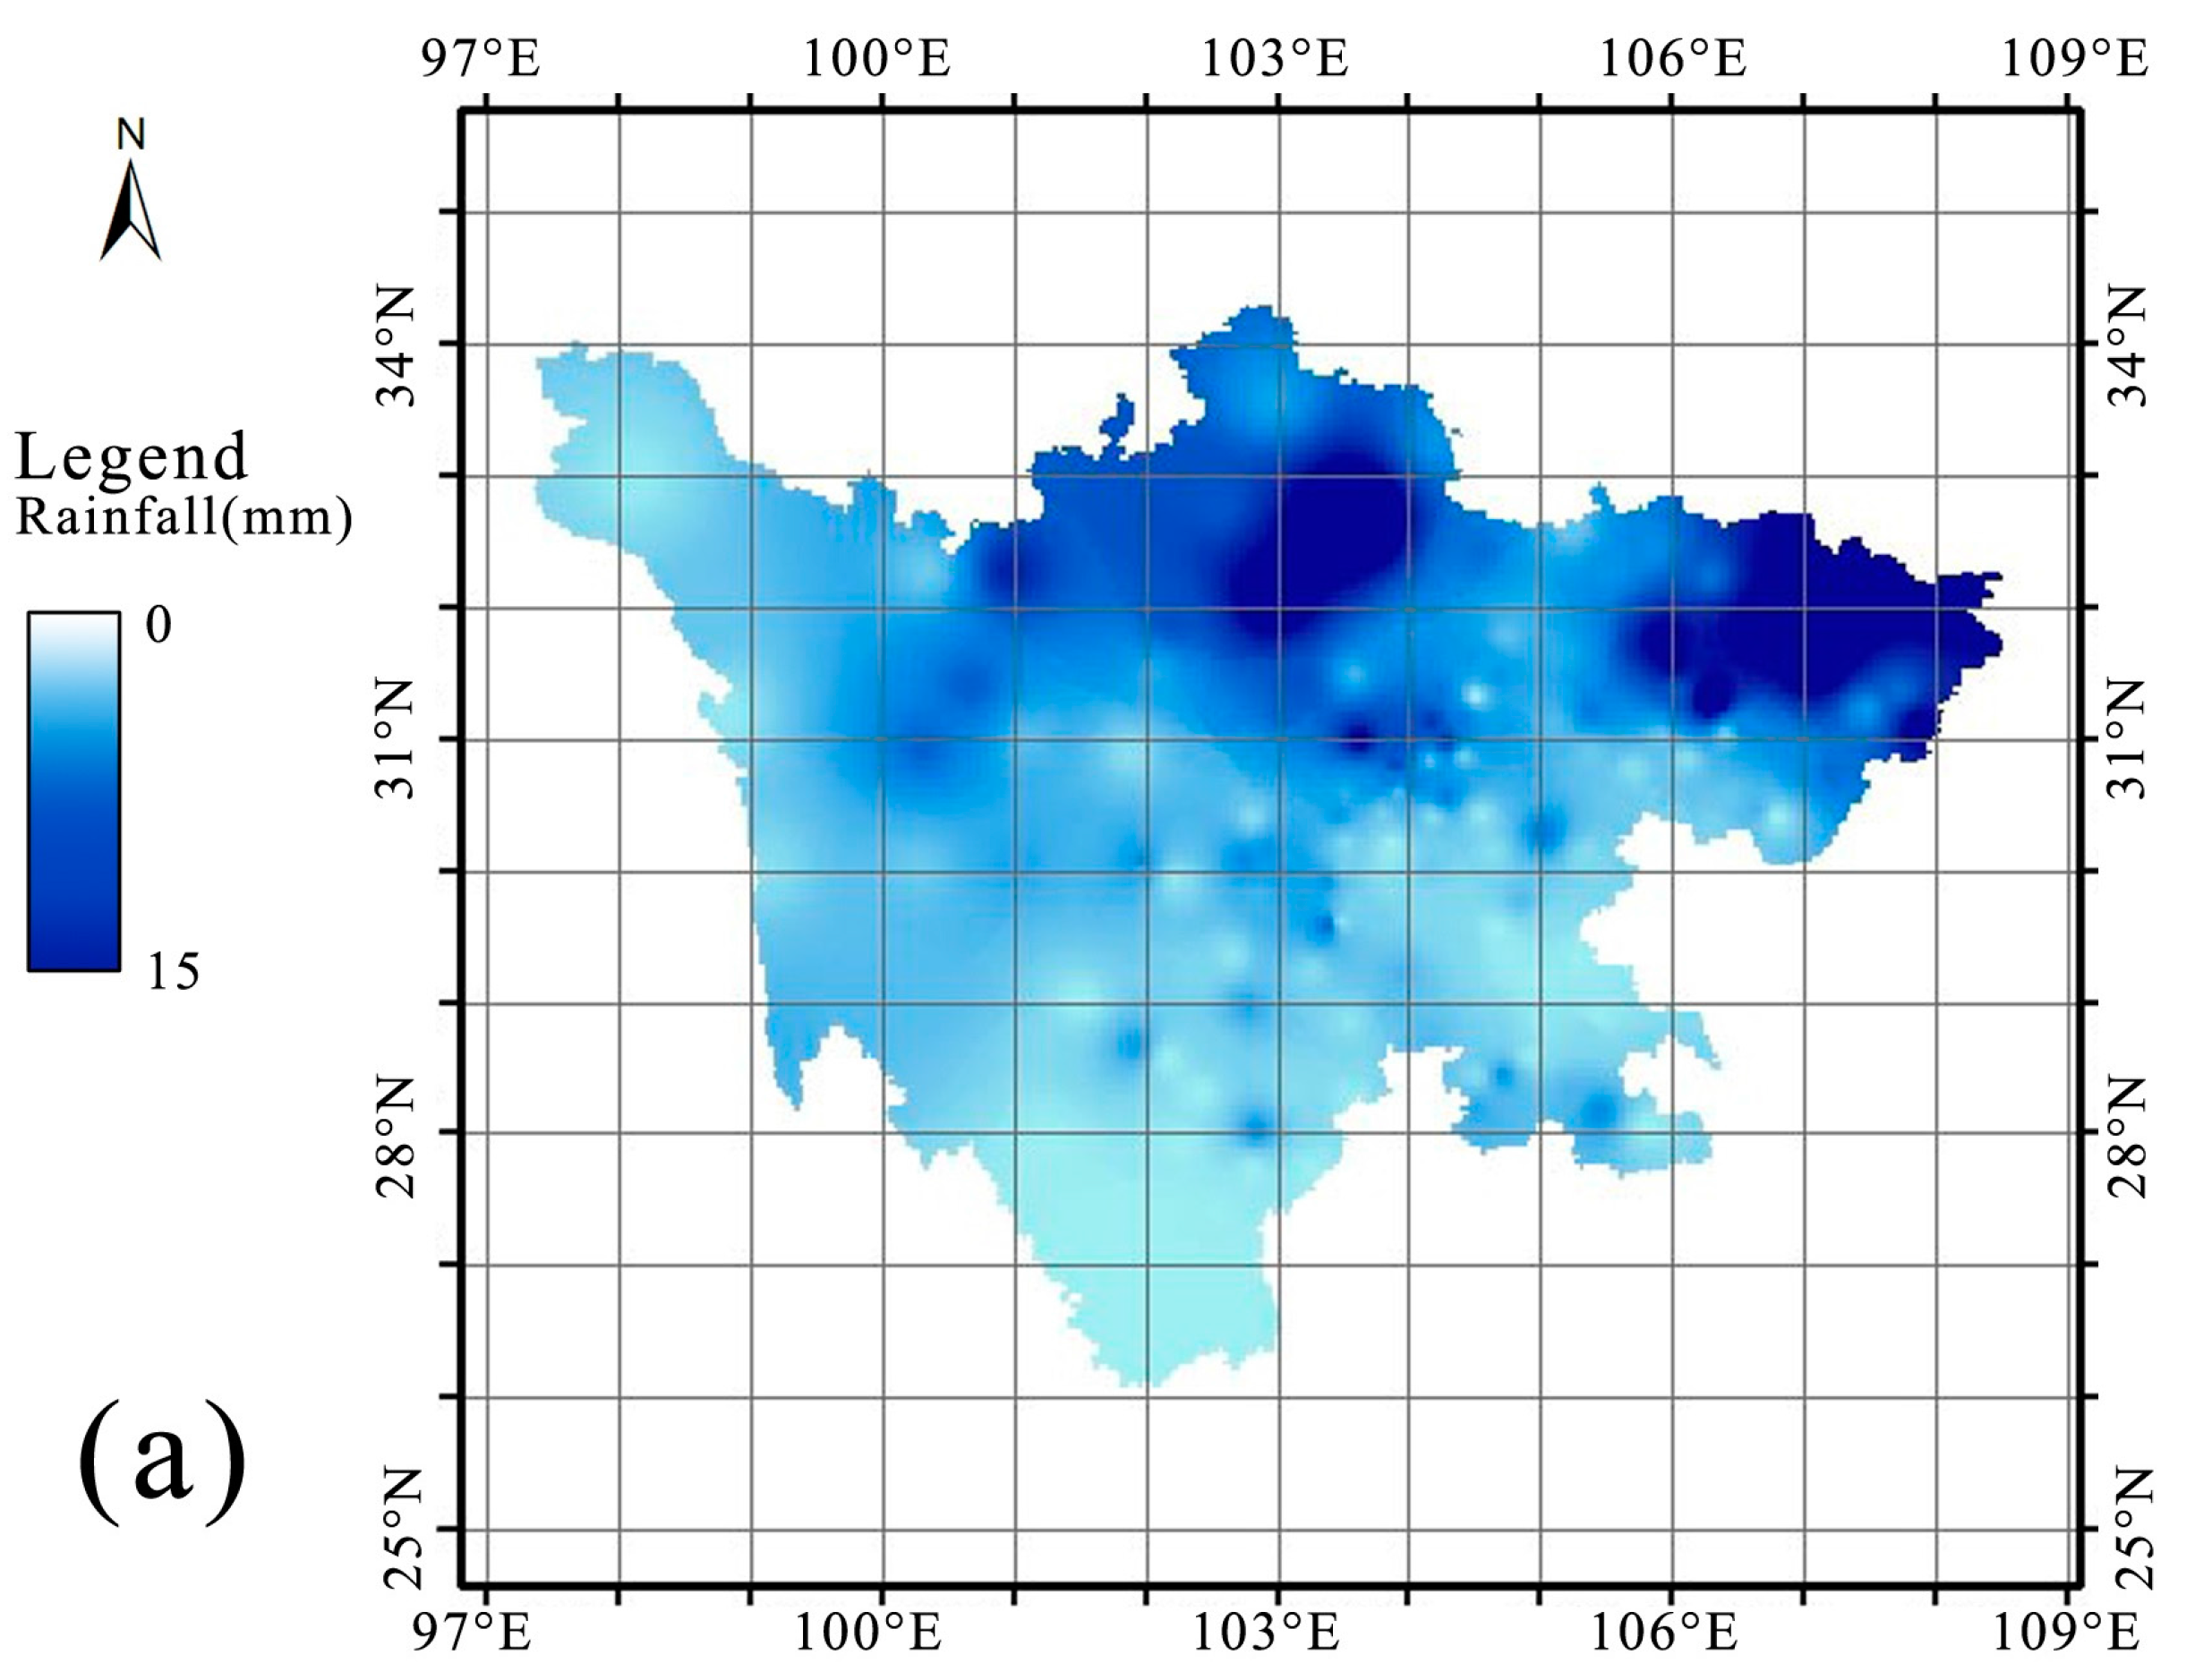
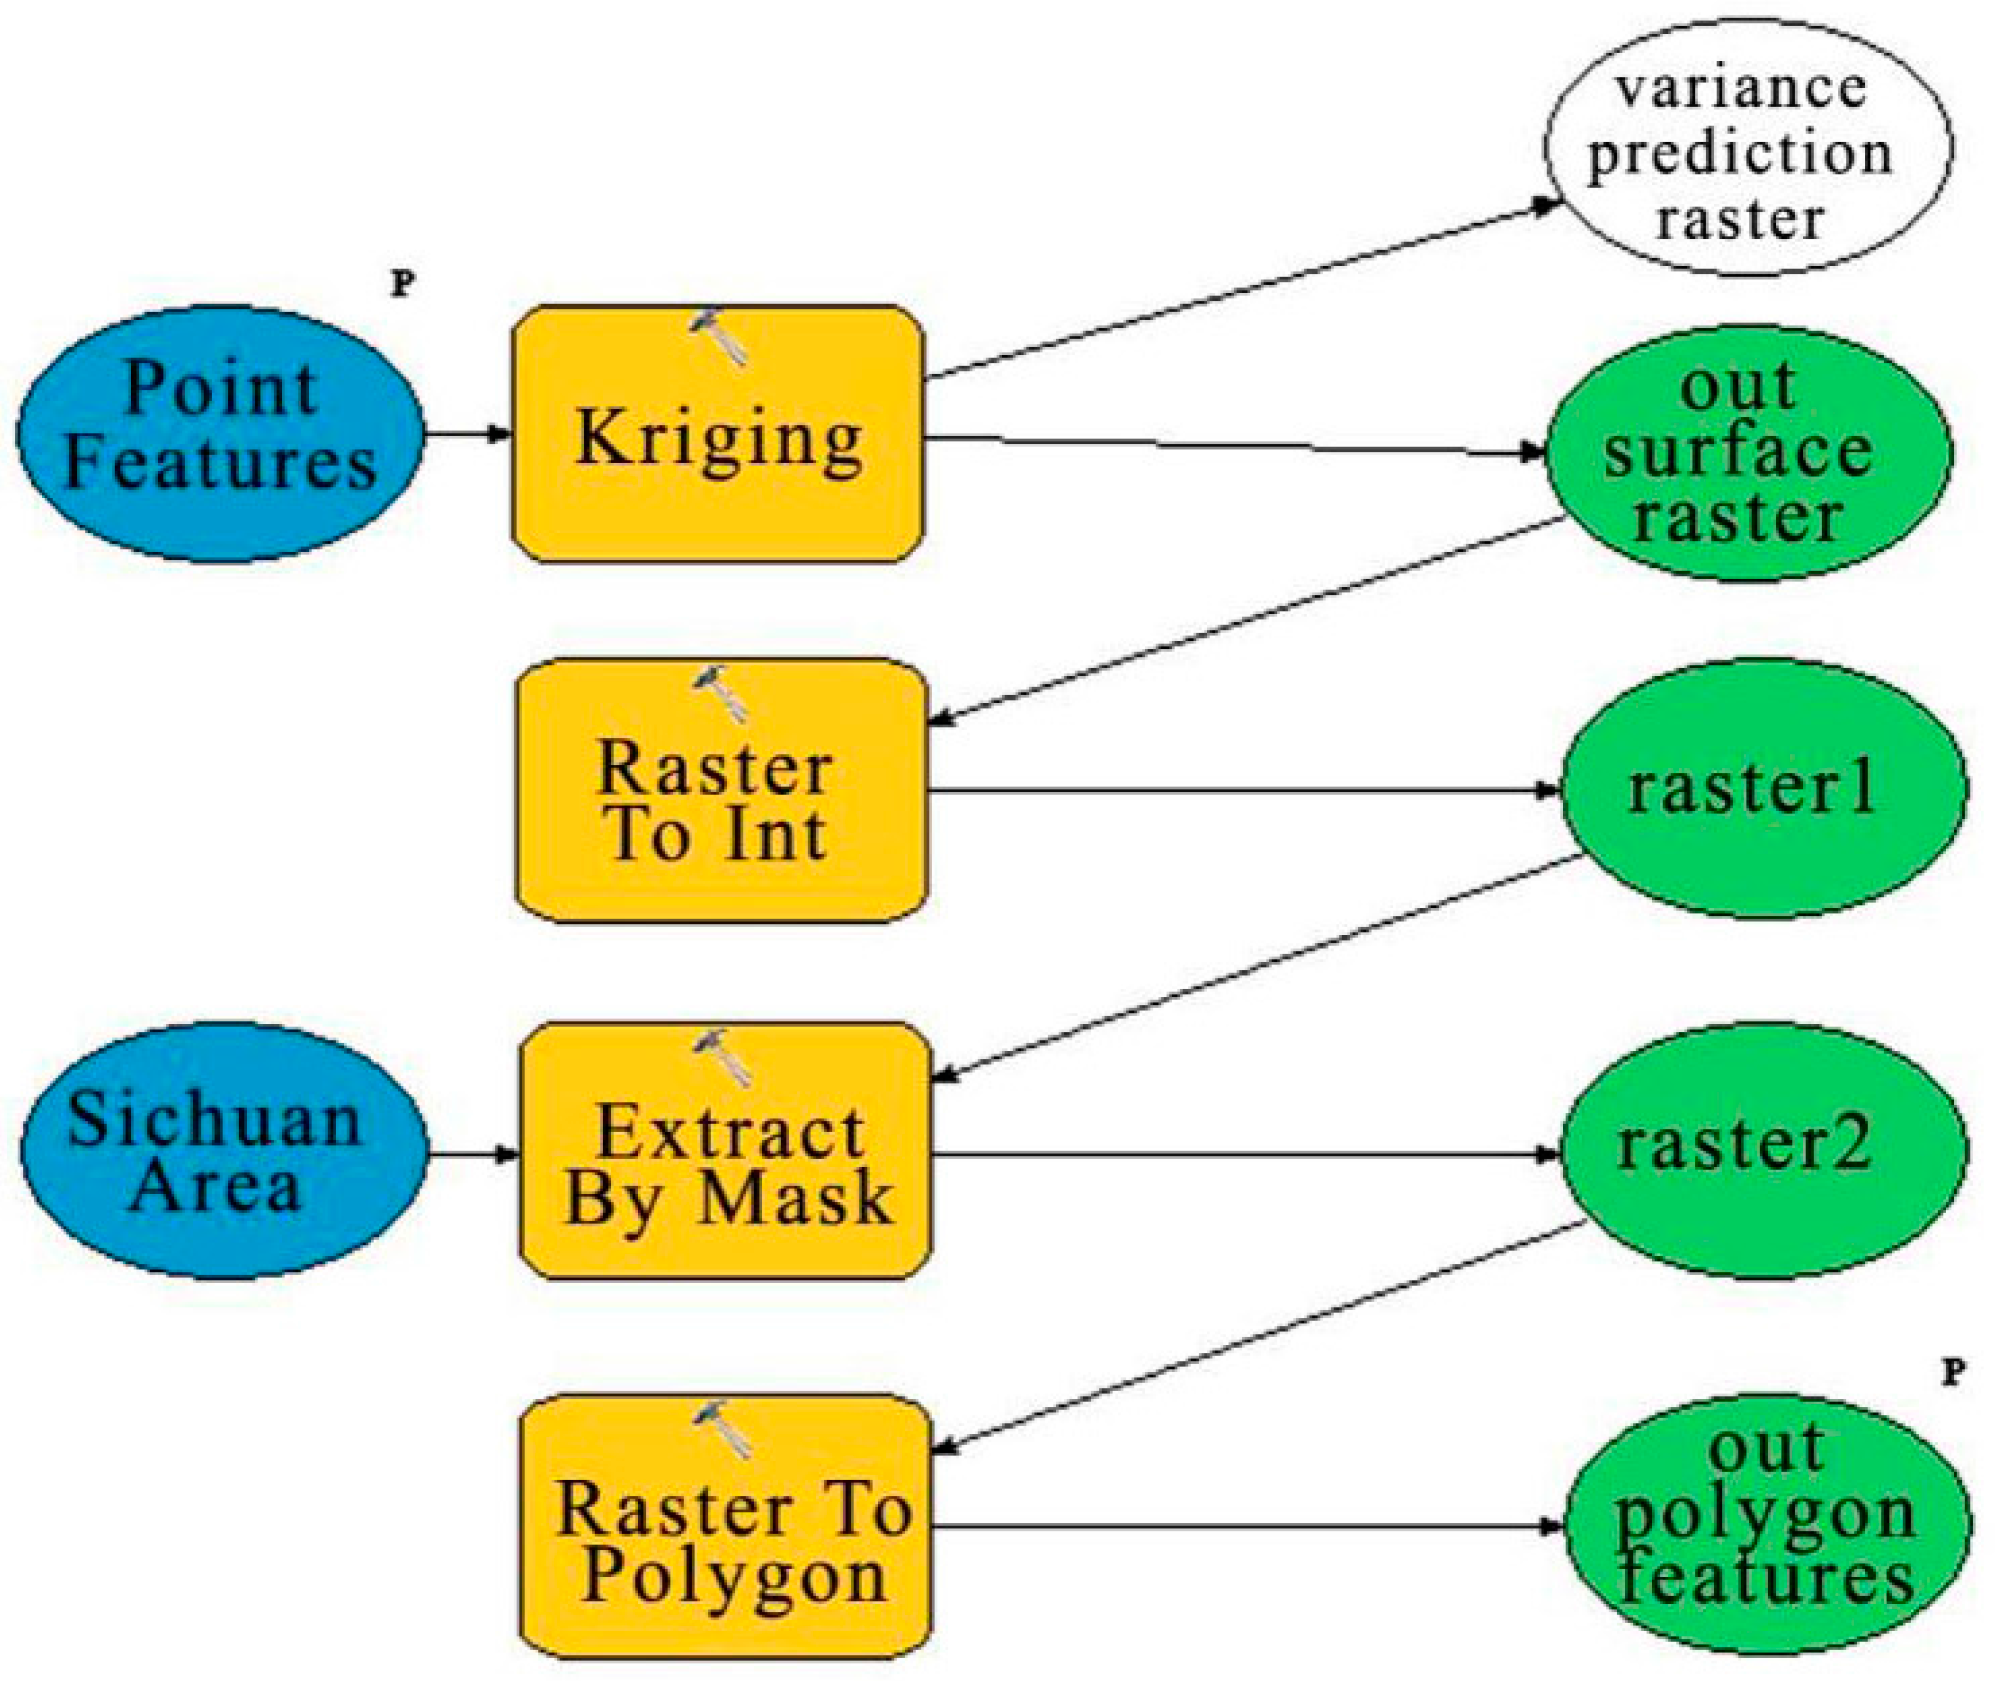
The core function of the system is the geoprocessing (GP) model that is released by the actuator, including the interpolation of geoprocessing services, query GP services, and early warning–judgment geoprocessing services. The interpolation of GP services (
Figure 5) used a Kriging interpolation model established by the ArcGIS model builder. After completing the operations of inputting parameters, integrating the grid, masking the region, and transforming the raster to feature, we output data in the form of a polygon and overlap layers in the client. The structure of the interpolated GP model is shown in
Figure 6.
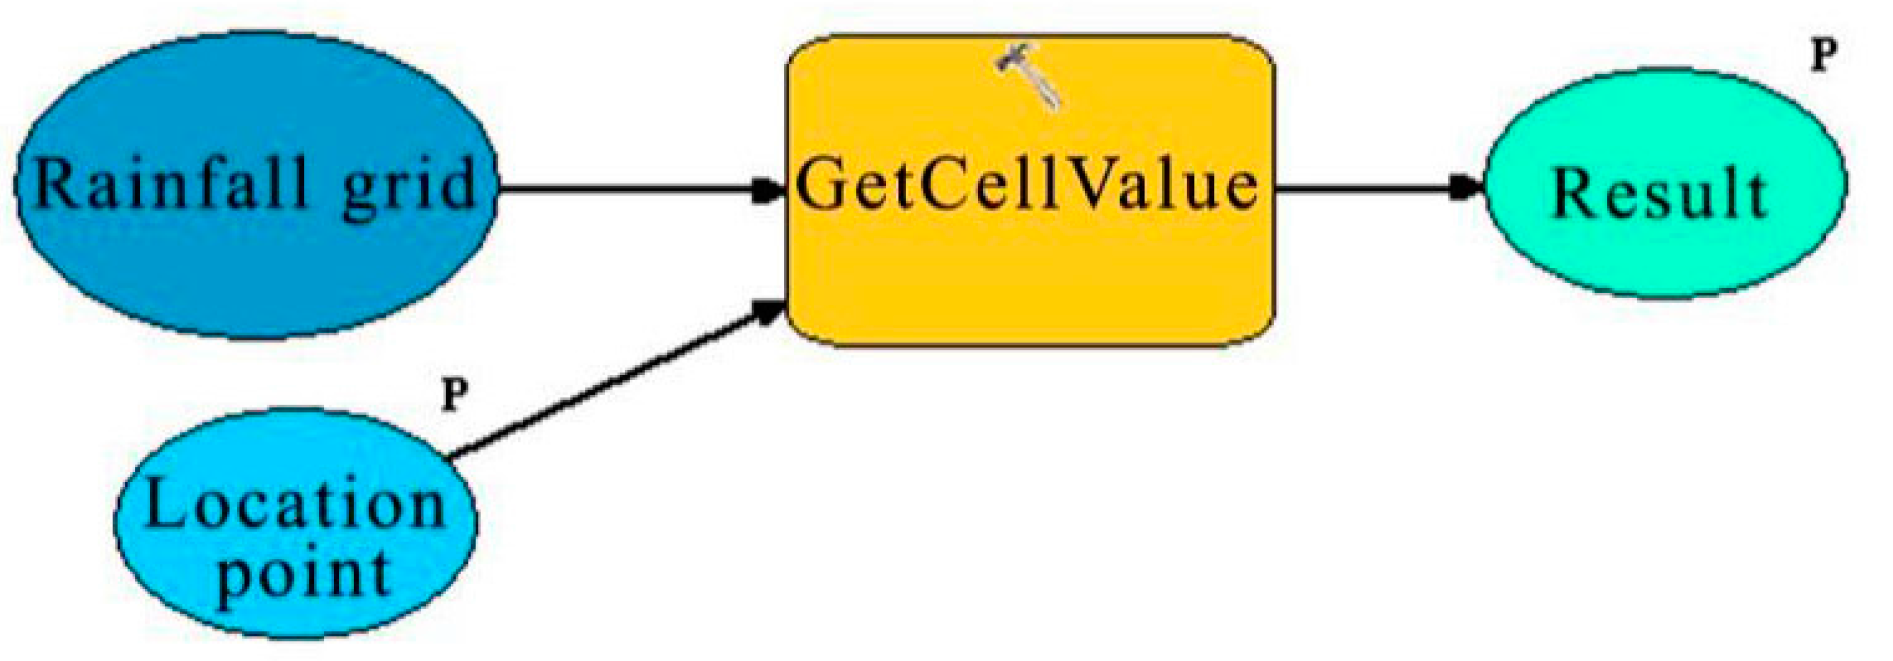
The query GP model (
Figure 6) can query the attributes of all layers and location data, through which we can query rainfall, population, economic losses, and some others. The location parameter in
Figure 6 is the most important parameter to get the result. When a query is initiated by the proscenium, the location parameter can be sent to the task manager and formatted as a dataset in MapPoint format, then sent to the GP actuator. The GP actuator can acquire different values by choosing an index from different layers for different requests.
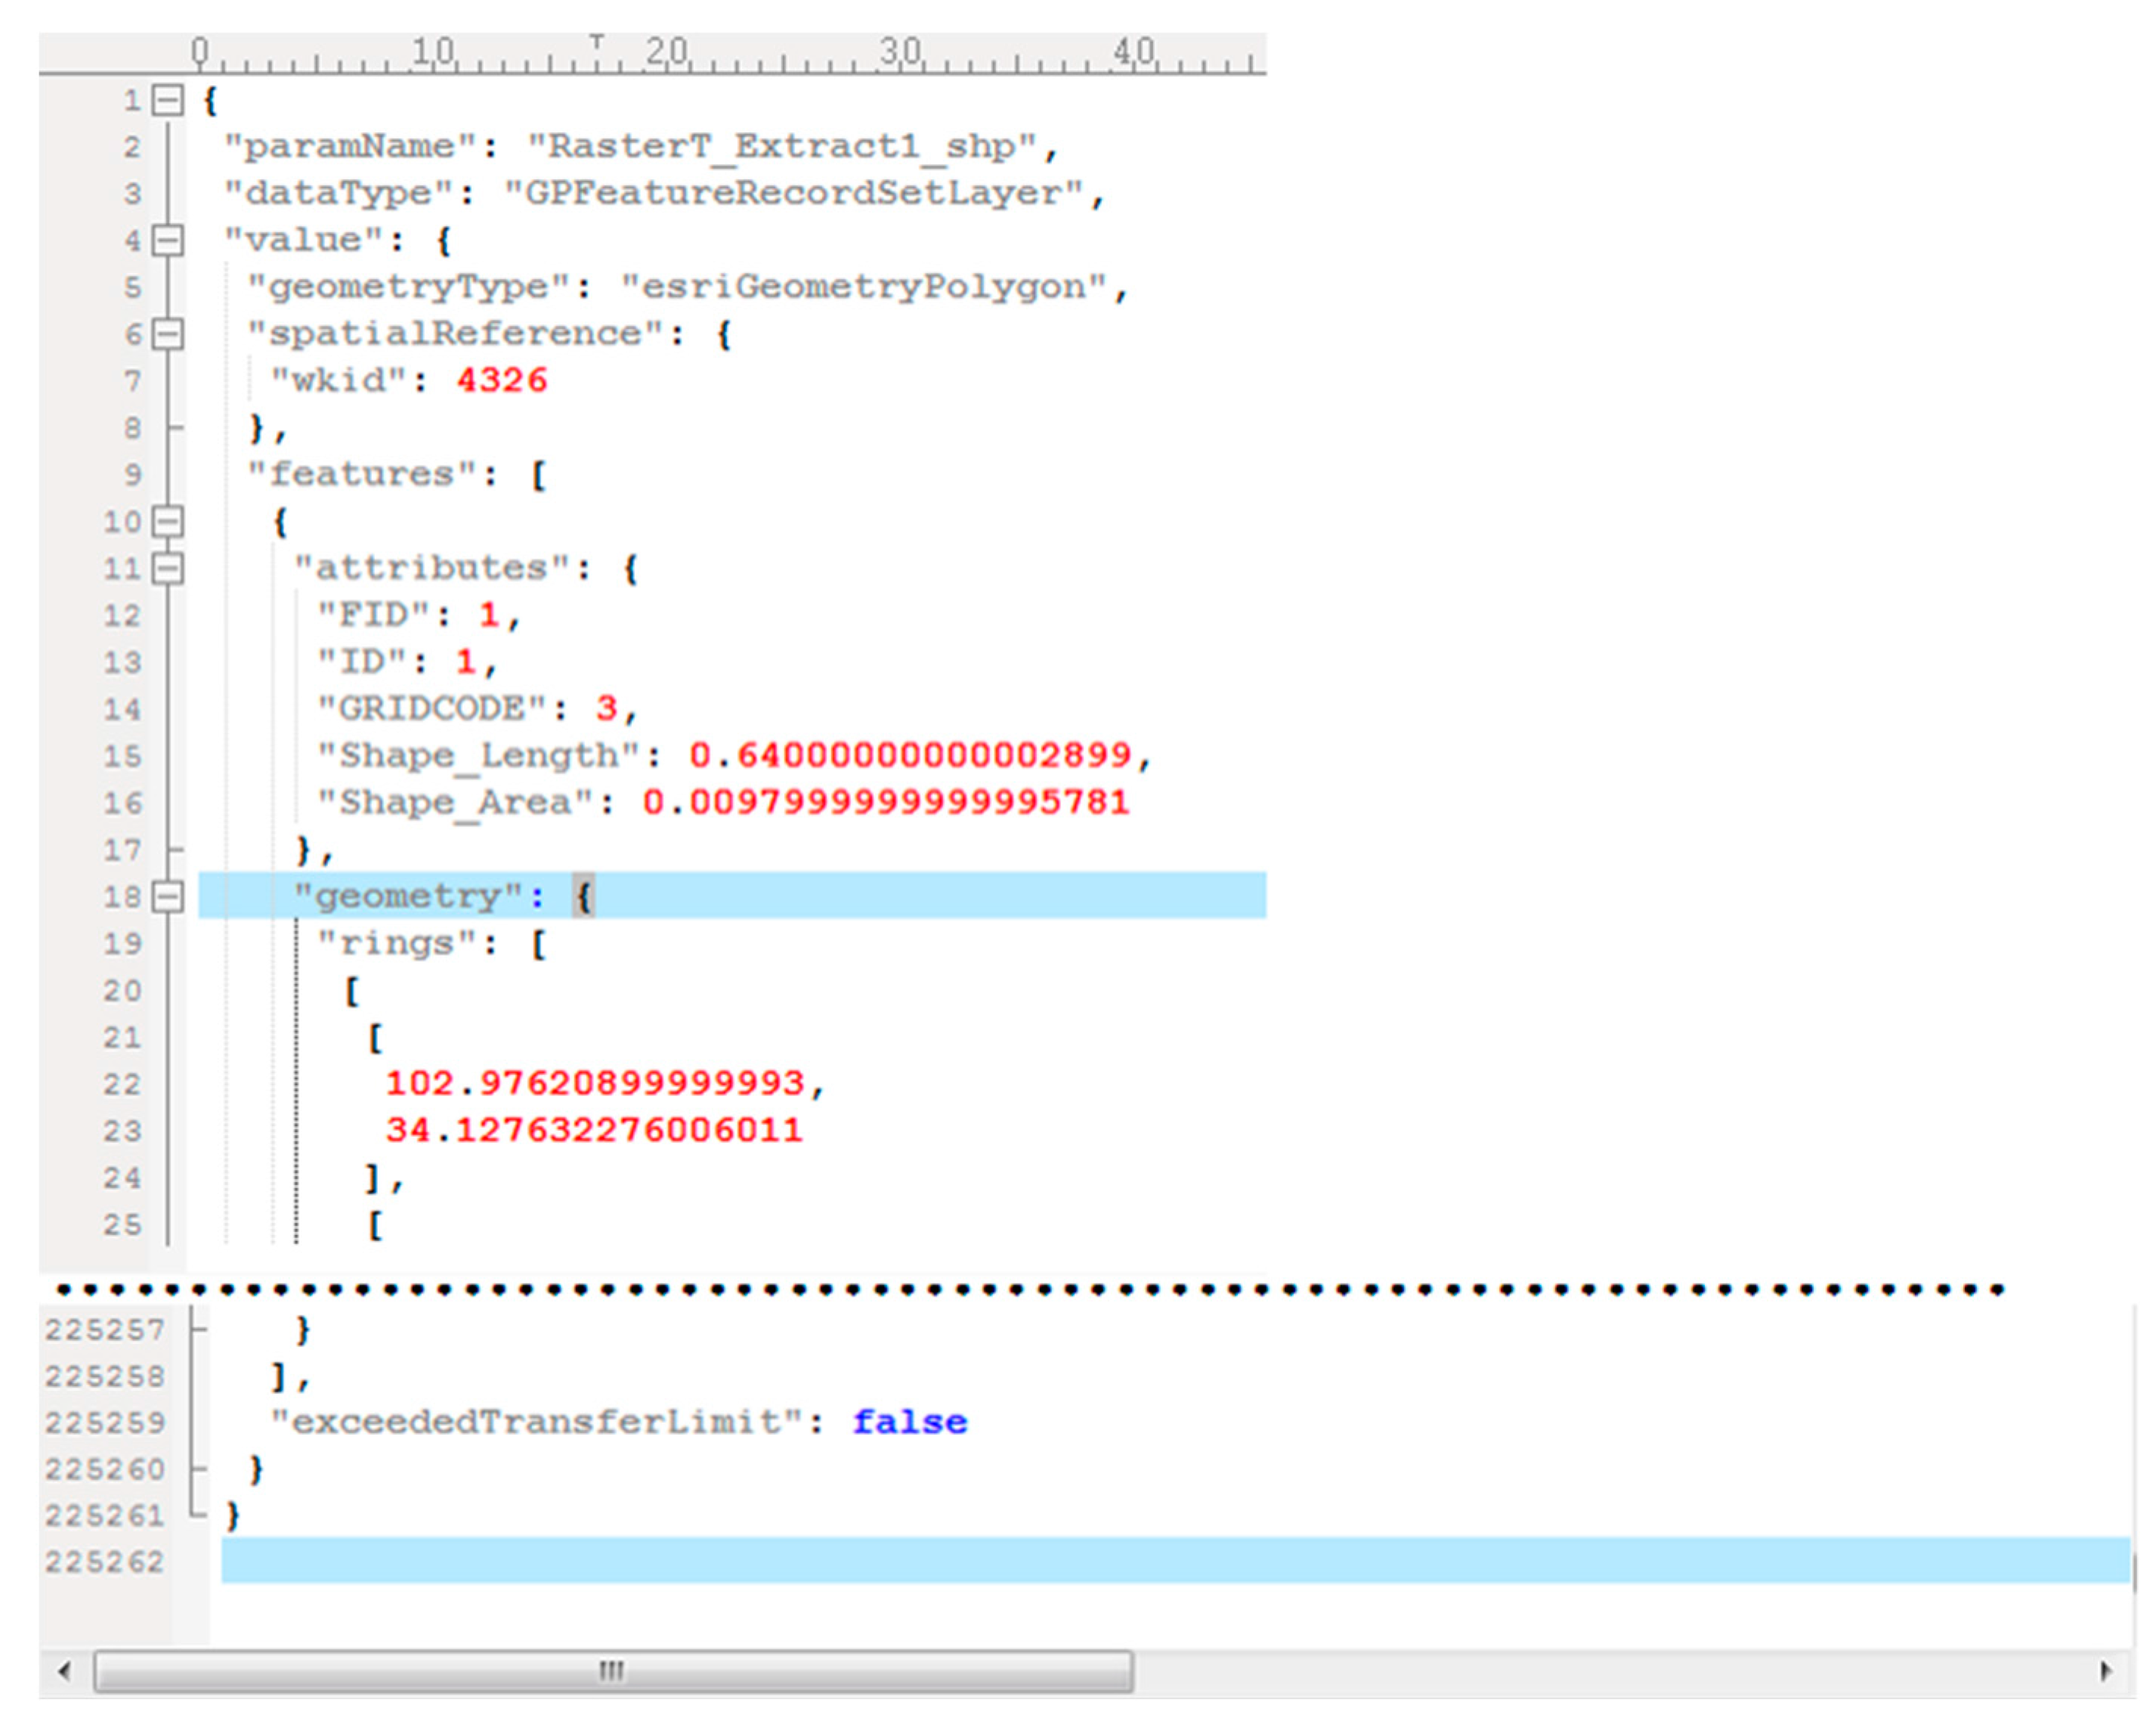
The operation of passing parameters is restricted in the Web client, and the transmission of raster data cannot meet the requirements of timeliness. Therefore, in the DSS process, we send a formative dataset in JSON format. For ArcGIS REST API can only use the GET method, which utilizes a URL to send parameters and submit data, though the size of the data parameters is highly restricted by the browser and operating system. So, we override the submitted part of the HTTP of API using the method of POST (Algorithm 1;
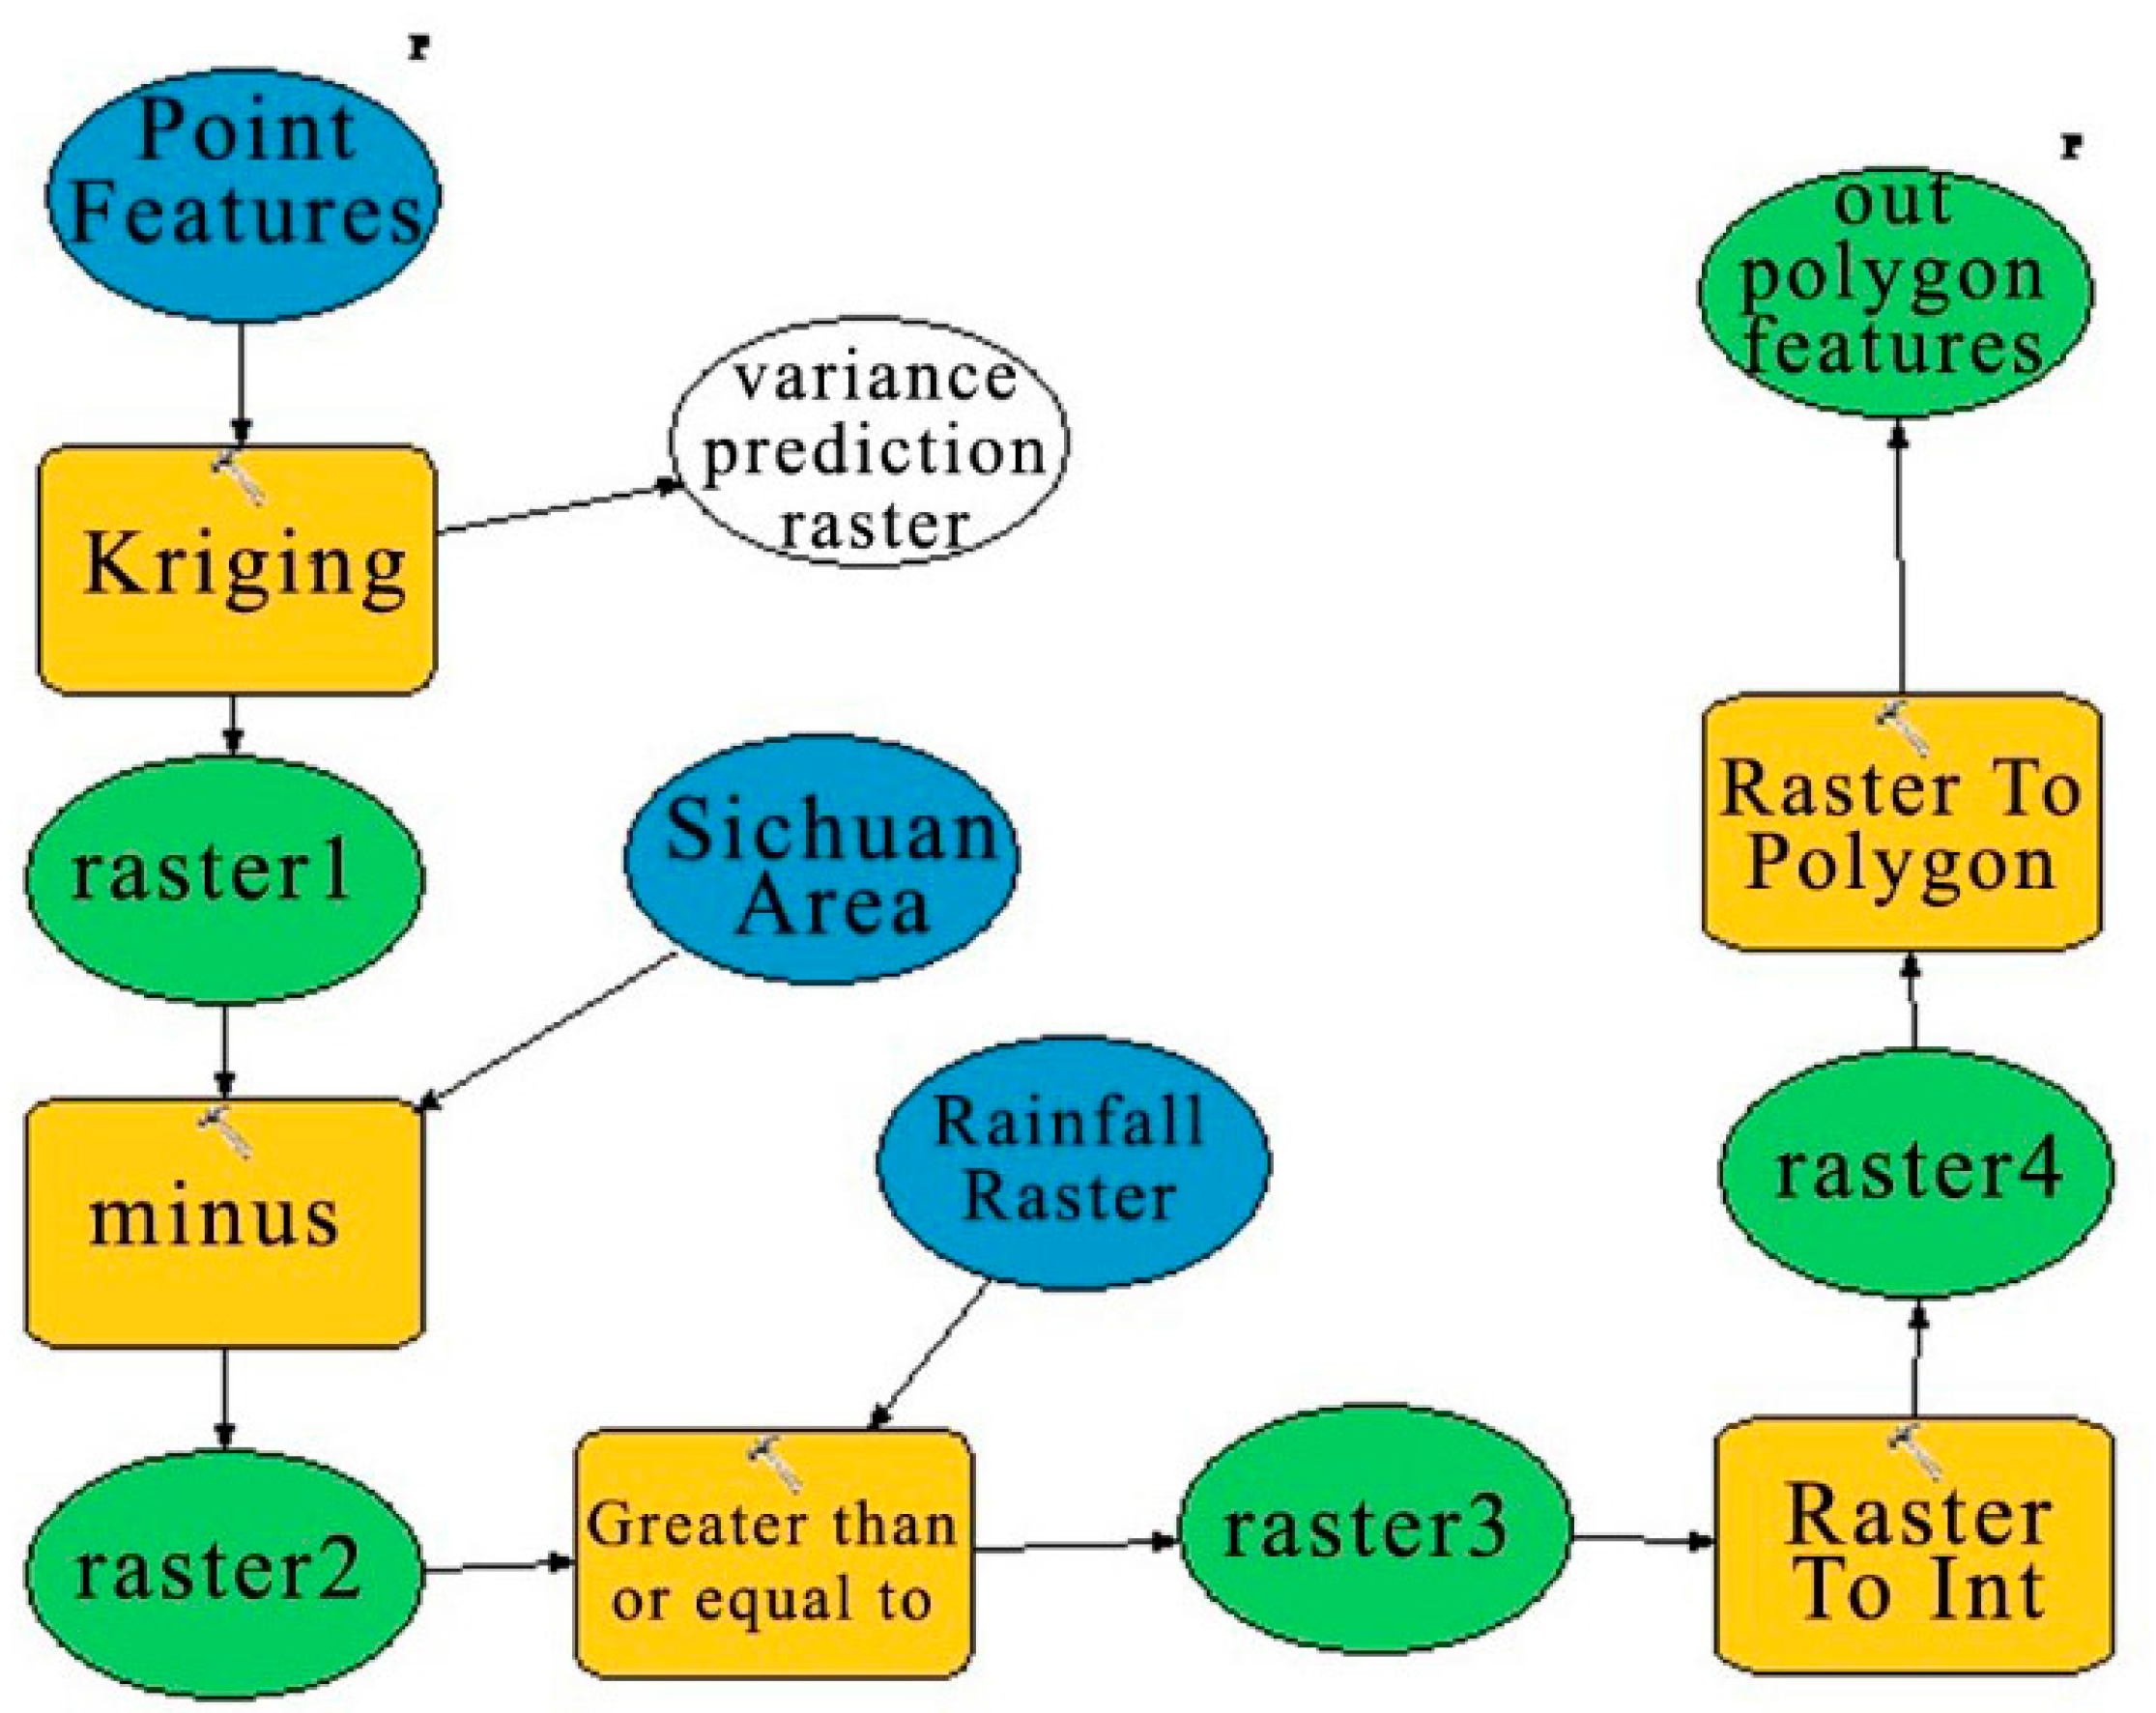
Figure 7). Warning–judgment geoprocessing services compare the 1-h and 24-h real-time rainfall raster data after interpolation with the grid data of average annual maximum rainfall and extract the region where the rainfall is greater than average, then transform the data into a vector polygon file and send the data back to the client. The process of the warning–judgment GP model is shown in
Figure 8.
| Algorithm 1. Code about formation JSON with POST method and encode feedback data. |
Procedure submitPointFeature()
For PointNumber= 0 to PointArry.length
URlRequest.HTTPparameter add PointFeature /* add all PointFeature to parameter with ArcGIS format*/
JSON.encode(HTTPparameter) /* Encode to JSON format */
addEventListener
when GPService.complete
JSON.decode(Result) /*decode result when GP executor complete task */
URLRequest.post() /* Post a URlRequest with URL*/ |
The DSS proscenium is based on Flex and ArcGIS REST API, and adjusts the alpha value to 40–50% to optimize the coverage effect when drawing a graphic layer. By releasing the geoprocessing services to the ArcGIS Server and completing the backstage deployment of the warning–judgment module, users can receive rainfall warning information at the map canvas in regular time.
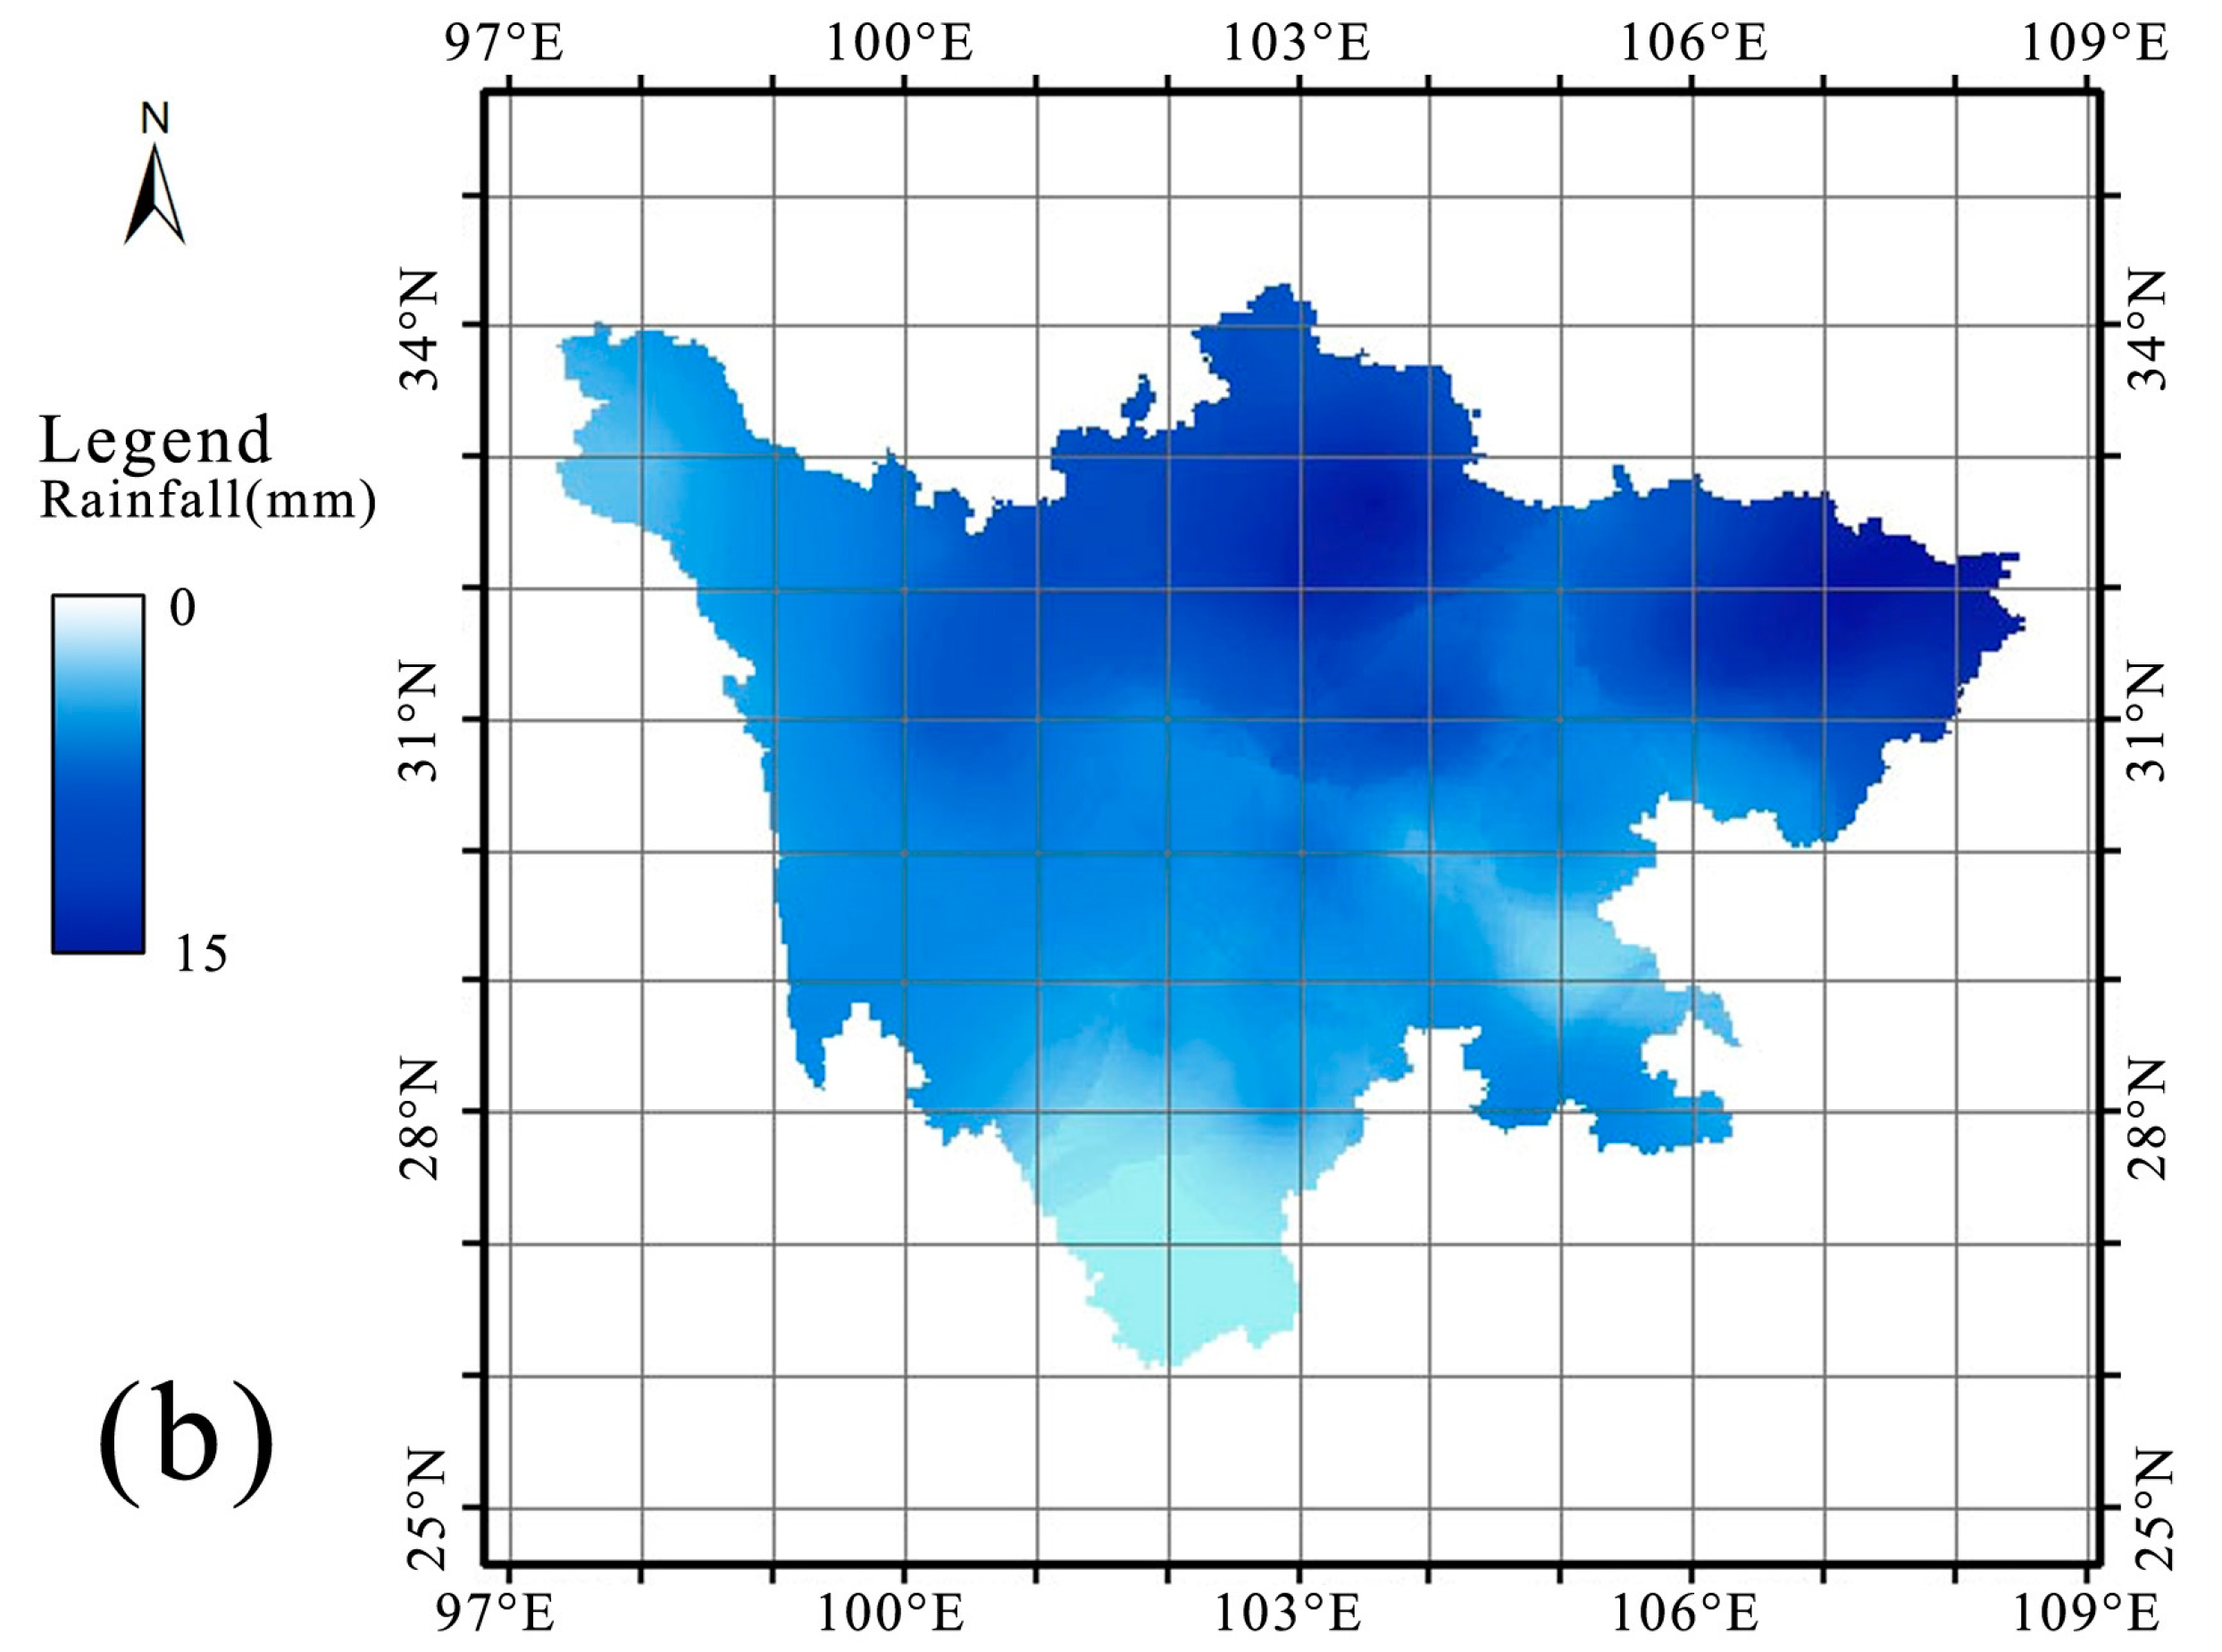
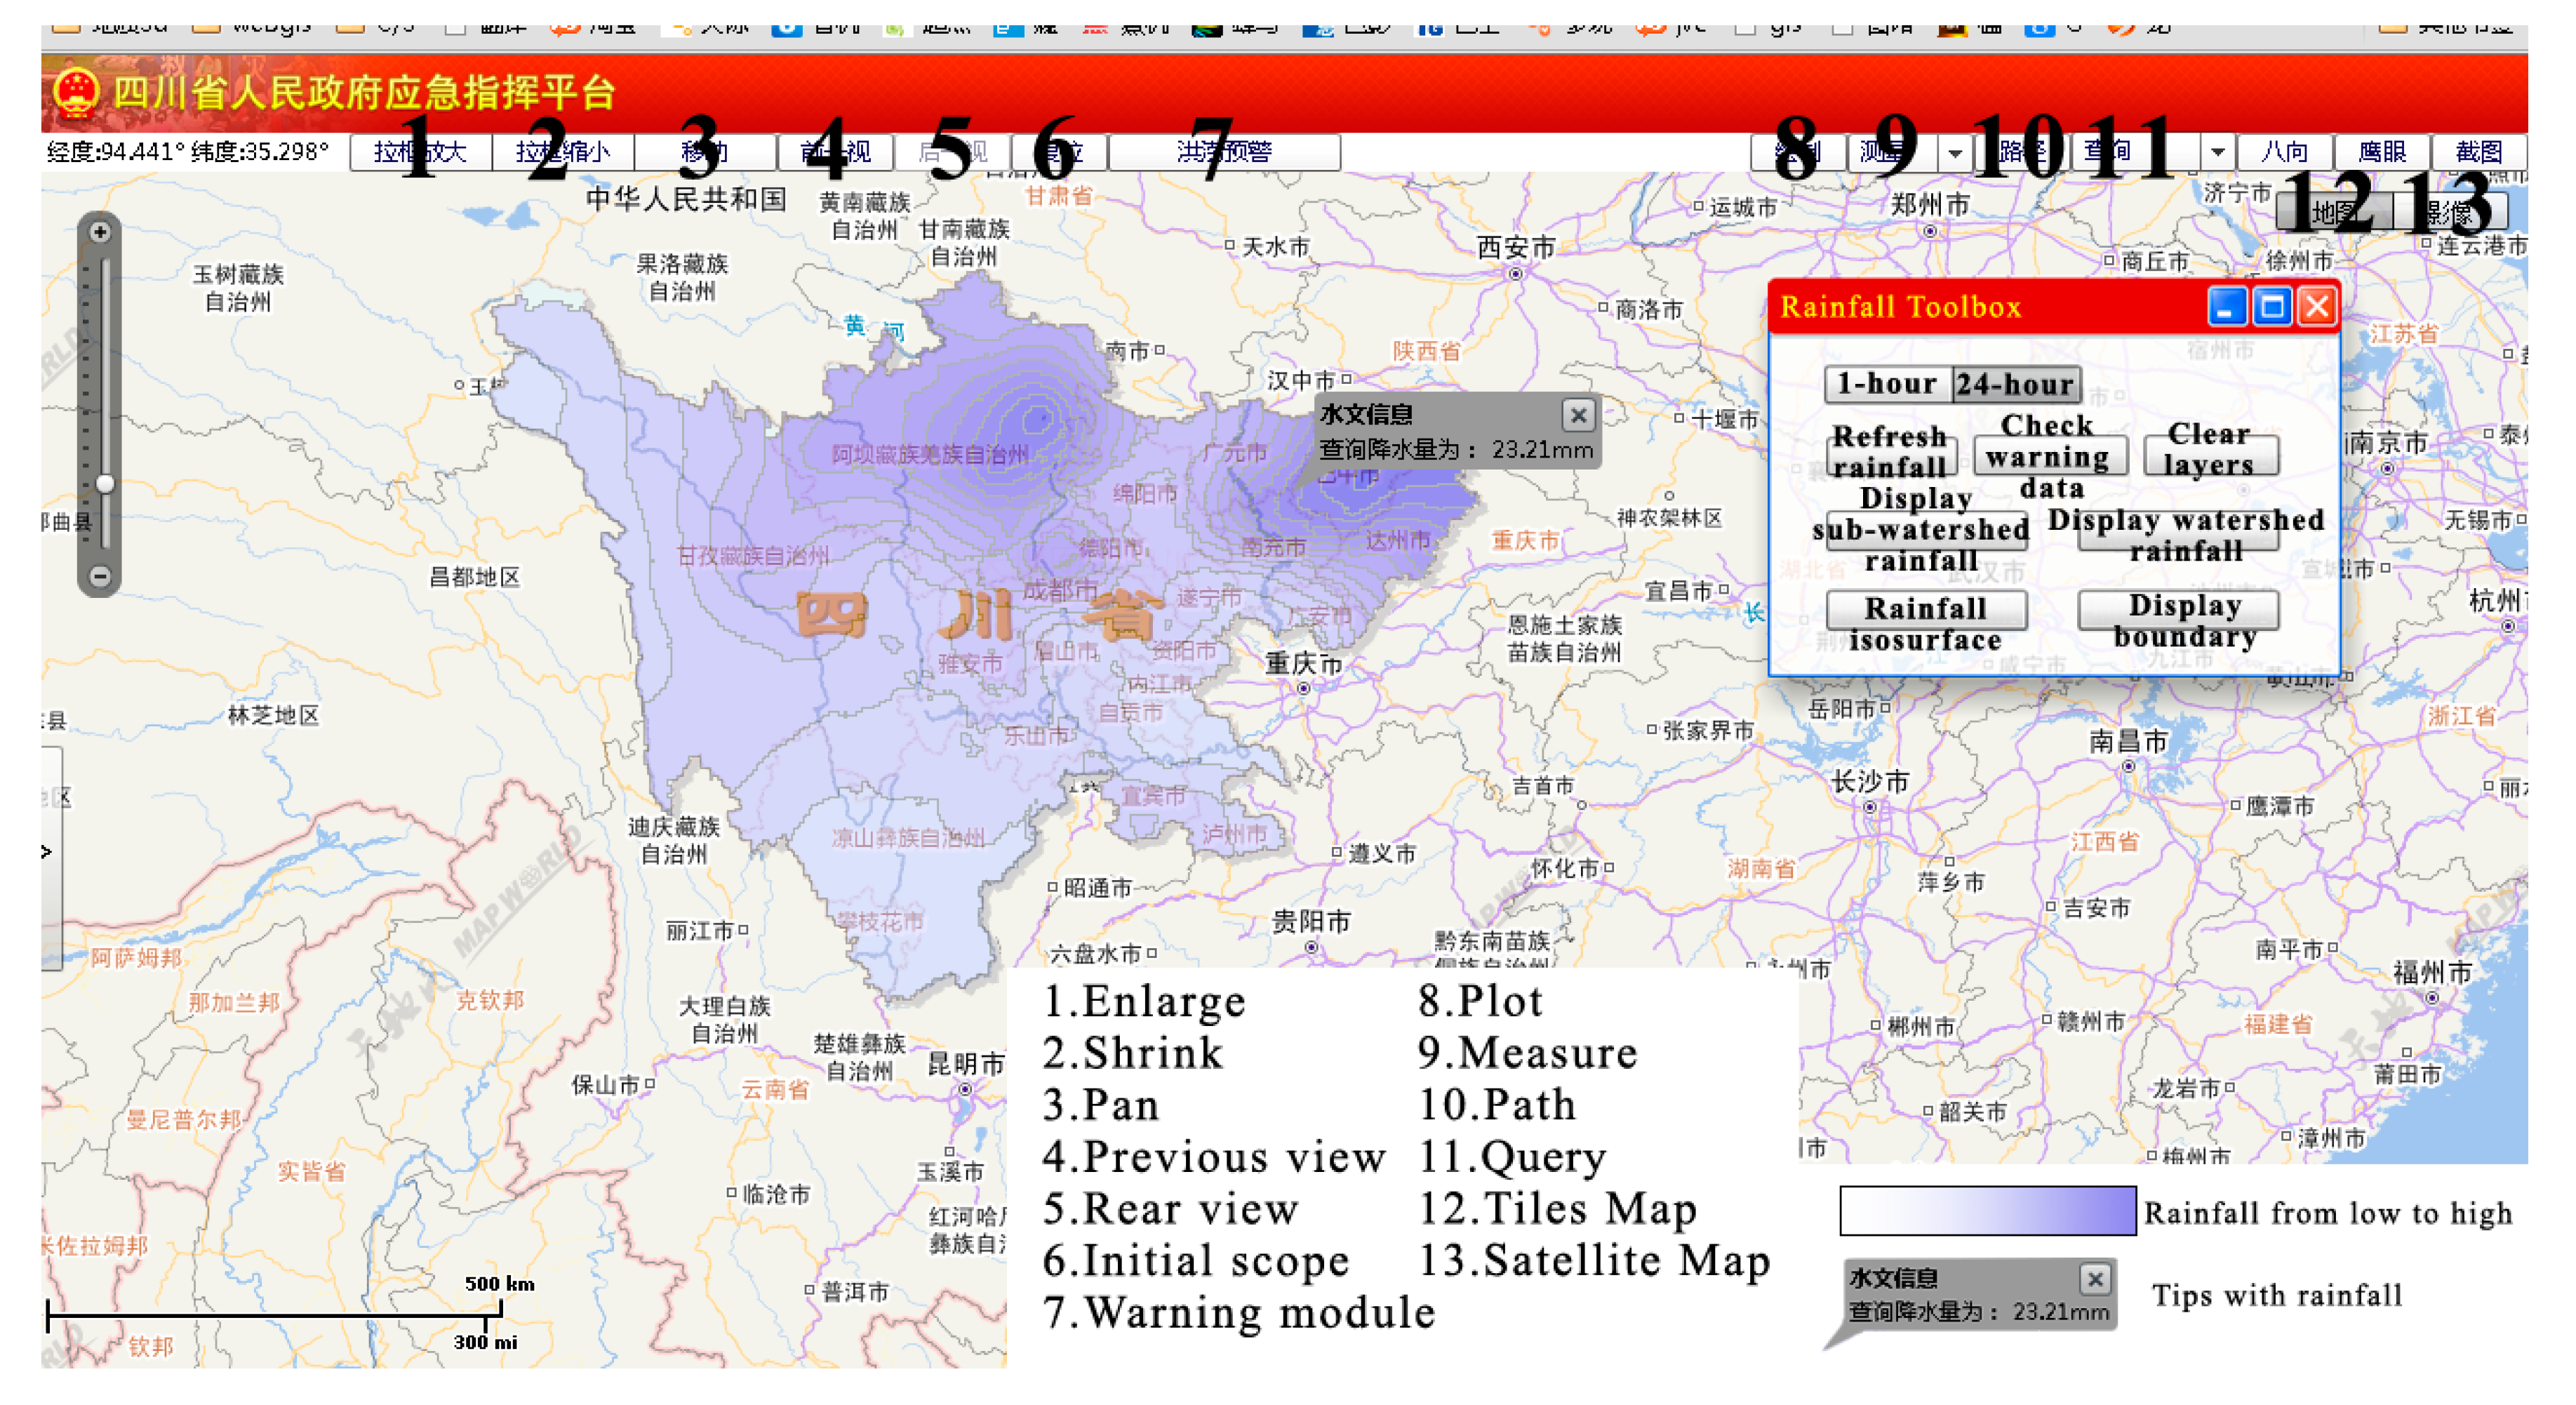
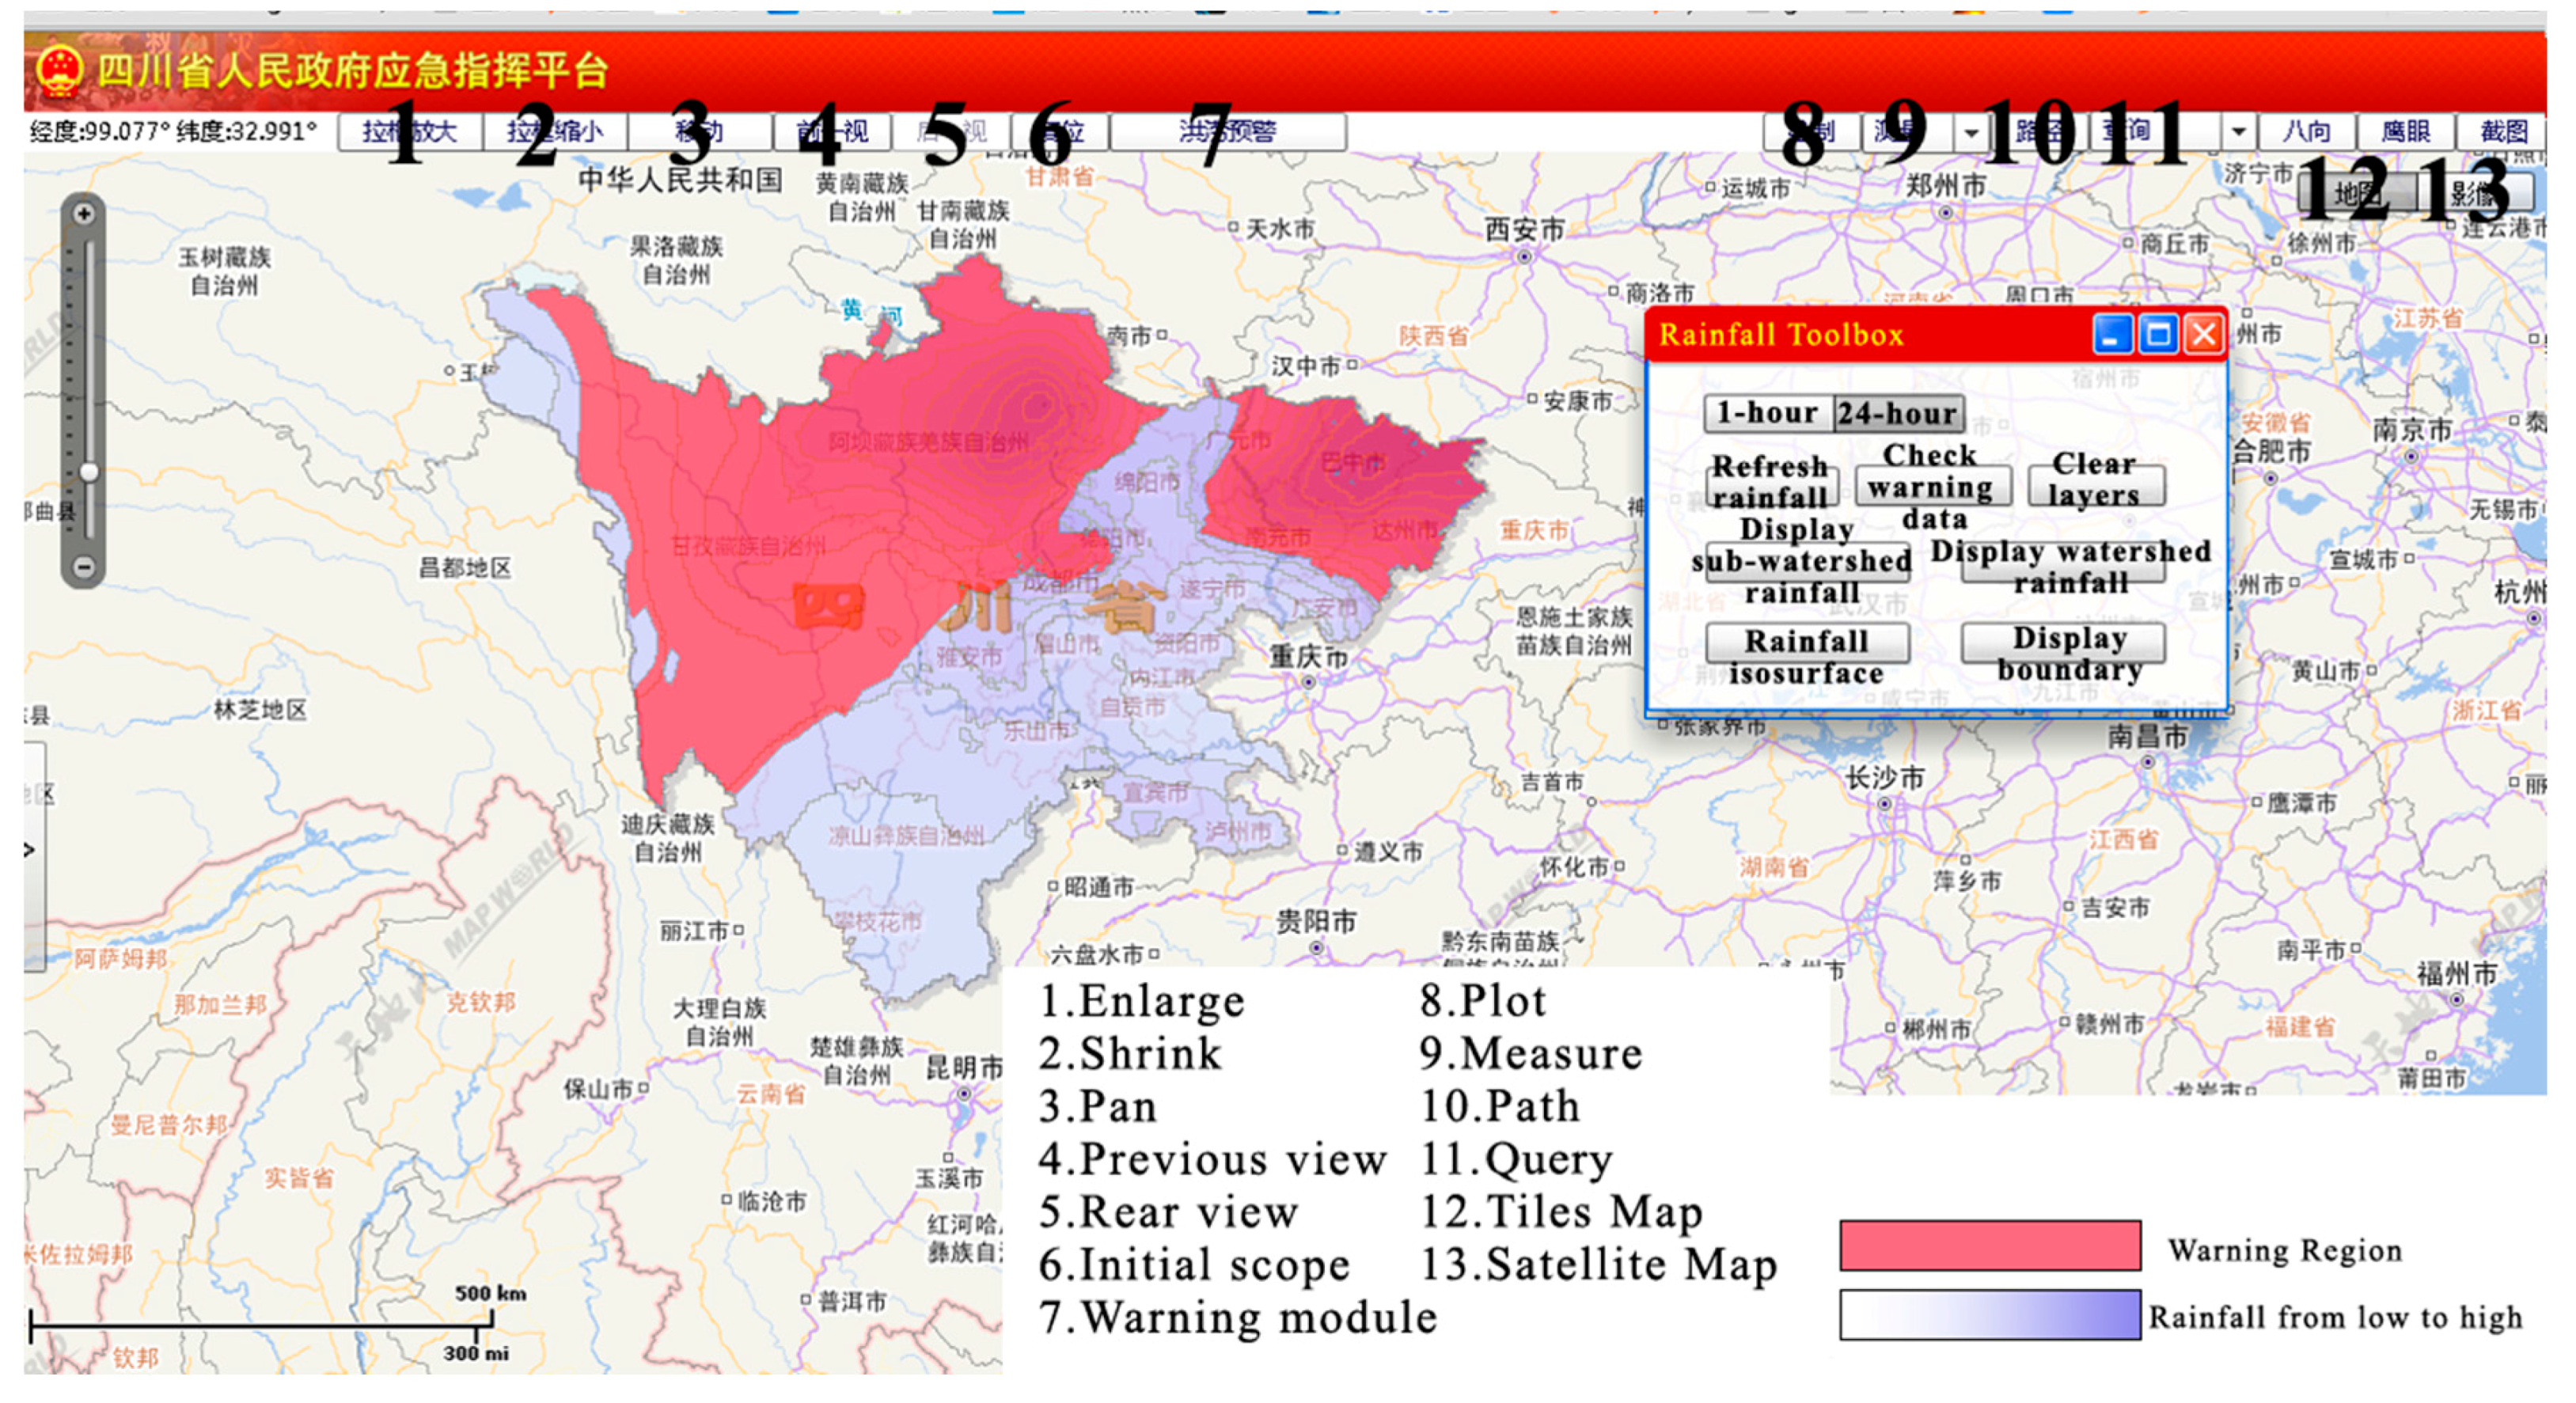
Two figures show how rainfall is shown in the rainfall warning module of the DSS: rainfall data from low to high, and the overburden layer, from shallow to deep (
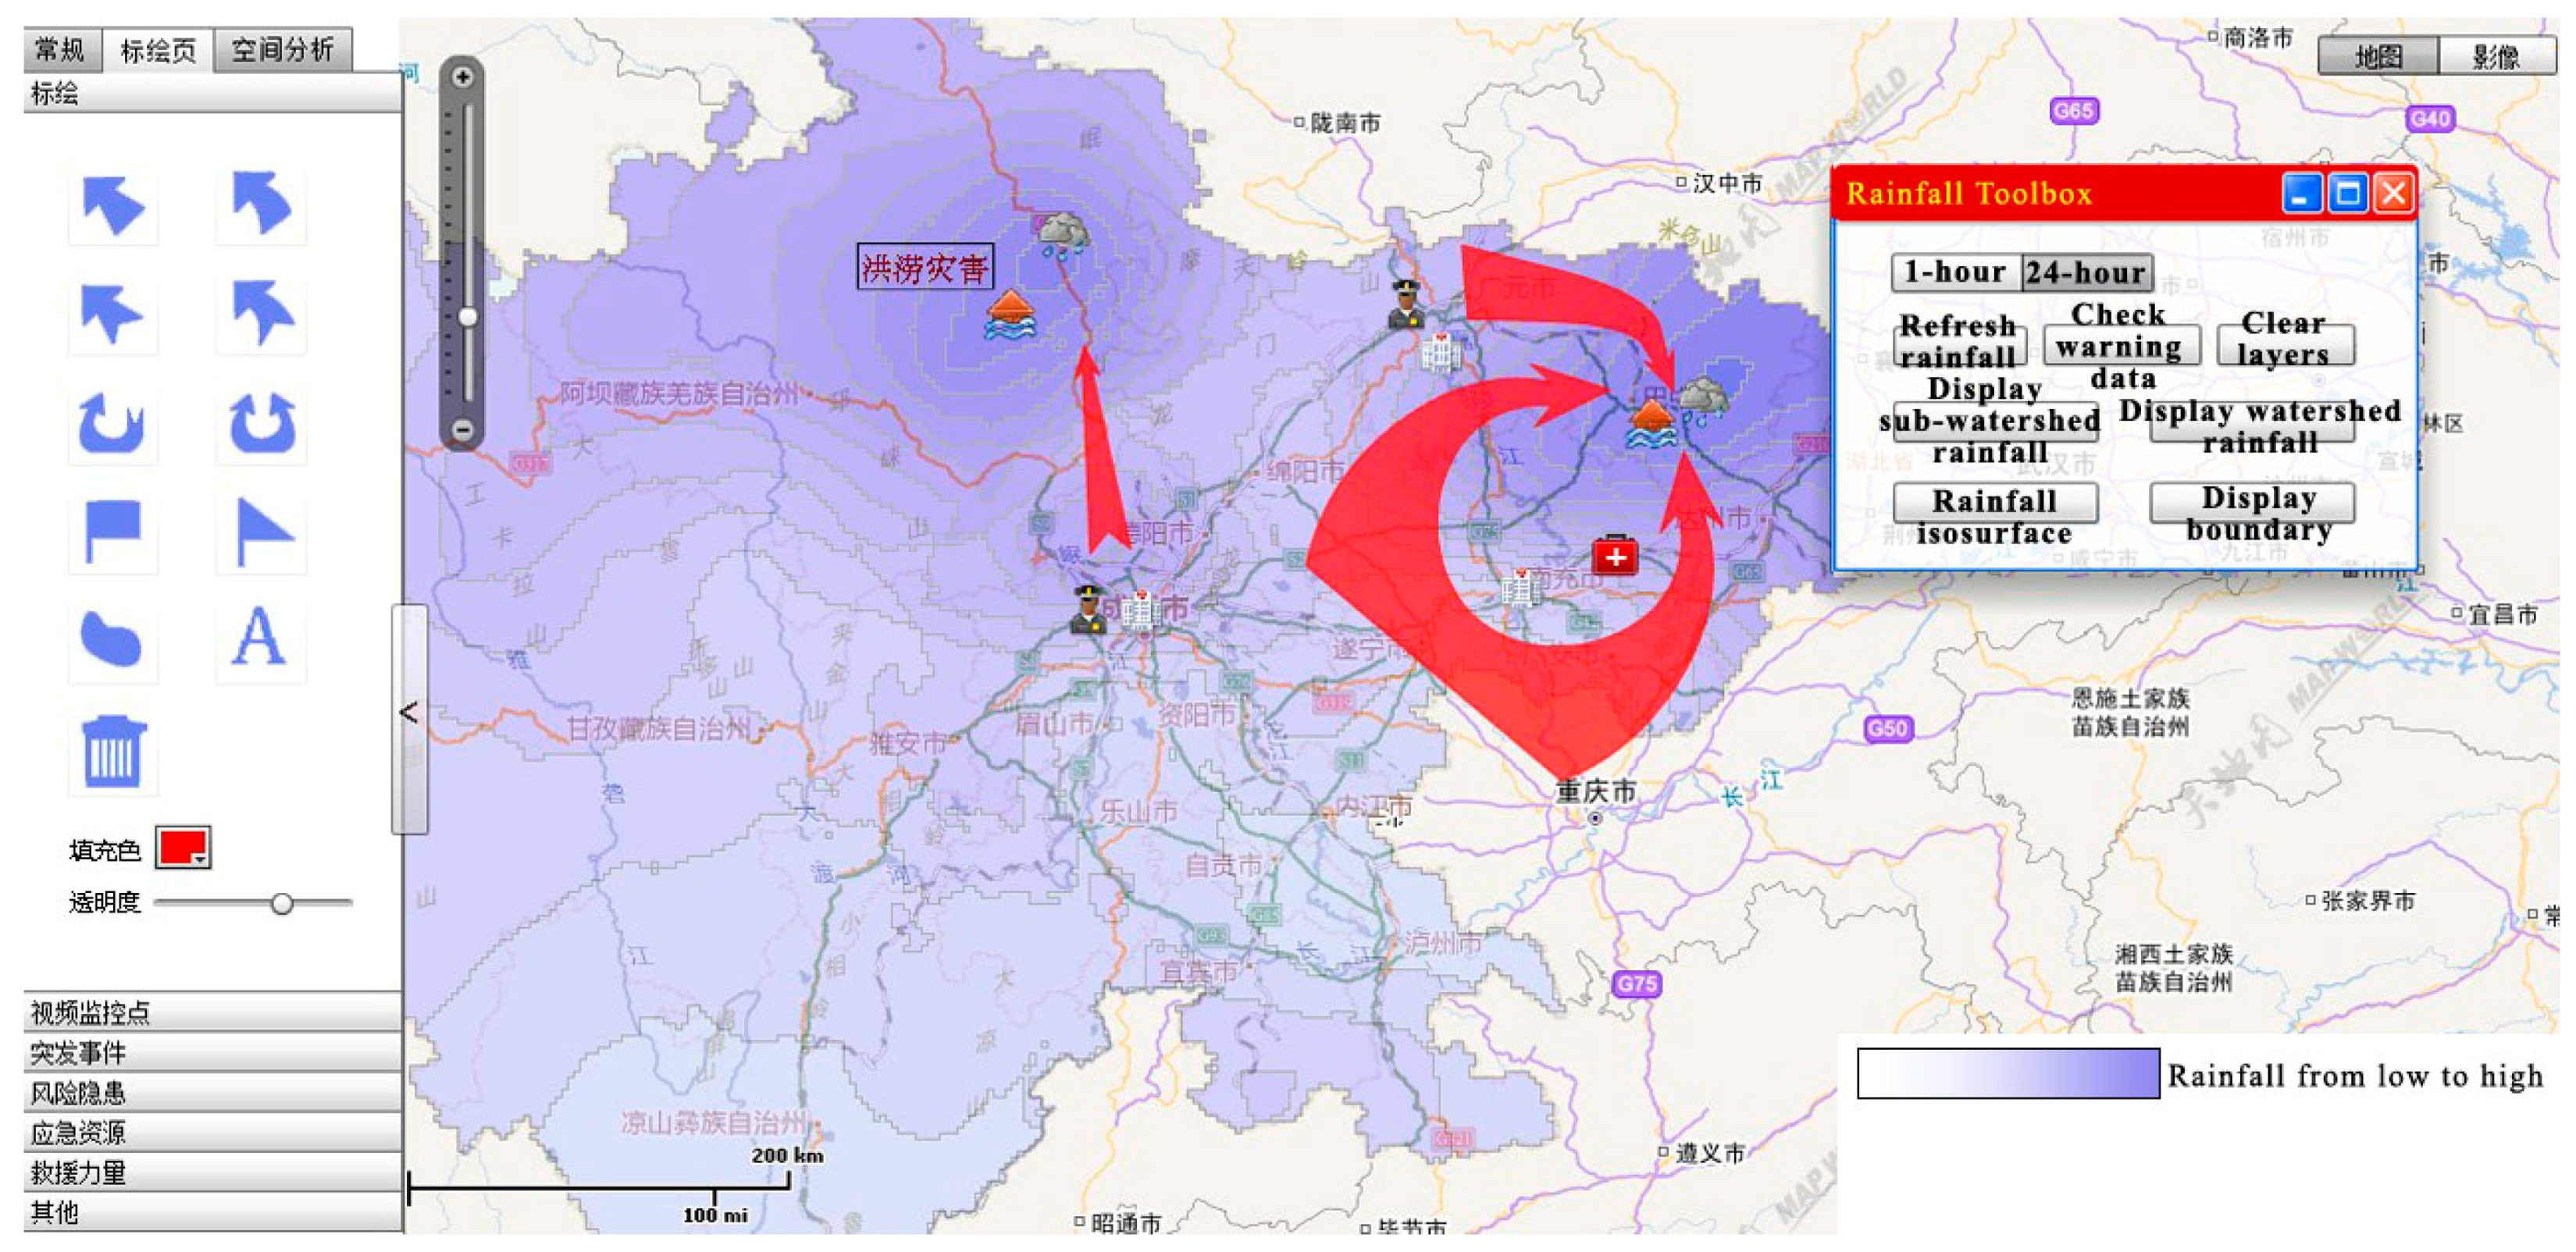
Figure 9). Rainfall “tips” can pop up when clicking the mouse on the layer. If the rainfall is enough to trigger the alarm, the warning area will be in red (
Figure 10). In this way, the rainfall warning–judgment process based on geoprocessing services is completed. Users only need to submit a request in the foreground, and the GP invoker will define the parameters of the geoprocessor, then the GP actuator will call on related data calculations, return results, and complete the task. By means of this method, DSS not only makes operation simple, but also separates presentation from calculation.
5. Other Functions of DSS
Likewise, DSS can realize complex functions with the powerful geographic processing ability of the ArcGIS Server by releasing different geoprocessing services to free a client from heavy computing tasks and allow it to focus on data presentation. After determining the rainfall alarm location, users can invoke the economic or personnel situation of affected areas with the loss–statistics module, or invoke the plotting module annotation arrow and landmarks, or use the path analysis function to find the best travel routes.
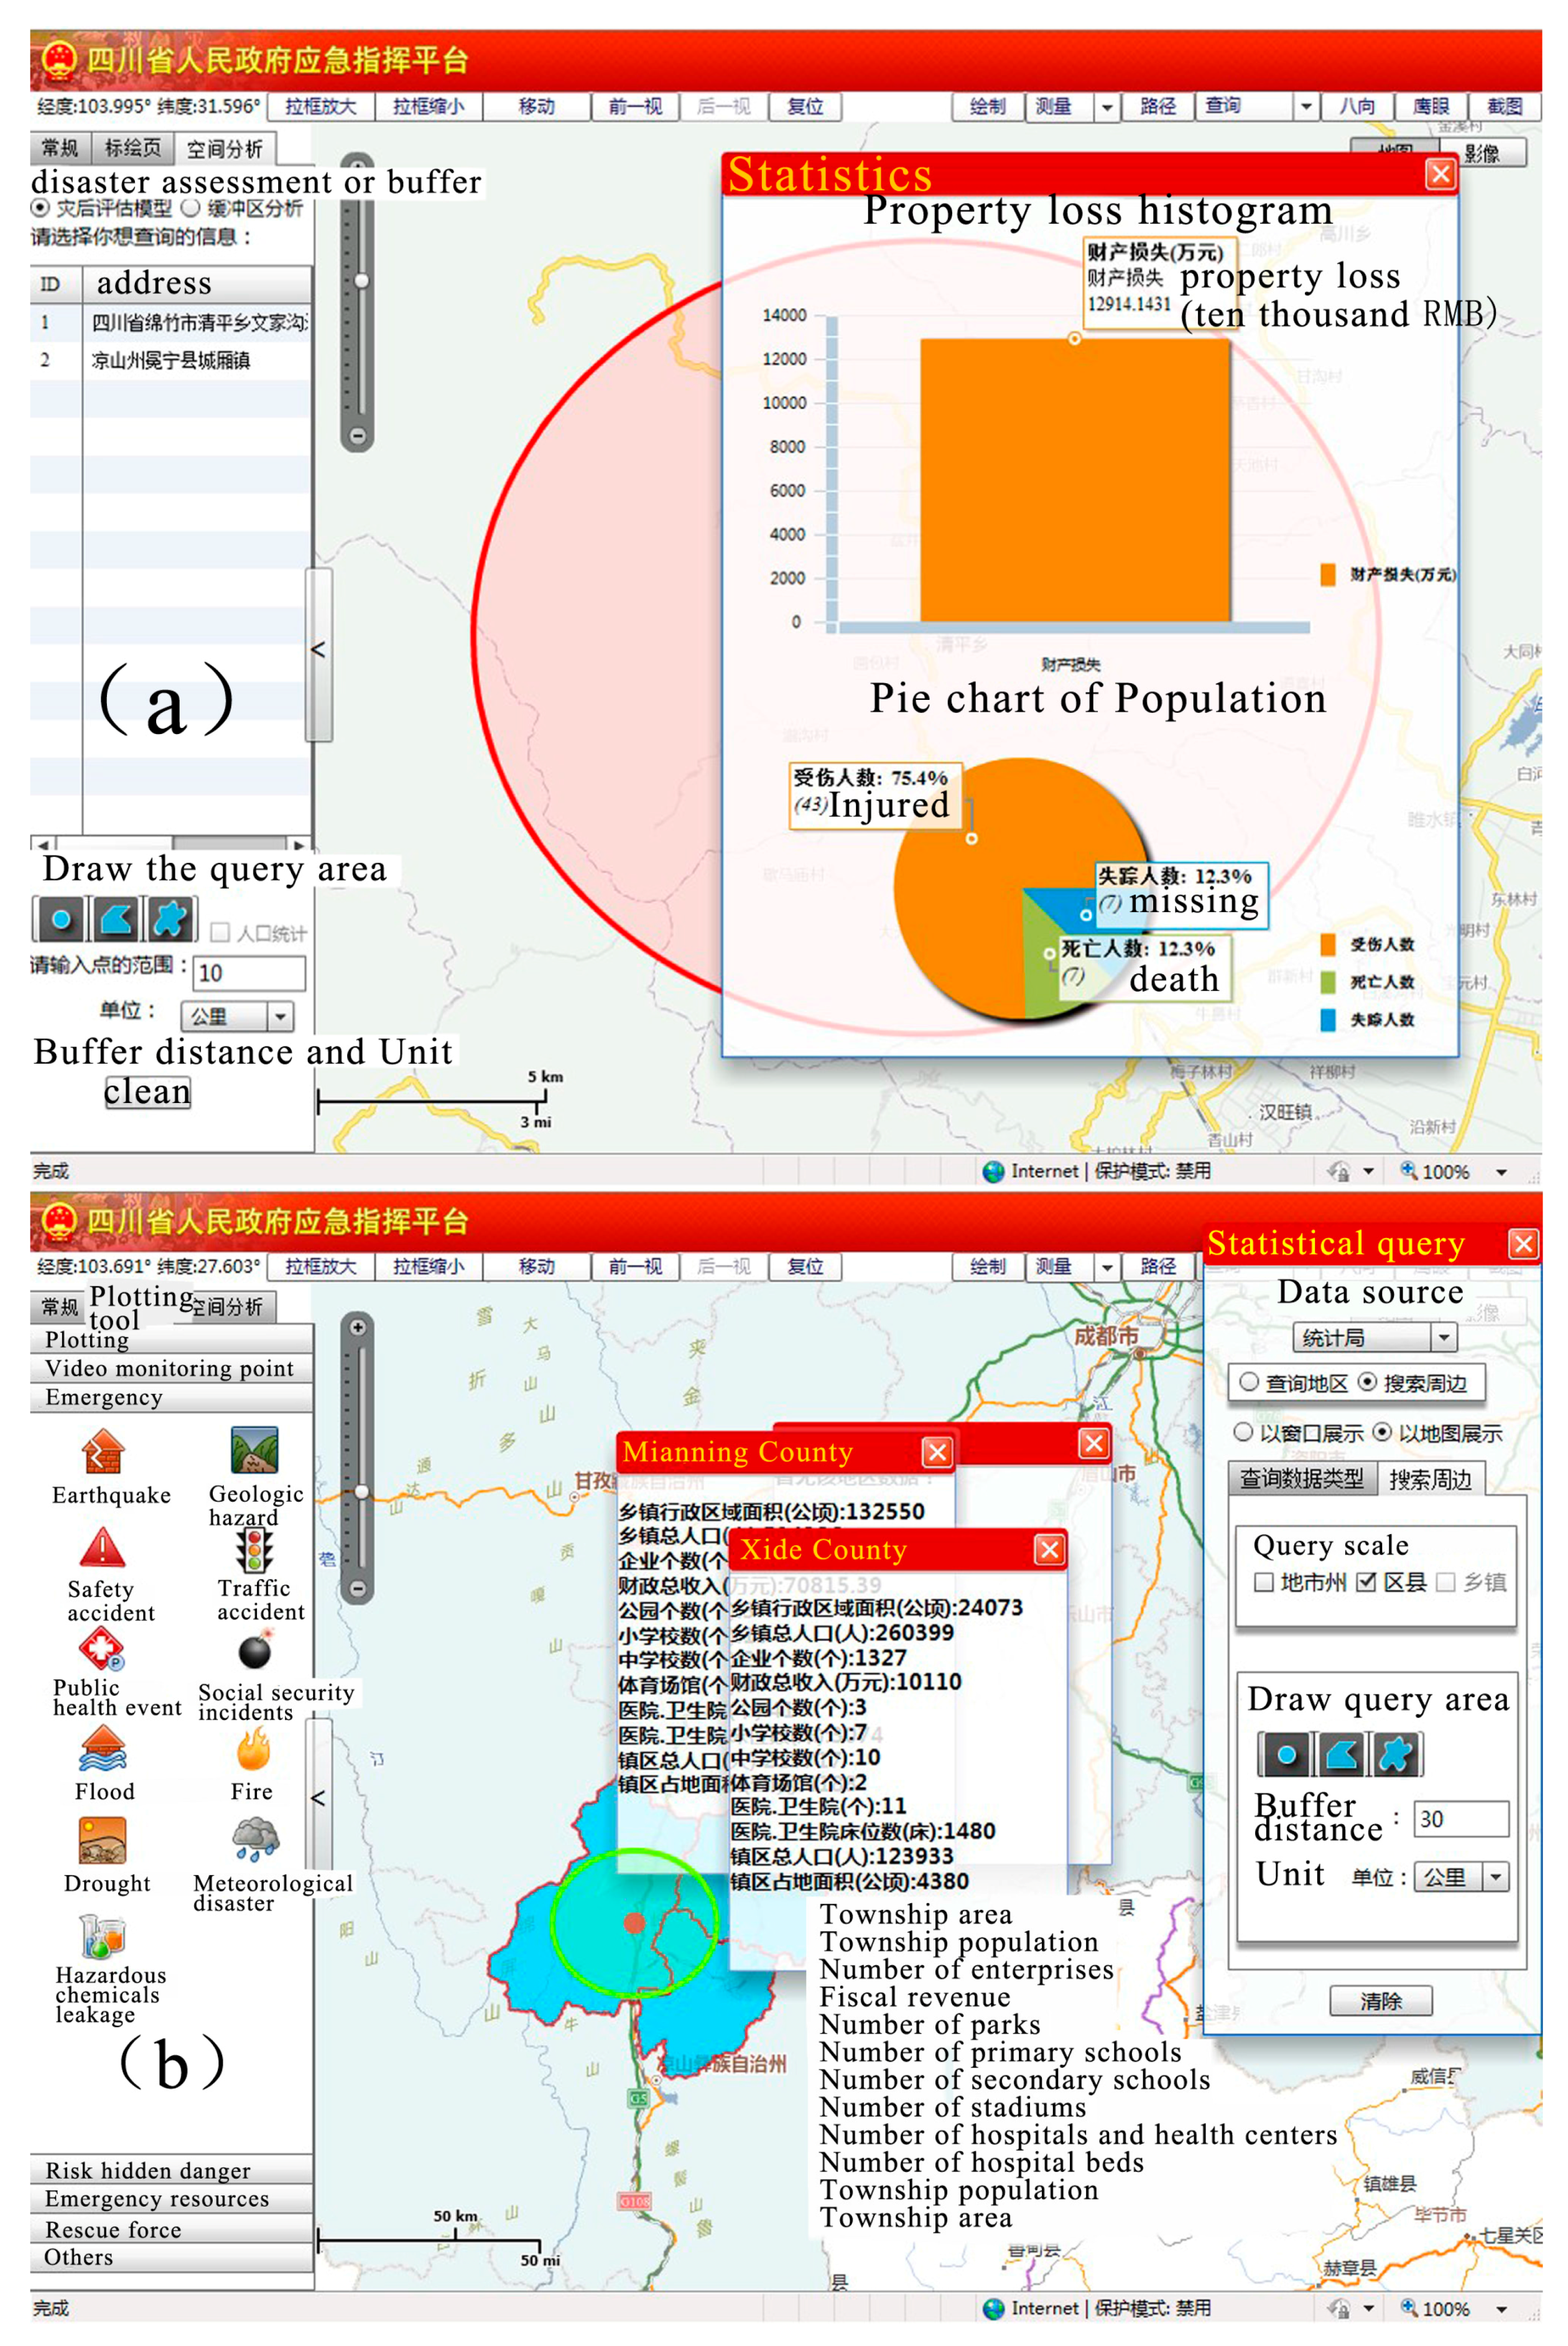
The statistics module (
Figure 10) is a simulation case for the warning–judgment module. After determining an appropriate buffer range and query topic, users send parameters by JSON to the ArcGIS Server and it executes; then, users can query the population and economic data of the selected region or selected administrative region through the geoprocessing services, which feed the results back in a chart or multiwindow (
Figure 11).
The map plot module (
Figure 12) allows users to make annotations on the map, including marking points, lines, and polygons, and labeling with customized fill colors, contour colors, line styles, and some other options. It can be used to mark the allocation of resources and for command and dispatch mapping and situation mapping. The plot module audits user permission. All levels of users can view and modify their own uploaded plotting, though low-level users cannot modify but can only view maps that high-level users have uploaded. All mapping data is stored as XML in the server by Webservice.

