A Comparison of Terrain Indices toward Their Ability in Assisting Surface Water Mapping from Sentinel-1 Data
Abstract
:1. Introduction
2. Materials and Methods
2.1. Study Sites
2.2. SAR Data
2.3. DEM Data
3. Methodology
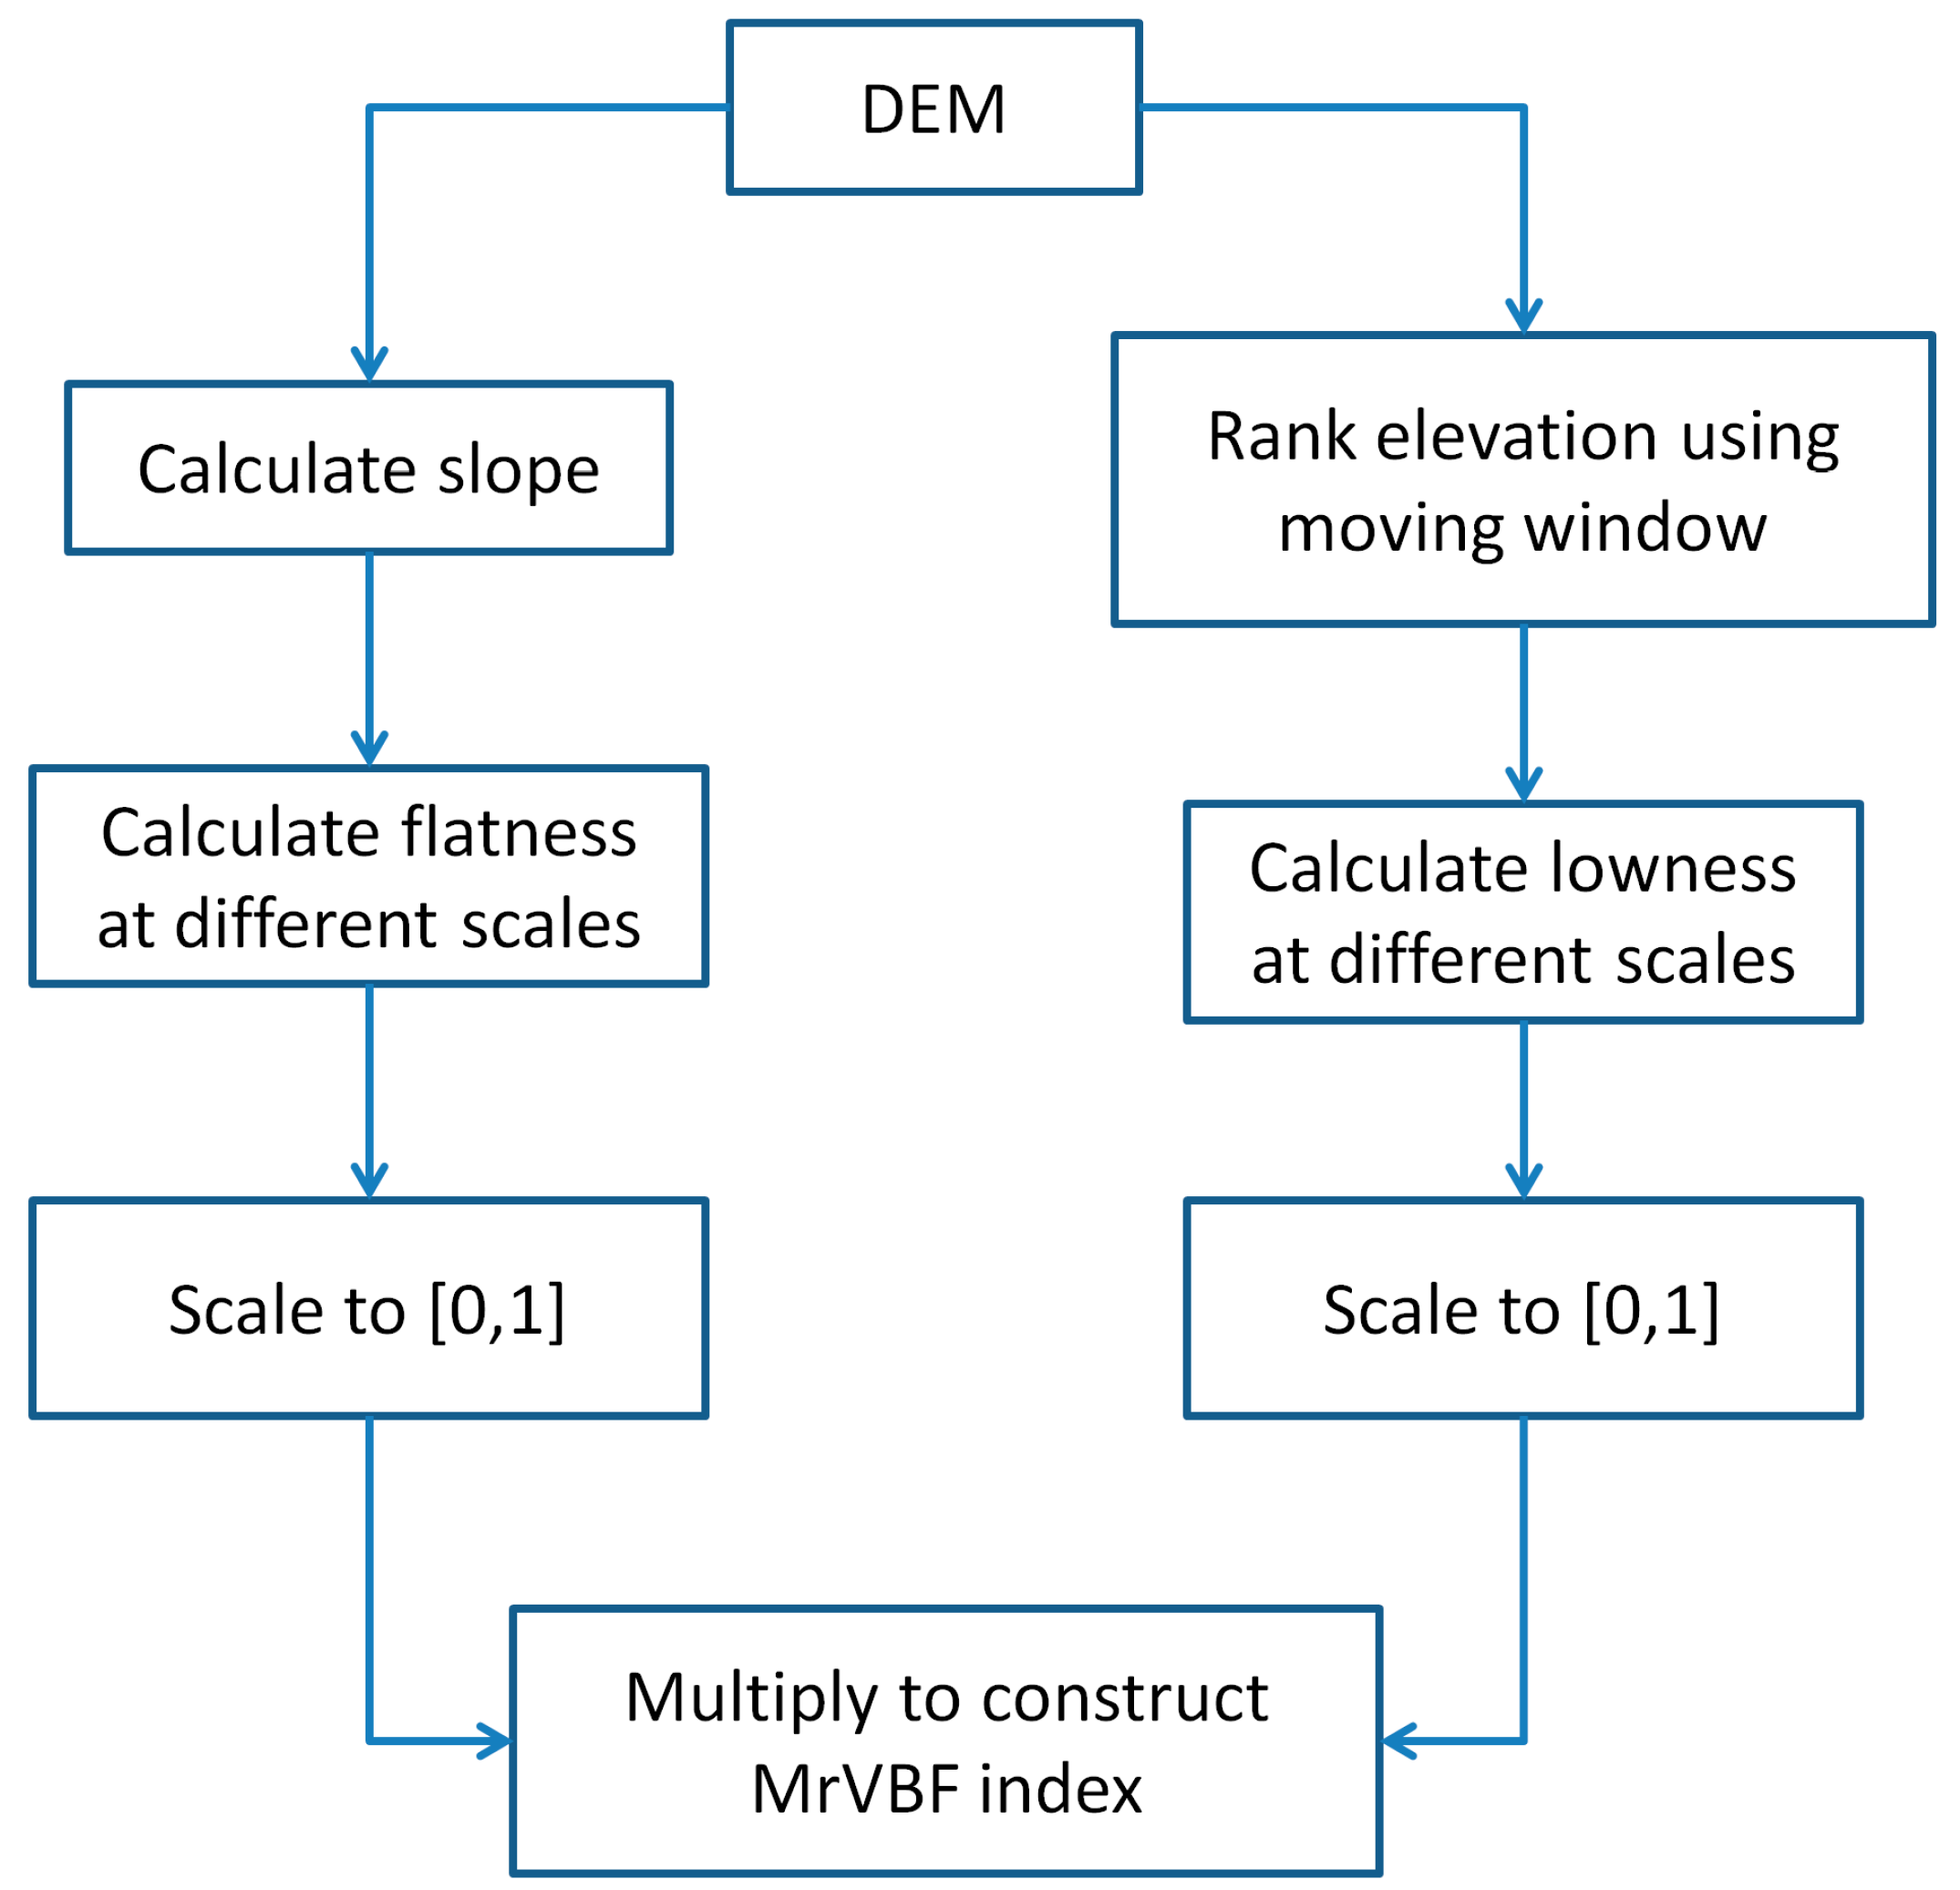
3.1. Calculation of MrVBF Index
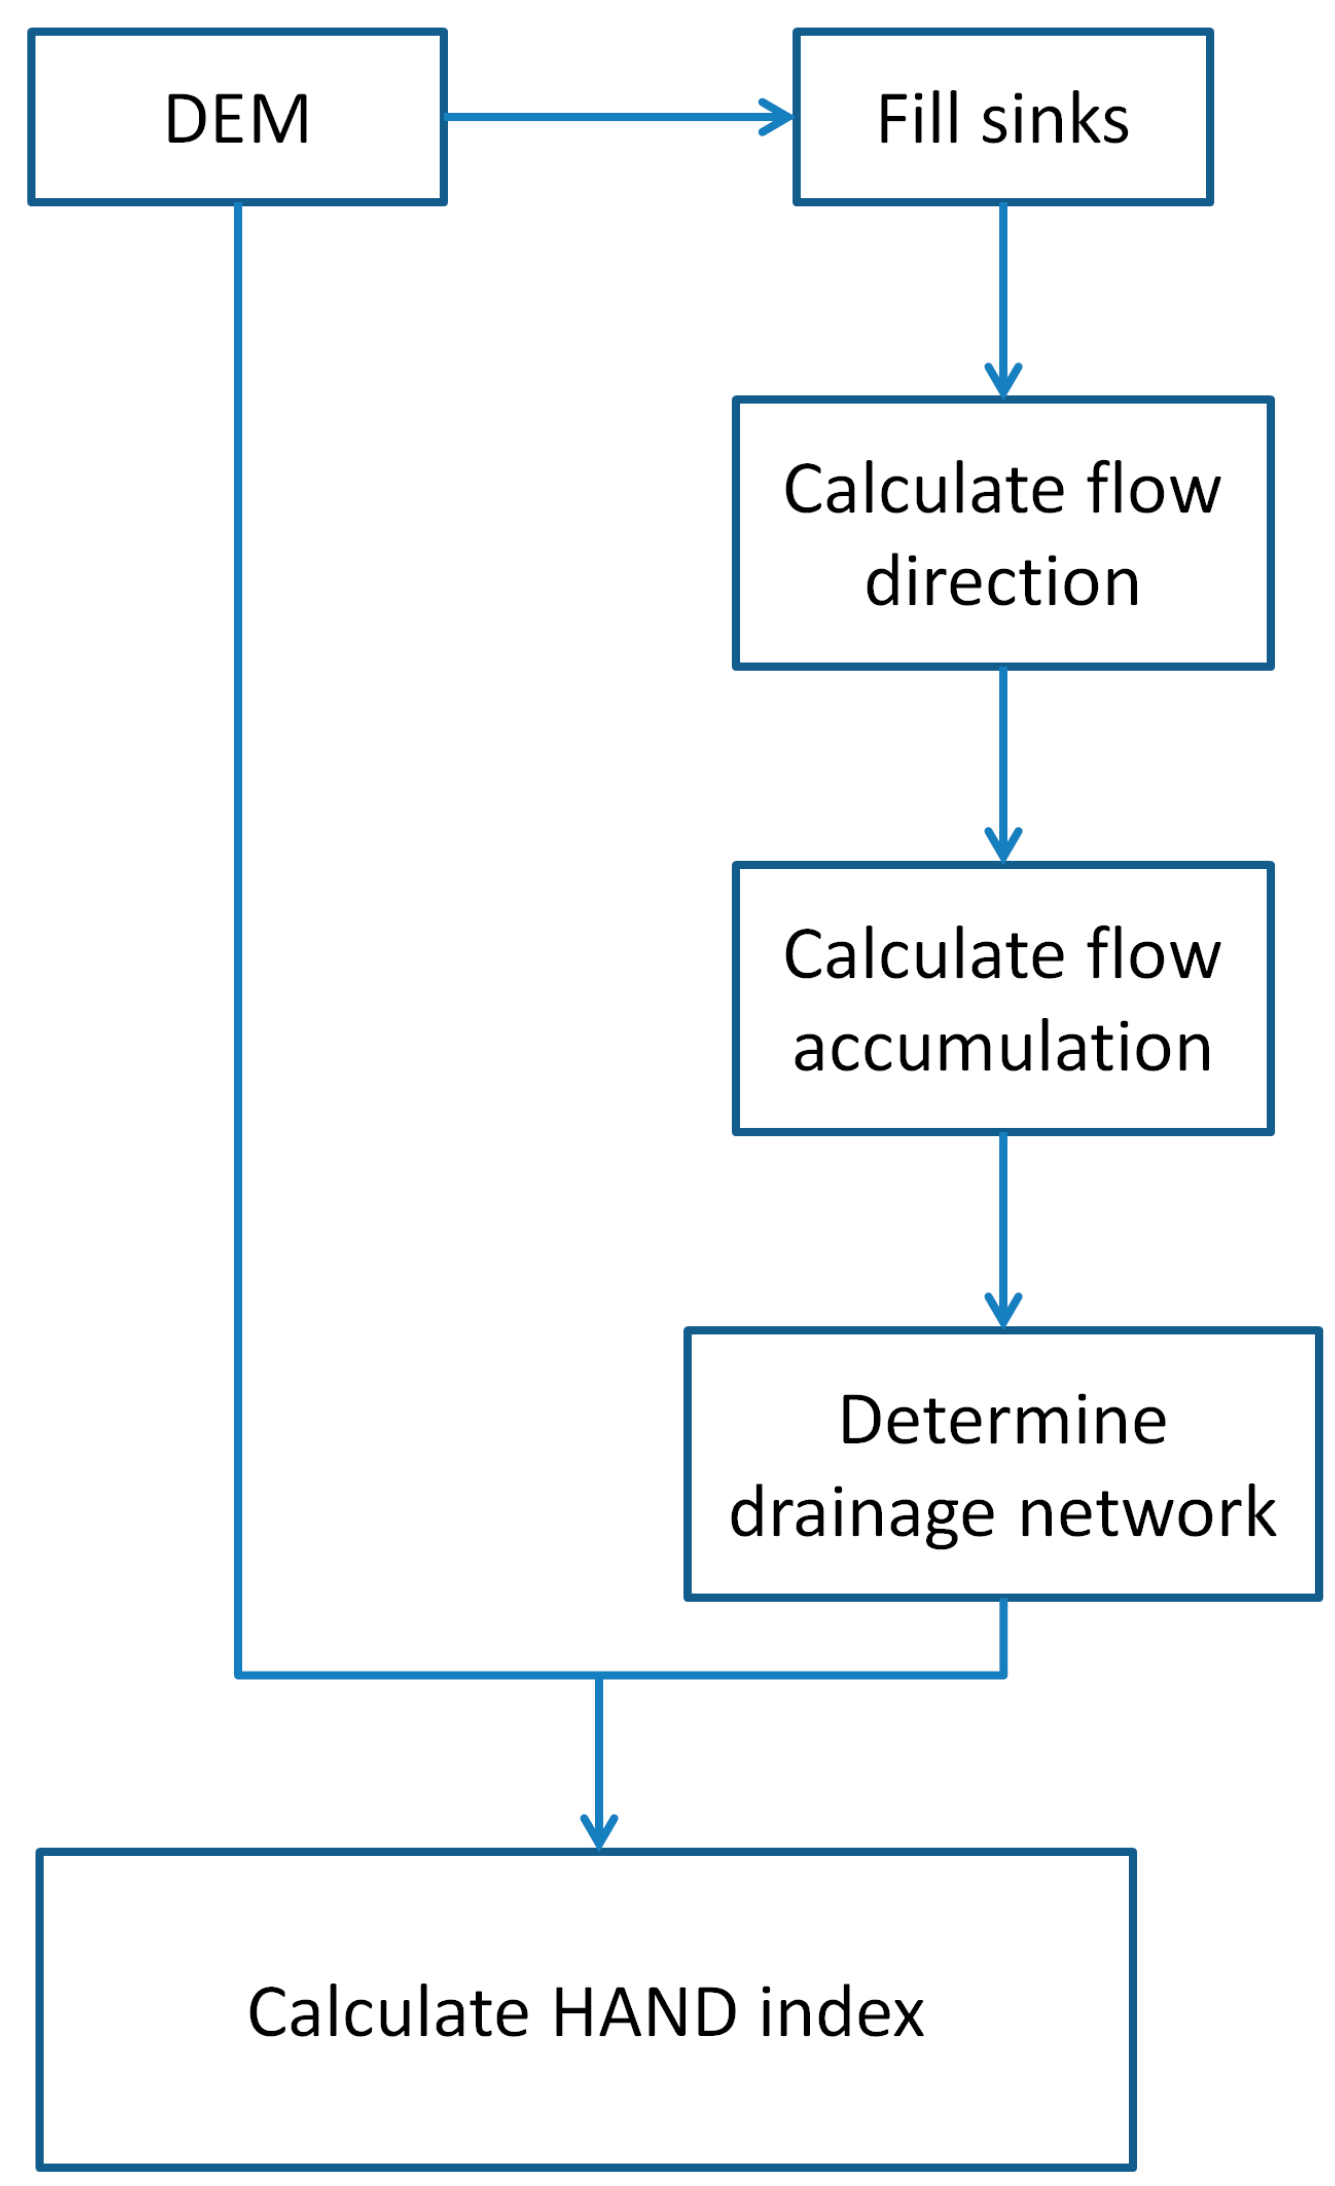
3.2. Calculation of HAND Index
3.3. Water Mapping
4. Results and Discussion
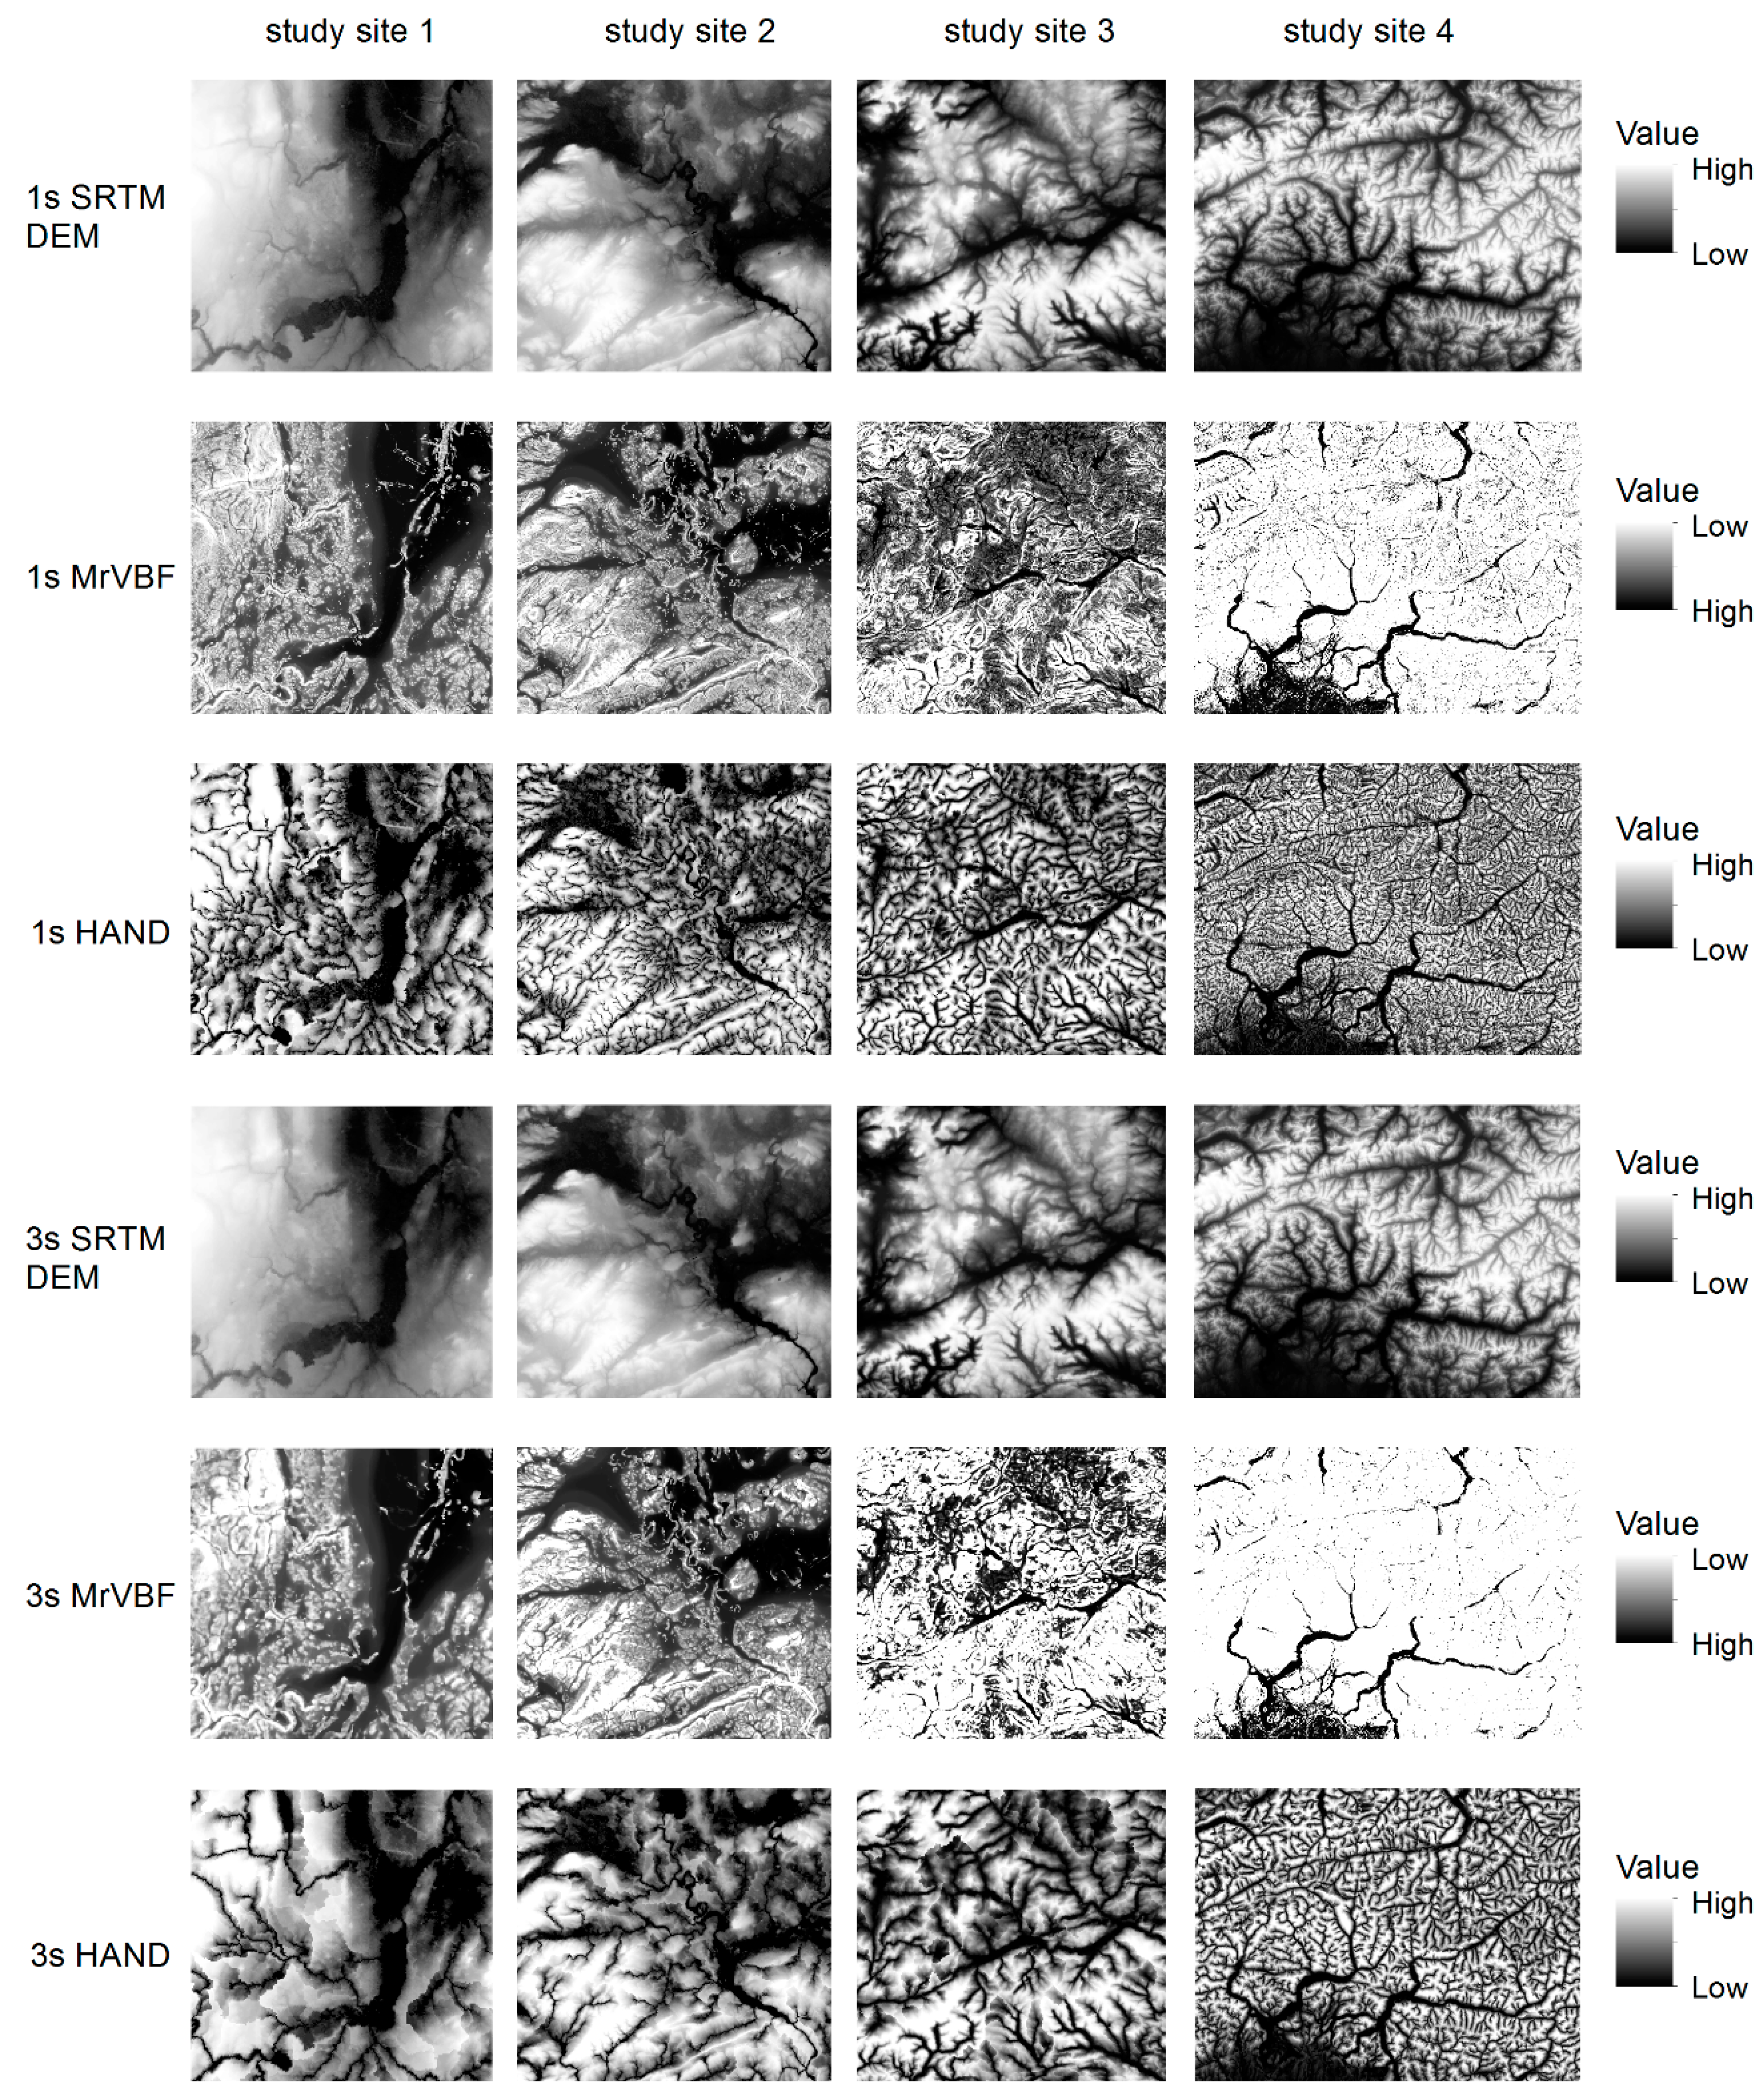
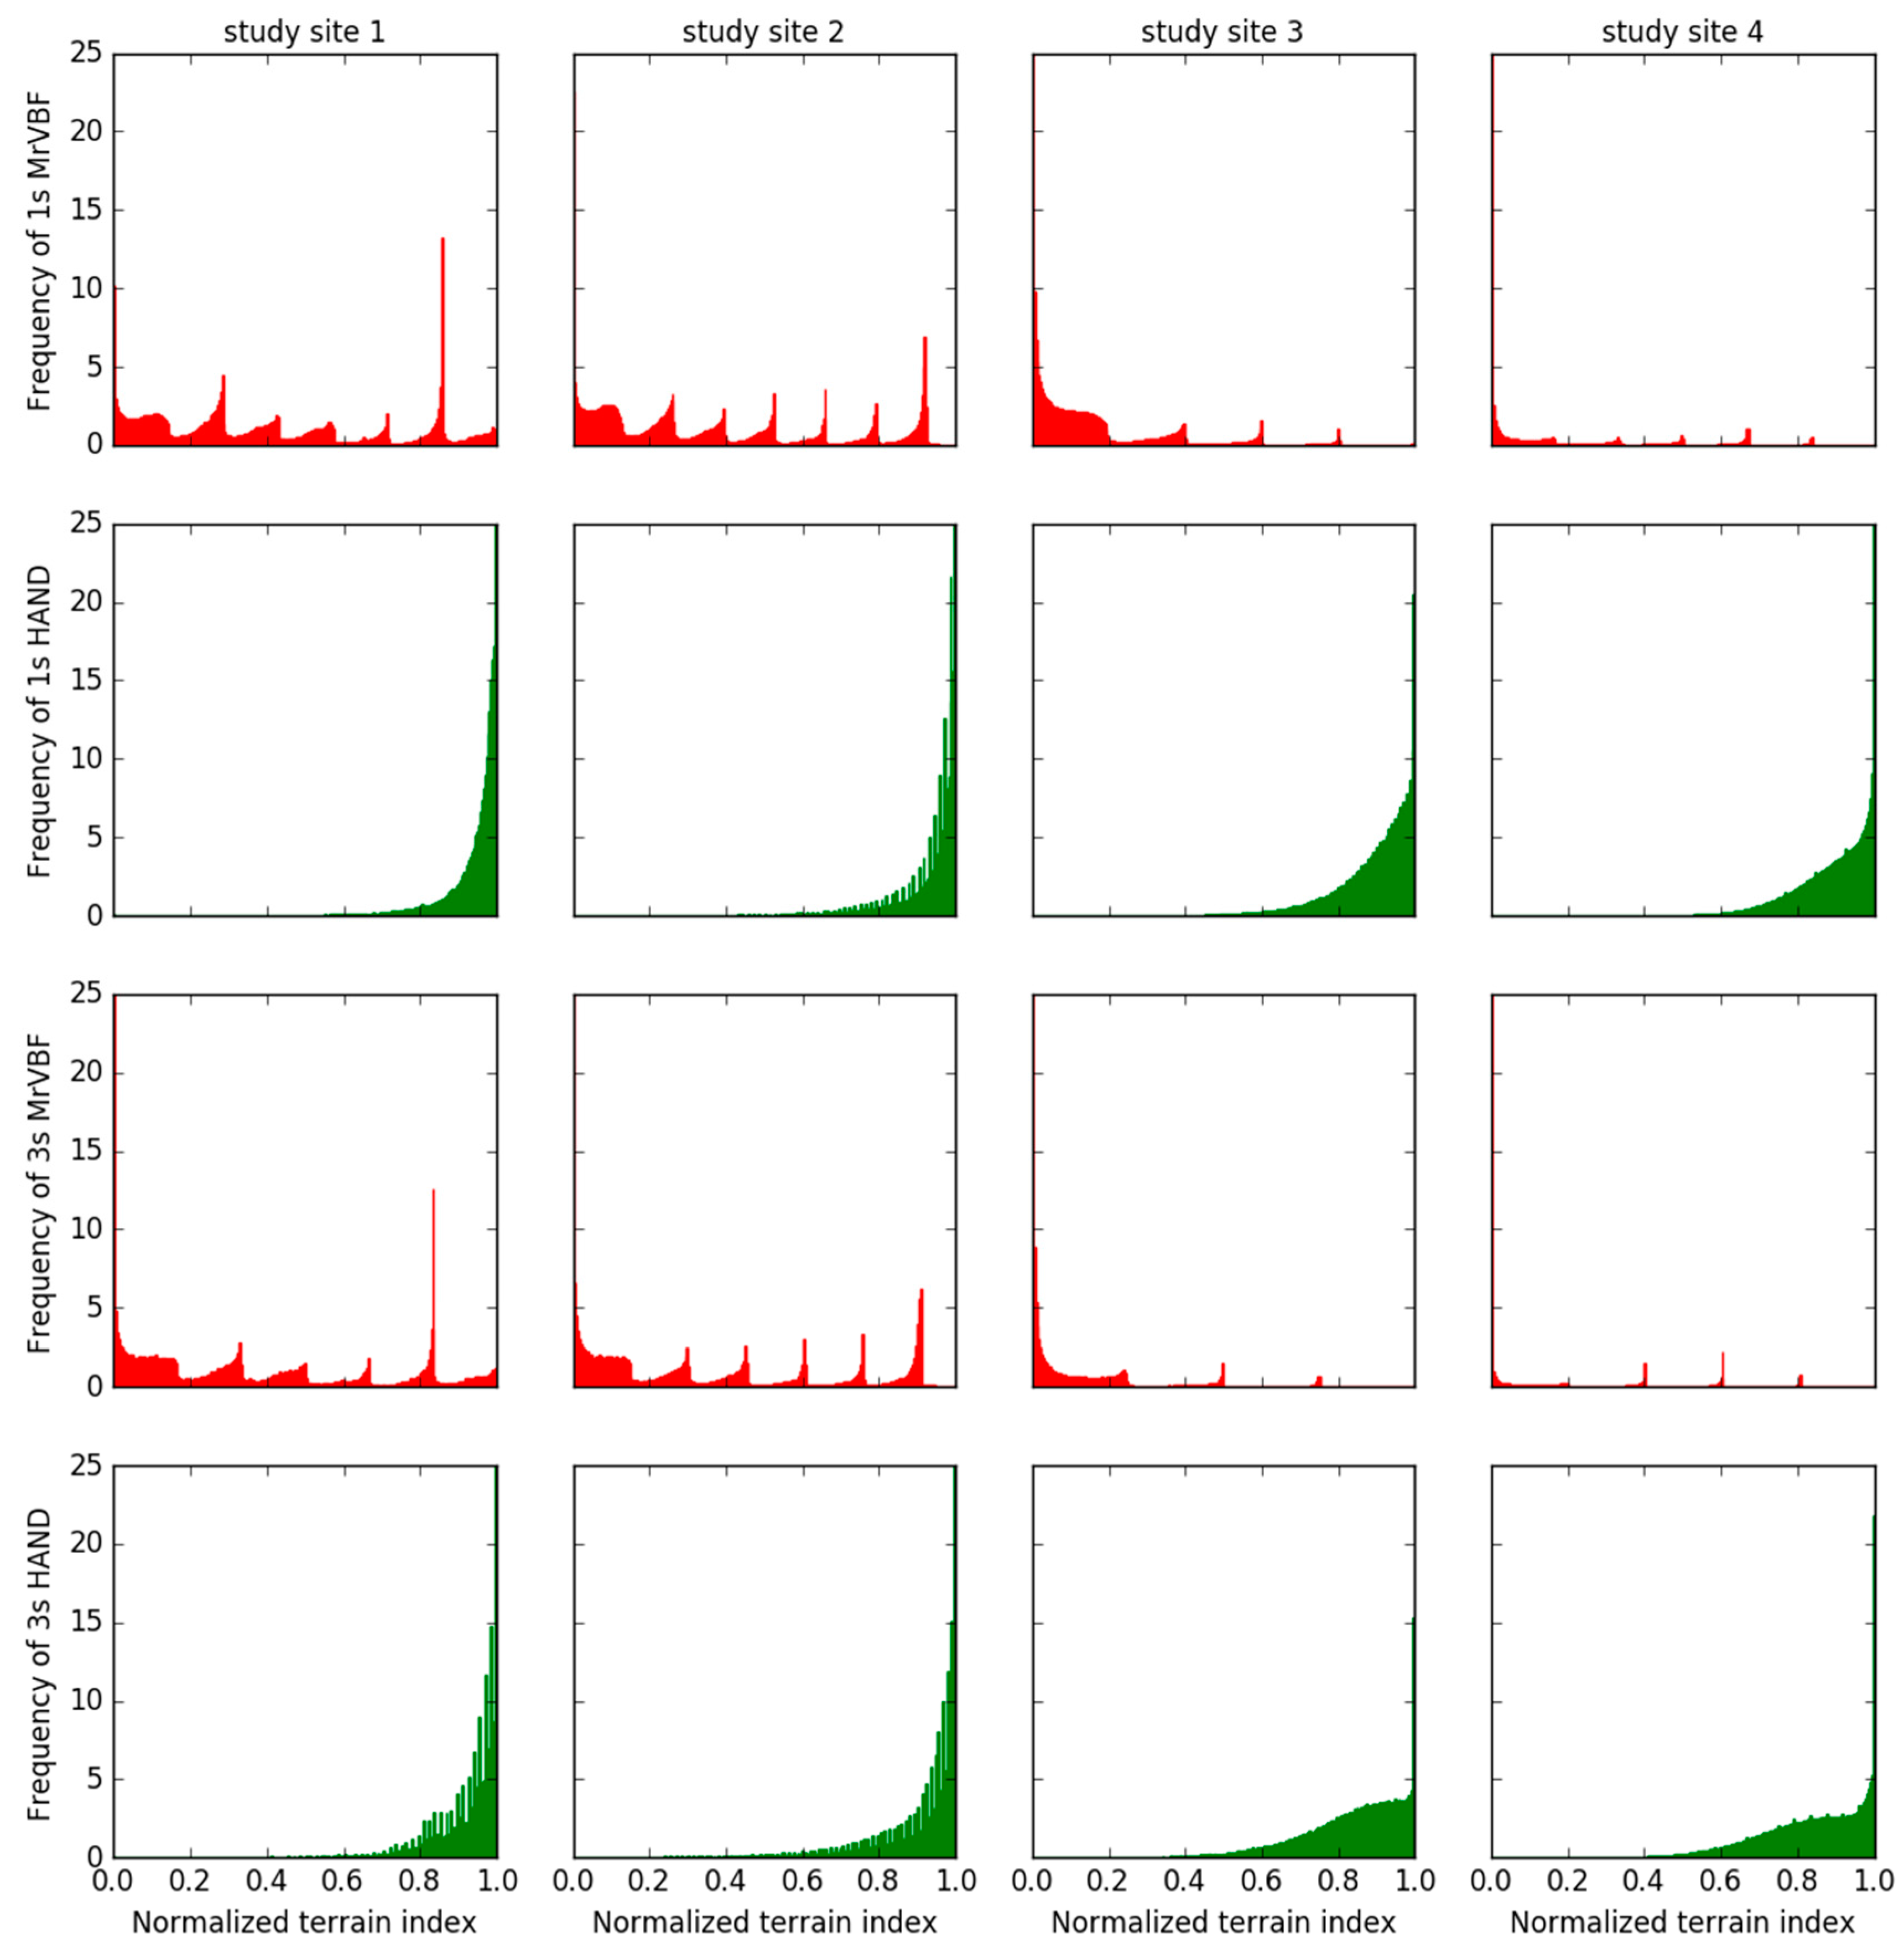
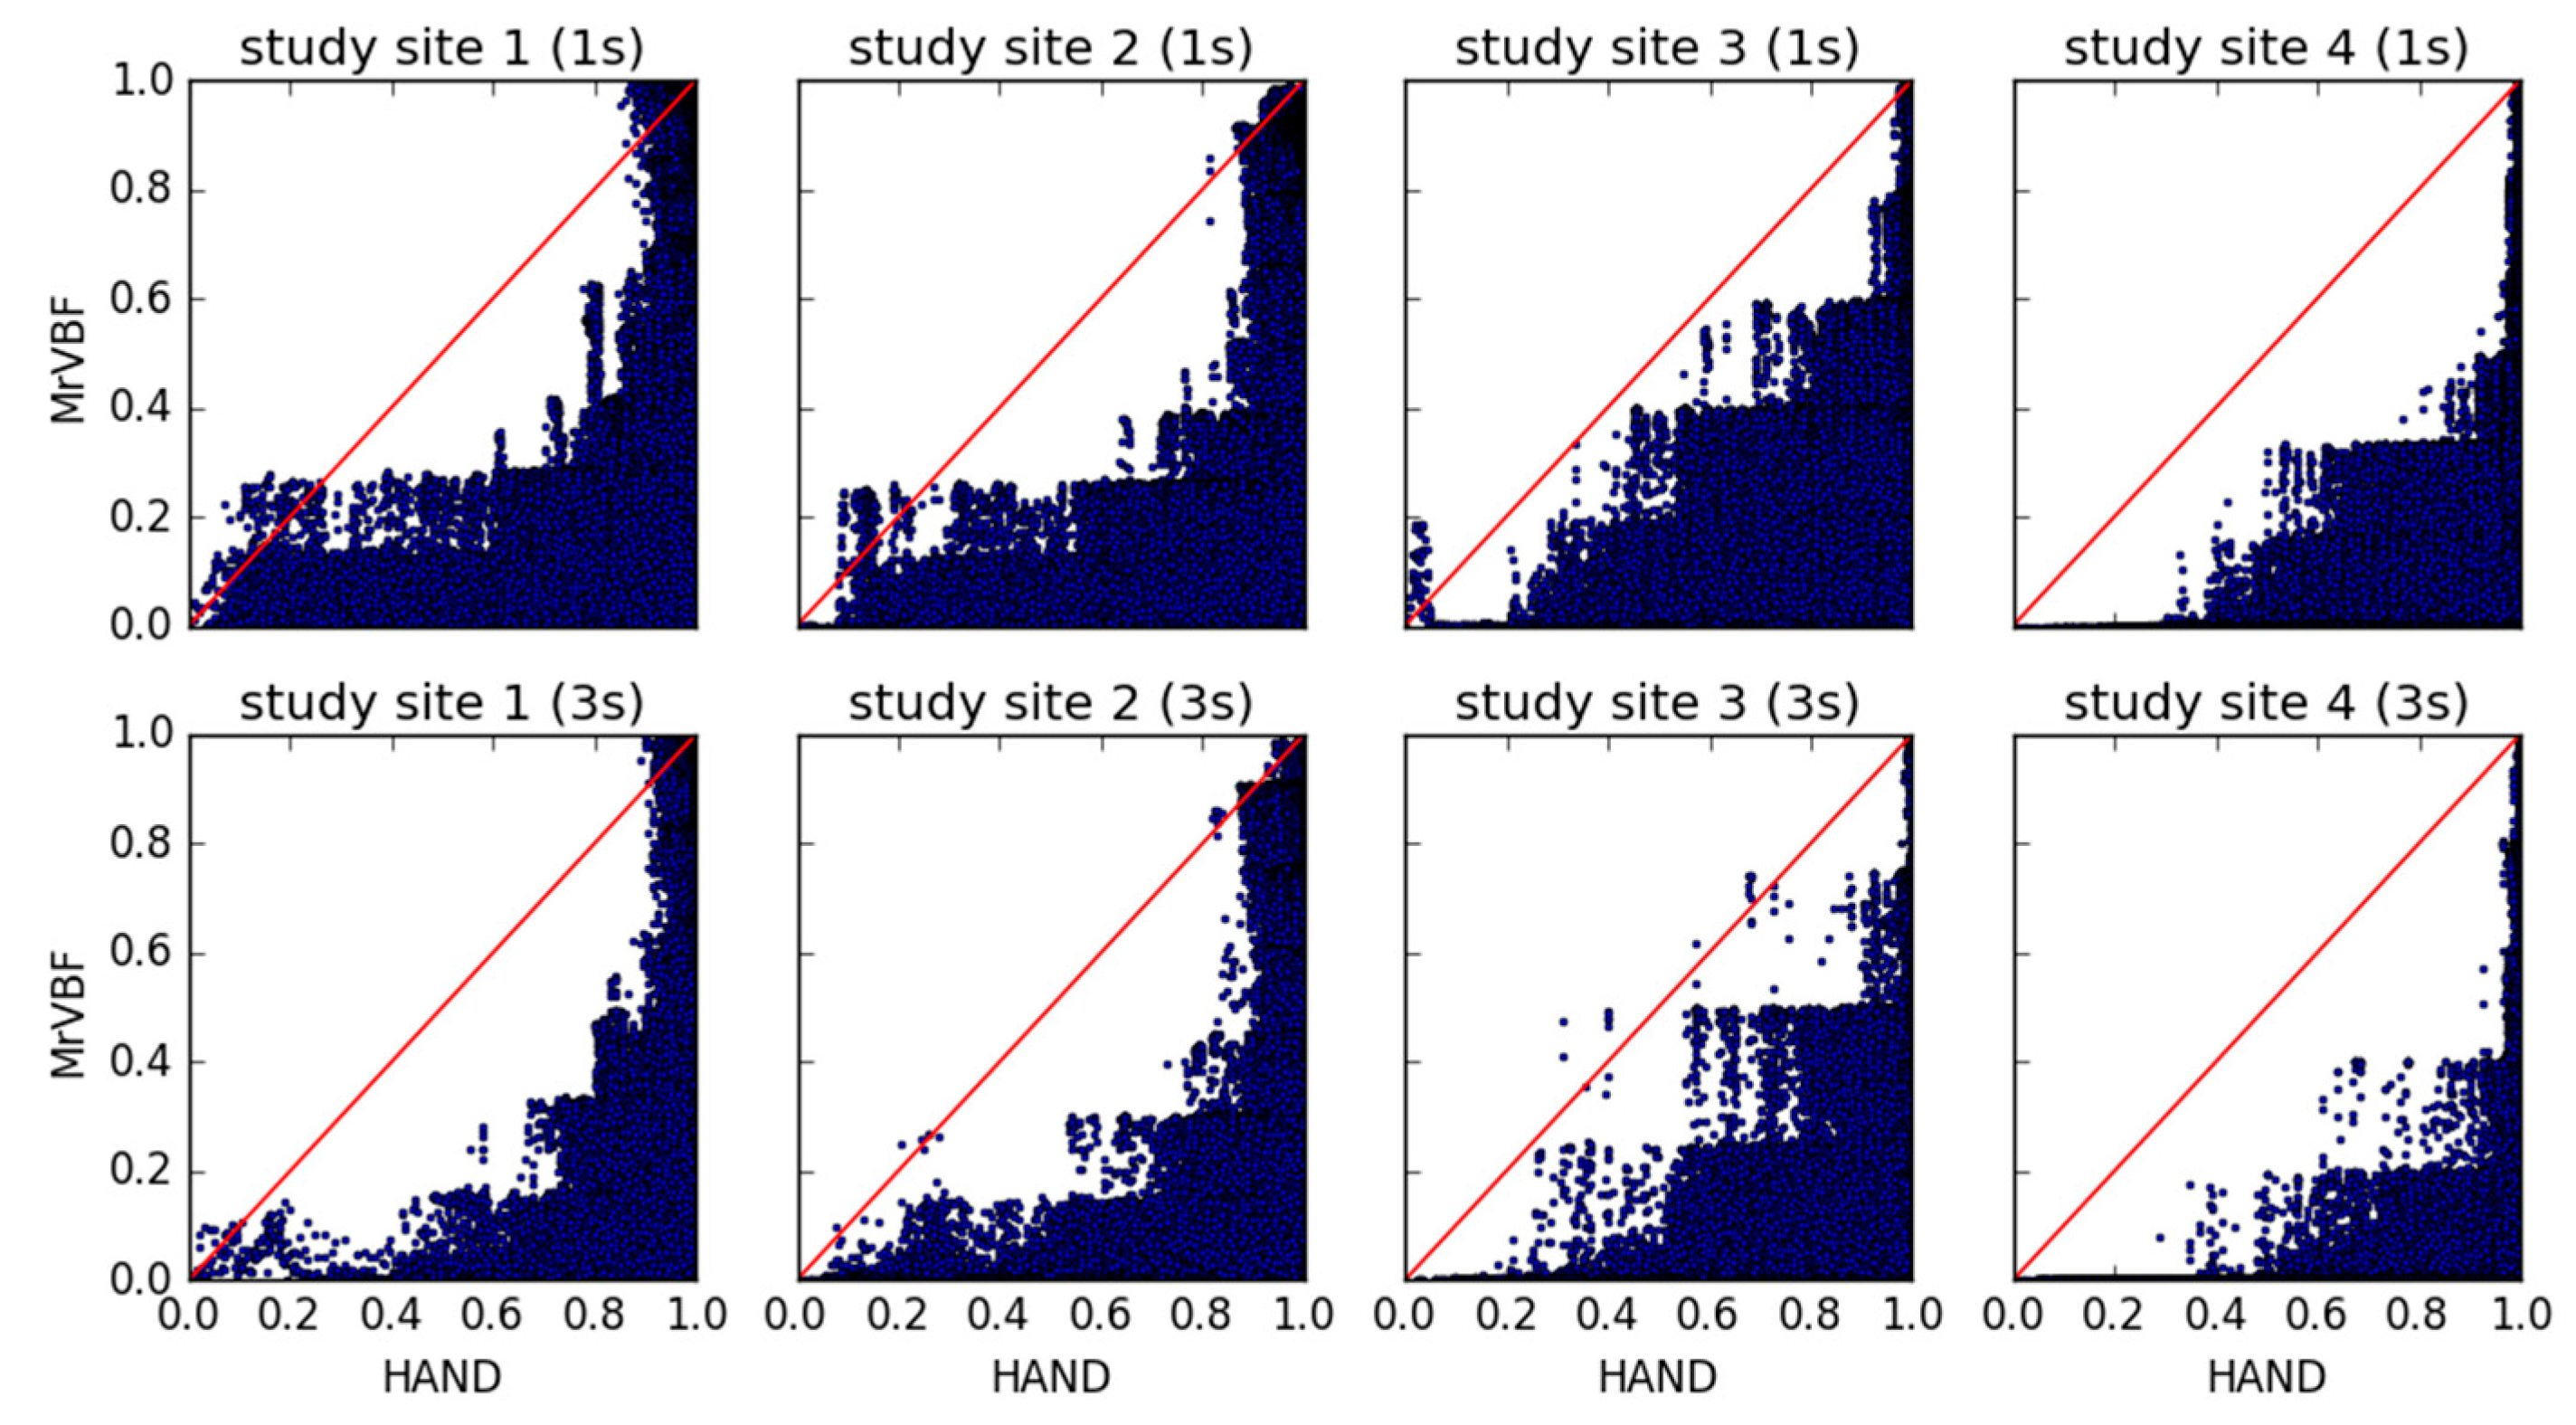
4.1. MrVBF Value vs. HAND Value
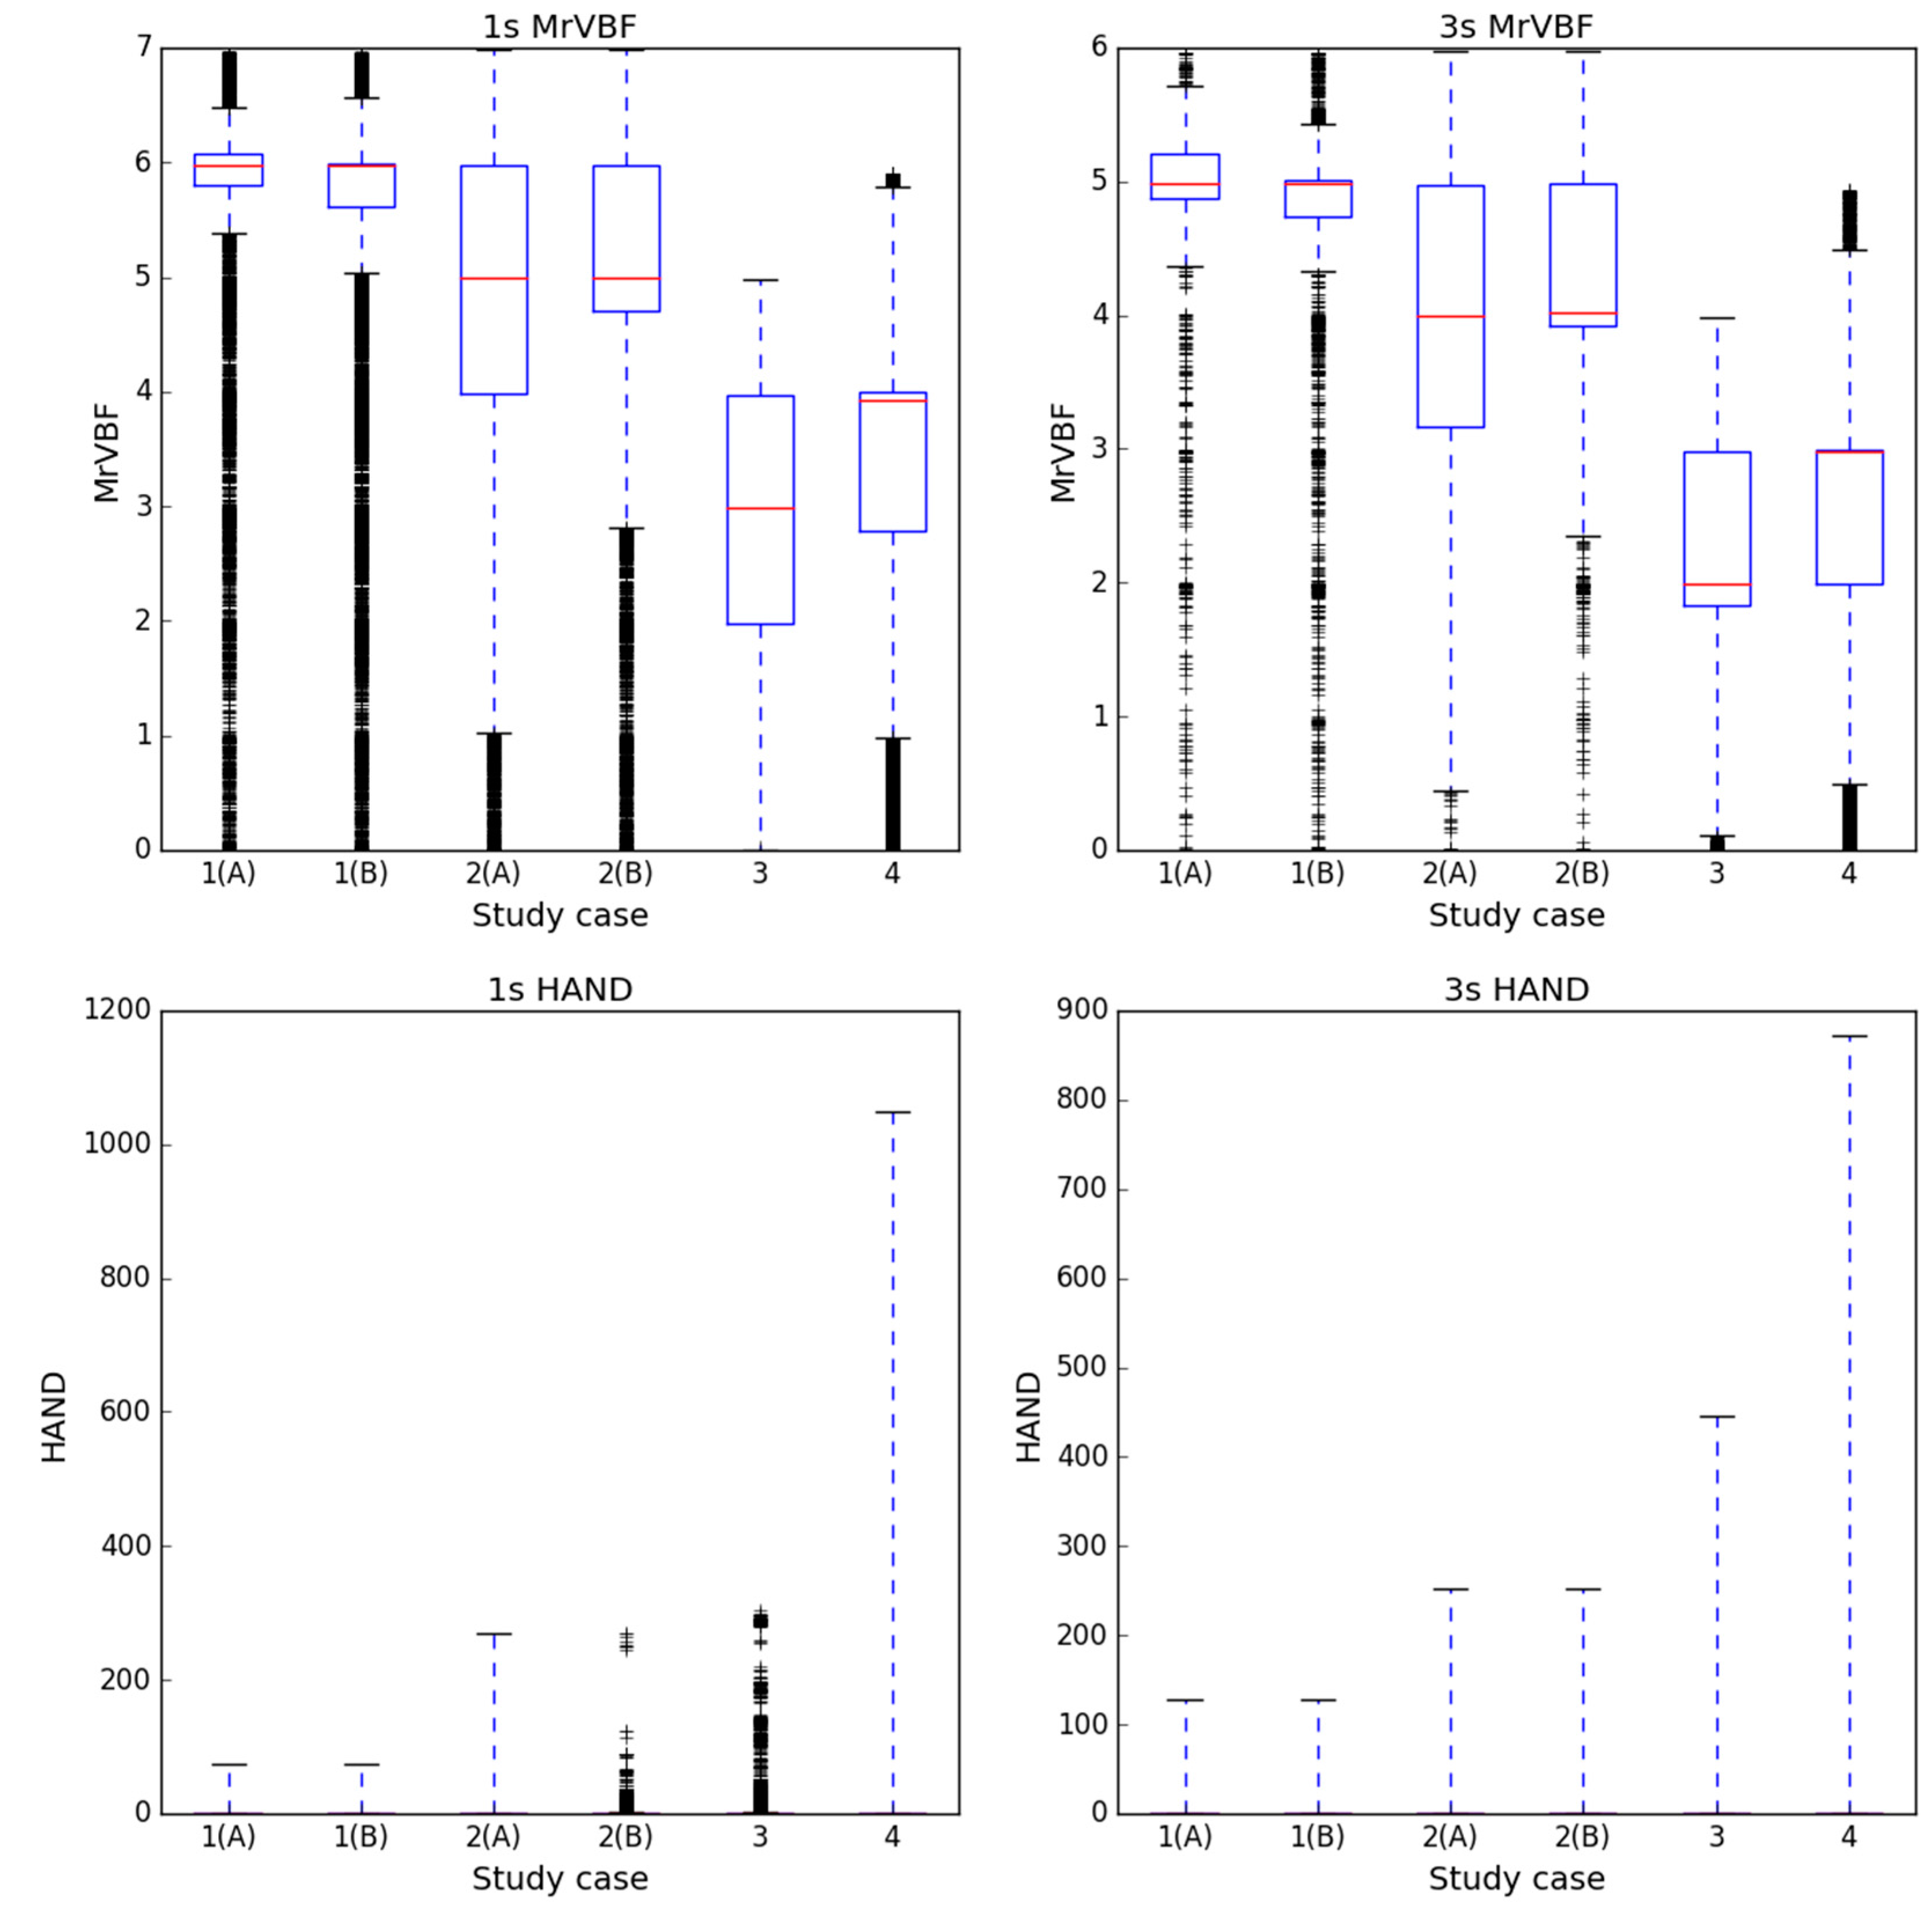
4.2. MrVBF Value vs. HAND Value within Water Areas
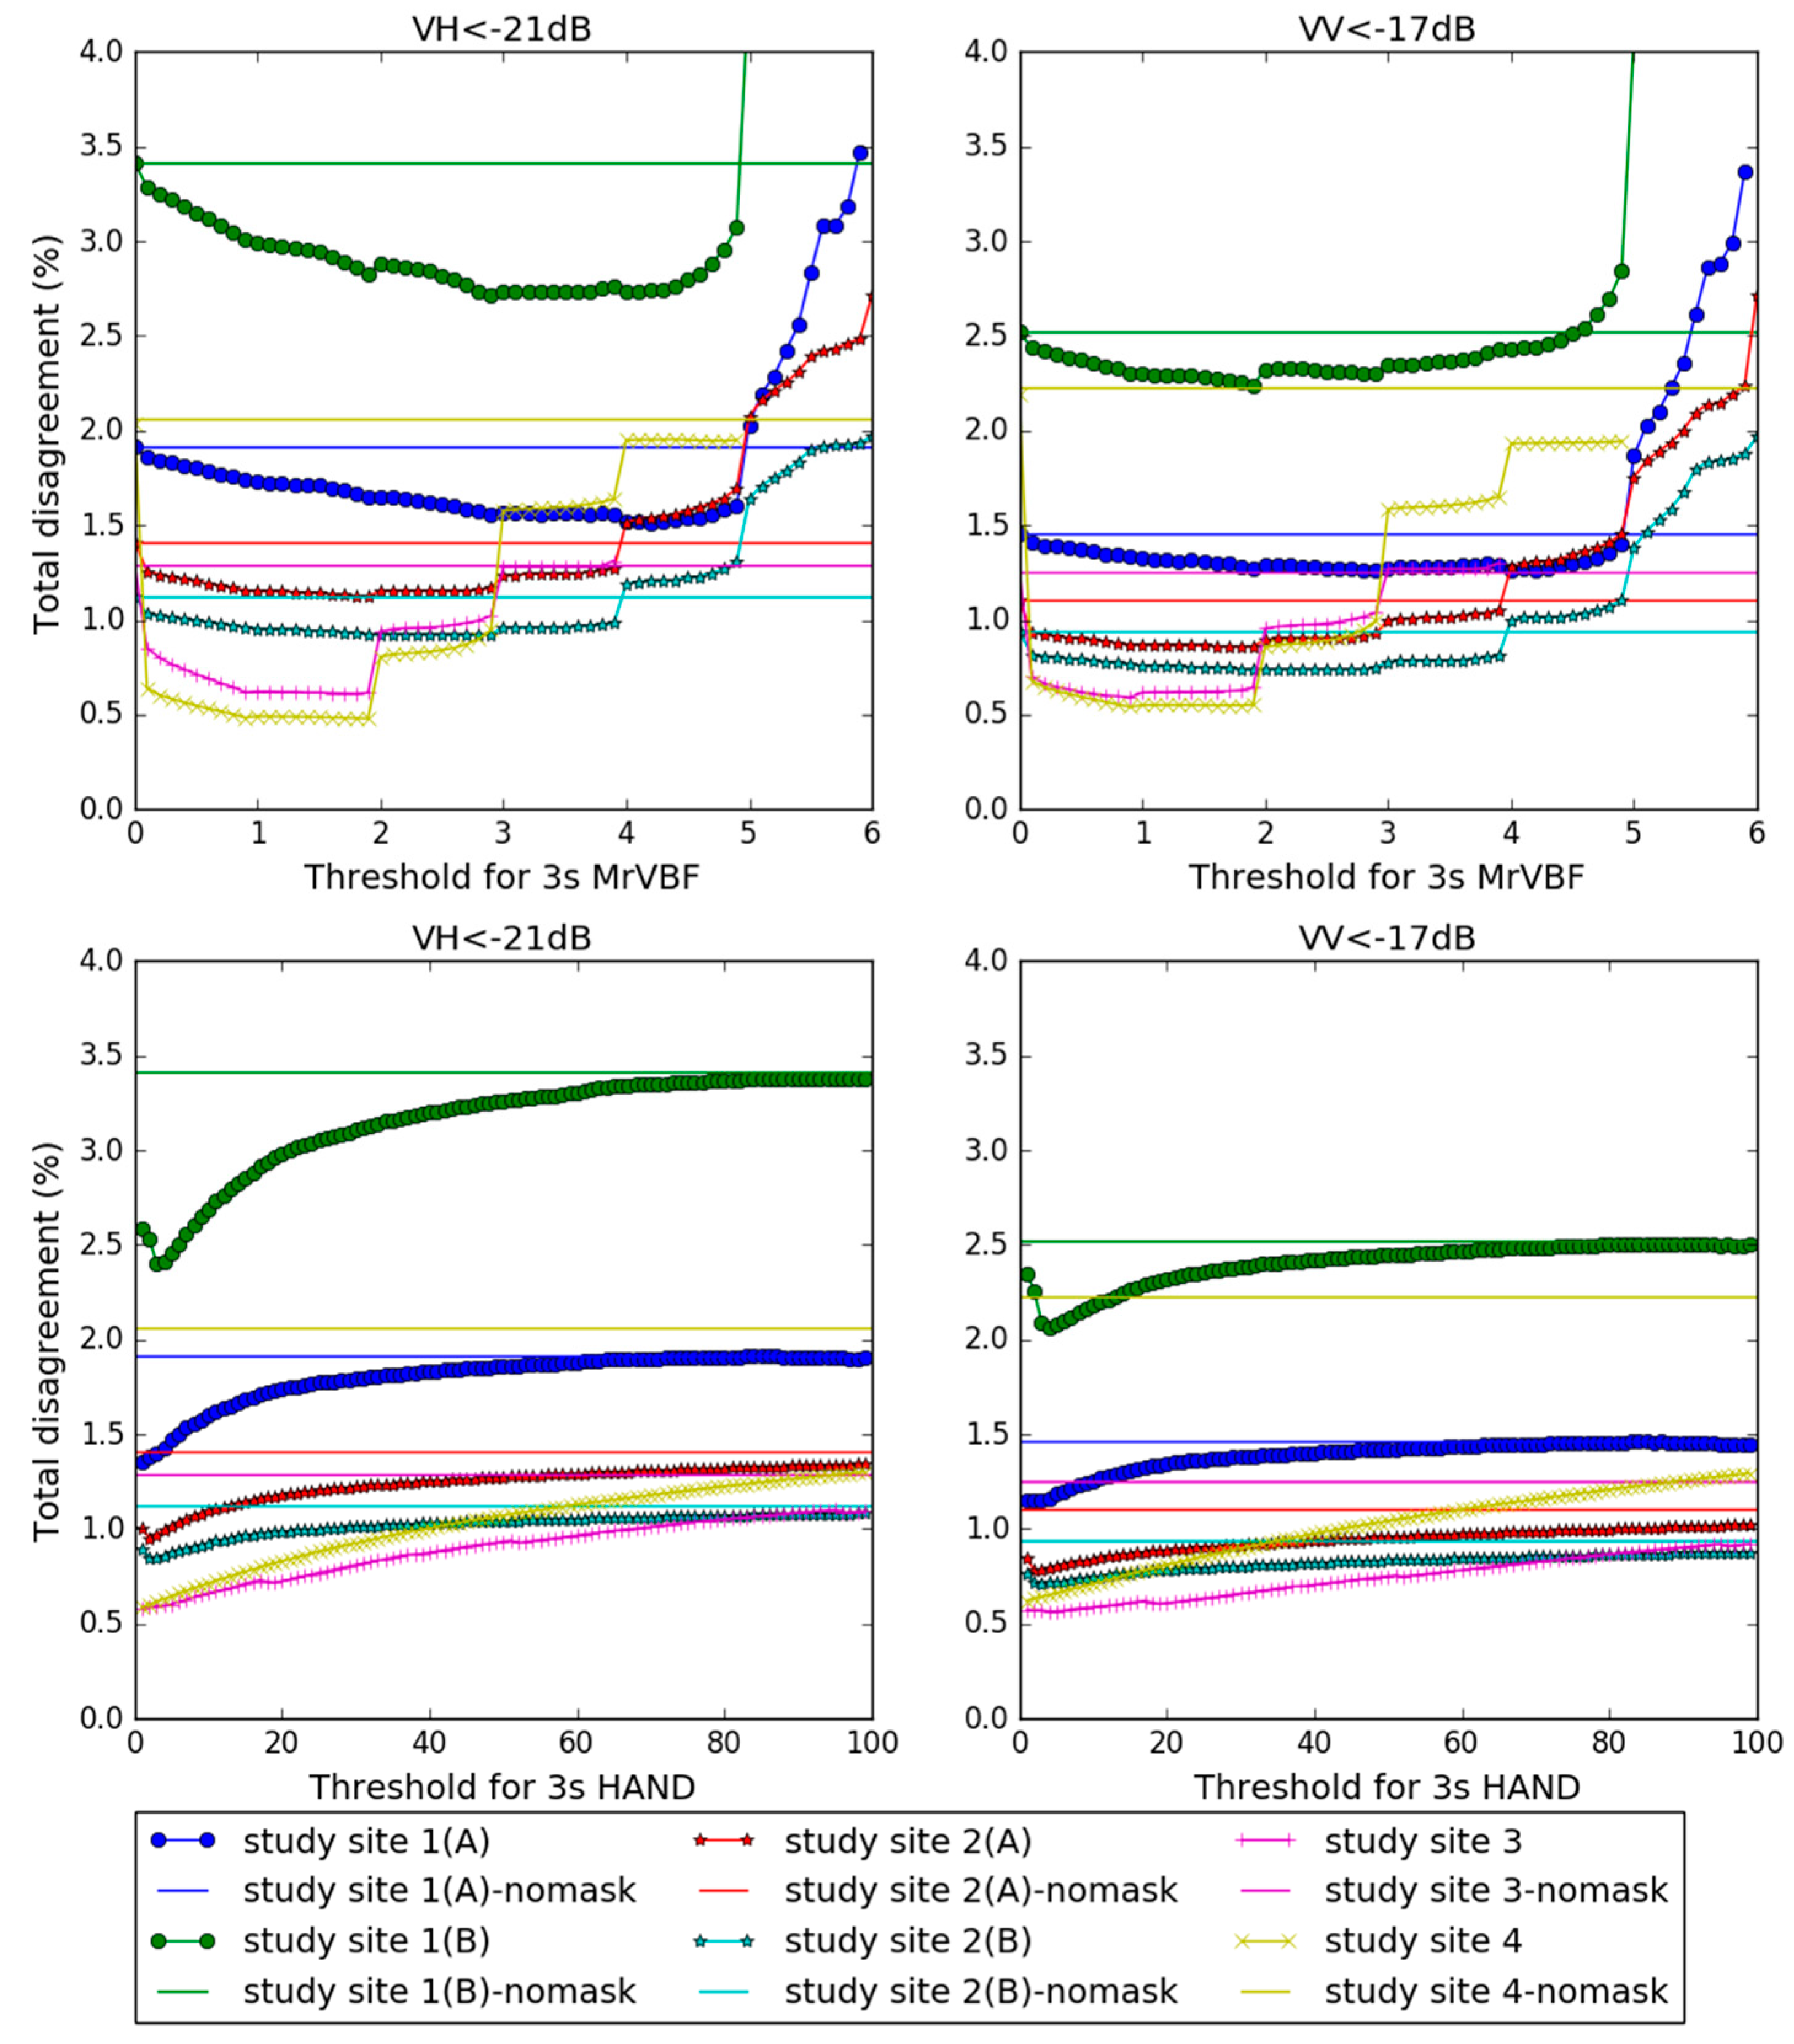
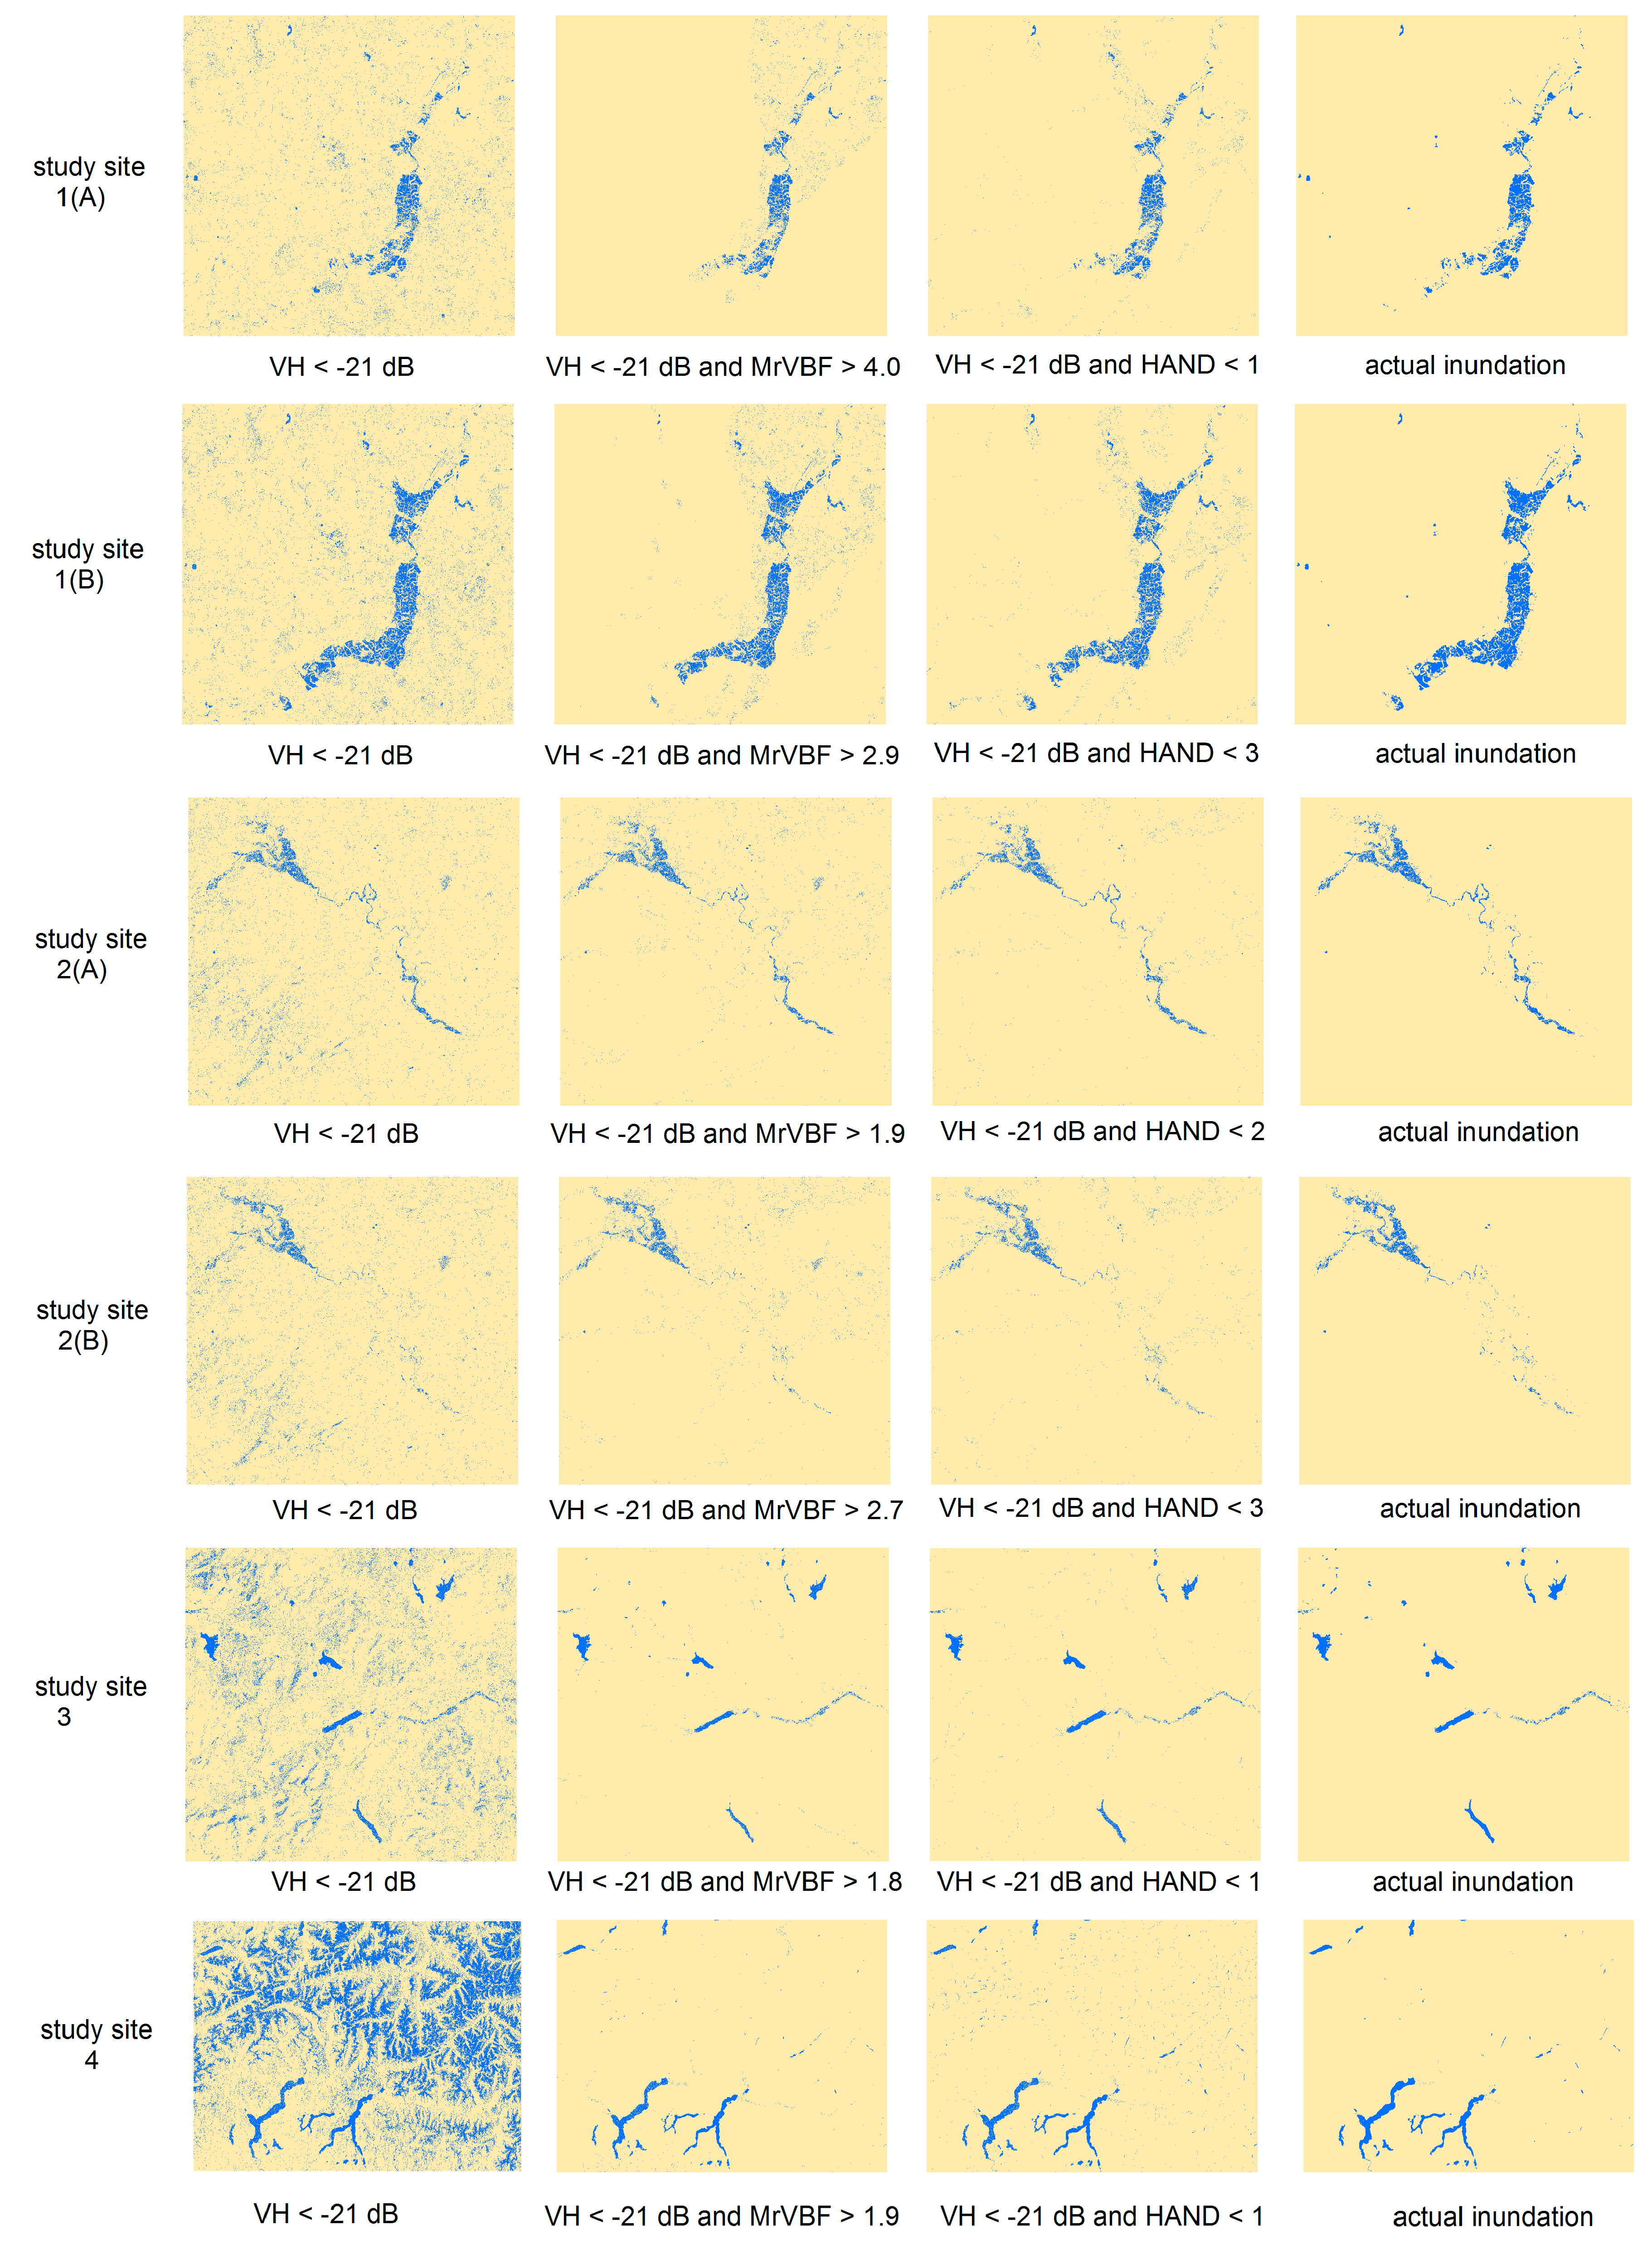
4.3. Sensitivity of MrVBF and HAND Thresholding
- (VH < −21 dB and MrVBF > ζ) or (VV < −17 dB and MrVBF > ζ);
- (VH < −21 dB and HAND < δ) or (VV < −17 dB and HAND < δ).
4.4. Optimal Thresholds and Their Performance
5. Conclusions
- Both terrain indices are able to help improve water mapping significantly. HAND performs slightly better than MrVBF in most of these cases.
- Optimal thresholds for both indices are not fixed. Adjustments are required to achieve optimal results. HAND is less sensitive to different thresholds, which is a good quality when being applied to larger areas with varied topography.
- MrVBF classifies low and flat areas with more details than HAND does. For example, those areas that have a unique HAND value of 0 may have quite different MrVBF values, depending on the scale of valley bottoms. This advantage makes MrVBF sometimes more effective in eliminating false water bodies in mountainous areas.
Acknowledgments
Author Contributions
Conflicts of Interest
References
- World Bank. Earth Observation for Water Resources Management: Current Use and Future Opportunities for the Water Sector; World Bank Group: Washington, DC, USA, 2015. [Google Scholar]
- Karpatne, A.; Khandelwal, A.; Chen, X.; Mithal, V.; Faghmous, J.; Kumar, V. Global monitoring of inland water dynamics: State-of-the-art, challenges, and opportunities. In Computational Sustainability; Lässig, J., Kersting, K., Morik, K., Eds.; Springer International Publishing: Cham, Switzerland, 2016; pp. 121–147. [Google Scholar]
- Gao, H.; Zhang, S.; Durand, M.; Lee, H. Satellite remote sensing of lakes and wetlands. In Hydrologic Remote Sensing; CRC Press: Boca Raton, FL, USA, 2016; pp. 57–72. [Google Scholar]
- McGinnis, D.; Rango, A. Earth resources satellite systems for flood monitoring. Geophys. Res. Lett. 1975, 2, 132–135. [Google Scholar] [CrossRef]
- Westerhoff, R.; Kleuskens, M.; Winsemius, H.; Huizinga, H.; Brakenridge, G.; Bishop, C. Automated global water mapping based on wide-swath orbital synthetic-aperture radar. Hydrol. Earth Syst. Sci. 2013, 17, 651–663. [Google Scholar] [CrossRef]
- Long, S.; Fatoyinbo, T.E.; Policelli, F. Flood extent mapping for Namibia using change detection and thresholding with SAR. Environ. Res. Lett. 2014, 9, 035002. [Google Scholar] [CrossRef]
- Frison, P.L.; Paillou, P.; Sayah, N.; Pottier, E.; Rudant, J.P. Spatio-temporal monitoring of evaporitic processes using multiresolution C-band radar remote sensing data: Example of the Chott el Djerid, Tunisia. Can. J. Remote Sens. 2013, 39, 127–137. [Google Scholar] [CrossRef]
- Di Baldassarre, G.; Schumann, G.; Brandimarte, L.; Bates, P. Timely low resolution SAR imagery to support floodplain modelling: A case study review. Surv. Geophys. 2011, 32, 255–269. [Google Scholar] [CrossRef]
- Horritt, M.S.; Mason, D.C.; Luckman, A.J. Flood boundary delineation from synthetic aperture radar imagery using a statistical active contour model. Int. J. Remote Sens. 2001, 22, 2489–2507. [Google Scholar] [CrossRef]
- Phuhinkong, P.; Kasetkasem, T.; Kumazawa, I.; Rakwatin, P.; Chanwimaluang, T. Unsupervised segmentation of synthetic aperture radar inundation imagery using the level set method. In Proceedings of the 11th International Conference on Electrical Engineering/Electronics, Computer, Telecommunications and Information Technology (ECTI-CON), Nakhon Ratchasima, Thailand, 14–17 May 2014. [Google Scholar]
- Henry, J.B.; Chastanet, P.; Fellah, K.; Desnos, Y.L. Envisat multi-polarized ASAR data for flood mapping. Int. J. Remote Sens. 2006, 27, 1921–1929. [Google Scholar] [CrossRef]
- White, L.; Brisco, B.; Dabboor, M.; Schmitt, A.; Pratt, A. A collection of SAR methodologies for monitoring wetlands. Remote Sens. 2015, 7, 7615–7645. [Google Scholar] [CrossRef]
- Otsu, N. A threshold selection method from gray-level histograms. IEEE Trans. Syst. Man Cybern. 1979, 9, 62–66. [Google Scholar] [CrossRef]
- Song, Y.-S.; Sohn, H.-G.; Park, C.-H. Efficient water area classification using RADARSAT-1 SAR imagery in a high relief mountainous environment. Photogram. Eng. Remote Sens. 2007, 73, 285–296. [Google Scholar] [CrossRef]
- Wang, Y.; Colby, J.D.; Mulcahy, K.A. An efficient method for mapping flood extent in a coastal floodplain using Landsat TM and DEM data. Int. J. Remote Sens. 2002, 23, 3681–3696. [Google Scholar] [CrossRef]
- Gianinetto, M.; Villa, P.; Lechi, G. Postflood damage evaluation using Landsat TM and ETM+ data integrated with DEM. IEEE Trans. Geosci. Remote Sens. 2006, 44, 236–243. [Google Scholar] [CrossRef]
- Li, J.; Chen, W. A rule-based method for mapping Canada’s wetlands using optical, radar and DEM data. Int. J. Remote Sens. 2005, 26, 5051–5069. [Google Scholar] [CrossRef]
- Pekel, J.-F.; Cottam, A.; Gorelick, N.; Belward, A.S. High-resolution mapping of global surface water and its long-term changes. Nature 2016, 540, 418–422. [Google Scholar] [CrossRef] [PubMed]
- Gilbert, J.T.; Macfarlane, W.W.; Wheaton, J.M. The Valley Bottom Extraction Tool (V-BET): A GIS tool for delineating valley bottoms across entire drainage networks. Comput. Geosci. 2016, 97, 1–14. [Google Scholar] [CrossRef]
- Jordan, G. Adaptive smoothing of valleys in DEMs using TIN interpolation from ridgeline elevations: An application to morphotectonic aspect analysis. Comput. Geosci. 2007, 33, 573–585. [Google Scholar] [CrossRef]
- Williams, W.A.; Jensen, M.E.; Winne, J.C.; Redmond, R.L. An automated technique for delineating and characterizing valley-bottom settings. Environ. Monit. Assess. 2000, 64, 105–114. [Google Scholar] [CrossRef]
- Hjerdt, K.N.; McDonnell, J.J.; Seibert, J.; Rodhe, A. A new topographic index to quantify downslope controls on local drainage. Water Resour. Res. 2004, 40, W05602. [Google Scholar] [CrossRef]
- Gallant, J.C.; Dowling, T.I. A multiresolution index of valley bottom flatness for mapping depositional areas. Water Resour. Res. 2003, 39, 291–297. [Google Scholar] [CrossRef]
- Mueller, N.; Lewis, A.; Roberts, D.; Ring, S.; Melrose, R.; Sixsmith, J.; Lymburner, L.; McIntyre, A.; Tan, P.; Curnow, S.; et al. Water observations from space: Mapping surface water from 25 years of Landsat imagery across Australia. Remote Sens. Environ. 2016, 174, 341–352. [Google Scholar] [CrossRef]
- Chen, Y.; Huang, C.; Ticehurst, C.; Merrin, L.; Thew, P. An evaluation of MODIS daily and 8-day composite products for floodplain and wetland inundation mapping. Wetlands 2013, 33, 823–835. [Google Scholar] [CrossRef]
- Huang, C.; Chen, Y.; Wu, J. Mapping spatio-temporal flood inundation dynamics at large river basin scale using time-series flow data and MODIS imagery. Int. J. Appl. Earth Obs. Geoinform. 2014, 26, 350–362. [Google Scholar] [CrossRef]
- Rennó, C.D.; Nobre, A.D.; Cuartas, L.A.; Soares, J.V.; Hodnett, M.G.; Tomasella, J.; Waterloo, M.J. HAND, a new terrain descriptor using SRTM-DEM: Mapping terra-firme rainforest environments in Amazonia. Remote Sens. Environ. 2008, 112, 3469–3481. [Google Scholar] [CrossRef]
- Nobre, A.D.; Cuartas, L.A.; Hodnett, M.; Rennó, C.D.; Rodrigues, G.; Silveira, A.; Waterloo, M.; Saleska, S. Height above the nearest drainage—A hydrologically relevant new terrain model. J. Hydrol. 2011, 404, 13–29. [Google Scholar] [CrossRef]
- Donchyts, G.; Schellekens, J.; Winsemius, H.; Eisemann, E.; van de Giesen, N. A 30 m resolution surfacewater mask including estimation of positional and thematic differences using Landsat 8, SRTM and OpenStreetMap: A case study in the Murray-Darling basin, Australia. Remote Sens. 2016, 8, 386–407. [Google Scholar] [CrossRef]
- Twele, A.; Cao, W.; Plank, S.; Martinis, S. Sentinel-1-based flood mapping: A fully automated processing chain. Int. J. Remote Sens. 2016, 37, 2990–3004. [Google Scholar] [CrossRef]
- Schlaffer, S.; Chini, M.; Dettmering, D.; Wagner, W. Mapping wetlands in Zambia using seasonal backscatter signatures derived from ENVISAT ASAR time series. Remote Sens. 2016, 8, 402. [Google Scholar] [CrossRef]
- Haile, A.T.; Rientjes, T. Effects of LiDAR DEM resolution in flood modelling: A model sensitivity study for the city of Tegucigalpa, Honduras. ISPRS Arch. 2005, XXXVI, 12–14. [Google Scholar]
- Rabus, B.; Eineder, M.; Roth, A.; Bamler, R. The shuttle radar topography mission—A new class of digital elevation models acquired by spaceborne radar. ISPRS J. Photogramm. Remote Sens. 2003, 57, 241–262. [Google Scholar] [CrossRef]
- Strozzi, T.; Wegmuller, U.; Wiesmann, A.; Werner, C. Validation of the X-SAR SRTM DEM for ERS and JERS SAR geocoding and 2-pass differential interferometry in alpine regions. In Proceedings of the 2003 IEEE International Geoscience and Remote Sensing Symposium, Toulouse, France, 21–25 July 2003. [Google Scholar]
- Kääb, A. Combination of SRTM3 and repeat ASTER data for deriving alpine glacier flow velocities in the Bhutan Himalaya. Remote Sens. Environ. 2005, 94, 463–474. [Google Scholar] [CrossRef]
- Sun, G.; Ranson, K.; Kharuk, V.; Kovacs, K. Validation of surface height from shuttle radar topography mission using shuttle laser altimeter. Remote Sens. Environ. 2003, 88, 401–411. [Google Scholar] [CrossRef]
- O’Callaghan, J.F.; Mark, D.M. The extraction of drainage networks from digital elevation data. Comput. Vis. Graph. Image Proc. 1984, 28, 323–344. [Google Scholar] [CrossRef]
- Sabel, D.; Bartalis, Z.; Wagner, W.; Doubkova, M.; Klein, J.-P. Development of a global backscatter model in support to the Sentinel-1 mission design. Remote Sens. Environ. 2012, 120, 102–112. [Google Scholar] [CrossRef]
- Pontius, R.G.; Millones, M. Death to Kappa: Birth of quantity disagreement and allocation disagreement for accuracy assessment. Int. J. Remote Sens. 2011, 32, 4407–4429. [Google Scholar] [CrossRef]
- Schumann, G.; Matgen, P.; Hoffmann, L.; Hostache, R.; Pappenberger, F.; Pfister, L. Deriving distributed roughness values from satellite radar data for flood inundation modelling. J. Hydrol. 2007, 344, 96–111. [Google Scholar] [CrossRef]
- O’Grady, D.; Leblanc, M.; Gillieson, D. Relationship of local incidence angle with satellite radar backscatter for different surface conditions. Int. J. Appl. Earth Obs. Geoinform. 2013, 24, 42–53. [Google Scholar] [CrossRef]
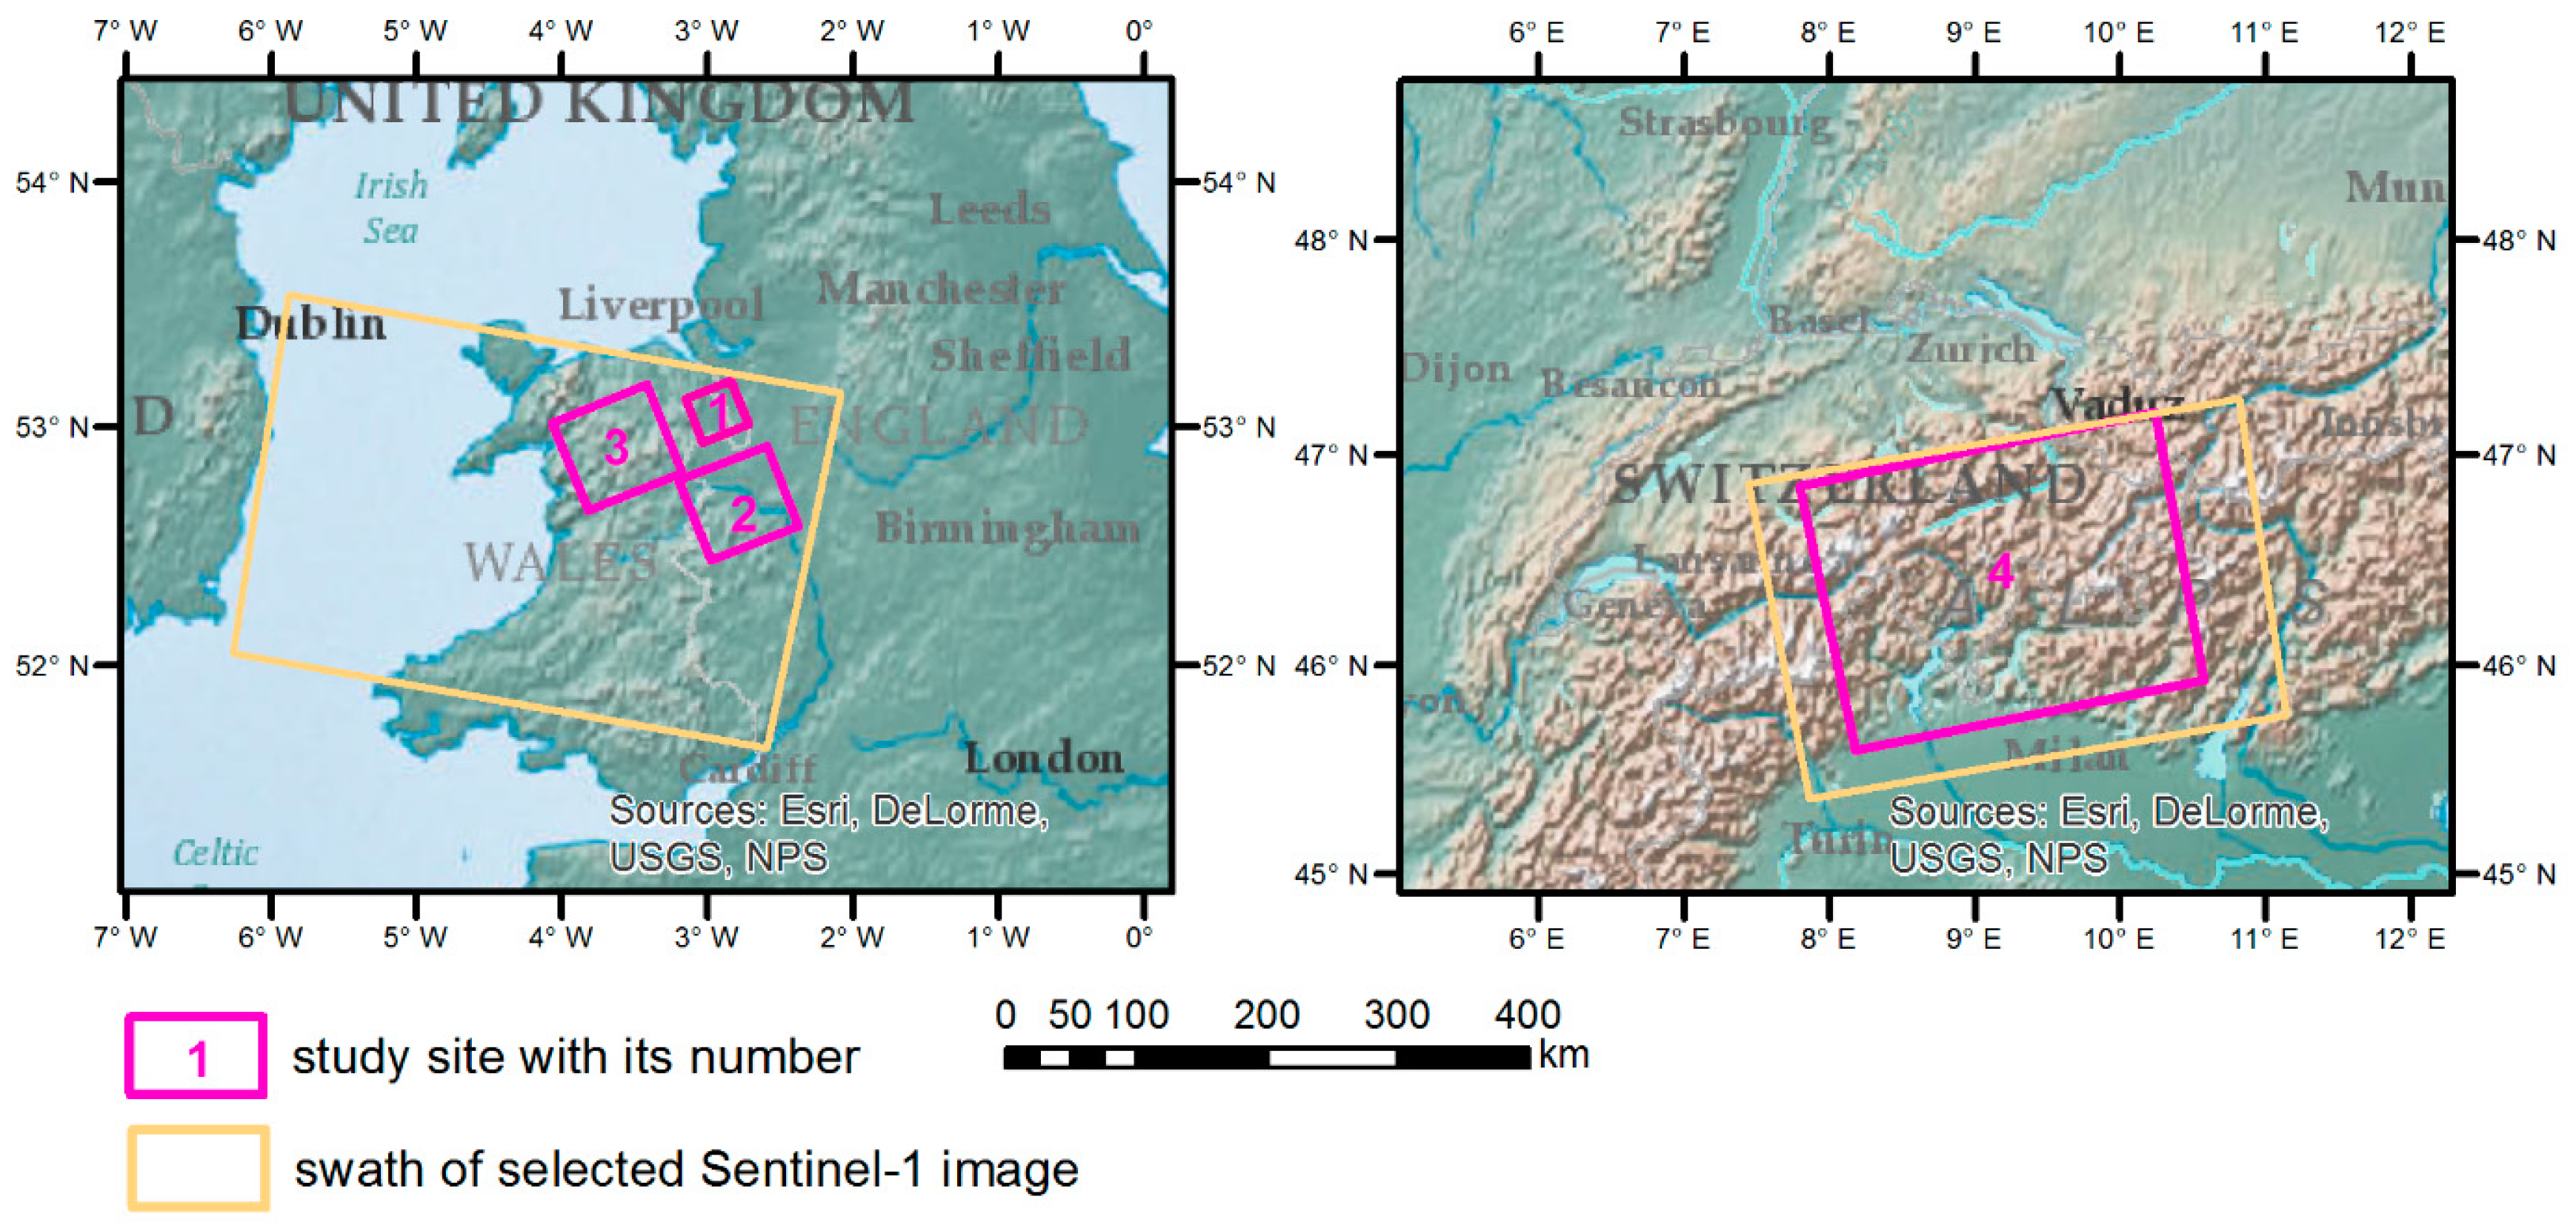
| Study Site | Code for Study Case | Data of Acquisition | Sensor Mode | Pass | Incident Angle | Resolution |
|---|---|---|---|---|---|---|
| 1 | Study site 1(A) | 3 December 2015 | Interferometric Wide Swath | Descending | 33.258–35.266 | 5 × 20 m |
| Study site 1(B) | 27 December 2015 | |||||
| 2 | Study site 2(A) | 3 December 2015 | Interferometric Wide Swath | Descending | 31.051–35.012 | 5 × 20 m |
| Study site 2(B) | 27 December 2015 | |||||
| 3 | Study site 3 | 27 December 2015 | Interferometric Wide Swath | Descending | 34.928–38.910 | 5 × 20 m |
| 4 | Study site 4 | 16 May 2015 | Interferometric Wide Swath | Ascending | 32.067–43.855 | 5 × 20 m |
| Study Site | Code for Study Case | SD of 1s MrVBF | SD of 1s HAND | SD of 3s MrVBF | SD of 3s HAND |
|---|---|---|---|---|---|
| 1 | Study site 1(A) | 1.301 | 2.754 | 1.043 | 11.669 |
| Study site 1(B) | 1.300 | 2.061 | 1.095 | 7.782 | |
| 2 | Study site 2(A) | 1.340 | 5.748 | 1.178 | 4.911 |
| Study site 2(B) | 1.245 | 6.347 | 0.992 | 6.015 | |
| 3 | Study site 3 | 1.288 | 21.521 | 1.021 | 19.792 |
| 4 | Study site 4 | 1.333 | 15.215 | 0.993 | 14.543 |
| Study Case | 1s MrVBF (TD %) | 1s HAND (TD %) | 1s MrVBF (TD %) | 1s HAND (TD %) | 3s MrVBF (TD %) | 3s HAND (TD %) | 3s MrVBF (TD %) | 3s HAND (TD %) |
|---|---|---|---|---|---|---|---|---|
| VH Image | VV Image | VH Image | VV Image | |||||
| Study site 1(A) | 5.0 (1.253) | 1 (1.165) | 2.8 (1.096) | 2 (0.965) | 4.0 (1.514) | 1 (1.354) | 2.9 (1.259) | 1 (1.149) |
| Study site 1(B) | 3.9 (2.147) | 2 (1.917) | 2.8 (1.824) | 3 (1.642) | 2.9 (2.714) | 3 (2.401) | 1.9 (2.240) | 4 (2.064) |
| Study site 2(A) | 2.8 (0.943) | 2 (0.824) | 2.7 (0.716) | 3 (0.665) | 1.9 (1.124) | 2 (0.954) | 1.8 (0.859) | 2 (0.782) |
| Study site 2(B) | 2.9 (0.847) | 3 (0.801) | 2.9 (0.683) | 3 (0.675) | 2.7 (0.918) | 3 (0.847) | 1.9 (0.736) | 3 (0.710) |
| Study site 3 | 2.0 (0.662) | 6 (0.578) | 1.1 (0.640) | 8 (0.548) | 1.8 (0.611) | 1 (0.580) | 0.9 (0.591) | 5 (0.561) |
| Study site 4 | 2.0 (0.627) | 1 (0.820) | 2.0 (0.678) | 1 (0.869) | 1.9 (0.480) | 1 (0.586) | 0.9 (0.541) | 1 (0.623) |
© 2017 by the authors. Licensee MDPI, Basel, Switzerland. This article is an open access article distributed under the terms and conditions of the Creative Commons Attribution (CC BY) license (http://creativecommons.org/licenses/by/4.0/).
Share and Cite
Huang, C.; Nguyen, B.D.; Zhang, S.; Cao, S.; Wagner, W. A Comparison of Terrain Indices toward Their Ability in Assisting Surface Water Mapping from Sentinel-1 Data. ISPRS Int. J. Geo-Inf. 2017, 6, 140. https://doi.org/10.3390/ijgi6050140
Huang C, Nguyen BD, Zhang S, Cao S, Wagner W. A Comparison of Terrain Indices toward Their Ability in Assisting Surface Water Mapping from Sentinel-1 Data. ISPRS International Journal of Geo-Information. 2017; 6(5):140. https://doi.org/10.3390/ijgi6050140
Chicago/Turabian StyleHuang, Chang, Ba Duy Nguyen, Shiqiang Zhang, Senmao Cao, and Wolfgang Wagner. 2017. "A Comparison of Terrain Indices toward Their Ability in Assisting Surface Water Mapping from Sentinel-1 Data" ISPRS International Journal of Geo-Information 6, no. 5: 140. https://doi.org/10.3390/ijgi6050140
APA StyleHuang, C., Nguyen, B. D., Zhang, S., Cao, S., & Wagner, W. (2017). A Comparison of Terrain Indices toward Their Ability in Assisting Surface Water Mapping from Sentinel-1 Data. ISPRS International Journal of Geo-Information, 6(5), 140. https://doi.org/10.3390/ijgi6050140


