1. Introduction
Nowadays, quick and easy transportation has been an essential part of modern society, but traffic congestion will become worse without big changes in citizen’s travel behavior towards more efficient, sustainable and environmental travel alternatives [
1].
Different solutions have been explored for solving those issues, and it is important to know what actually is causing the traffic congestion. Interesting to note, according to [
2], the average number of passengers per car (taking into account regular vehicles with five passengers, including the driver) for the European countries is approximately 1.45 passengers. This means that vehicles are often running in low occupancy, only 29% occupancy, and sometimes even unoccupied. Collaborative mobility, such as sharing traveling resources (e.g., carpooling, ridesharing, car sharing) and time (rescheduling and reordering joint activities), has caught the attention of a larger number of researchers. Numerous studies have already shown the impacts of collaborative mobility on the environment, the transportation system and its effects on the behavior of people (see, e.g., [
3,
4,
5,
6,
7]). Other studies analyze the factors that are influencing the collaborative activities. The work in [
8] conducted a survey to analyze people’s views regarding carpooling activities. The results showed that 55% of the respondents did not carpool because of the difficulty in finding someone with a similar location and schedule, and 45% prefer the flexibility of solo driving. Another survey made by [
9] showed that the poor carpooling schedule and trust level between strangers are two major obstructions for carpool activities. The question that arises in this context is how we can solve those issues in order to attract more people towards collaborative mobility.
Recent technological advances in nomadic and wearable devices (smartphones and smartwatches) combined with the market penetration of portable technologies and the latest developments in transportation are emerging as an attractive option for large-scale sensing of human behaviors [
10]. Sensor technologies embedded in the mobile devices carried by travelers can generate unprecedented amount of data related to human mobility patterns [
11]. One can argue that today, we have the technologies and tools to solve those issues. The solution can be the combination of the collaborative mobility schemes with the existing technologies and the development of new data-driven ITS [
12]. In this context, ITS should offer individual-based, real-time information about all of the users and sharing alternatives and advise them which sharing solution to choose in particular situations in order to save money, time and be also flexible. In this context, it is crucial to automatically collect and process the massive datasets generated, in order to detect travel patterns and possible interaction between the system participants without the intervention of the respondents [
13].
In this context, the main objective of this study is to derive an indicator for revealing potential collaborative mobility options between individuals using automated data collected from smartphone sensors. This indicator can be used by ITS in order to provide recommendations for all combinations of collaborative mobility sharing systems (e.g., carpooling, parking sharing, car sharing). The proposed indicator must take into consideration individual preferences, the schedule of the entire chain of activities and be sensitive to dynamic changes in different scenarios. At the same time, the method proposed must be simple enough in order to be able to perform the computation in almost real time.
The remainder of this paper is structured as follows. In
Section 2, we frame the current study in the transportation sharing services research domain. We present also the contribution in a survey of methodologies for extracting activity duration and location from GPS traces. The proposed collaborative mobility indicator is defined in
Section 3, followed by the experimentation and results in
Section 4. Finally, we outline the discussion and perspectives in
Section 5 followed by the conclusions of the paper in
Section 6.
2. Related Work
In the first part of this section, we frame the current study in the transportation sharing services research domain and formulate the research question and the motivation behind this research. In the second part of this section, we analyze related work for extracting activity duration and location from raw data of GPS traces collected. This is the first important step in order to transform the meaningless raw data collected into knowledge that can be used by both researchers in analyzing the process and ICT systems in computing the data provided.
2.1. Collaborative Mobility Services
There are different sharing solutions available as private and public services, which involve different resources, conditions and operation procedures. We can categorize these services into joint sharing and concurrent sharing services. While in joint sharing (e.g., carpooling), the objective is to group more people into fewer cars, in concurrent sharing (e.g., car sharing, parking sharing), the target is to intensify the resource usage. In this study, we explore a solution to combine the above services in a single Collaborative Mobility (CM) system. The question that arises is how the CM can be assessed in the combination of services in such a way that all of those services can complement each other. Thus, the concept of the CM system proposed in this study is characterized by the following features:
The resources that can be shared among the users can be both private resources (e.g., private cars), but also resources provided by public or private third parties (e.g., car sharing system, parking lots)
The ITS collects on a continuous basis the travel patterns and preferences for all users in a closed environment system
For joint sharing services, users must be matched for simultaneous usage of a resource (e.g., a car). This requirement is applicable for both recurring trips (carpooling) and for instant ridesharing (dynamic ridesharing)
For concurrent sharing services, compatible users must be matched so that they can use the resources without overlapping
ITS acts as a recommendation/advisory system, measuring the compatibility for using different combinations of resources by a group of users
The objective of CM at the system level is to match users in order to maximize the resource usage combining different services to be used by compatible users. At the individual level, the objective is to ensure that the total cost of each single individual is less than if they would not use the collaborative sharing system.
Even if the literature has emphasized the importance of the above-mentioned services in traffic congestion problems, much of the literature pays particular attention to only parts of those services and objectives and rarely in combined methodology. In the remainder of this section, we present the most relevant literature for this topic.
The traveler’s matching problem is one of the most important features and recently has attracted more attention in the literature [
14]. The work in [
15] focused on the optimization problem of finding efficient matches between passengers and drivers. Optimization algorithms for complex matching ride systems are also explored in [
16]. A real challenge for the high-dimension matching problem is the development of complex recommendation systems. The work in [
17] explores the required functions that must be implemented in the future recommendation systems for massification of ridesharing matching problem. Some fast algorithms are proposed to generate the shortest path considering different requirements ([
18,
19]), while they do not consider the involved cost evaluation of each provided solution. In this paper, we propose an indicator that can be used by a recommendation system to assess the CM between compatible individuals, considering also the total cost involved (i.e., flexibility, time and monetary costs).
The impact on travelers’ behavior and on transport system costs is relatively unexplored in the literature. Some studies evaluate the matching of individuals in sharing systems using only preferred departure times and different matching strategies in real time ([
20,
21]). Other studies quantified the reduction in travel costs when sharing rides ([
22,
23]). In addition to travel cost, the proposed indicator from this study will evaluate the system cost not only for ridesharing, but multiple combined sharing services (parking sharing, car sharing) in different case studies. Moreover, it will assess the cost value not only at the system level, but also at the individual level.
Another form of joint sharing services is the semi-organized ridesharing practice, defined as flexible carpooling in the literature ([
5,
24,
25,
26]). This is gaining popularity especially where high-occupancy vehicle lanes are implemented because individuals want the benefit of using those faster lanes and reduced tolls. In this type of sharing service, passengers and drivers meet spontaneously in specific locations without any notice or exchange of information. An advantage of the flexible carpooling scheme is the provided convenience for no specific commitment. The disadvantage is that it requires a large number of users. With the proposed indicator, we aim to extend the functionality of the recommendation systems not only for the first-come-first-service basis, but also for the planned carpooling. In this case, it is possible to evaluate the recurrent, but also the dynamic ridesharing in a single metric and to choose the best options for different groups of users based on the compatibility score between individuals and available sharing solutions. Moreover, the system does not need a large number of users. In the case that no matching was found between a group of users or the compatibility score is low, a future recommendation system will send personal advice on how the behavior can be changed (e.g., rescheduling and reordering of activities) in order to increase the matching rate and the compatibility score between individuals.
With the emergence of the Internet, a number of private matching agencies emerged to provide diverse ridesharing services for travelers. The work in [
27] provides an extended review of those agencies with the conclusion that still, ridesharing has continued to decline. The main difficulties identified are the schedule, sharing the cost and choosing a specific route that is advantageous for every passenger. This indicates the need for innovative systems and services that are necessary to change people’s behavior towards a more efficient, sustainable and environmentally-friendly sharing economy.
The above challenges and limitations imply the automation of the entire process and a method for assessing each service-specific variable and constraint in a single metric. Automation of the entire process can be an attractive feature because it is removing the users’ burden task to manually input and constantly edit the journey plan, but also to search for the best sharing solutions and partners for CM. Therefore, location, origin, destination, departure time and sequence of activities must be automatically extracted from the data collected. In the following section, we inspect the methodologies for the extraction of activity duration and location from raw GPS data in order to automatically identify the sequence of activities and individual travel patterns. Those patterns will be used in this study to evaluate the proposed indicator and can be used by any recommendation system to automatize the extraction process.
The study of the repetitions in individual activity travel patterns has shown that the repetitiveness of individuals’ activities is influenced by several factors e.g., the types of activities, the accessibility of different locations and different commitments. Furthermore, [
28] showed that different types of activities have different patterns of repetition. Interestingly, [
29] demonstrate that in the period of a six-week study, 70% of all of the trips have a repetitive behavior of visiting the same 2–4 locations. Based on those findings, we can argue that using the most frequent locations of respondents, we can model and evaluate the behavior of the proposed collaborative mobility indicator.
Privacy is another challenge in the sharing services schemes, among others. One concern is the risk of exchanging private information with strangers [
30]. The loss of privacy due to the systematic data collection of the private information is another major concern [
31]. We address this issue by proposing the implementation of sharing service schemes at the organization’s level. In this paper, we explore different case studies in a closed environment where the trust is much higher between individuals and the organizations have an interest to securely keep the sensitive anonymized information in-house.
2.2. Methodologies for Extracting Activity Duration and Location
The automatic extraction of activities locations and places of interest is a mandatory requirement when studying mobility behavior, and this must accurately be done by nomadic and wearable devices. Those devices can collect a large amount of location points, represented by the position coordinates together with the date and time where the sensor captured the location information. In order to transform the raw position points data into knowledge that a machine can understand or a human can visualize and interpret, these data have to be transformed into places of interest, defined as origin and destination points. In this section, we present and compare the most relevant methodologies and algorithms used by researchers for extracting activity duration and location, using different data sources, devices, sensors, algorithms and having different precision.
In the beginning, researchers used the data obtained from different GPS devices and other traditional sources. The work in [
32] used a wearable GPS receiver and a GPS data logger to collect data from six users for seven months. Clusters of places using a variant of the k-means clustering algorithm have been used in order to detect the user’s locations and sub-locations. They integrate the results in a system that can incorporate these locations into a predictive model of the user’s movements. Several potential applications of such models are presented, including single and multi-user scenarios. The precision of the method was not tested, but they argued that this methodology can be the basis of future prediction algorithms, the relative frequency and the probability of locations in time.
In [
33], data were collected using hand-held GPS devices carried by two persons for one year. Using the classical approach, the method takes the temporal sequence of recorded locations and uses a set of decision rules, based on distance and time between points, in order to identify clusters. This agglomerative algorithm iteratively tests GPS points to determine if they remain within a given threshold distance. If the time between the first and last observed point exceeds a predefined stay duration, the cluster is assigned. Probabilistic models were developed for modeling a location history and the probabilities of being in a location in a given recurring time interval. Even if the method precision is not evaluated, this can be a starting point for future exploration of probabilistic models of location histories.
In a similar fashion, [
34] use a speed threshold criterion in order to identify activity locations from GPS records of the trucks in an open pit mine. Even if the presented algorithm is very fast, this is mainly due to the fact that the calculations are very simple, with data obtained from low-speed areas having no high variations and without taking the time into consideration. Because the method accuracy was not tested, this can be rather a complementary method to identify the GPS errors (so called “supersonic jumps”) than an efficient method for extracting activities’ location and duration.
Technological advancement in mobile devices and sensing systems made possible the collection and processing of the data in a much easier way and with higher accuracy. The work in [
35] proposed a novel approach to extract stops from single trajectories with noise using the sequence-oriented clustering method. In this method, the spatial and time information is considered as the input. The proposed algorithm is able to detect effective stops and discard the false positive stops. The reachability is represented in a graph, which illustrates the clustering structure and different levels of a specific trajectory. Even if the algorithm has a very good precision of 91.3% in recognizing the effective stops and eliminating false positive stops, it was tested only on small datasets, for short distances at a small scale. The proposed method requires high computation, loading all of the GPS locations and then computing using different tools, being suitable for small and very accurate distances. This can be a good complementary method for detecting false positive stops.
Besides the GPS data, [
36] used also accelerometer data from smartphone, using five features derived on the basis of the sensors’ characteristics and the individuality of human-travel behavior. They propose a novel method for automatically extracting trips on the basis of continuously collected data. While conventional methods are based on detecting stay areas with a boundary suffer from errors for short-distance trips, the authors showed that the proposed method was able to correctly extract the trips and suppress outliers in classifying each GPS point either at a stay or trip point. Moreover, the method uses the GPS-positioning error as a positive feature in order to classify an indoor location as a stay point. Even if the proposed method showed a promising 89.4% precision and correctly classified short-distance trips, this is more suitable for extracting trips rather than locations. Nevertheless, the GPS and accelerometer sensors are used at the maximum intensity.
To the best of our knowledge, one of the most advanced methodologies to discover places-of-interest from multi-modal smartphone data is presented in a study done by [
37], which consider two different levels of aggregation or clustering in order to obtain the points of interest. In the first level of clustering, the location points are grouped into places of interest using a time-based clustering method. In the second level, the stay points are grouped into stay regions, using a grid-based clustering algorithm. A client-server system has been installed on smartphones, which collects location information by integrating GPS, WiFi, GSM and accelerometer sensors, among others. The method employed an algorithm to learn places of interest not only from the GPS data, but also from the WiFi, Bluetooth and GSM cell phone towers. Data are stored in a local database of locations associated with each entity scanned on a continuous basis. This is an efficient method to obtain location from multi-modal mobile phone data with accuracy even in indoor places. This strategy results in significant savings of battery life, switching to different power saving modes (e.g., GPS being programmed to switch off automatically when the location is obtained with the WiFi map or the phone is static). Moreover, using this method, it is possible to reconstruct the missing location data (e.g., if the GPS is not turned on, the location is set by the WiFi network). This was one of the most suitable methodologies found, such that it is tested on a similar case study as the current paper. The only drawback is that it is much harder to replicate the results because the framework and algorithms were implemented in a private mobile application. Replicating this is a very consuming task regarding the time and resources needed, and it is not the core of this paper.
In order to obtain similar results using less resources and implementation time, we use in this study the methodology developed by [
38]. The proposed algorithm differs from the traditional approach because it does not analyze data points sequentially, but it uses GPS points to build a kernel density surface. The peaks are selected as possible location stops, and the GPS points are categorized as belonging to a trip or a stop location. The proposed algorithm has a precision of 92.3%, tested with an artificial dataset. Moreover, the code is available as a tool that can be used together with ArcGIS 10.
A side-by-side comparison between the inspected methodologies is presented in
Table 1.
3. Methodology
In this paper, an indicator is proposed that will be used for assessing the collaborative mobility between individuals, providing a single score defined hereafter as an index. The problem consists of generating a score of compatibility for carpooling, car sharing and parking sharing between two or more individuals who are willing to share the resources. The value of the index indicates if there is a compatibility between a group of users for using sharing services and the level of compatibility. This indicator has the following features and objectives:
System optimization: At the system level, the objectives are to provide a compatibility score between individuals for using sharing services in order to reduce carbon emissions, traffic congestion on the roads and the need for parking spaces, subject to:
- (a)
Minimizing the sum of total costs (reduce the cost of shareable resources);
- (b)
Maximizing the number of users that are using the sharing services simultaneously (grouping more people in fewer cars).
Individual optimization: At the individual level, the objective is to minimize the cost of each participant in the collaborative mobility scheme.
Single metric: The index provide a compatibility score combining carpooling, parking sharing and car sharing in a single indicator.
Sensitive: The value of the index reflect any change in the schedule of individuals, the number of users that share the resources, the travel path chosen or the number of resources that are shared.
Flexible: The indicator can be used to assess the compatibility between individuals for long-term sharing services, but also for instant sharing services.
3.1. General Conceptual Model of the Collaborative Mobility Indicator
The indicator should evaluate the total cost of the system, but also the individual cost of every user, considering different trade-off strategies in some cases. The mathematical problem here developed is challenging in many aspects, for instance implementing the right trade-off rules is far from trivial given the fact that travelers’ characteristics can change over time [
39]. It is a multi-objective optimization problem, involving more than one objective function to be optimized simultaneously.
All of the variables and cost values used in this paper are explained in the following list. The default cost values used in the examples and case studies presented in this paper are similar to the values found in the specialized literature (see, e.g., [
39]). Furthermore, because the case studies are done in Luxembourg, the parking fee cost is based on the public local rates.
| I | Collaborative mobility index value | |
| C | Individual cost without using sharing services | |
| Individual cost when using sharing services | |
| Cost ratio between and C | |
| Carpooling cost | |
| Parking sharing cost | |
| Car sharing cost | |
| F | Distance based costs | 0,15 €/km |
| Travel time cost | 0,17 €/min |
| Rescheduling time cost | 0,17 €/min |
| P | Parking cost | 17,42 €/day |
| Parking time | |
| O | Other trip related costs, e.g., toll, vignette etc. | |
| Weight variable for a specific cost | |
| n | Total number of users | |
Definition 1. Shareable costs are defined as the costs that can be shared between the individuals when using sharing services: F, P, O
Definition 2. Non-shareable costs are defined as the costs that cannot be shared between the individuals when using sharing services: ,
Definition 3. Distance in Time (DT) between two activities a and b is defined as the time difference between the starting () time of activities: Definition 4. Distance in Space (DS) between activities is represented by the shortest path distance in the road network between the activities’ locations.where , represent the location index and x, y are the latitude and longitude of each location. The general mathematical formulations and constraints for the proposed indicator are defined as follows:
where:
subject to:
where:
The compatibility between a group of users exists when Constraints Equations (
6) and (
7) are met simultaneously. This ensures that the sharing services are efficient both at the system level and at the individual level. Equation (
6) ensures that the sum of individual costs when persons are using sharing services is less than the sum cost of individual costs when they are not. Constraint Equation (
7) ensures that the individual cost for each single person when using the sharing services is not exceeding the cost when the individual is not using the services. The index value denotes also the level of the compatibility between individuals that are using the sharing services. The lower the value below 1, the lower the cost is, resulting in higher compatibility.
Therefore, the proposed indicator is sensitive to any individual cost as follows:
Shareable costs are divided by the number of individuals that are sharing a resource for a specific trip segment/time period.
Travel time is the individual total travel time, which is increasing in the case of a detour, and it is not shareable.
Reschedule time represents the time cost for each individual user who must reschedule his/her activities in order to synchronize with the other travelers.
Weight cost variables represents the weight of the cost for each individual. This offers a realistic cost calculation because, e.g., a user might not care about saving shareable costs, but has no flexibility for rescheduling his/her activity. In this case, the the weight of shareable costs can be zero.
In the next subsections, we present in detail the conceptual model of each of the sharing services, i.e., carpooling, parking sharing and car sharing.
3.2. Collaborative Mobility Indicator for Assessing Carpooling
Carpooling is the sharing of car journeys so that more than one person travels in a car. When travelers are carpooling, they are sharing the cost of the fuel. In our conceptual model, the costs are shared by the the segment of the trip where users are sharing the car. The cost is divided by the number of people in the car for that segment.
In this case, the collaborative mobility indicator applied for carpooling is defined as in Equation (
3), where:
subject to Equations (
6) and (
7).
The value of the index applied to carpooling represents the compatibility between two or more travelers that are carpooling together. The lower the value of the index is, the lower the cost of carpooling, resulting in higher compatibility between users, according to Equations (
6) and (
7).
3.3. Collaborative Mobility Indicator for Assessing Parking Sharing
Using the same indicator model, it is possible to analyze the compatibility index between individuals for parking sharing services. The conceptual model for parking sharing is defined as in Equation (
3), where:
subject to Equations (
6) and (
7).
In order to demonstrate the different applicabilities of the parking sharing index, we will consider the following case studies and define the model and conditions for each of them. In the first case study, we define the conditions for parking sharing between a group of car-dependent users that are willing to share the parking place in order to reduce the cost. The second case study is dealing with the usage of parking sharing in combination with carpooling.
3.3.1. Parking Sharing Compatibility Index for Car-Dependent Users
Compatibility for parking sharing between a group of car-dependent users is defined as in
Section 3.3 with the condition that the intervals when they are using the parking place do not overlap.
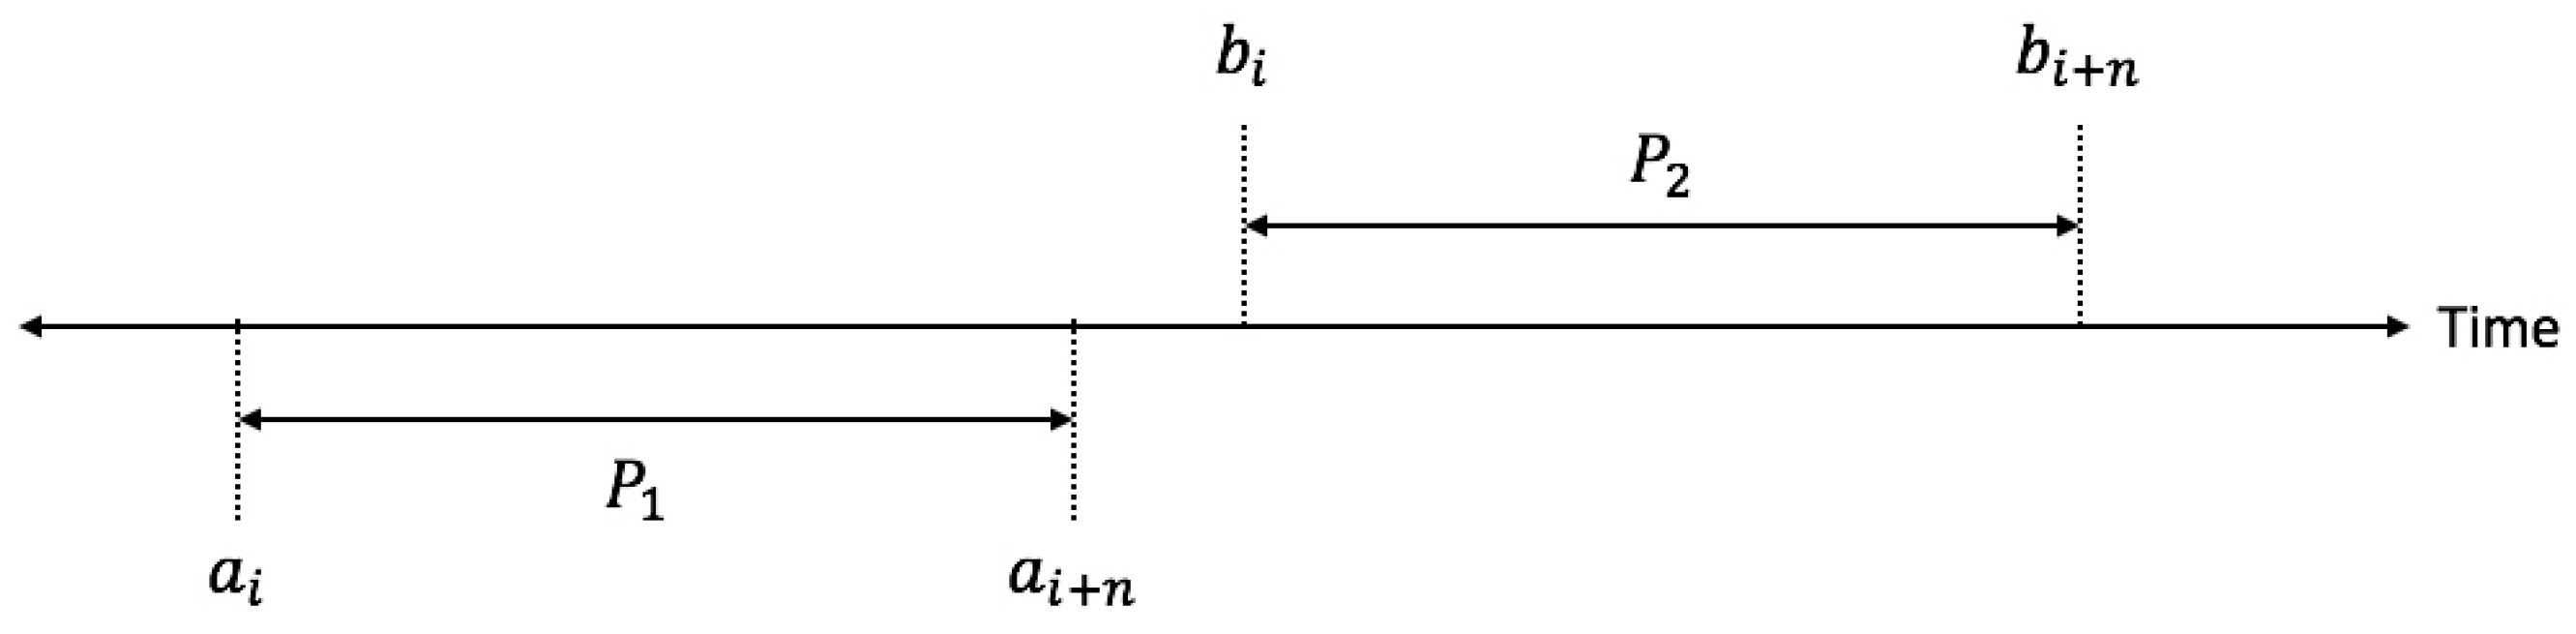
Figure 1 presents an example of how the parking is used by two persons during one day.
The intervals when each of them is using the parking place are: = [, ]; = [, ]
In this case, the condition for parking sharing is:
Constraint Equation (
15) ensures that there will be no overlapping between parking usage periods.
3.3.2. Parking Sharing Index in Combination with Carpooling
The conceptual model for assessing the parking sharing between individuals in combination with carpooling is defined as in Equation (
3), where:
subject to Equations (
6) and (
7).
3.4. Collaborative Mobility Indicator for Assessing Car Sharing
Car sharing is a resource that has a similar conceptual model and constraints as parking sharing. A vehicle booked by an individual cannot be used simultaneous by other users, as Equation (
15). There is only one single exception, when a group of users needs to use simultaneously the car sharing system and the
and
for the origin and destination are zero, then they can instantly carpool using the car sharing system.
The most efficient way of using the car sharing system in a collaborative mobility scheme is in combination with other sharing services, in our case carpooling and parking sharing. In this case, the indicator must be evaluated over a chain of activities, for a longer period, e.g., the chain of activities and the related trips between activities over a full day. The conceptual model for assessing the car sharing for a chain of trips and in combination with carpooling is actually defined as in Equations (
3)–(
5), subject to Equations (
6) and (
7).
Basically, the index is evaluating the cost when using the carpooling for part of the trip chain, sharing the parking cost and using the car sharing system for the other part of the chain trips versus the cost when using the private car for the entire trip chain, e.g., over a full day.
All of the conceptual models defined above will be tested and evaluated with real data, in different scenarios performing various experiments, in the following section.
4. Experimentation and Results
In this section, we describe the experimentation performed and results obtained together with the data collection and data processing work-flow. Data collection and data processing steps are described in
Section 4.1. From
Section 4.2, we provide different examples and case studies in order to test the indicator’s behavior in different case studies.
4.1. Data Collection and Processing
4.1.1. Architecture of the Sensing System
As discussed in the Related Work section, the market for smartphones and connected devices has opened up a world of opportunity for new applications. In this context, the studies conducted as part of this paper are based on SWIPE, an open-source platform for sensing, recording and processing human dynamics using smart devices [
40,
41].
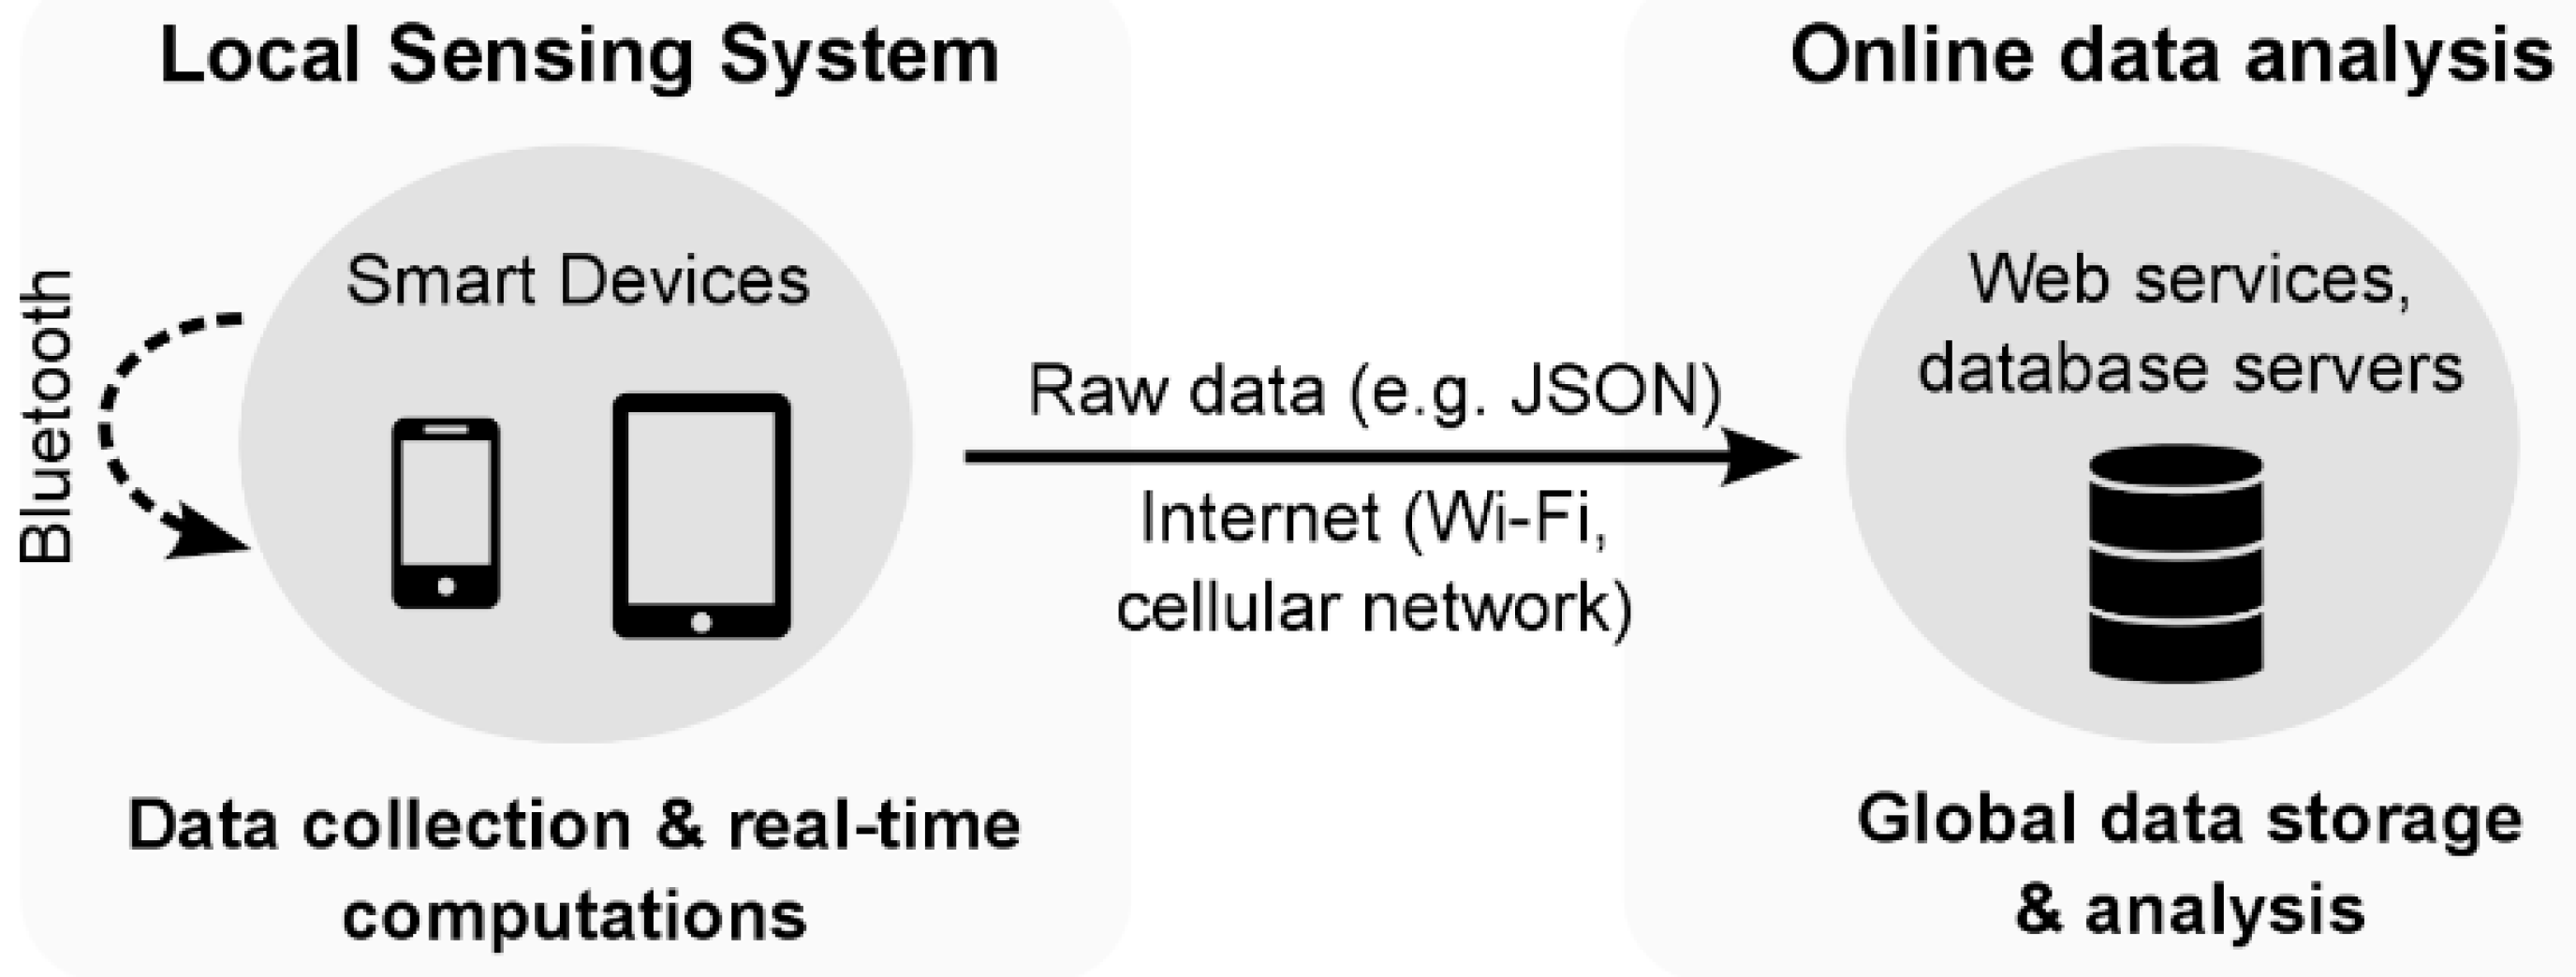
Figure 2 gives an overview of the SWIPE architecture, which consists of two main parts: a local sensing system composed of one or several smartphones and an online analytics platform where the data from multiple users and devices is aggregated and analyzed. Interested readers can refer to [
40] to get more information about the data collection parameters (e.g., sampling and recording rates) and existing energy optimization strategies.
4.1.2. Data Collection
Our study was tested inside the University of Luxembourg, where the data were collected from five employees of the university, both students and teachers, during approximately one week. The participants received a smartwatch and a mobile application that has been installed on their Android smartphone. The application was collecting in the background the data from smartphone and smartwatch sensors, sending the data to a server when the smartphone was connected to the Internet.
Even if data were collected from all of the sensors, in this paper, we use only the data regarding the location (GPS latitude and longitude) and the WiFi connections.
Table 2 gives a summary of the data collection.
As can be observed, each user reported a different number of data points collected, and the difference between some users can be quite significant. This is due to the fact that it was not possible to collect geolocalized data all of the time. In some cases, we observed that users turned off the GPS or switched the smartphone to the flight mode, e.g., during the night, when they travel or to save the battery energy. In other cases, the GPS was turned off accidentally or by the operating system in order to save energy. Once switched off, users must activate again the GPS in order to start again the collection of the data points. This explains the difference between the different numbers of location data points between, e.g., the users P2 and P5.
From the data collection summary, we can also observe that users reported a different total distance covered. This is instead related to the different travel behavior of different types of users. In our case, students and professors participated in the data collection. From their travel behavior, different hypotheses can be extracted, e.g., user P1 reported a short trip outside the country during the week and other trips between campuses. This behavior is more appropriate for a professor rather than a student, with more flexibility and traveling outside the country during the weekdays.
4.1.3. Data Processing
Data collection methods usually contain errors, resulting in out-of-range values (e.g., vehicle speed: 1500 km/h) or missing values (e.g., data collected without any GPS points). Using this type of data can produce errors if the system is not designed to filter and process this type of data [
42].
In order to clean the data, we calculate the speed between each consecutive point in order to remove any “supersonic jump” with unusual high speed. Then, all of the remaining points without a GPS location were removed because those points are not only useless for the algorithm used for the extraction of activities, but can also produce errors because of the gaps in the data without any information.
4.1.4. Data Mining for Reconstruction of Missing Locations
Location data can be acquired with errors due to several reasons. First, the GPS can be turned off accidentally by the user during data collection. In such a case, the system is collecting the data from other sensors, but not the location data. Second, due to the urban canyon effect and the smartphone position during traveling or the sitting location, the GPS was unable to detect the location or the geospatial coordinates recorded may be erroneous [
43].
For the reconstruction of the missing locations, a data mining process has been applied using existing GPS locations and WiFi information in order to reconstruct individual’s daily activity locations. Approximately one third of the GPS data have been recovered.
4.1.5. Extracting Activity Duration and Location
As discussed in
Section 2.2, in this study, the methodology developed by [
38] was used with the ArcToolbox [
44]. The algorithm requires the definition of a spatial and temporal parameter. The spatial parameter, or bandwidth value, corresponds to the kernel bandwidth (
). The temporal variable defines the minimal duration of stay that a point must meet in order to be qualified as a stop location where an activity is performed or as a trip point. Furthermore, other parameters must be defined, like resample frequency or minimum duration for a visit to a location in order to remain as an activity. The following values for the parameters were used, following the recommendation and experiments of the authors and some test that we have done to observe the highest accuracy possible:
KB = 275,
Resample frequency = 180,
Minim visit duration = 360,
minDuration2keepHS = 360.
In our particular case study, since we are studying the collaborative mobility inside a closed network of respondents that have the same workplace, our hypothesis was that the most frequent locations visited by the respondents are the home and work locations. Since the work location is known, we performed some calculations in order to derive an automatic way to extract the home location. First, we inspected the frequent activities performed by the respondents in the 9 p.m.–9 a.m. time interval and preassigned those locations with the home semantic. Another general way to find the home and workplace locations following our hypothesis is by computing the total time spent in each location. In
Table 3, we can observe that for all of the respondents, the location where they are spending most of the time during the week is the home place, followed by the workplace. Furthermore, we can see that the total time spent in other locations is in general less than the time spent at the workplace.
From
Table 3, we can observe that there is a significant gap between, e.g., time spent at home for
and the rest of the users. This denote that the algorithm was not able to classify the raw GPS points as a location because either the GPS was turned off or it was not possible to acquire the location from the respective building.
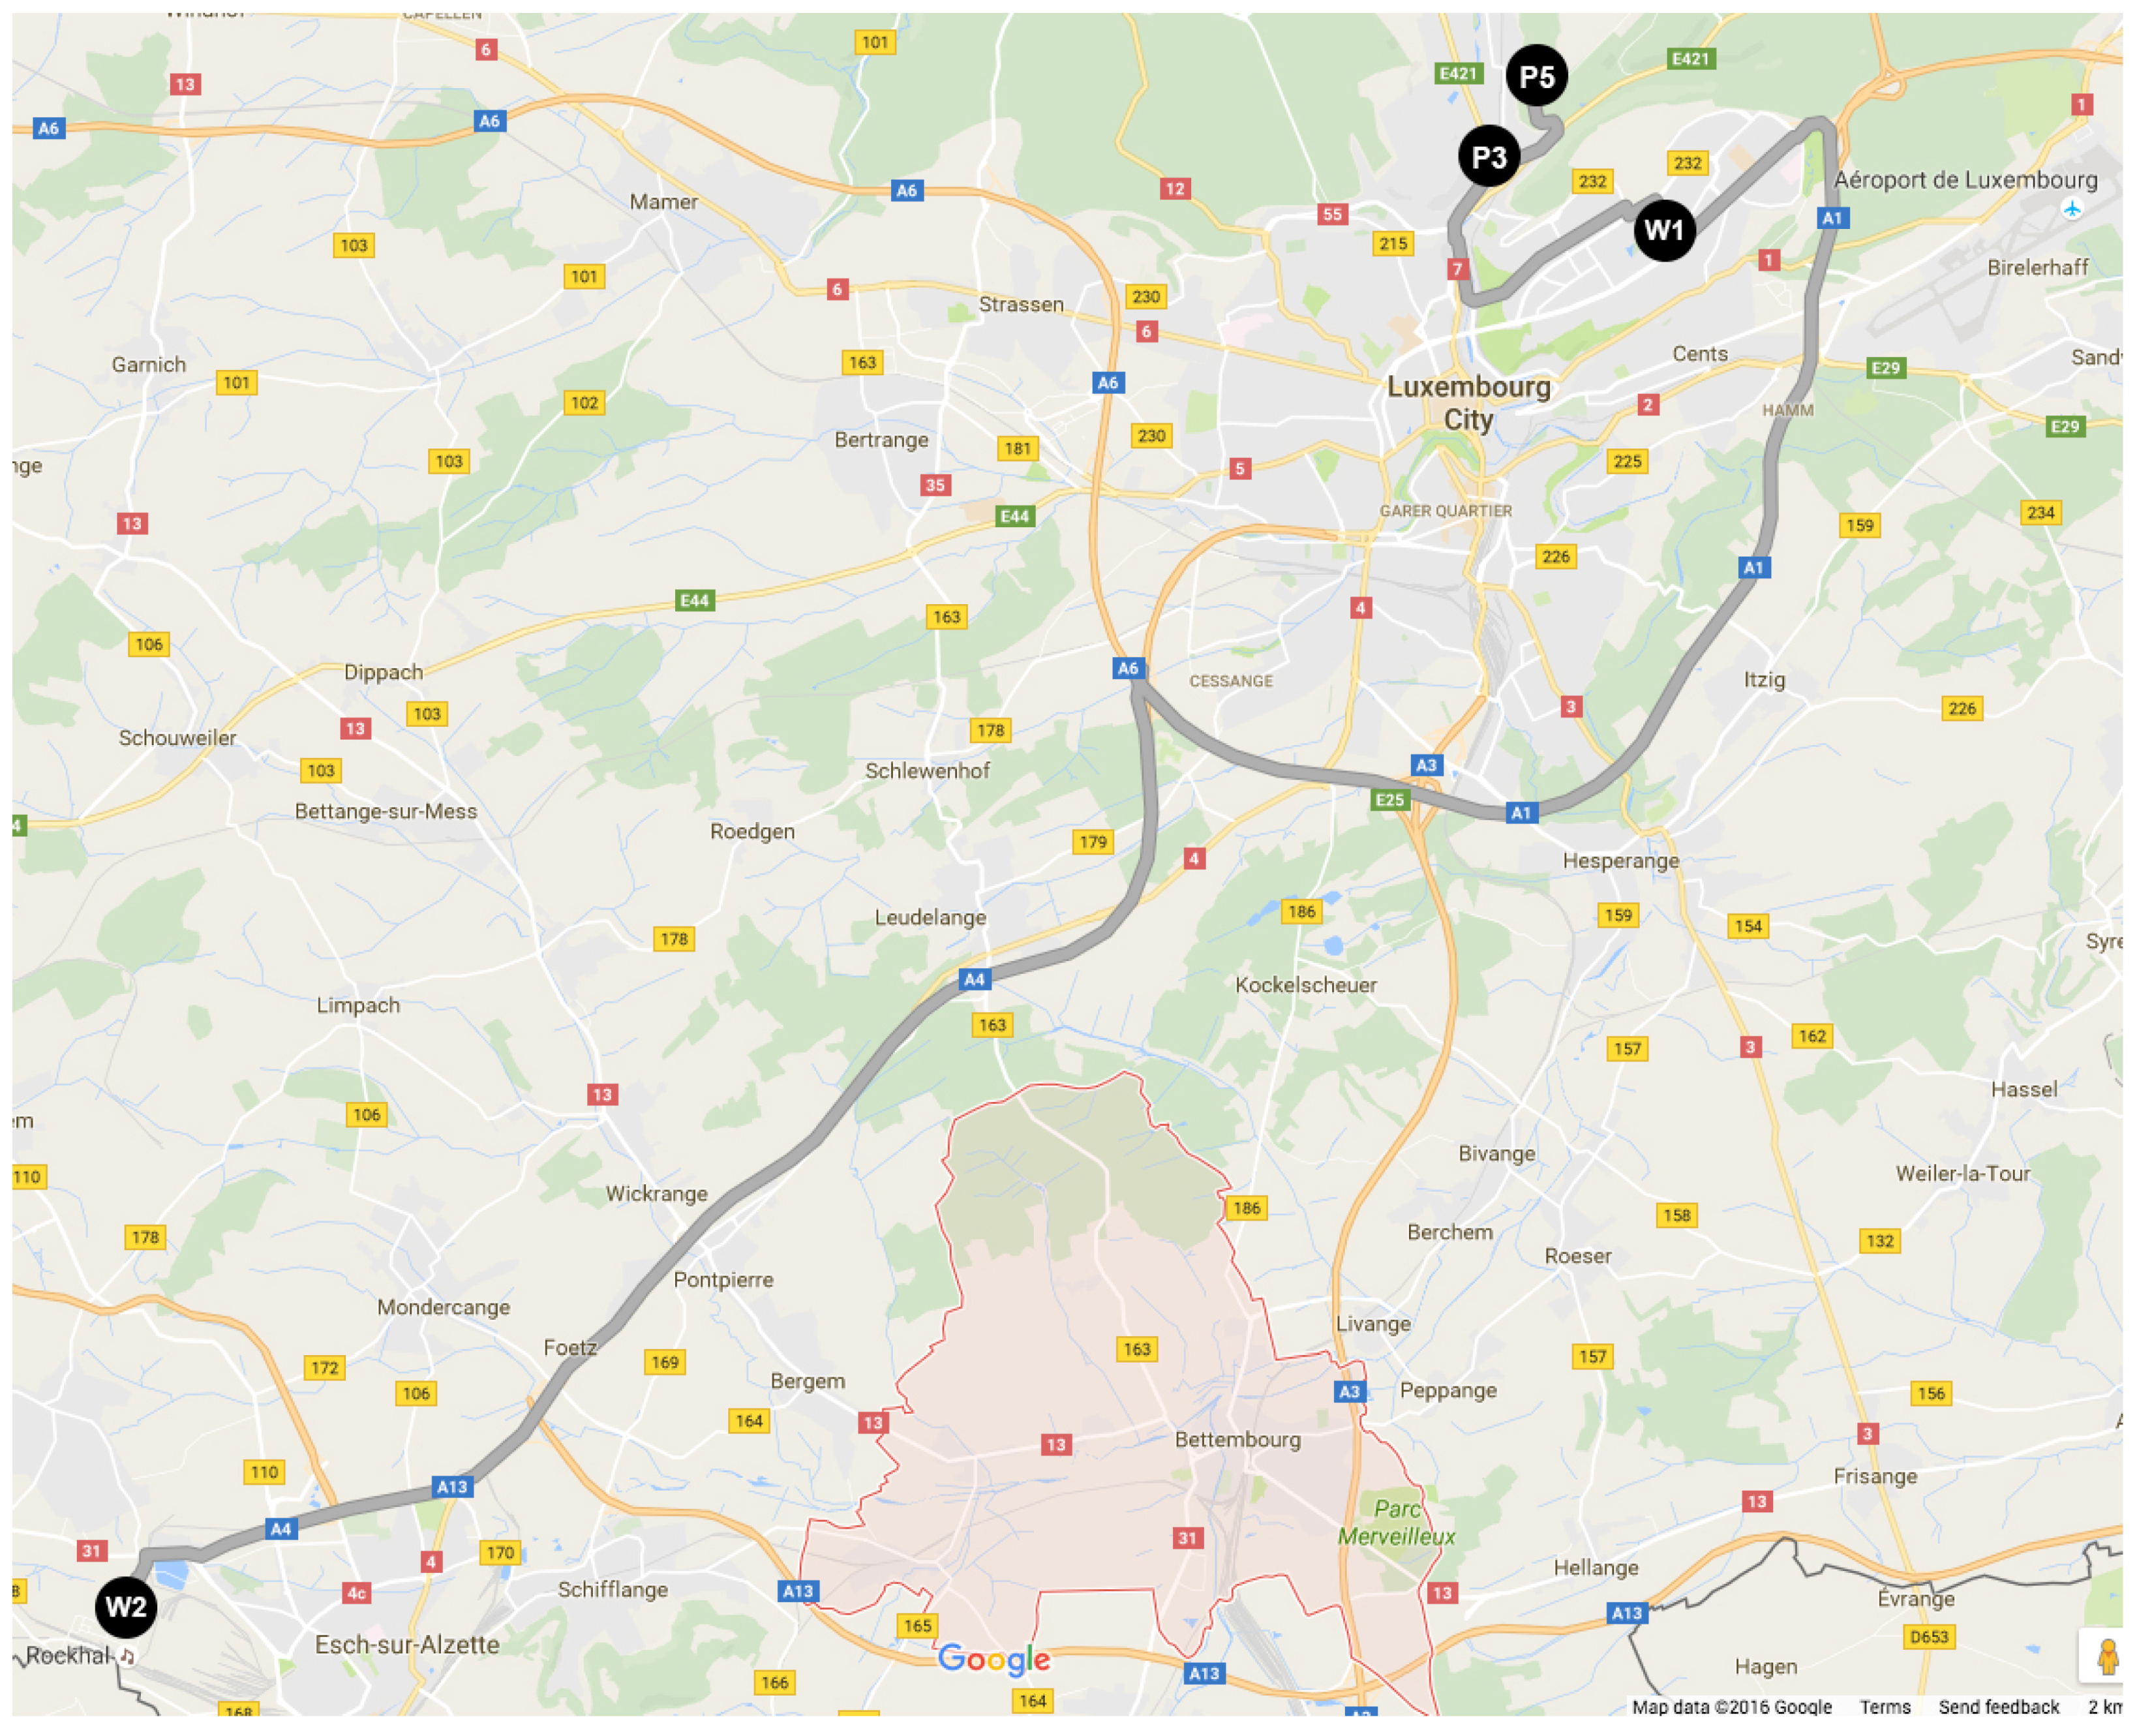
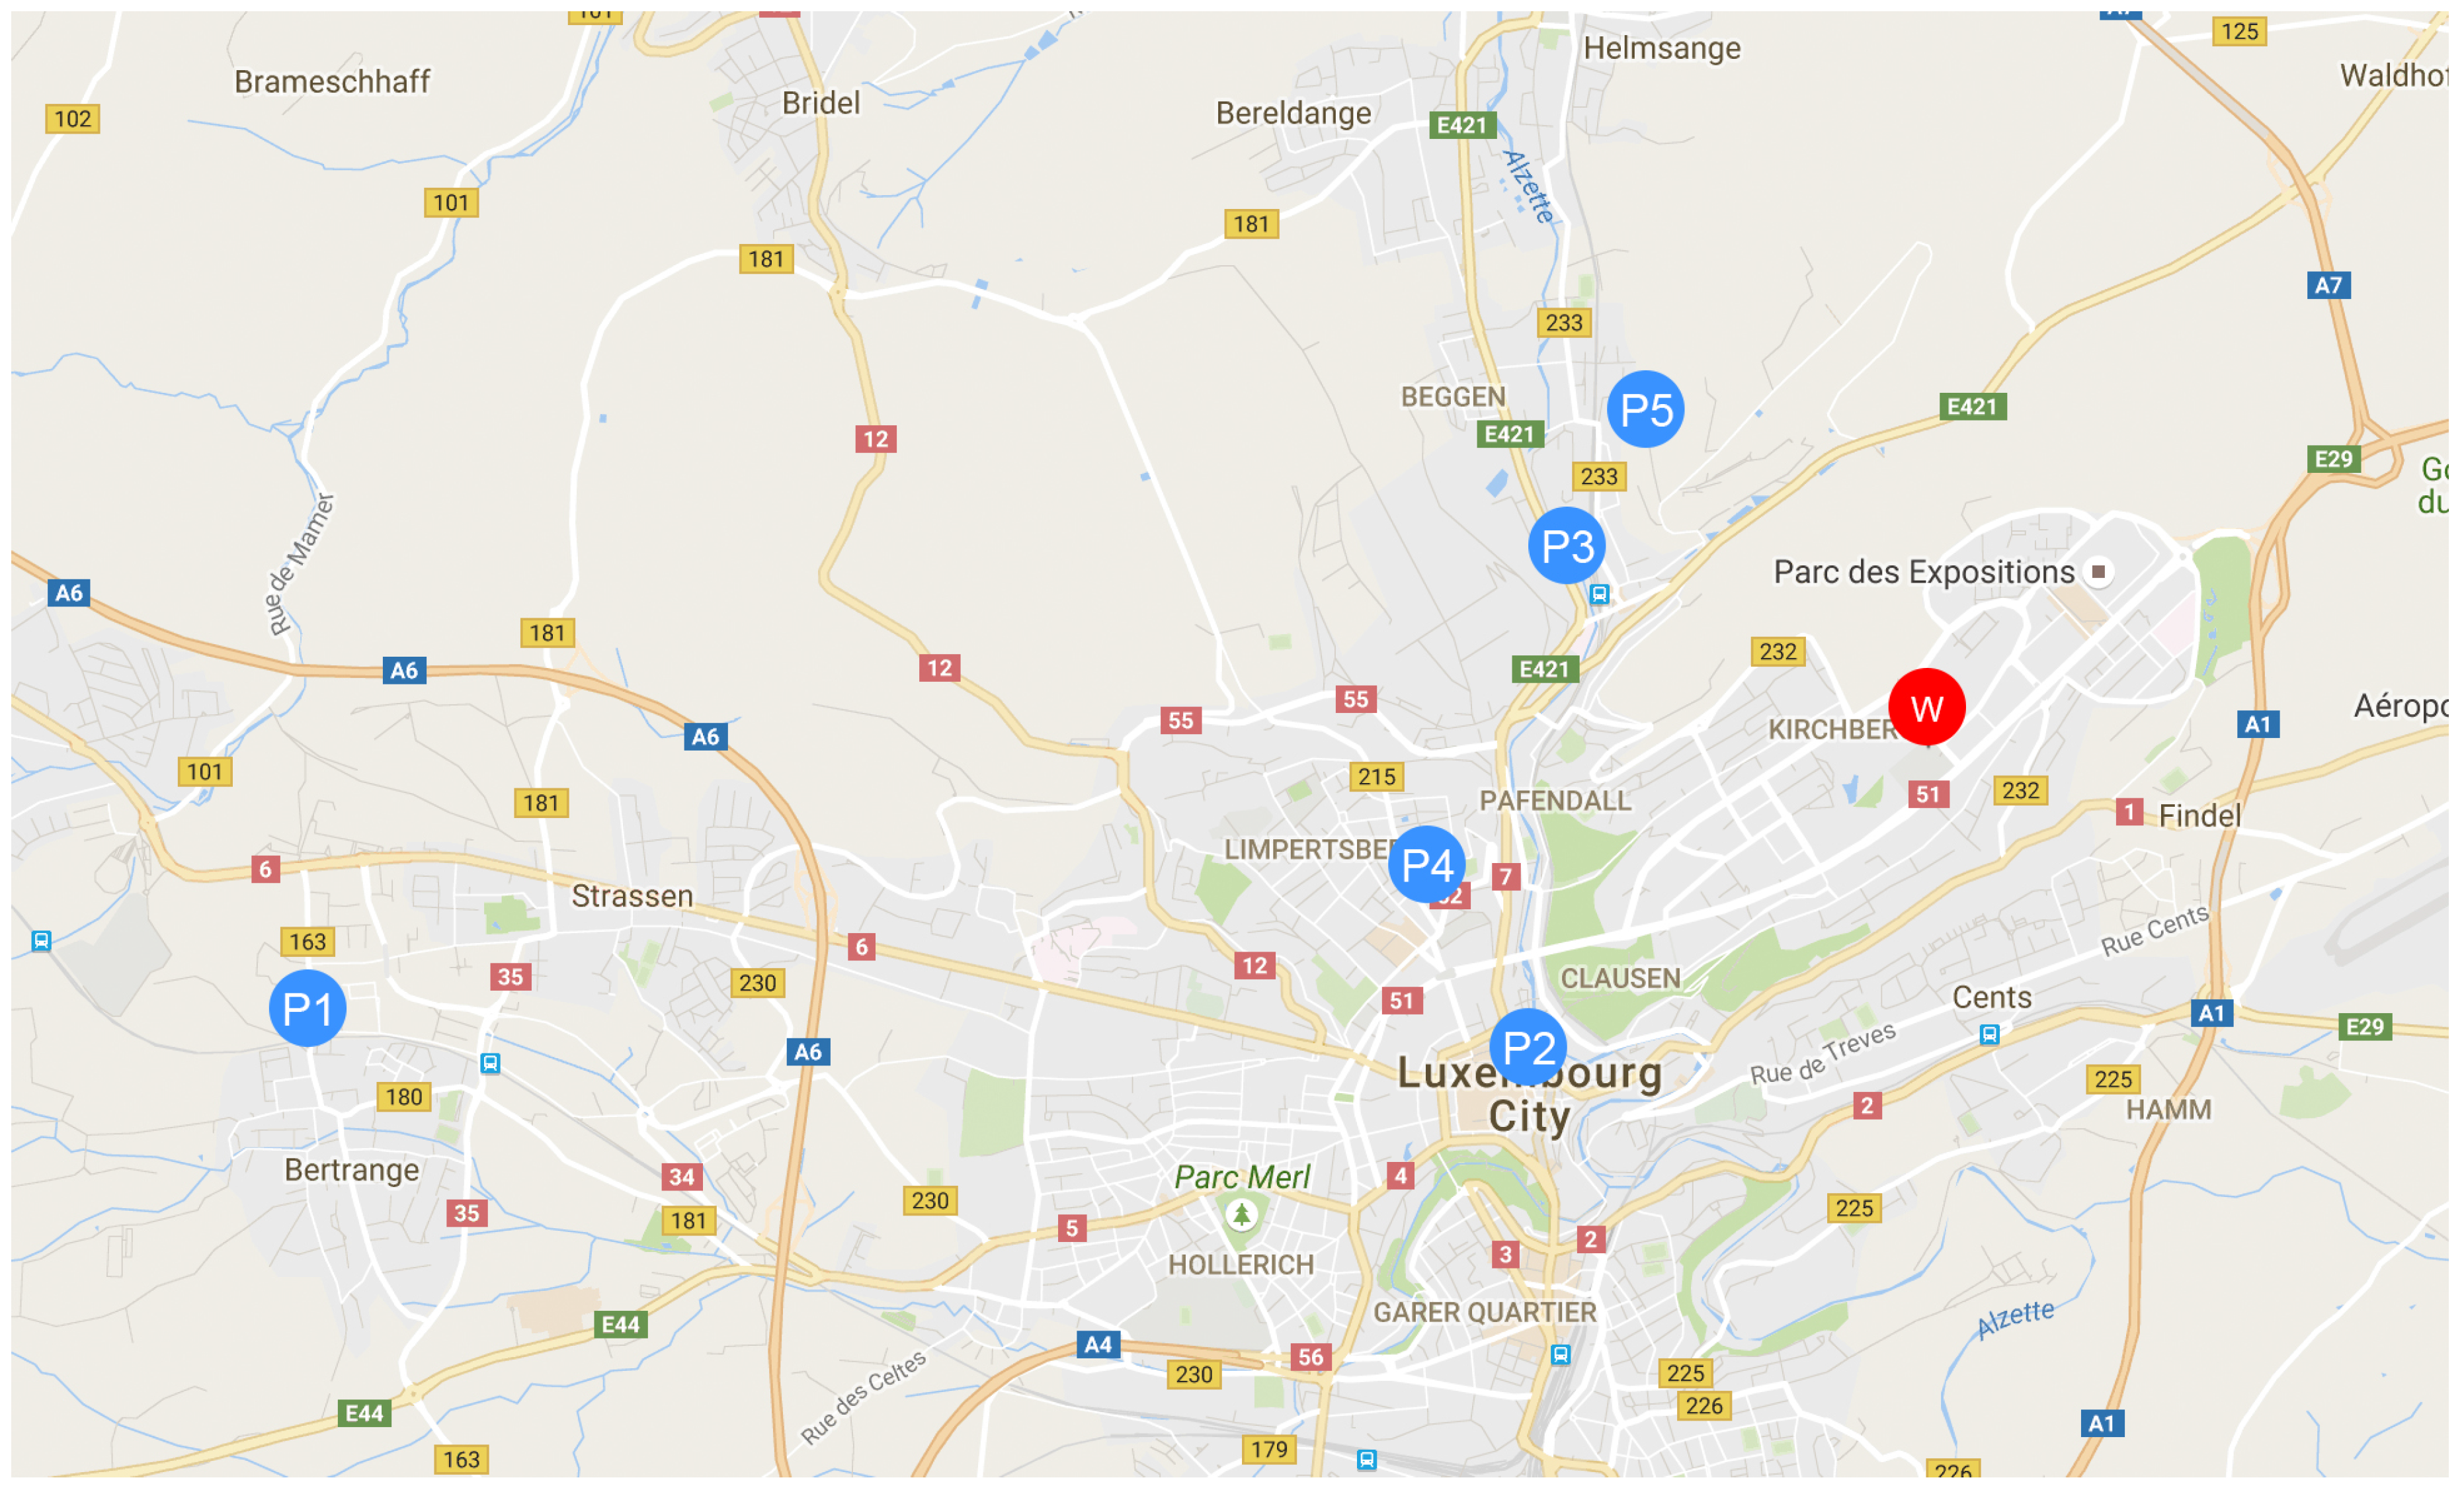
The extracted home locations of each respondent (
–
) are plotted in
Figure 3 with blue, and the common workplaces are highlighted in red. Those locations are used in the current paper to evaluate the indicator for assessing the compatibility of a group of people for using carpooling, sharing the parking or car, but also scenarios with a combined solution between all of those options.
4.1.6. Distance in Time and Space between Activities
The distance in the network between the location of activities is important information used in this study. After the extraction of the location and duration for the activity of each user, the distance in the network between all of the extracted locations was calculated, using friendly batch routing [
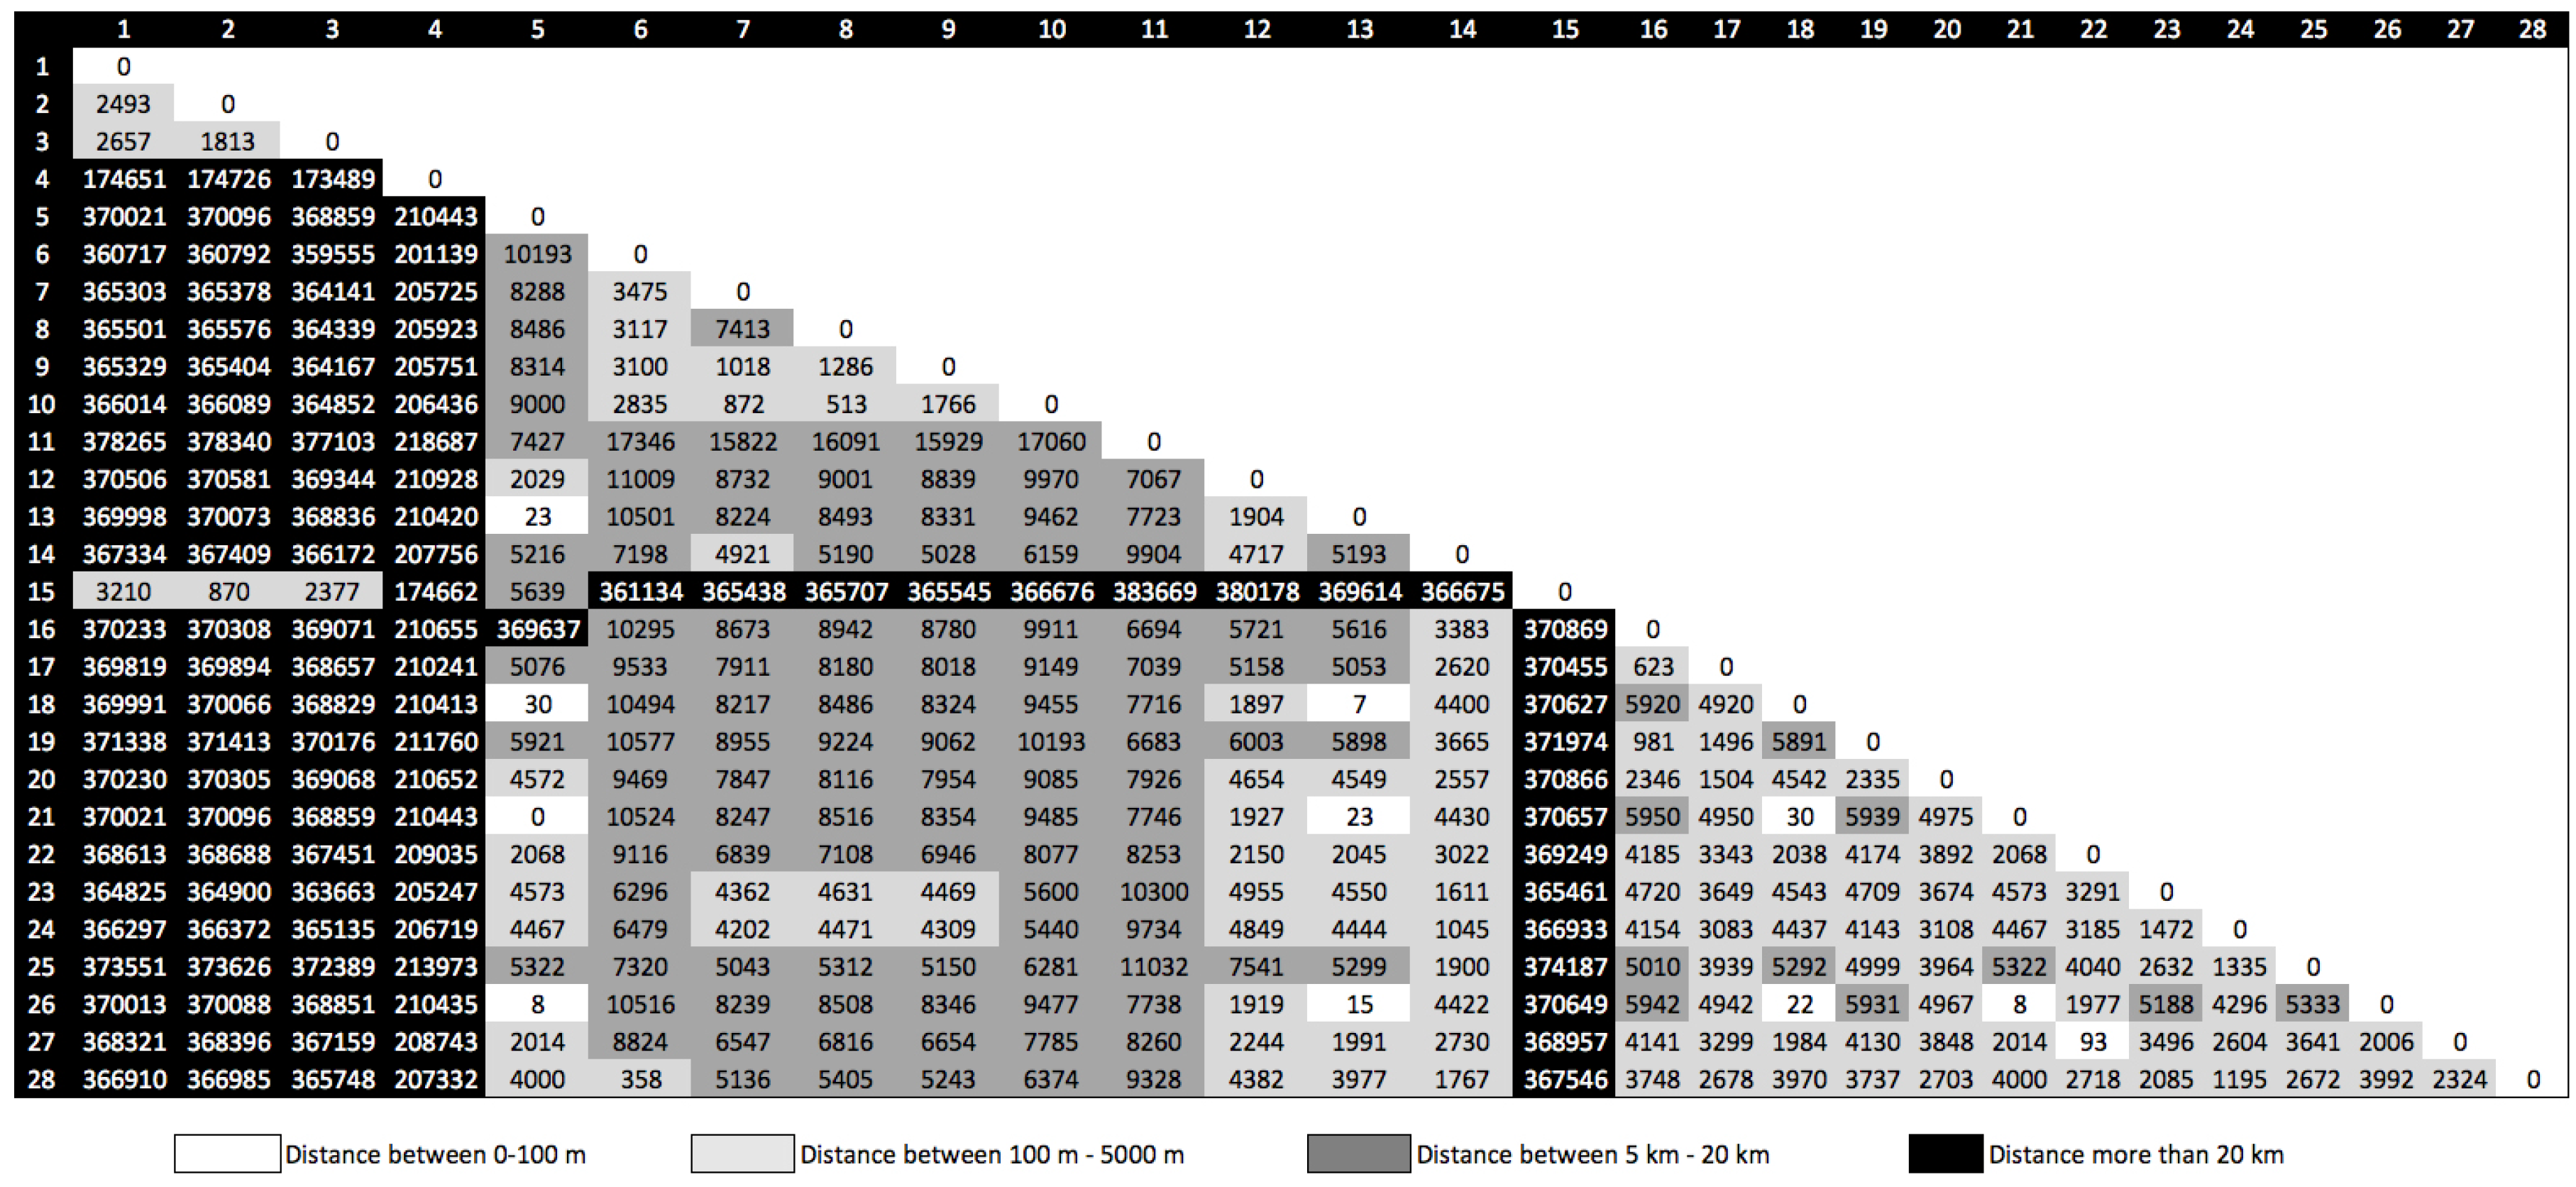
45].
Figure 4 shows the matrix of distances between all 28 locations extracted from all five users.
From
Figure 4, we can observe that some locations are very close, under 100 m. We refer to those points as common locations between users. Because the respondents from our data collection are co-workers, the common locations can be identified as representing the workplace. Other locations have more than a 20-km distance from others, meaning that the user traveled outside the city or country.
The extraction of activity duration and location data followed by the computation of the distances between activities, described in the previous sections, provide the necessary data, which will help us to further analyze the collaborative mobility.
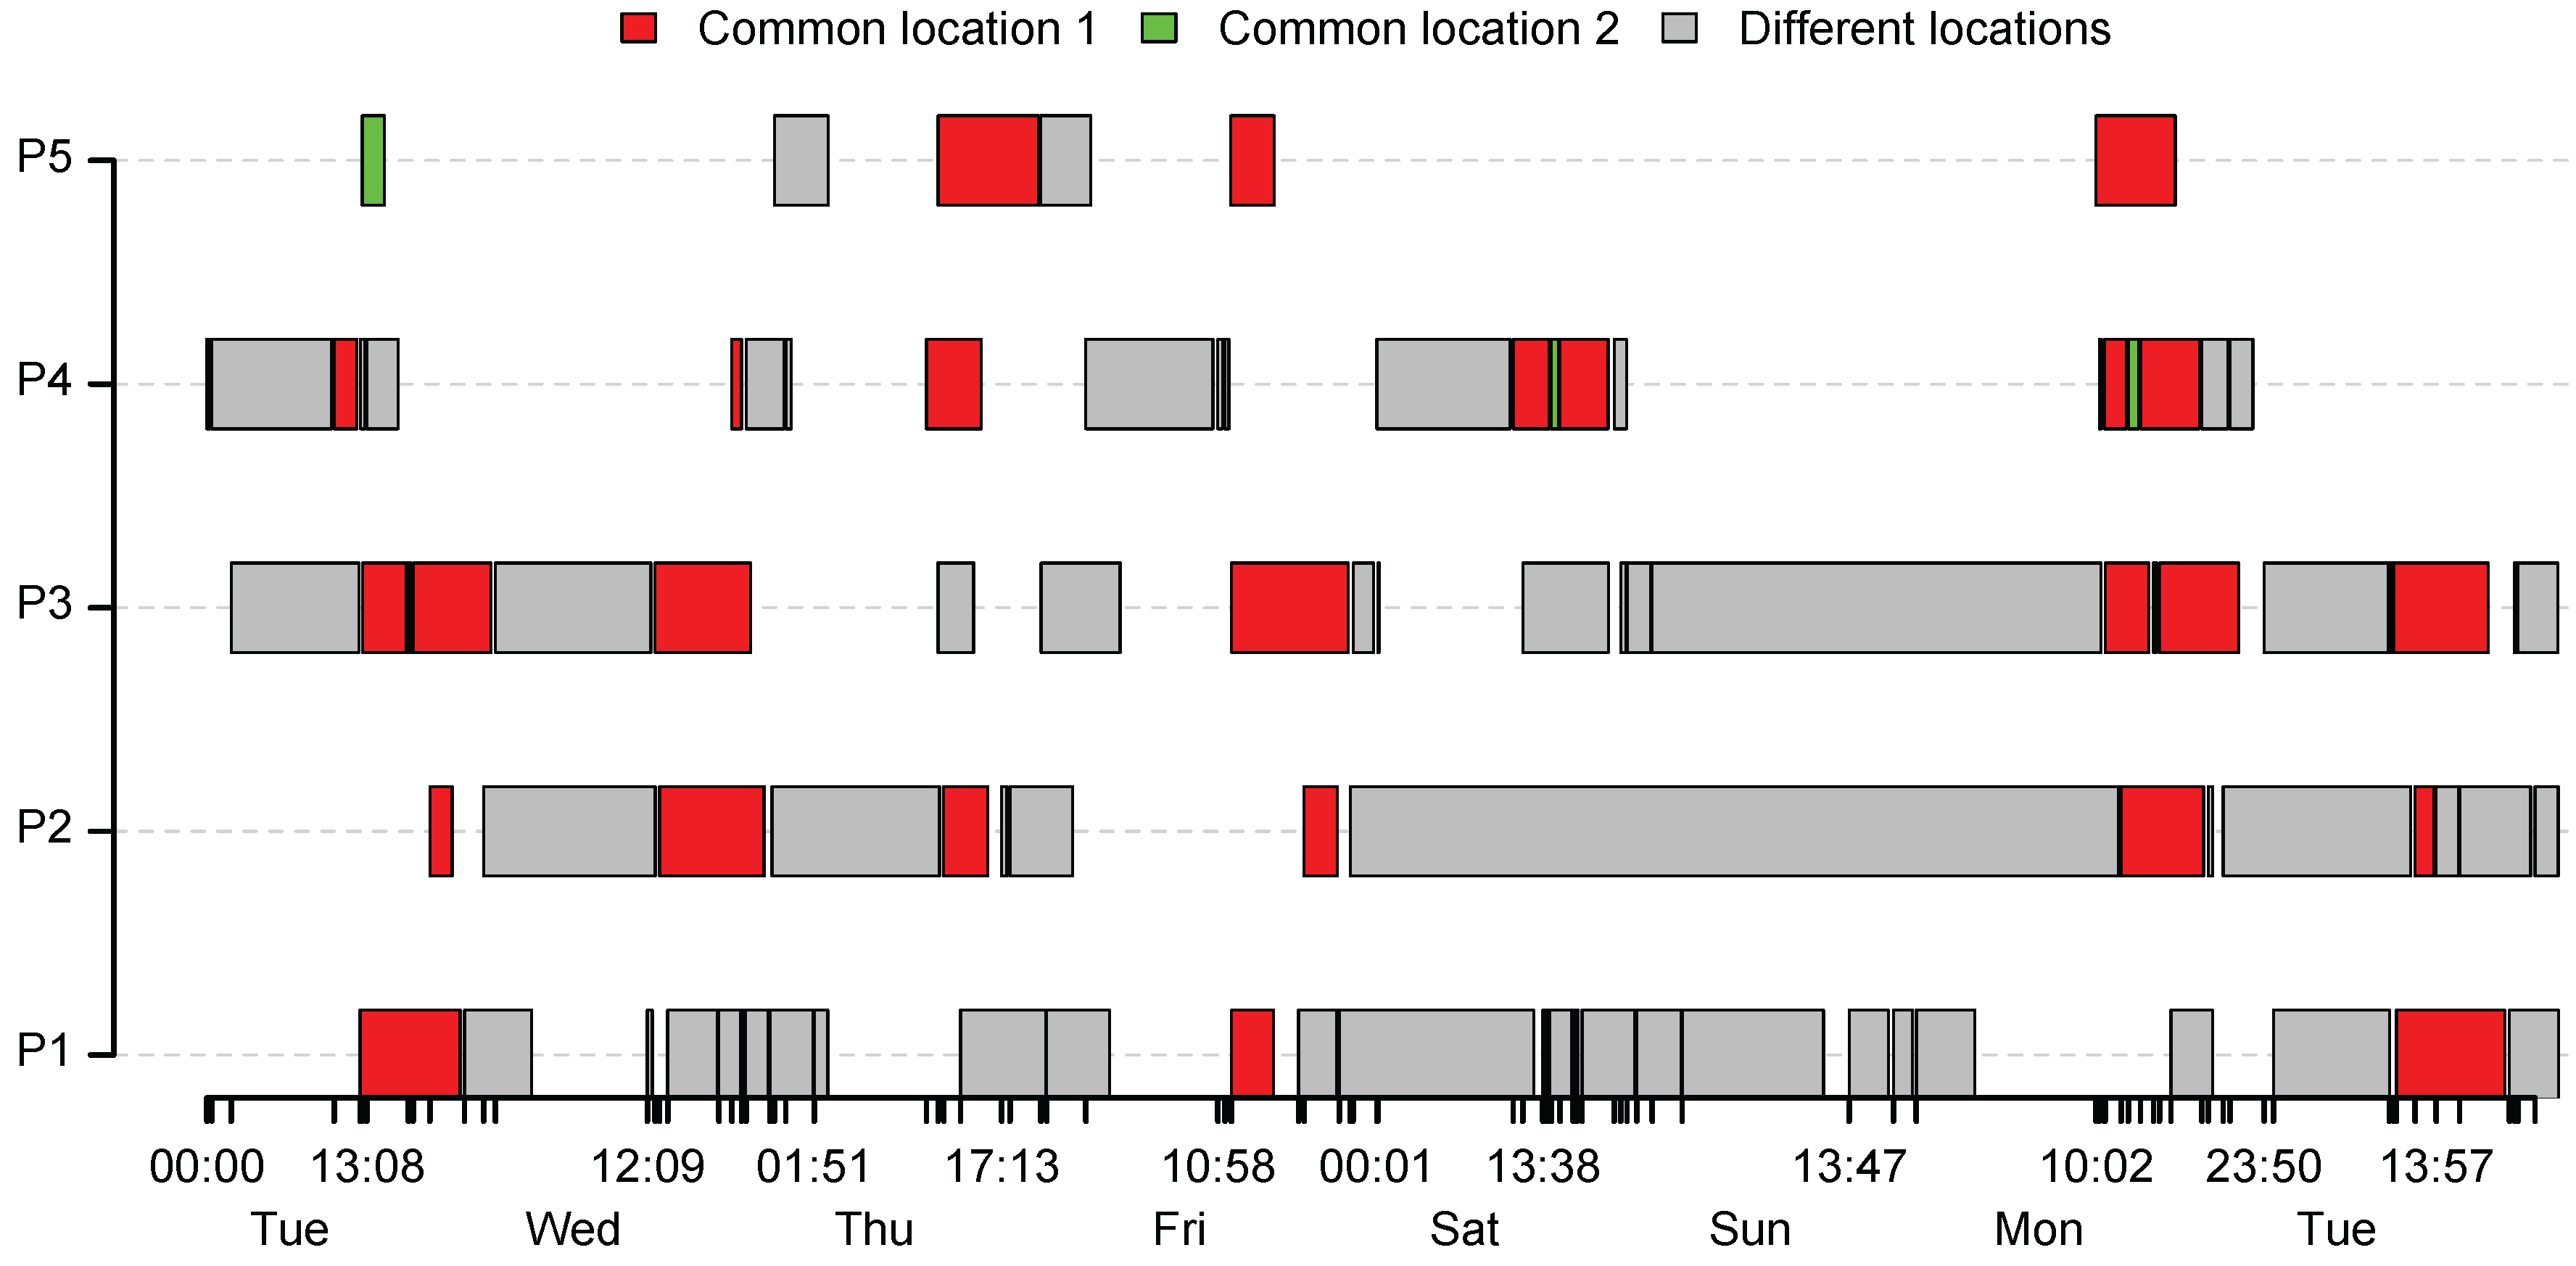
Plotting the
between the extracted activities, we obtained the sequence of activities for each individual.
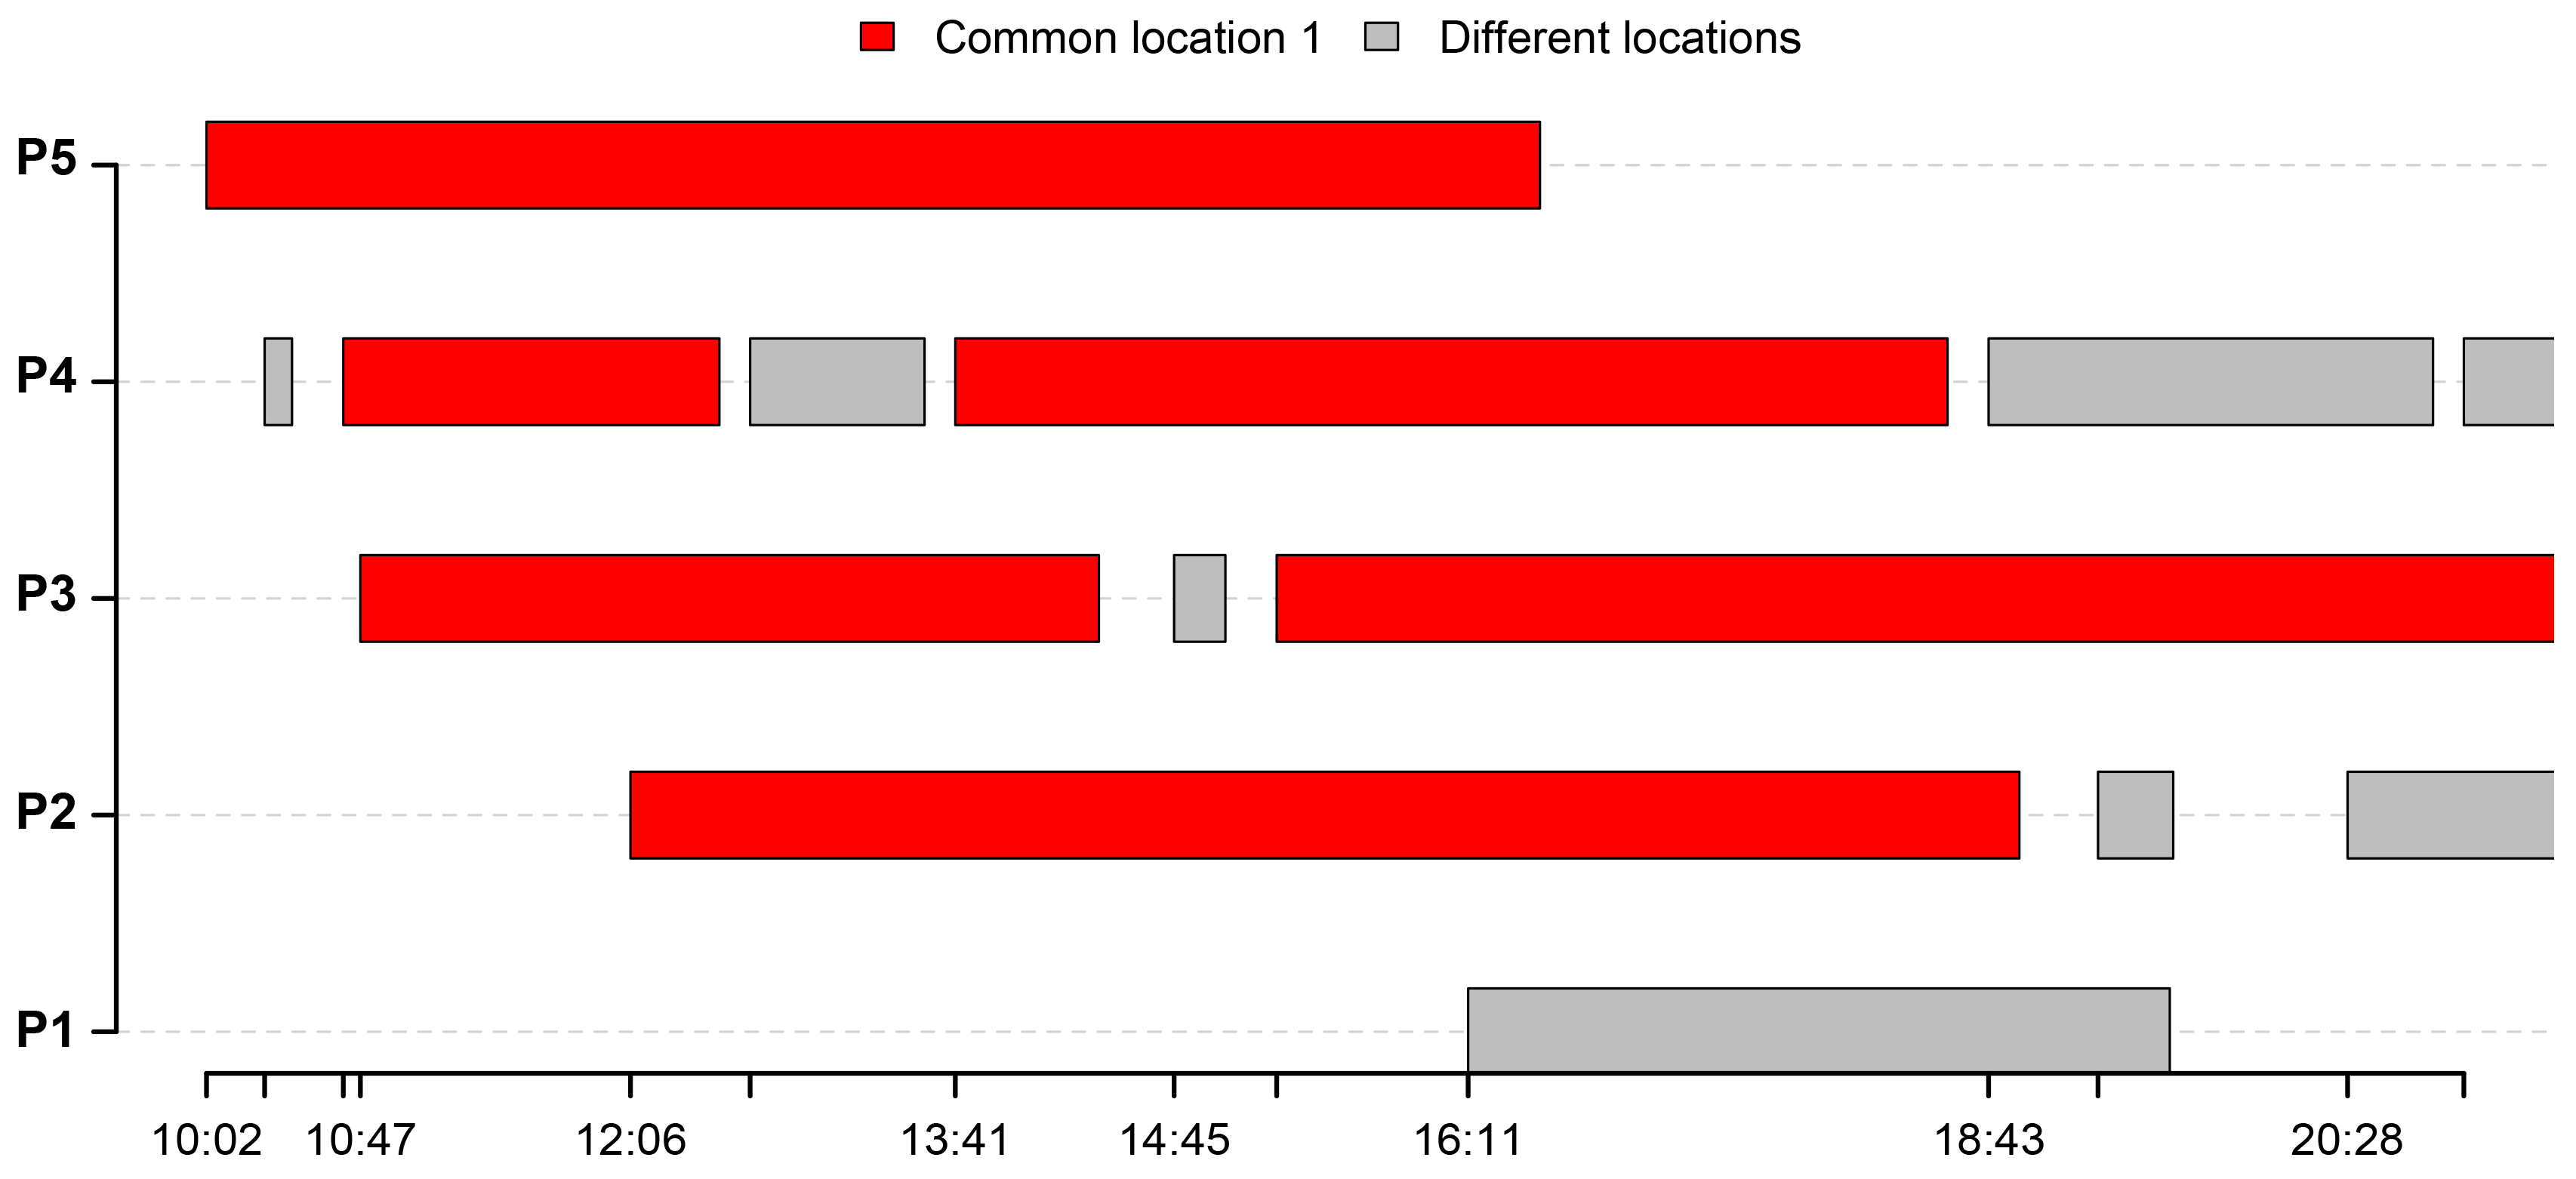
Figure 5 gives an overview of the extracted activities sequences, for all five users.
The activities that are performed in a common location are highlighted in red. In our particular case study, the common location for all users is the University of Luxembourg where all of the respondents are working. The activities performed in different locations are shown in grey. The gaps between the highlighted activities represent the time periods when the algorithm has not classified the points as a location. This is happening either if the respondents are moving or if it was not possible to acquire the GPS position. Furthermore, we can see that user and user visited the same location in different time periods, highlighted with green.
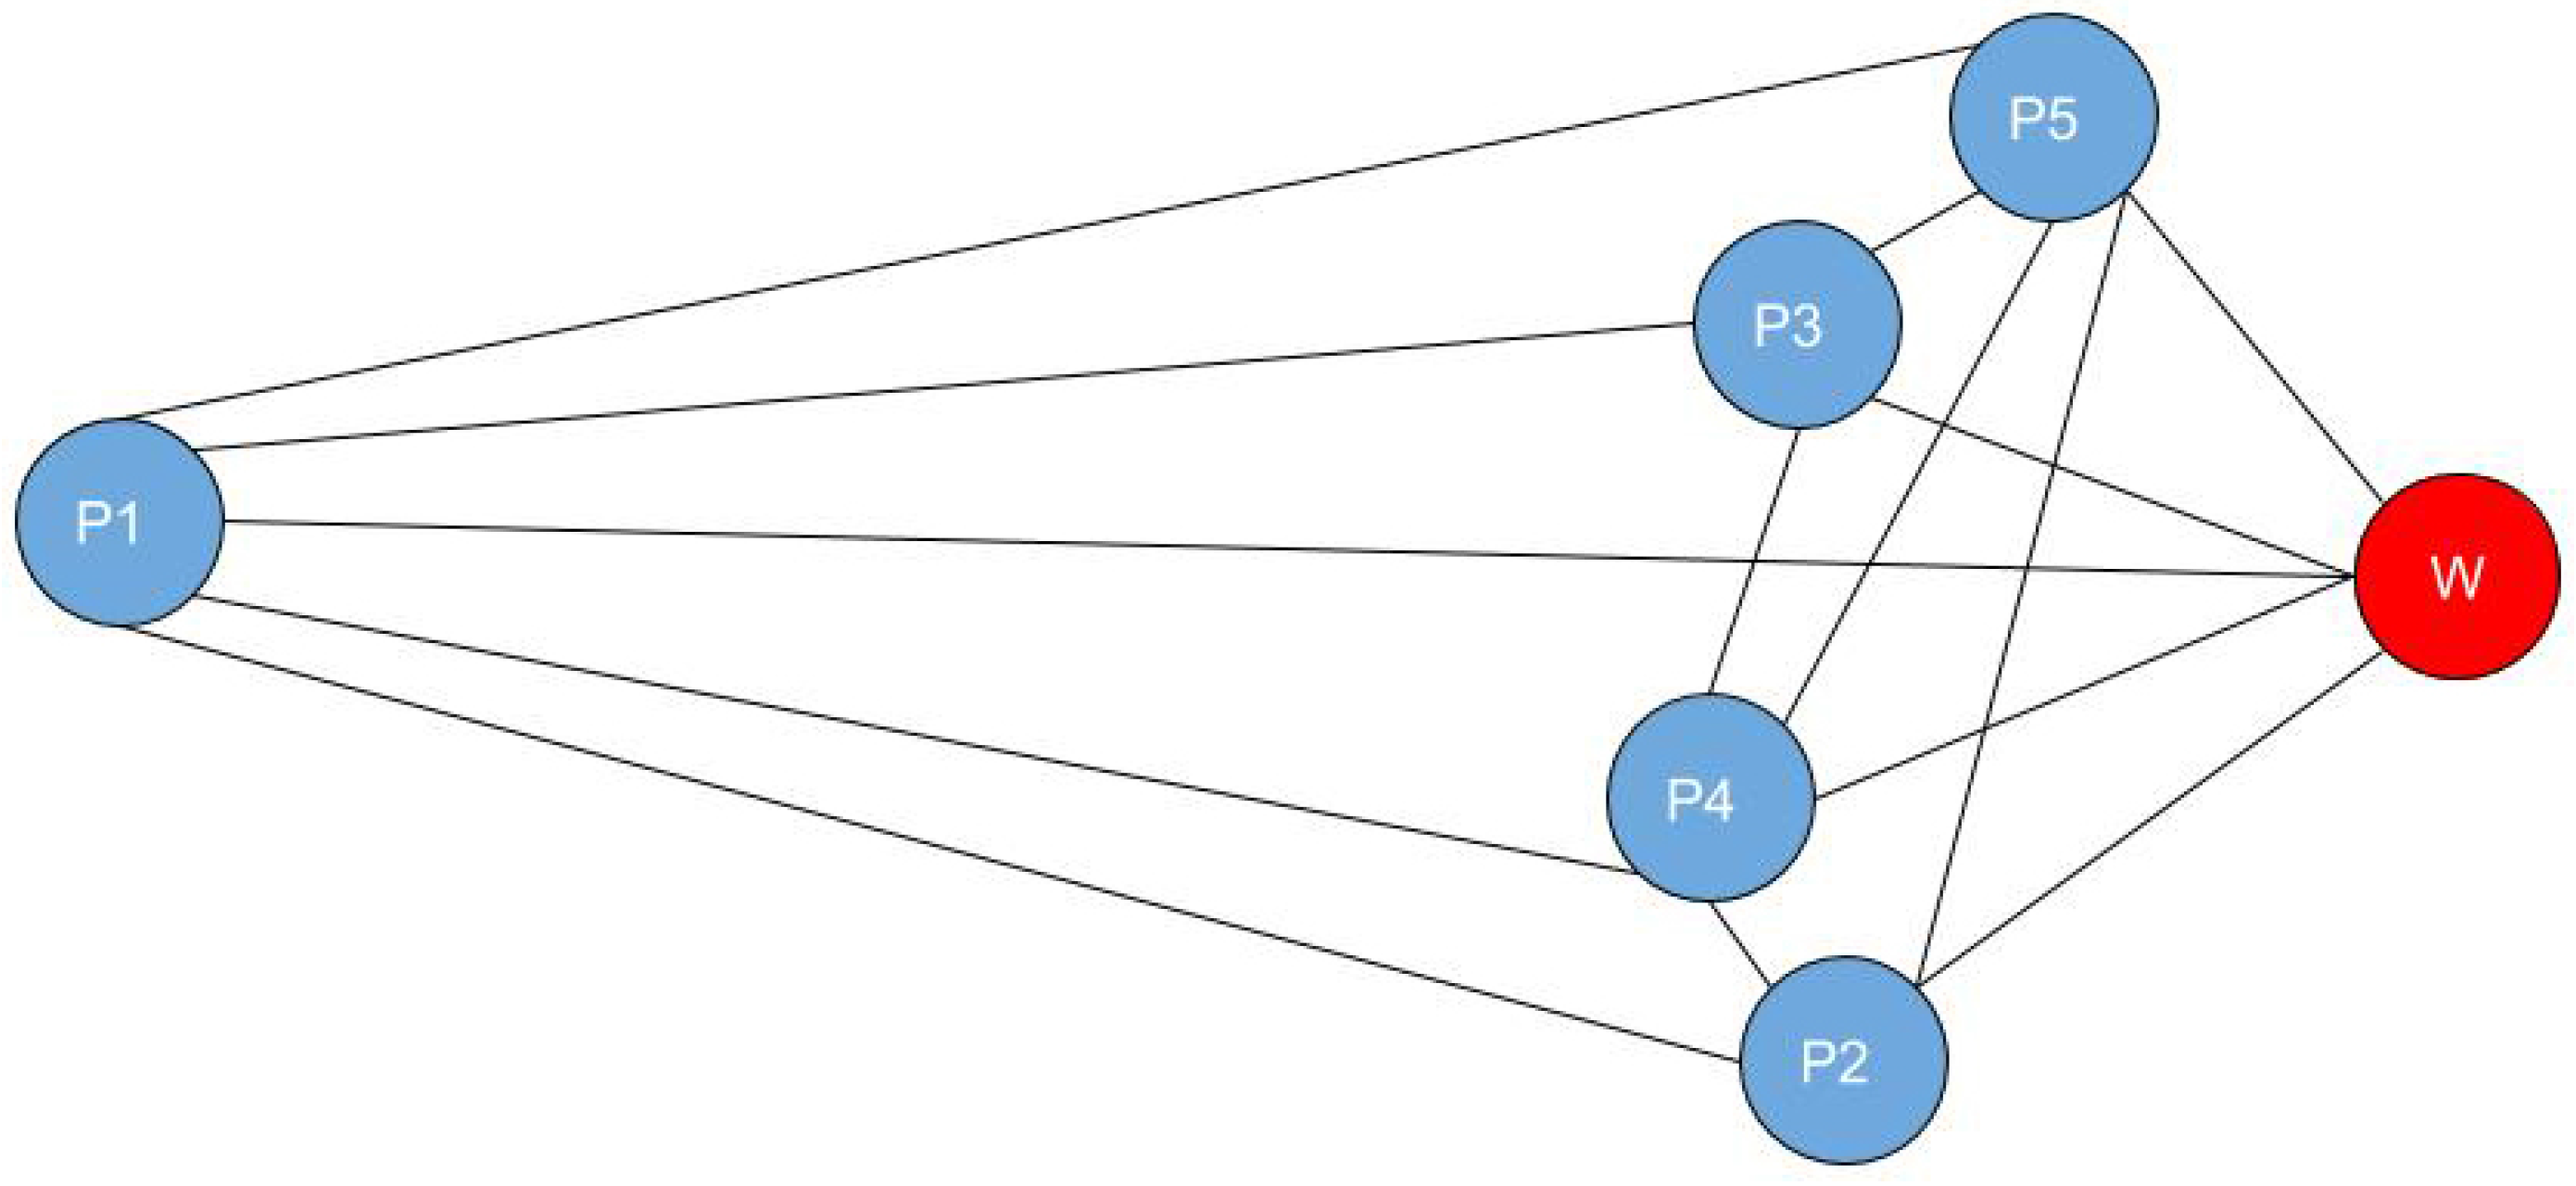
The distance in the network between home and workplace locations from
Figure 3 is presented in
Table 4.
The topological graph of distances in the network between home and work locations computed using the data from
Table 4 is presented in
Figure 6.
This will be our input data for assessing the collaborative mobility between individuals in different scenarios in order to test the behavior of the proposed collaborative index.
4.2. Collaborative Mobility Index for Carpooling
Example 1. Carpooling compatibility:
In this example, we test the compatibility for carpooling between and for work commuting. It is assumed that all users in the system have access to a private car, and they can drive alone or can offer a ride to other users. Furthermore, we consider the weight cost variable for each user (α, β, γ) as equal to one. This makes the assignment of the trips easier and also leaves the focus on the index computation.
The shortest path between
,
and the workplace is
. Using the equations and constraints from
Section 3.2, the computations are as follows:
As we can observe from the carpooling index, the requirement Equation (
6) for compatibility is met. Moreover, Condition Equation (
7) is fulfilled, meaning that the carpooling cost for each of them is less than the cost of traveling alone with their own private car. Furthermore, we can note that carpooling is even more convenient for user
, for he/she shares the entire cost of the trip with
, without any extra time because of the detour involved. For
, also the carpooling is more convenient than traveling with his/her own car even if he/she made a detour, because the cost of the second segment trip is shared with
.
This example shows how the indicator automatically provides that the overall carpooling is efficient in any trip, but also provides the benefits for each single individual. This means that based on the individual score, each user can evaluate if the economic benefit is enough for him/her and accept or deny a carpooling proposal. Even if this solution is foreseeable and can seem very simple, this method replicates the human thinking and the probability that a user will accept a sharing proposal increase. Of course, each individual has a different perception of the cost and the economic benefit, and this will be explored in the next examples where cost weight variables have different values and results.
Example 2. Carpooling incompatibility:
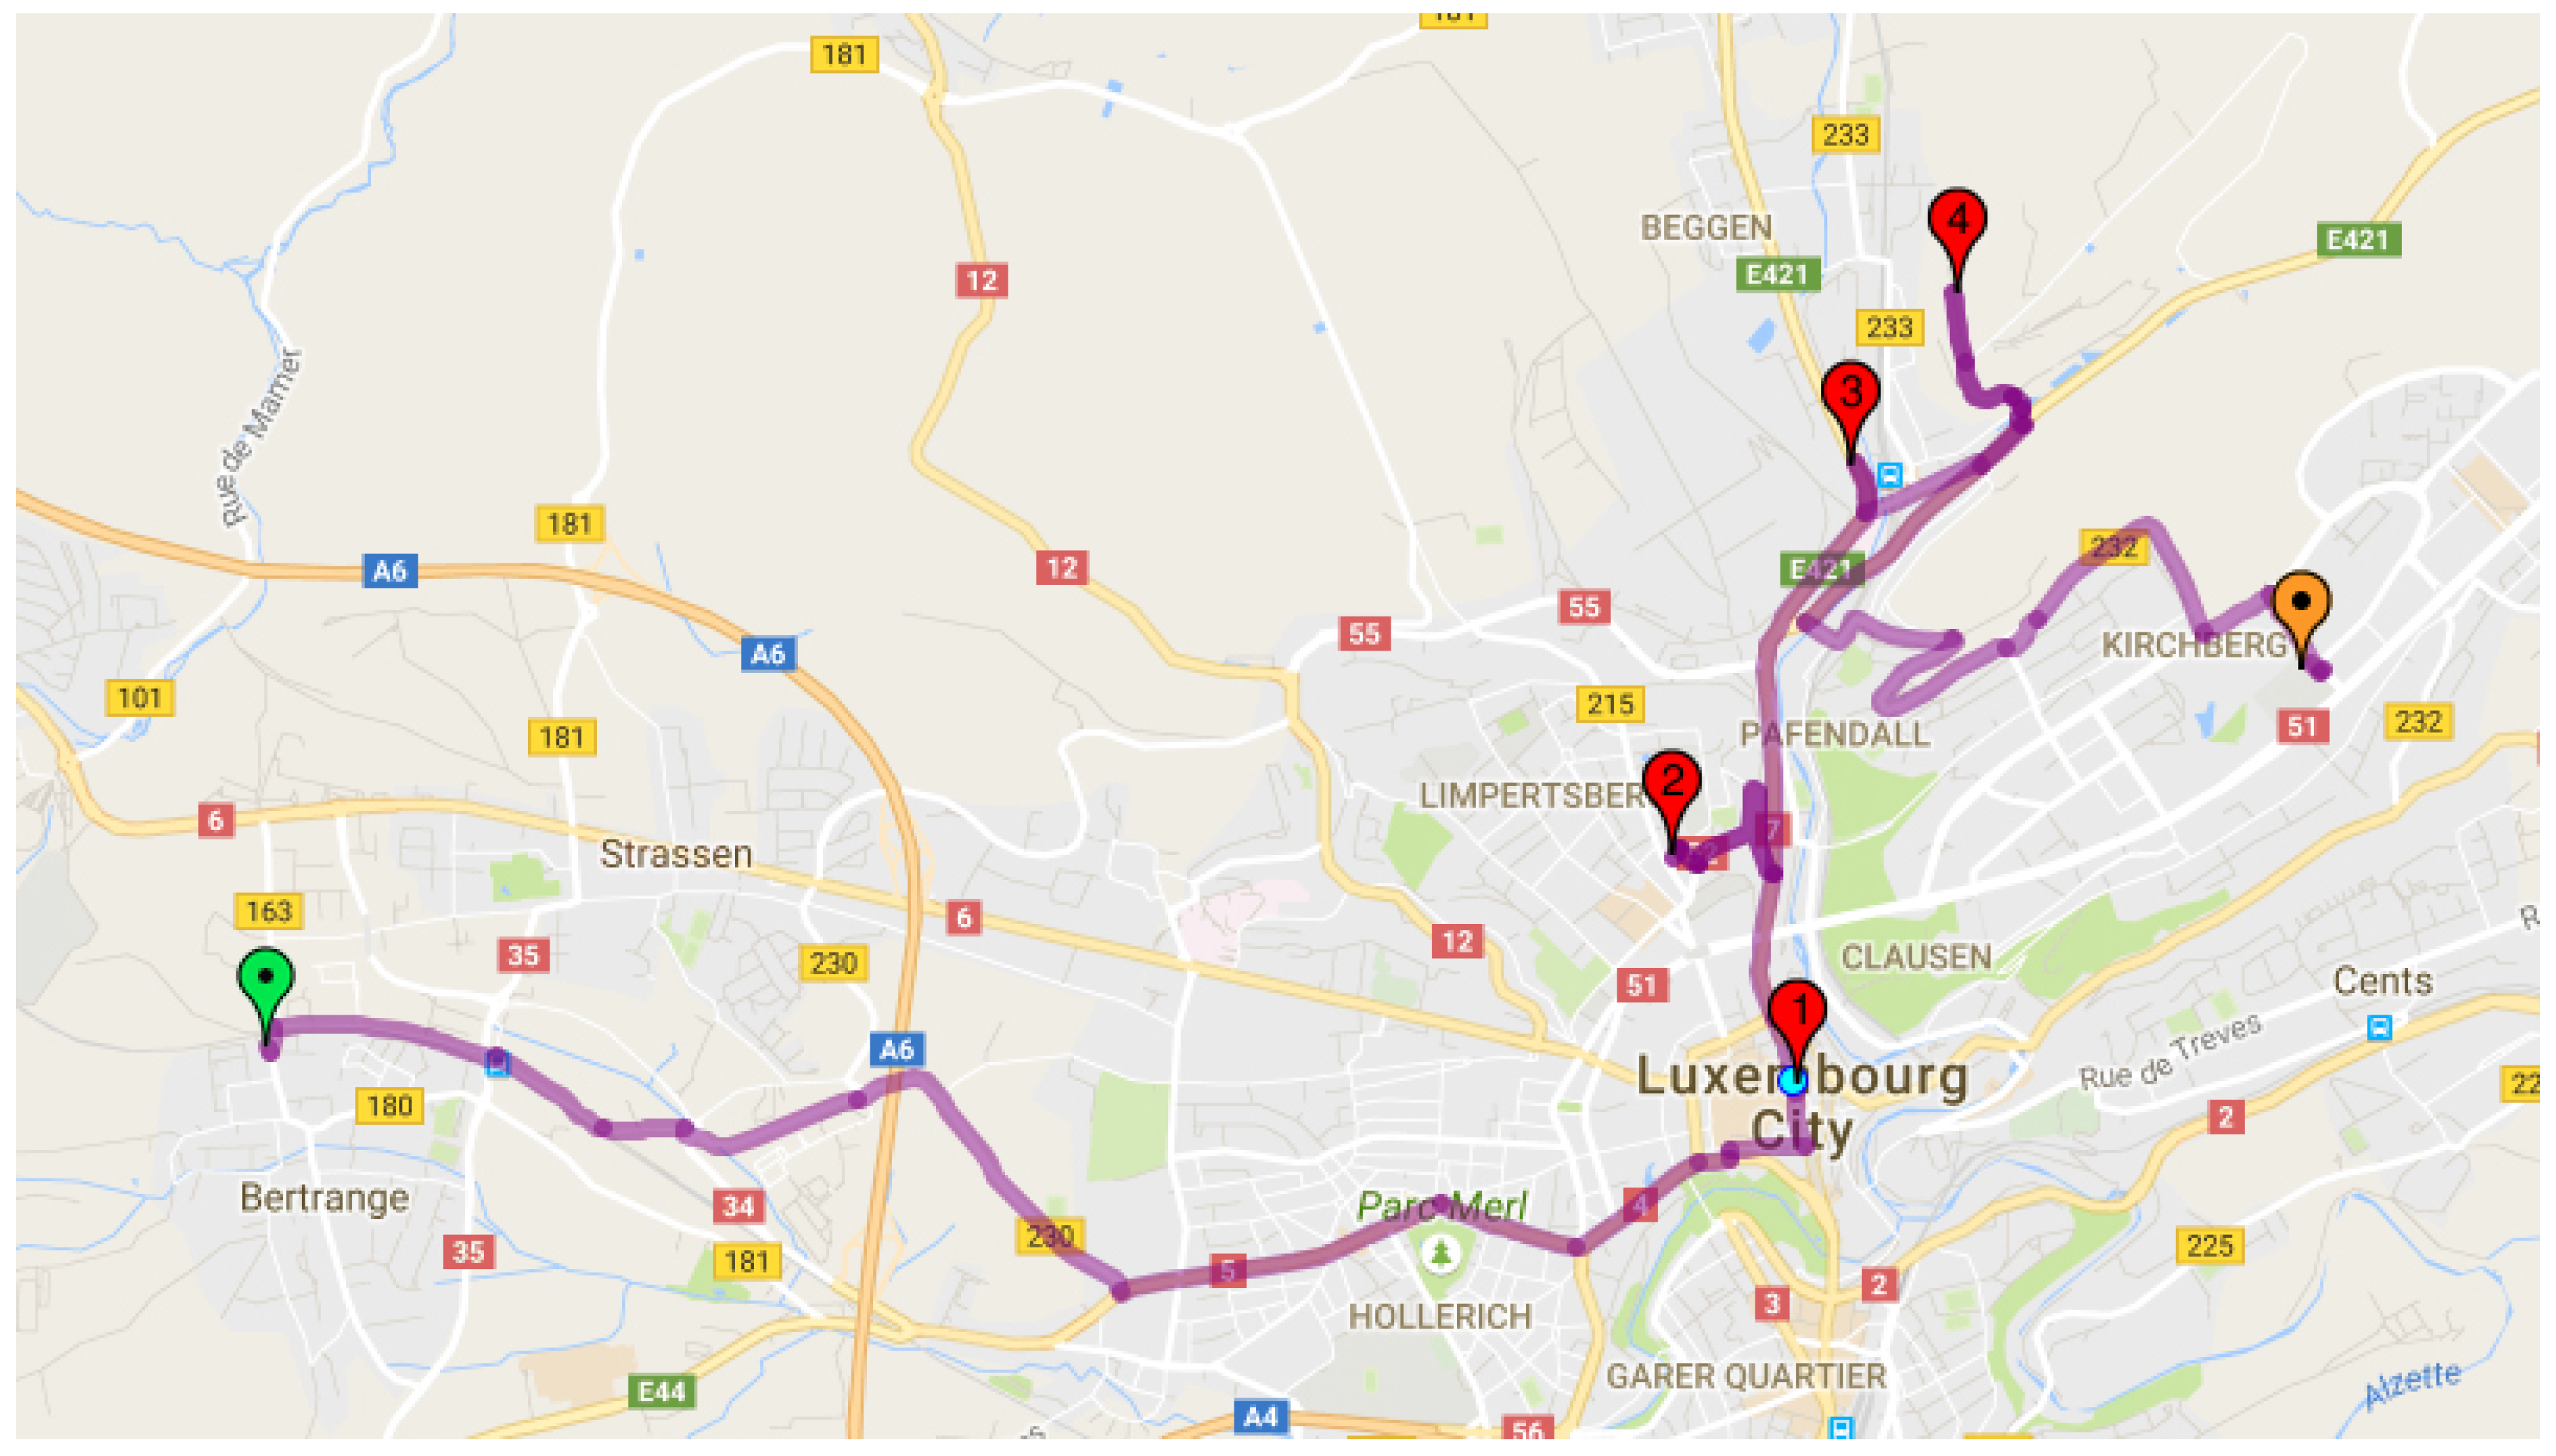
One of the main objectives of collaborative sharing is to group more people into fewer cars. Maximizing the number of passengers and minimizing both the overall cost, but also the individual cost is a challenge in a dynamic ridesharing problem. Using the provided dataset, we will assess the collaborative mobility for all users together. Similar to Example 1, it is assumed that all users have access to private cars. Moreover, , meaning that their schedule is synchronized.
In order to carpool together, one driver must pick up the rest of the passengers. The problem consists of finding the shortest path in the network that passes through all user residences and that reaches the final destination at the common workplace for all of the users. This can be solved with the well-known Dijkstra algorithm. The shortest path presented in
Figure 7 is the following:
.
Similar to Example1, the carpooling index computation and the cost variables’ results between all five users are the following:
| | | | |
| | | | |
| | | | |
|
In this particular example, the group formed by all five users is not compatible for carpooling. The total system cost when users are carpooling is higher than if they are traveling with their own private cars. Interesting to note, as we can see from the values, users and are the only ones who benefits in this case.
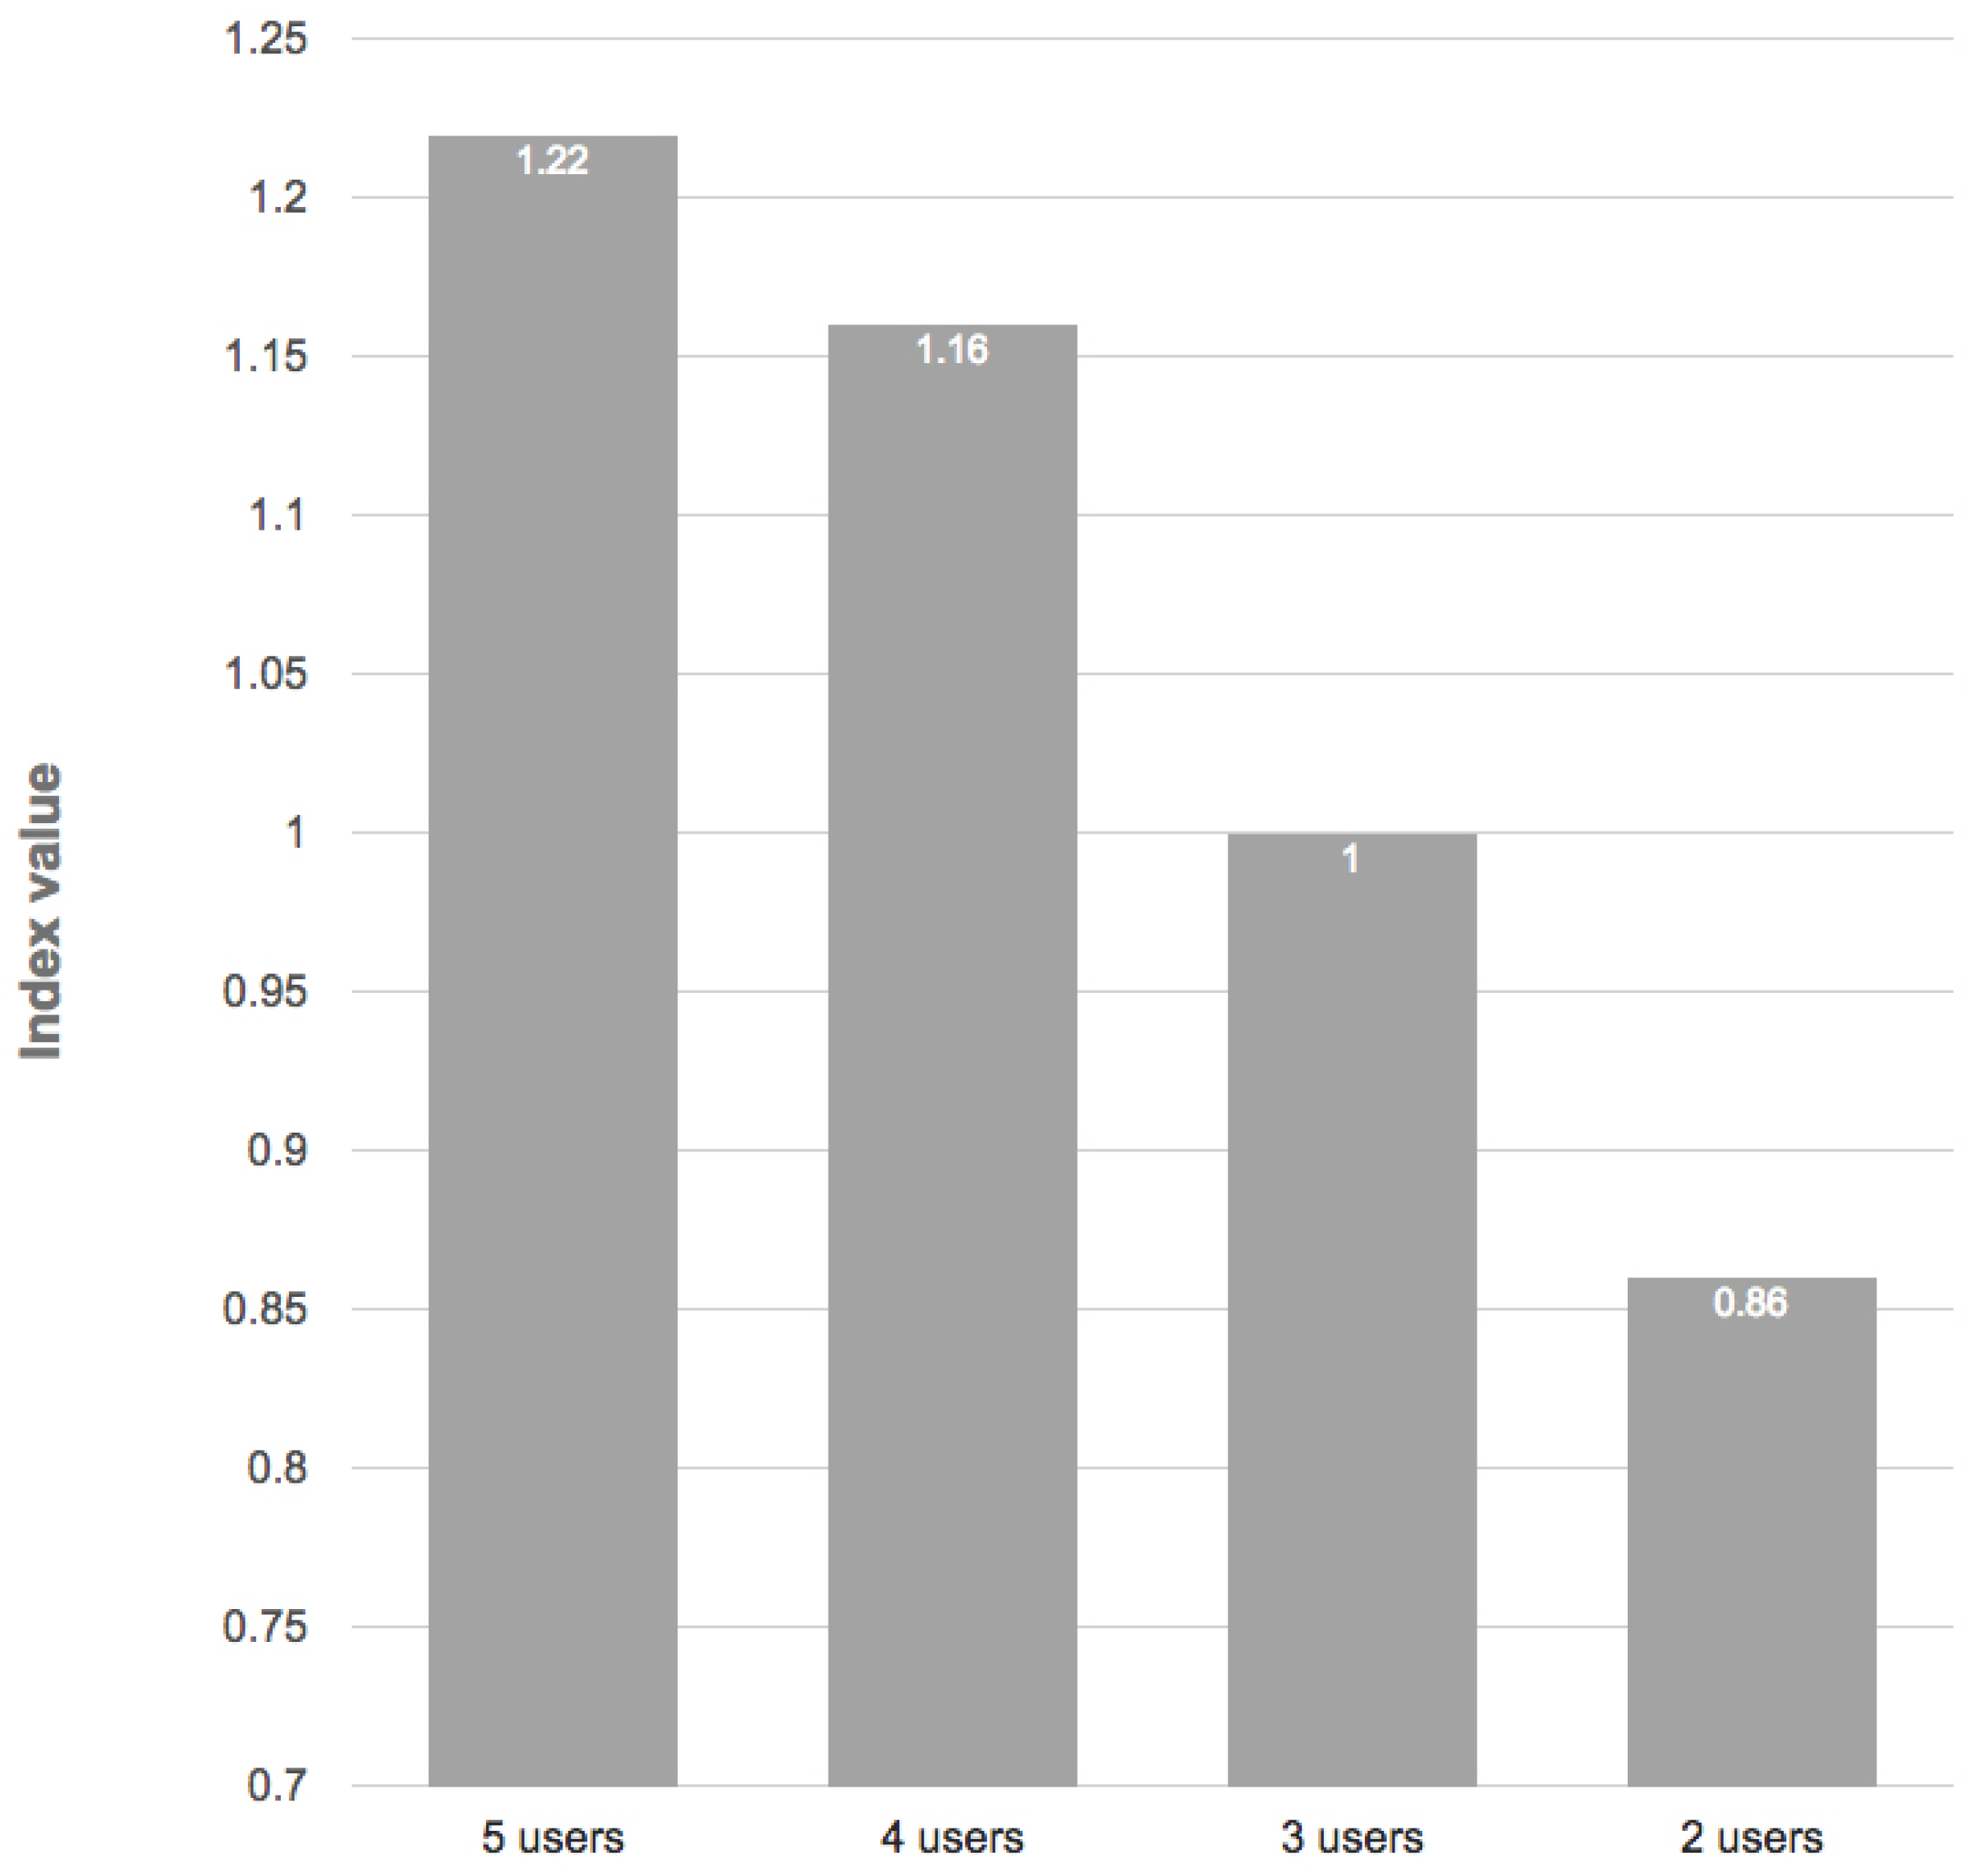
The question that arises is: what is the maximum number of users that can carpool together in this case study? In order to provide an answer, we compute the index with different numbers of users. The results plotted in
Figure 8 show that in this particular case study, the best index can be obtained grouping the last three users in order to have the lowest index value below one with the maximum number of users.
This experiment demonstrates that the collaborative mobility index can also be used at the system level to group more people into fewer cars, but at the same time, at the individual level, all users benefit from using the sharing services. The indicator is sensitive to dynamic changes, e.g., the maximum number of users that can join in a carpooling trip from one origin to a destination or the efficiency at the system and individual level if a specific user is joining the carpooling trip. We can conclude that the indicator is flexible and has the potential to be used also in real-time carpooling assignment, and the system can recommend, e.g., to a user that is driving that on his/her road trip, he/she can pick-up other compatible users; and all of the passengers will have an economic benefit. This can be useful for individuals that are commuting or traveling, but also to, e.g., taxi and carpooling companies, which can find new customers ad hoc in real time without any other intervention. The only requirement is that the system requires the origin-destination information for each user and their willingness to participate in the collaborative mobility schemes.
Example 3. Carpooling index with rescheduled activities:
In this example, we aim to assess the carpooling compatibility between users
,
and
in the case when their activities are not synchronized.
and weight cost variables are considered, as defined in Equation (
10). In
Figure 9, we can observe the
between the activities of all of the users for a day, extracted from
Figure 5.
From
Figure 9, both
and
start work at almost 10:47. Therefore, they are pretty synchronized, and the
between them is very small. The computed carpooling index values are
,
,
resulting in that they have a very good compatibility for carpooling because both Constraints Equations (
6) and (
7) are met.
It might be possible also for to join the ridesharing, but we can see that usually he/she arrive at work 45 min earlier than and . In this situation, users must reschedule their activities in order to achieve the synchronization and be able to carpool.
Therefore, three scenarios are considered as follows. In the first scenario, it is assumed that
accepts to reschedule his/her activity because he/she has a flexible schedule, resulting in that for him/her,
,
and
as defined in Equation (
10), and the reschedule is not seen as a cost. Consequently, this scenario is reshaped as a perfect synchronization between individuals because
. In the second scenario,
accepts to reschedule his/her scenario, but
α,
β and
γ are considered by the user (equal to one) for all users, resulting in that for
, the related reschedule has an extra cost. The third scenario is similar to the second, with the difference that
and
will reschedule their activity; thus, both of them will have a reschedule time cost.
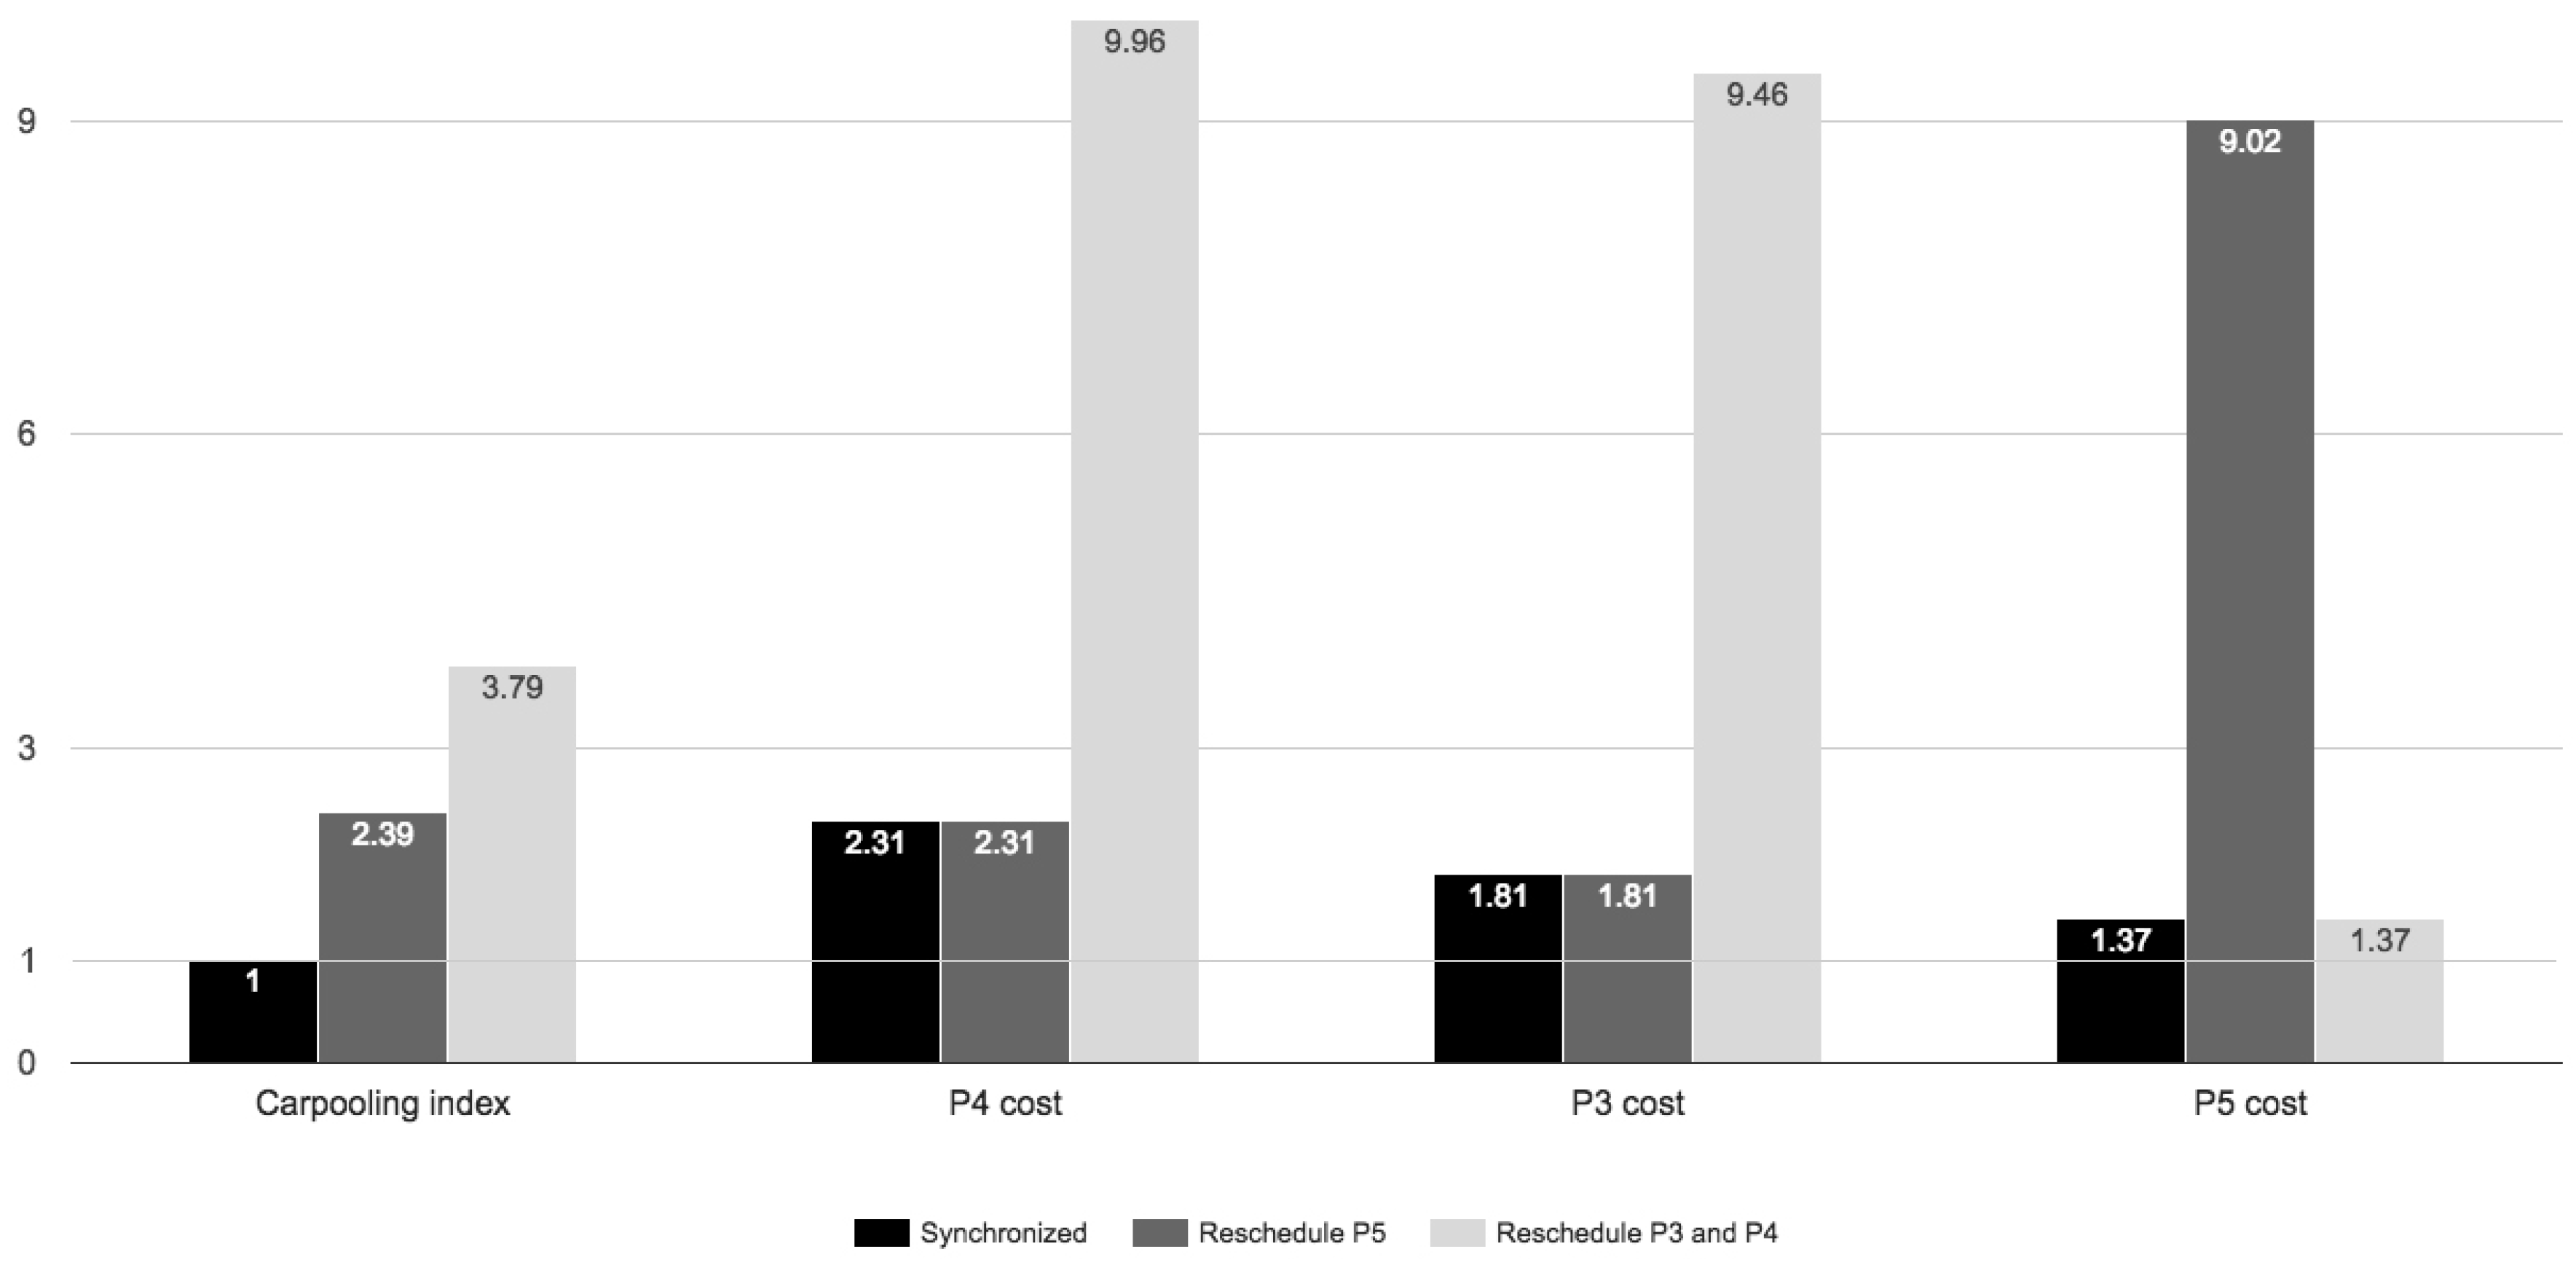
The comparison of the index value and the cost of each individual in the proposed scenarios is captured in
Figure 10.
From this case study, we can argue that the proposed carpooling index is sensitive to any additional cost in any situation. Based on the index value, a recommendation system that has multiple options for user synchronization can choose the optimal solution for advising users how to reschedule or reorder their activities in order to minimize the overall system cost, but also to balance the individual cost for all users. Moreover, the indicator is sensitive to the individual’s cost perception, computing the index value considering the weight value for each involved variable. The indicator is sensitive to any change in the weight of cost variables for each user, and the final indicator value for a group of individuals can be highly influenced by the weight that each individual assigns to his/her cost variable. This means that a group of users can be compatible or not just because they have different perceptions regarding the economic benefit and the trade-off between comfort, saving money and being flexible, e.g., to reschedule his/her departure or arrival time. Users’ synchronization and the usage optimization of existing resources are the other objectives where the proposed indicator model can contribute.
4.3. Collaborative Mobility Index for Parking Sharing
In this section, we evaluate the conceptual models defined in
Section 3.3.1 and
Section 3.3.2 with examples from the data collection.
4.3.1. Parking Sharing Compatibility Index for Car-Dependent Users
In this scenario, it is assumed that there is a daily parking fee at the workplace. This cost can be shared between multiple persons if they use the same parking place. The problem consists of finding car-dependent compatible users who match Equation (
15). In order to find compatible users, we compute the
and
between the parking location and the users activities.
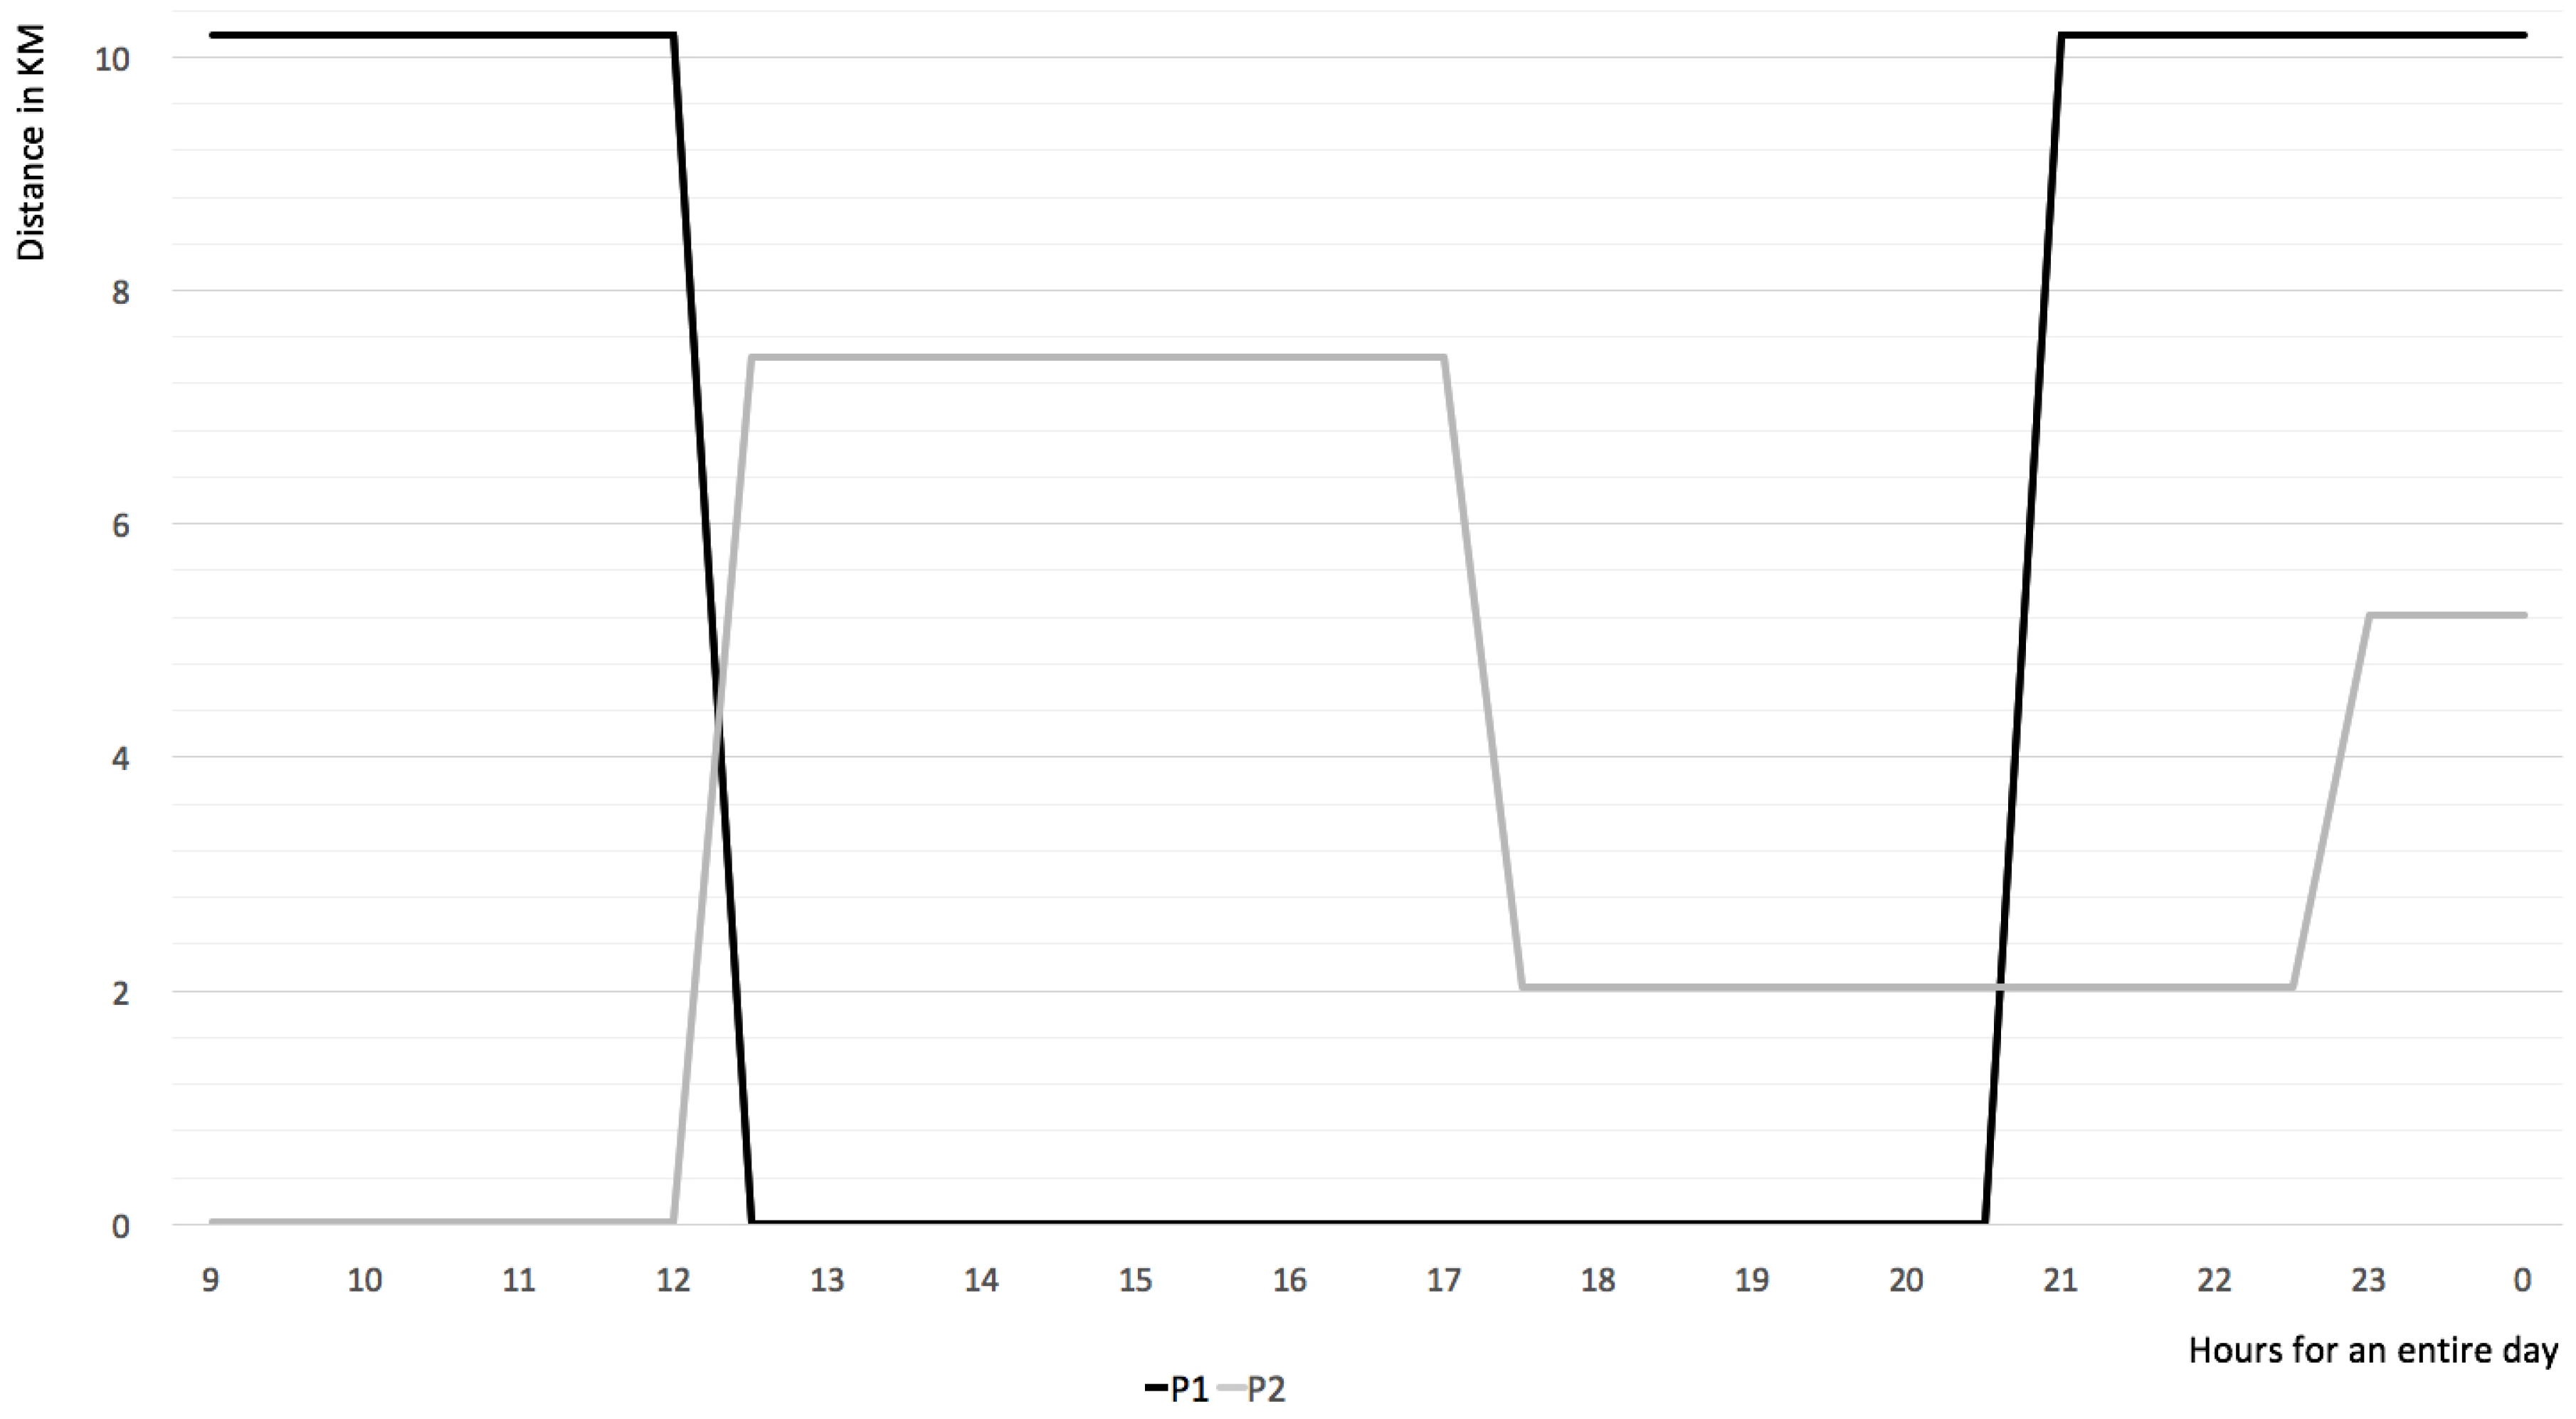
Figure 11 shows the results for two users during one day.
When the distance is zero, users perform an activity in a location near the parking place. In our case study, it is the parking at the workplace. From
Figure 11, we observe that the intervals in which
and
are in the parking place meet the constraint Equation (
15), resulting in that they are compatible for parking sharing. If this is a repetitive behavior that can be observed over long time periods, they are compatible for long-term parking sharing.
Having travel behavior data for a long time period and for a higher number of respondents, using the proposed indicator, it is possible to compute at a large scale the compatibility between all users for long-term parking sharing. In this way, the parking lot can be used more efficiently, and number of parking places required can be reduced. This can be useful both for individuals that want to share the parking cost, but also for organizations that aim to reduce the parking space and the corresponding costs. The indicator can capture also long-term dynamic changes that appear in the travel behavior of each user and the suggestion of different sharing solutions based on the new knowledge, e.g., the change of residence or workplace, but also new frequent locations visited, e.g., a new restaurant, new friends, etc. The only requirement is a historical database of locations visited and a learning method used by a recommendation system that detects changes in the behavior of each user and suggests new solutions.
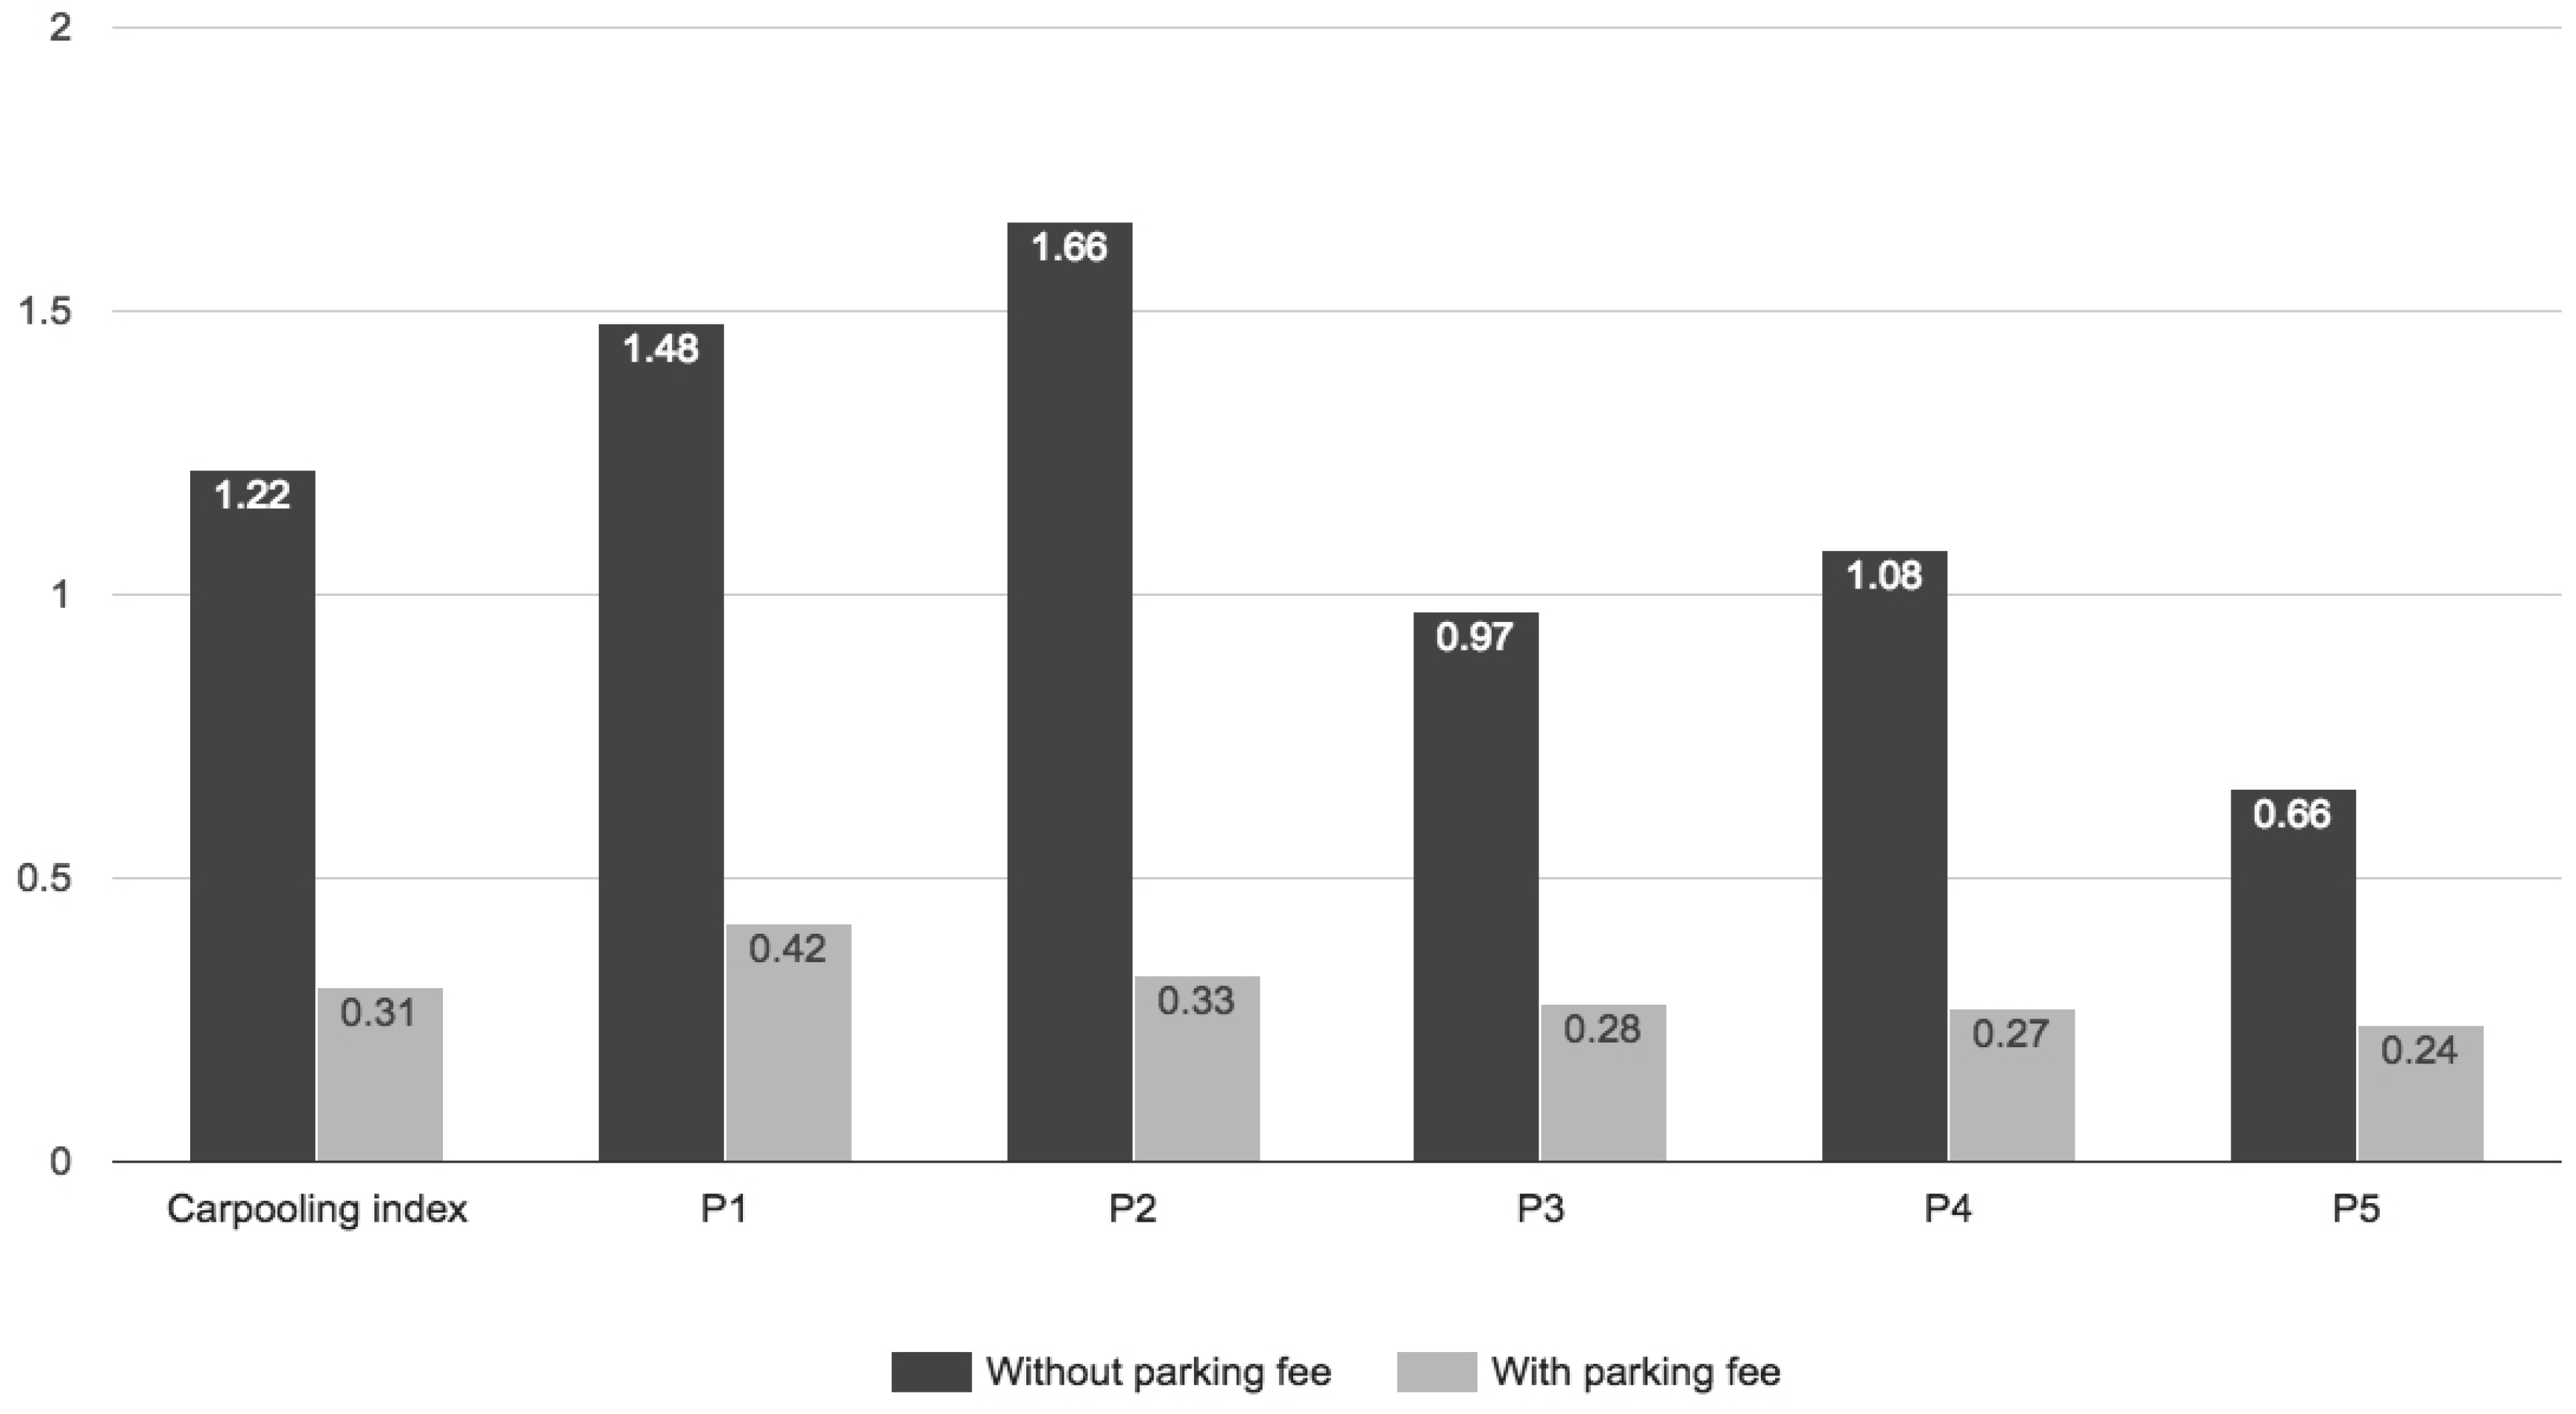
4.3.2. Parking Sharing Index in Combination with Carpooling
In this case study, we evaluate how the indicator behaves when it is considered a scenario with a daily parking fee and in combination with carpooling service. For this case study, we use the input data from Example 2 from which we have the indicator values for the situation in which they might carpool, all five together, and there is no parking fee, and we compute the index as defined in
Section 3.3.2. We compare the results from Example 2 with the situation when there is a daily parking fee that can be shared in order to observe how the parking fee policy can influence the perception and costs regarding the carpooling service. The results are presented in
Figure 12.
From
Figure 12, we observe that in the situation when there is no parking fee, the index value indicates no compatibility for carpooling, with the index value higher than one. In this case, they will not carpool together, meaning more parking places occupied.
In the situation when they have to pay a parking fee, the index value indicates an excellent compatibility when sharing the ride and parking cost, both at the system level, but also at the individual level. The results from this case study show that the index can be used as an indicator for assessing the impact of different parking fee policies and prices. The proposed indicator can be part of a recommendation system for advising users for sharing the parking cost with other compatible users in combination with other sharing services; in this case, carpooling.
4.4. Collaborative Mobility Index for Car Sharing
In order to evaluate the indicator for car sharing, we consider a case study that combines car sharing, carpooling and parking sharing. Furthermore, we consider the entire activity chain of an entire day, as discussed in
Section 3.4.
Figure 13 presents a similar situation as in Example 1. From this example, we know that
and
are compatible for carpooling when they are commuting from home-work in the morning and work-home in the evening, and also, they share the parking cost. In this case study, the difference is that
must travel from the initial workplace (
) to a meeting in (
) and return back to (
). In this case, the chain of activities for
is:
.
For the trips and , he/she plans to commute by carpooling and share the parking cost with user . However, because he/she has to make an extra trip and he/she has no other users to carpool, he/she plans to use his/her private car for the entire day because he/she has a tight schedule and he/she cannot afford to lose time. This means certainly extra cost because in this situation, he/she will not share the costs involved.
Let us assume now that he/she has access to a car sharing system. This option gives him/her the flexibility to carpool for the trips and with user and to use the car sharing system for the trip .
In order to evaluate the indicator behavior in this case study, we compute the indicator when
uses the private car for the entire tip chain versus the situation when commuting by carpooling, sharing the parking cost with
and using the car sharing system. The computations as defined in Equations (
3)–(
5) are:
In this case study, the indicator values show that the best option for is to carpool for the commuting trips and to use the car sharing for the other trips. Furthermore, and are compatible for using sharing services, both of them saving the related trip and parking costs.
We can argue that the proposed indicator can be used to evaluate the collaborative mobility between individuals in a closed environment, considering the entire chain of activities and combinations between all of the sharing services. The values obtained can be used by an ITS that acts as a travel advisor, which automatically finds the most efficient sharing services and recommends to each individual user in the system, considering not just only one time service usage, but the entire trip chain for one day. Moreover, the indicator is able to evaluate and optimize combined sharing schemes and modes in a single indicator, in a fast and simple fashion. The travel advisor can try different combinations and propose various solutions from which users can choose depending on their preferences and constraints. The model proposed can be used in a multi-objective optimization approach and more complex problems where different providers, schemes and solutions can be considered.
5. Discussion and Perspectives
Technological advances in recent decades and the availability of data from the nomadic and wearable devices have facilitated the understanding of human mobility patterns directly from the data collected by those devices. Numerous studies, models and solution procedures have been proposed to better manage the transportation systems. In this study, we explore the usage of ITS in combination with the actual technologies and with the sharing services as an effective solution for traffic congestion problems. The current study together with others from the literature review emphasized the need for a change in the citizen’s travel behavior towards sustainable and efficient collaborative mobility among groups of users. In this case, the ITS must pro-actively give recommendations to users and incentivize them to reschedule, reorder and re-route their activities in order to group as many travelers into fewer cars, but also to give advice on how, when and with whom to share the resources and, implicitly, the costs involved, e.g., parking fees, fuel cost.
This process must be be fully automatized using similar methodologies as those presented in this paper. Data must be accurately collected (individual based and available in real time from mobile devices) and processed. The framework presented in the current paper aims to take the full benefits of the data collected and transform it to knowledge. More complex machine learning and data mining methods and algorithms can be used in order to extract the knowledge out of the raw data, using a data fusion strategy from all of the sensors built in the mobile devices. This means that the ITS must take the full benefit of the geospatial big data and larger market penetration of portable technologies. With this, the next generation of collaborative ITS platforms would be able to pro-actively give advice in order to change the user’s travel behavior towards more efficient, sustainable and environmentally-friendly sharing solutions. ITS must act as an advisor that assists the citizens in their daily choices in order to achieve significant travel behavior change.
The indicator developed in this study aims to fill the gap between the ITS and the user needs and preferences. Using this indicator, an ITS can assess the collaborative mobility between users in a faster, flexible and reliable fashion. As presented with real case studies in the current paper, the system can automatically find sharing opportunities and recommend different behavioral changes in order to be compatible with other users for sharing services.
From the case studies presented, we can argue that such a travel advisor ITS is suitable for different types of organizations and communities. In this model, members will be advised by the ITS to reorder or reschedule their activities in order to be compatible with other users inside the organization for using sharing services in a CM system. This will lead to great benefits at the company level, because, e.g., less employees will do the commuting with their private cars. This can result in savings for large companies, which normally need to rent big parking lots for their employees. The case studies presented in this paper suggest that a parking fee can incentivize more people to adopt the shared commuting option. Furthermore, the proposed indicator can be used as a tool for assessing the effects of different parking policies at the organization’s level.
At a higher level (e.g., at the city level), less people will do commuting with their private cars, resulting in less cars on the roads and less traffic congestion at peak hours. The indicator’s values includes also the system cost variable. A general perspective regarding the organization’s system costs can be a good indicator for evaluating the impact of different policies planned by local authorities.
The collaborative mobility scheme presented in this study can have great benefits also at the micro level, for each individual user in the system. Cost savings, e.g., fuel, parking fee and less time spent when commuting, are strong incentives that can attract more and more travelers towards an environmentally-friendly and sustainable travel behavior.
Because the user’s activities are repetitive, all of the computations made for different users and scenarios can be stored and reused by an ITS for speed optimization. This is a mandatory requirement when there is a massive number of computations for large communities. Finally, the entire process must be fully automatized so that the user will not have to manually perform queries in the system (e.g., searching for a ride or a colleague to share the parking fee). The entire human-machine interaction should be minimized until the point that the user will have only to press one button in order to confirm that the system correctly predicted the next destination and the user accepts the recommendation provided by the system.
We can argue that the proposed method has multiple strengths described in the presented proof-of-concept examples. We demonstrate that the indicator can evaluate combined sharing schemes, sharing modes and resources in a single indicator. It is sensitive to dynamic changes, flexible and can be used in multi-objective optimization problems. However, the results and accuracy of the model are dependent on the the quality of the input data. This means that in order to be used, the indicator must be integrated as a component, part of a complex system where the data are collected, aggregated and processed in an automatic fashion and a recommendation system that performs different computations based on the model proposed and chooses the best solutions, taking into consideration all of the objectives, user preferences and constraints. Some variables, e.g., the weight of the cost for each user, might be very hard to obtain, and those are mandatory elements that can have a great influence on the final result. The indicator has been tested only on a small dataset, with a limited period of time and only five users. Even so, because there are many variables, routes, sharing schemes and modes, user preferences and constraints, but also multi-objectives solutions, the computation becomes quickly very intensive, and this can require large computing resources and optimization methods for computation.
6. Conclusions and Future Work
In this paper, we propose an indicator for enhancing collaborative mobility that can be used by a travel advisor to pro-actively recommend different actions towards an environmentally-friendly and sustainable travel behavior. The research presents different constraints and variables that should be taken into consideration when assessing the collaborative mobility between individuals based on different sharing solutions. Carpooling, parking sharing and car sharing experiments and case studies were explored using the real data collected from mobile devices. These experiments confirmed that the proposed indicator is sensitive to dynamic changes, flexible and can be used in multi-objective optimization problems. We conclude that the behavior of combined sharing schemes and modes can be assessed in a single indicator. This can be used for assessing the collaborative mobility for individuals at the micro level, but also by organizations for simulating the effects of different policies.
There are many directions for extending this work. The methods presented in this study represent the theory that has to be combined with complex ML and artificial intelligence methods in order to develop the engine of an ITS that has a bright future in the next generation traffic systems. The challenge will be to develop the prototype of an elaborated ITS that will be able to execute complex tasks and operations, e.g., automatic learning, prediction, optimization and management of collaborative systems, for sharing resources.
In the current research, we have used mainly the geospatial data collected from mobile devices. Future exploration of sensing system will be also done in order to use the data fusion between all of the mobile sensors available from the nomadic and wearable devices, like smartphones and smartwatches. Each additional sensor brings important data, which should be exploited in order to acquire new knowledge.
While we consider the problem of collaborative mobility, our approach is still at a small scale, mainly because of the limited data collection and the focus on the theoretical aspect rather than the implementation in the real world. Other challenges related to the large-scale real data usage collected from smartphones are the data collection’s high cost and the privacy aspect. Authorizations must be obtained from specialized authorities for surveys and data collections that contain sensitive information. Then, data anonymization protocols must be implemented using different types of information sanitization with the intent of privacy protection. Encryption protocols, blurring techniques for location privacy or removing personally identifiable information from datasets are some of the protocols that can be used so that the users from whom the data are collected remain anonymous.
An interesting direction is to apply the same methods and scenarios for larger datasets with a higher number of users and for a long time period or using artificially-generated datasets. Both methods brings complex problems because larger datasets require specialized methods, tools and optimizations for running intensive computations. Furthermore, the artificial datasets and simulations must capture the similar travel behavior of the real users’ mobility patterns.


