
A Spatio-Temporal Enhanced Metadata Model for Interdisciplinary Instant Point Observations in Smart Cities


Abstract
:1. Introduction
2. Spatio-Temporal Enhanced Metadata Model for Interdisciplinary Instant Point Observations
2.1. Data Classification and Association
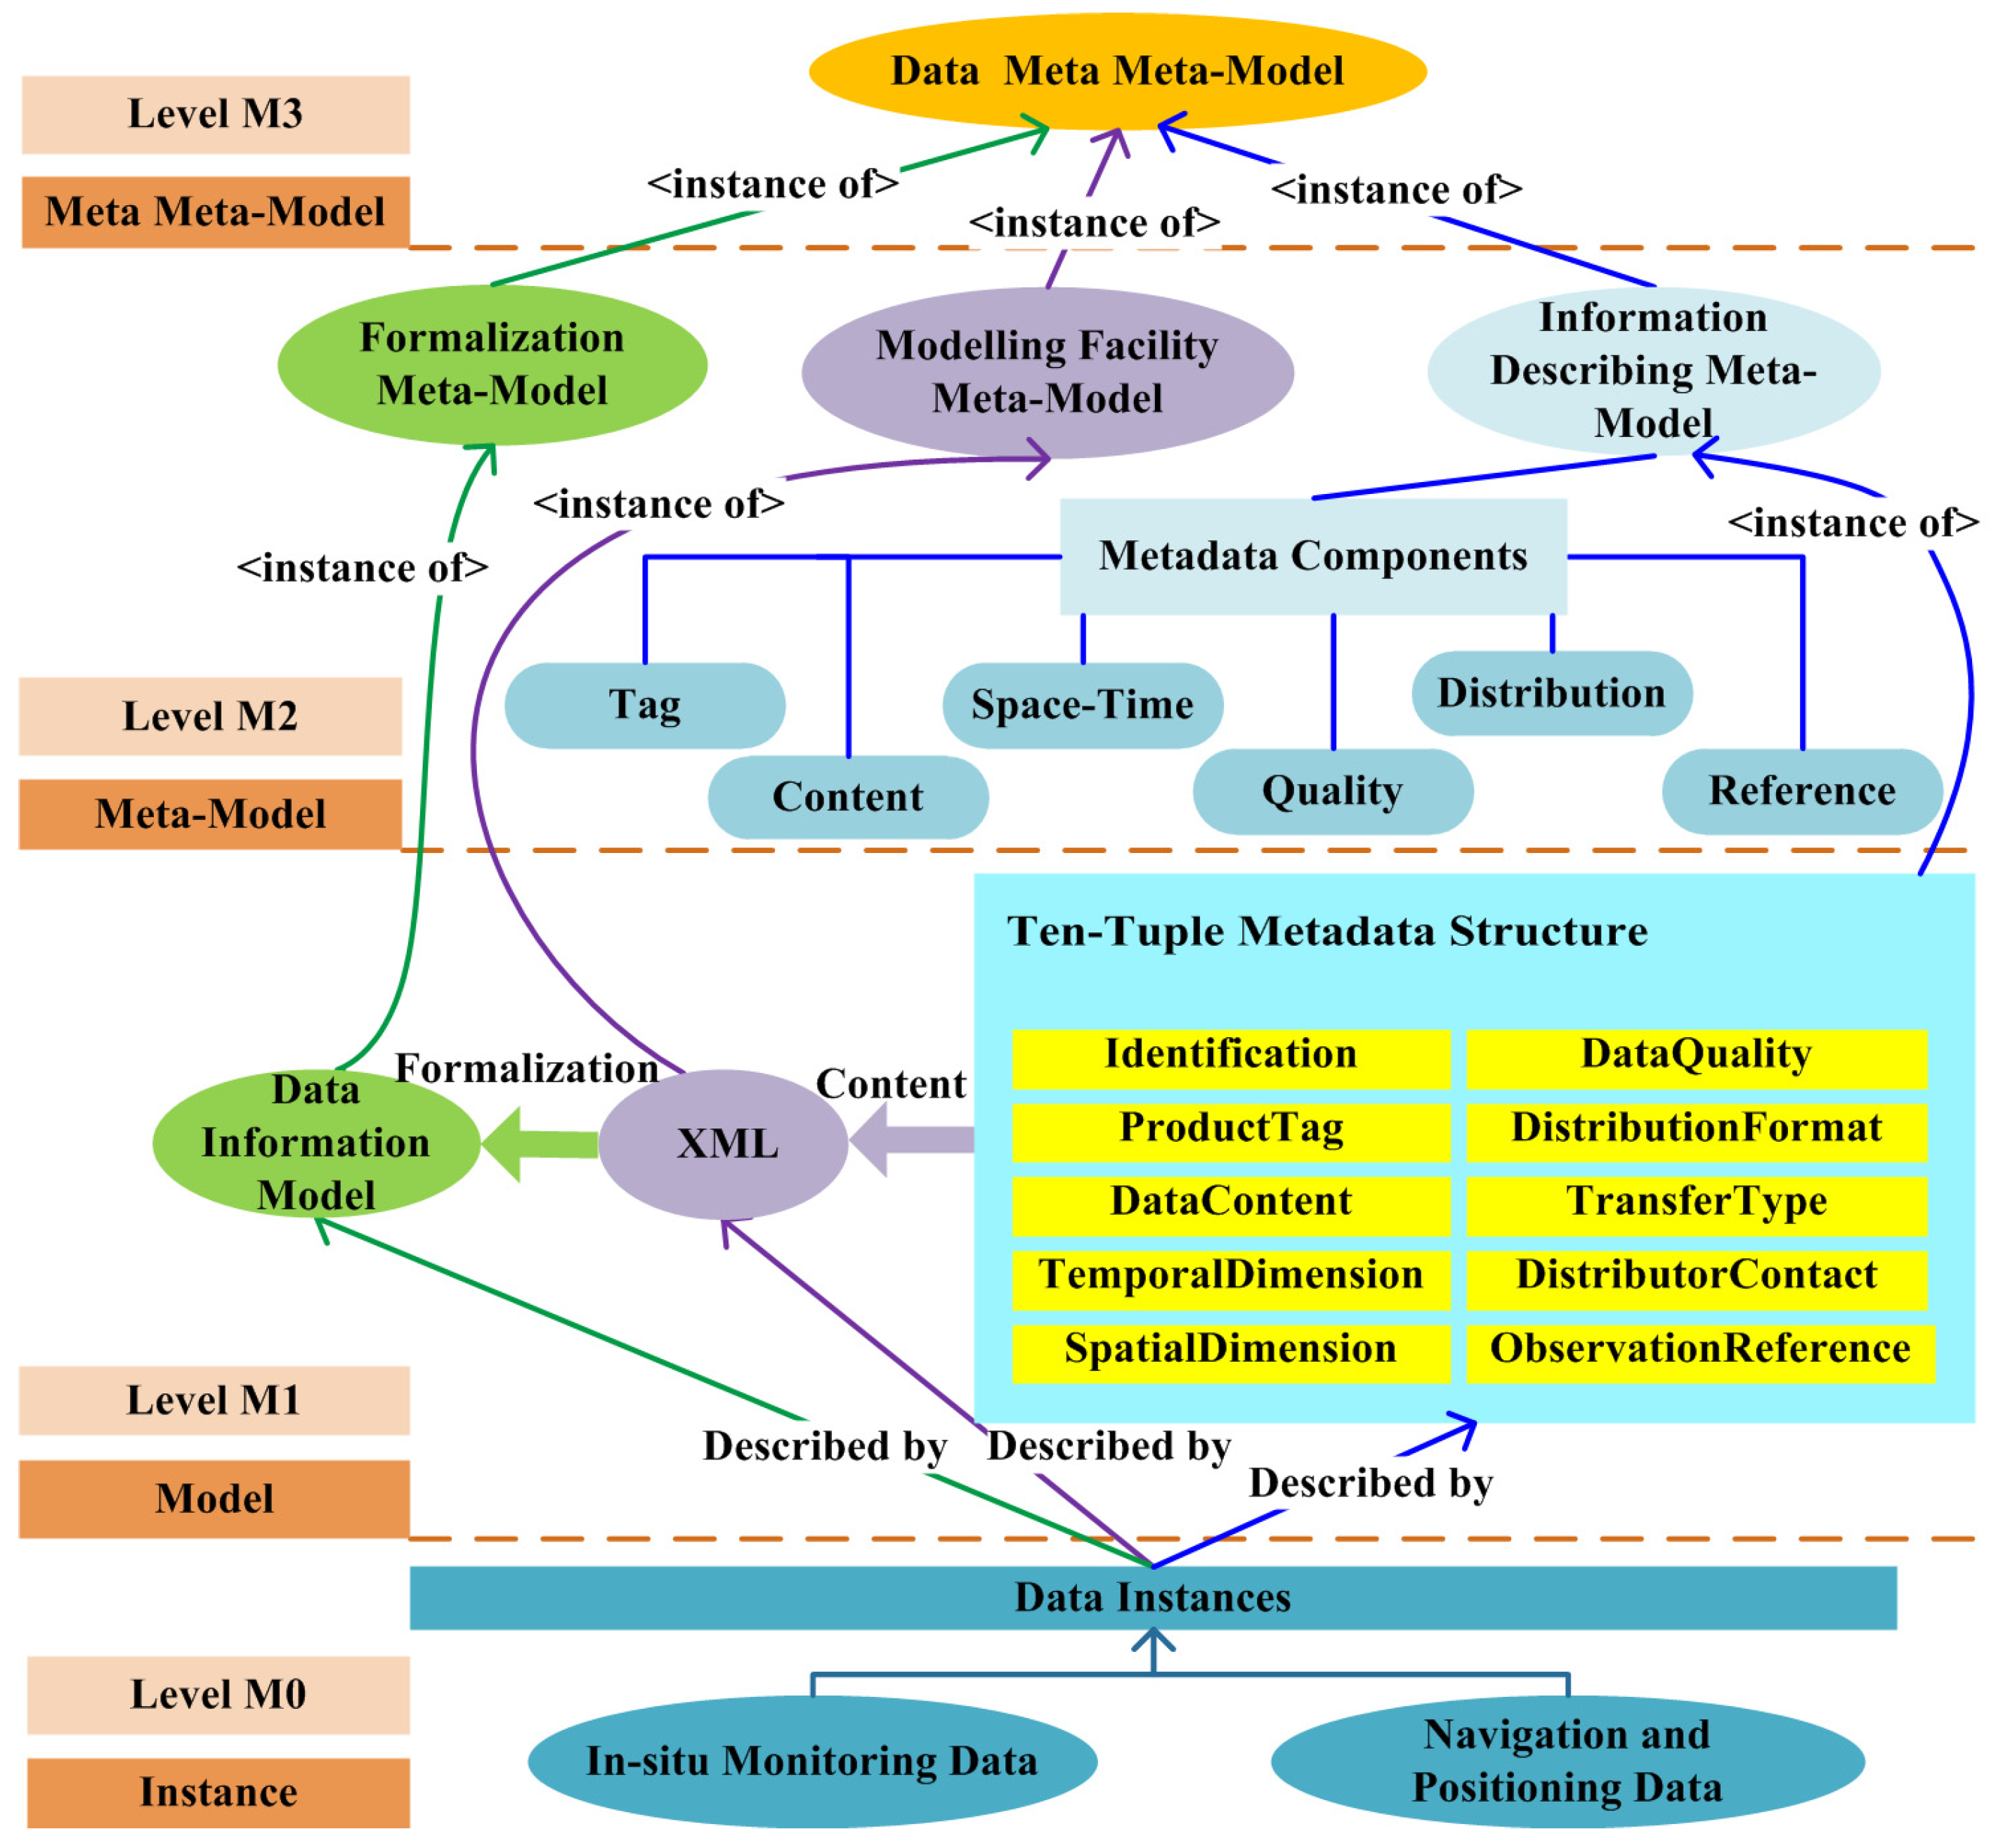
2.2. Data Meta-Modeling
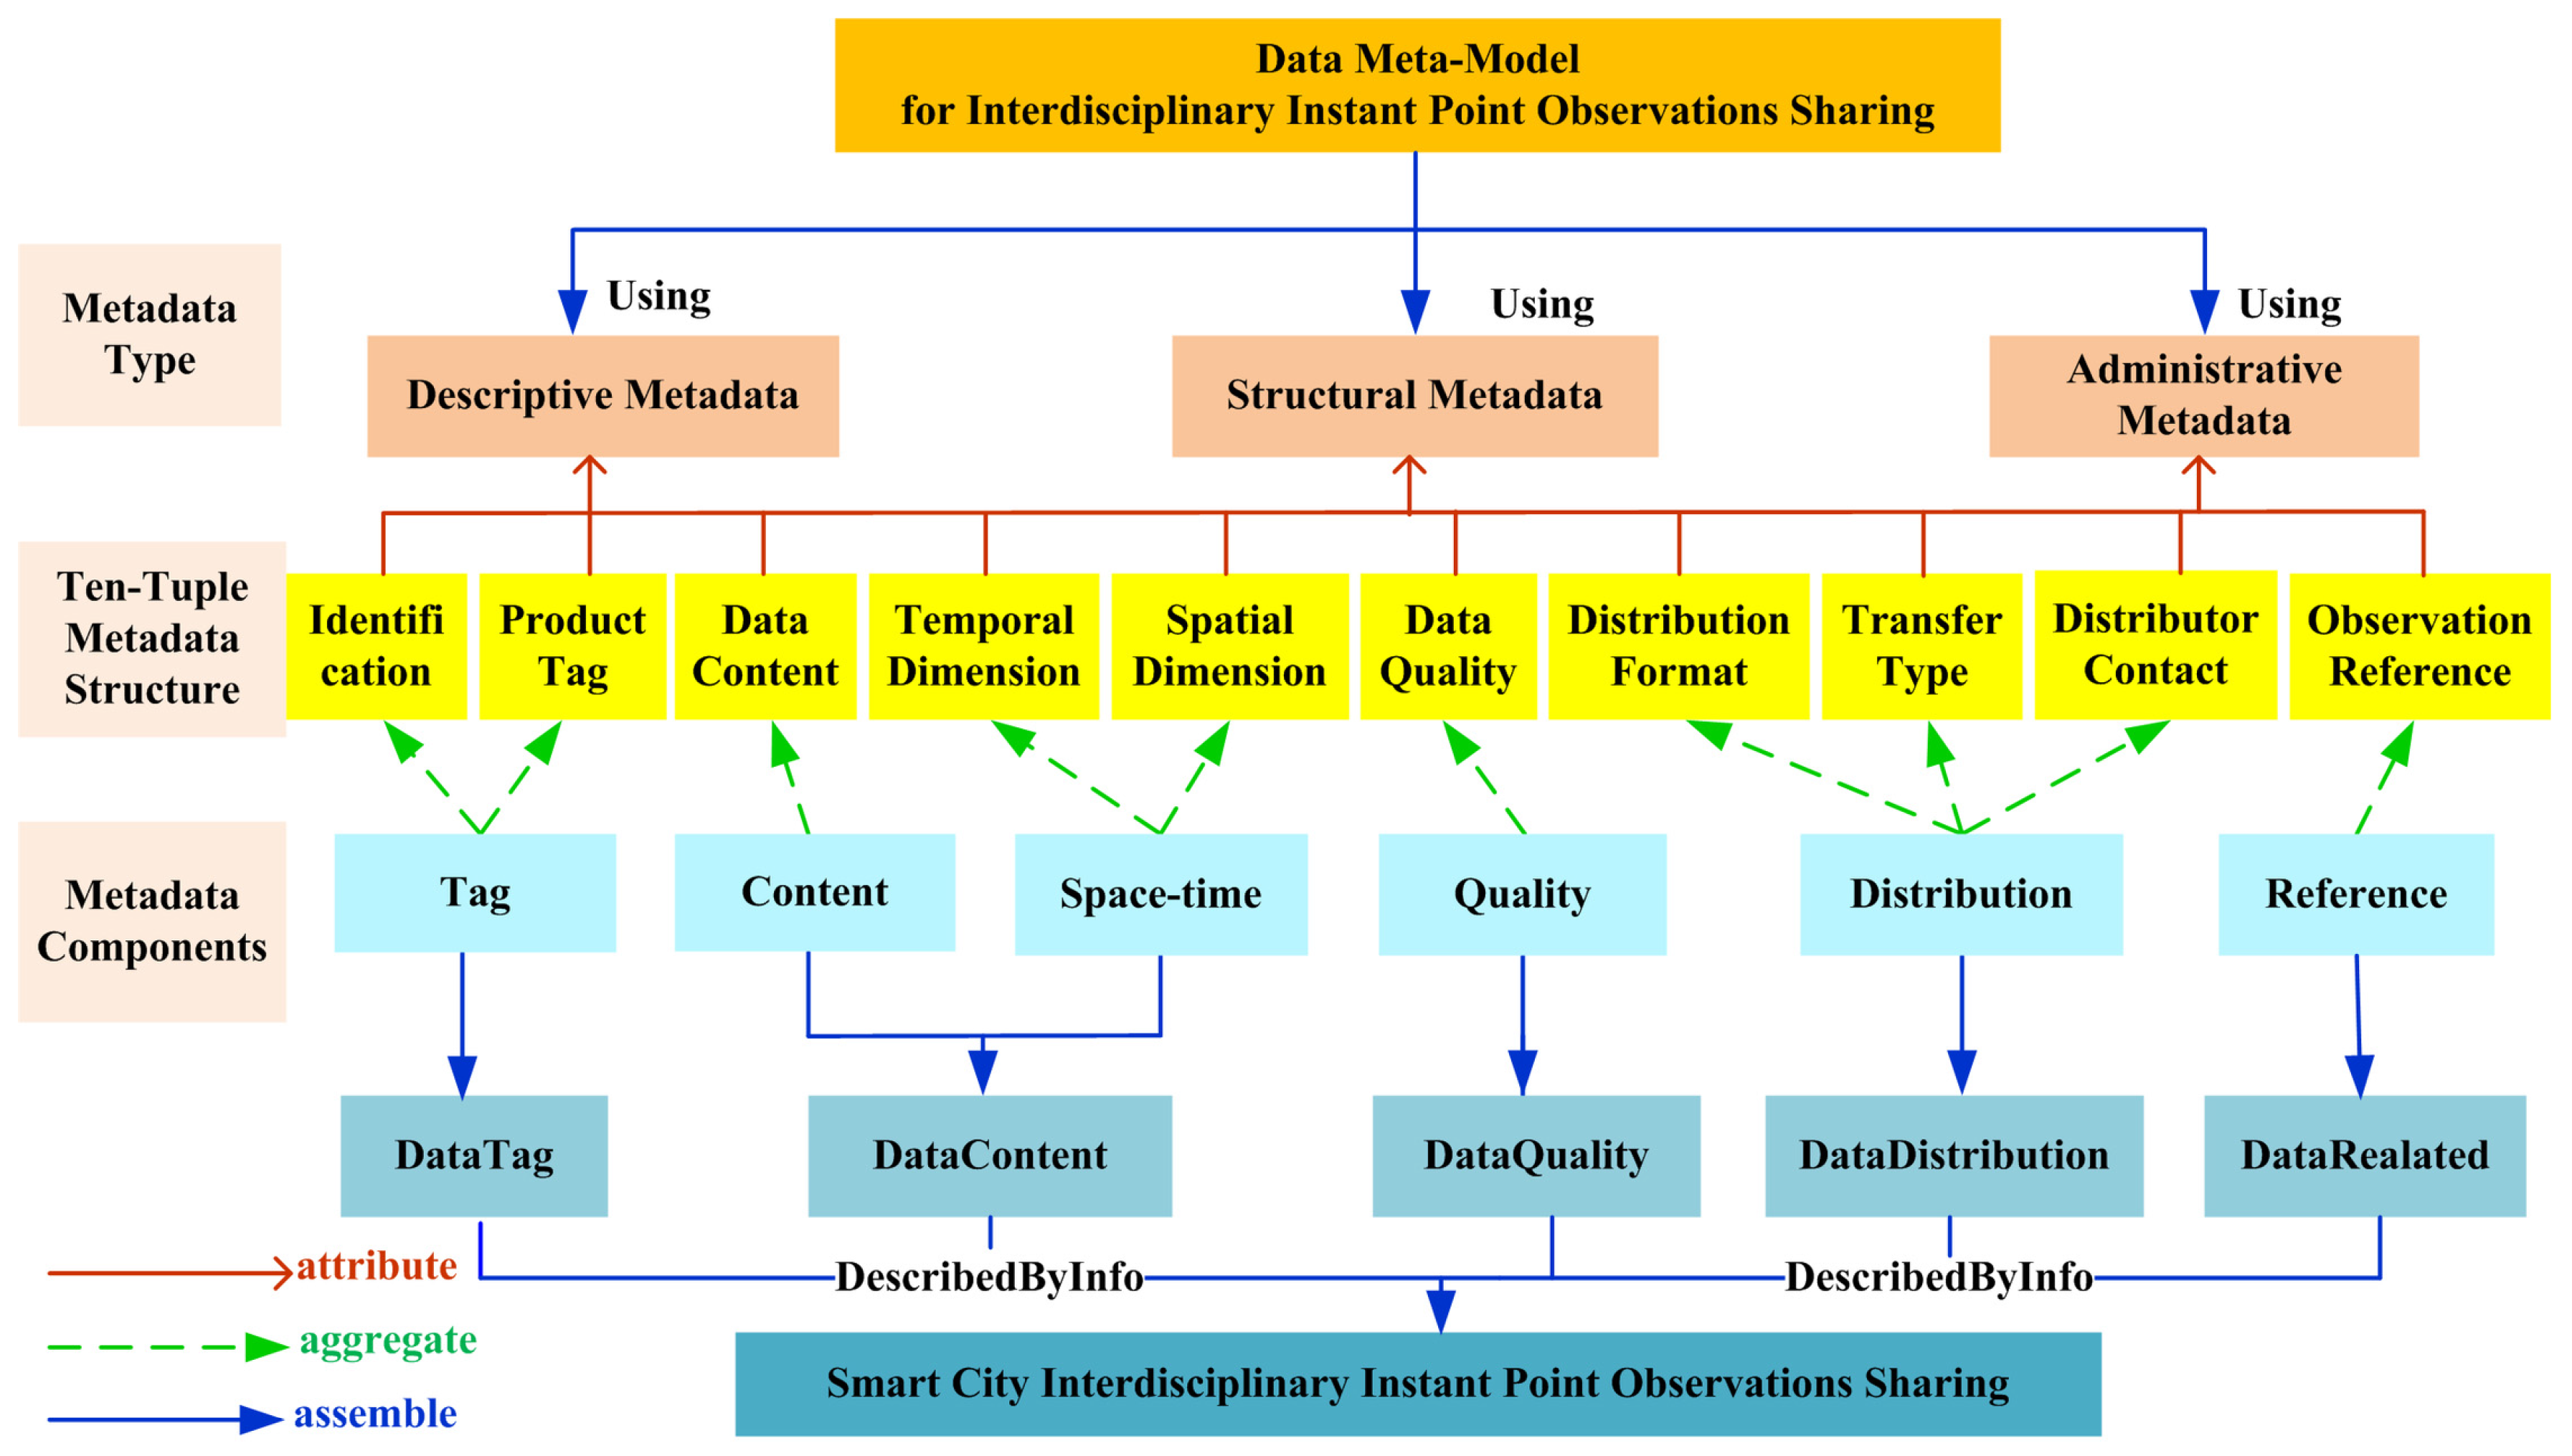
2.3. Basic Metadata Components of the DMM
- Tag: Tag information includes the identification and product information, such as dataset and observation properties, which can provide the basis descriptive metadata information for data discovery and determine whether the data itself can be quickly found for emergency responses.
- Content: Content information covers the data type of point observations. Because of the different observation mechanism, the point observation data produced by different sensors have essential differences in data content, thus helping select the DMM within a certain scope.
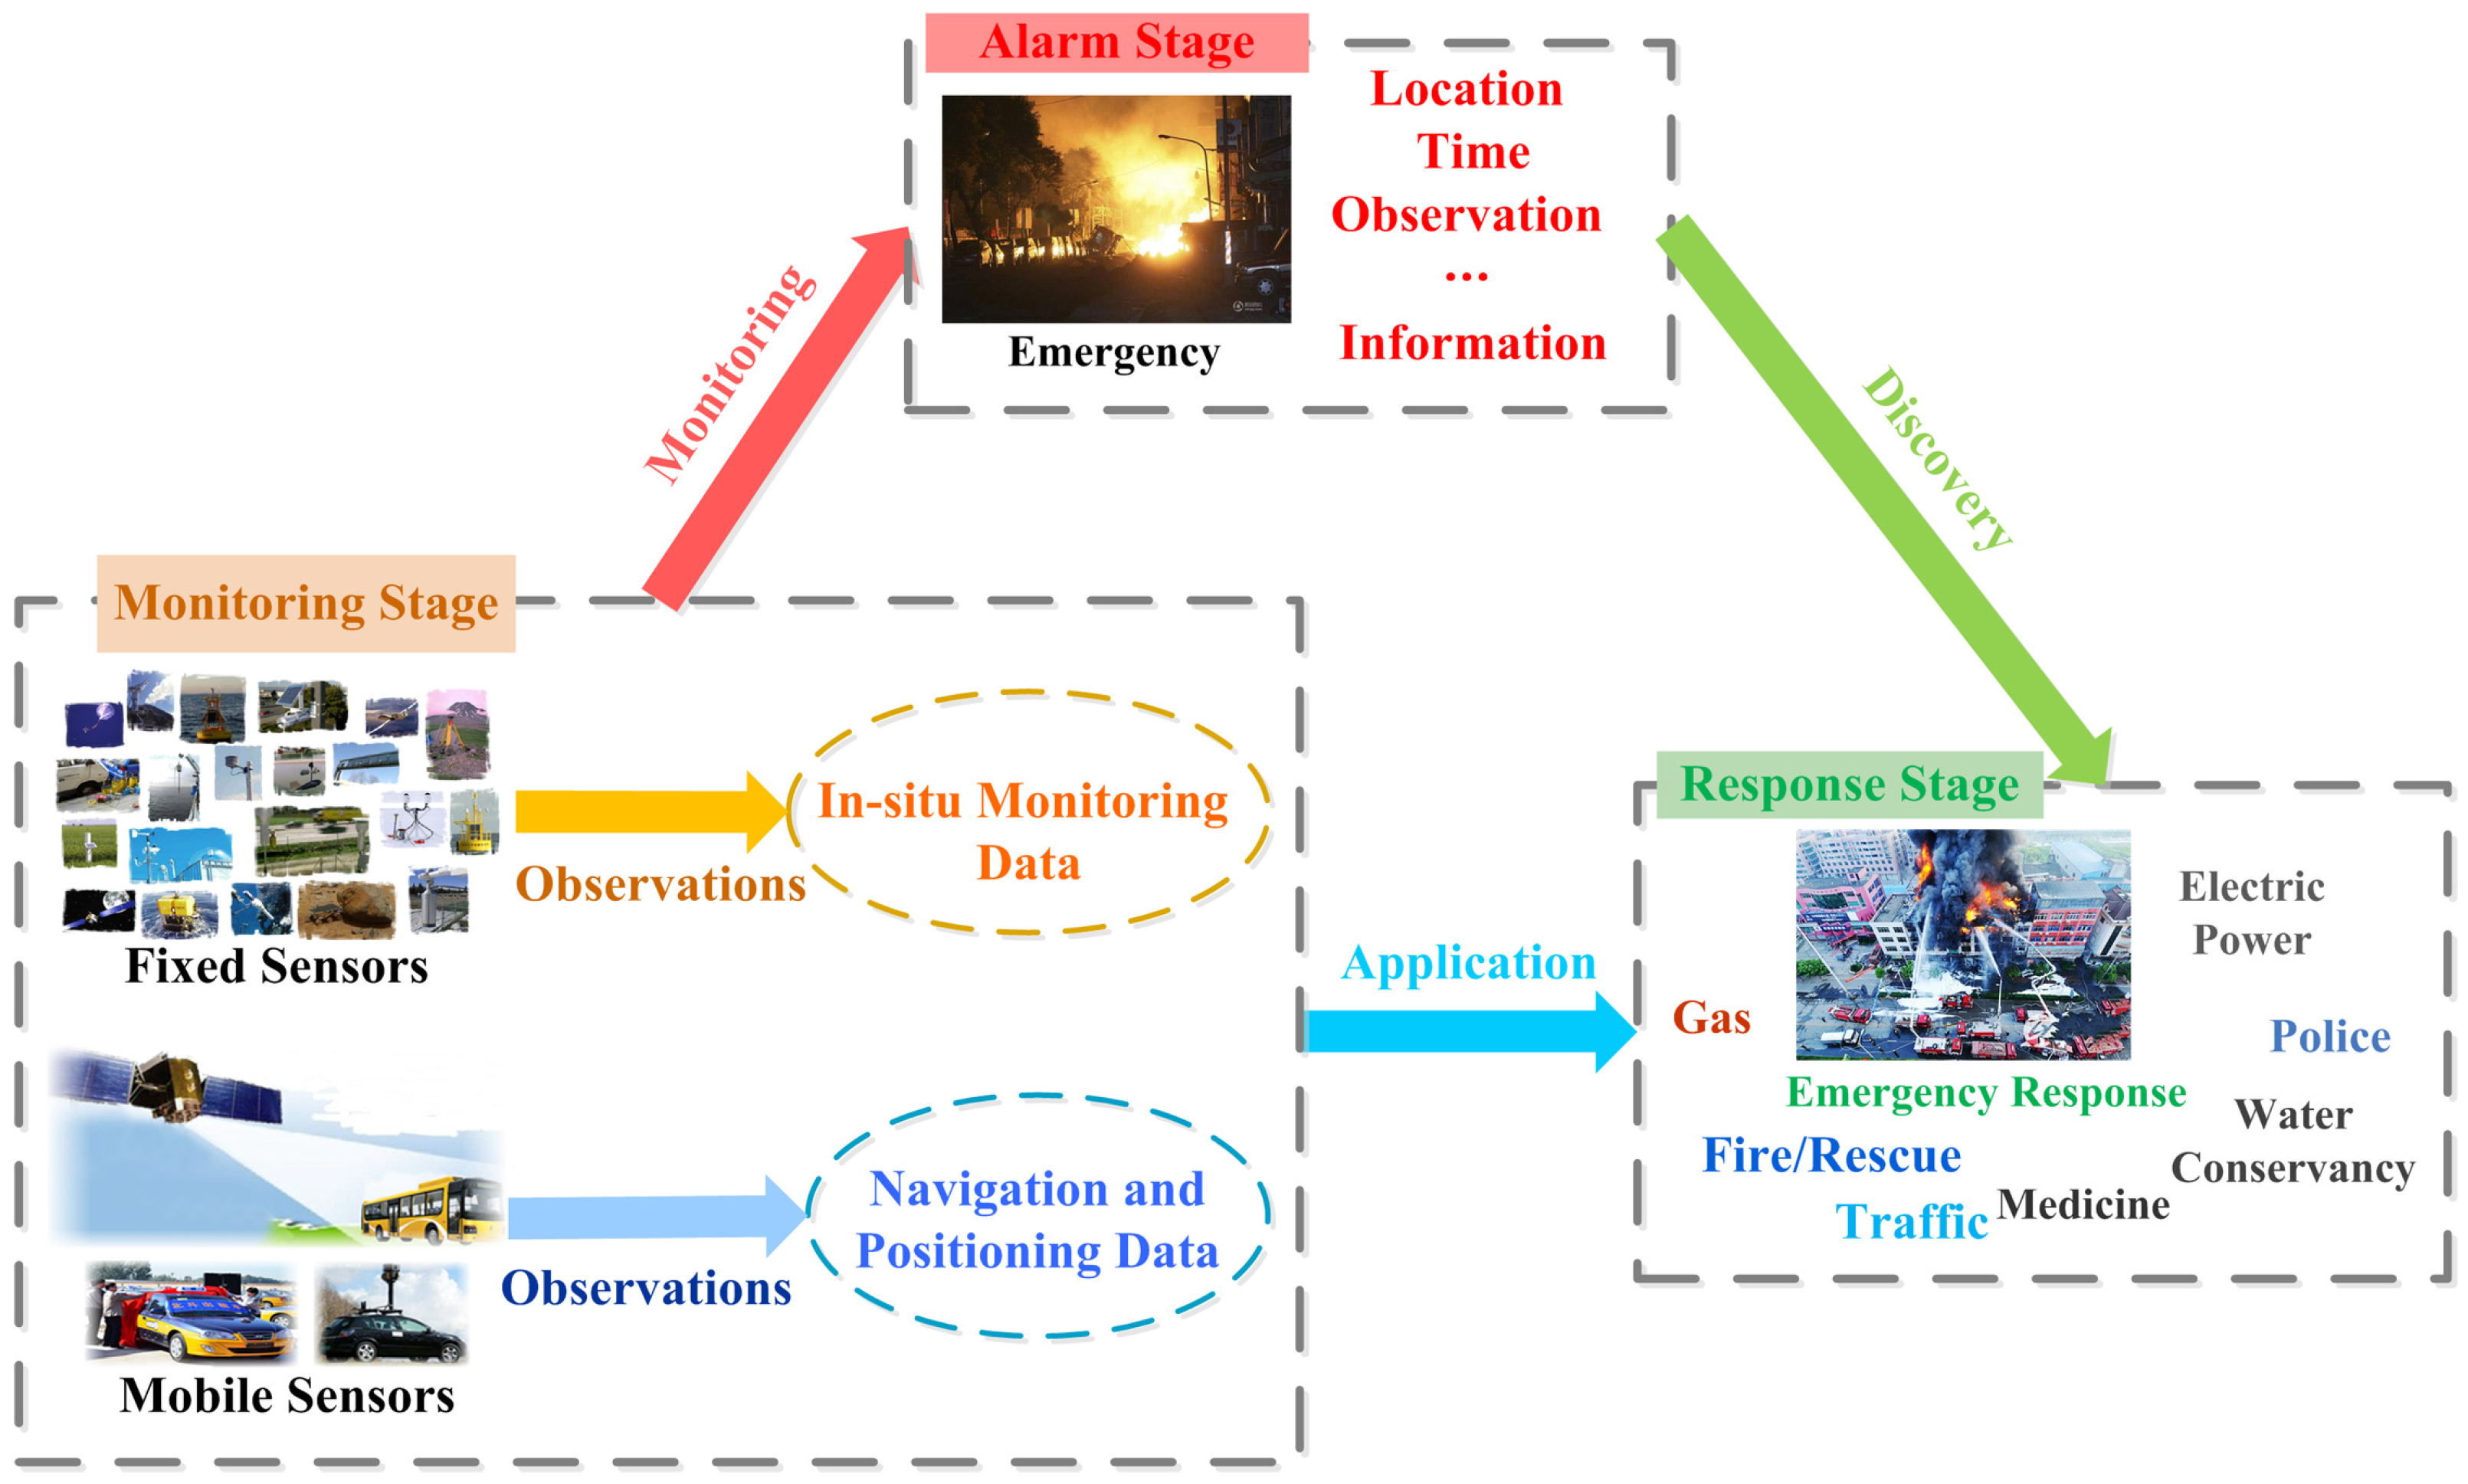
- Space-Time: Space-Time information records the spatial and temporal properties of emergency in detail, such as the information of location, time, and the space and time referencing framework, which can enhance the spatio-temporal information description, and is crucial for data interconnection and collaborative applications for emergency responses data resources.
- Quality: Quality information is mainly about the observation results and sampling method, and plays an important role in the application of point observation data, especially, in the field of ability or suitability.
- Distribution: Distribution information mainly includes the distribution format, distribution contact, and transfer type, and reflects the information of data ownership. Besides, the way of data distribution is affected by regulators, access level and the influence of legal and security constraint conditions, which is essential to data availability.
- Reference: Reference information covers the related information of metadata and observation elements, which is important for the discovery of point observation data, and can also be used as the basic information of data query. In addition, the relevant observation information allows users to enhance the perception of related data resources for specific tasks.
2.4. Ten-Tuple Information Description Structure
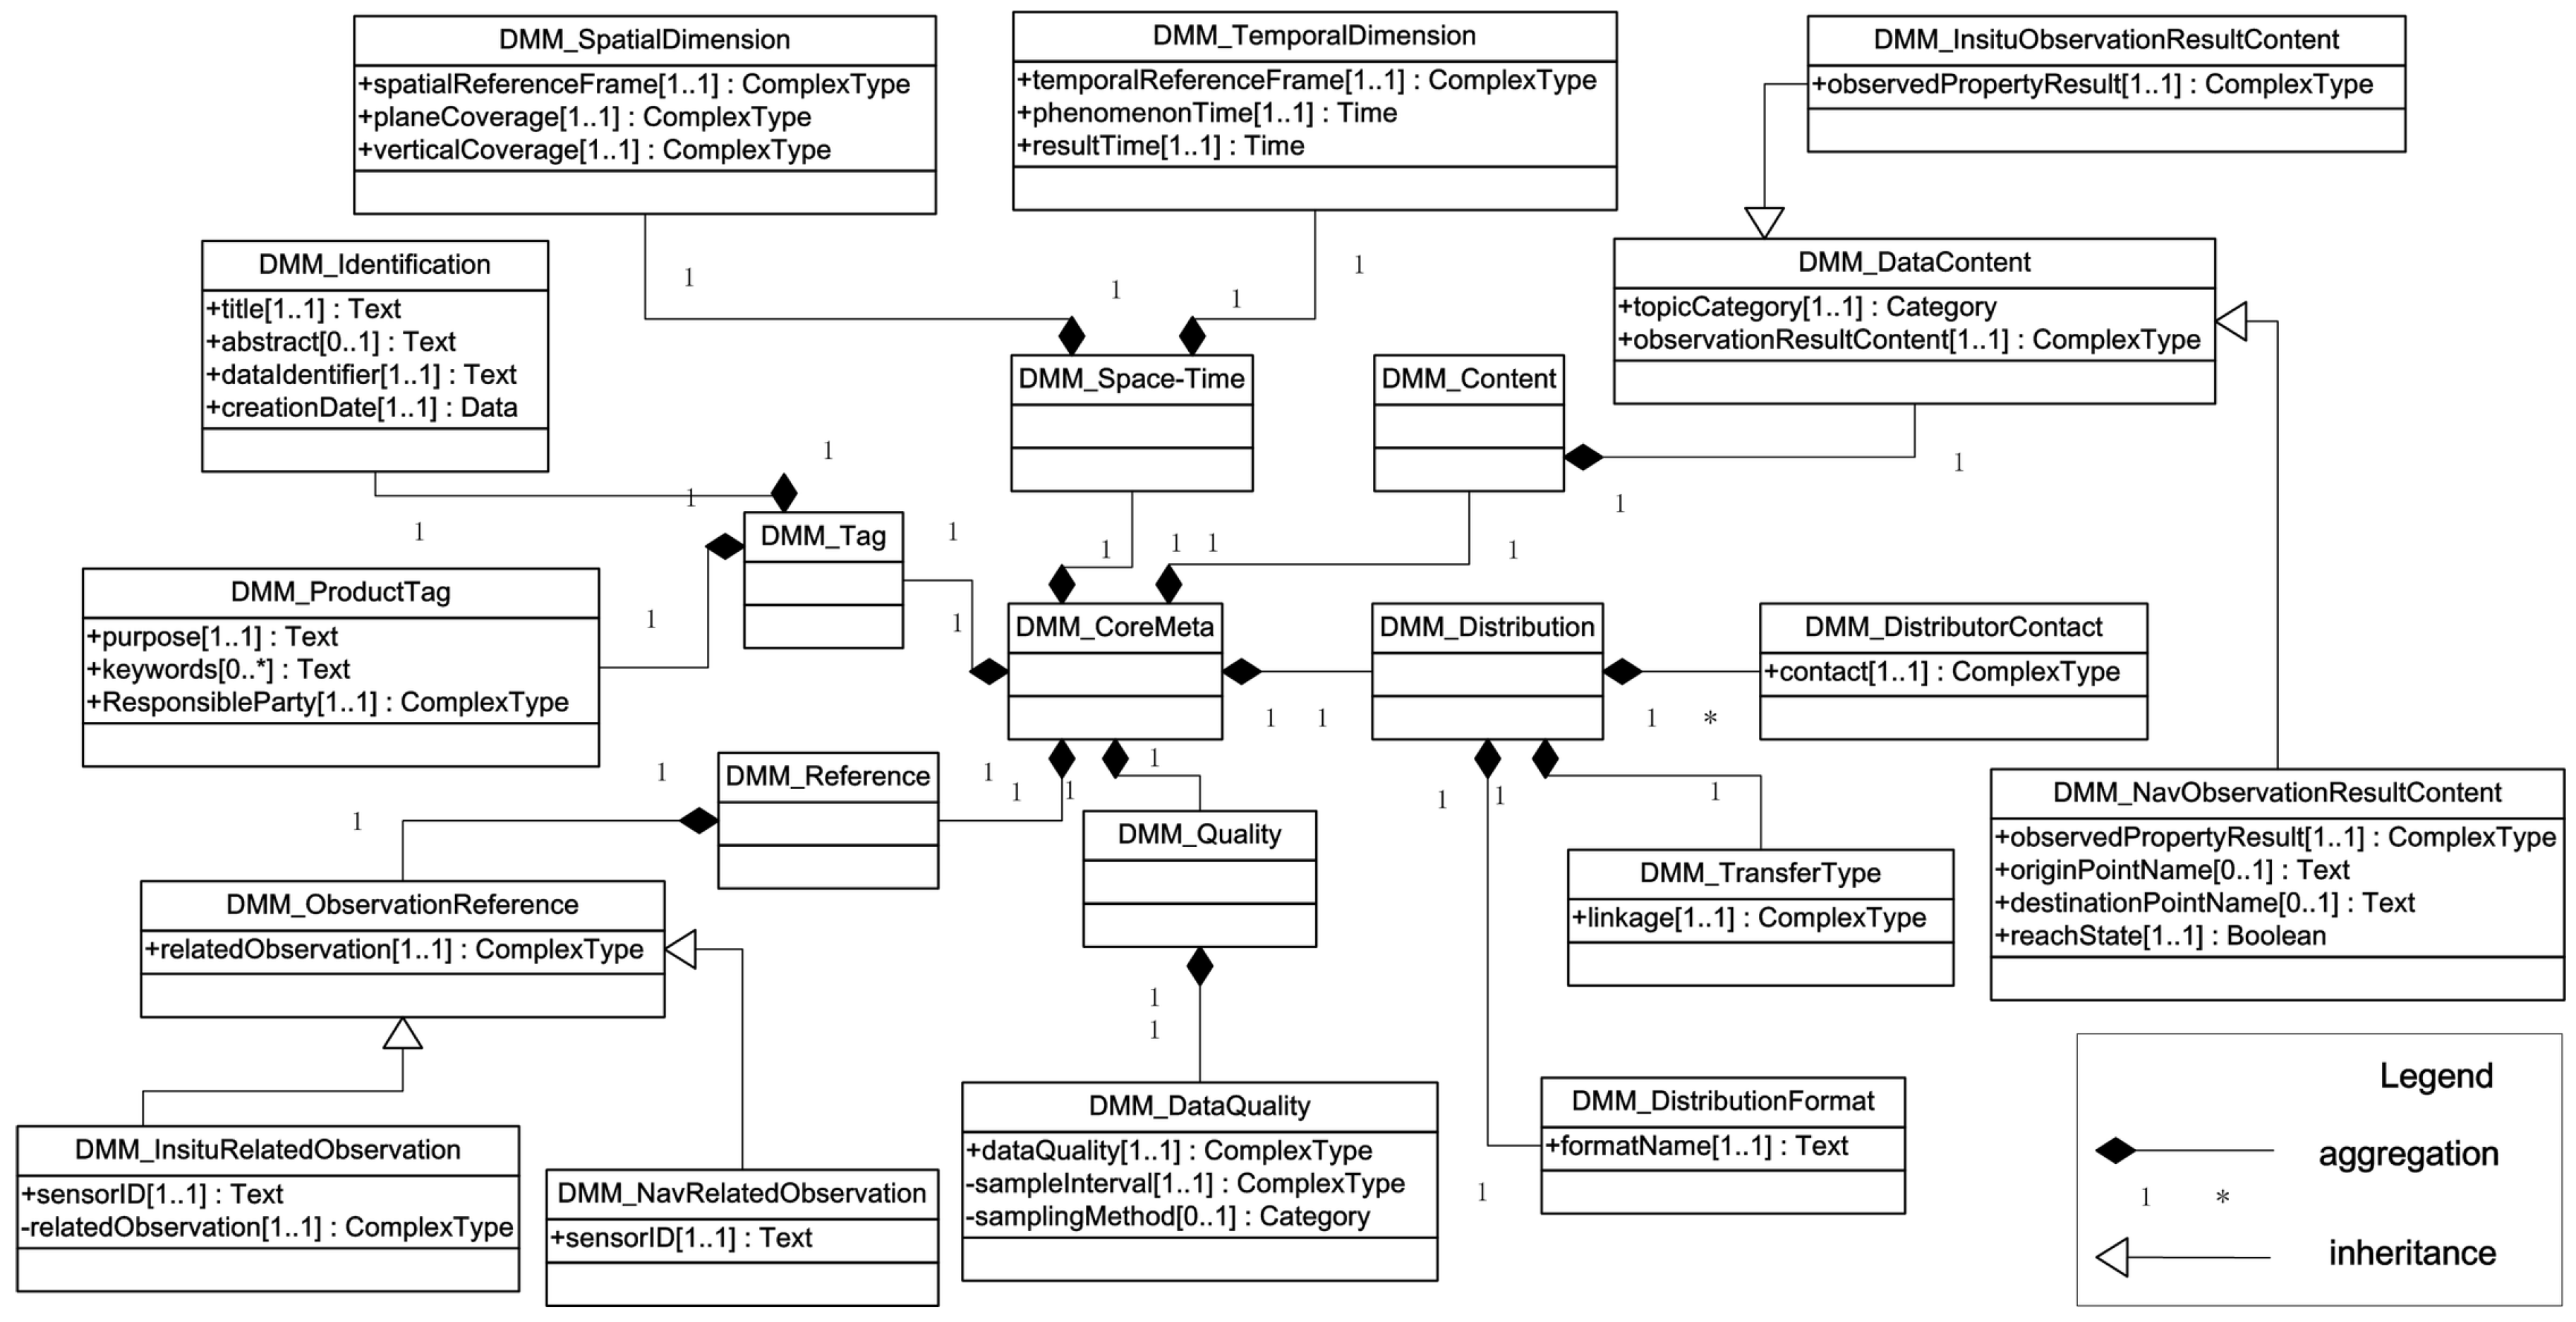
- Identification: It includes title, abstract, data identifier and creation date, which can describe the basic data information of point observations resources, as well as identify data uniquely for data discovery.
- Product tag: It includes purpose, keywords and data responsible party information to describe the characteristic product information of point observation data.
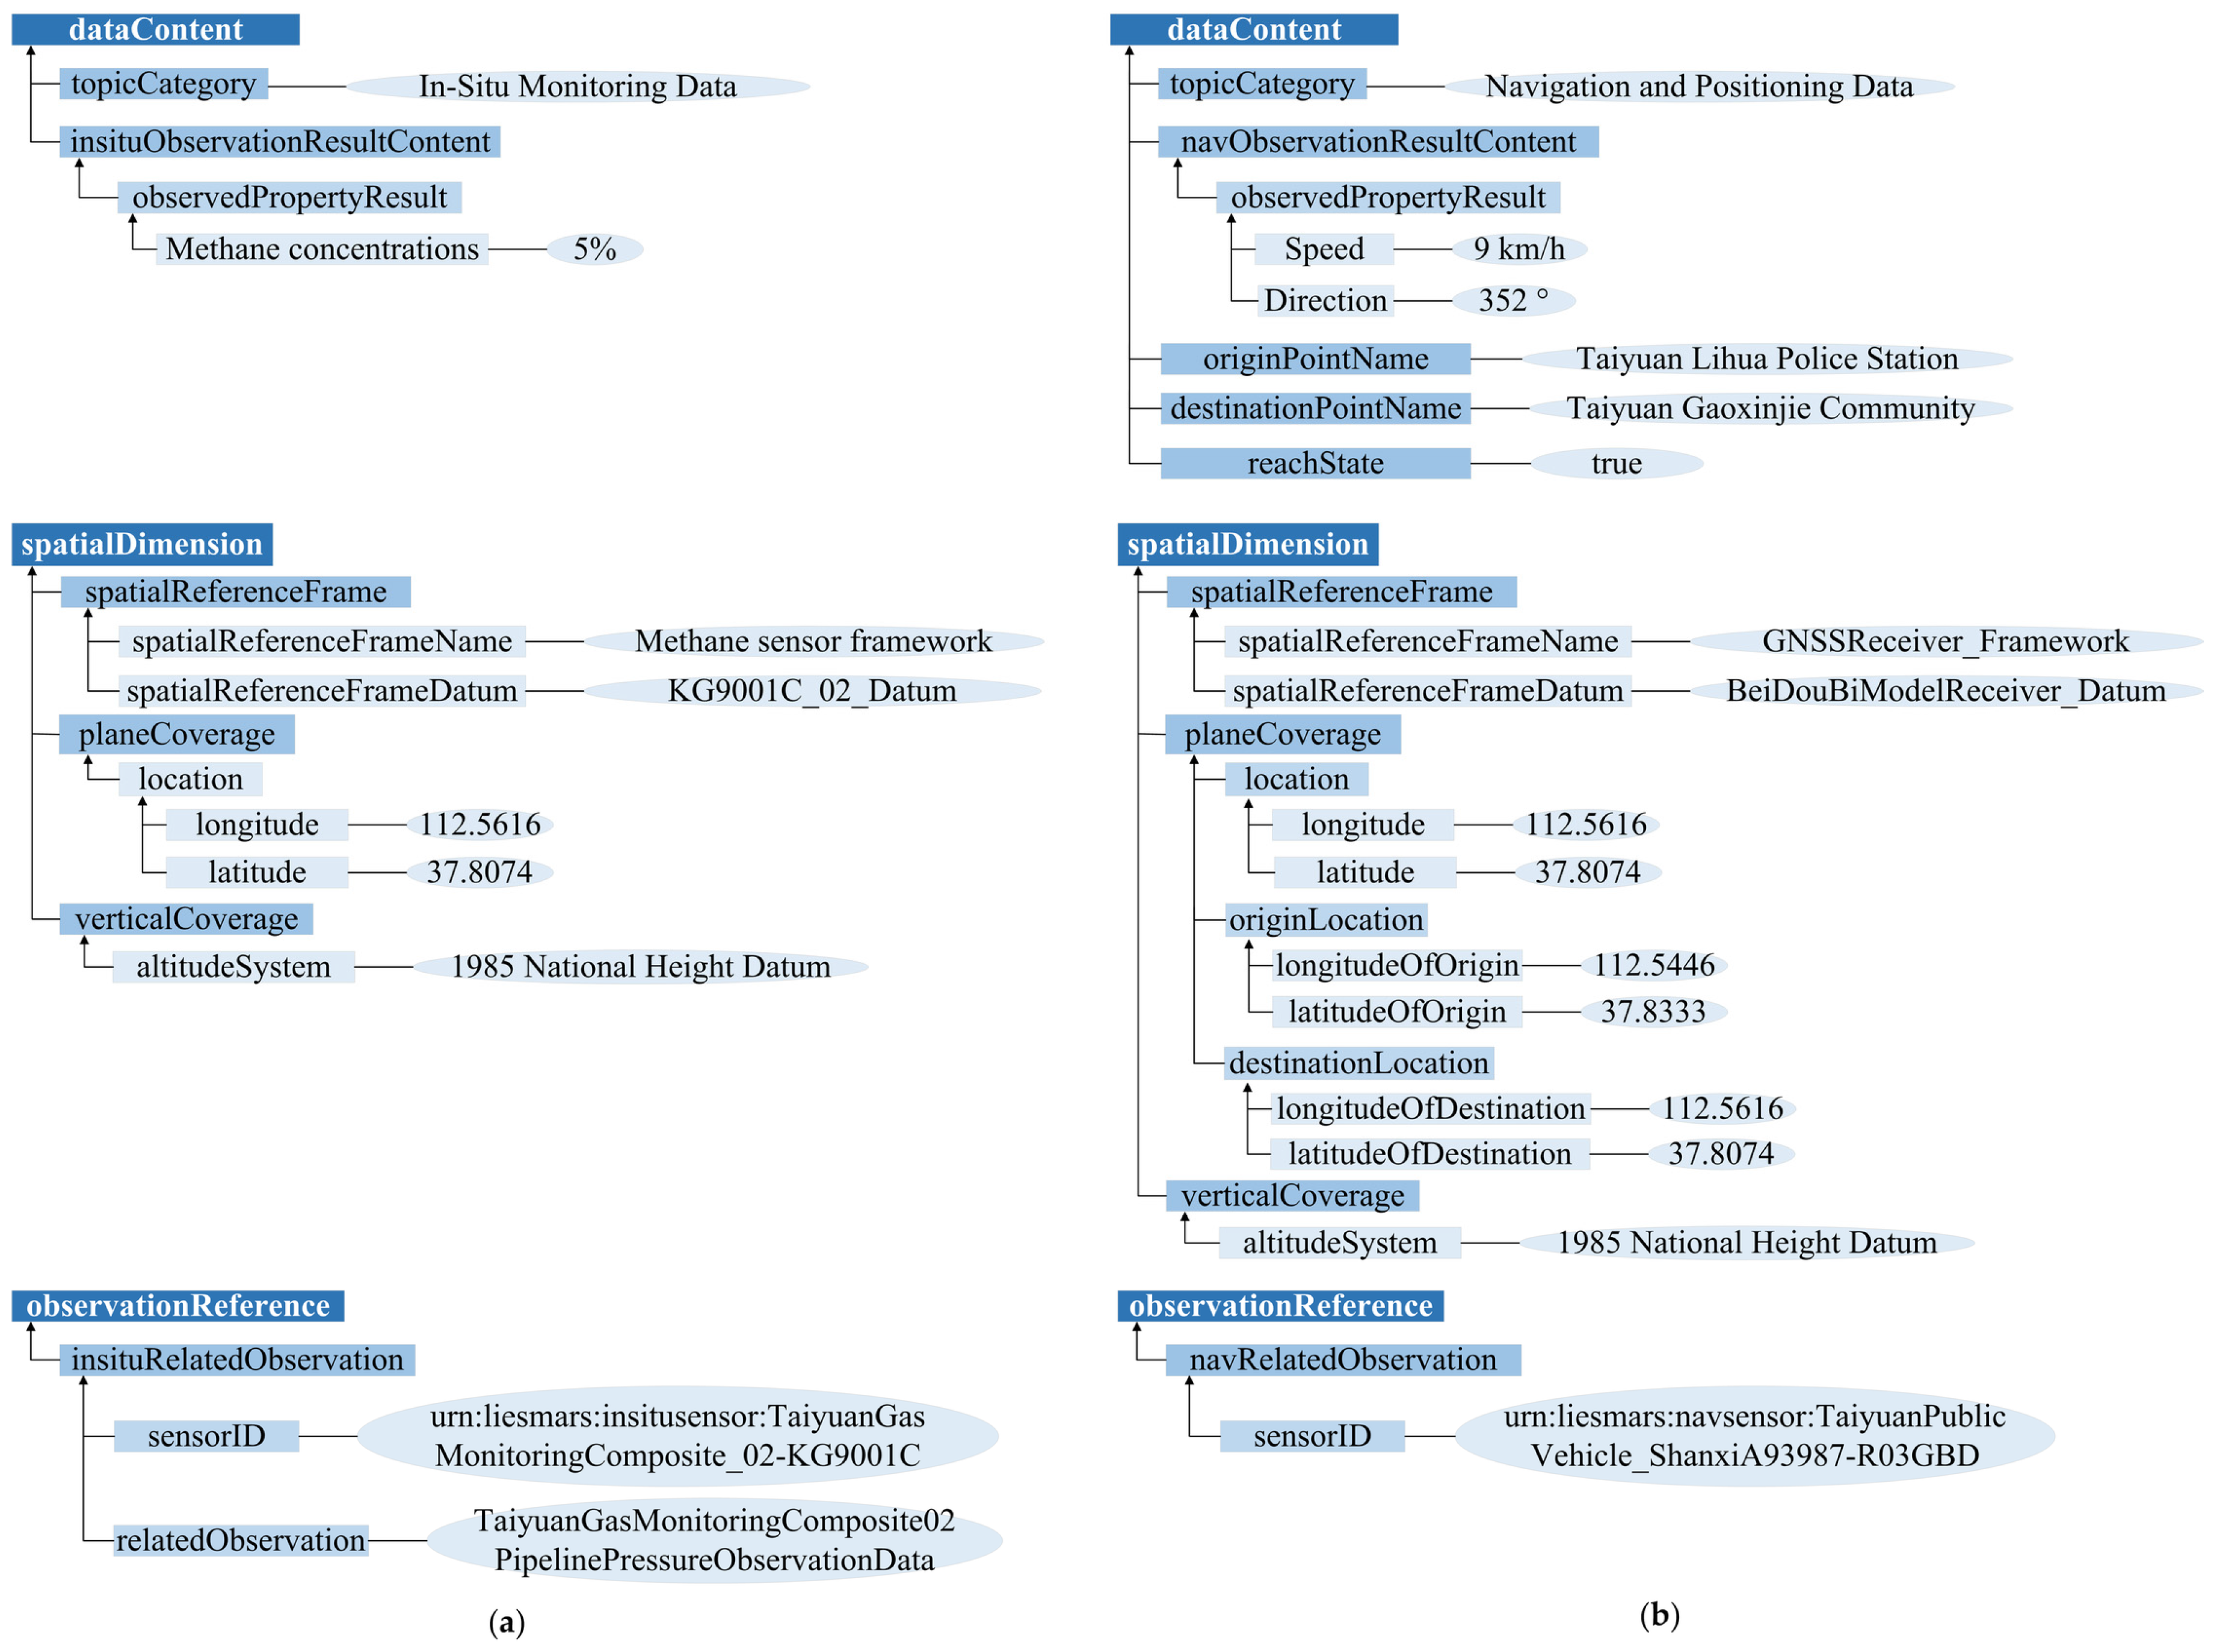
- Data content: It includes topic category and observation result content. The information can describe different application fields and observed property result of point observation data.
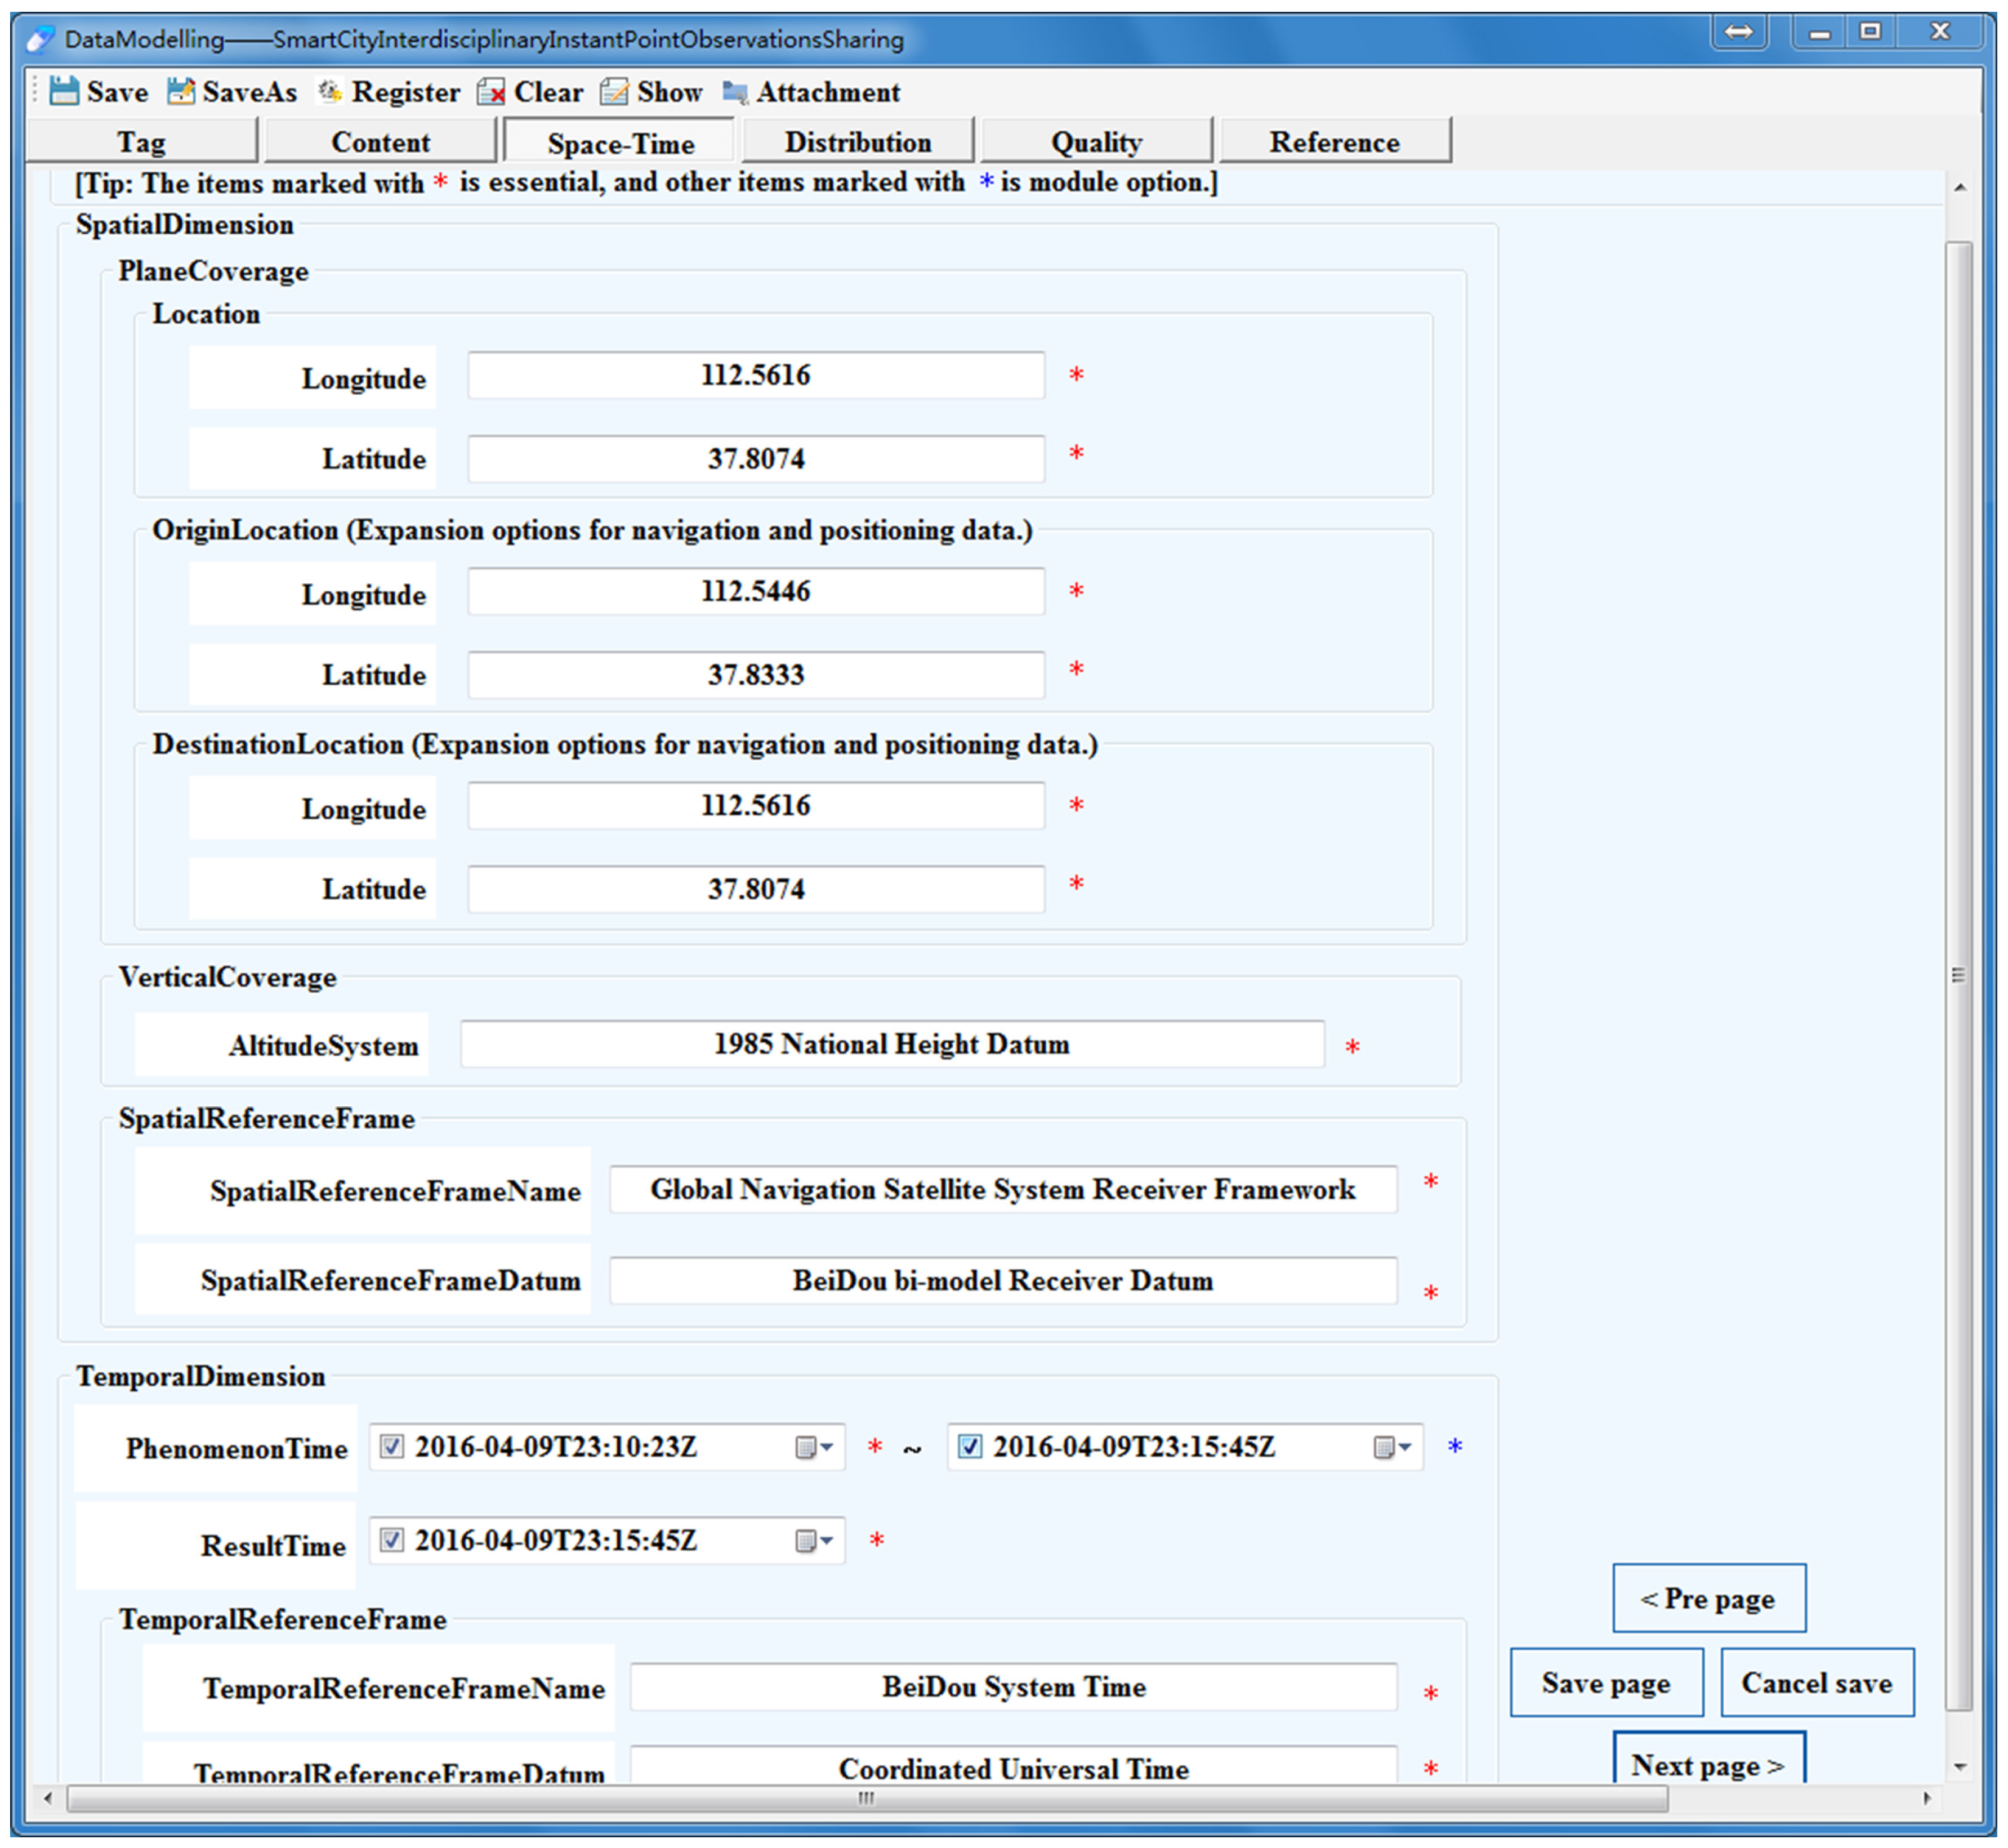
- Temporal dimension: It includes the phenomenon time, result time and temporal reference frame to uniformly describe the temporal information of observation data, which can determine whether the DMM is available for a specific time of emergency response.
- Spatial dimension: It includes the plane coverage, vertical coverage and spatial reference frame to uniformly describe the location information for point observation data which can determine whether the DMM is available for a specific location of emergency response.
- Data quality: It refers to the data quality, sampling interval and sample method, namely, the general instructions that made by data producers for the evaluation of method and process of relevant data sets quality.
- Distribution format: It includes the distribution format name of dataset, which affect the accessibility of point observation data.
- Transfer type: It includes transfer options, such as linkage of point observation data, which can provide the way of data acquisition.
- Distributor contact: It includes the contact information of data distributor, such as name, organization, phone and address, thus providing support for further contact between users and distributors.
- Observation reference: It refers to the related observation, for example, sensorID, which can also distribute to the quick discovery of related DMM instances.
3. Software Implementation
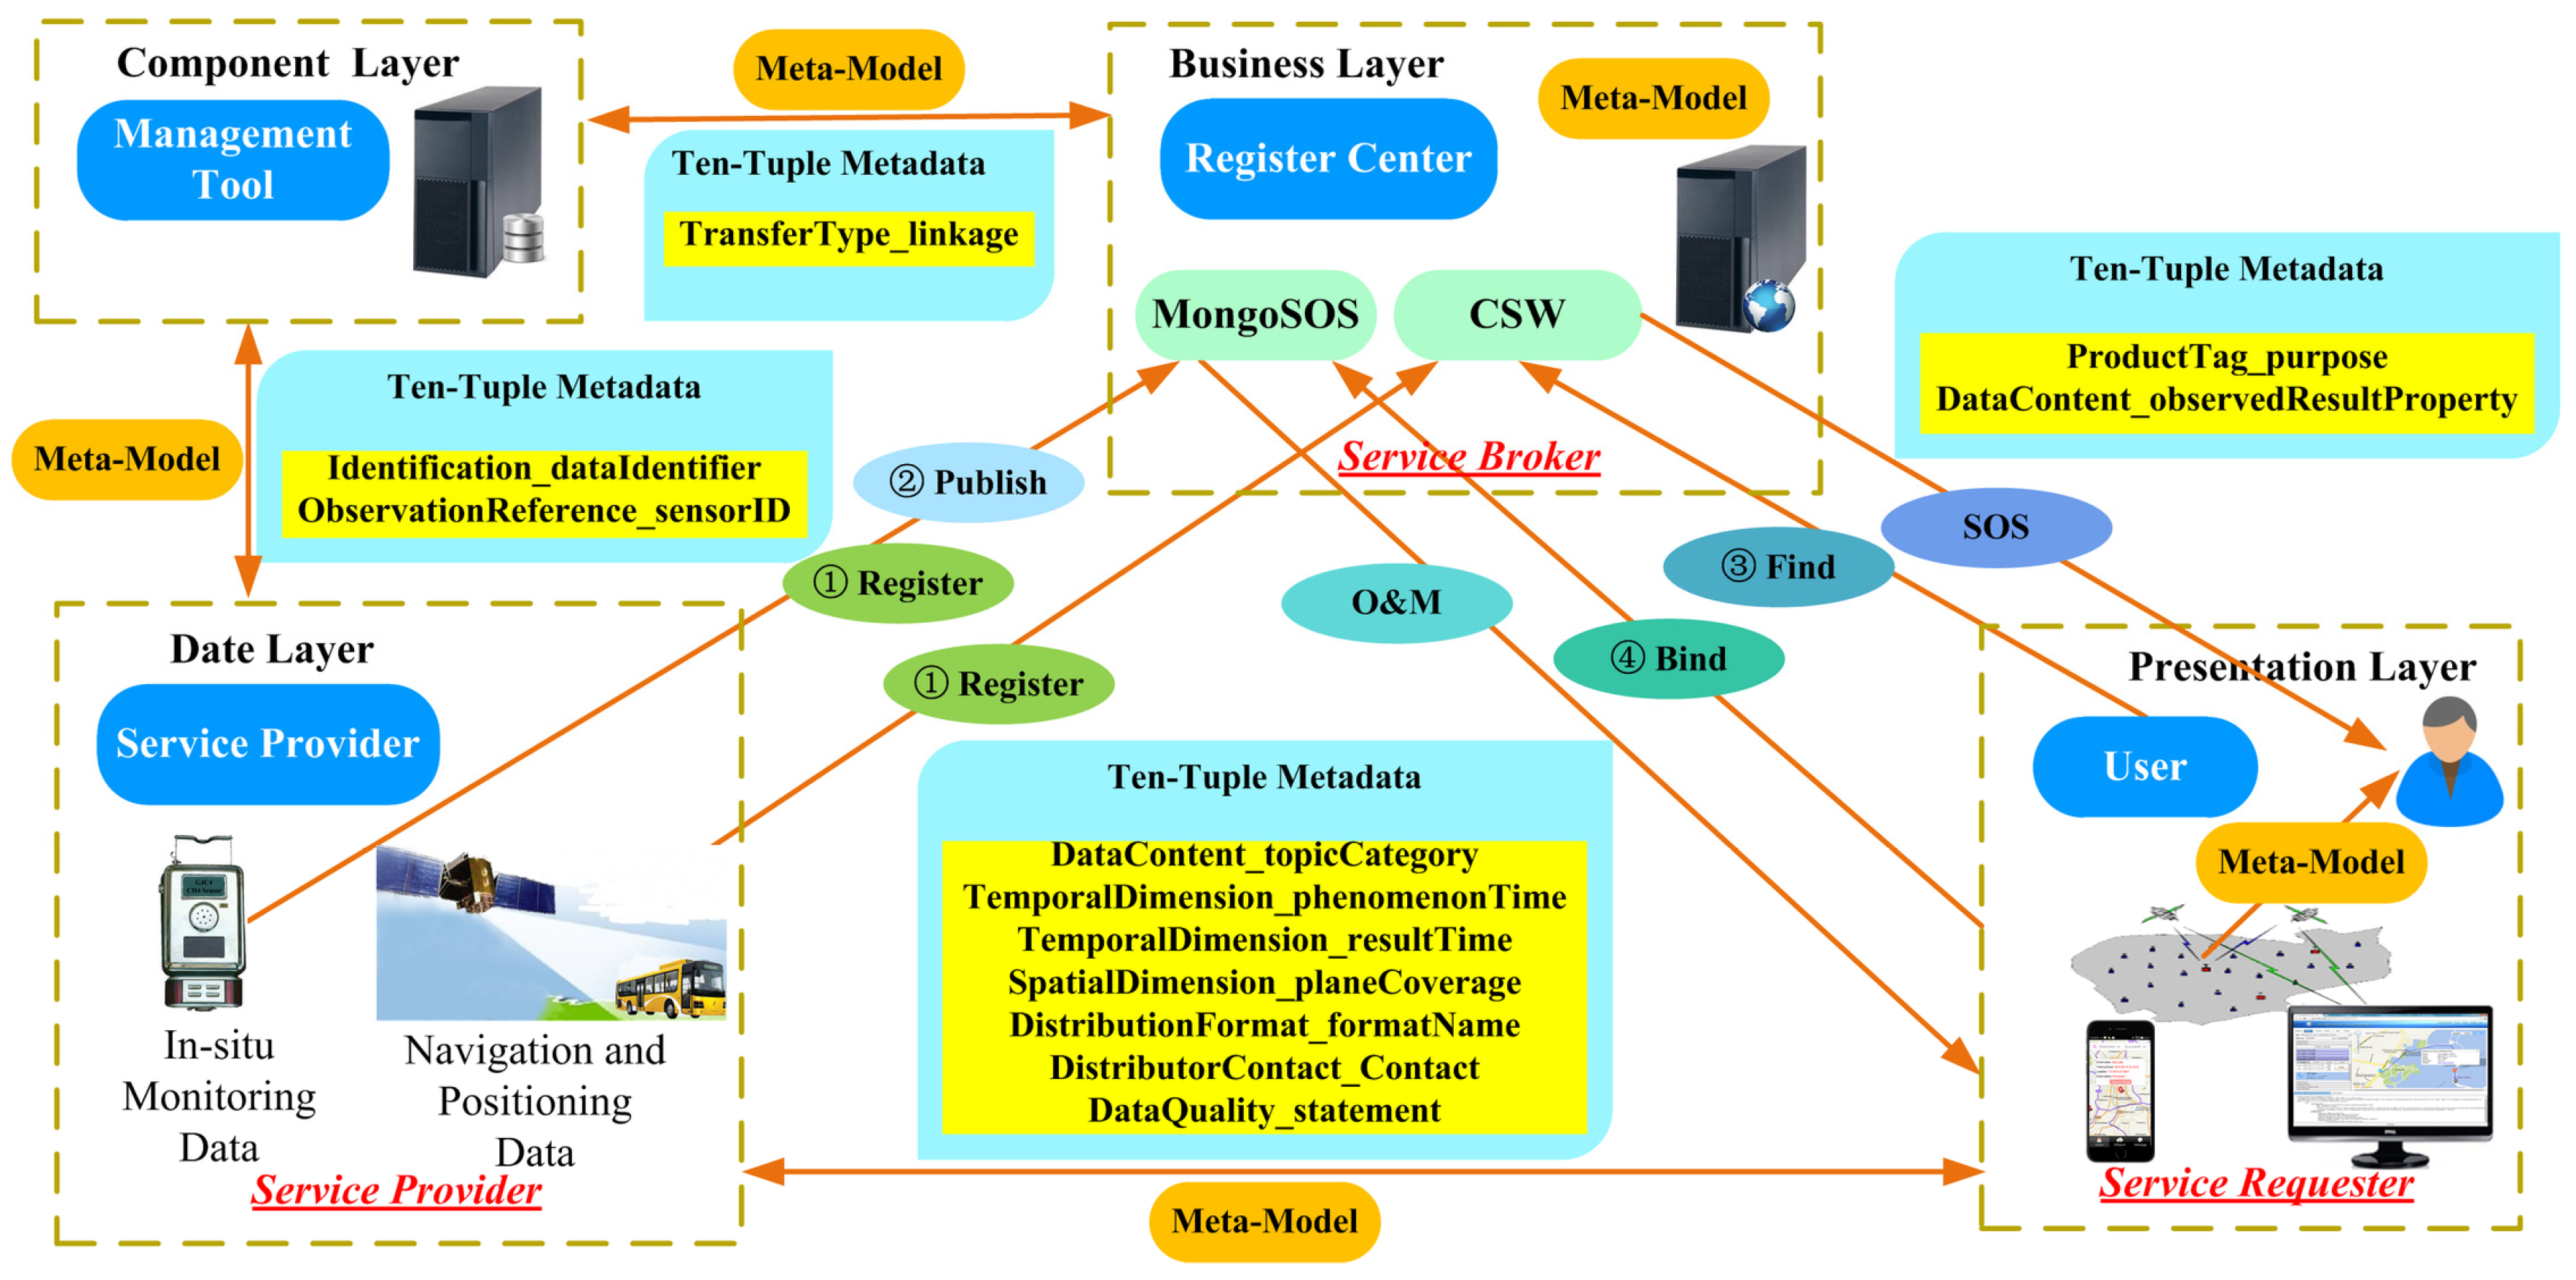
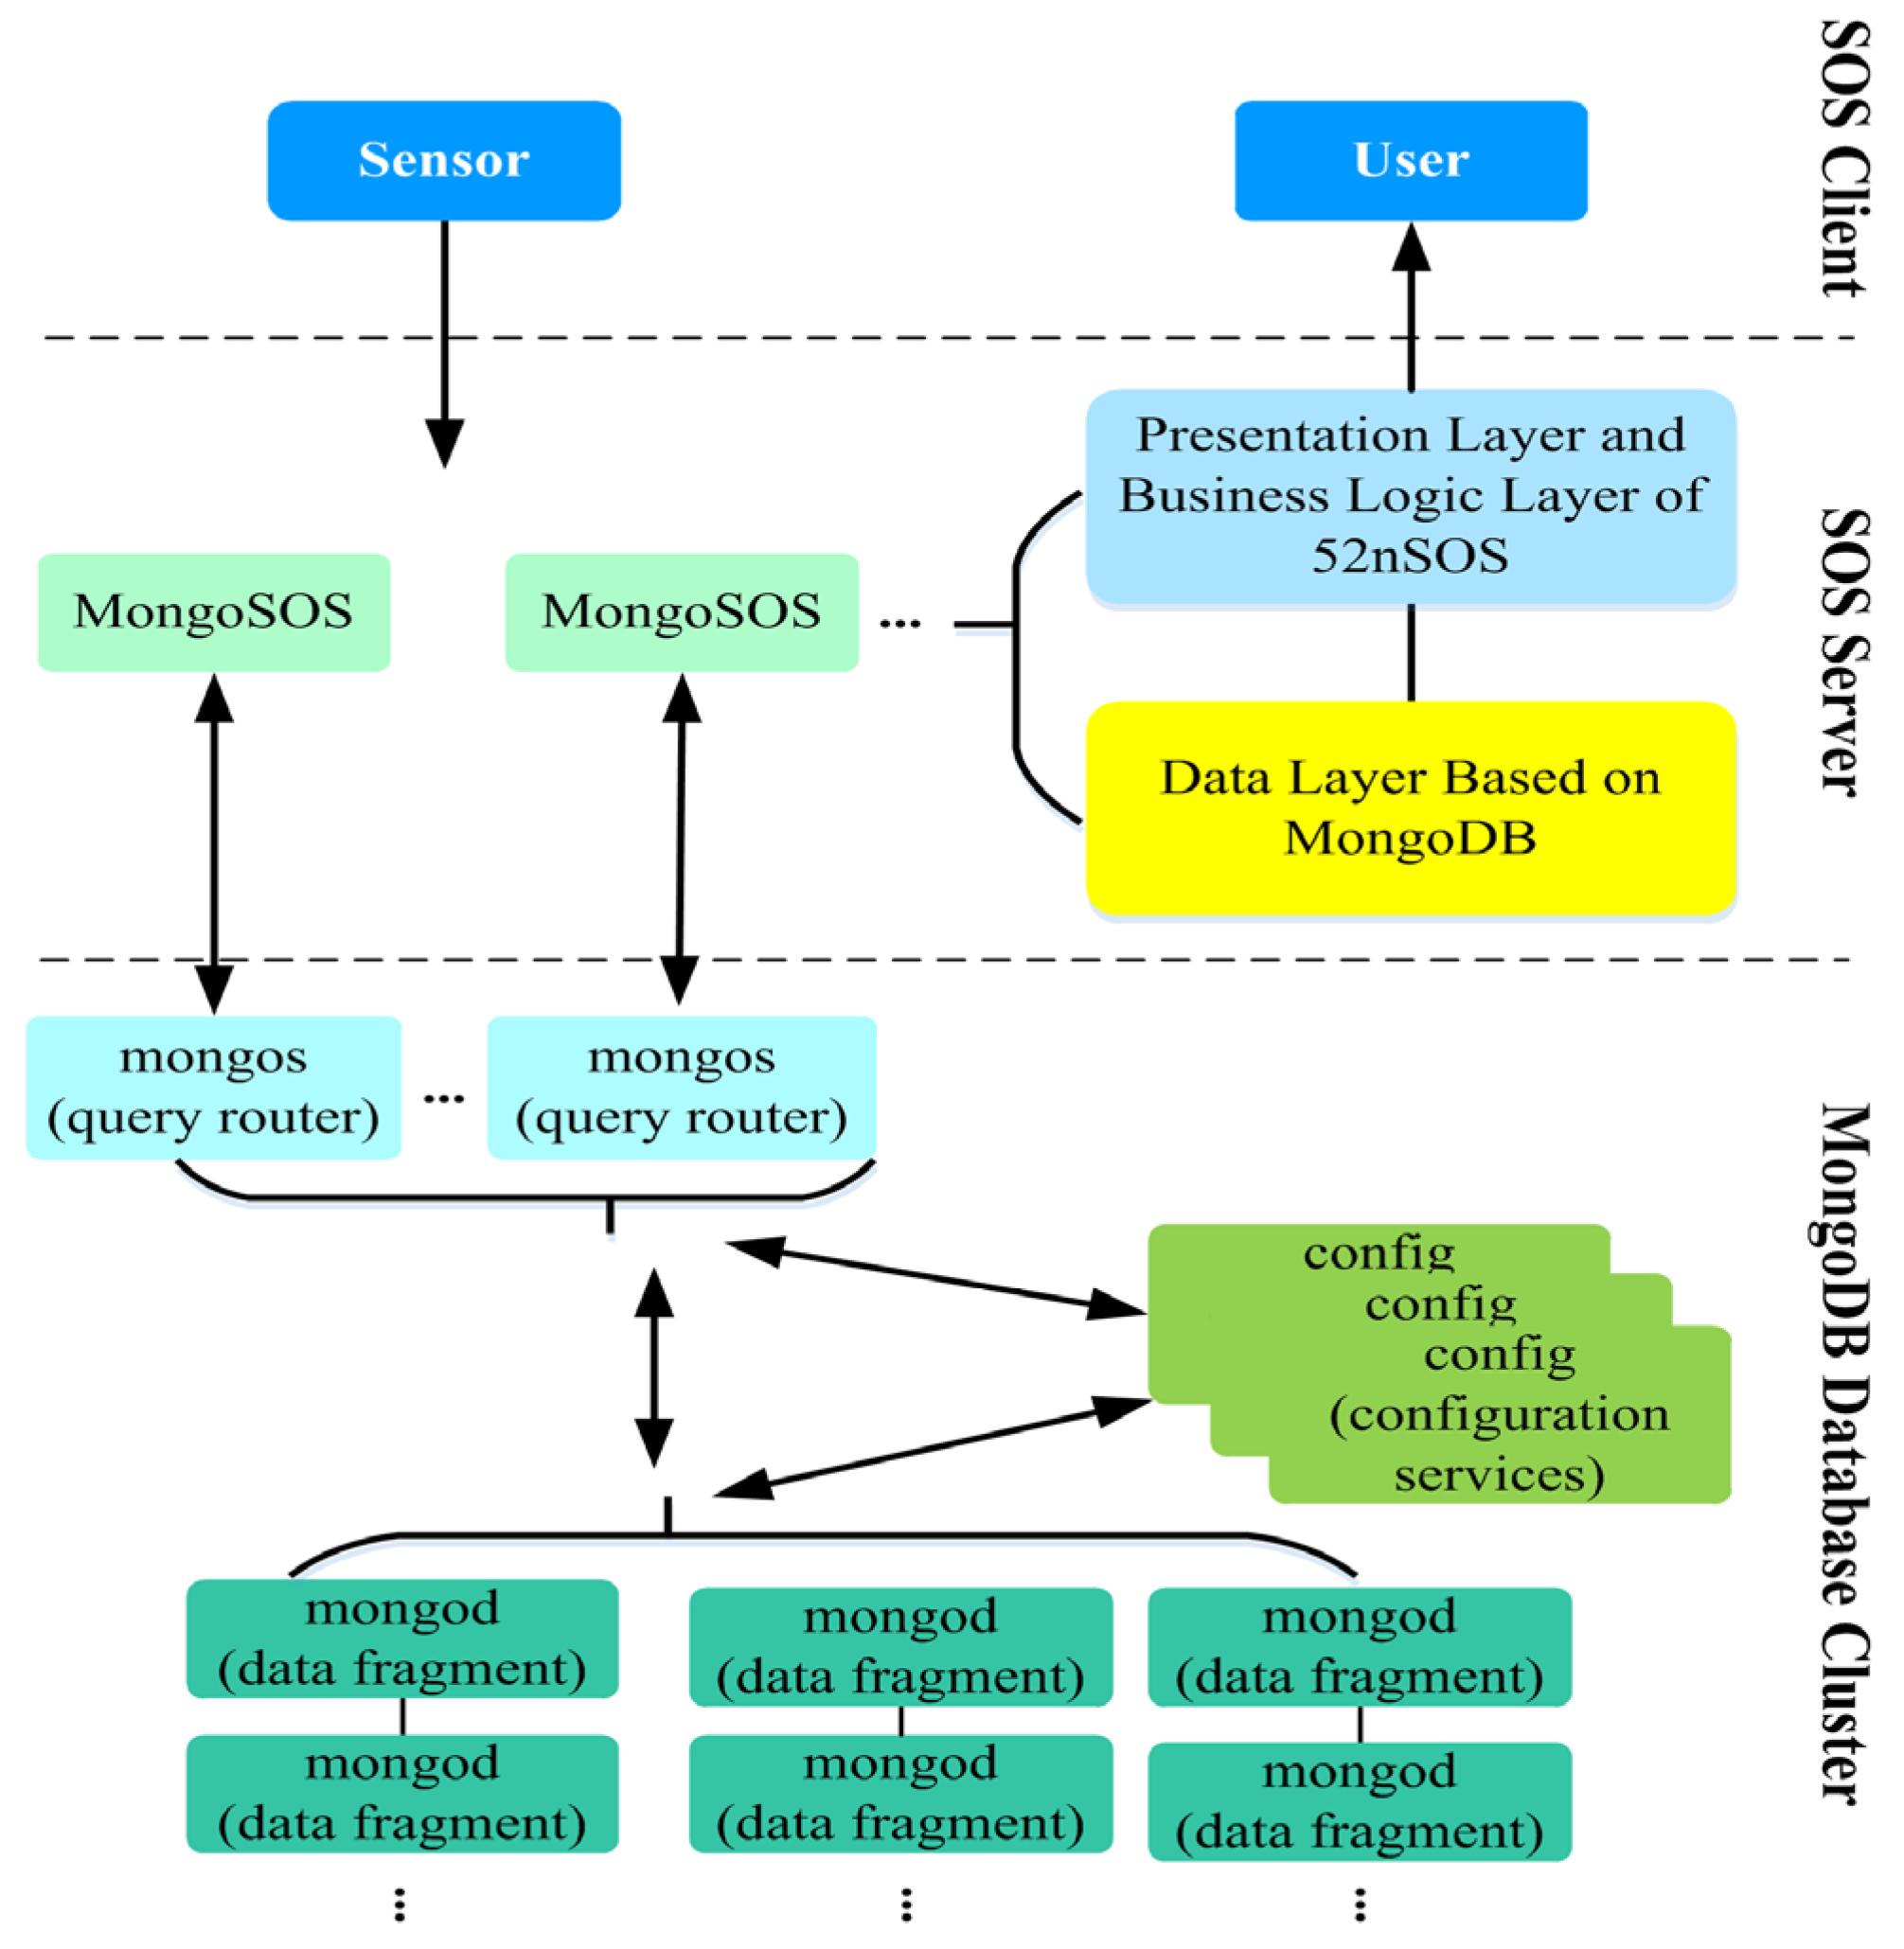
3.1. System Architecture
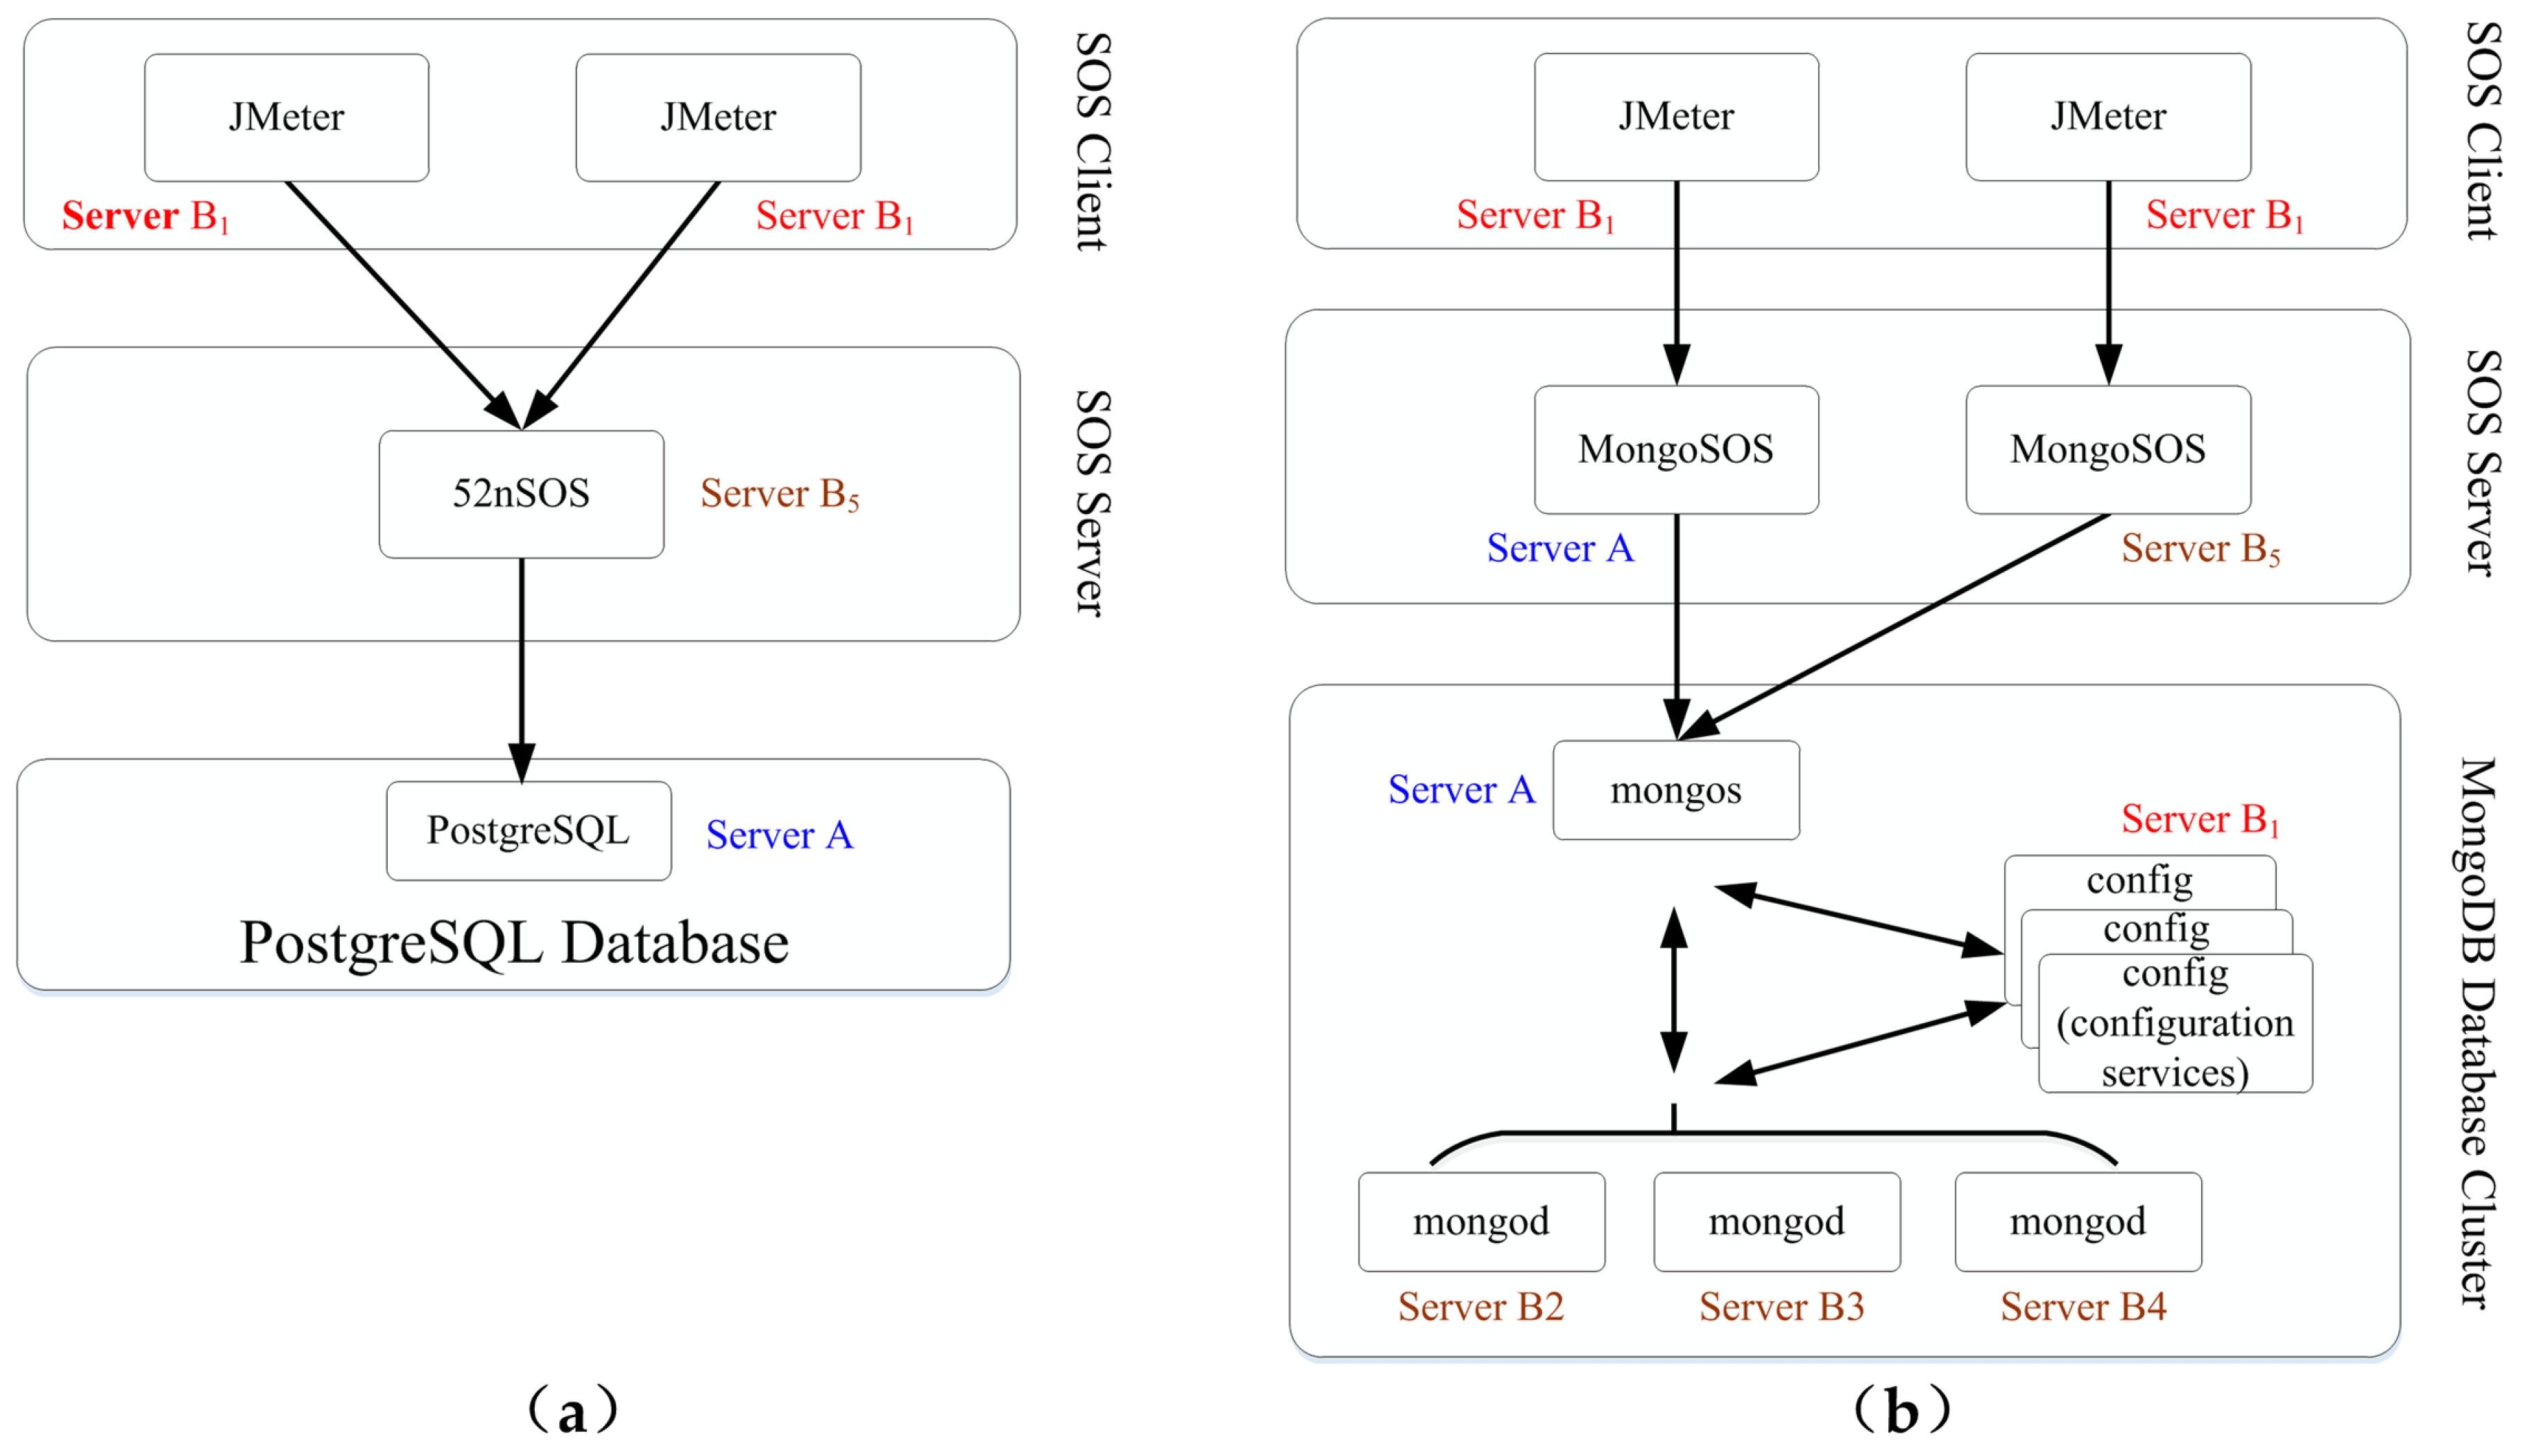
3.2. System Performance Evaluation on SOS
3.3. System Implementation
3.4. Performance Tests of MongoSOS
4. Case Studies
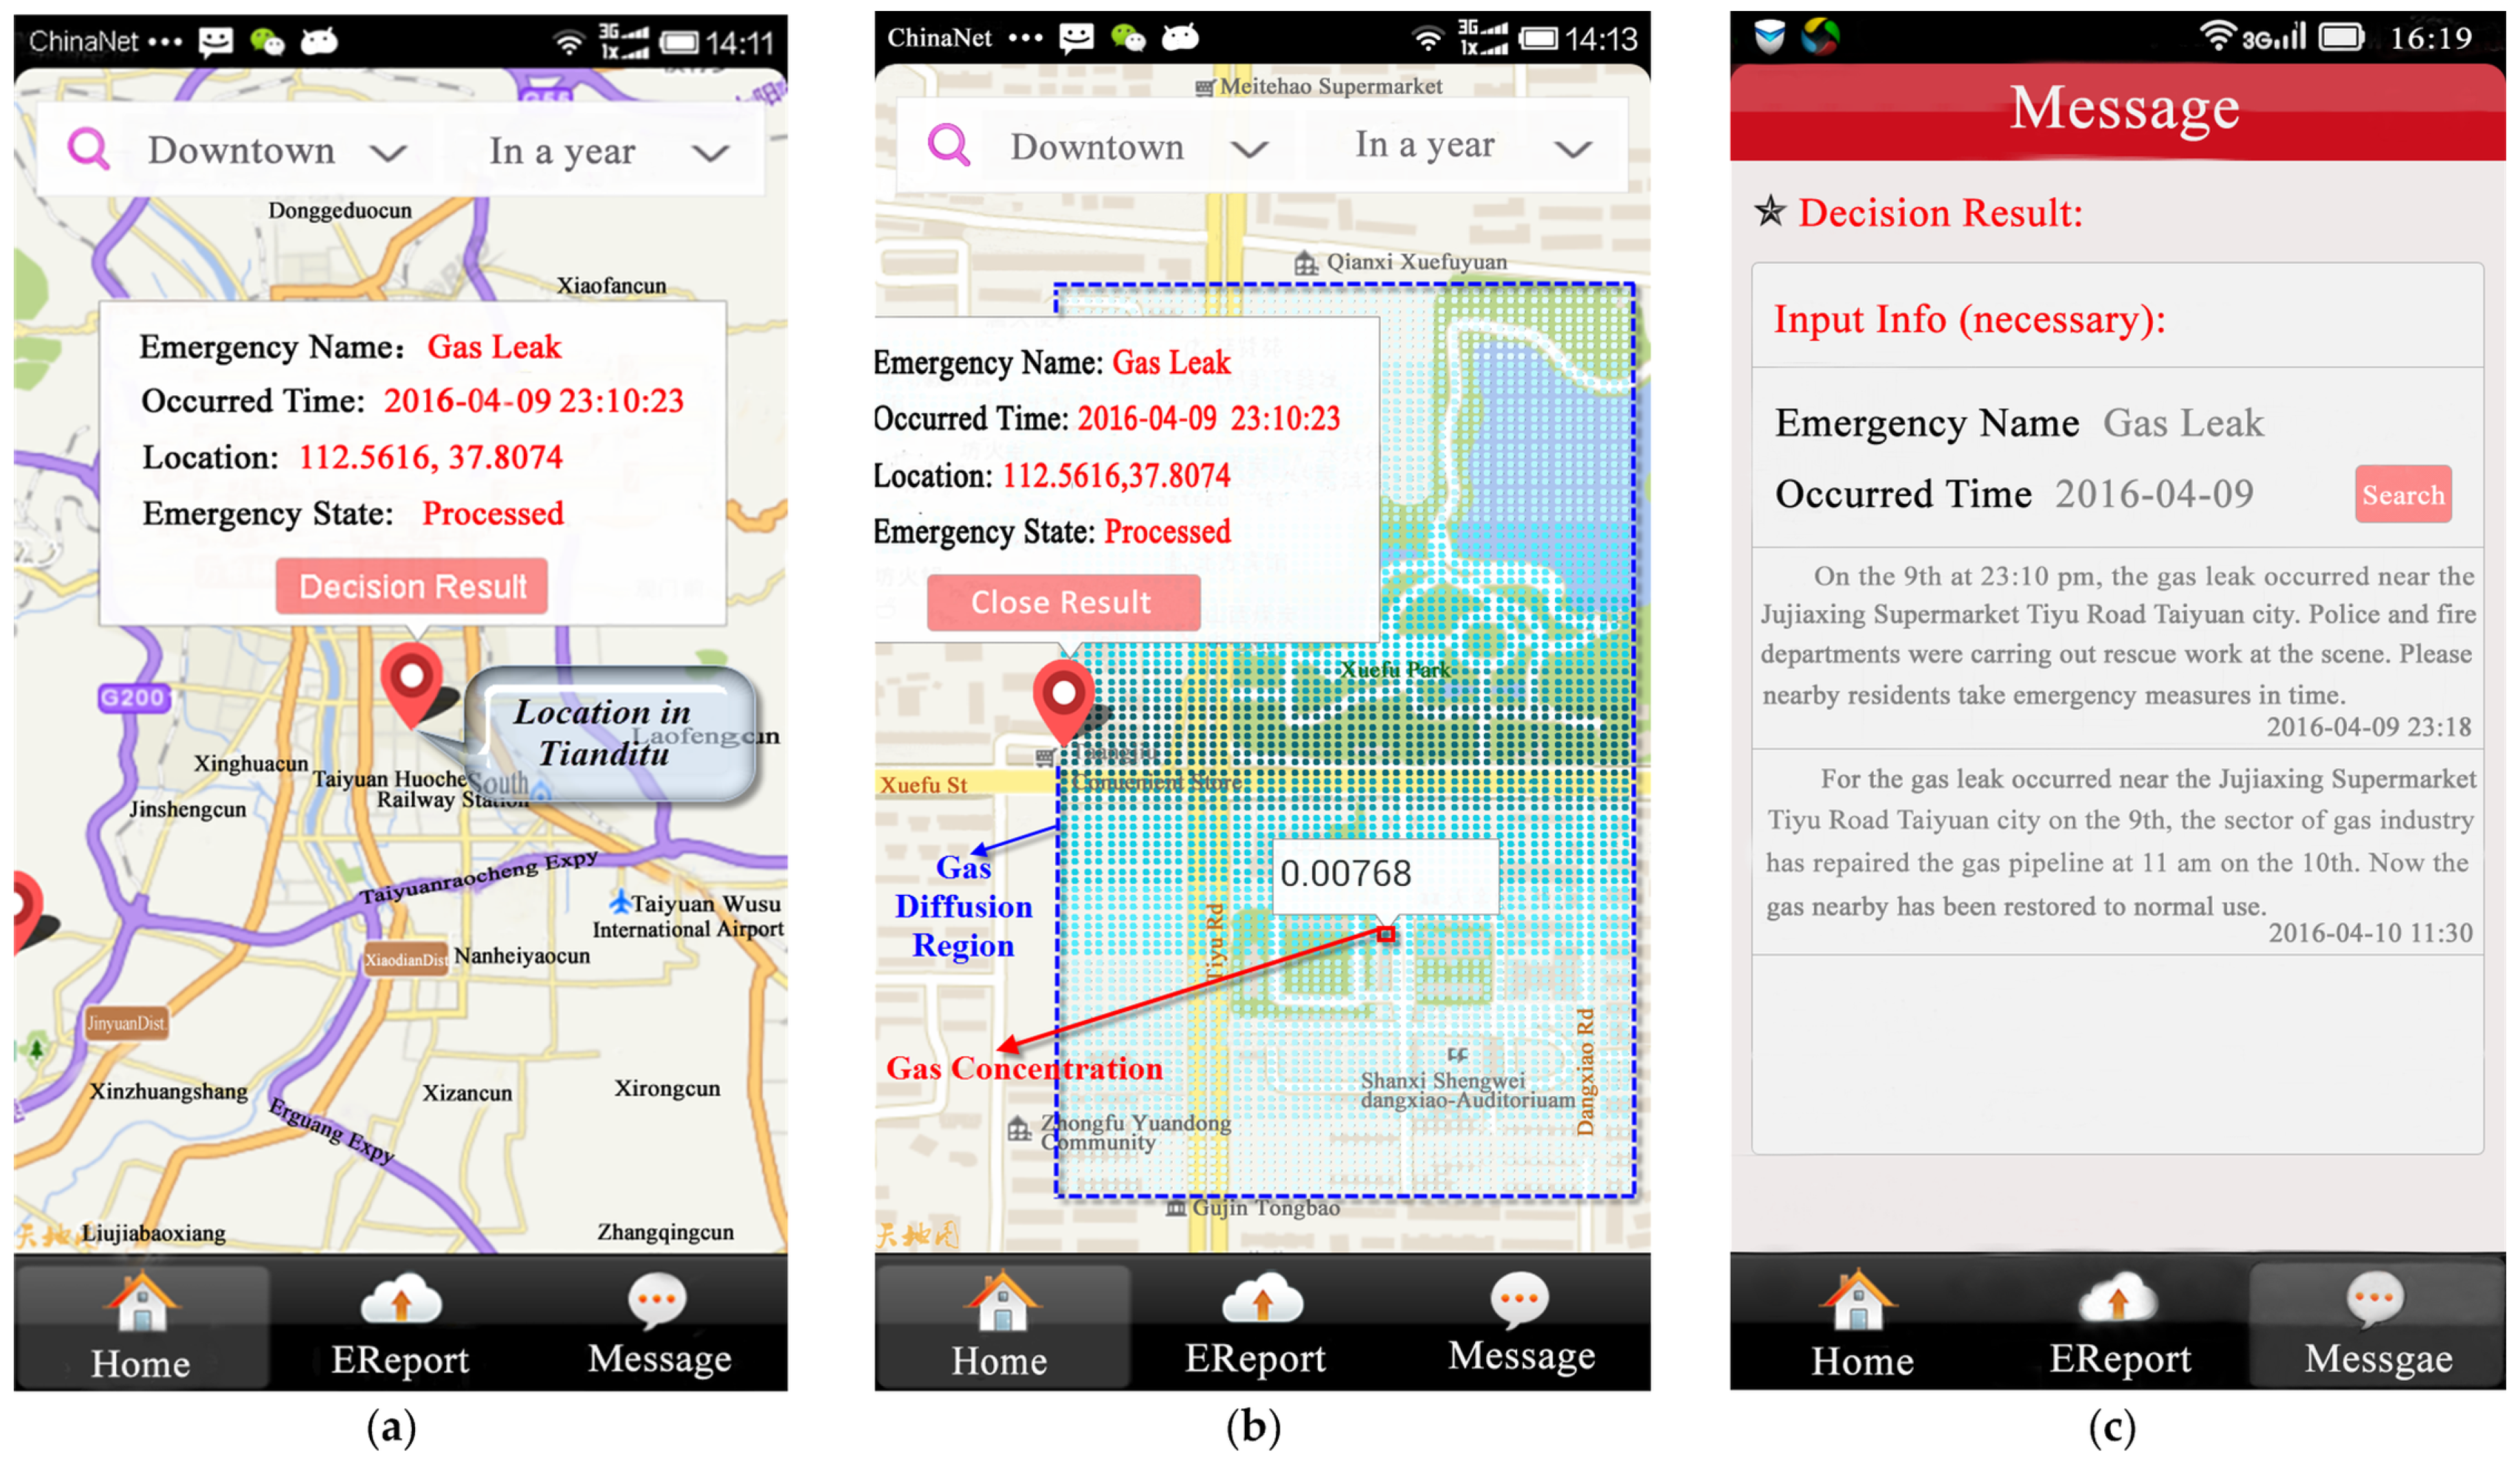
4.1. Case One: Gas Concentrations Monitoring
4.1.1. Gas Leak Emergency Response Scenario
4.1.2. Data Modeling and Register
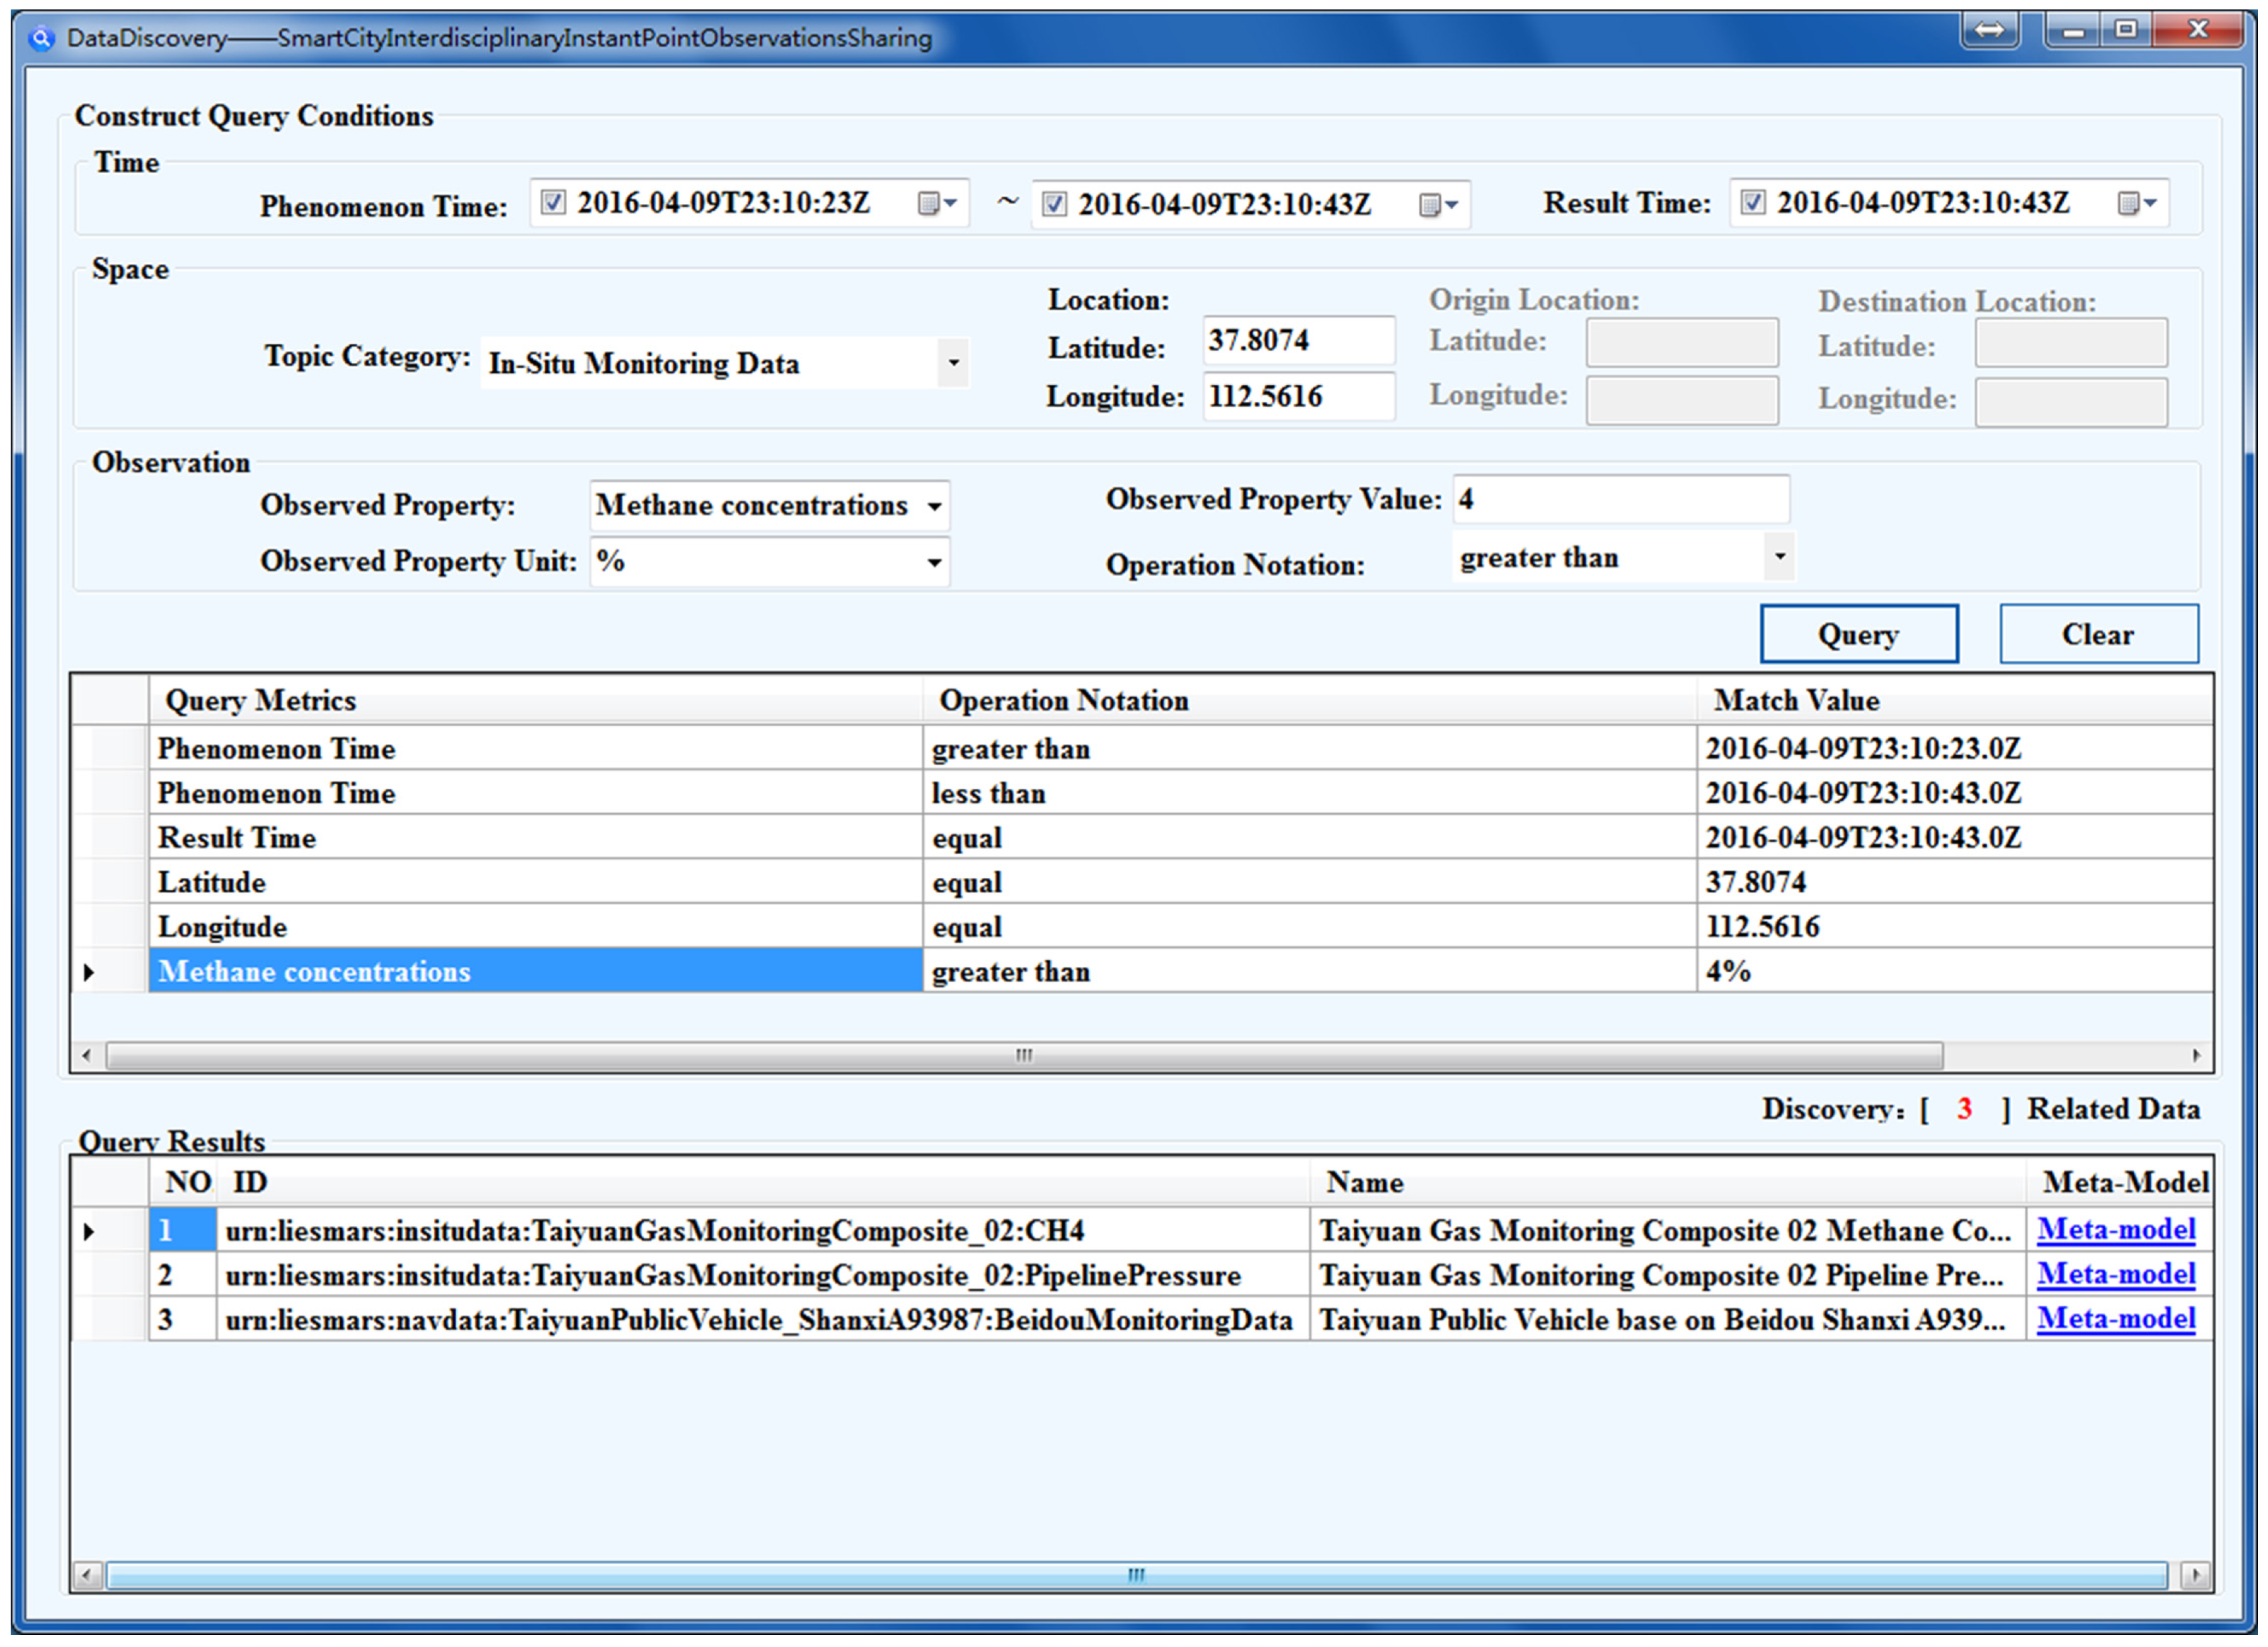
4.1.3. Data Application and Visualization
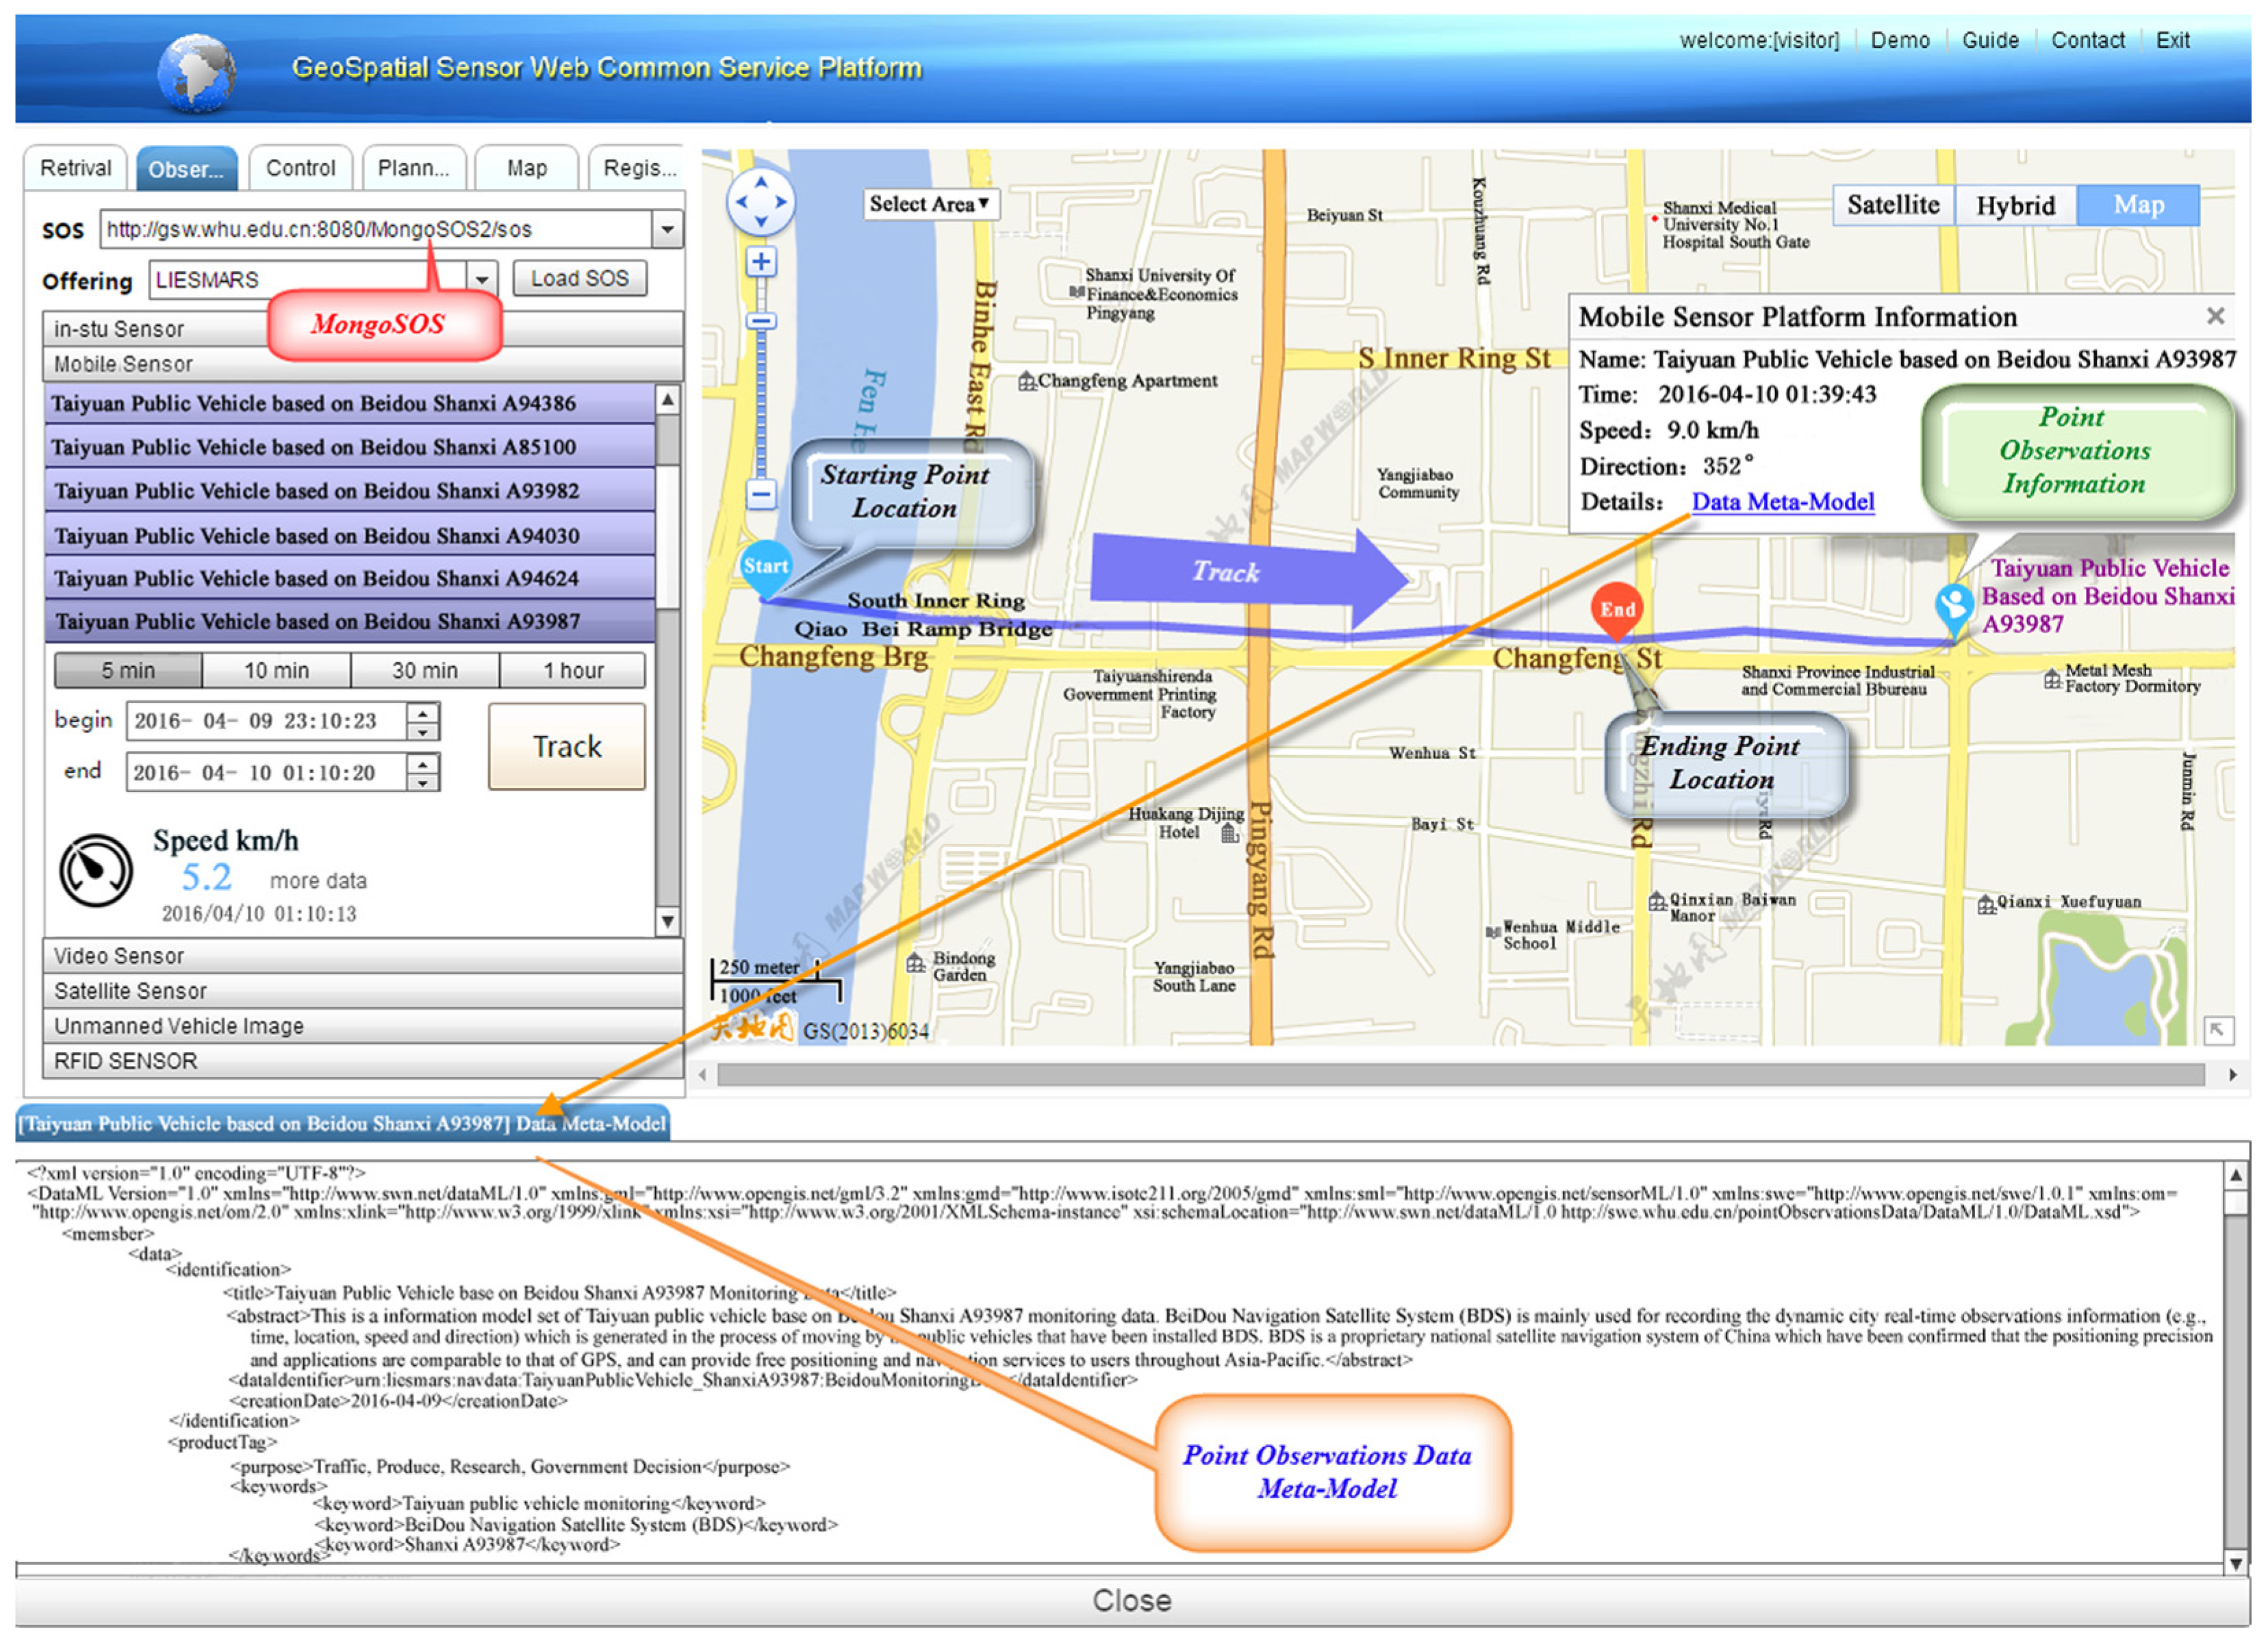
4.2. Case Two: Smart City Public Vehicle Monitoring Based on BDS
5. Discussion
5.1. Versatility and Extensibility for the Point Observations Data Modeling
5.2. Spatio-Temporal Enhanced Interdisciplinary Instant Point Observations Sharing
5.3. Other Application Scenarios
6. Conclusions
Supplementary Materials
Acknowledgments
Author Contributions
Conflicts of Interest
Abbreviations
| ISO | International Organization for Standardization |
| NGA | National Geospatial-Intelligence Agency |
| CSM | Community Sensor Model |
| SensorML | Sensor Model Language |
| O&M | Observations and Measurements Schema |
| OGC | Open Geospatial Consortium |
| DMM | Data Meta-Model |
| NoSQL | Not Only SQL |
| SOS | Sensor Observation Service |
| MongoSOS | Sensor Observation Service based on MongoDB |
| SWE | Sensor Web Enablement |
| XML | Extensible Markup Language |
| MOF | Meta Object Facility |
| CSW | Catalog Service for Web |
| 52nSOS | 52north Sensor Observation Service |
| JMeter | Apache JMeter™ |
| BDS | BeiDou Navigation Satellite System |
| GMD | Geographic MetaData extensible markup language |
References
- Batty, M.; Axhausen, K.W.; Giannotti, F.; Pozdnoukhov, A.; Bazzani, A.; Wachowicz, M.; Ouzounis, G.; Portugali, Y. Smart cities of the future. Eur. Phys. J. Spec. Top. 2012, 214, 481–518. [Google Scholar] [CrossRef]
- Lv, Z.; Li, X.; Zhang, B.; Wang, W.; Zhu, Y.; Hu, J.; Feng, S. Managing big city information based on WebVRGIS. IEEE Access 2016, 4, 407–415. [Google Scholar] [CrossRef]
- Fernández, C.; Manyà, F.; Mateu, C.; Sole-Mauri, F. Modeling energy consumption in automated vacuum waste collection systems. Environ. Model. Softw. 2014, 56, 63–73. [Google Scholar] [CrossRef]
- Fan, W.; Chen, Z.; Xiong, Z.; Chen, H. The internet of data: A new idea to extend the IOT in the digital world. Front. Comput. Sci. 2012, 6, 660–667. [Google Scholar] [CrossRef]
- Lorincz, K.; Malan, D.J.; Fulford-Jones, T.R.; Nawoj, A.; Clavel, A.; Shnayder, V.; Mainland, G.; Welsh, M.; Moulton, S. Sensor networks for emergency response: Challenges and opportunities. IEEE Pervas. Comput. 2004, 3, 16–23. [Google Scholar] [CrossRef]
- Shan, S.; Wang, L.; Li, L.; Chen, Y. An emergency response decision support system framework for application in e-government. Inf. Technol. Manage. 2012, 13, 411–427. [Google Scholar] [CrossRef]
- Stokols, D.; Hall, K.L.; Taylor, B.K.; Moser, R.P. The science of team science: Overview of the field and introduction to the supplement. Am. J. Prev. Med. 2008, 35, 77–89. [Google Scholar] [CrossRef] [PubMed]
- Lam, J.C.K.; Walker, R.M.; Hills, P. Interdisciplinarity in sustainability studies: A review. Sust. Dev. 2014, 22, 158–176. [Google Scholar] [CrossRef]
- Haapasaari, P.; Kulmala, S.; Kuikka, S. Growing into interdisciplinarity: How to converge biology, economics, and social science in fisheries research? Ecol. Soc. 2012, 17. [Google Scholar] [CrossRef]
- Huutoniemi, K.; Klein, J.T.; Bruun, H.; Hukkinen, J. Analyzing interdisciplinarity: Typology and indicators. Res. Policy 2010, 39, 79–88. [Google Scholar] [CrossRef]
- Klein, J.T. Research integration: A comparative knowledge base. In Case Studies in Interdisciplinary Research; Repko, A.F., Newell, W.H., Szostak, R., Eds.; Sage Publications: Thousand Oaks, CA, USA, 2012; pp. 283–289. [Google Scholar] [CrossRef]
- Kröger, M.; Schäfer, M. Scenario development as a tool for interdisciplinary integration processes in sustainable land use research. Futures 2016, 84, 64–68. [Google Scholar] [CrossRef]
- Horsburgh, J.S.; Tarboton, D.G.; Piasecki, M.; Maidment, D.R.; Zaslavsky, I.; Valentine, D.; Whitenack, T. An integrated system for publishing environmental observations data. Environ. Model. Softw. 2009, 24, 879–888. [Google Scholar] [CrossRef]
- Tuchyna, M. Establishment of spatial data infrastructure within the environmental sector in Slovak Republic. Environ. Model. Softw. 2006, 21, 1572–1578. [Google Scholar] [CrossRef]
- Roda, F.; Musulin, E. An ontology-based framework to support intelligent data analysis of sensor measurements. Expert. Syst. Appl. 2014, 41, 7914–7926. [Google Scholar] [CrossRef]
- Di, L.; Moe, K.L.; Yu, G. Metadata requirements analysis for the emerging sensor web this was orally presented at the European geosciences union general assembly 2008, Vienna, Austria, 13–18 April 2008. Int. J. Digit. Earth 2009, 2, 3–17. [Google Scholar] [CrossRef]
- Fan, H.; Li, J.; Chen, N.; Hu, C. Capability representation model for heterogeneous remote sensing sensors: Case study on soil moisture monitoring. Environ. Model. Softw. 2015, 70, 65–79. [Google Scholar] [CrossRef]
- Chen, N.; Hu, C. A sharable and interoperable meta-model for atmospheric satellite sensors and observations. IEEE J. Sel. Top. Appl. Earth Obs. Remote Sens. 2012, 5, 1519–1530. [Google Scholar] [CrossRef]
- Geographic Information—Metadata—Part 1: Fundamentals. ISO 19115–1:2014. Available online: https://www.iso.org/obp/ui/#iso:std:53798:en (accessed on 3 August 2014).
- Geographic Information—Imagery Sensor Models for Geopositioning. ISO/TS 19130:2010. Available online: https://www.iso.org/obp/ui/#iso:std:iso:ts:19130:ed-1:v1:en (accessed on 3 August 2014).
- Community Sensor Model (CSM) Technical Requirements Document (TRD). NGA.STND.0017_3.0. Available online: http://www.gwg.nga.mil/documents/csmwg/documents/CSM_TRD_Version_3.0__15_November_2010.pdf (accessed on 8 October 2014).
- Botts, M.; Robin, A. OpenGIS® Sensor Model Language (SensorML) Implementation Specification. OGC® 07-000. Available online: http://www.opengeospatial.org/standards/sensorml (accessed on 5 March 2015).
- Cox, S. Geographic Information: Observations and Measurements—OGC Abstract Specification Topic 20. OGC 10-004r3. Available online: http://www.opengeospatial.org/docs/as (accessed on 7 May 2015).
- Cox, S. Observations and Measurements—XML Implementation. OGC 10-025r1. Available online: http://www.opengis.net/doc/IS/OMXML/2.0 (accessed on 17 July 2015).
- Gasperi, J.; Houbie, F.; Woolf, A.; Smolders, S. Earth Observation Metadata Profile of Observations & Measurements. OGC 10-157r4. Available online: http://docs.opengeospatial.org/is/10-157r4/10-157r4.html (accessed on 12 June 2016).
- Kiryakov, A.; Popov, B.; Terziev, I.; Manov, D.; Ognyanoff, D. Semantic annotation, indexing, and retrieval. Web Semant. 2004, 2, 49–79. [Google Scholar] [CrossRef]
- Gunay, A.; Akcay, O.; Altan, M.O. Building a semantic based public transportation geoportal compliant with the INSPIRE transport network data theme. Earth Sci. Inf. 2014, 7, 25–37. [Google Scholar] [CrossRef]
- Wang, W.; Stewart, K. Spatiotemporal and semantic information extraction from Web news reports about natural hazards. Comput. Environ. Urban Syst. 2015, 50, 30–40. [Google Scholar] [CrossRef]
- Disz, T.; Akhter, S.; Cuevas, D.; Olson, R.; Overbeek, R.; Vonstein, V.; Stevens, R.; Edwards, R.A. Accessing the SEED genome databases via web services API: Tools for programmers. BMC bioinform. 2010, 11, 319. [Google Scholar] [CrossRef] [PubMed]
- Berners-Lee, T. Linked Data—Design Issues. Available online: https://www.w3.org/DesignIssues/LinkedData.html (accessed on 10 August 2015).
- Bizer, C.; Heath, T.; Berners-Lee, T. Linked data-the story so far. Int. J. Semant. Web Inf. Syst. 2009, 5, 1–22. [Google Scholar] [CrossRef]
- Bizer, C. The emerging web of linked data. IEEE Intell. Syst. 2009, 24, 87–92. [Google Scholar] [CrossRef]
- Xiong, Z.; Luo, W.; Chen, L.; Ni, L.M. Data vitalization: A new paradigm for large-scale dataset analysis. In Proceedings of the Parallel and Distributed Systems (ICPADS), 2010 IEEE 16th International Conference, Shanghai, China, 8–10 December 2010; pp. 251–258.
- Botts, M.; Percivall, G.; Reed, C.; Davidson, J. OGC® Sensor Web Enablement: Overview and High Level Architecture. In GeoSensor Networks, Proceedings of the Second International Conference, GSN 2006, Boston, MA, USA, 1–3 October 2006; Nittel, S., Labrinidis, A., Stefanidis, A., Eds.; Springer: Berlin/Heidelberg, Germany, 2008; pp. 175–190. [Google Scholar]
- Díaz, L.; Bröring, A.; Mcinerney, D.; Libertá, G.; Foerster, T. Publishing sensor observations into geospatial information infrastructures: A use case in fire danger assessment. Environ. Model. Softw. 2013, 48, 65–80. [Google Scholar] [CrossRef]
- Kragt, M.E.; Robson, B.J.; Macleod, C.J. Modellers’ roles in structuring integrative research projects. Environ. Model. Softw. 2013, 39, 322–330. [Google Scholar] [CrossRef]
- Visconti, M.; Cook, C.R. A meta-model framework for software process modeling. In Product Focused Software Process Improvement, Proceedings of the 4th International Conference, Profes 2002, Rovaniemi, Finland, 9–11 December 2002; Oivo, M., Komi-Sirviö, S., Eds.; Springer: Berlin/Heidelberg, Germany, 2002; pp. 532–545. [Google Scholar]
- Chen, N.; Wang, K.; Xiao, C.; Gong, J. A heterogeneous sensor web node meta-model for the management of a flood monitoring system. Environ. Model. Softw. 2014, 54, 222–237. [Google Scholar] [CrossRef]
- Atkinson, C.; Kuhne, T. Model-driven development: A metamodeling foundation. IEEE Softw. 2003, 20, 36–41. [Google Scholar] [CrossRef]
- Meta Object Facility (MOF) Specification. ISO/IEC 19502:2005(E). Available online: http://www.omg.org/spec/MOF/ISO/19502/PDF (accessed on 10 September 2015).
- Information technology—Object Management Group Meta Object Facility (MOF) Core. ISO/IEC 19508:2014(E). Available online: http://www.omg.org/spec/MOF/ISO/19508/PDF (accessed on 10 September 2015).
- Vitolo, C.; Elkhatib, Y.; Reusser, D.; Macleod, C.J.; Buytaert, W. Web technologies for environmental big data. Environ. Model. Softw. 2015, 63, 185–198. [Google Scholar] [CrossRef]
- Chen, Z.; Chen, N.; Di, L.; Gong, J. A flexible data and sensor planning service for virtual sensors based on web service. IEEE Sens. J. 2011, 11, 1429–1439. [Google Scholar] [CrossRef]
- Di, L.; Chen, A.; Yang, W.; Liu, Y.; Wei, Y.; Mehrotra, P.; Hu, C.; Williams, D. The development of a geospatial data Grid by integrating OGC web services with Globus-based Grid technology. Concurr. Comp. Pract. Exp. 2008, 20, 1617–1635. [Google Scholar] [CrossRef]
- Bröring, A.; Stasch, C.; Echterhoff, J. OpenGIS® Sensor Observation Service Interface Standard. OGC 12-006. Available online: http://www.opengis.net/doc/IS/SOS/2.0 (accessed on 12 December 2015).
- Chen, N.; Xiao, C.; Pu, F.; Wang, X.; Wang, C.; Wang, Z.; Gong, J. Cyber-physical geographical information service-enabled control of diverse in-situ sensors. Sensors 2015, 15, 2565–2592. [Google Scholar] [CrossRef] [PubMed]
- Chen, N.; Di, L.; Yu, G.; Min, M. A flexible geospatial sensor observation service for diverse sensor data based on Web service. ISPRS J. Photogramm. Remote Sens. 2009, 64, 234–242. [Google Scholar] [CrossRef]
- Chen, N.; Zhang, W.; Wang, X. Performance evaluation and method on sensor observation service. Bull. Surv. Mapp. 2015, 4, 61–64. [Google Scholar] [CrossRef]
- 52nSOS. Available online: http://52north.org/communities/sensorweb/sos/ (accessed on 13 February 2017).
- Apache JMeter. Available online: http://jmeter.apache.org/ (accessed on 13 February 2017).
- Chen, Y.W.; Yap, K.-H.; Lee, J.Y. Tianditu: China’s first official online mapping service. Media Cult. Soc. 2013, 35, 234–249. [Google Scholar] [CrossRef]
- Lines, I.G.; Deaves, D.M.; Atkins, W.S. Practical modelling of gas dispersion in low wind speed conditions, for application in risk assessment. J. Hazard. Mater. 1997, 54, 201–226. [Google Scholar] [CrossRef]
- Shi, C.; Zhao, Q.; Hu, Z.; Liu, J. Precise relative positioning using real tracking data from COMPASS GEO and IGSO satellites. GPS Solut. 2013, 17, 103–119. [Google Scholar] [CrossRef]
- Zhao, Q.; Guo, J.; Li, M.; Qu, L.; Hu, Z.; Shi, C.; Liu, J. Initial results of precise orbit and clock determination for compass navigation satellite system. J. Geod. 2013, 87, 475–486. [Google Scholar] [CrossRef]
- Altova XMLSpy. Available online: https://www.altova.com/simpledownload2c.html (accessed on 11 January 2017).


| Features | Standards | |||||
|---|---|---|---|---|---|---|
| ISO 19115 | ISO 19130 | NGA CSM | OGC SensorML | OGC O&M | OGC Earth Observation Metadata profile of O&M | |
| Keywords | √ | × | × | √ | × | × |
| Identification | √ | × | ○ | √ | × | × |
| Constraint | √ | × | × | √ | ○ | ○ |
| Quality | √ | × | × | × | √ | √ |
| Sensor Info | × | ○ | ○ | √ | × | ○ |
| Platform Info | × | ○ | ○ | √ | × | ○ |
| Product Info | × | × | × | × | × | ○ |
| Spatial Reference | √ | × | × | √ | √ | √ |
| Temporal Reference | √ | × | × | √ | √ | √ |
| Acquisition | × | × | ○ | × | × | ○ |
| Accessibility | ○ | × | × | ○ | ○ | ○ |
| Geolocation | × | √ | √ | × | ○ | ○ |
| Encoding Schema | XML | N/A | N/A | XML | XML | XML |
| Application | Geographical information and services | Geolocation of the remote sensing data | Implementation of geolocating of remote sensing data | Sensor modeling language | Sensor data interoperability | Earth Observation data interoperability |
| Software | Type | Version |
|---|---|---|
| CentOS | Linux | 6.2 (64bit) |
| JDK (Hotspot) | Java | 1.7 |
| Apache JMeter | Test Tool | 2.13 |
| MongoDB | Database | 3.0 (WiredTiger) |
| PostgreSQL | Database | 9.2 |
| PostGIS | PostgreSQL Space Function Extension | 2.1 |
| Tomcat | Java Web Container | 7.0.61 |
| Type | Server A | Server B |
|---|---|---|
| Number | 1 | 5 (B1-B5) |
| CPU | Intel Xeon E5-2665 (8-Core 2.40 GHz processor) | Intel Xeon E5-2620 (6-Core 2.00 GHz processor) |
| RAM | 32 GB (1333 MHz) | 32 GB (1333 MHz) |
| Hard Disk | 244 GB (SAS, 15,000 rpm) | 405 GB (SAS, 15,000 rpm) |
| Network | 1 Gbps | 1 Gbps |
| SOS operations | MongoSOS | 52nSOS | MongoSOS/52nSOS |
|---|---|---|---|
| GetObservation (with spatial conditions) | 458 ms | 20,589 ms | 2.3% |
| InsertObservation (no data) | 514 ms | 667 ms | 77.1% |
| InsertObservation (large amount of data) | 4,320 times/s (300 million times) | 146 times/s (10 million times) | 29.5 times |
| Data Meta-Model (DMM) Schema | Other Description Models | ||
|---|---|---|---|
| Metadata Type | Metadata Elements | Description Model | Metadata Element |
| ProductTagType | ResponsibleParty | SensorMLl.0.0 | Contact |
| DataContentType | observationResultContent | SWECommon1.0.1 | DataRecord |
| TemporalDimensionType | temporalReferenceFrame | SensorMLl.0.0 | TemporalReferenceFrame |
| phenomenonTime | O&M2.0.0 | phenomenonTime | |
| resultTime | O&M2.0.0 | resultTime | |
| SpatialDimensionType | spatialReferenceFrame | SensorMLl.0.0 | SpatialReferenceFrame |
| DistributorContactType | contact | SensorMLl.0.0 | Contact |
| TransferType | linkage | GMD1.0.0 | CI_OnlineResource |
| DataQualityType | dataQuality | GMD1.0.0 | DQ_DataQuality |
| ObservationReferenceType | relatedObservation | O&M2.0.0 | relatedObservation |
© 2017 by the authors. Licensee MDPI, Basel, Switzerland. This article is an open access article distributed under the terms and conditions of the Creative Commons Attribution (CC BY) license ( http://creativecommons.org/licenses/by/4.0/).
Share and Cite
Chen, N.; Liu, Y.; Li, J.; Chen, Z. A Spatio-Temporal Enhanced Metadata Model for Interdisciplinary Instant Point Observations in Smart Cities. ISPRS Int. J. Geo-Inf. 2017, 6, 50. https://doi.org/10.3390/ijgi6020050
Chen N, Liu Y, Li J, Chen Z. A Spatio-Temporal Enhanced Metadata Model for Interdisciplinary Instant Point Observations in Smart Cities. ISPRS International Journal of Geo-Information. 2017; 6(2):50. https://doi.org/10.3390/ijgi6020050
Chicago/Turabian StyleChen, Nengcheng, Yingbing Liu, Jia Li, and Zeqiang Chen. 2017. "A Spatio-Temporal Enhanced Metadata Model for Interdisciplinary Instant Point Observations in Smart Cities" ISPRS International Journal of Geo-Information 6, no. 2: 50. https://doi.org/10.3390/ijgi6020050
APA StyleChen, N., Liu, Y., Li, J., & Chen, Z. (2017). A Spatio-Temporal Enhanced Metadata Model for Interdisciplinary Instant Point Observations in Smart Cities. ISPRS International Journal of Geo-Information, 6(2), 50. https://doi.org/10.3390/ijgi6020050