1. Introduction
Motorcycle crashes represent one of the major types of road accidents. Statistics reveal that motorcyclists are among the drivers most vulnerable to road accidents [
1]. The U.S. Department of Transportation’s National Highway Traffic Safety Administration (NHTSA) reported that in 2013, motorcyclists were about 26 times more likely than passenger car occupants to be killed in a crash per mile driven, and five times more likely to be injured [
2]. In Australia, a national study conducted by the Australian Transport Safety Bureau (ATSB) found that motorcyclists are 30 times more likely to die on Australian roads than car drivers [
3]. The UK Department of Transport reported that motorcyclists are roughly 38 times more likely to be killed in an accident than car drivers [
4].
Much effort has been made to investigate those factors that cause motorcycle accidents. According to the Hurt study [
5], the causes of motorcycle crashes include overbraking, speeding, lack of attention, and alcohol use. The European Motorcycle Accident In-Depth Study [
6] categorized the primary factors contributing to motorcycle accidents to be human (e.g., speeding), vehicular (e.g., brake failure), and environmental (e.g., road conditions). Among them, human-related factors are considered to be the primary causes in approximately 87.5% of all the cases. A study conducted by the UK Department of Transport [
7] found that the predominate cause of motorcycle accidents was drivers’ inattention. Overall, studies have reported that errors resulting from drivers’ unsafe behavior are one of the major causes of motorcycle accident. Understanding and improving driver behavior is therefore essential for increasing motorcycle safety.
Recent advances in tracking and sensing technologies have facilitated the monitoring of driver behavior by aiming to identify risky driving maneuvers. Experiential evidence reported in the literature has shown that measuring driver performance and providing this information as immediate feedback to the drivers affected their behavior, and so reduced accidents. Lehmann [
8] showed that the installation of a driver monitoring system in cars reduced crash rates by up to 30%. Similar reduction rates of about 20% were reported in an experiment conducted by Wouters and Bos [
9]. While these studies targeted car safety, only limited research has been conducted to date on motorcycle safety.
Postal motorcycles are particularly vulnerable to road accidents because they are exposed to traffic throughout an entire work day. Korea Post, the national postal service of Korea, reported that postal motorcycles constitute the largest portion of their delivery fleet and are also involved in the largest portion of total accidents by their delivery vehicles [
10]. According to a survey that was conducted by the Korea Research Institute for Alternative Workers’ Movements in 2013 [
11], a majority of postmen (51%) have experienced accidents associated with delivery vehicles including postal motorcycles. Specifically, 86.3% of postmen have been injured seriously enough to require medical care; 18.1% of them had experienced at least three accidents in their delivery careers.
Although some commercial postal organizations already use tracking technologies (e.g., GPS), Korea Post currently has no systematic way to collect their postmen’s driving behavior. In this paper, we aim to develop methods for quantifying and analyzing individual postal motorcyclists’ safety performance. To collect the driving data, we developed a system that was capable of monitoring a postal motorcyclist’s driving behavior [
12]. The system is installed on personal digital assistants (PDAs) already being carried by postmen throughout their entire shifts. The use of this existing device does not require the purchasing or developing any additional equipment and reduces cost and time for the system to be used in field work.
The system described in this paper is specifically designed to compute a safety index (SI). The SI developed in our study quantitatively measures the relative safety performance of a postman driving a motorcycle. In fact, obtaining absolute numerical measurements of driving performance is difficult and so relative numerical measurements have been used to evaluate driving performance. Studies have shown that the SI can be effective in identifying the relative safety level of drivers [
13,
14]. The SI is formulated based on driving behavior as well as those environmental factors that are likely to affect driving behavior. Castignani et al. [
13] consider real-time contextual information, such as route topology or weather conditions; Carter et al. [
14] consider the variables indicating a higher probability of risk such as traffic volume and roadway geometry in measuring a bicyclist’s SI. In addition, the SI is commonly used to evaluate road safety [
15,
16,
17]. In determining SI for two-lane rural highways, for example, Cafiso et al. [
16] considered the accident frequency, accident severity, and exposure of drivers to road hazards.
In this paper, to compute the SI in order to measure the relative safety level of postmen operating motorcycles, we consider an individual postal motorcyclist’s driving behavior along with his/her work environment. Each postman’s work environment varies from post office to post office and postman to postman depending on delivery conditions. For example, postmen who use roads with higher accident frequency have a higher accident risk as compared to others. Thus, hazardous factors that may contribute to accidents can result not only from the postal motorcyclist’s usual driving habits but also the demands of the work environment, such as accident frequency and working hours. In developing the SI, we considered three risk factors: accident frequency (static factors); driving behavior (dynamic factors); and, postmen’s working hours (workload factors).
To examine the feasibility of our system and the developed SI, we conducted two phases of field tests during a two-year period of postmen, who were responsible for deliveries via motorcycle. Each postman carried the monitoring system installed on a PDA throughout an entire work day. The system tracked each postman’s motorcycle, measured driving behaviors, and computed the SI. Using the collected field data, we show the possible applications of our developed SI, such as identifying whether there are any differences in the safety performance among postal motorcyclists working in different regional post offices or within the same regional post office.
The remainder of this paper is structured as follows.
Section 2 shows the process of gathering customer requirements in order to develop the monitoring system.
Section 3 describes the way we developed the SI.
Section 4 reports how we conducted the field tests.
Section 5 shows how we validated the SI and
Section 6 discusses implications from the collected postal motorcyclists’ SI.
Section 7 concludes with directions for future work.
3. Development of Safety Index for Postal Motorcyclists’ Driving
Studies have shown that measuring the SI can facilitate better understanding of factors improving personnel safety [
13,
14]. The main functionality of the postal motorcyclist monitoring system is quantitative assessing the postal motorcyclists’ safety performance by providing SI. The value of the SI can be self-monitored by the postal motorcyclists in real time. Authorized personnel (e.g., safety officers at Korea Post) can also access postal motorcyclists’ overall driving history records and associated SIs. This provides the means to recognize individual postman’s safety performance and to develop safer practices that are tailored for their unique delivery conditions.
3.1. Safety Index
There are a large number of factors contributing to factors that cause motorcycle accidents such as roadway conditions (e.g., roadway surface), weather conditions (e.g., rain), and human-related factors (e.g., age). These factors are not fully independent of each other making it difficult to identify a factor as being more significant than the others.
In developing the SI, Korea Post requested using devices that could be acquired at a low cost over the short run. To meet this requirement, we decided to exploit postal PDAs that were already being carried by delivery postmen throughout their entire working hours. Using such equipment eliminated the need to develop and purchase new equipment. To collect data to be used to develop the SI, we installed a GPS receiver that is not contained in the PDAs currently used by Korea Post.
From the acquired GPS data, we extracted the following factors: postal motorcycle’s speed and the presence of risky driving behavior (i.e., sudden acceleration or sudden deceleration). This set of factors, which is determined in real time by each individual postman’s driving style, we termed
dynamic factor. In developing the SI, we also considered accident history data from each regional post office, month to month, day to day, and time to time. This set of factors, determined by the combined accident frequency of all the workers in a post office, we termed
the static factor. This factor represents the conditions of each motorcycle drive itself and is thereby used as a weight for the dynamic factor. By combining the dynamic and static factors, the general formula to calculate the SI is as follows:
The static factor is updated annually to reflect the previous year’s accident history. Therefore, the static factor could be zero in case no accidents occurred in the previous year though such a possibility is low. To prevent having a factor be zero, the static factor is increased by a certain value such as 1. The updated formula is as follows:
One of the distinct characteristics of postal motorcyclists’ delivery work is that their working hours are much longer than most other workers in Korea. It is reported that a postmen’s average working hours per day may be as long as 15.3 during special seasons, such as Thanksgiving Day, New Year’s Day, or elections [
11]. Several studies have shown that the duration of drivers’ shifts directly increases their chance of accidents. To reflect this, we created
workload factor, indicating a postmen’s working hours and included in the SI. Depending on the working hours, there can be a large variation in the value of the workload factor (explained in
Section 3.4); this factor is not multiplied, but is added to the formula. The final updated formula is as follows:
Table 2 summarizes a set of factors we used to construct the SI in this study. The following sub-sections describe our development of the SI which represents the relative safety level of a postal motorcyclist.
3.2. Static Factor
The static factor for calculating the SI is determined based on the number of annual postal vehicle accidents, which is updated yearly by Korea Post. Despite Korea Post’s efforts, postmen experienced 315 accidents in 2014 [
10] because they are especially vulnerable to a variety of accidents due to the hazardous nature of their work. Among the 315 accidents, the total number of motorcycle related accidents accounted for 268 (85.1%). The accident statistics vary from post office to post office (affiliation factor), month to month (monthly factor), day to day (daily factor), and time to time (hourly factor). Using these four elements, the formulation for the static factor of SI is shown in (4):
Affiliation factor: Since each post office has unique conditions for delivery (e.g., mail/package volume, traffic volume, road conditions, weather), the accident risk for its motorcyclists varies. In Korea, approximately 3542 post offices are managed by nine regional post offices [
10]. The affiliation factor representing the relative accident risk for each of these nine regional post offices is shown in
Table 3.
Monthly factor: This factor represents the relative accident risk for each month, as shown in
Table 4. It is commonly believed that postal delivery accidents occur most frequently during the winter season due to snowy or icy road conditions. According to the statistics in
Table 4, however, the accident rate is similar in warm and cold months.
Daily factor: This factor represents the relative accident risk for each weekday, as shown in
Table 5. It has been reported that accidents occur most frequently on Mondays (23% of the weekly accidents). This is because of the relatively high workload due to the large volume of delivery items accumulated over the weekend.
Hourly factor: This factor represents the relative accident risk per specific time slot, as shown in
Table 6. It has been reported that accidents occur most frequently from 14:00 to 16:00 (24% of a day’s accidents). This may be because this period is the most active time for deliveries.
3.3. Dynamic Factor
The dynamic factor represents the relative accident risk for each postal motorcyclist based on his/her individual driving behavior. This factor incorporates postal motorcycle’s speed, road layout (straight or curvy) where the motorcycle is currently being operated, and the presence of risky driving events, such as sudden acceleration (or deceleration). The dynamic factor is formulated as in (5).
where
α is the weight of the speed factor and
β is the weight of the sudden acceleration (or deceleration) factor. While the static factor of the SI is a fixed value determined by the accident frequency of the post office of each postal worker, the dynamic factor is a value that is determined in real time by each individual postman’s driving style. Therefore, different postmen affiliated with the same post office share the same value for the static factor but have a different value for the dynamic factor depending on their individual driving habits.
Speed factor: Speed has been identified as a factor highly influencing road accidents. Increased speed leads to higher risk of accidents with more severe injuries [
18,
19]. The speed factor represents the relative accident risk according to the motorcyclist’s current speed. This factor is either 0 or 1, depending on whether the motorcyclist obeys the speed limit or not. A weight
α is determined depending on the road layout where the motorcycle is currently located. According to accident statistics that are based on road layouts reported by the Korean National Police Agency [
20], fatality rates on a straight road and a curve are 0.02 and 0.07, respectively. A weight
α is created by transforming 0.02 to 1.0;
α is 1.0 for a straight road and 3.5 for a curve.
Sudden acceleration (or deceleration) factor: Studies have shown that risky driving promotes accidents [
21,
22]. The sudden acceleration (or deceleration) factor is the relative accident risk representing this type of risky motorcyclists’ driving. This factor is either 0 or 1, depending on whether the motorcyclist is considered to be a safe or risky driver. The value of a weight
β is determined depending on which specific risky behavior the motorcyclist is engaged in—sudden acceleration or sudden deceleration. Torbic et al. [
23] examined the accidents that occurred during three years (2002 to 2004) in acceleration/deceleration lanes (also known as speed-change lanes or auxiliary lanes). Acceleration (or deceleration) lanes provide drivers with the chance to speed up or slow down. Thus, accident statistics for these two lanes reflect the relative accident risk of sudden acceleration and deceleration. The accident rate is reported as 0.18 for an acceleration lane (94 accidents in 525 acceleration lanes) and 0.46 for a deceleration lane (252 accidents in 550 deceleration lanes). A weight
β is created by transforming 0.18 to 1.0;
β is 1.0 for a sudden acceleration and 2.56 for a sudden deceleration.
3.4. Workload Factor
Studies have shown that the length of drivers’ work shifts directly increases their number of traffic accidents [
24,
25,
26,
27]. In a study of bus drivers, Meijman [
24] reported that as work time increased, the efficiency of mental processing and attention decreased. In another study of various occupations in Germany, Hanecke et al. [
25] found that accident risk exponentially increases beyond the 8th or 9th hour of work.
Postmen’s working hours (i.e., hours for sorting, taking, loading, and delivering mail) vary according to fluctuations in the volume of delivery items: special seasons (Thanksgiving Day, New Year’s Day, elections), peak seasons (from the 14th to the 22nd of each month), and off seasons (normal days except peak or special seasons). According to a survey conducted by the Korea Research Institute for Alternative Workers’ Movements in 2013 [
11], postmen’s average working hours per day are 15.3, 13.1, and 10.8 h during special, peak, and off seasons, respectively. Since postmen’s working hours across all of the seasons are much higher than an average worker’s day (e.g., 8-h), it is important to consider their longer working hours as one of the factors that is potentially contributing to traffic accidents.
The workload factor in our study represents the relative accident risk of postal motorcyclists based on their working hours. Several studies have calculated the relative risk for accidents for the number of hours on duty [
25,
26,
27,
28]. Although these calculated risk values were somewhat inconsistent, it is clear that accident risk increased over time.
For example, Goode [
28] found that the relative risks for work periods of 1–3, 4–6, 7–9, 10–12, and 13 or more hours were approximately 0.79, 0.84, 1.11, 1.65, and 5.62. Based on the Goode study, the workload factors in our study are calculated as follows. By establishing the relative risk for the initial 4 h at 1.0, a comparable relative risk for each period is calculated, as described in
Table 7.
3.5. Safety Ratings
The SI values of our study range from 1.0 to 17.52 with the lower SI values indicating safer ratings. To provide evaluative measures of the calculated SI values, we define three safety levels as shown in
Table 8.
Each level is categorized as follows: “Good” if a postal motorcyclist who has normal working hours (e.g., 7 h) does not conduct any risky driving actions during delivery; “Fair” if the driver takes actions that are considered to be moderately risky but fair such as speeding on a straight road or suddenly accelerating; “Poor” if the driver takes actions that are considered to be highly risky, such as speeding on a curvy road or suddenly decelerating. The criteria of these safety ratings, however, can be tailored depending on authorities’ discretion based on their own circumstances. For this, our system provides a user interface that allows one to update the criteria.
4. Field Tests
We conducted field tests to examine the feasibility of our system and the developed SI, which measures the relative safety performance of a postman operating a motorcycle.
4.1. Settings
The tests were conducted in two phases during a two-year period, as shown in
Table 9. In the first phase, two delivery postmen were selected who worked in two different demographic areas: one, urban (Songpa, density: 49,760/sq mi); the other, rural (Nonsan, density: 642/sq mi).
In the second phase, six delivery postmen were selected who worked in two different demographic areas: one, urban (Cheongju, density: 3680/sq mi); the other, rural (Gangseo, density: 1220/sq mi).
4.2. Procedure
All of the participating postmen were trained to ensure complete data collection. To properly collect data during all of their work hours, each postman was instructed to carry the PDA throughout an entire work day. Every morning on test days, we issued a fully charged PDA to the postmen right before they left for their delivery areas and cautioned them not to turn it off even during lunch. After the participating postmen had finished their deliveries and returned to the office, the GPS data stored in the PDA’s internal memory was downloaded. The collected GPS data was carefully investigated to detect whether there had been any interruptions in data transmissions along the work route to identify potential problem sources such as GPS signals lost. Finally, for the next day’s deliveries, the PDAs were placed on their charging cradles. In this paper, we define a work route to be the following itinerary: between the post office and the first (or the last) delivery point (termed commute route) and between the first and the last delivery points within the delivery area (termed delivery route).
4.3. Data Processing
The GPS receiver in postal PDAs obtains GPS data every second, creating a one second gap between the collected data points. Once the data is received, the system extracts the latitude, longitude, speed, date, and angle, and computes the SI for each data point. As described in the previous section, the static factor and workload factor of the SI are determined according to accident statistics and postmen’s working hours, respectively. At each data point, a dynamic factor is computed based on the postman’s speed, the road layout where the motorcycle is currently operated, and whether the postal motorcyclist conducts any sudden accelerations (or decelerations). Sudden acceleration and sudden deceleration are defined by using speeds at each data point. If the speed is constantly reduced until falling below a certain threshold, that data point is determined as a sudden deceleration point; on the other hand, if the speed is continuously increased until exceeding the threshold, that the data point is determined as a sudden acceleration point. The road layout is determined using the difference between the current angle of the motorcycle and the angle during the previous second. Assuming a linear change in the speed between the sampled data points, the computed SI for each data point is used to create statistics within user specified dates (e.g., daily, weekly, and monthly basis) by averaging the SI values during the period.
6. Analysis of Postal Motorcyclists’ Safety Performance Using SI
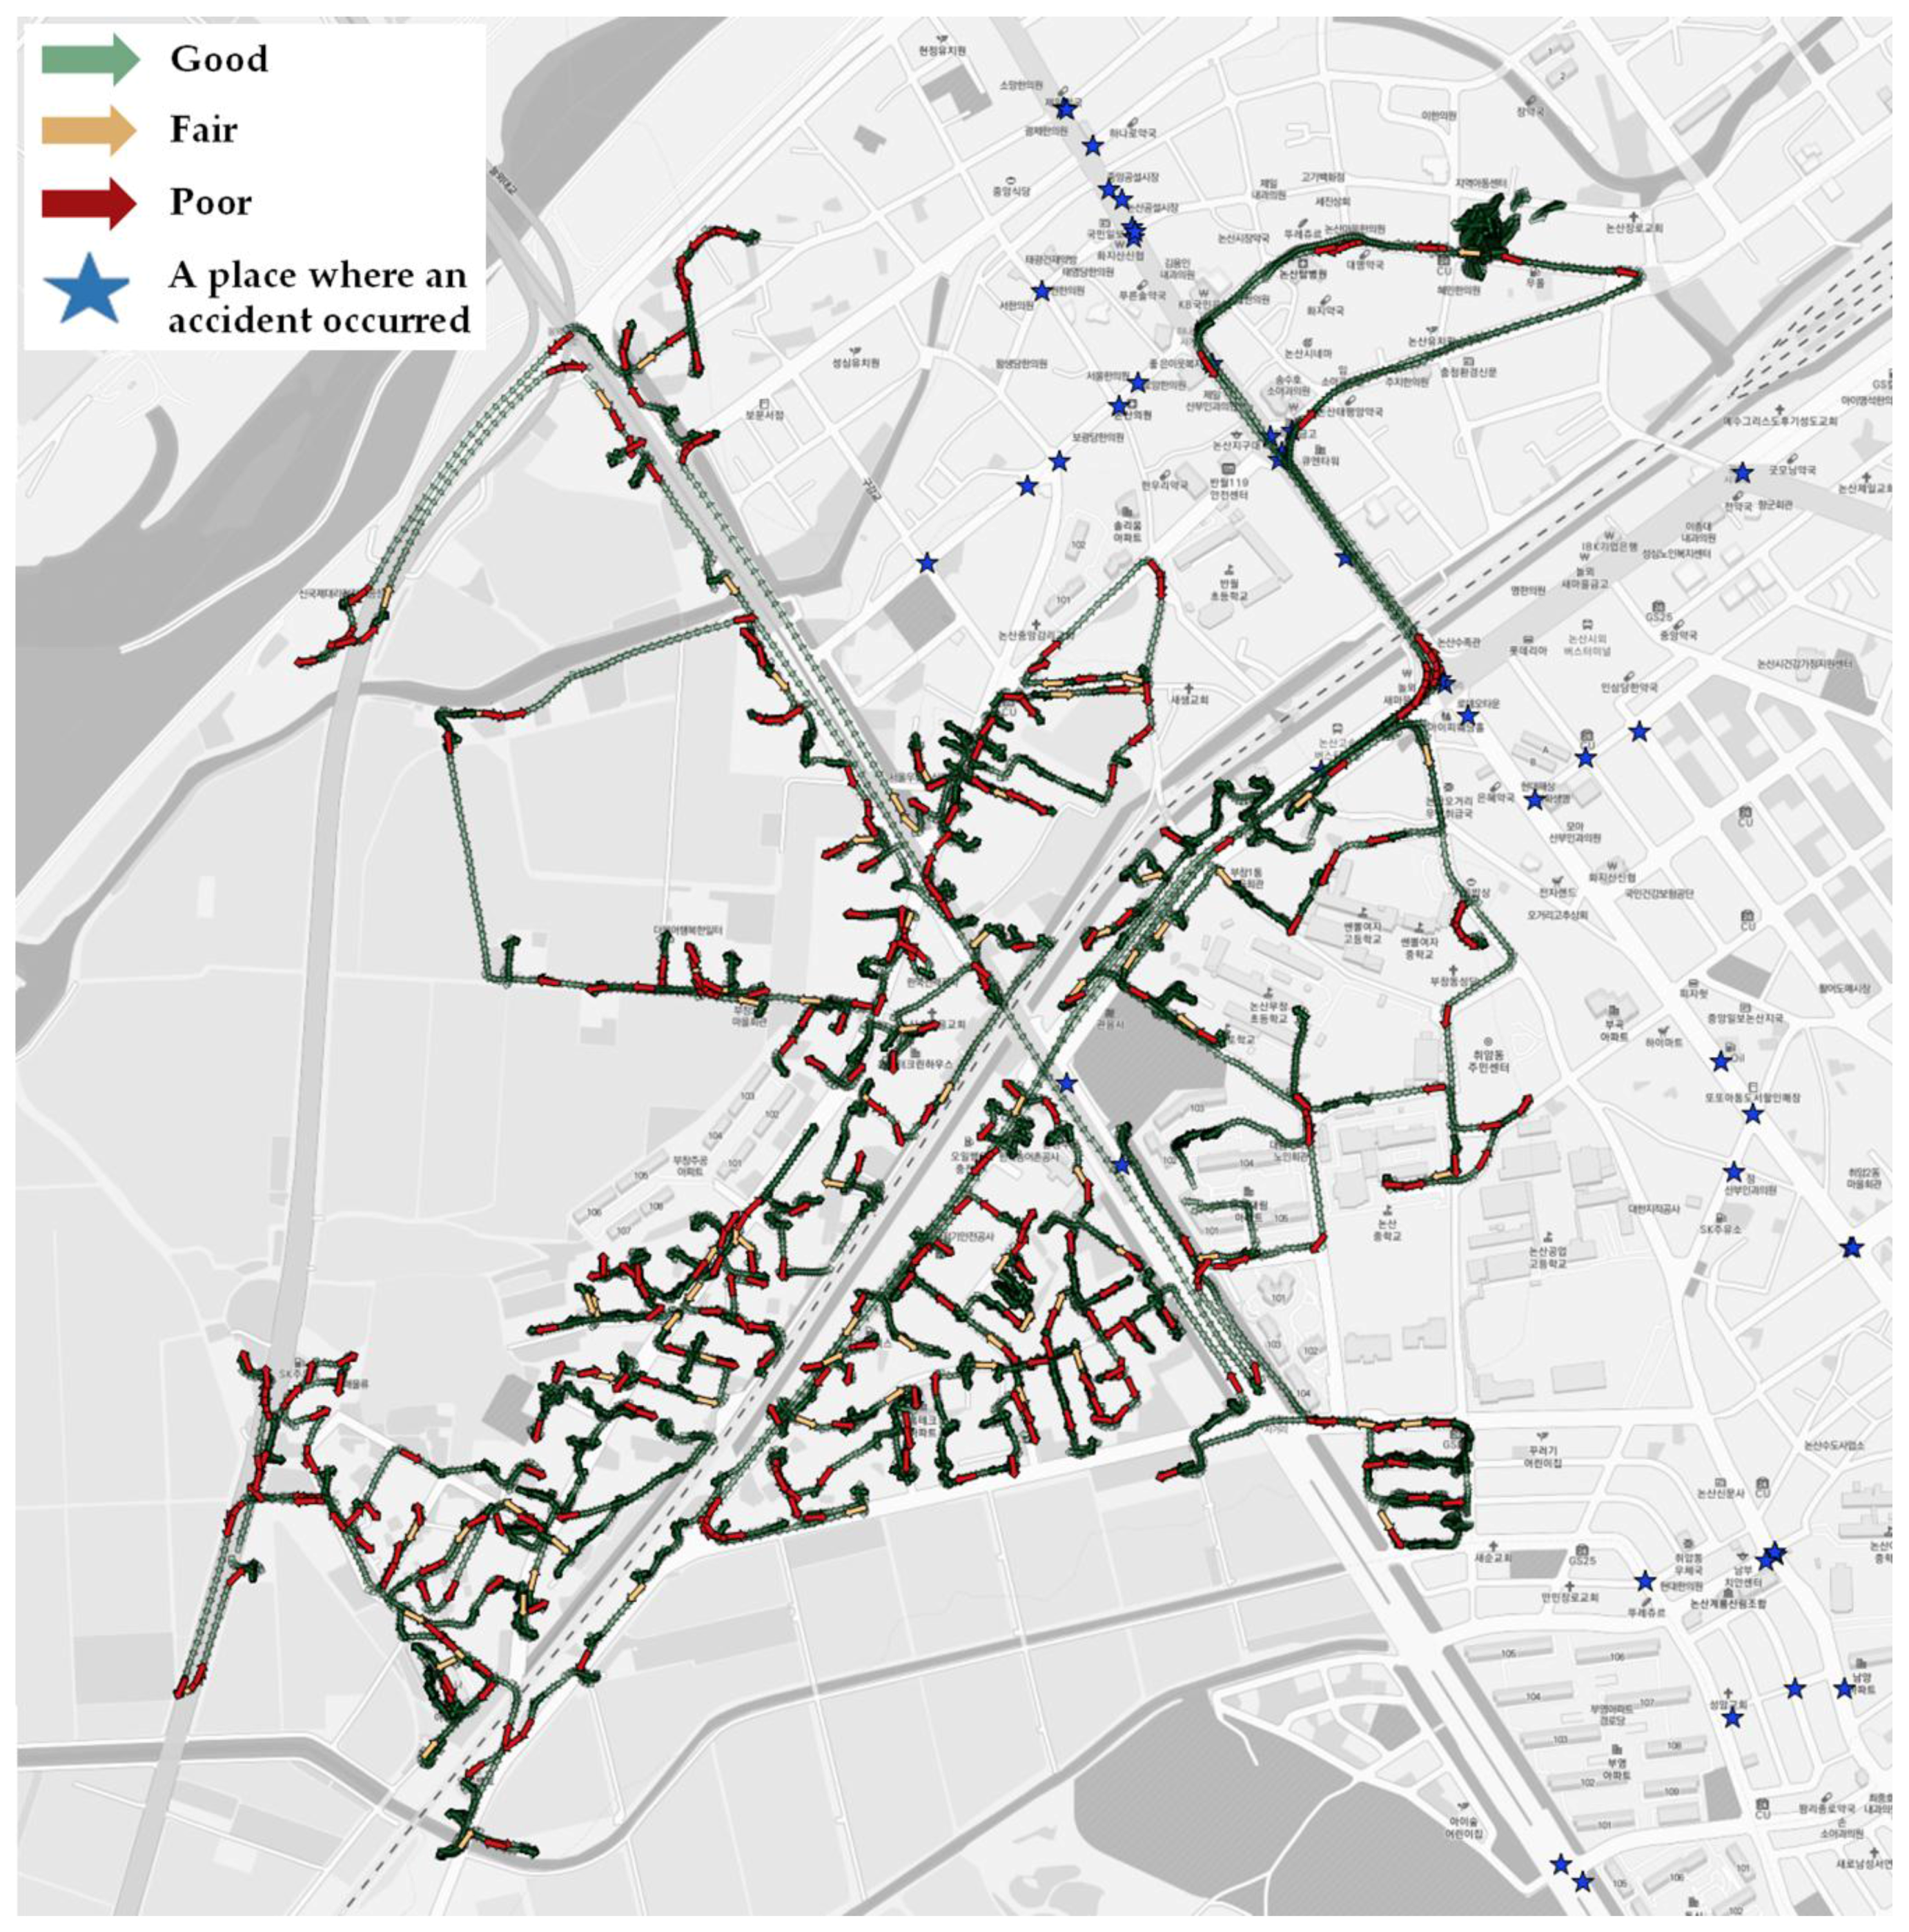
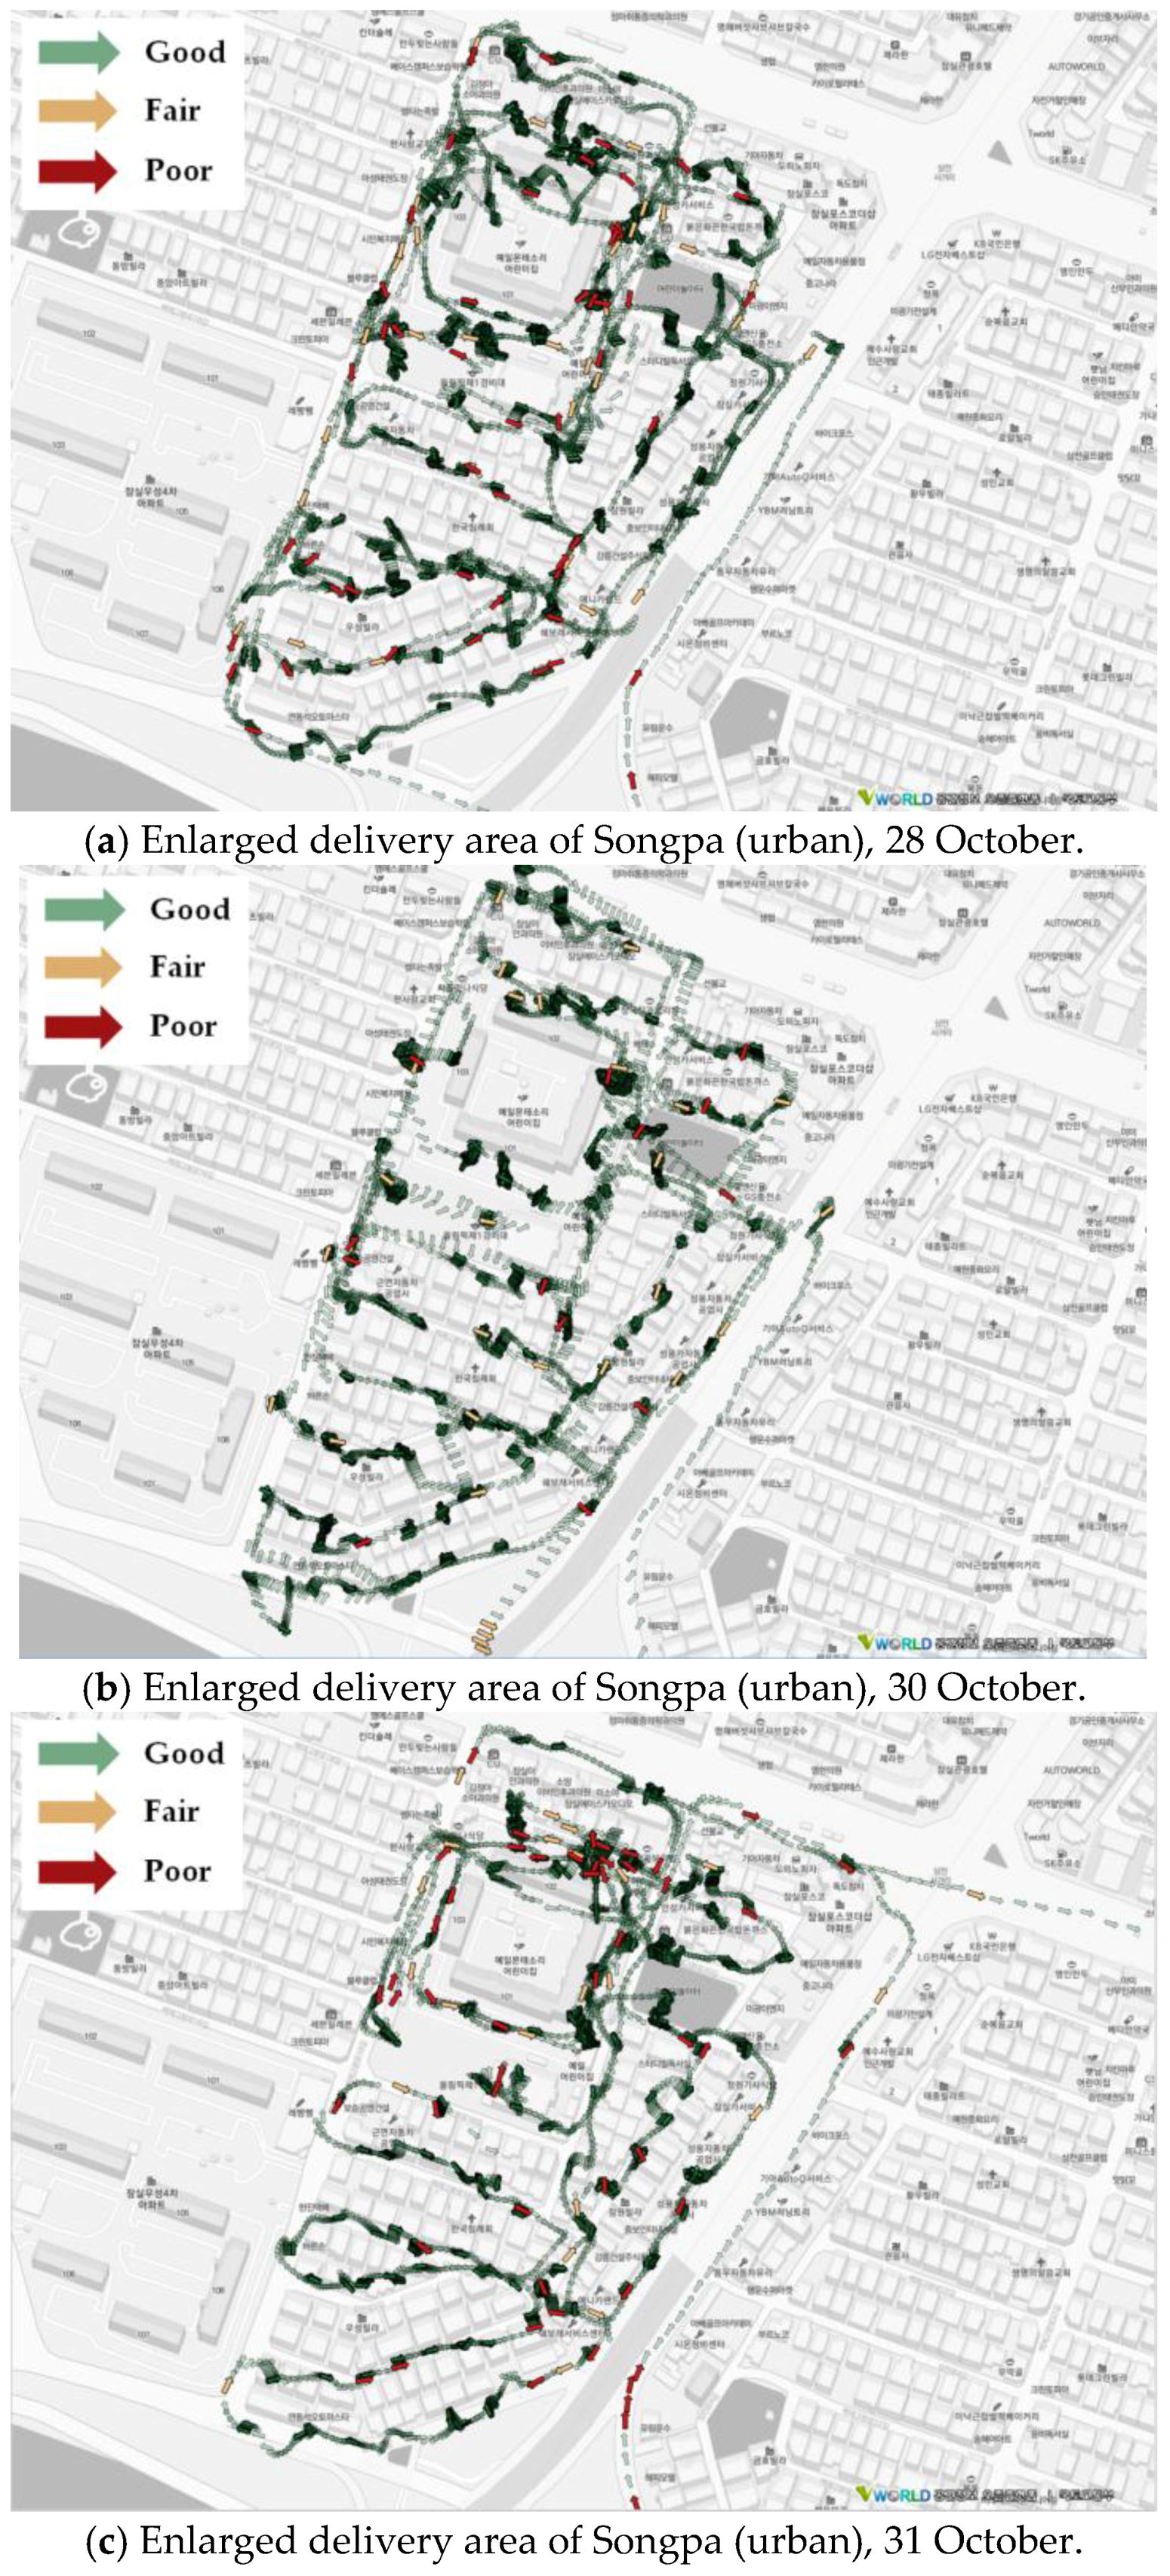
Each postal motorcyclist’s collected SI values could be used to investigate whether a particular postman is operating in potentially unsafe working conditions. Safety officers at Korea Post are responsible for improving postmen’s safety, including equalizing delivery workloads and improving the work environment. The following subsections describe issues facing the safety officers and how the developed SI helps them address the issues. An efficient way to investigate each postman’s SI values is to plot the collected data on a map, as shown in
Figure 2. This figure shows a postal motorcyclist’s work route throughout an entire work day on the V-World grayscale map [
29] in the QGIS system. The route is plotted via a dotted line where one dot represents one second of movement along the route. The colors along the route denote the SI of the motorcyclists at each position: green for ‘Good’, yellow for ‘Fair’, red for ‘Poor’ for the safety performance.
6.1. Analysis at the National Level
At the national level, safety officers at Korea Post’s headquarters conduct accident prevention activities. Without being restricted to particular delivery areas, they can access postmen’s SI data nationwide. This allows them to compare the information of a group of postmen working in one delivery area with that of postmen working in other delivery areas. A relevant question for the safety officers could be:
Question:
Are there any differences in the distribution of the SI values among different regional post offices?
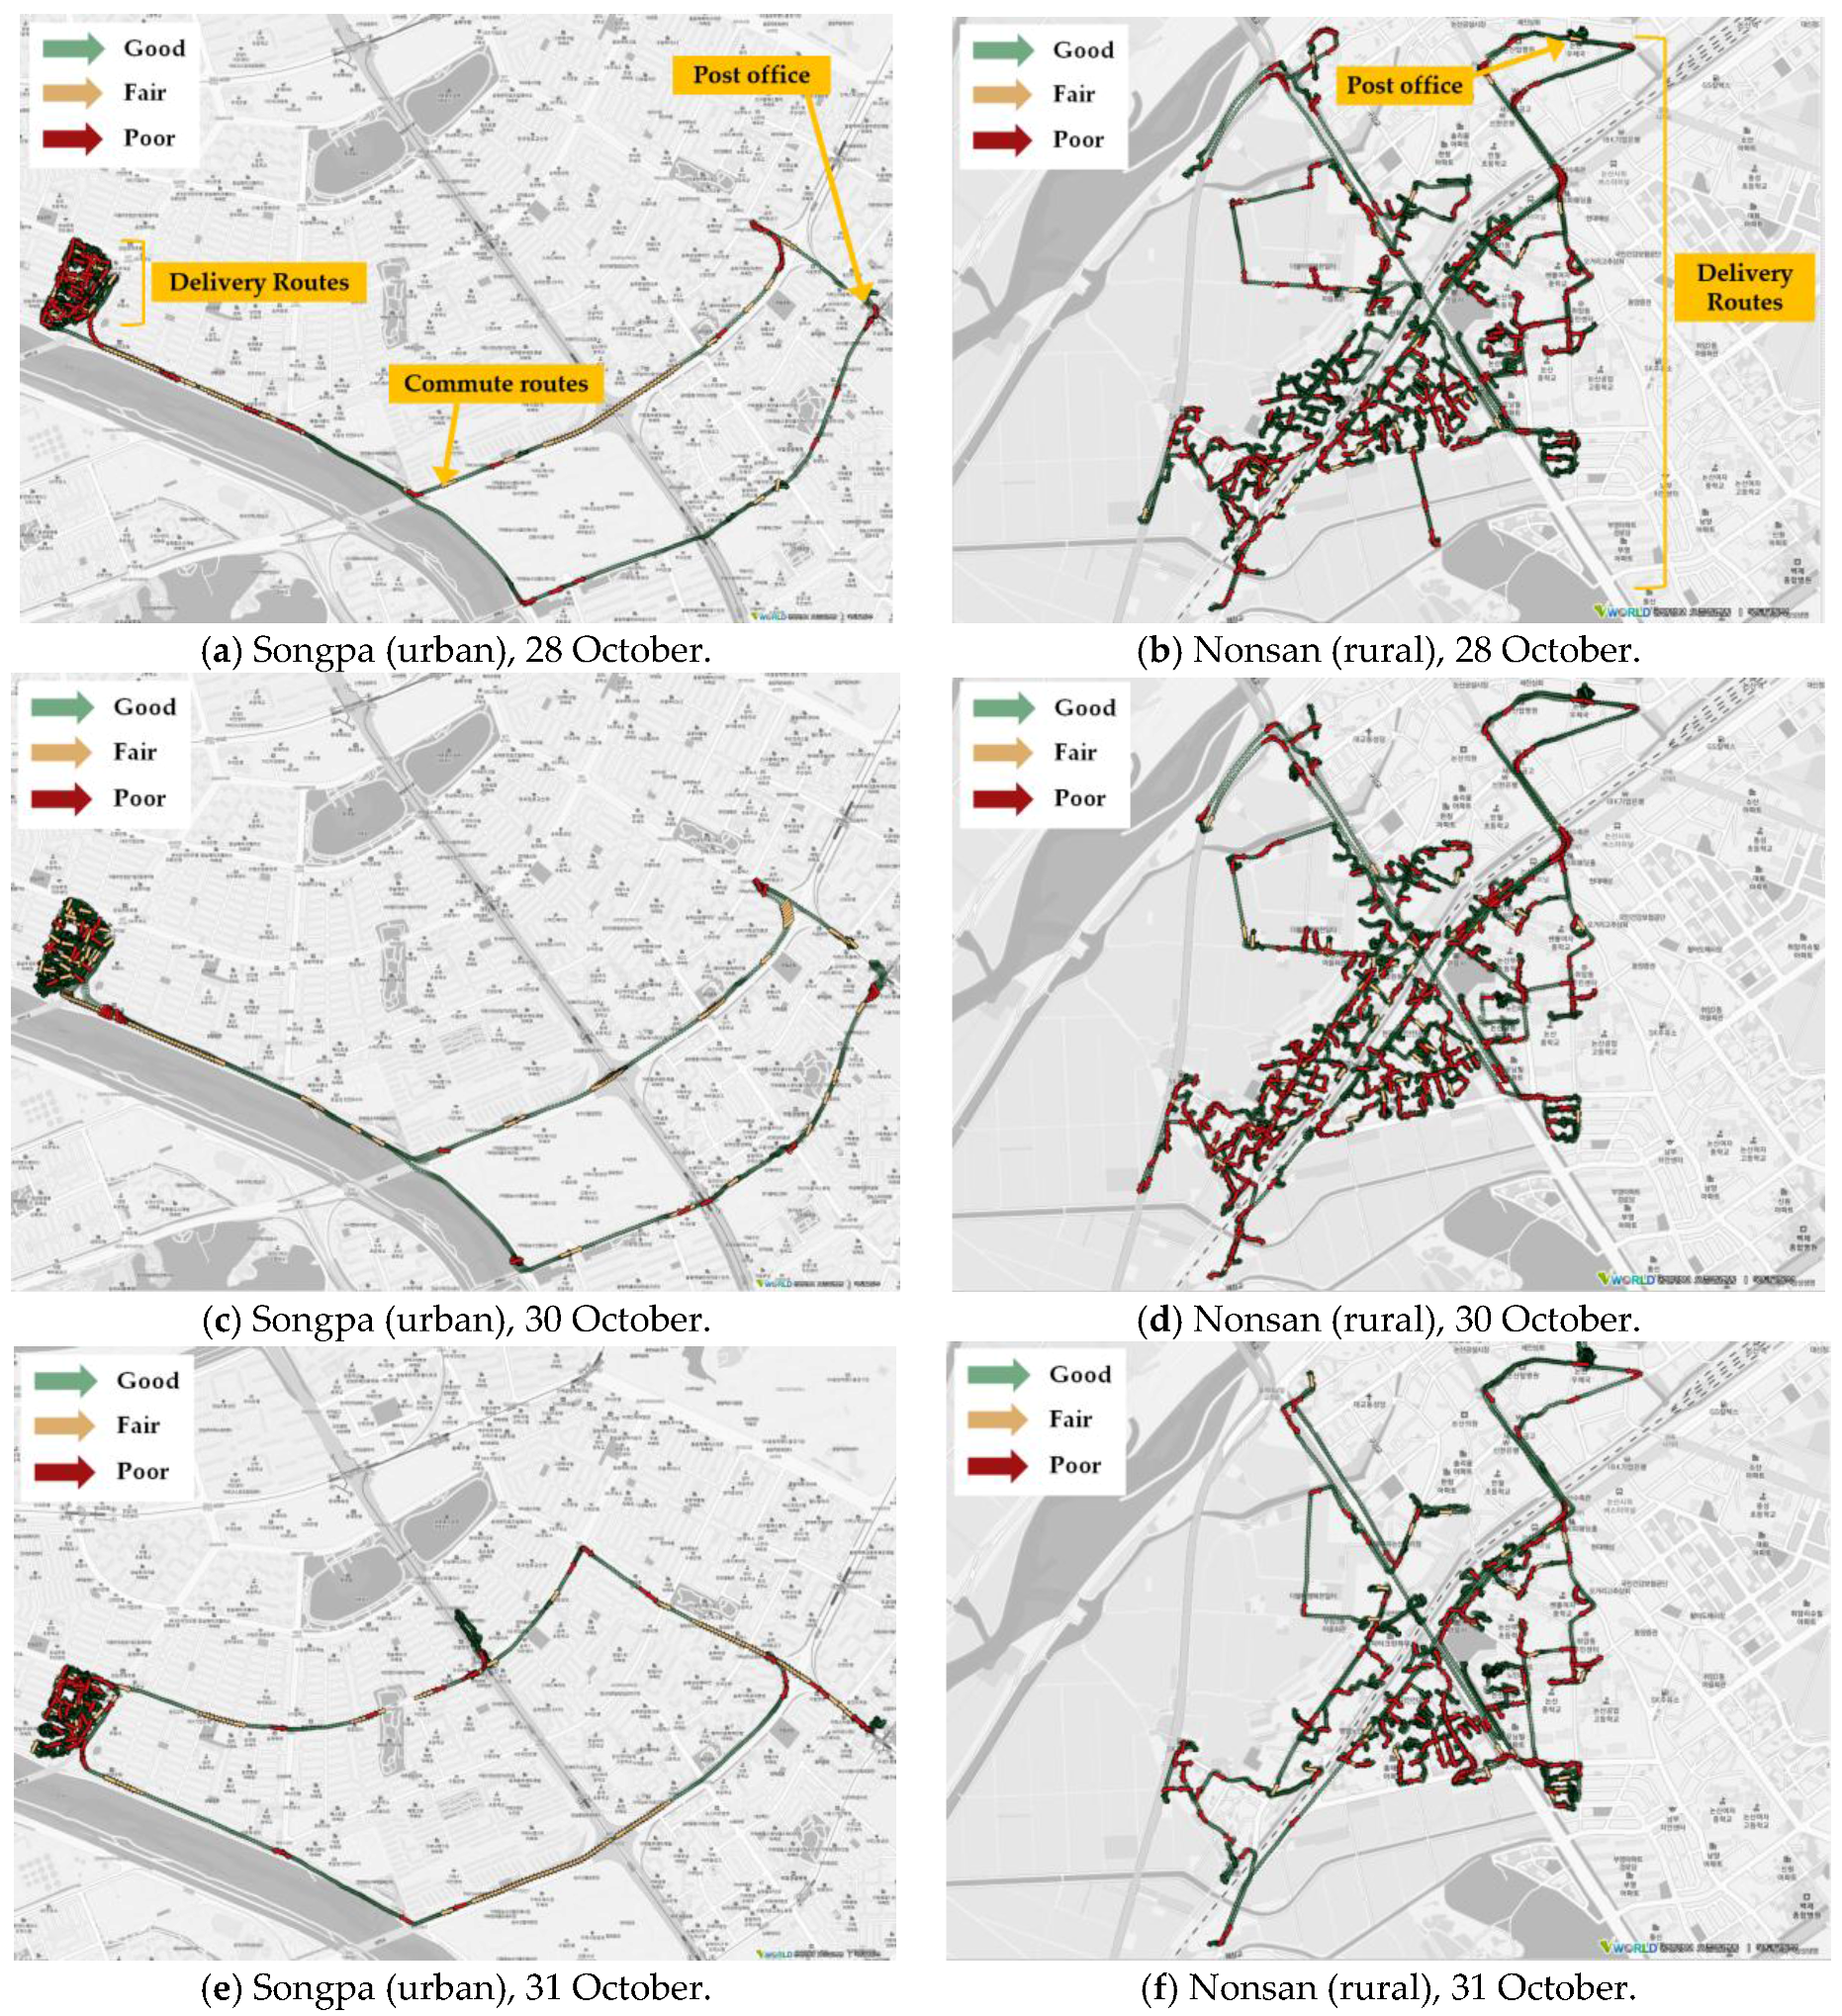
Using the collected data during the first phase of the field test,
Figure 2 shows two postal motorcyclists’ work routes in two different demographic areas—one, Songpa (urban), the other, Nonsan (rural). Visual representations in this figure reveal similarities for each area of the work route over three days. These similarities result from a postman’s delivery area being fixed for a certain period. Since this postal worker’s delivery area in Songpa is narrow and the delivery points are very densely distributed within that area, the delivery area is enlarged to illustrate the postman’s safety performance which is shown in
Figure 3.
Along the entire work routes in Songpa and Nonsan as seen in
Figure 2 and
Figure 3, green dots are observed to occur frequently throughout the routes. This shows that the two postmen’s safety performance is satisfactory with overall safe driving. In the commuting routes in Songpa, however, yellow or red dots occur frequently over the three days. This provides critical information to the safety officers to help identify the causes for unsafe operation.
One possible explanation for the safety officers is as follows. The delivery area in Songpa is somewhat distant from the post office, and thus commuting routes are clearly visualized to be distinct from the delivery routes. Such long and uninterrupted commuting routes allow the postal motorcyclist to speed up the increasing dynamic factors of the SI. A narrow delivery area, however, contains densely distributed delivery points requiring frequent delivery stops for the postal motorcyclist during his/her short-run deliveries. This circumstance does not allow the postal motorcyclist the opportunity to speed as much as when he is on commuting routes. In Nonsan, on the other hand, the delivery area is shown to be nearby the post office and so commuting routes are not clearly separate from the delivery routes in
Figure 2. Since delivery points are evenly distributed throughout the delivery area, such circumstances may reduce the opportunity to accelerate during deliveries.
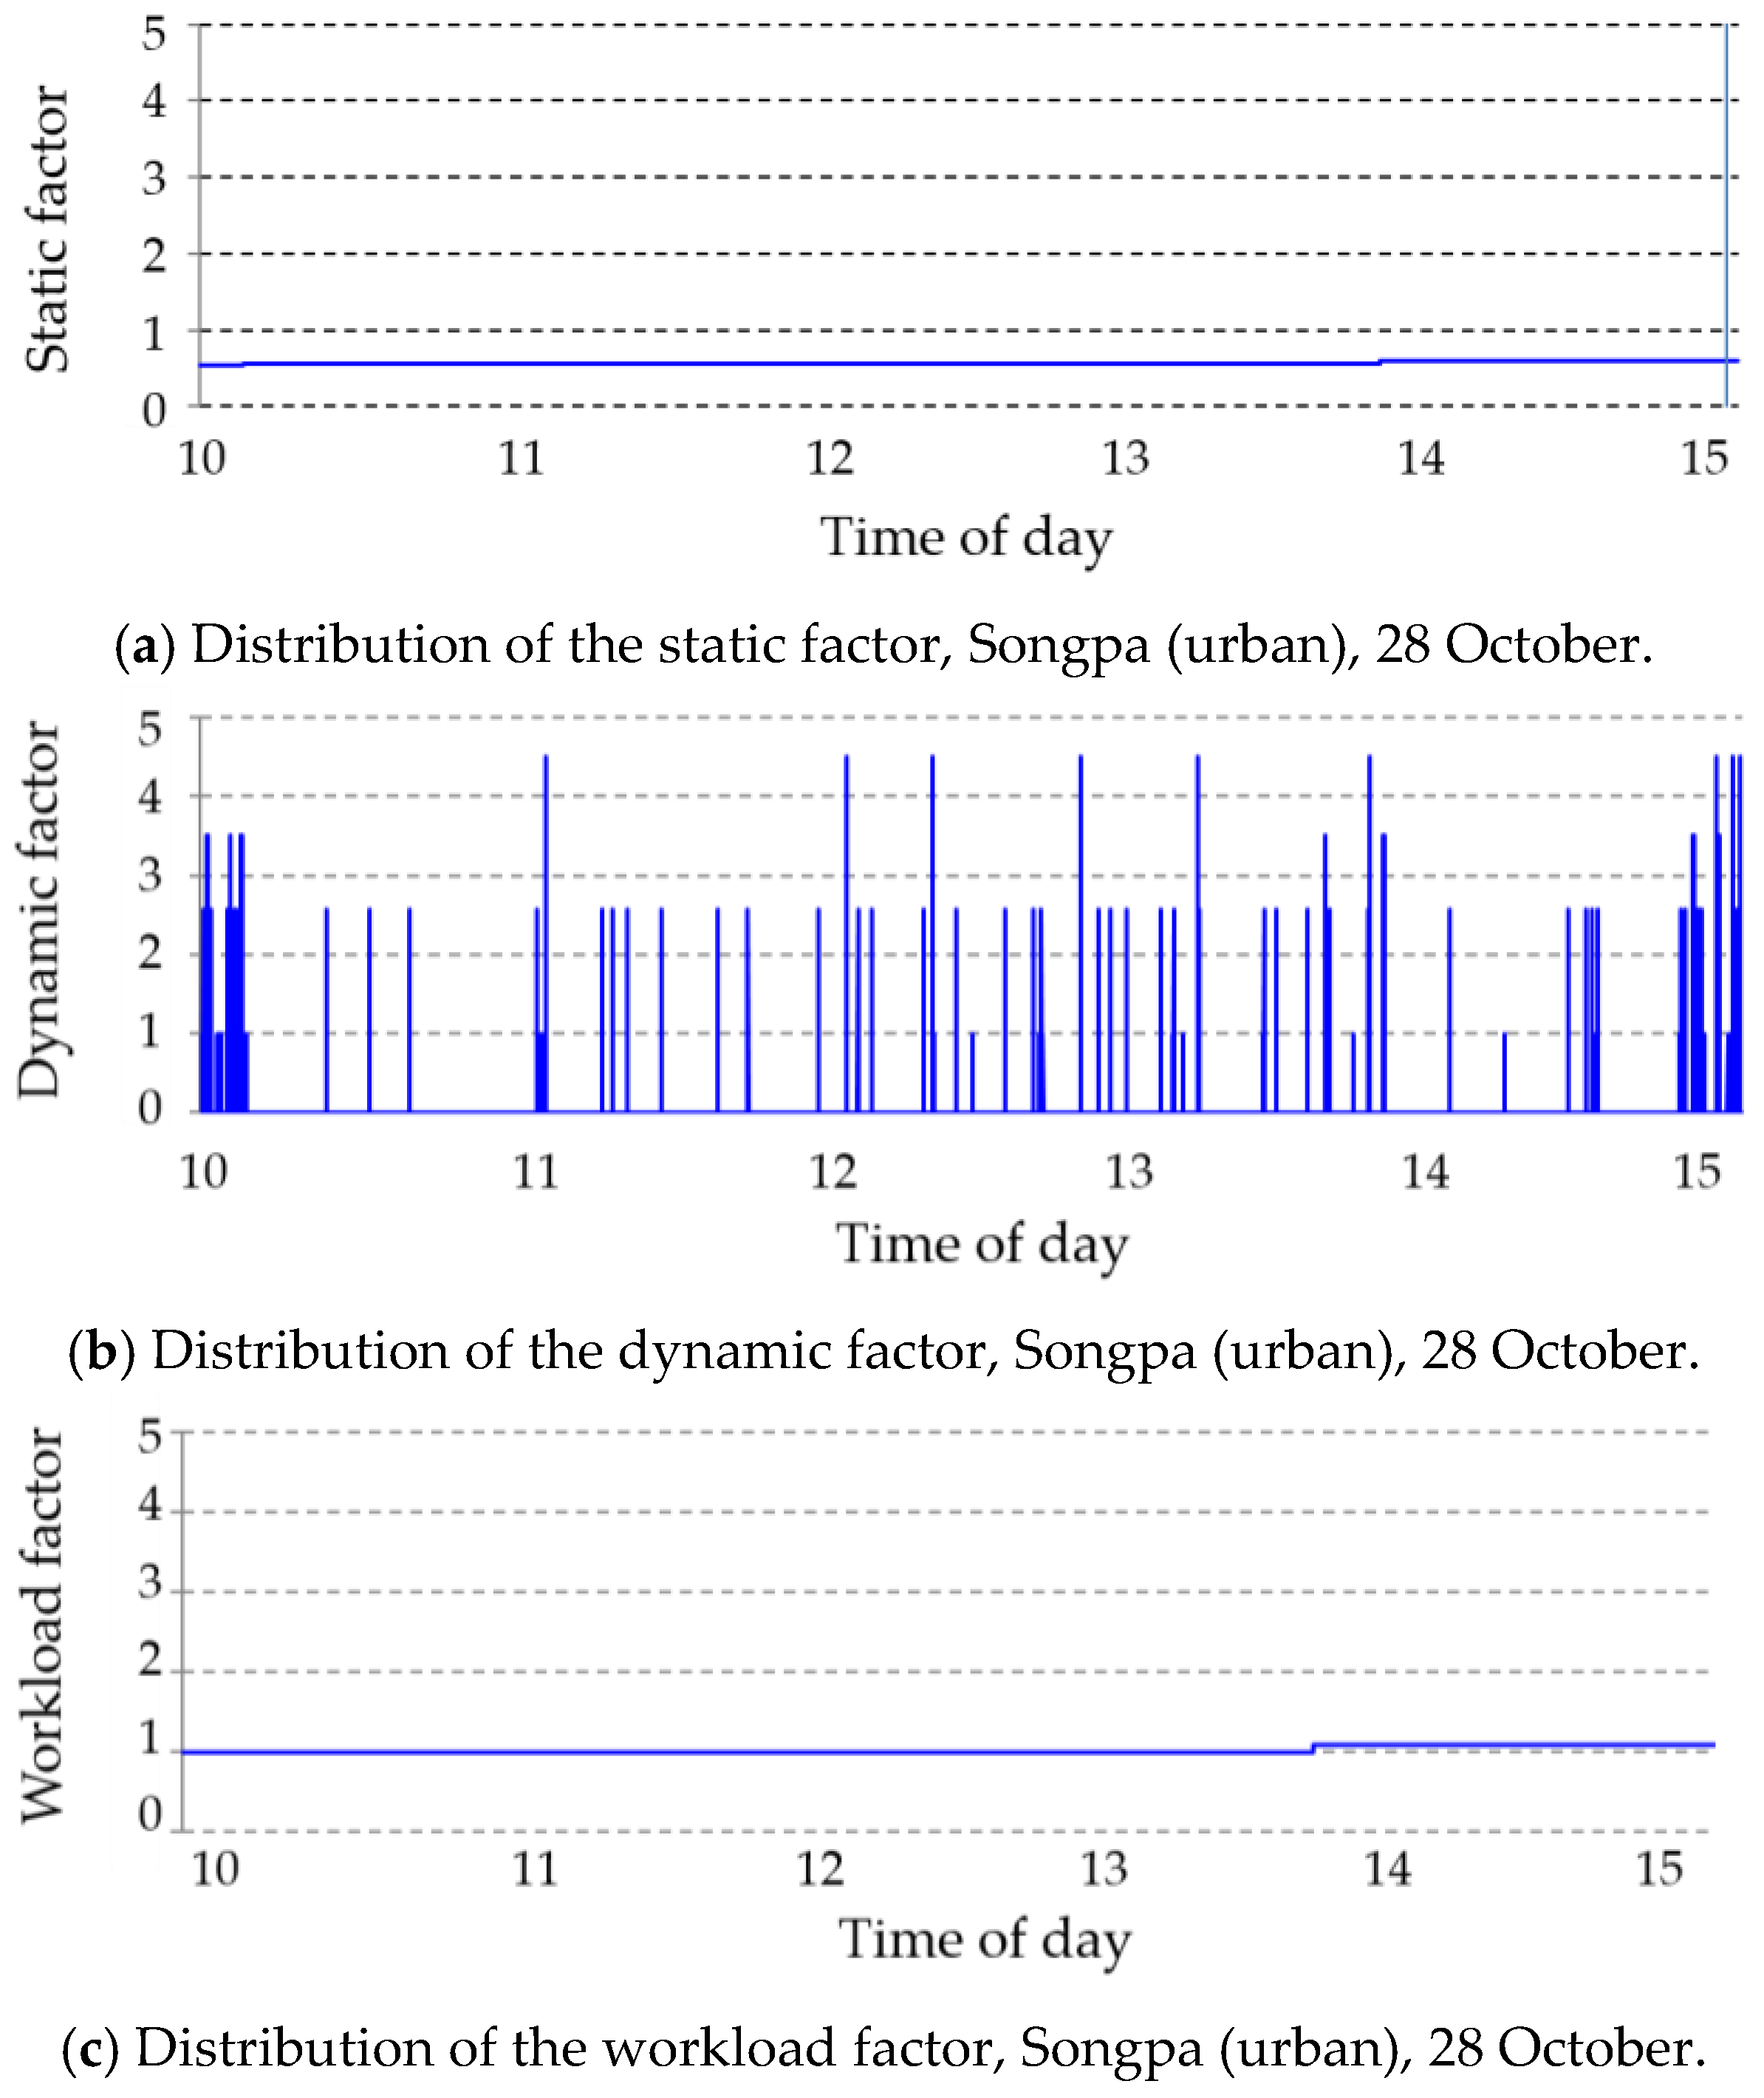
To confirm this speculation, the safety officers can refer to the values of the components of the SI factors. For example,
Figure 4 shows the distribution of three factors of the SI that were collected by the postman working in Songpa for one day, October 28. During all of his working hours, the static and workload factors varied from 0.54 to 0.6 and from 1.0 to 1.1, respectively. The dynamic factor varied most frequently with the largest range (from 0 to 4.5), and so it affects the value of the SI the most.
The safety officers can then identify what specific values of the components of the dynamic factor particularly affect safety performance.
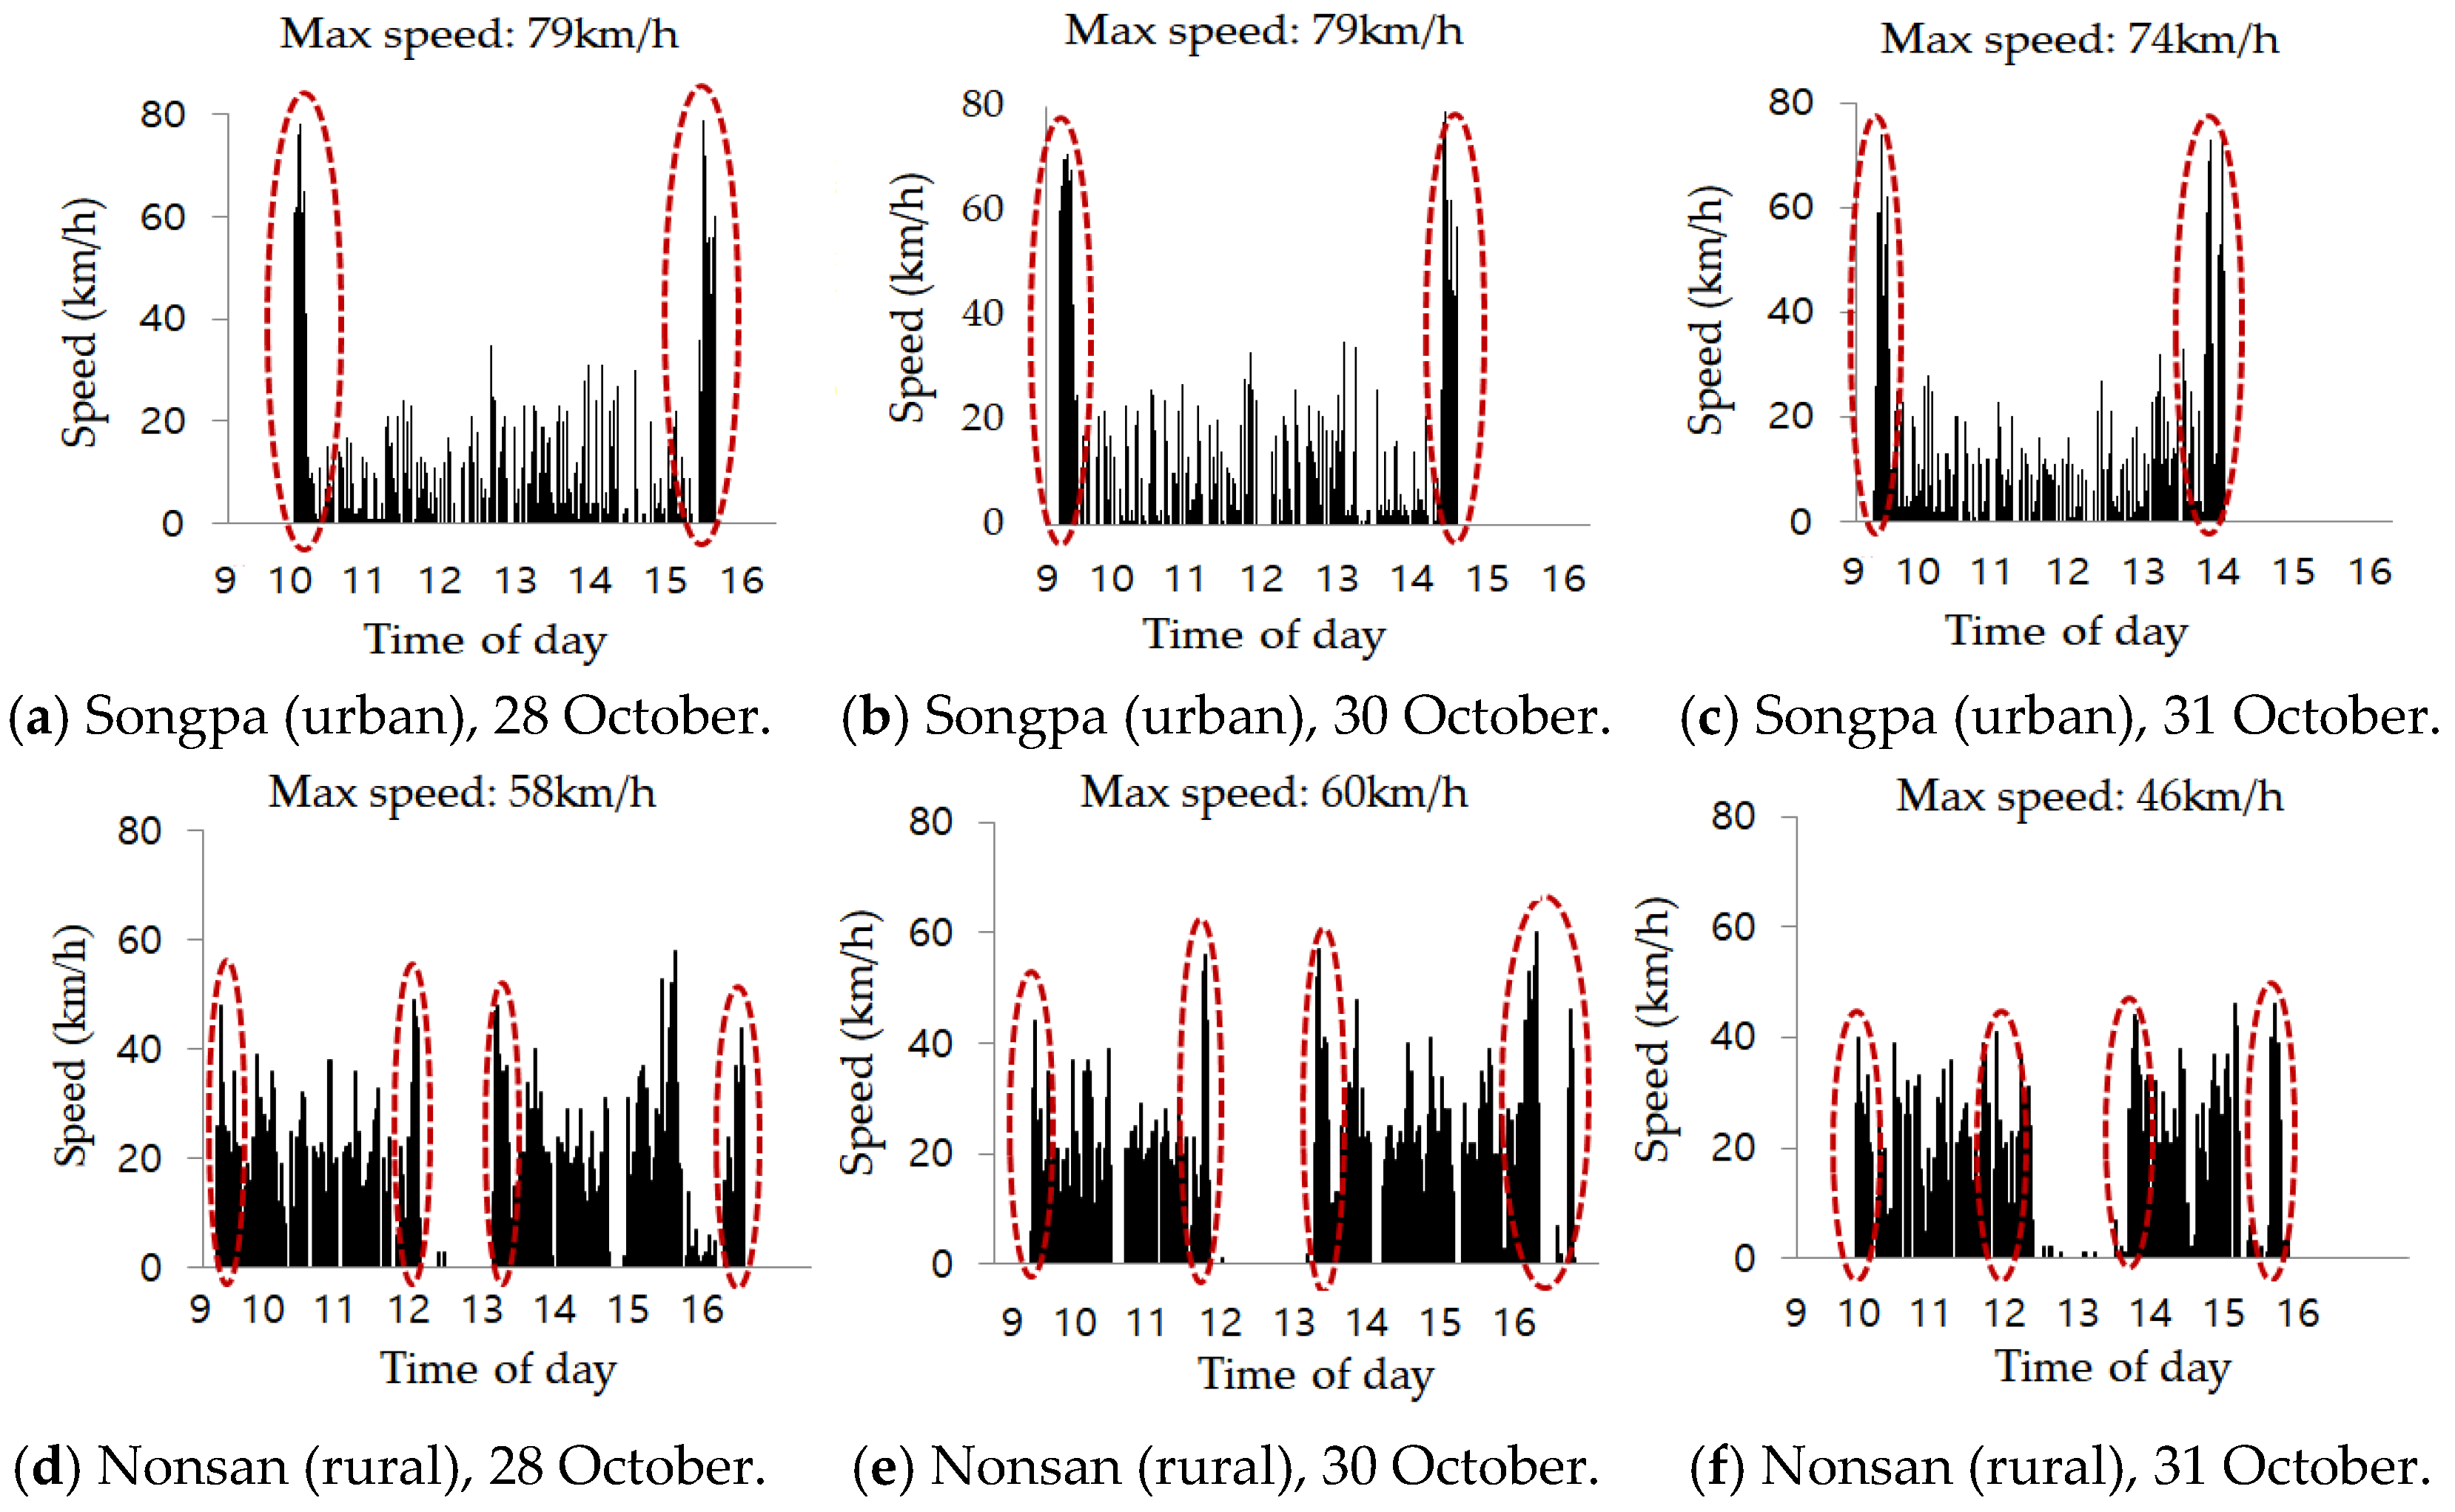
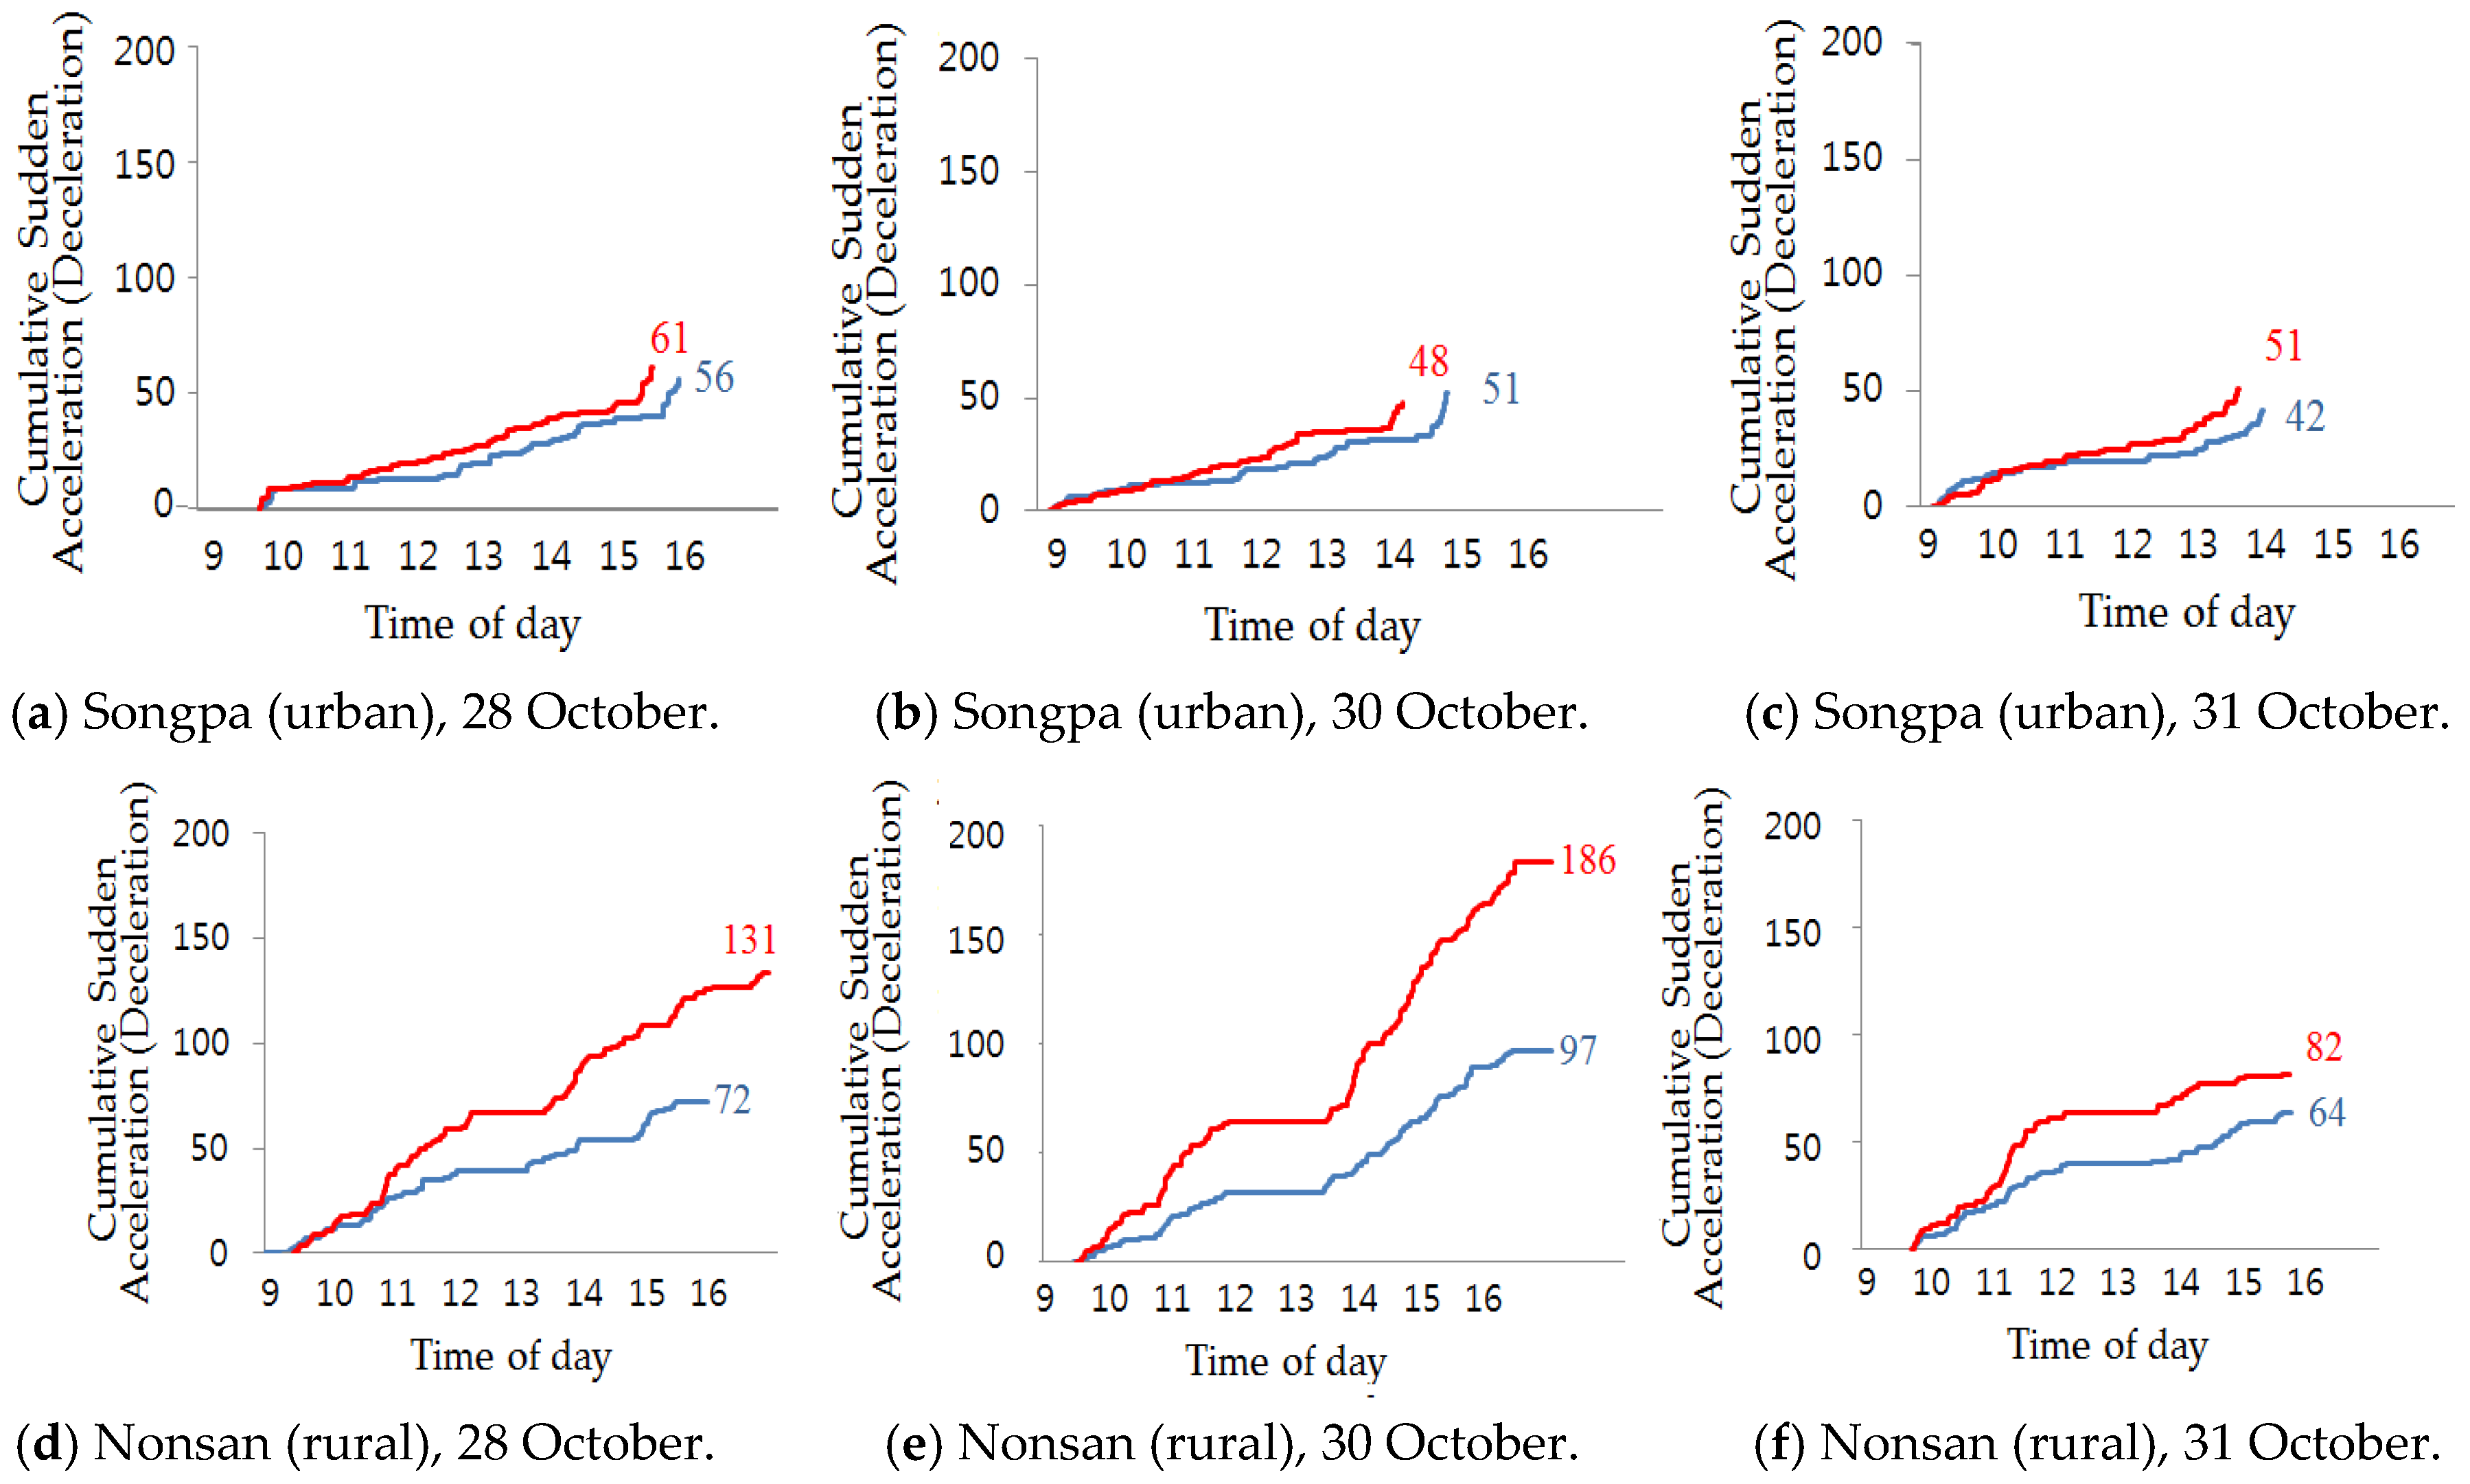
Figure 5 and
Figure 6 show the distribution of each component of the dynamic factor, i.e., speed, sudden accelerations, and sudden decelerations by two postal motorcyclists working in Songpa and Nonsan, respectively. In
Figure 5, speeds on the commutes to and from the post office are marked with circles. Over three days in
Figure 5, the distribution of speeds in Songpa shows that the postman reached maximum speeds at the beginning and end of the delivery, i.e., when the postman was commuting from and to the post office. The average speed of the postman on commuting routes was 77 km/h; on delivery routes, 12 km/h. Based on their analysis, the safety officers can conduct a field investigation of examining the traffic volume of the commuting routes in Songpa to determine whether the road can safely support the postman’s current speeds. If not, the safety officers can design interventions that are likely to reduce risky driving.
The Nonsan data show that the postman averaged 55 km/h on commuting routes and 16km/h on the delivery routes and the difference between them is not as significant as for that of the Songpa postman. Note that the speeds between 12:00 and 13:00 in Nonsan are observed to be consistently zero. This is because the postman delivered twice a day—in the mornings and afternoons—and he ate lunch at the post office during this time period. Although there are a few outliers between 12:00 and 13:00 (i.e., speed values greater than zero), this occurred due to weak GPS signals when the PDA is placed inside a building with windows.
Figure 6 shows the distribution of sudden accelerations and decelerations by the two postal motorcyclists. The total amount of sudden accelerations or decelerations for the postman in Nonsan is observed to be much more than for the postman in Songpa: average 50 (Songpa) vs. 78 (Nonsan) of sudden accelerations; average 53 (Songpa) vs. 133 (Nonsan) of sudden decelerations. In addition, the postman in Nonsan tended to suddenly decelerate (average: 133), more than suddenly accelerate (average: 78), whereas there was little difference for the postman in Songpa. Based on these findings, the safety officers can investigate whether this is due to fixed factors such as delivery conditions in Nonsan (e.g., the delivery points in rural areas are less densely located providing sufficient distance for acceleration or deceleration unlike those in urban areas) or the postman’s personal unsafe driving habits. In any case, the safety officers can establish a contingency plan to deal with the identified issues.
6.2. Analysis at the Regional Level
At the regional level, safety officers in each of the local delivery offices check for hazardous road conditions and alert postmen, enabling for defensive driving to prevent accidents. Using their deep background knowledge of their particular area’s delivery environment, the safety officers monitor the volume of mail/packages for each postman so as not to overload any postmen. Each safety officer in a local delivery office can access only their own office’s postmen’s safety performance data and not that of other delivery offices. Currently, however, they have no efficient way of monitoring their postmen’s delivery work except by referring to each postman’s manually recorded daily mileage. In light of this, our developed SI makes it possible for them to recognize their postmen’s safety performance and to identify those work environments conducive to accidents. Information sought by the safety officers in the local delivery offices could be:
Question:
Are there any differences in the distribution of the SI values within the same regional post office?
Based on the collected data during the second phase of the field test,
Table 11 shows values for five postmen’s SI and dynamic and workload factors during a particular day in Cheongju. Postmen that were working in the same delivery office are usually divided into two groups: some are responsible for the downtown and others for the area’s suburbs. In
Table 11, (S) signifies a postman delivering to a suburb of Cheongju and (D), a postman delivering in downtown Cheongju. Note that the information for postman #1 is not recorded in the table because his GPS data was not fully collected due to a PDA failure.
Table 11 shows that there is little difference in the SI values between the five postmen: the minimal and maximal values average 1.2 and 1.5, respectively. Among the five, postman #2, who is responsible for a suburb, shows the highest SI value (average 1.5), as well as a far higher number of sudden accelerations (165) and decelerations (153) than the others.
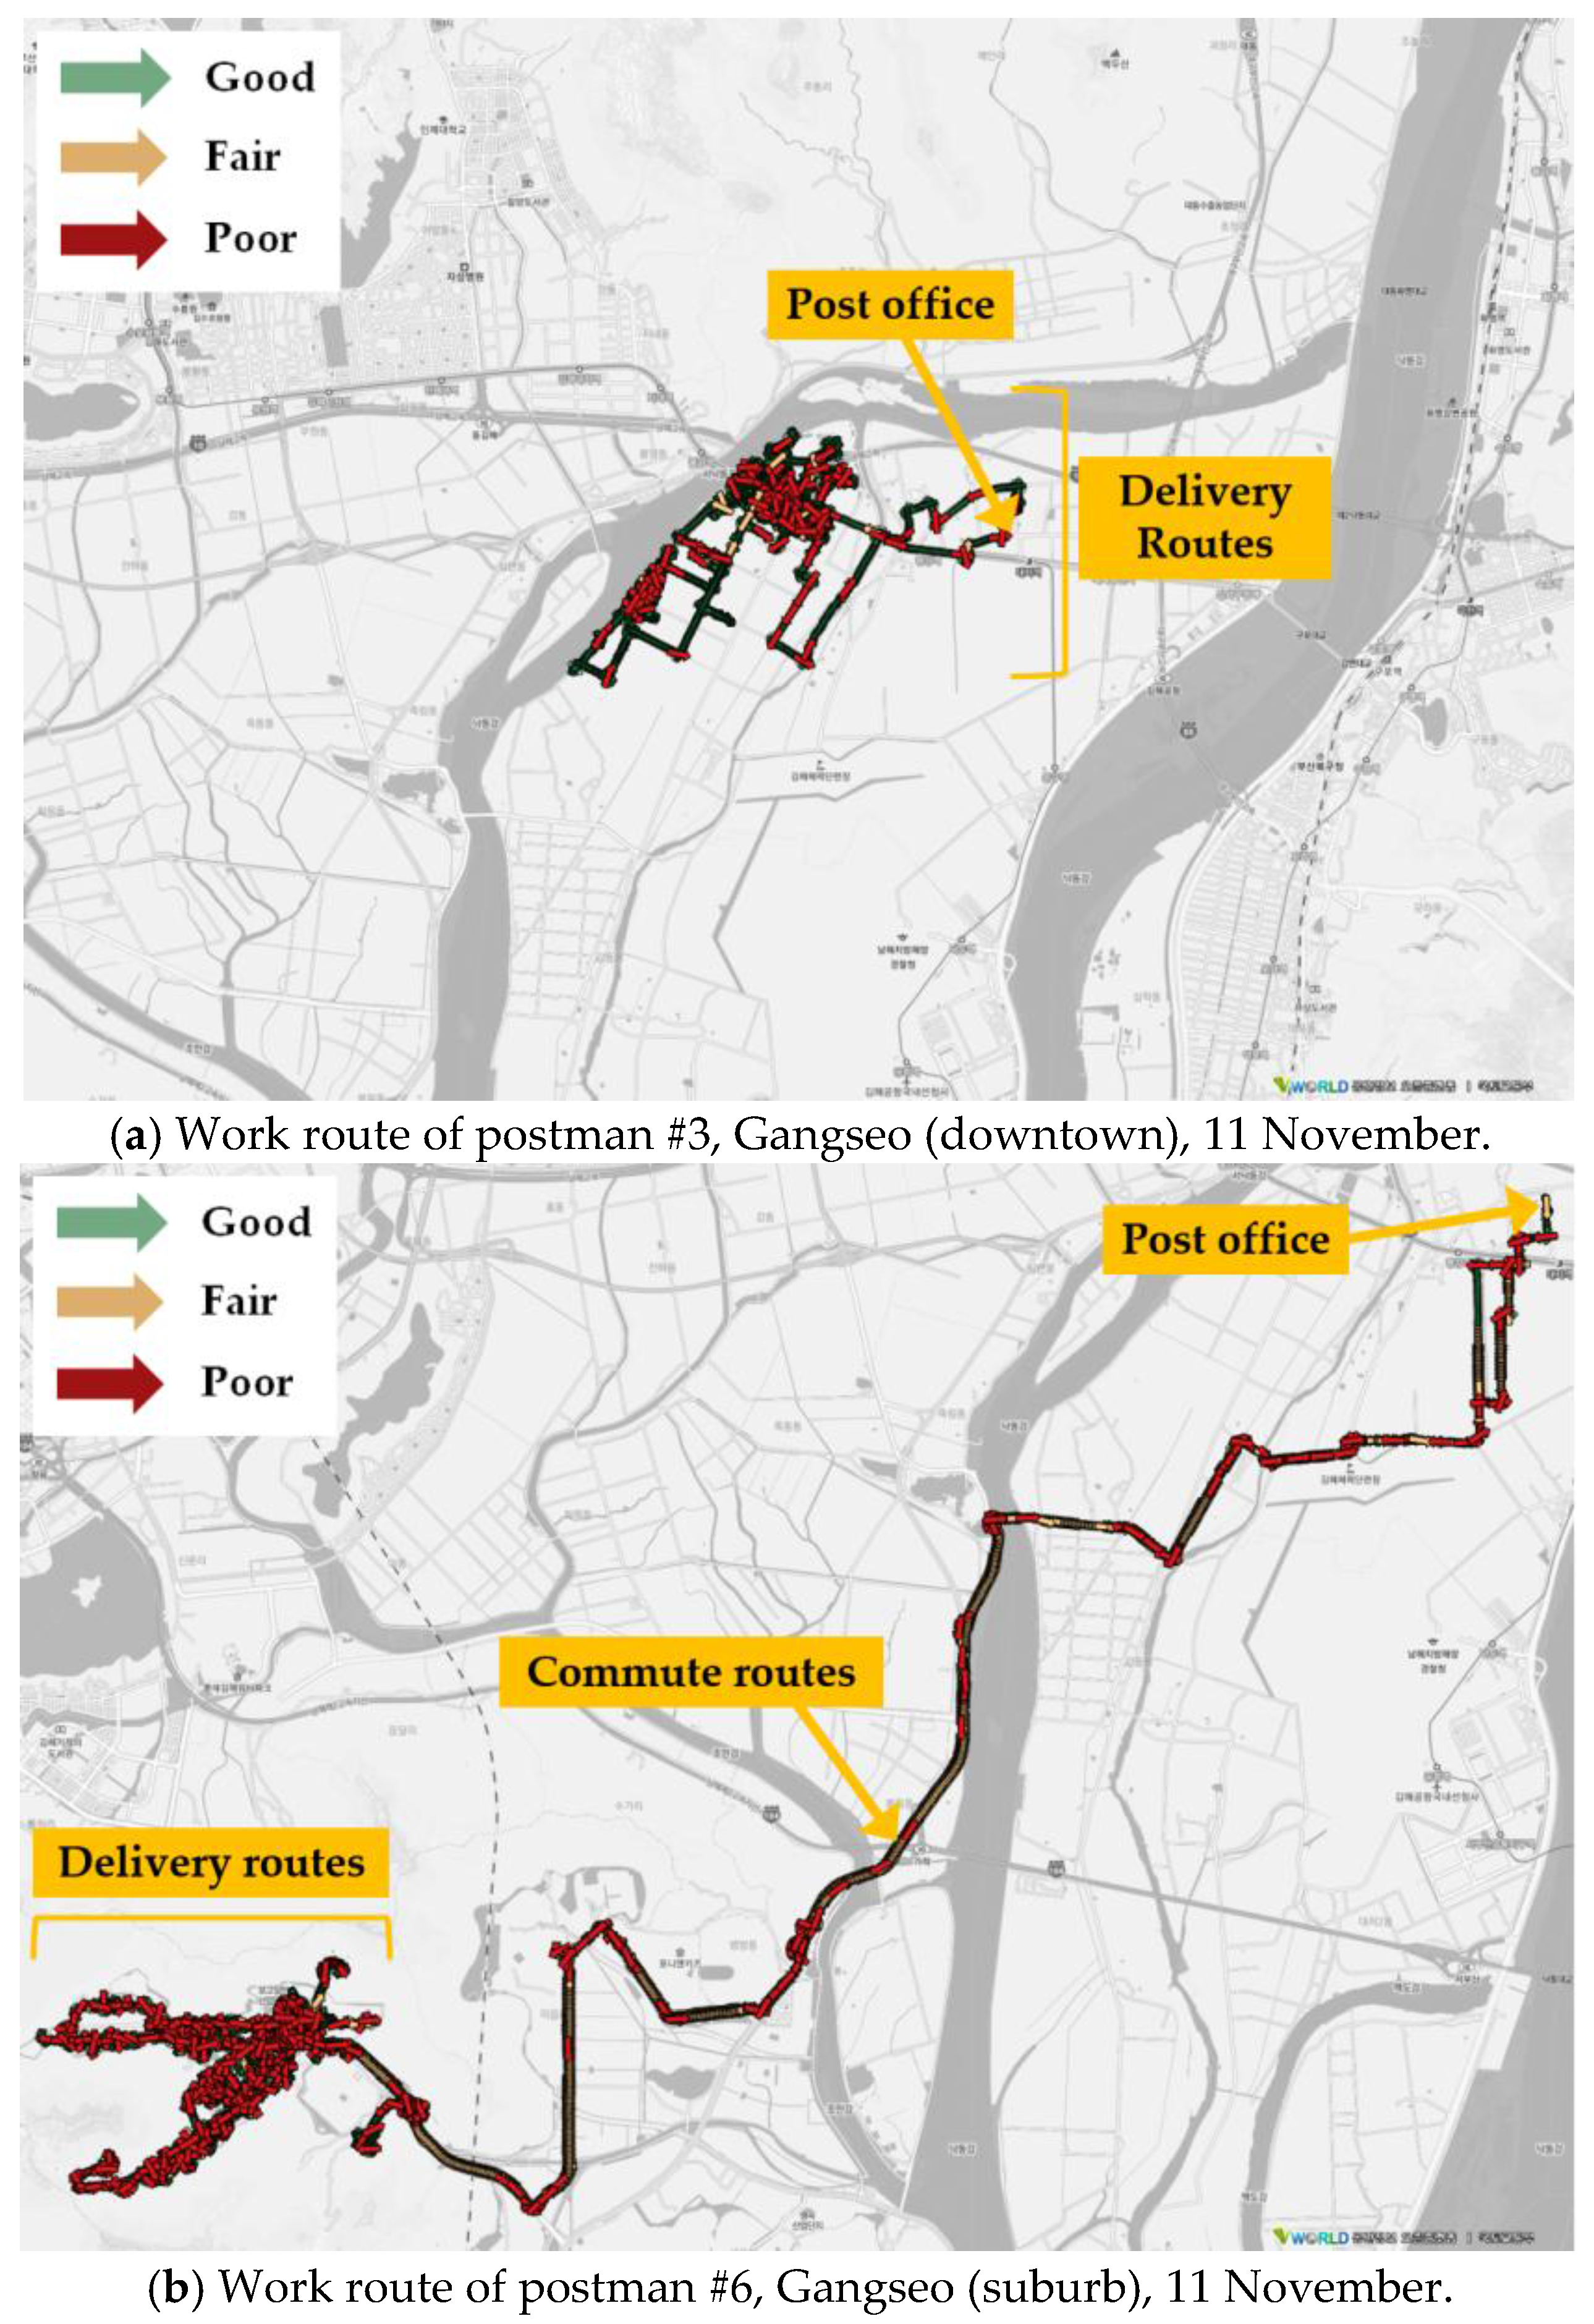
Table 12, representing the six postmen working in Gangseo, shows the difference between the SI of postman #3, who was responsible for the downtown, and postman #6, who was responsible for a suburb is quite noticeable: averages of 1.1 and 1.8, respectively. The statistics show that postman #6 drove more hazardously than postman #3 and had six times more sudden accelerations and 2.5 times more sudden decelerations. Also, the maximum speed of postman #6 reached 87 km/h which is a fairly high speed for a motorcycle. Working hours for postman #6 were around 40 min longer than for postman #3.
Figure 7 shows the two postmen’s SI values that were plotted on their work routes during a day, 11 November. The work route of postman #6 shows that the delivery area is fairly distant from the post office. This is because postman #6 is responsible for a suburb of Gangseo and must drive a long distance to reach the delivery area from the post office. This figure also shows that along the commuting routes of postman #6, yellow or red dots occur frequently, as in the case of Songpa. Using a value for speed every second, the total driving distances for each of the two postmen is estimated: 33.6 km and 74 km for postman #3 and #6, respectively. Ideally, to equalize delivery workloads between suburbs and downtown, postmen for suburbs should be allocated a smaller volume of deliveries than postman for downtown areas. According to the guidelines of Korea Post, it is usually appropriate for postmen responsible for suburbs to have less than half of the volume of deliveries than that of postmen in downtown areas. Since the SI value is mostly affected by the dynamic factor, safety managers need to investigate the primary causes of postman #6’s inappropriate driving actions: e.g., fatigue due to long distance driving; time pressure to make a large number of deliveries; an unsafe delivery environment conducive to risky driving; or personal unsafe driving habits.
7. Conclusions
Postal work-related accidents occur for various reasons—walking on uneven sidewalks or icy stairways; distractions such as reading mailing addresses while walking; unsafe driving; and, carrying overweight delivery pouches. Korea Post reported that of all its employees’ work activities (driving, running, walking, lifting, or carrying), operating postal motorcycles accounted for the largest portion (81%) in 2015.
Using variables that reflect risk factors for postal motorcyclists, we developed methods for quantifying and analyzing individual postal motorcyclists’ safety performance based on their driving behavior and work environment. The system developed in this paper tracks on-job movements of postal motorcyclists in real time by using a GPS and calculates an SI. Once the SI values are computed, Korea Post can determine which risk factors contribute most to accidents so that they can proactively work to reduce these identified risks.
Using the collected field data, we conducted various analyses and found several issues. First, the safety performance of postal motorcyclists working in different regional delivery offices varies depending on the regional characteristics of the local delivery office (e.g., densely distributed delivery points in Songpa vs. loosely distributed delivery points in Nonsan). Second, the safety performance of postal motorcyclists working in the same regional post office also varies depending on the specific circumstances of each delivery area (e.g., short commuting routes of the postman that was responsible for downtown Gangseo vs. long commuting routes of the postman who was responsible for a suburb of Gangseo).
Subsequent studies will involve designing optimal delivery routes to correct any existing unsafe or inefficient routes. We also plan to deploy our system to more postmen working in diverse environments to identify any additional factors threatening postal motorcyclists’ safety.


