
Analyzing Urban Human Mobility Patterns through a Thematic Model at a Finer Scale


Abstract
:1. Introduction
2. Trip Extraction and Analysis
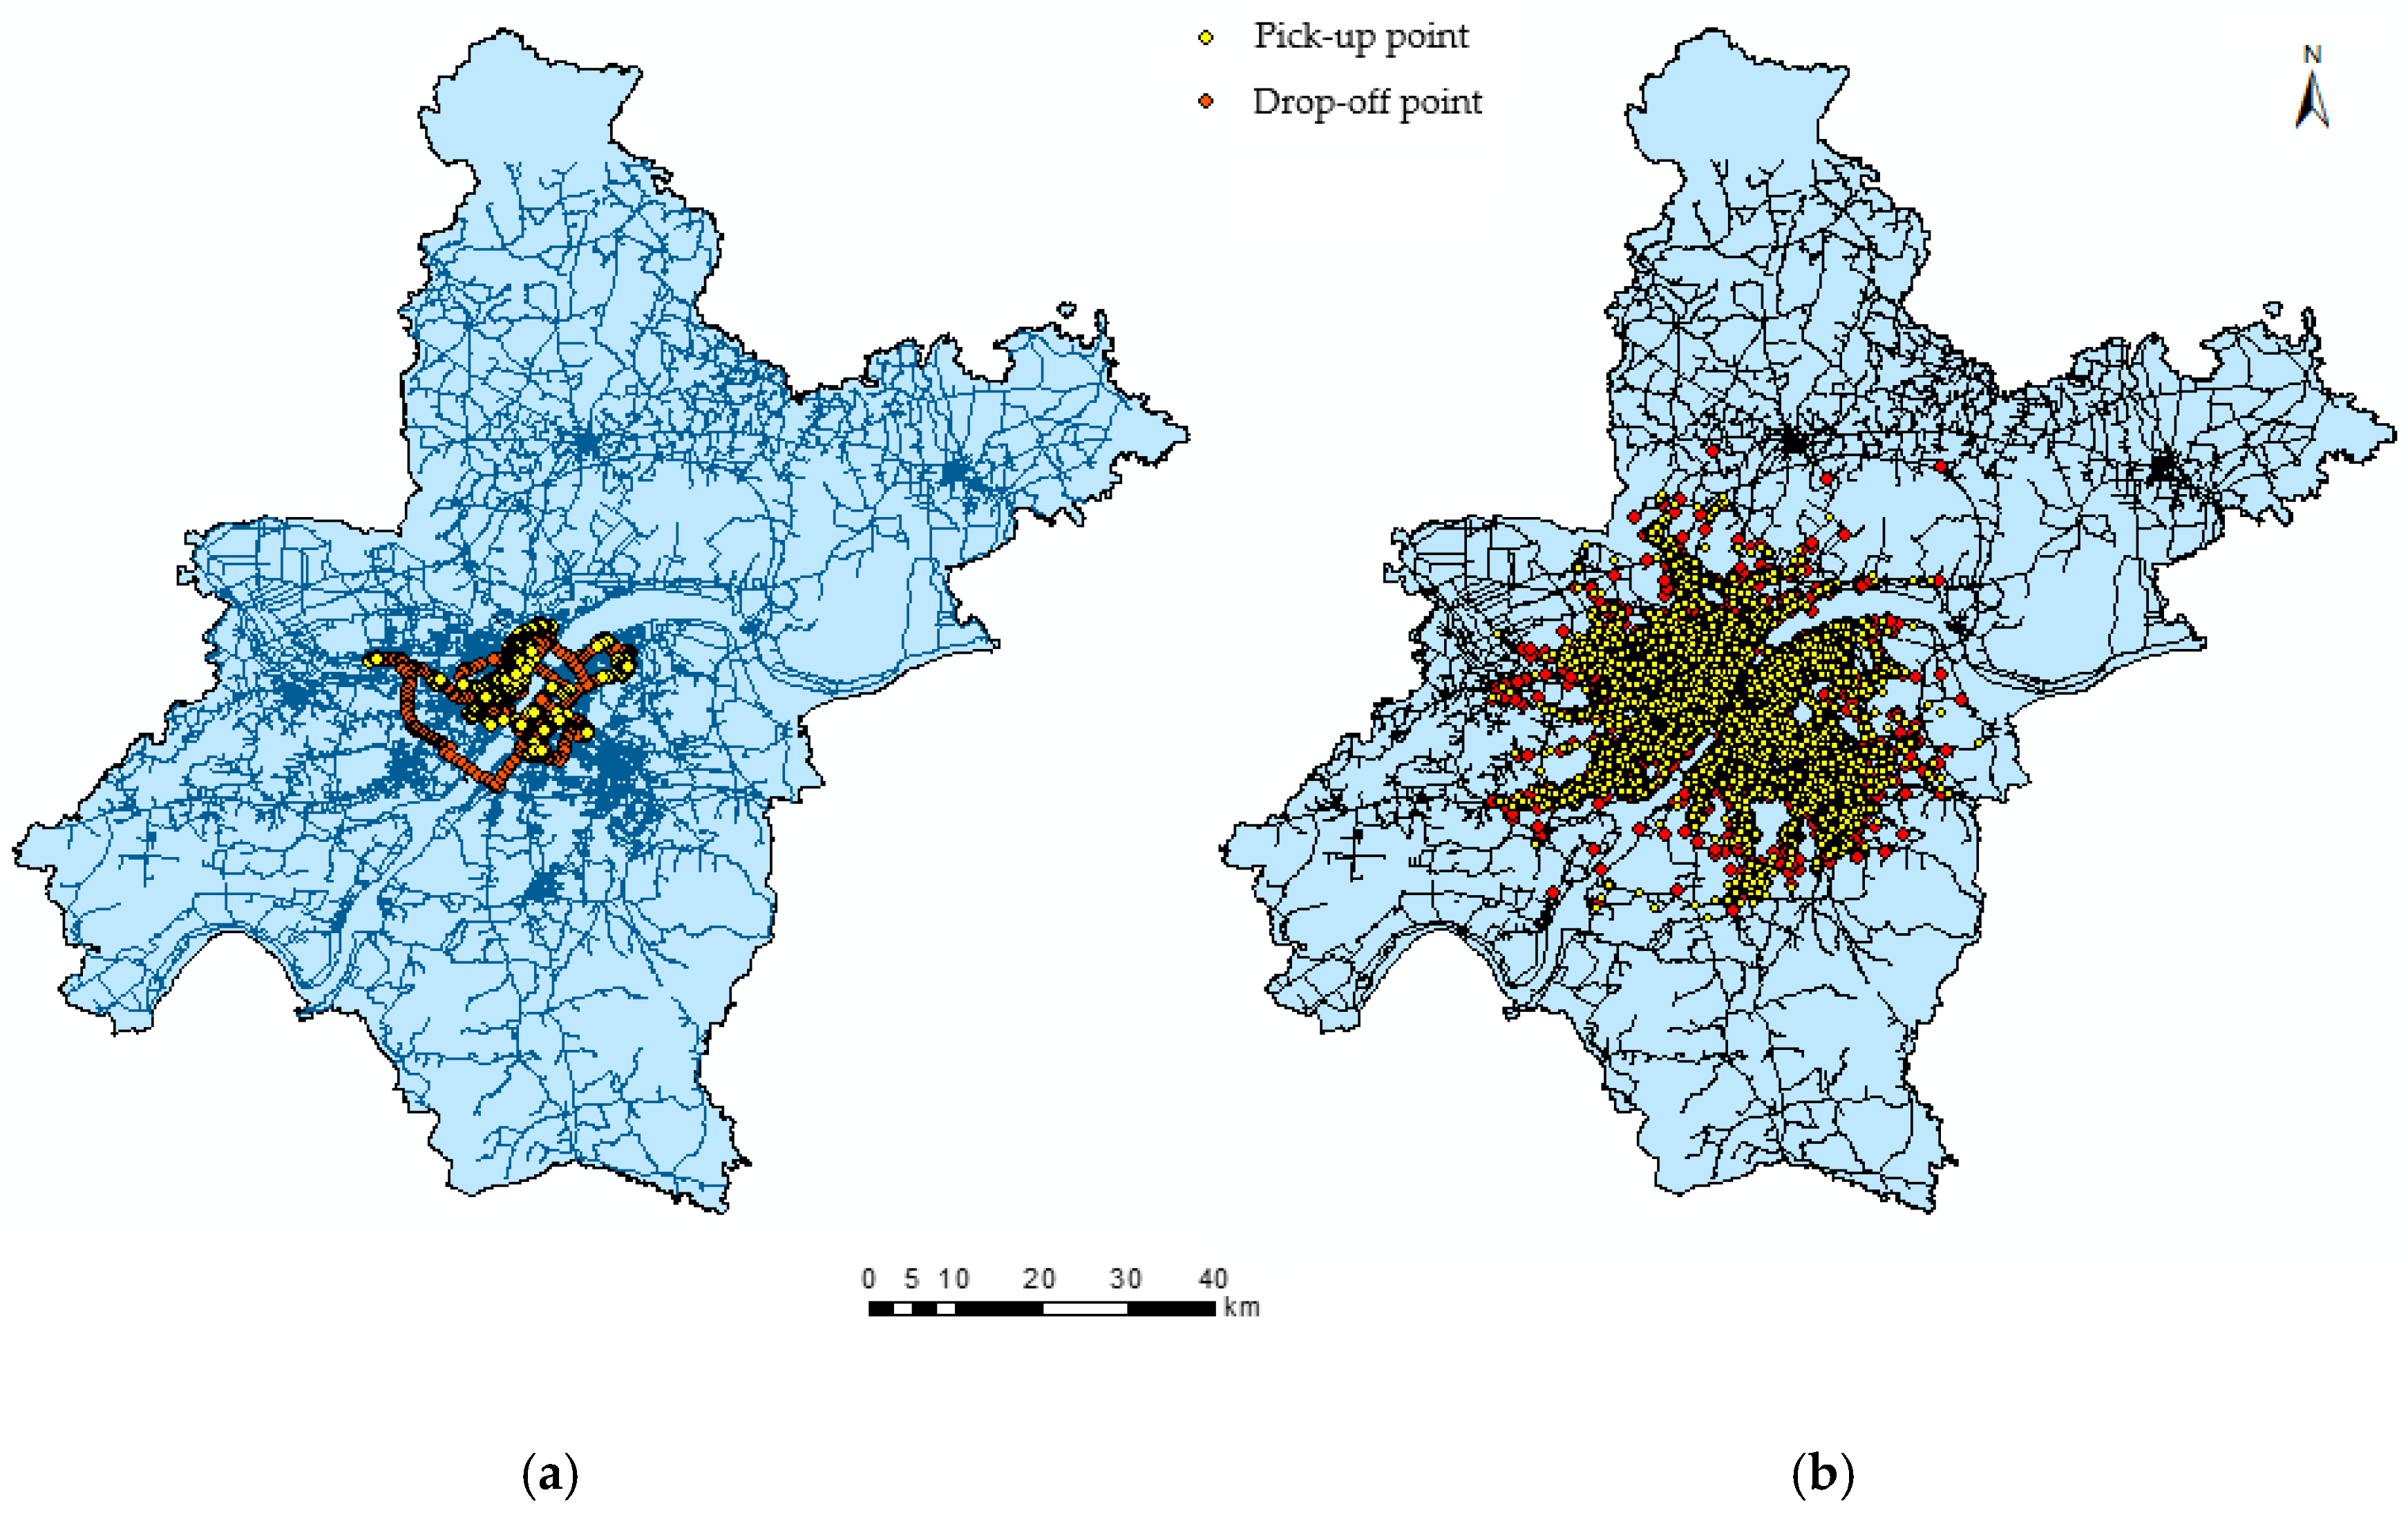
2.1. Trip Extraction
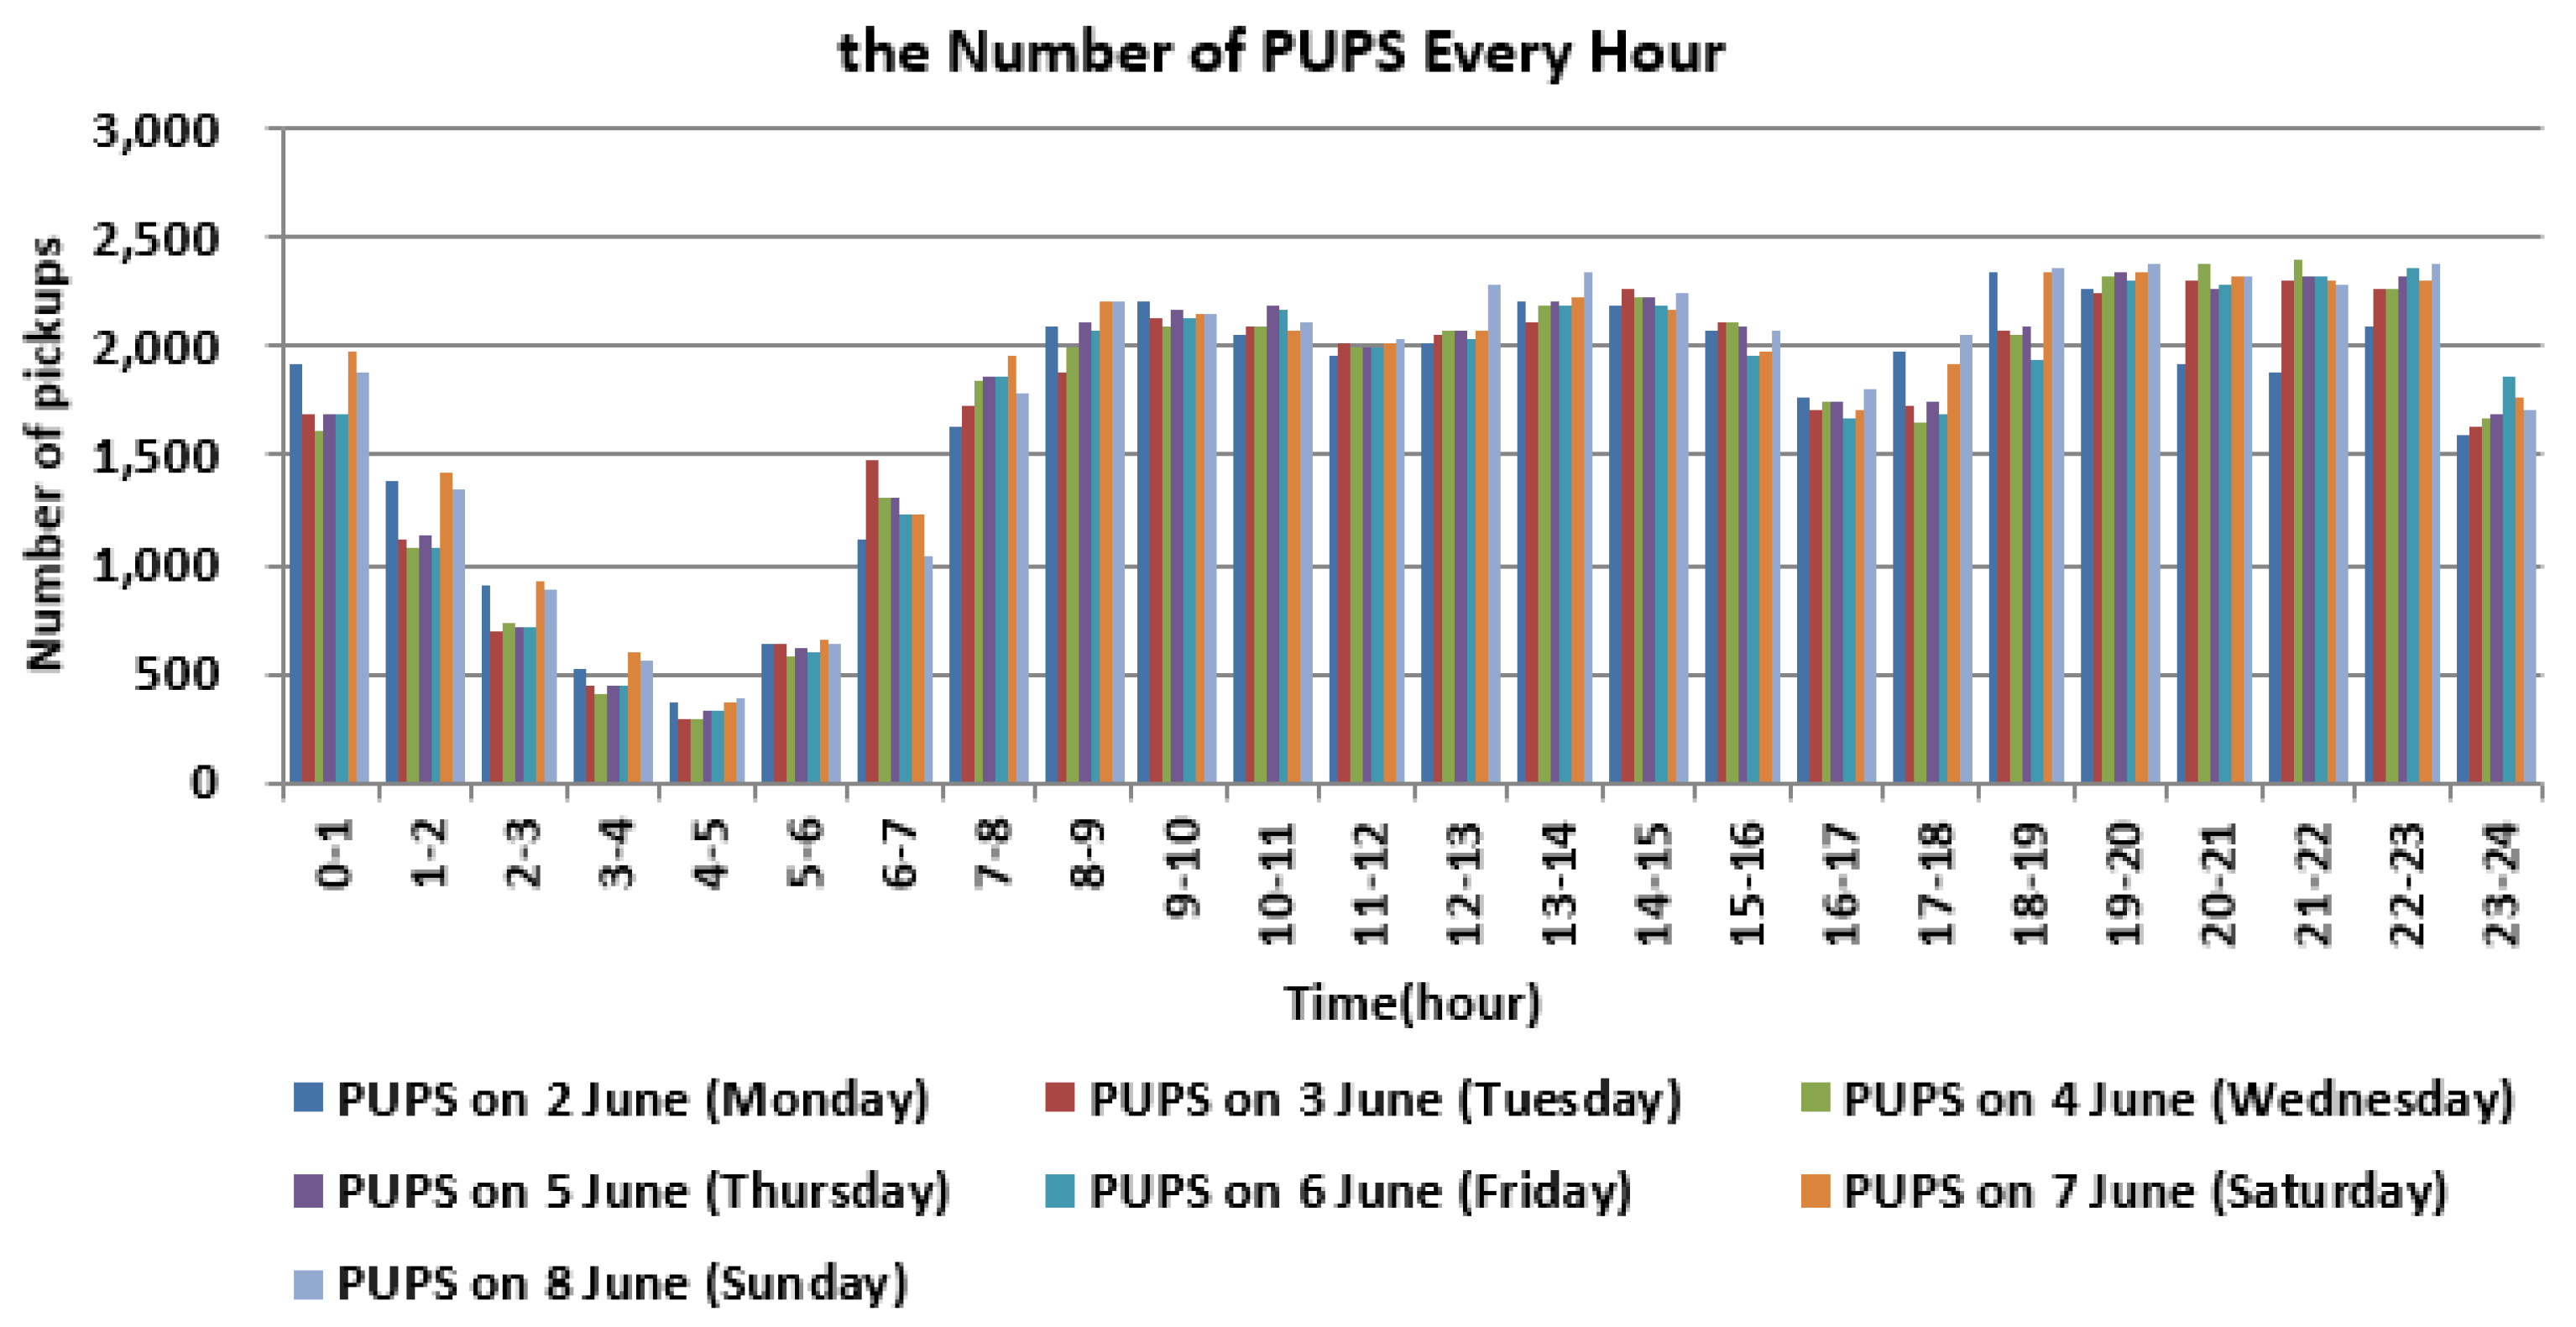
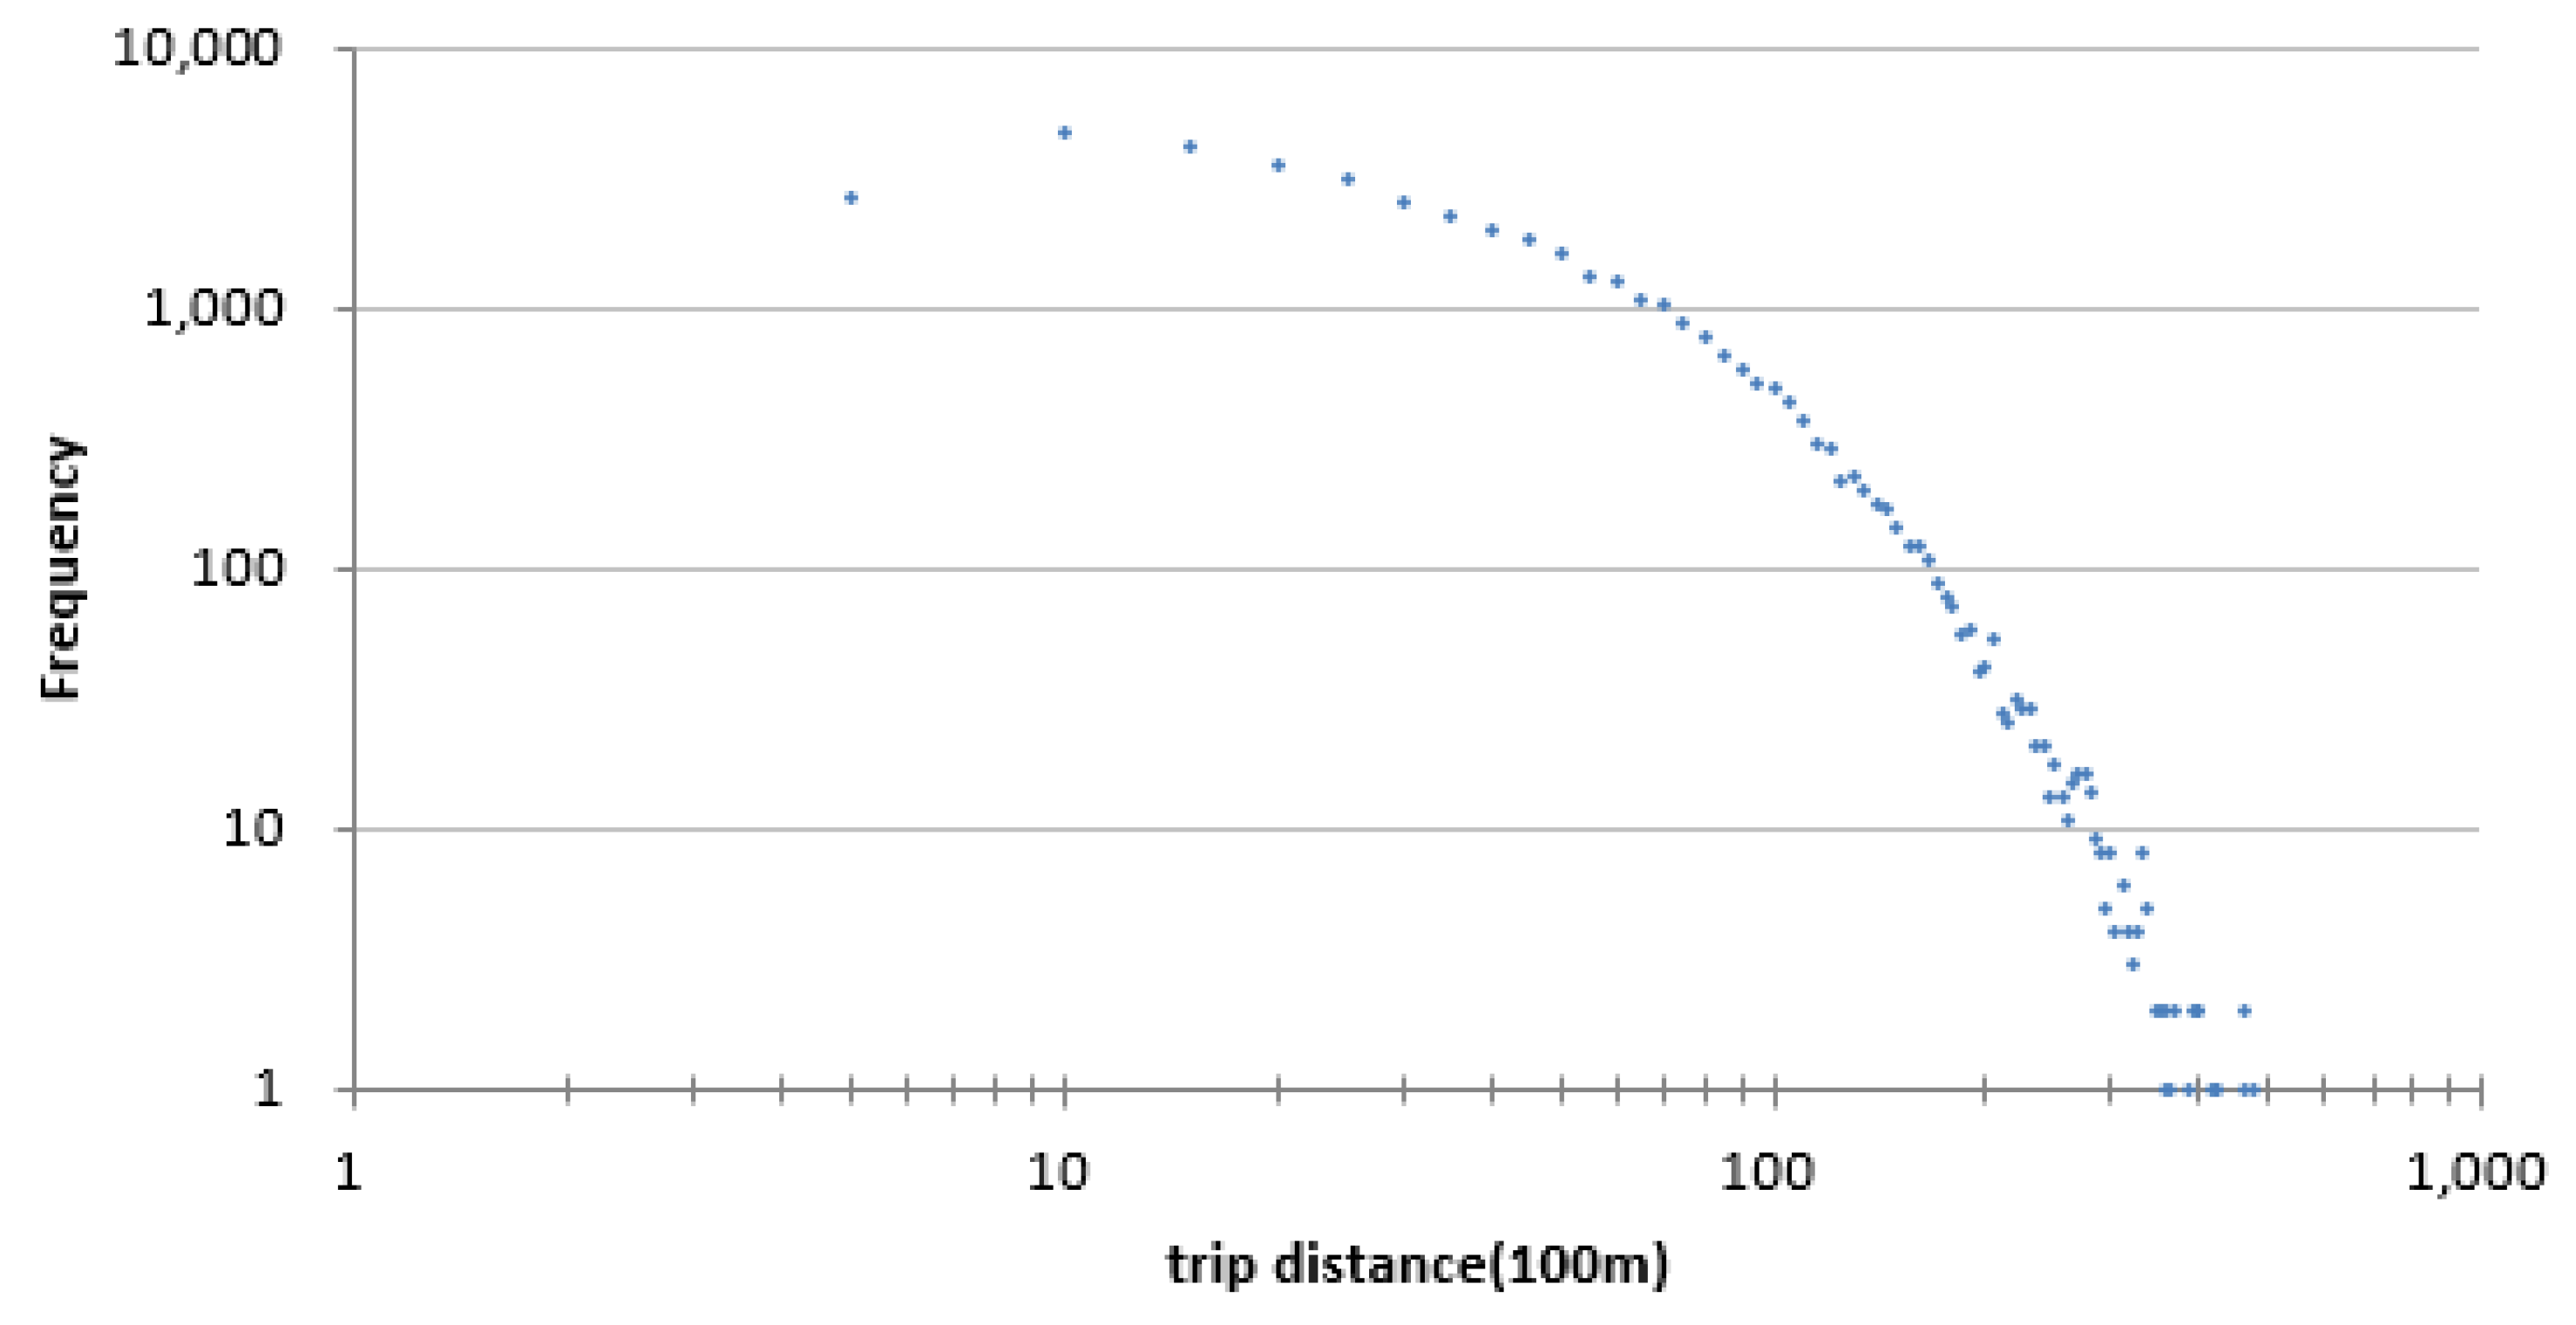
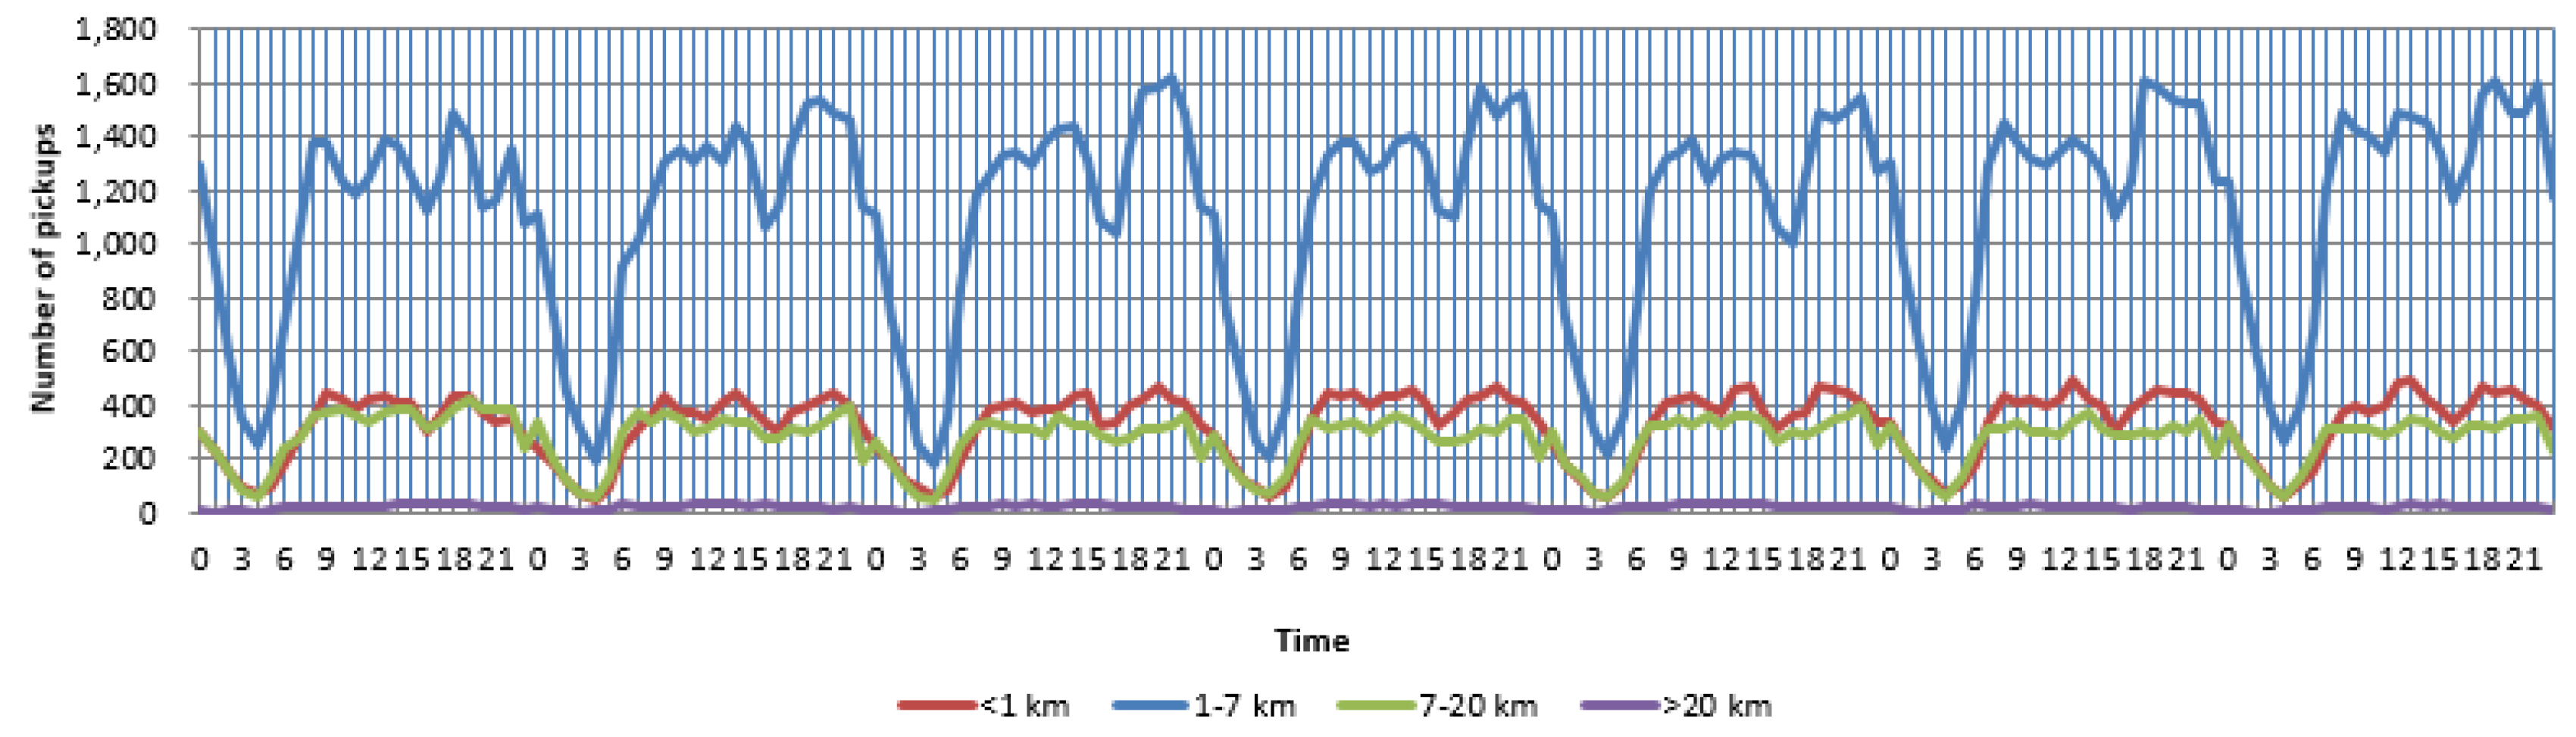
2.2. Distribution of Trips
3. Semantic Analysis
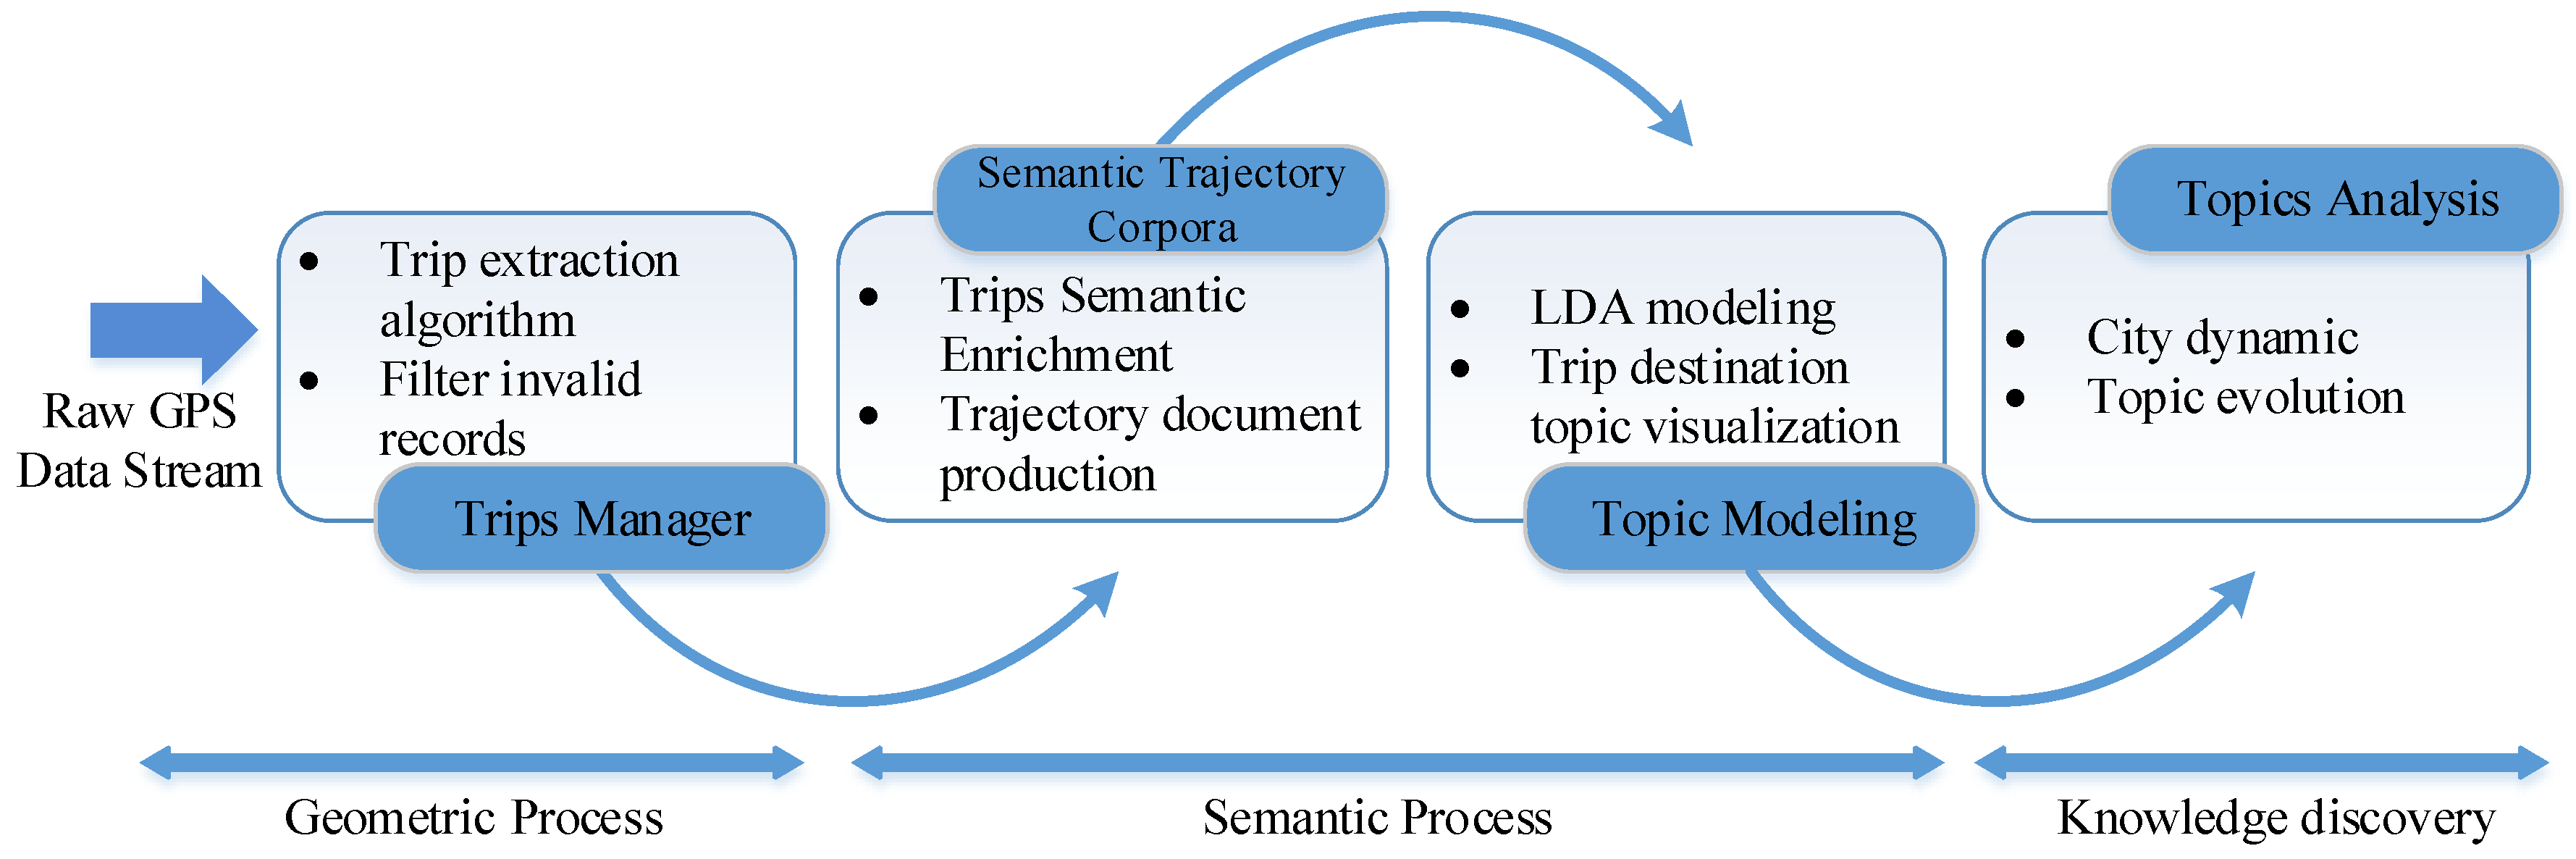
4. Trip Topic Modeling with LDA
4.1. Latent Dirichlet Allocation

4.2. Significance Definition
5. Trip Topic Analysis of Mobility Patterns in Wuhan
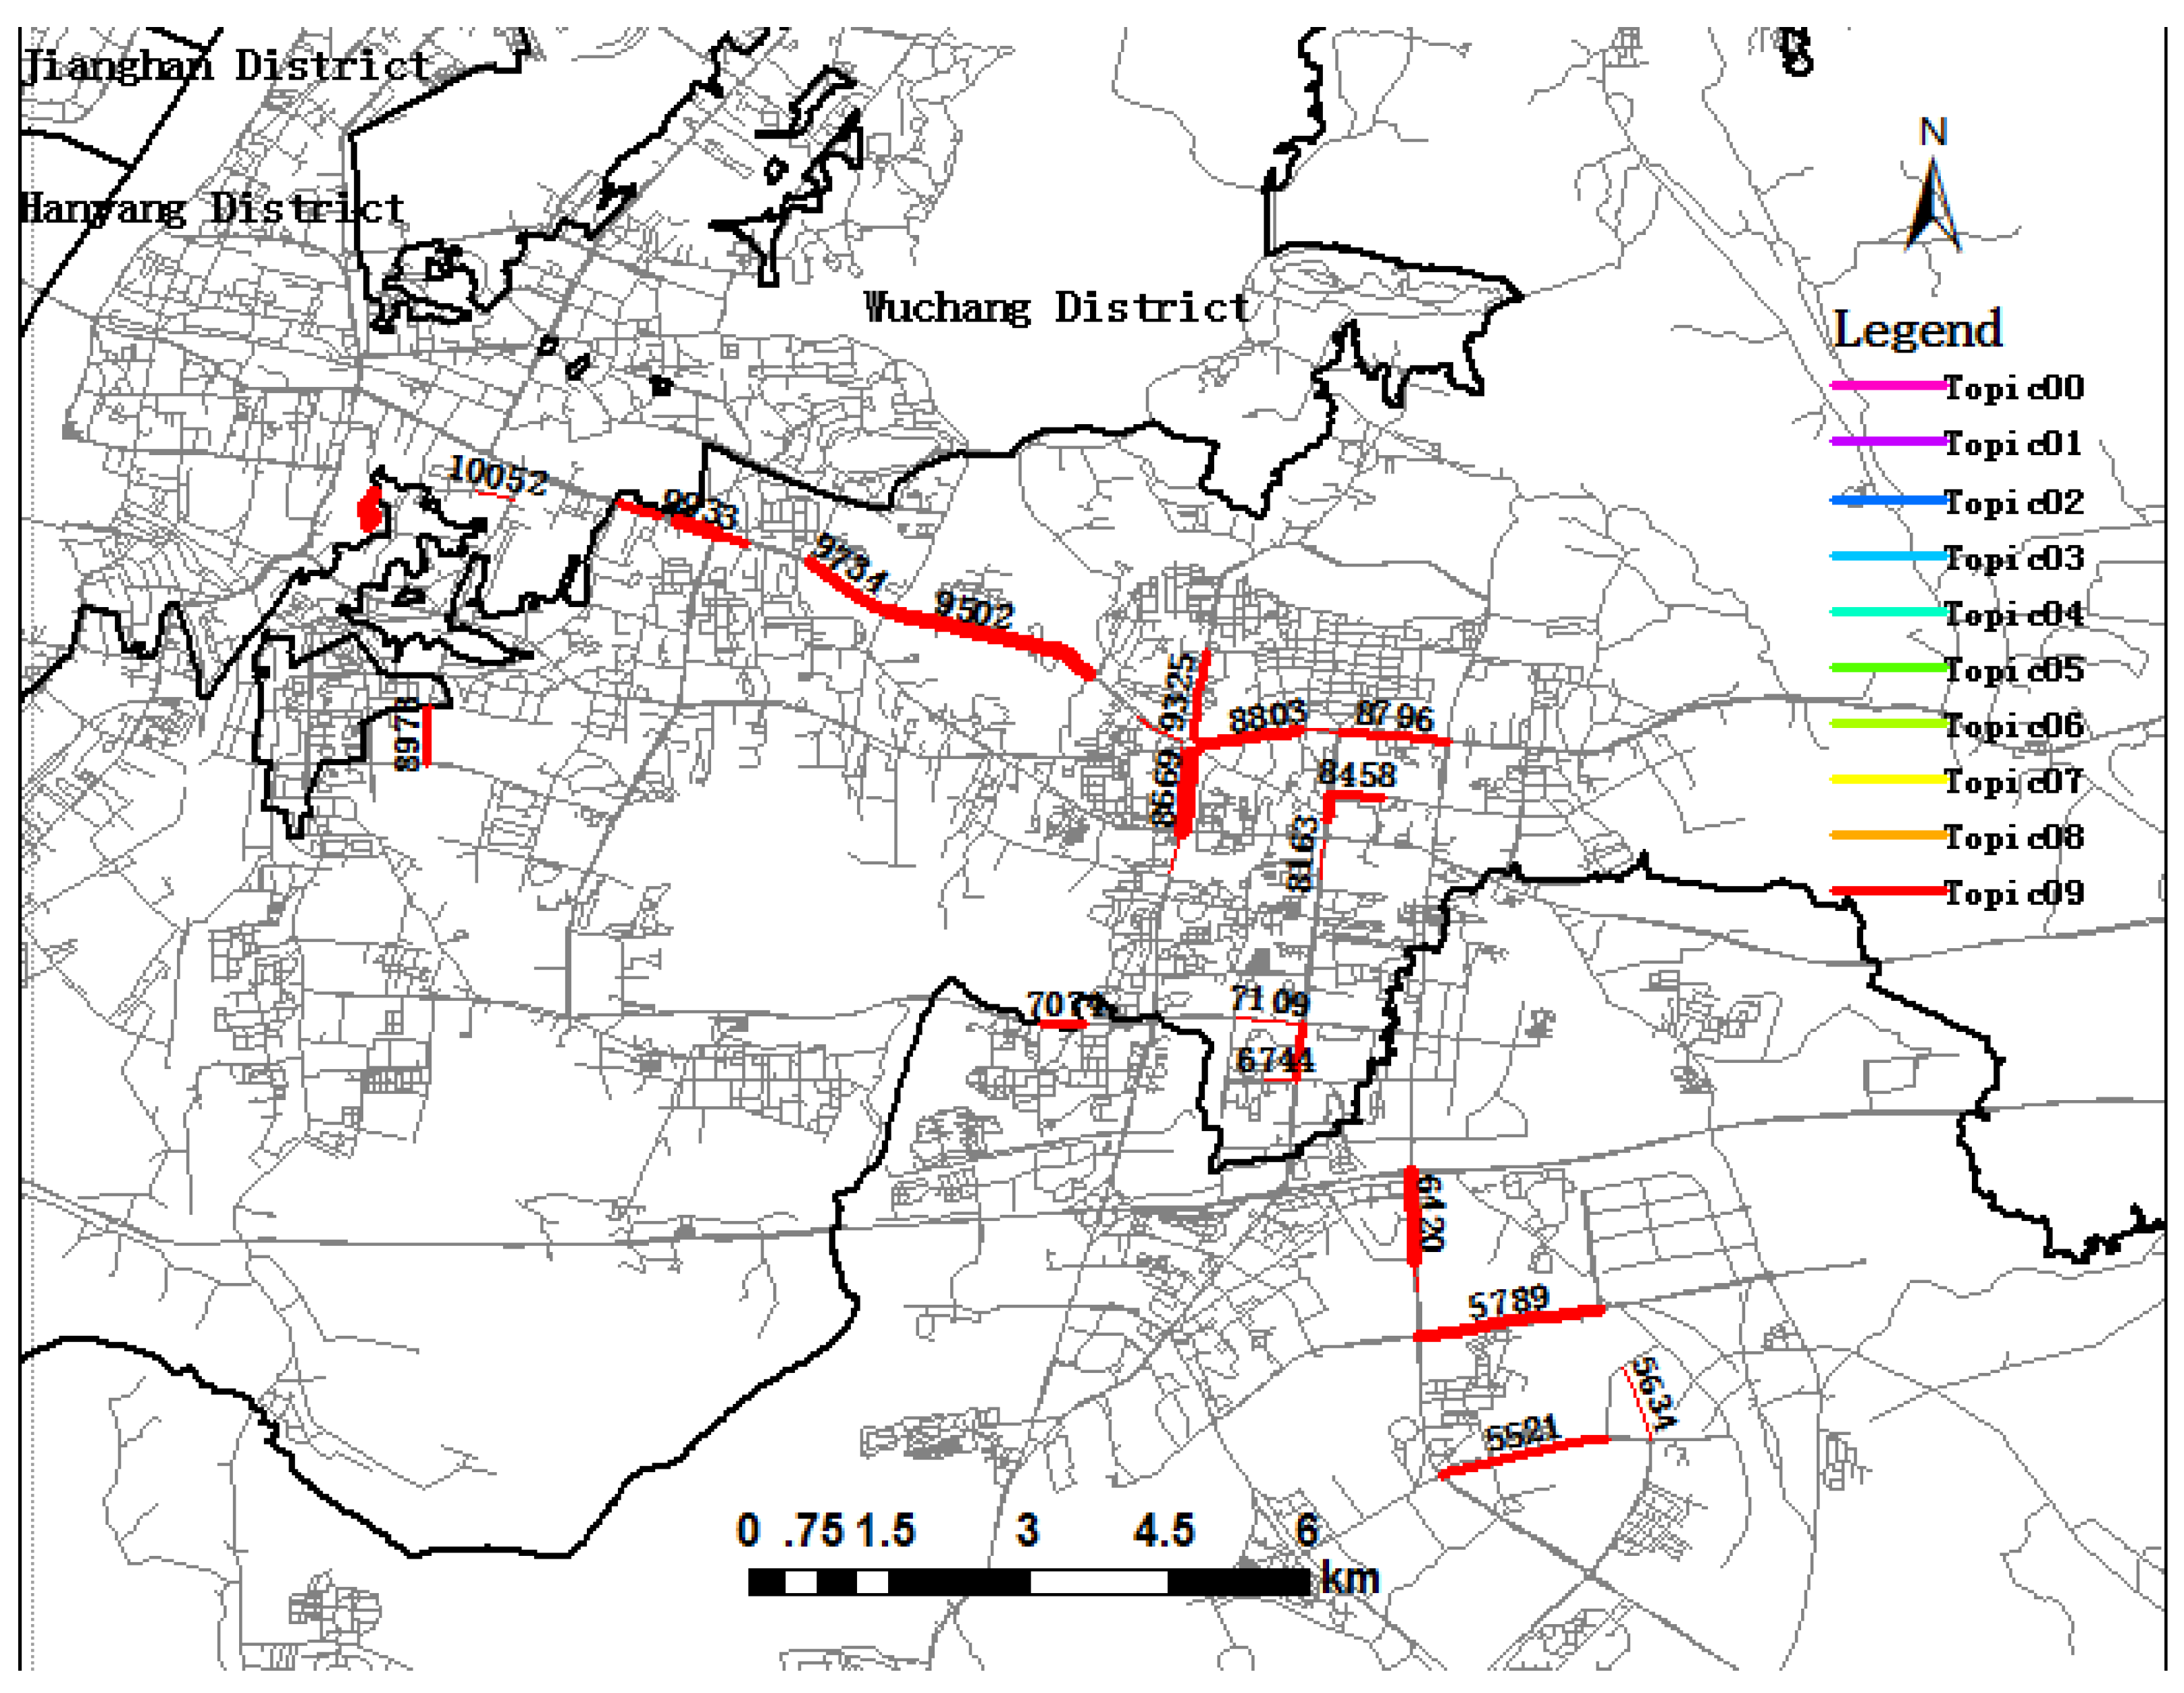
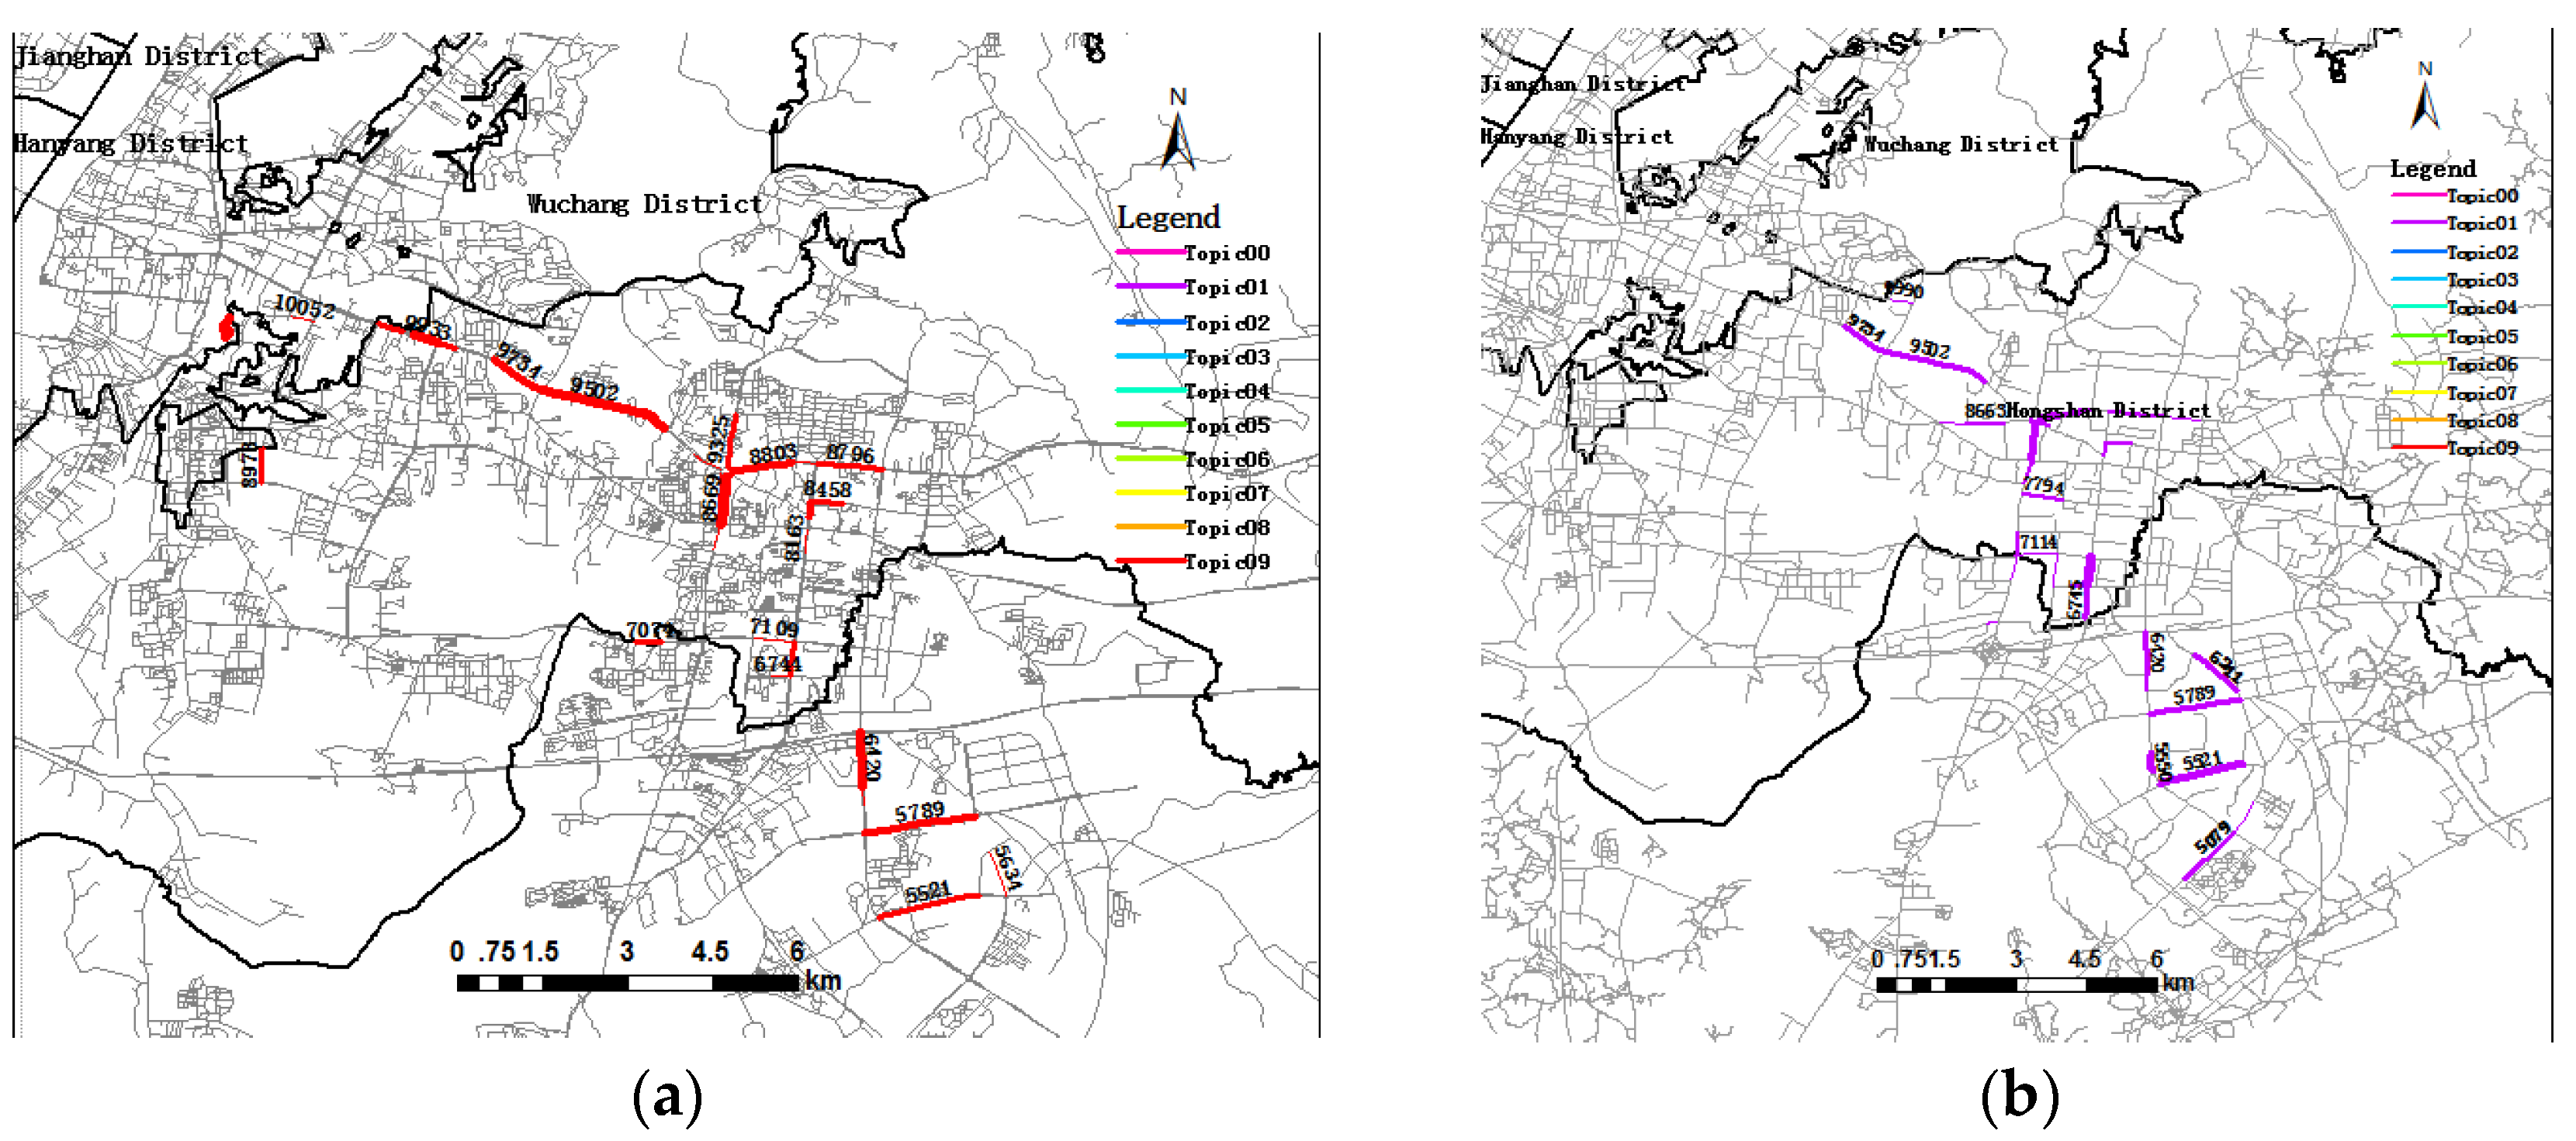
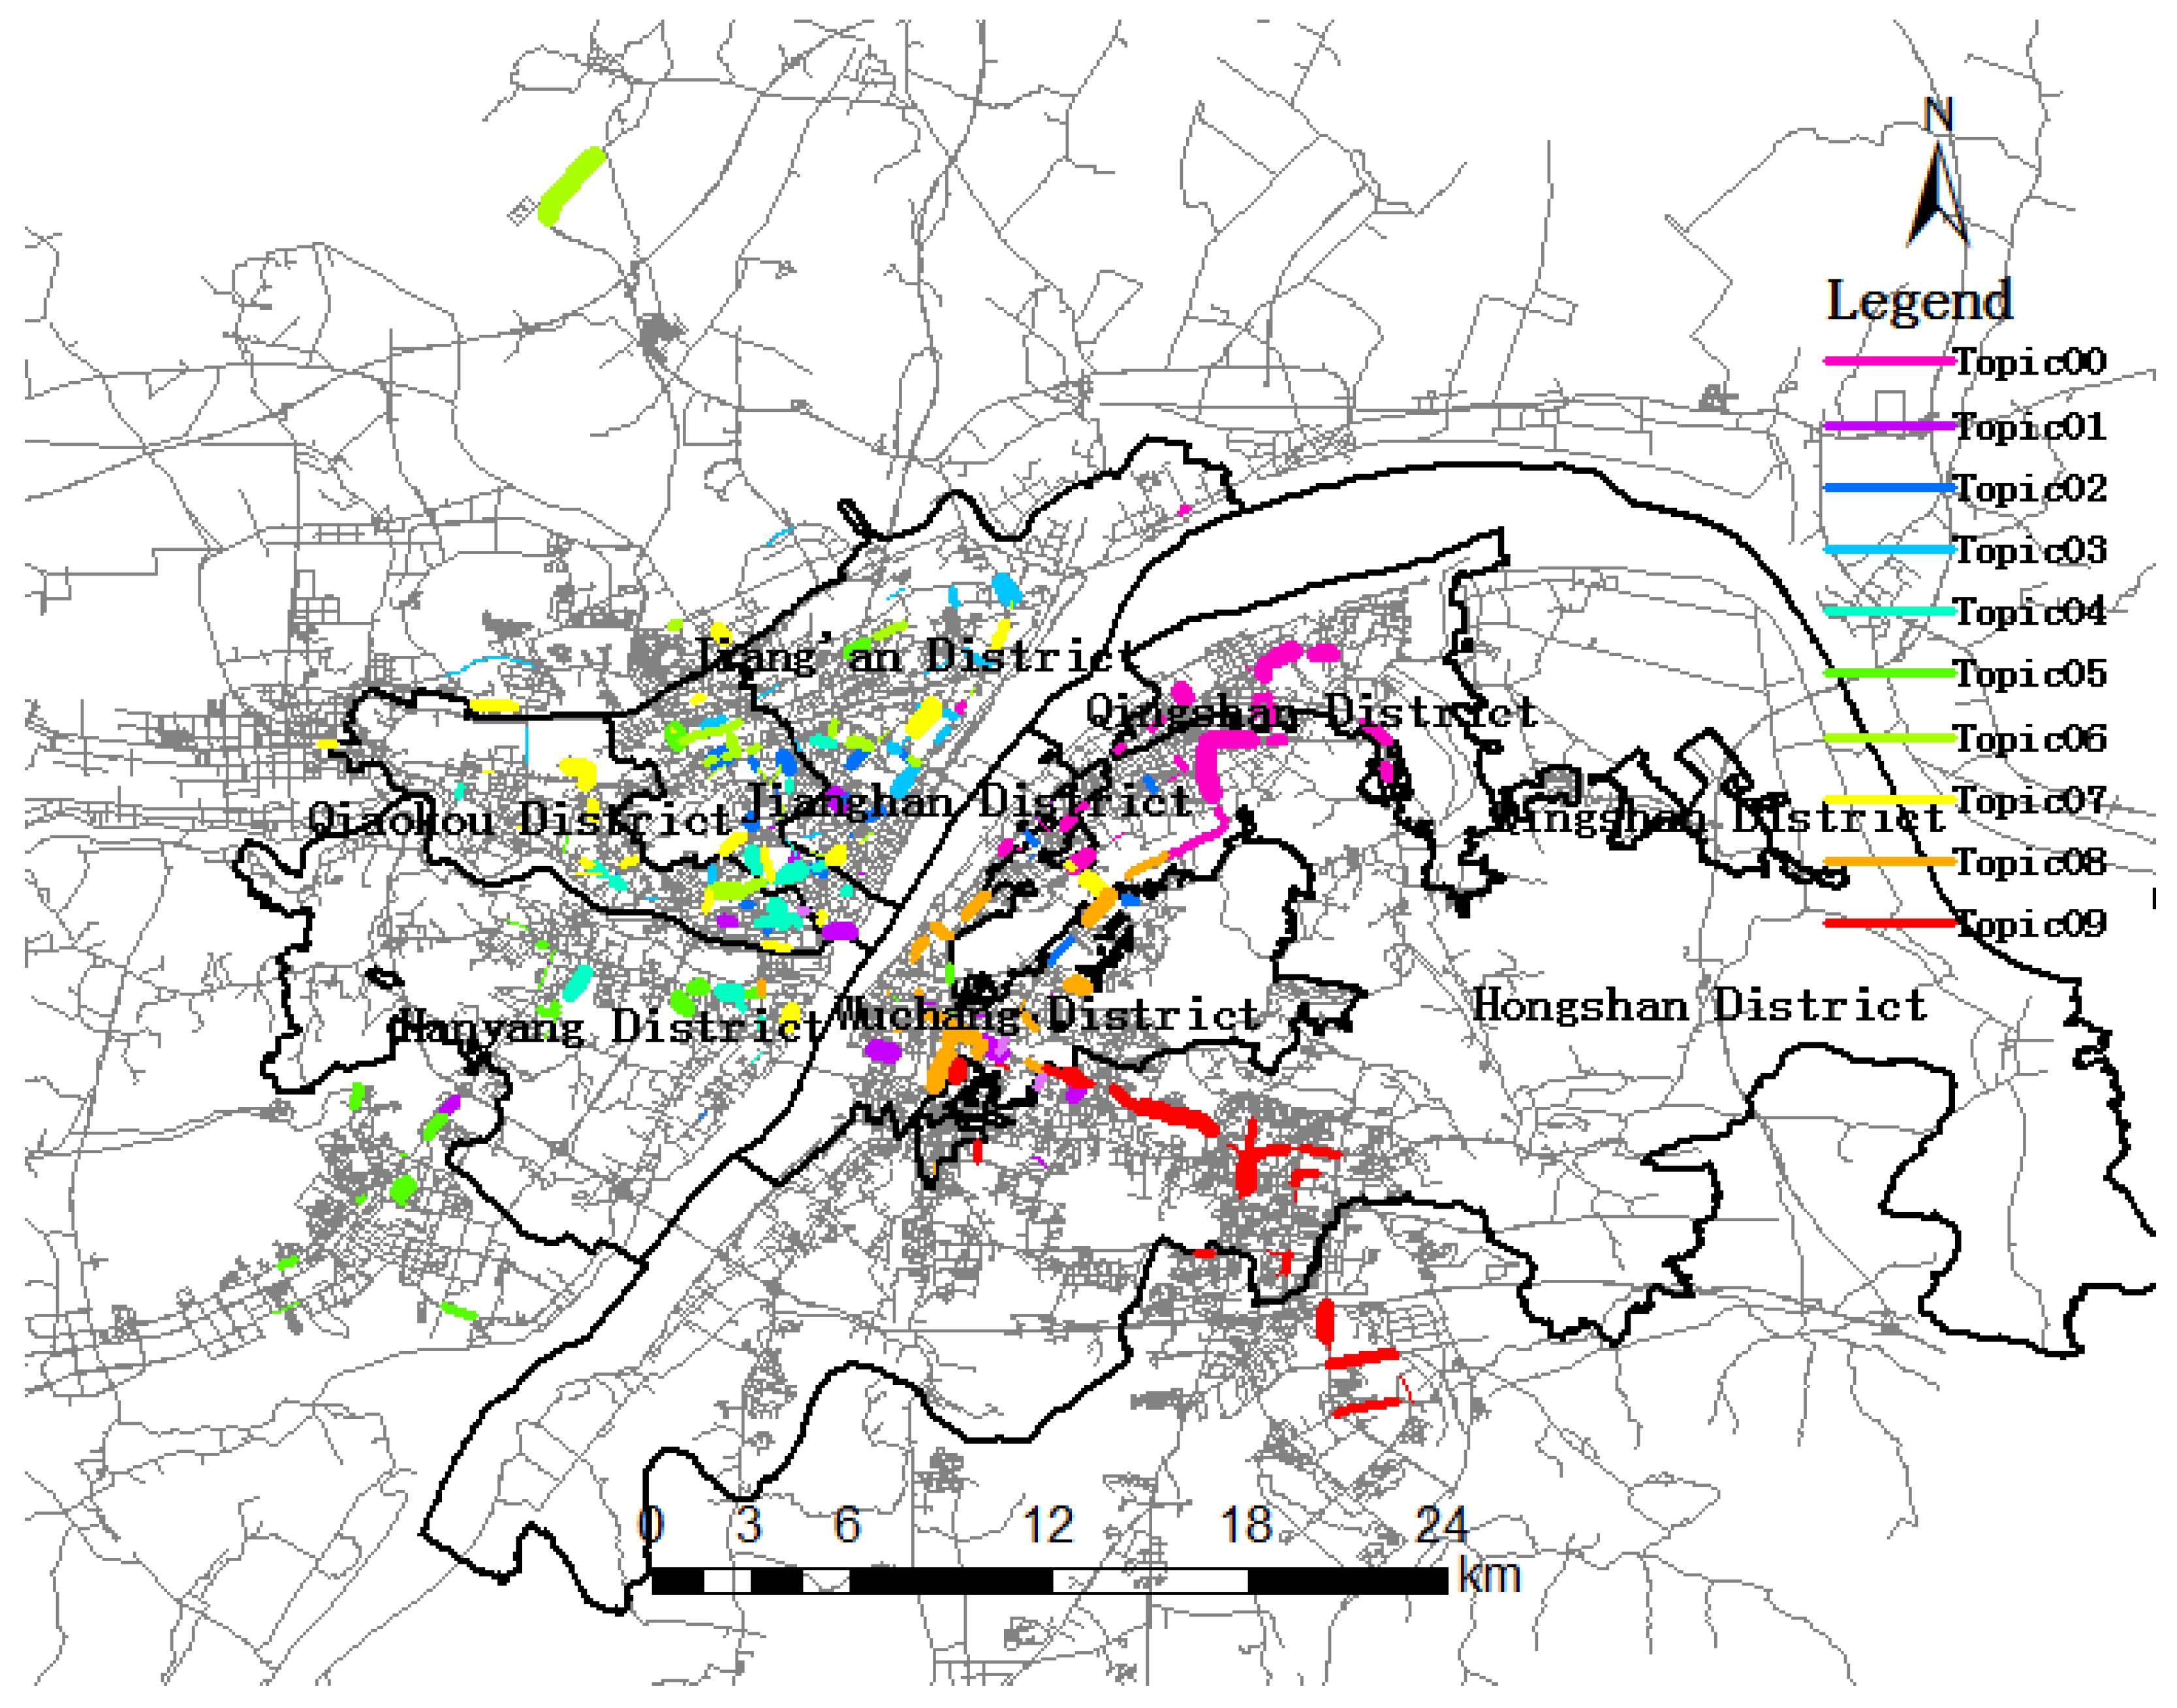
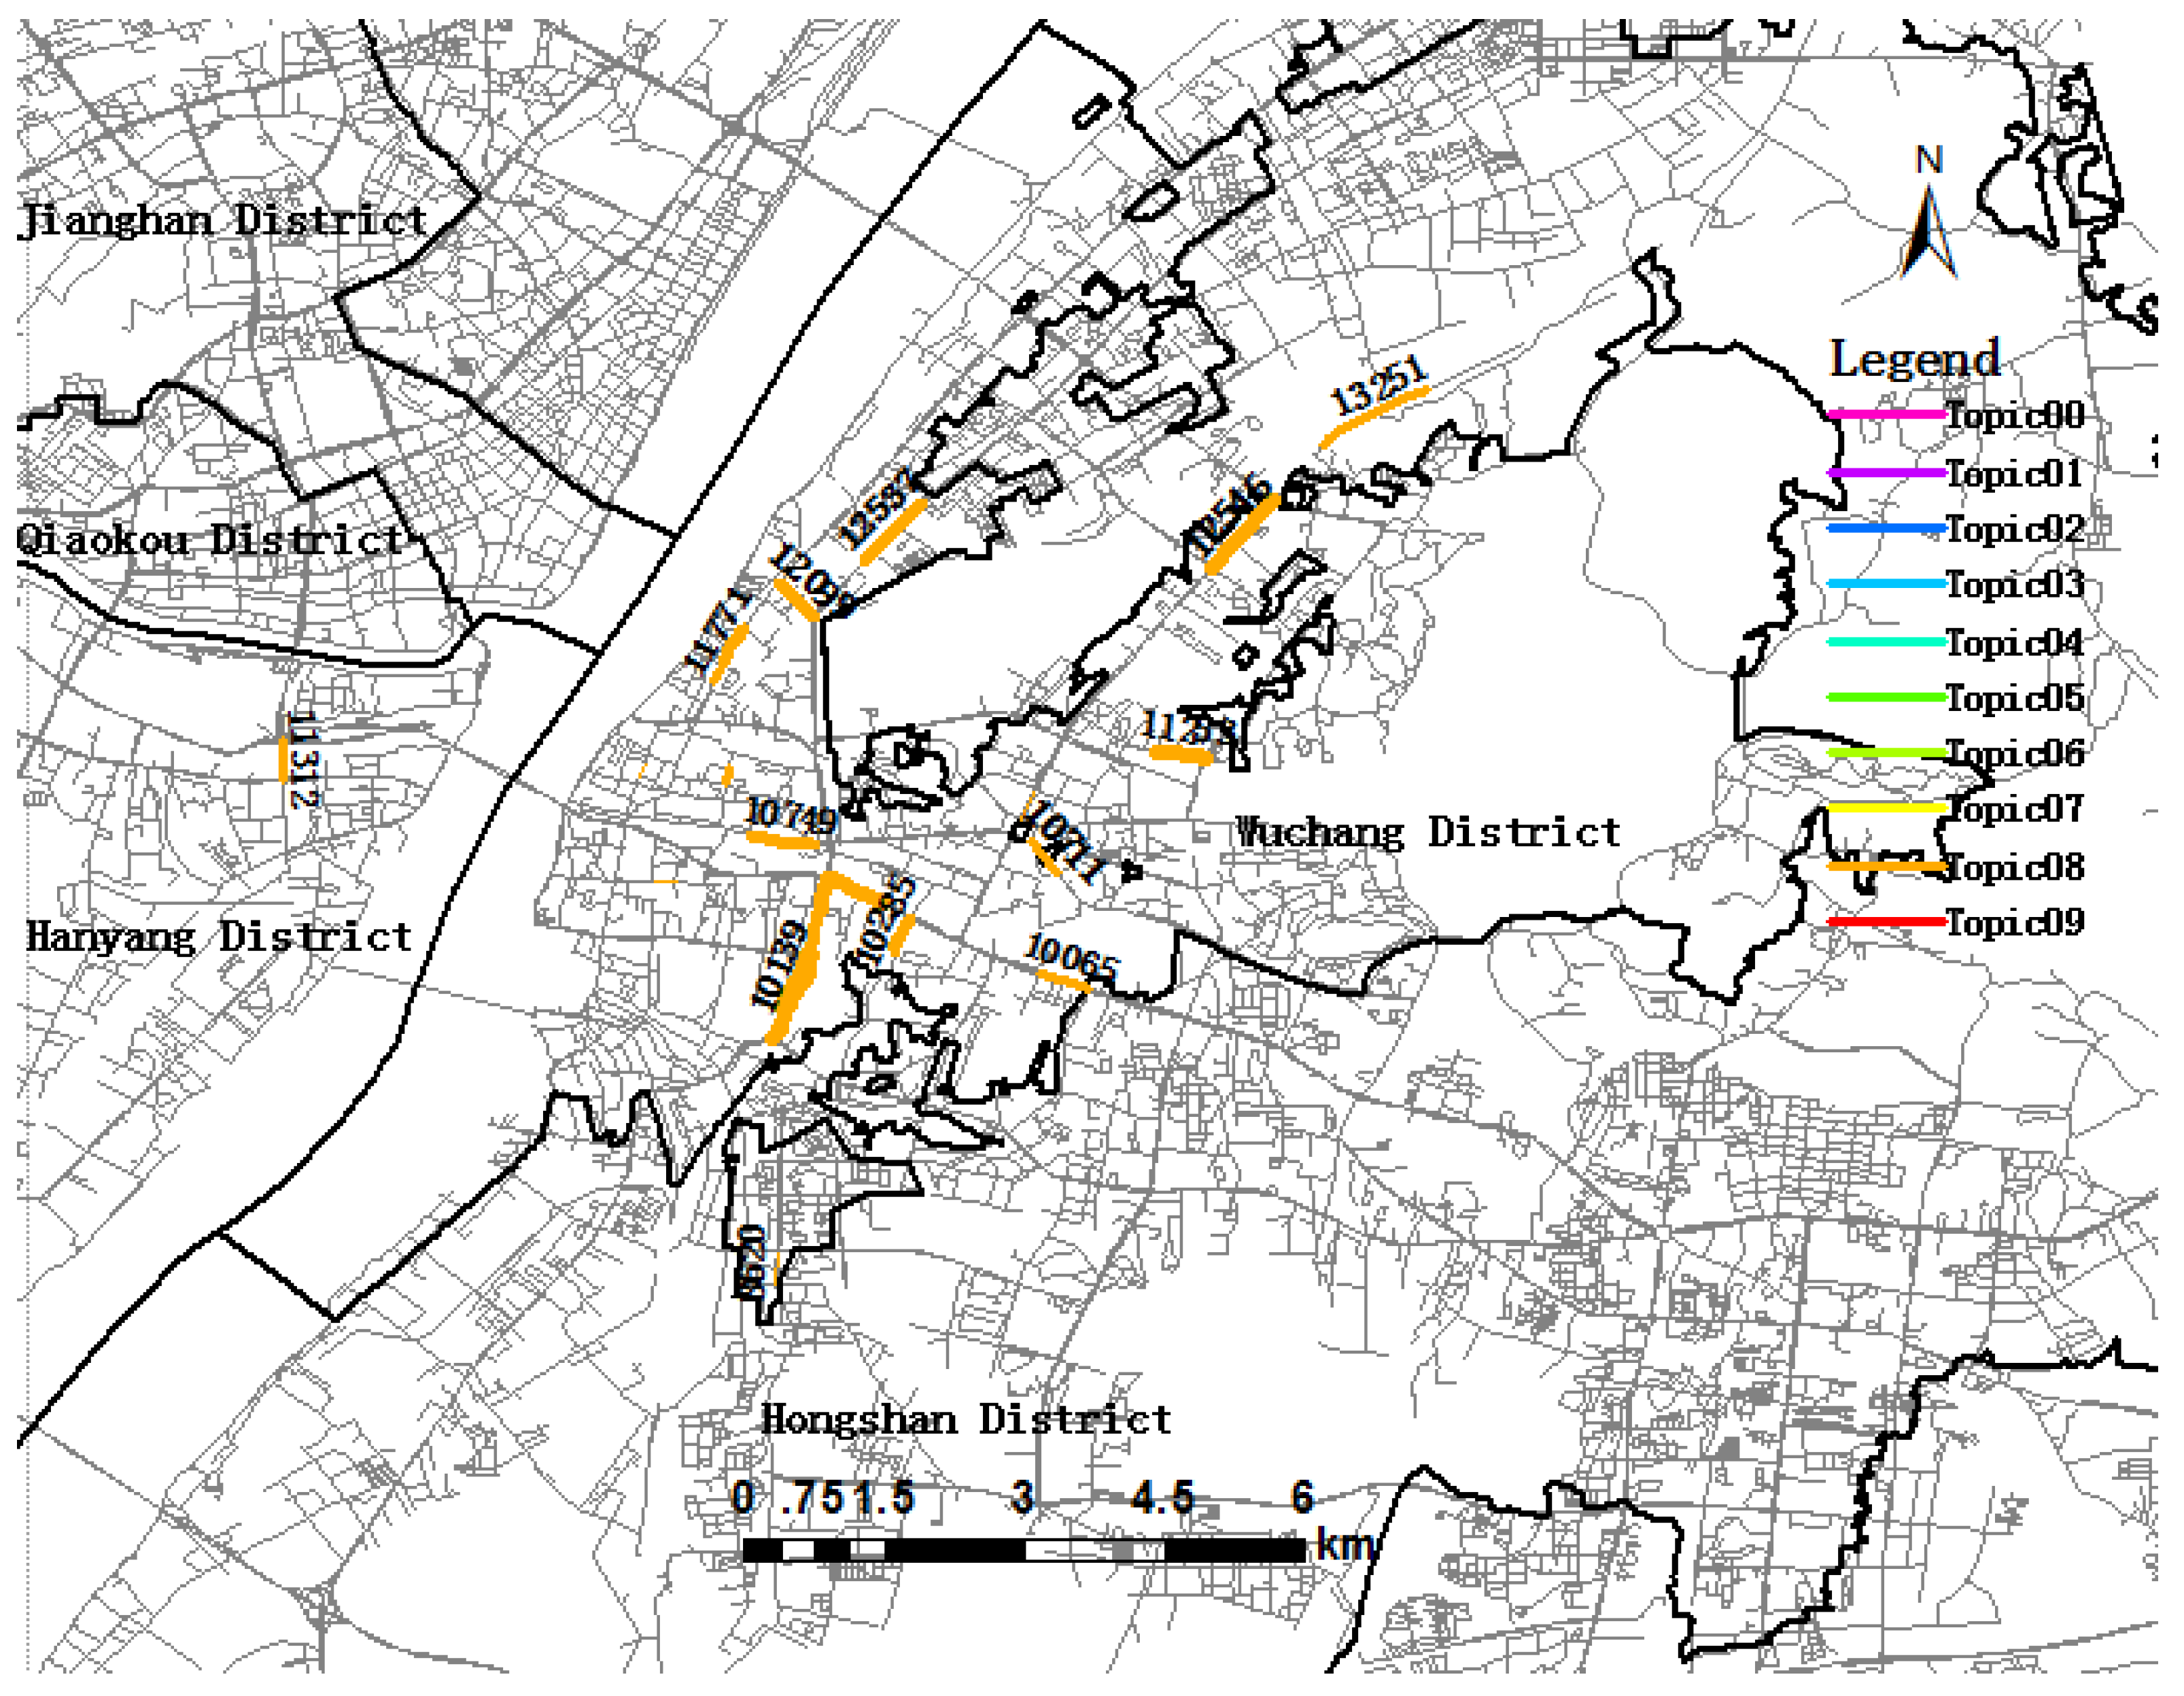
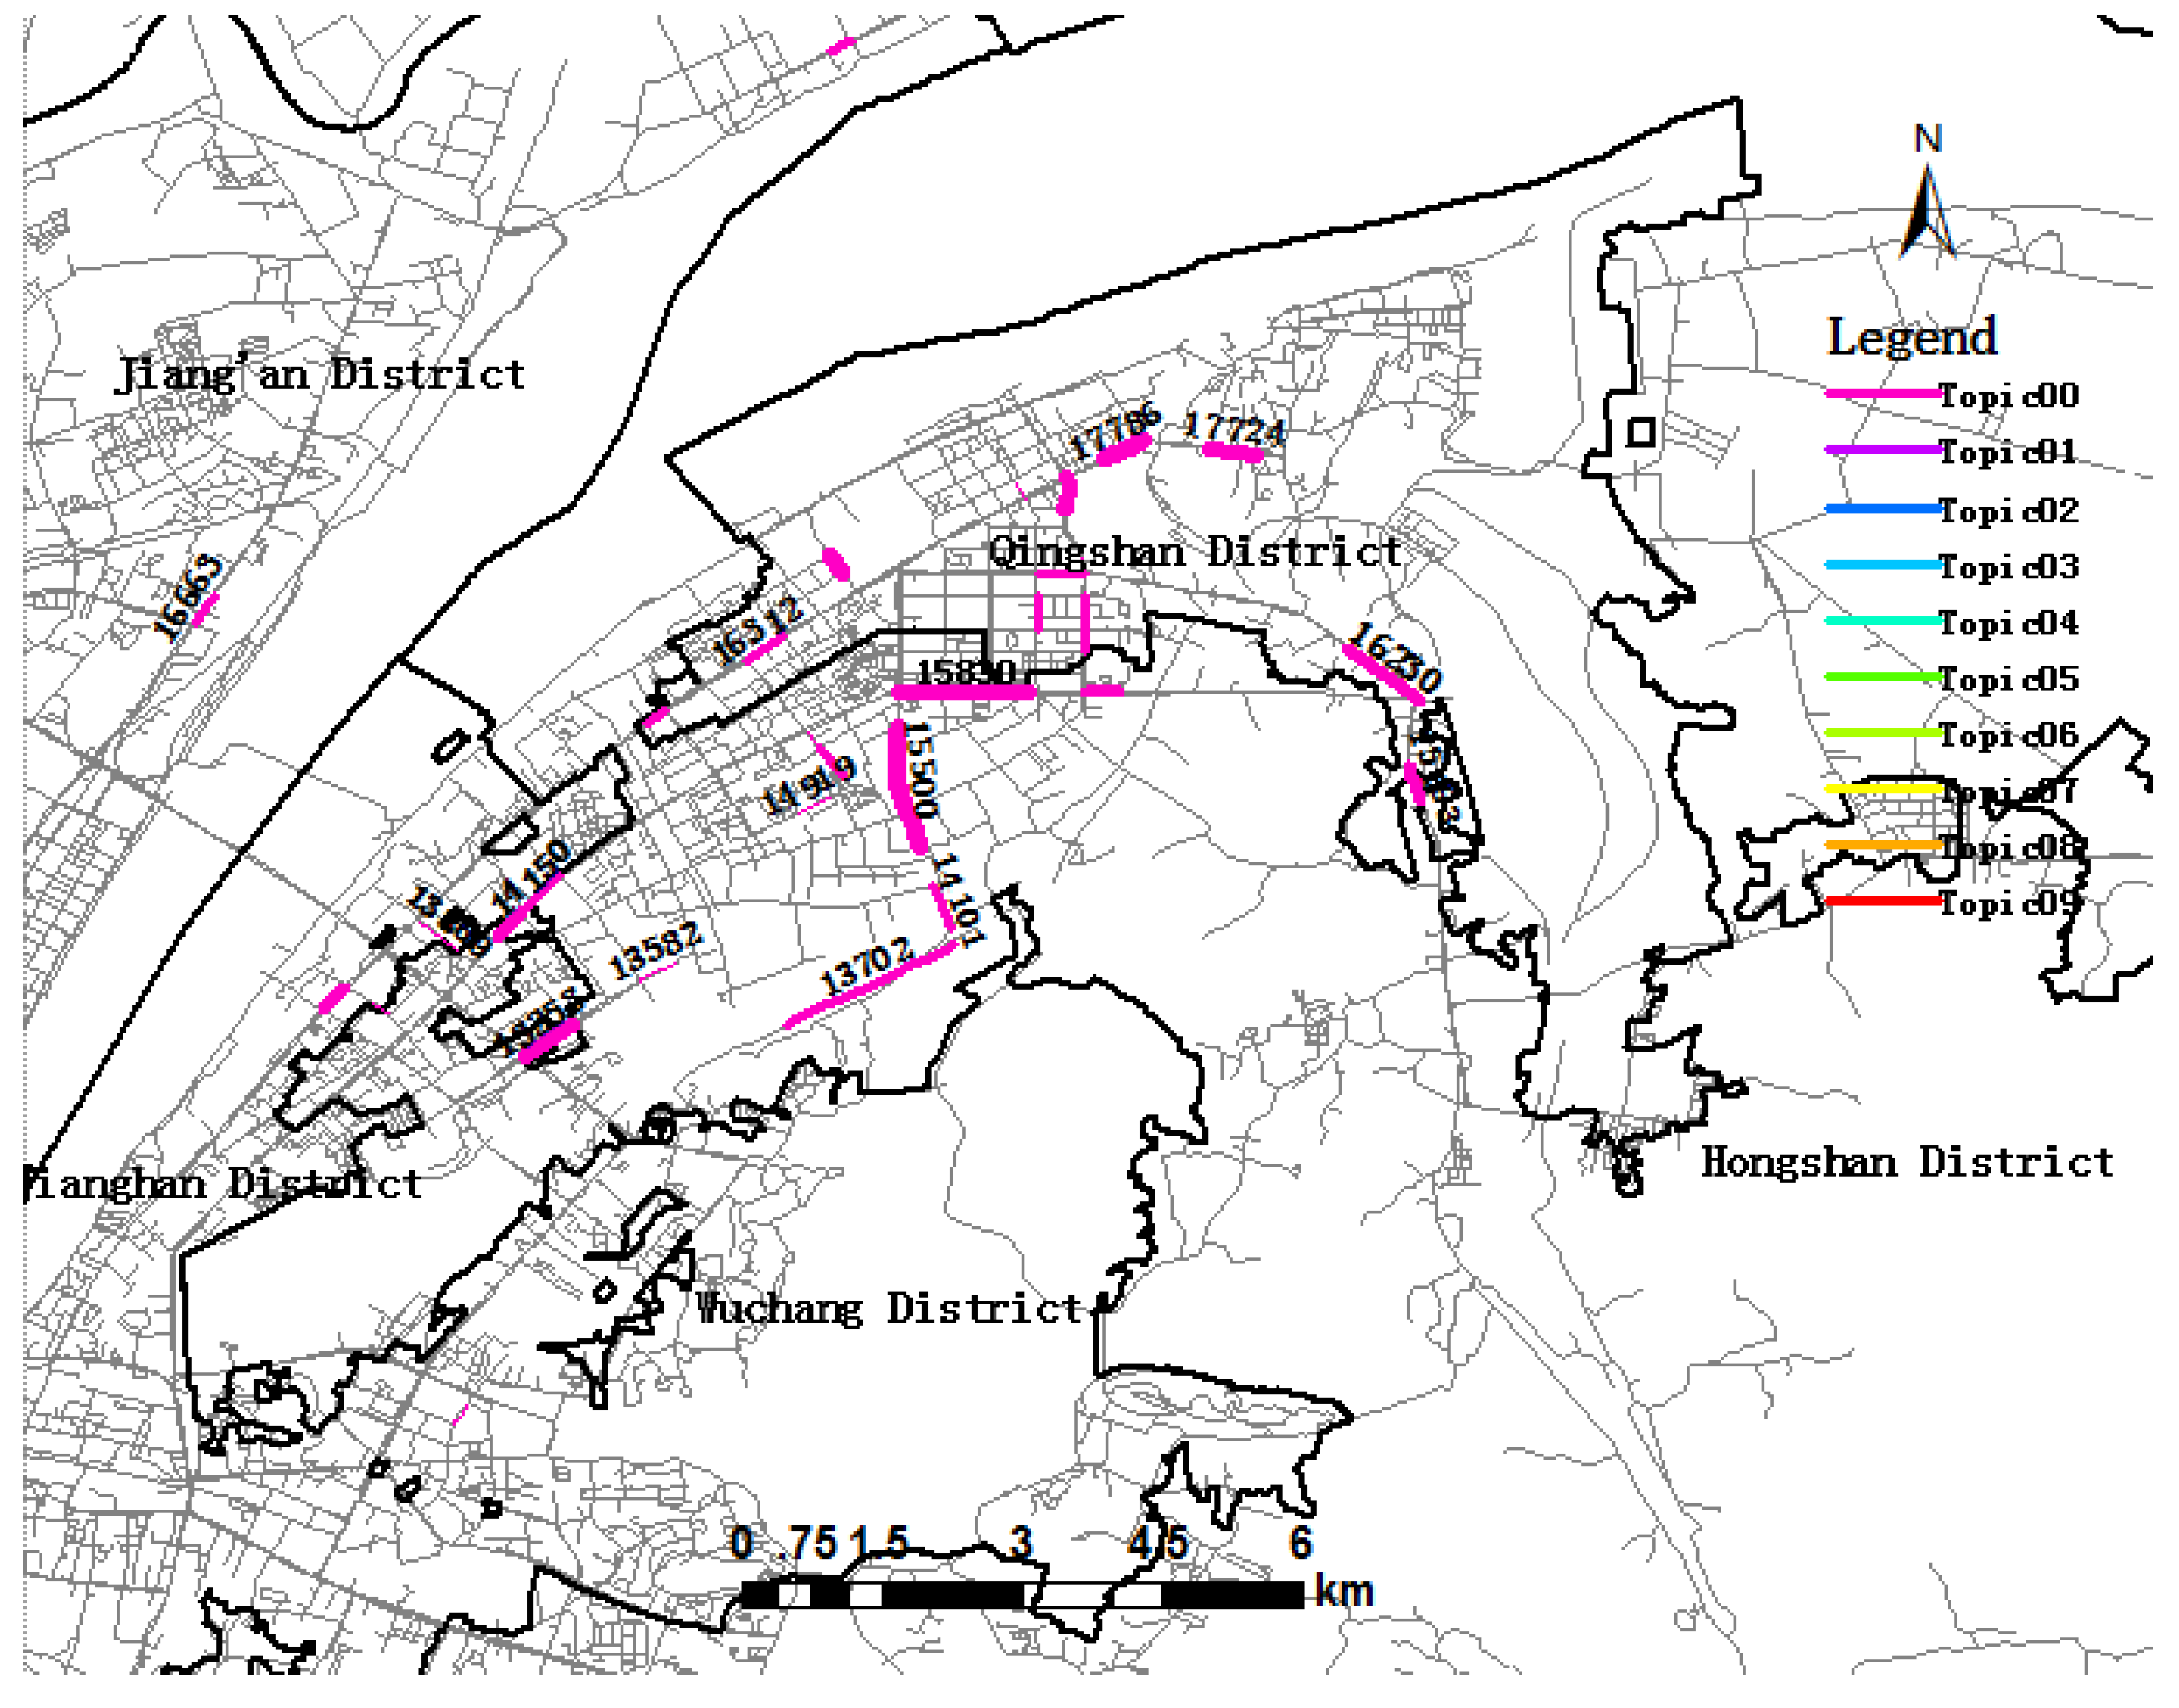
5.1. Trip Topic Extraction and Visualization
5.2. Trip Topic and Urban Dynamics
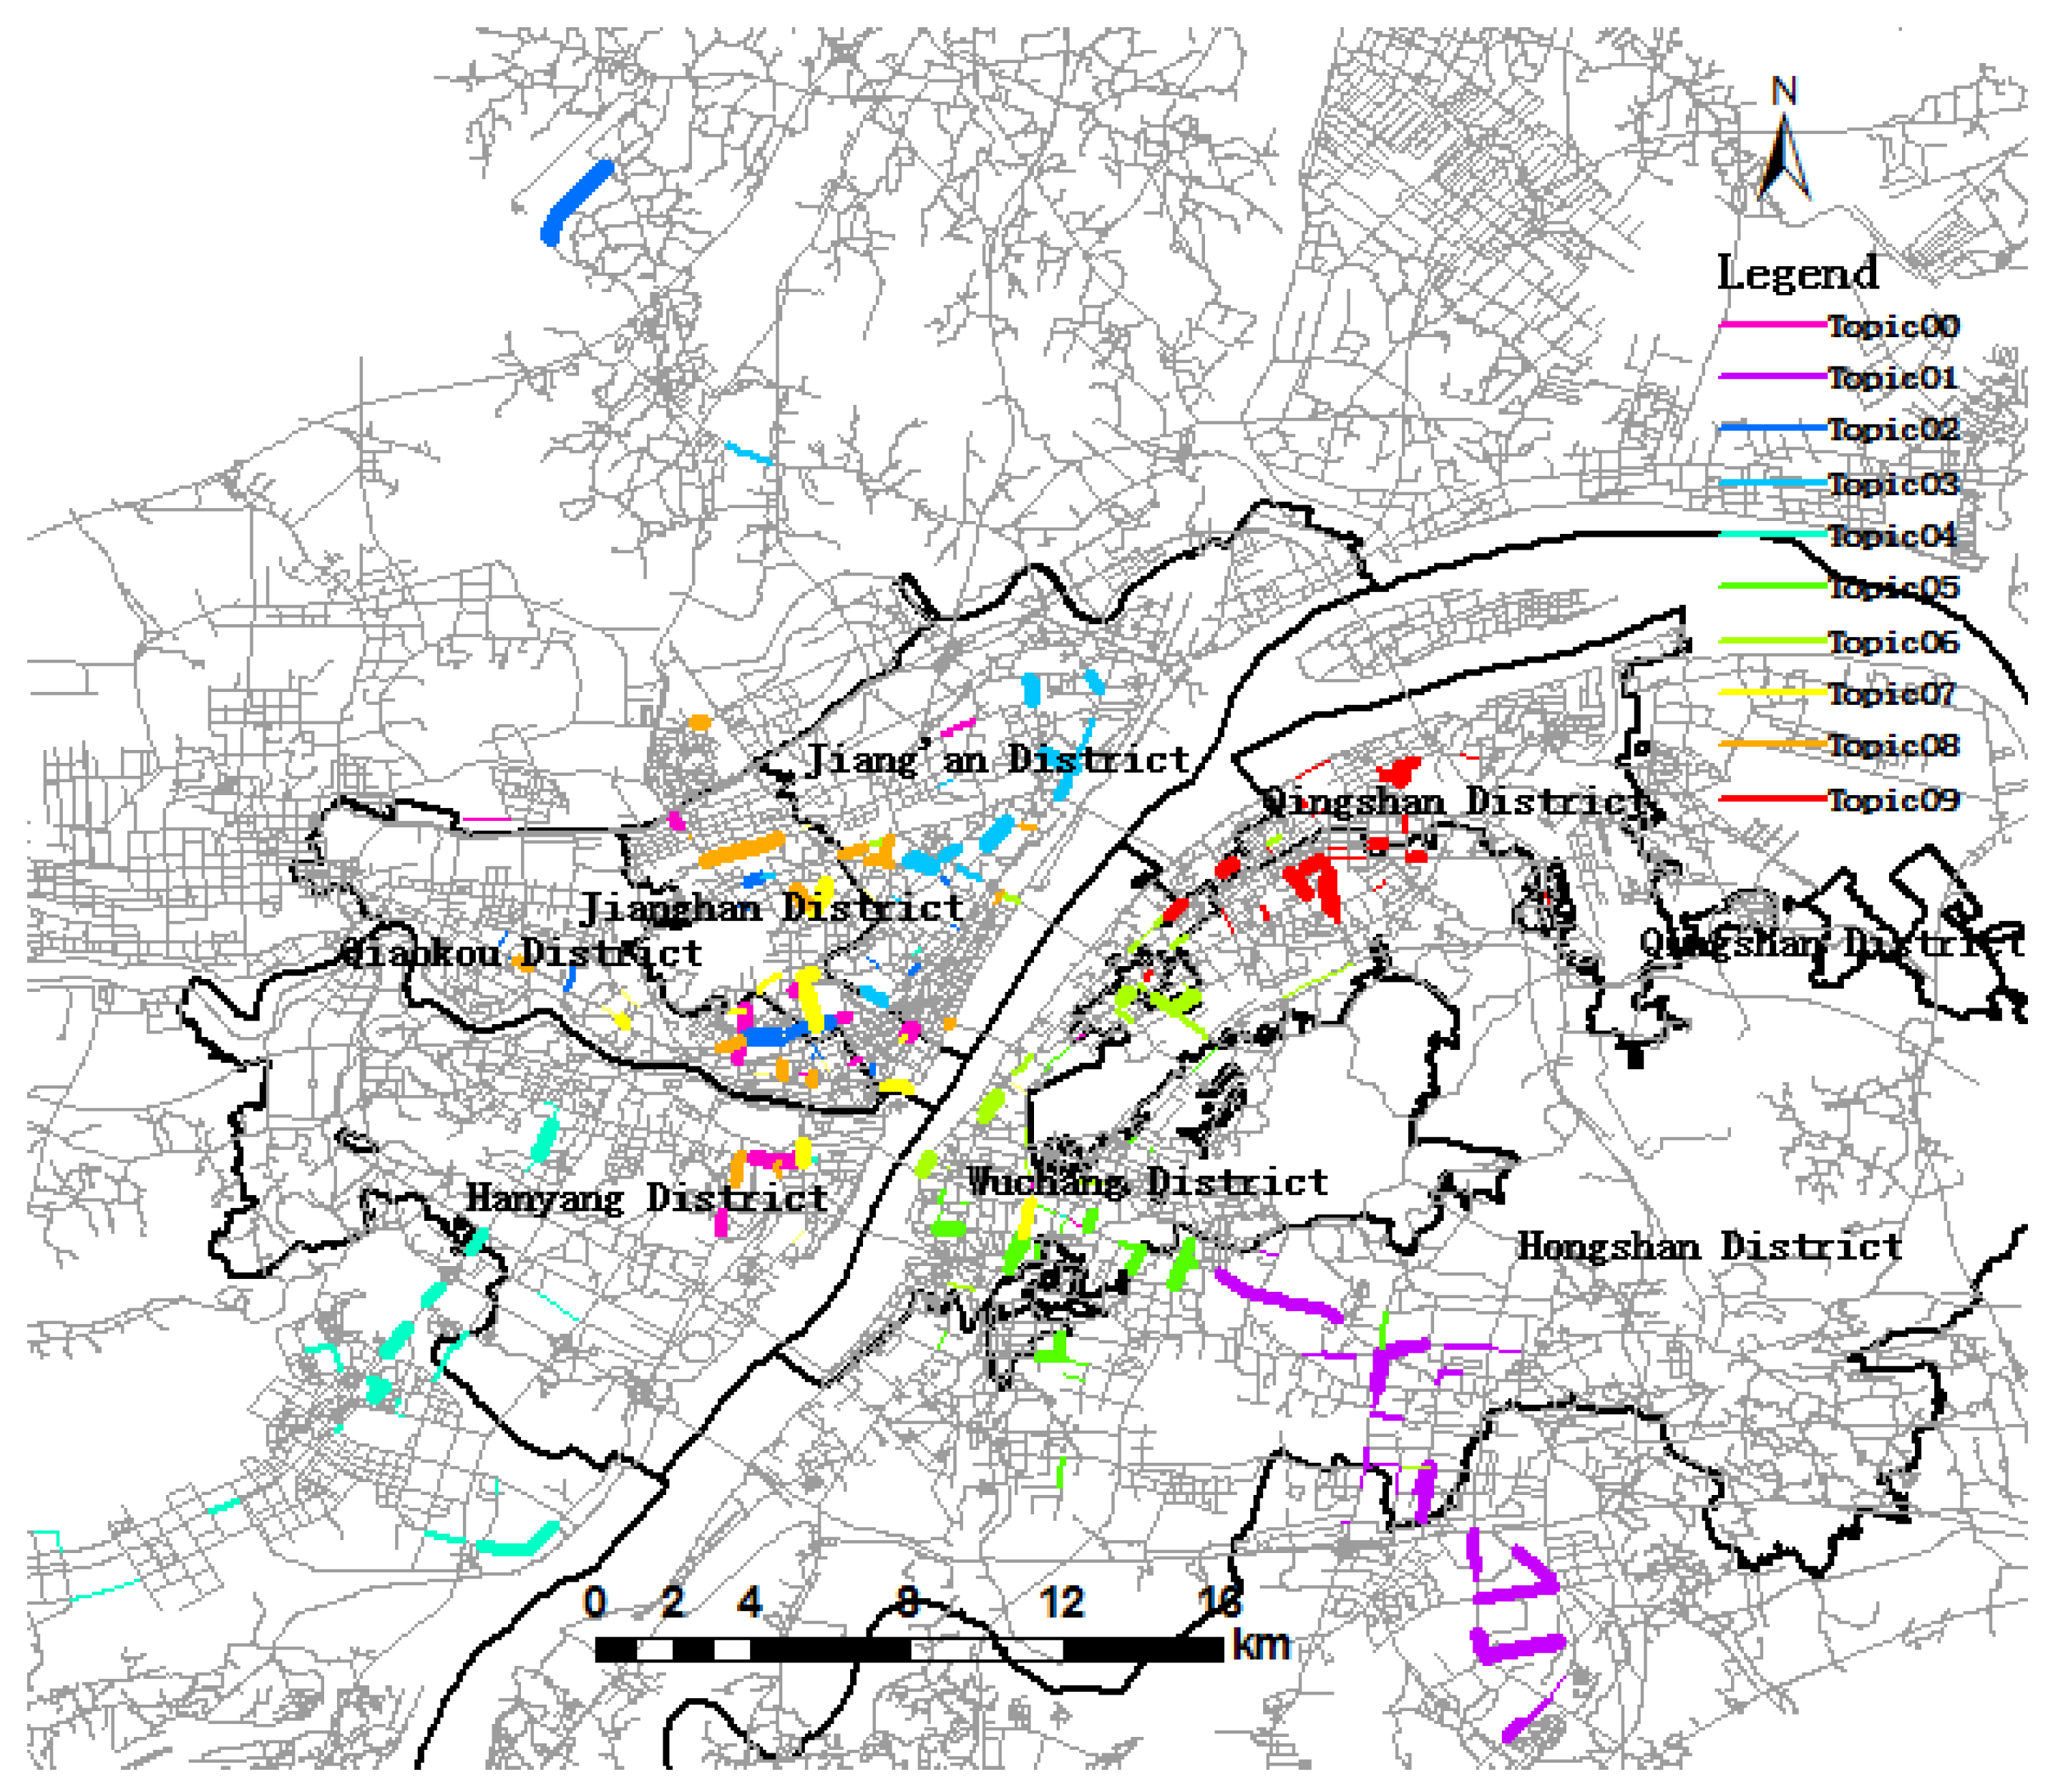
5.3. Trip Topic Evolution
6. Conclusions
Acknowledgments
Author Contributions
Conflicts of Interest
References
- Candia, J.; Gonzalez, M.C.; Wang, P.; Schoenharl, T.; Madey, G.; Barabasi, A.-L. Uncovering individual and collective human dynamics from mobile phone records. J. Phys. A Math. Theor. 2008. [Google Scholar] [CrossRef]
- Jiang, B.; Yin, J.; Zhao, S. Characterizing the human mobility pattern in a large street network. Phys. Rev. E 2009, 80. [Google Scholar] [CrossRef] [PubMed]
- Bai, F.; Helmy, A. A Survey of Mobility Models. In Wireless Adhoc Networks; University of Southern California: Los Angeles, CA, USA, 2004; pp. 1–30. [Google Scholar]
- Chaix, B.; Kestens, Y.; Perchoux, C.; Karusisi, N.; Merlo, J.; Labadi, K. An interactive mapping tool to assess individual mobility patterns in neighborhood studies. Am. J. Prev. Med. 2012, 43, 440–450. [Google Scholar] [CrossRef] [PubMed]
- Miller, H.J.; Shaw, S.L. Geographic information systems for transportation in the 21st Century. Geogr. Compass 2015, 9, 180–189. [Google Scholar] [CrossRef]
- Song, C.; Koren, T.; Wang, P.; Barabasi, A.-L. Modelling the scaling properties of human mobility. Nat. Phys. 2010, 6, 818–823. [Google Scholar] [CrossRef]
- Song, C.; Qu, Z.; Blumm, N.; Barabasi, A.-L. Limits of predictability in human mobility. Science 2010, 327, 1018–1021. [Google Scholar] [CrossRef] [PubMed]
- Yuan, Y.; Raubal, M.; Liu, Y. Correlating mobile phone usage and travel behavior: A case study of Harbin, China. Comput. Environ. Urban Syst. 2012, 36, 118–130. [Google Scholar] [CrossRef]
- Hawelka, B.; Sitko, I.; Beinat, E.; Sobolevsky, S.; Kazakopoulos, P.; Ratti, C. Geo-Located Twitter as Proxy for Global Mobility Patterns. Cartogr. Geogr. Inf. Sci. 2014. [Google Scholar] [CrossRef] [PubMed]
- Rhee, I.; Shin, M.; Hong, S.; Lee, K.; Kim, S.J.; Chong, S. On the Levy-Walk Nature of Human Mobility. IEEE/ACM Trans. Netw. 2011. [Google Scholar] [CrossRef]
- Chen, C.; Bian, B.; Ma, J. From Traces to Trajectories: How Well Can We Guess Activity Locations from Mobile Phone Traces? Transp. Res. Part C 2014. [Google Scholar] [CrossRef]
- Lu, Y.; Liu, Y. Pervasive location acquisition technologies: Opportunities and challenges for geospatial studies. Comput. Environ. Urban Syst. 2012, 36, 105–108. [Google Scholar] [CrossRef]
- Veloso, M.; Phithakkitnukoon, S.; Bento, C. Sensing urban mobility with taxi flow. In Proceedings of the 3rd ACM SIGSPATIAL International Workshop on Location-Based Social Networks, Chicago, IL, USA, 1–4 November 2011.
- Zheng, Y.; Liu, Y.; Yuan, J.; Xie, X. Urban computing with taxicabs. In Proceedings of the 13th International Conference on Ubiquitous Computing, Beijing, China, 17–21 September 2011.
- Gao, S.; Wang, Y.; Gao, Y.; Liu, Y. Understanding urban traffic-flow characteristics: A rethinking of betweenness centrality. Environ. Plan. B Plan. Des. 2013, 40, 135–153. [Google Scholar]
- Qi, G.; Li, X.; Li, S.; Pan, G.; Wang, Z.; Zhang, D. Measuring social functions of city regions from large-scale taxi behaviors. In Proceedings of the 2011 IEEE International Conference on Pervasive Computing and Communications Workshops (PERCOM Workshops), Seattle, WA, USA, 21–25 March 2011; pp. 384–388.
- Yuan, J.; Zheng, Y.; Xie, X. Discovering regions of different functions in a city using human mobility and POIs. In Proceedings of the 18th ACM SIGKDD International Conference on Knowledge Discovery and Data Mining, Beijing, China, 12–16 August 2012; pp. 186–194.
- Zheng, F.; Van Zuylen, H. Urban link travel time estimation based on sparse probe vehicle data. Transp. Res. Part C Emerg. Technol. 2013, 31, 145–157. [Google Scholar] [CrossRef]
- Cheng, Z.Y.; Caverlee, J.; Lee, K.; Sui, D.Z. Exploring millions of footprints in location sharing services. In Proceedings of the Fifth International AAAI Conference on Weblogs and Social Media, Barcelona, Spain, 17–21 July 2011; pp. 81–88.
- Lee, K.; Hong, S.; Kim, S.J.; Rhee, I.; Chong, S. SLAW: A mobility model for human walks. In Proceedings of the IEEE International Conference on Computer Communications, Rio de Janeiro, Brazil, 19–25 April 2009; pp. 855–863.
- Rhee, I.; Shin, M.; Hong, S.; Lee, K.; Chong, S. On the levy-walk nature of human mobility. In Proceedings of the IEEE INFOCOM, Phoenix, AZ, USA, June 2011; pp. 630–643.
- Liang, X.; Zheng, X.; Lv, W.; Zhu, T.; Xu, K. The scaling of human mobility by taxis is exponential. Phys. A 2012, 391, 2135–2144. [Google Scholar] [CrossRef]
- Liu, Y.; Kang, C.; Gao, S.; Xiao, Y.; Tian, Y. Understanding intra-urban trip patterns from taxi trajectory data. J. Geogr. Syst. 2012, 14, 463–483. [Google Scholar] [CrossRef]
- Liu, Y.; Wang, F.; Xiao, Y.; Gao, S. Urban land uses and traffic “source-sink areas”: Evidence from GPS-enabled taxi data in Shanghai. Landsc. Urban Plan. 2012, 106, 73–87. [Google Scholar] [CrossRef]
- Ballatore, A.; Wilson, D.C.; Bertolotto, M. Computing the semantic similarity of geographic terms using volunteered lexical definitions. Int. J. Geogr. Inf. Sci. 2013, 27, 2099–2118. [Google Scholar] [CrossRef]
- Chu, D.; Sheets, D.A.; Zhao, Y.; Wu, Y.Y.; Yang, J.; Zheng, M.; Chen, G. Visualizing Hidden Themes of Taxi Movement with Semantic Transformation. In Proceedings of the IEEE Pacific Visualization Symposium (PacificVis), Yokohama, Japan, 4–7 March 2014.
- Gong, L.; Liu, X.; Wu, L.; Liu, Y. Inferring trip purposes and uncovering travel patterns from taxi trajectory data. Cartogr. Geogr. Inf. Sci. 2015, 43, 1–12. [Google Scholar]
- Blei, D.M.; Ng, A.Y.; Jordan, M.I. Latent dirichlet allocation. J. Mach. Learn. Res. 2003, 3, 993–1022. [Google Scholar]
- Hashemi, M.; Karimi, H.A. A critical review of real-time map-matching algorithms: Current issues and future directions. Comput. Environ. Urban Syst. 2014, 48, 153–165. [Google Scholar] [CrossRef]
- Quddus, M.A.; Ochieng, W.Y.; Noland, R.B. Current map-matching algorithms for transport applications: State-of-the art and future research directions. Transp. Res. Part C Emerg. Technol. 2007, 15, 312–328. [Google Scholar] [CrossRef]
- Zheng, Y.; Lou, Y.; Zhang, C.; Xie, X.; Wang, W.; Huang, Y. Map-Matching for Low-Sampling-Rate GPS Trajectories. U.S. Patent Application 12/712,857, 25 February 2010. [Google Scholar]
- Chen, B.Y.; Yuan, H.; Li, Q.; Lam, W.H.K.; Shaw, S.-L.; Yan, K. Map-matching algorithm for large-scale low-frequency floating car data. Int. J. Geogr. Inf. Sci. 2014, 28, 22–38. [Google Scholar] [CrossRef]
- Ahas, R.; Aasa, A.; Silm, S.; Tiru, M. Daily rhythms of suburban commuter’s movements in the Tallinn metropolitan area: Case study with mobile positioning data. Transp. Res. C Emerg. 2010, 18, 45–54. [Google Scholar] [CrossRef]
- Schonfelder, S.; Axhausen, K.W. Urban Rhythms and Travel Behaviour: Spatial and Temporal Phenomena of Daily Travel; Ashgate Publishing: London, UK, 2010. [Google Scholar]
- Härri, J.; Filali, F.; Bonnet, C. Mobility models for vehicular ad hoc networks: A survey and taxonomy. Commun. Surv. Tutor. 2009, 11, 19–41. [Google Scholar] [CrossRef]
- Zonoozi, M.M.; Dassanayake, P. User mobility modeling and characterization of mobility patterns. IEEE J. Sel. Areas Commun. 1997, 15, 1239–1252. [Google Scholar] [CrossRef]
- Fang, Z.; Li, Q.; Shaw, S.L. What about people in pedestrian navigation? Geo-Spat. Inf. Sci. 2015, 18, 135–150. [Google Scholar] [CrossRef]
- Parent, C.; Spaccapietra, S.; Renso, C.; Andrienko, G.; Andrienko, N.; Bogorny, V.; Damiani, M.L.; Gkoulalas-Divanis, A.; Macedo, J.; Pelekis, N.; Theodoridis, Y.; et al. Semantic trajectories modeling and analysis. ACM Comput. Surv. 2013, 45, 1–32. [Google Scholar] [CrossRef]
- Li, Q.; Bo, H.; Yang, Y. Flowing car data map-matching based on constrained shortest path algorithm. Geomat. Inf. Sci. Wuhan Univ. 2013, 38, 805–808. [Google Scholar]
- Zhang, Y.; Yang, B.; Luan, X. Automated matching urban road networks using probabilistic relaxation. Acta Geod. Catogr. Sin. 2012, 41, 933–939. [Google Scholar]
- Blei, D.M. Probabilistic topic models. Commun. ACM 2012, 55, 77–84. [Google Scholar] [CrossRef]
- Ramage, D.; Rosen, E. Standford TMT (online). Palo Alto: The Stanford Natural Language Processing Group, 2015. Available online: http://nlp.stanford.edu/software/tmt/tmt-0.4/ (accessed on 31 January 2015).
- Wang, H.; Zou, H.; Yue, Y.; Li, Q. Visualizing hot spot analysis result based on mashup. In Proceedings of the 2009 International Workshop on Location Based Social Networks, LBSN ’09, Seattle, WA, USA, 3 November 2009; pp. 45–48.
- Speckmann, B.; Verbeek, K. Necklace maps. IEEE Trans. Vis. Comput. Graph. 2010, 16, 881–889. [Google Scholar] [CrossRef] [PubMed]


| Date | ID | Longitude | Latitude | Velocity | Heading | Status |
|---|---|---|---|---|---|---|
| 2 June 2014 01:04:44 | 40416 | 114.27183 | 30.59821 | 6.284861 | 316.78 | 0 |
| 2 June 2014 01:04:49 | 40416 | 114.271583 | 30.598418 | 8.756667 | 329.19 | 0 |
| 2 June 2014 01:05:09 | 40416 | 114.27093 | 30.59895 | 5.190278 | 310.57 | 1 |
| 2 June 2014 01:05:41 | 40416 | 114.27055 | 30.600498 | 8.756667 | 51.46 | 1 |
| 2 June 2014 01:06:24 | 40416 | 114.273651 | 30.601985 | 12.759861 | 62.53 | 1 |
| Date | Number of Records | Number of Taxies | Number of Trips | Number of Valid Trips |
|---|---|---|---|---|
| 2 June | 2,446,961 | 2057 | 56,770 | 41,134 |
| 3 June | 2,468,565 | 2059 | 55,487 | 40,992 |
| 4 June | 2,449,164 | 2069 | 54,472 | 41,048 |
| 5 June | 2,483,043 | 2073 | 55,598 | 41,698 |
| 6 June | 2,510,001 | 2064 | 56,936 | 41,098 |
| 7 June | 2,539,803 | 2049 | 59,220 | 42,989 |
| 8 June | 2,498,303 | 2063 | 58,353 | 43,233 |
| Total | 17,395,840 | 396,836 | 292,192 |
| Taxi ID | Date | Latitude | Longitude | Link ID | Street Name | ODState |
|---|---|---|---|---|---|---|
| 10319 | 2 June 2014 07:35:30 | 30.627251 | 114.381743 | 16373 | Gongye Road | origin |
| 10319 | 2 June 2014 07:40:02 | 30.63174 | 114.3775 | 16748 | Heping Road | destination |
| 16657 | 2 June 2014 18:24:44 | 30.515136 | 114.313965 | 9208 | Ping’an Road | origin |
| 16657 | 2 June 2014 18:44:42 | 30.548246 | 114.296945 | 10838 | Minzhu Road | destination |
| Topic | Total Frequency of Topic | Link 22921 | Link 10229 | Link 14346 | Link 10139 | ||||
|---|---|---|---|---|---|---|---|---|---|
| Freq | Prob | Freq | Prob | Freq | Prob | Freq | Prob | ||
| Topic08 | 2460 | 11 | 0.08 | 39 | 0.60 | 1 | 0.02 | 109 | 0.53 |
| Topic06 | 2173 | 60 | 0.44 | 0 | 0.00 | 18 | 0.28 | 0 | 0.00 |
| Topic09 | 2066 | 9 | 0.06 | 0 | 0.00 | 0 | 0.00 | 30 | 0.15 |
| Topic04 | 1728 | 5 | 0.04 | 0 | 0.00 | 14 | 0.22 | 28 | 0.14 |
| Topic03 | 1641 | 0 | 0.00 | 0 | 0.00 | 10 | 0.16 | 0 | 0.00 |
| Topic00 | 1543 | 4 | 0.03 | 0 | 0.01 | 0 | 0.00 | 2 | 0.01 |
| Topic01 | 1449 | 33 | 0.25 | 26 | 0.39 | 21 | 0.32 | 21 | 0.10 |
| Topic02 | 1381 | 13 | 0.10 | 0 | 0.00 | 0 | 0.00 | 0 | 0.00 |
| Topic07 | 1244 | 0 | 0.00 | 0 | 0.00 | 0 | 0.00 | 16 | 0.08 |
| Topic05 | 1003 | 0 | 0.00 | 0 | 0.00 | 0 | 0.00 | 0 | 0.00 |
| Morning Rush Hour Topics | Topic Significance | Evening Rush Hour Topics | Topic Significance | Topic Similarity | Significance Change |
|---|---|---|---|---|---|
| Topic08 | 2460 | Topic05 | 2110 | 0.43 | −14.23% |
| Topic06 | 2173 | Topic08 | 1805 | 0.40 | −16.94% |
| Topic09 | 2066 | Topic01 | 2404 | 0.53 | +16.41% |
| Topic04 | 1728 | Topic00 | 1426 | 0.29 | −17.49% |
| Topic03 | 1641 | Topic03 | 1976 | 0.42 | +20.43% |
| Topic00 | 1543 | Topic09 | 1489 | 0.47 | −3.45% |
| Topic01 | 1449 | Topic00 | 1426 | 0.25 | −1.64% |
| Topic02 | 1381 | Topic02 | 1672 | 0.13 | +21.10% |
| Topic07 | 1244 | Topic00 | 1426 | 0.17 | +14.59% |
| Topic05 | 1003 | Topic04 | 1073 | 0.22 | +7.02% |
| Total topic significance | 16,687 | – | 17,681 | – | – |
© 2016 by the authors; licensee MDPI, Basel, Switzerland. This article is an open access article distributed under the terms and conditions of the Creative Commons Attribution (CC-BY) license (http://creativecommons.org/licenses/by/4.0/).
Share and Cite
Zhang, F.; Zhu, X.; Guo, W.; Ye, X.; Hu, T.; Huang, L. Analyzing Urban Human Mobility Patterns through a Thematic Model at a Finer Scale. ISPRS Int. J. Geo-Inf. 2016, 5, 78. https://doi.org/10.3390/ijgi5060078
Zhang F, Zhu X, Guo W, Ye X, Hu T, Huang L. Analyzing Urban Human Mobility Patterns through a Thematic Model at a Finer Scale. ISPRS International Journal of Geo-Information. 2016; 5(6):78. https://doi.org/10.3390/ijgi5060078
Chicago/Turabian StyleZhang, Faming, Xinyan Zhu, Wei Guo, Xinyue Ye, Tao Hu, and Liang Huang. 2016. "Analyzing Urban Human Mobility Patterns through a Thematic Model at a Finer Scale" ISPRS International Journal of Geo-Information 5, no. 6: 78. https://doi.org/10.3390/ijgi5060078
APA StyleZhang, F., Zhu, X., Guo, W., Ye, X., Hu, T., & Huang, L. (2016). Analyzing Urban Human Mobility Patterns through a Thematic Model at a Finer Scale. ISPRS International Journal of Geo-Information, 5(6), 78. https://doi.org/10.3390/ijgi5060078