Article

Indexing for Moving Objects in Multi-Floor Indoor Spaces That Supports Complex Semantic Queries

1
Institute of Remote Sensing and Digital Earth, Chinese Academy of Sciences, CAS Olympic S & T Park, No. 20 Datun Road, P.O. Box 9718, Beijing 100101, China
2
University of Chinese Academy of Sciences, No. 19A Yuquan Road, Beijing 100049, China
3
Department of Computer Science, University of Massachusetts Boston, Boston, MA 02125, USA
4
Beijing Jinghang Computation and Communication Research Institute, Beijing 100074, China
*
Authors to whom correspondence should be addressed.
ISPRS Int. J. Geo-Inf. 2016, 5(10), 176; https://doi.org/10.3390/ijgi5100176
Submission received: 17 May 2016 / Revised: 8 September 2016 / Accepted: 18 September 2016 / Published: 27 September 2016
(This article belongs to the Special Issue 3D Indoor Modelling and Navigation)

Abstract

:
With the emergence of various types of indoor positioning technologies (e.g., radio-frequency identification, Wi-Fi, and iBeacon), how to rapidly retrieve indoor cells and moving objects has become a key factor that limits those indoor applications. Euclidean distance-based indexing techniques for outdoor moving objects cannot be used in indoor spaces due to the existence of indoor obstructions (e.g., walls). In addition, currently, the indexing of indoor moving objects is mainly based on space-related query and less frequently on semantic query. To address these two issues, the present study proposes a multi-floor adjacency cell and semantic-based index (MACSI). By integrating the indoor cellular space with the semantic space, the MACSI subdivides open cells (e.g., hallways and lobbies) using space syntax and optimizes the adjacency distances between three-dimensionally connected cells (e.g., elevators and stairs) based on the caloric cost that extends single floor indoor space to three dimensional indoor space. Moreover, based on the needs of semantic query, this study also proposes a multi-granularity indoor semantic hierarchy tree and establishes semantic trajectories. Extensive simulation and real-data experiments show that—compared with the indoor trajectories delta tree (ITD-tree) and the semantic-based index (SI)—the MACSI produces more reliable query results with significantly higher semantic query and update efficiencies; has superior semantic expansion capability; and supports multi-granularity complex semantic queries.

1. Introduction

According to the available statistics, humans spend 87% of their time in indoor spaces [1], such as private residences and office buildings. Thus, humans produce vast numbers of indoor moving trajectories. For example, on 5 March 2016, the 15 operation lines of the Beijing Subway handled a daily passenger volume of 9.6711 million [2]. Effectively managing the massive data of indoor cells and moving objects is particularly important for many applications, including object tracking [3], indoor navigation [4] and emergency evacuation [5].
Due to building obstructions, Global Positioning Systems (GPS) cannot obtain accurate positioning results in indoor environments. Recently, with the development of indoor positioning technology, large volumes of tracking data have become available, greatly promoting the vigorous development of indoor Location Based Service (LBS). Indoor positioning uses short-distance positioning technologies, such as Radio Frequency Identification (RFID) [6], WiFi [7,8] and ZigBee [9]. The representation of the positioning signals varies between outdoor and indoor positioning. For example, the outdoor positioning signals of GPS generally consist of latitude and longitude coordinates, while Symbolic cells are more frequently used to represent indoor positioning [10].
In addition, the Euclidean distance or road network distance is often used as the outdoor measurement standard, although the former cannot be used in indoor spaces because of various constraints, such as walls. As shown in Figure 1, the distance between objects O1 and O2 cannot be measured using the straight-line distance; instead, the length of the line connecting C3, C2, C1, C9, C6 and C5 (red line) should be used for the indoor space. Outdoor areas contain free space. As shown in Figure 2, the distance between the moving object O1 and O2 can be measured using the straight-line distance or road network distance for the outdoor space. In addition, from the perspective of spatial cognition, the user demand for indoor positioning accuracy [11] is significantly higher than that of outdoor spaces, and the establishment of user trust [12,13] for indoor spaces is also more complex.
Due to the aforementioned differences, outdoor moving object management technology, which is very mature, cannot be applied to indoor spaces. Currently, research on indoor moving object indices [14,15,16,17] has mainly focused on the perspective of spatial space, typically only considering moving objects in single-floor indoor spaces. Few studies have considered moving objects in multi-floor indoor spaces and semantic spaces. Indoor moving object databases have extensive indoor user data. The combination of indoor cellular and semantic spaces to provide users with stable and efficient semantic searching capabilities can create numerous business opportunities. For example, online-to-offline applications have undergone vigorous development in recent years and allow increasing numbers of users to search for the contents that they are interested in online and experience services offline. Various types of search needs are associated with indoor scenes. For example, a user can use an app to search for fried squid rings. The app returns a list of relevant restaurants which are sorted based on their distances, and the user arrives at the selected restaurant with the help of the indoor navigation system. Similarly, a shopping mall operator can search for users who often go to the movie theater after shopping and deliver the latest movie information to them.
Due to the particularity of indoor environments and the positioning issues, this paper aims to establish an effective index for indoor moving objects in multi-floor indoor spaces that can support typical 3d spatial queries. By combining cell and semantic spaces, multi-granularity semantic cells and object searches can be realized. A series of experiments are used to prove that the system has better query, update, and expansion performances.
In summary, this study makes the following main contributions:
  • A new indexing strategy for indoor moving objects, i.e., the multi-floor adjacency cell and semantic-based index (MACSI), is proposed. This index not only considers the adjacency relation between simple indoor cells (e.g., room) but also contains open cells (e.g., hallways and lobbies) and cells connected across floors (e.g., elevators and stairs). Open cells are subdivided using space syntax to ensure that the adjacency cellular spaces are reasonable, and the adjacency distances between cells connected across floors are optimized based on the caloric cost. To the authors’ knowledge, this is the first time that an index for indoor moving objects, based on an adjacency relation between indoor cells, has been expanded from single-floor to multi-floor indoor spaces.
  • The present study proposes an indoor multi-granularity semantic hierarchy tree (MGSH-tree) that supports queries for complex indoor semantic cells and objects and has improved semantic expansion capability.
  • A semantic trajectory model based on the indoor MGSH-tree is proposed. This model supports queries for complex semantic trajectories and addresses a shortcoming of traditional trajectories, which only represent user behavior points. This model provides a more diverse trajectory search service for applications and assists numerous applications to achieve efficient semantic trajectory retrieval and analysis.
  • Indoor trajectories delta tree (ITD-tree) [14] performance is relatively good for indoor moving objects based on the adjacency relation between indoor cells, and the semantic-based index (SI) [18] is currently one of only a few indices for indoor semantic spaces. To demonstrate the superiority of the MACSI in indoor cell spaces and semantic spaces, experiments are performed on simulated and real data sets. The MACSI is found to be advantageous over the ITD-tree and the SI in queries for semantic cells, objects and trajectories, and the MACSI is more applicable to actual indoor application scenarios.
The rest of this paper is organized as follows: Section 2 summarizes the previous studies related to the present study and elucidates their differences; Section 3 defines some basic concepts; Section 4 describes the MACSI in detail; Section 5 demonstrates the advantages of the MACSI through a series of comparative experiments. Section 6 provides the conclusion of this study and an outlook for future work.

2. Related Work

2.1. Indexing of Outdoor Moving Objects

Currently, several Euclidean distance-based indexing techniques exist for moving objects, such as the R-tree variant-based temporal partitioning R(TPR)-tree [19] and time-parameterized R* (TPR*)-tree [20], which can be used to index the current and future positions of moving objects, as well as the multi-version 3-dimensional R(MV3R)-tree [21], historical R(HR)-tree [22] and the trajectory-bundle(TB)-tree [23], which can be used to index the historical trajectories of moving objects. Finally, the fixed network R(FNR)-tree [24], the moving objects in networks (MON)-tree [25] and the dynamic sketched-trajectory R(DSTR)-tree [26] index moving objects based on road networks.

2.2. Representation and Space Subdivision of Indoor Spaces

Indoor moving objects are subject to indoor space constraints; therefore, in the representation and modeling of indoor spaces, space subdivision plays a particularly important role in the management of indoor moving objects [27,28,29]. To summarize, the methods for subdividing indoor space are the geometric method, the graph method, and a combination of these. The geometric method attends to the expression of an indoor space [30], which mainly includes a raster model [31,32,33,34] and a vector model based on the boundary [30,35,36]. The raster model is composed of regular [31] and irregular grids [32,33,34]. The graph method is a popular method of modeling indoor spaces. Jensen et al. [37] established an indoor connectivity graph model with indoor rooms as nodes and doors as edges.
In addition, Yang et al. [38], Yuan et al. [39], and Kang et al. [40] established models based on graphs. The combination method uses the advantages of each method to support multi-purpose management. Becker et al. [41] proposed a multi-layered space-event model that extends the node-relation-structure (NRS) to multiple spatial layers, including the geometric, topological, and sensor layers. Li et al. [42] proposed a model of indoor space that accounts for the geometric and topological characteristics of the space and can represent its connectivity and geometric characteristics.
Zlatanova et al. [43,44] proposed a conceptual framework that is concerned with physical and conceptual subdivisions of indoor space and rooted in the following six concepts: Space, Partition, Agent, Activity, Resource and Modifier.

2.3. Indexing of Indoor Moving Objects

The adaptive cell-based index for indoor moving objects (ACII) proposed by Shin et al. [45] indexes historical and current moments. Jensen et al. [15] proposed the reader-time R (RTR)-tree and the time parameter point R (TP2R)-tree. The core idea of the RTR-tree is to segment an object’s trajectory into several linear elements. The TP2R-tree introduces the time parameter into the indexing of trajectory points. Alamri et al. [14,16,17] proposed an index for moving objects based on the connectivity of indoor cells. This index supports various types of searches (including searches for object connectivity and k-nearest neighbors [k-NN]) but gives less consideration to open cells (e.g., hallways and lobbies) and three-dimensionally connected cells (e.g., stairs and elevators). Alamri et al.’s index is mainly used for the indexing of moving objects in a single-floor indoor space. Based on Alamri et al.’s indoor adjacency cells, here, open cells (e.g., hallways and lobbies) are subdivided using space syntax [46,47,48], and the adjacency distances between three-dimensionally connected cells (e.g., stairs and elevators) are optimized based on the caloric cost, thereby expanding the application of indexing from single-floor indoor spaces to multi-floor indoor spaces.

2.4. Indoor Semantic Indexing

Jin et al. [49] divided an indoor space into rooms, doors, sensors and stationary objects and established semantic relations between moving objects and indoor elements. Ben et al. [18] proposed an SI that semantically classifies indoor cells and supports semantic-based queries. However, because the SI performs indexing through limited semantic categories, the SI has a limited semantic expansion capability. In addition, the SI provides relatively weak support for spatial constraint-based searches (e.g., searches for k-NN and connectivity). The MACSI integrates indoor cellular space with semantic spaces and improves the fine-grained semantic indexing and semantic keyword expansion capabilities of the SI through inverted indexing.
In summary, in contrast to the indexing of moving objects in outdoor spaces, the characteristics of multi-floor searches and semantic searches must also be comprehensively considered for indoor spaces. Therefore, it is vital to establish an index for moving objects in multi-floor indoor spaces that supports complex semantic searches.

3. Preliminary

This section provides the formal definitions of some basic concepts. Section 3.1 defines the concepts relating to indoor cellular spaces; Section 3.2 defines the concepts relating to indoor semantic spaces; Section 3.3 provides the formal definition of indoor semantic trajectories. Table 1 lists the notations used throughout this paper.

3.1. Definition of Indoor Cellular Spaces

Definition 1.
For a given set of cells, C = {C1, C2, C3, …, Cn}, if any arbitrary object, Oi, does not need to pass any other cell when moving from Cx to Cy, where x ∈ n, and y ∈ n, then Cx and Cy are adjacency cells.
Definition 2.
For a given set of cells, C = {C1, C2, C3, …, Cn}, and for any two arbitrary moving objects, Oi(xi, yi) and Oj(xj, yj), CDist(Oi, Oj) = |Ci, Cj, …, Cn| −1 represents the number of cells that must be passed minus 1. RDist(Oi, Oj) is defined as the actual indoor distance that Oi must travel to reach Oj, and Edist is defined as the planar distance between Px(xi,yi) and Px(xj,yj) (). As shown in Figure 1, the cellular distance between O1 and O2 is |C3, C2, C1, C9, C6, C5| −1 = 5; the length of the dotted line is the Euclidean distance between O1 and O2 (EDist(O1, O2)); the length of the red line is the actual distance between O1 and O2 (RDist(O1, O2)).

3.2. Definitions of Indoor Semantic Meanings

Definition 3.
For a given set of indoor cell keywords, K = {K1, K2, K3, …, Ki, …, Kn}, and for any indoor cell, Ci, its cellular semantic meaning is expressed by SCi = {Ci,{K1, K2, …,Ki, …, Kn}}, where .
Definition 4.
For a given set of moving object keywords, J = {J1, J2, J3, …, Jn}, and for any arbitrary moving object, Ox, its semantic meaning is expressed by SOx = {Ox,{J1, J2, …Ji, …, Jn}}, where .
Definition 5.
For a given semantic keyword, Ki, and a given root node of the semantic tree, SRoot, if there is a node access path, SiTr = SRoot- > SLevel2- > SLevel3 - > …- > SLeveln, through which the semantic node containing Ki can be found, then the semantic node is expressed by Si = {SRoot, SLevel2, SLevel3, …, SLeveln} (the depth of Si: SDepth = |SiTr| −1, where |SiTr| represents the number of nodes in the semantic trajectory).

3.3. Definition of Indoor Semantic Trajectories

Definition 6.
Unlike an outdoor Euclidean space, the trajectory of a moving object in an indoor space cannot be directly expressed by coordinate series because doing so could lead to a “passing-through-the-wall” phenomenon. For a given set of objects, O = {O1, O2, O3, …, On}, and a given set of cells, C = {C1, C2, C3, …, Cn}, the trajectory of an indoor moving object is often expressed by, which is shown in Table 2, where pn represents the sequential number of the trajectory positioning point, Cx represents the cellular space in which the indoor moving object is located, Sti represents the time at which the indoor moving object enters Cx, and Eti represents the time at which the indoor moving object leaves Cx. Based on the sequential relation between Stis, the trajectory of the user shown in Figure 3 can be expressed by the sequence of symbols shown in Figure 4.
Definition 7.
For a given trajectory of a certain moving object, its semantic trajectory is expressed by, where SDepth(Si) = SDepth(STree).

4. Index Structure of the MACSI

This section introduces the MACSI in detail. First, several indoor queries supported by the MACSI are described (see Table 3). Section 4.1 describes the overall index structure of the MACSI; Section 4.2 introduces a multi-floor adjacency cell-based tree (MAC-tree); Section 4.3 proposes a multi-granularity semantic index (MGSI).

4.1. Overall Index Structure

The MACSI considers two dimensions comprehensively: the spatial and semantic dimensions (Figure 5). For the spatial dimension, this study establishes a MAC-tree by expanding Alamri et al.’s ITD-tree. The MAC-tree optimizes open cells and three-dimensionally connected cells using space syntax and the caloric cost, respectively, hence expanding the application of indexing from single-floor indoor spaces to multi-floor indoor spaces. In addition, the MAC-tree indexes the moving objects in a cellular space through a cell-object table and records the historical trajectories of the moving objects using an object record table.
For the semantic dimension, the present study establishes an MGSI, which includes semantic category nodes formed using semantic levels and a fine-grained semantic expansion structure generated via semantic inverted indexing. As shown in Figure 5, the moving trajectory of O1 is Pizza Hut- > Guess- > KFC- > Nike- > Adidas- >7-11. The multi-granularity semantic trajectory is obtained based on the MGSH-tree. To realize searches for moving objects, a semantic inverted index for moving objects is established using semantic object inverted indexing. A trajectories table is formed by integrating the object record table with semantic trajectories and is used to index the trajectories of moving objects.

4.2. MAC-Tree

4.2.1. Generation of Cellular Spaces

The influence of obstructions (e.g., columns, desks and chairs) in an indoor environment is ignored. Based on elements such as walls and doors, an indoor space can be divided into room cells and open cells (e.g., living rooms and hallways). When a moving object moves within a certain cell, the next cell that the moving object passes through must be an adjacent cell. Based on this characteristic and the adjacency relation between indoor cells, an adjacency distance matrix of the indoor cellular space is obtained (0 represents a cell, and 1 represents the adjacency cell), and thus, by repeating this process, the global distance matrix of the indoor cellular space can be obtained. Figure 6 shows the three-dimensional structures of floor 1 and floor 2 of a certain building. Table 4 presents the adjacency distance matrix of the corresponding cells. When managing indoor moving objects, the indoor adjacency distance matrix and expansion algorithm [16] can be used to locate the corresponding nodes to construct a spatial index. Figure 7 shows the expansion steps using the expansion algorithm based on the spatial adjacency relation; interested readers may refer to sultan Alamri’s work [14,16,17] for more information.

4.2.2. Processing of Open Cells

The scale of an open cell is generally larger than that of a room cell. If open cells (e.g., hallways) are treated as independent cells, the reasonableness of the adjacency distances will be damaged. As shown in Figure 6, C18 is a connected hallway. If only walls and doors are used to subdivide the indoor space, then CDist(C1, C8) = |C1,C18,C8| − 1 = 2 and CDist(C1, C5) = |C1,C18,C5| = 2. However, in reality, a relatively large difference exists between CDist(C1, C8) and CDist(C1, C5). For open-cell problems, this study applies space syntax to define a finer cellular space structure with a smaller scale.
Space syntax involves three main types of analytical methods: axis analysis, visual line analysis and convex space analysis. Visual line analysis may cause hallways in the same direction to be subdivided into the same cell. As shown in Figure 8, an object only needs to pass through C18 when moving from C1 to C20 and from C1 to C19. The cellular distance is the same in both cases, which is clearly unreasonable. Convex space analysis defines doors as a reference point group in a convex space; thus, doors may coincide with natural structures (e.g., walls and other doors). In this work, open cells are divided using axis analysis. As shown in Figure 8, the hallway spaces are first abstracted to axes. Based on their perpendicular relations, the doors are mapped onto the hallway axes to obtain new cross-points. Because the current indoor positioning accuracy is typically 3 m [50], the nodes with adjacency distances of less than 3 m are merged into a new node (the yellow sections in Figure 8) to avoid excessively short distances, which can result in the unreasonable subdivision of adjacency cells. Finally, a perpendicular bisector of adjacency nodes is produced to divide them into multiple cells.

4.2.3. Processing of Three-Dimensionally Connected Cells (e.g., Stairs and Elevators)

Considering the indexing of moving objects in a multi-floor indoor space, Shin et al. [31] separated the floors and treated three-dimensionally connected cells (e.g., elevators and stairs) as regular cells. However, this method produces unreliable query results. As shown in the stereograph in Figure 9, a moving object will select the more distant lavatory on the same floor when searching for a lavatory, whereas the moving object only needs to go upstairs to reach a lavatory that is closer to him/her.
Bassett et al. [51,52] found that the walking speed of a moving object and its caloric cost varied significantly when a person ascended and descended stairs and walked. If elevators and stairs are set as regular room cells, the reasonableness of the adjacency distance matrix will be violated. Here, the adjacency distances between three-dimensionally connected cells (e.g., stairs and elevators) are set based on the caloric cost, which mainly refers to the energy consumed by human activity, different activity intensities have different caloric costs.
For stairs, Chuan et al. [53,54] experimentally demonstrated that the ratio of the caloric cost of a moving object when he/she ascends stairs to that consumed by the moving object when he/she descends stairs is approximately 3:1. Therefore, in this study, the adjacency distances are established between three-dimensionally connected cells, and the symmetric adjacency matrix is changed to an asymmetric adjacency matrix. First, the stair cell is logically divided into two cells, corresponding to ascending stairs and descending stairs; the ascending-stair cell is segmented into three sub-cells. In the adjacency matrix, the ascending-stair cell has an interval of 3, and the descending-stair cell has an interval of 1. As shown in Figure 10, C18 is divided into an ascending-stair cell and a descending-stair cell. The ascending-stair cell is divided into three sub-cells. Using the distance measurement method, the global matrix of the indoor cellular space is obtained (Table 5), showing the difference in the cost between the ascending-stair cell and the descending-stair cell. For example, CellDist(C1, C20) = 8, whereas CellDist(C20, C1) = 6.
For elevators, the influence of streams of people and special situations (e.g., emergency rescues) on elevators is eliminated, and the problem is simplified to facilitate research on caloric costs. The costs of the elevator hoistways between different floors are all set to 1. For example, the cost from the elevator hoistway on floor 1 to the elevator hoistway on floor 2 is 1, as is that from the elevator hoistway on floor 1 to the elevator hoistway on floor 3. Table 5 presents the indoor adjacency matrix. C19 is the elevator hoistway. Clearly, CellDist(C1, C21) = 8 and CellDist(C1, C22) = 8, where C21 is a room cell on floor 2, and C22 is a room cell on floor 3.

4.3. MGSI

4.3.1. MGSH-Tree

The MAC-tree reflects the spatial topological relation but provides relatively weak support for semantic meanings. The present study establishes an MGSH-tree to meet various semantic needs. As shown in Figure 11, semantic keywords are first extracted from the spatial cells. A semantic hierarchy structure is established based on the semantic relations between the keywords. Considering the fine-grained semantic needs and semantic expansion capability, inverted indexing is performed on the leaf nodes of the MGSH-tree. Relations between the semantic keywords and indoor cells are constructed, significantly improving the query performance and ensuring the semantic expansion capability. For example, the semantic hierarchical path of Pizza Hut in Figure 11 is Shopping- > Food- > Pizza- > Pizza Hut. Spaghetti, which is an inverted index keyword, is added to Pizza Hut. Through spaghetti, KFC and Pizza Hut can both be found. When Pizza Hut needs to update its keywords (e.g., a new product, vanilla phoenix-tail prawns, is added), a mapping relation between vanilla phoenix-tailed prawns and Pizza Hut can be established in the inverted index. Thus, semantic expansion is achieved.
Figure 12 shows the algorithm by which the MACSI queries for the nearest semantic cell. The quicksort algorithm is mainly used to obtain the nearest adjacency cell list after rapidly sorting the adjacency distances between the search cell and the target cell.

4.3.2. Semantic Trajectory Modeling

Outdoor semantic trajectory modeling often clusters the geographic locations of the stop points of users and creates semantic trajectories based on the time sequence after forming semantic points [55]. Because an indoor space has a relatively small scale and densely distributed features and the outdoor Euclidean distance is not suitable for an indoor space, the outdoor trajectory modeling methods cannot be used for indoor spaces. Using the MGSH-tree, the present study establishes a semantic hierarchy index for each spatial cell from bottom to top. As a result, the trajectory of a user contains multi-granularity semantic information.
The trajectories in a multi-floor indoor cellular space are different from those in an outdoor Euclidean space. In outdoor indexing, coordinate-based positioning points are stored, whereas the initial trajectory points obtained in an indoor cellular space are the room numbers. As shown in Figure 13, a moving object moves from the Starbucks to the Apple store and stays at the Apple store for 10–30 min, subsequently reaching the Levis store. Then, the moving object goes upstairs to shop. The user’s trajectory can be simply expressed as Starbucks- > Apple- > Levis. However, using only room numbers or brand numbers cannot reflect the user’s behavior on multiple levels.
As shown in Figure 14A, the trajectory of user 1 is Nike- > Puma- > Adidas, the trajectory of user 2 is Guess- > Samsung- > Apple, and the trajectory of user 3 is Nike- > Puma- > Adidas. Based on the method used to process outdoor spaces, the influence of floors is eliminated, and the similarity among the shapes of the indoor planar trajectories is measured. The results show that the trajectories of user 1 and user 2 are more similar. However, user 1 and user 3 are both interested in buying sporting goods. Therefore, the similarity between user 1 and user 3 should be higher. Hence, this method is not suitable for indoor spaces.
Using only the coarse-grained semantic hierarchy will cause the inaccuracy of actual similarity. As shown in Figure 14B in the coarse-grained semantic hierarchy, the cellular space is related to a certain semantic keyword. Clearly, the four users have the similar consumption habit—they are all interested in shopping. However, the differences between the users are not visually reflected. In the fine-grained semantic hierarchy, the similarity between the users can be accurately measured. As shown in Figure 14C, in the fine-grained semantic hierarchy, it’s obvious that user 1 and user 3 are both interested in buying sporting goods, which is consistent with their actual behavior. However, numerous trajectories of indoor moving objects exist. Using only the fine- grained semantic hierarchy will cause the measurement of the similarity between users to fall into a local trap. As shown in Figure 14C, user 4 visits the Apple store when shopping for sporting goods. Based on the longest common subsequence algorithm [56], the similarity between user 1 and user 4 is relatively low, which is inconsistent with the actual situation. In this work, the MGSH-tree is employed to process trajectory sequences and establish a semantic index for both the coarse- and fine-grained semantic hierarchy models to improve the recognition of the users’ behavior. As shown in Figure 14D, the users’ trajectories contain multi-granularity semantic information. User 3 is the most similar to user 1, user 4 is the second most similar to user 1, and user 2 is the least similar to user 1, which is consistent with the actual situation.
Figure 15 describes the algorithm for a semantic trajectory query. The getLcsLength function returns the length of the maximum common sequence between the trajectory keyword sequence of the target and the semantic keyword sequence of the object:

5. Experimental Results and Analysis

This section verifies the search, update and expansion efficiencies of the MACSI through a series of comparative experiments. A personal computer with a 3.6-GHz Intel Core i7-4790 processor and 4-GB random-access memory was used as the operating environment of the program. The program was realized through Java. An adjacency matrix was established based on the plan of a 22-floor building in Tianjin, China, and was used as simulated data. In addition, moving trajectories were generated using the given floor plan. Figure 16 shows the floor plan of the building and the simulated positioning points of moving objects. A shopping center in Beijing, China, was selected as the real-data experimental environment. The shopping center has a building area of 180,000 m2, a business area of 120,000 m2, six aboveground floors and four belowground floors. To support semantic-related queries, the semantic level of each store and brand was manually established. Keywords were extracted from Wikipedia to establish an inverted index. In the real-data environment, 60 moving objects with different ages, genders and backgrounds who were freely shopping were selected, and their indoor moving trajectories were obtained. Figure 17 shows the architectural plan of the real environment and the extracted records of partial trajectories.

5.1. Experimental Results Using the Simulated Dataset

The performed queries on the simulated dataset are shown in Table 3. Considering the impact of the number of cells and objects on the query and update efficiencies, a single variable was used for each group of experiments. To simulate environments ranging from small buildings to large-scale commercial centers, the number of cells was set to 10–3000; the cells were extracted or copied from the simulated data. When the number of cells varied, the number of moving objects was set to 3000. When the number of moving objects varied, the number of cells was set to 1000. To simulate low- to high-congestion conditions, the number of objects was set to 10–10,000. The mean value of 10 runs was used as the result for each group of experiments. For the semantic cells and objects’ queries, the MACSI was compared with the ITD-tree and SI in terms of the query and update efficiencies based on the coarse- and fine-grained semantic cells and objects’ queries. For the semantic trajectory query, the MACSI was compared with the SI in terms of the complex semantic trajectory query performance. Finally, the memory cost for the MACSI, ITD-tree and SI were compared. The results show that when processing semantic cells and object-related queries, the MACSI not only maintains its spatial connectivity search capability but also has better search and update efficiencies for semantic queries. In addition, the MACSI can also support multi-granularity semantic queries, and the memory cost can meet the practical requirements of the application.

5.1.1. Fine-Grained Semantic Cell Query

As shown in Figure 18, when the number of cells increases from 10 to 3000, the query efficiency of the MACSI is superior to those of the SI and ITD-tree, and the query efficiencies of the SI and ITD-tree decrease significantly for the following reason: The SI and ITD-tree do not consider the needs of fine-grained semantic queries and must traverse all of the nodes. In contrast, the MACSI uses an inverted index for fine-grained semantic cells, and an increase in the number of cells will not significantly affect the MACSI. As shown in Figure 19, when the number of objects increases from 10 to 10,000, the search time of the MACSI is maintained within the range of 0.10–0.30 s, and its query efficiency is superior to those of the SI and ITD-tree. The reason is that when the number of cells is fixed, the structural hierarchy of the MACSI is relatively stable. In addition, because semantic cell queries are not significantly related to the number of objects, the query efficiencies of the SI and ITD-tree are also relatively stable.

5.1.2. Coarse-Grained Semantic Cell Query

As shown in Figure 20, as the number of cells increases, the query efficiency of the MACSI is comparable to that of the SI, and both are more efficient than the ITD-tree, which is mainly based on the following reasons. The ITD-tree does not consider the needs of semantic queries and must traverse all the nodes, resulting in a low semantic query efficiency. In comparison, the nodes of the SI and MACSI are both capable of coarse-grained semantic cell queries, and far fewer nodes are searched by the SI and MACSI than by the ITD-tree. Similar to fine-grained semantic cell query, the number of objects exerts a negligible effect on coarse-grained semantic cell query. As shown in Figure 21, as the number of objects increases, the query efficiency of the MACSI is comparable to that of the SI, and the efficiencies of both are superior to that of the ITD-tree. The query efficiencies of the MACSI, SI and ITD-tree are all relatively stable.

5.1.3. Fine-Grained Semantic Object Query

As shown in Figure 22, when the number of cells increases from 10 to 3000, the fine-grained semantic object query efficiency of the MACSI is relatively stable and superior to those of the ITD-tree and SI, which decrease significantly. The main reason for this behavior is that the MACSI indexes semantic objects using an inverted index, whereas the SI and ITD-tree do not have fine-grained semantic indexing capabilities. Thus, increases in the number of cells will increase the numbers of nodes and the hierarchical depths of the SI and ITD-tree. As shown in Figure 23, as the number of objects increases, the query efficiency of the MACSI is superior to those of the ITD-tree and SI and is stable. The query efficiency of the ITD-tree is superior to that of the SI, primarily because the ITD-tree uses delta increment updates and deletes redundant moving objects during the object-update process. Thus, the number of object nodes that the ITD-tree must traverse is relatively low. In comparison, the number of moving object nodes of the SI continues to increase, and its query efficiency will continuously decrease as the number of objects increases.

5.1.4. Coarse-Grained Semantic Object Query

As shown in Figure 24, as the number of cells increases, similar to fine-grained semantic cell query, the structural query efficiency of the MACSI is comparable with that of the SI, and both are more efficient than the ITD-tree. As shown in Figure 25, as the number of objects gradually increases, the query efficiency of the MACSI is comparable with that of the SI. Furthermore, the query efficiencies of both decrease significantly, whereas that of the ITD-tree remains relatively stable, which is mainly because the ITD-tree has a stable hierarchical structure when the number of cells is fixed. In addition, the ITD-tree uses delta increment updates and deletes redundant moving objects in a timely fashion during the object-update process, whereas the MACSI and SI do not. Unlike semantic cell queries, semantic object queries require the traversing of more object nodes, thereby decreasing the queries’ efficiency.

5.1.5. Complex Semantic Trajectory Query

As shown in Figure 26, as the scale of the cells increases, the complex semantic trajectory query efficiency of the MACSI is significantly superior to that of the SI and also exhibits good stability. As shown in Figure 27, as the scale of the objects increases, the MACSI is comparable to the SI when the number of objects is relatively low but is significantly superior once the number of objects reaches 1000. Indeed, when processing complex semantic trajectory query, the MACSI has both coarse-grained and fine-grained semantic indexes and can accurately locate the semantic level and reduce the traversal cost of the semantic tree, thereby relatively quickly finding complex semantic trajectories. In comparison, the SI must traverse each semantic keyword, resulting in low query efficiency.

5.1.6. Semantic Cell Keyword Update Efficiency

As shown in Figure 28, as the number of cells increases, the semantic cell keyword update efficiency of the MACSI is superior to the SI and ITD-tree efficiencies. Increasing the number of cells results in increments in the hierarchical structures of the ITD-tree and SI. Consequently, the number of cell nodes that must be traversed increases. In contrast, the MACSI uses a hash index for fine-grained semantic indexing and can ensure relatively high update efficiency. As shown in Figure 29, as the scale of the objects increases, the update efficiency of the MACSI is superior to those of the ITD-tree and SI. In addition, the update efficiencies of the MACSI, ITD-tree and SI are relatively stable, which is mainly because the update of semantic cell keywords is not significantly related to the objects.

5.1.7. Memory Cost

Figure 30 shows a comparison of the memory cost for the different index structures with varying numbers of cells. As the number of cells increases, the memory costs of the MACSI, the SI and the ITD-tree increase significantly. The memory cost of the MACSI is higher than that of the SI and the ITD-tree, and the ITD-tree has the best performance. This is mainly because the MACSI has the capacity to index both semantic and unit spaces through the MAC-tree, the MGSI and multiple auxiliary tables, the cost of which is the need for more memory space to support the index structure and strategy, which is a typical space-for-time strategy. However, the MACSI still controls the memory cost relatively well. When there are 3000 cells, the memory cost is only 1.4 Mb, indicating that the MACSI still performs well in terms of memory cost for building structures for large-scale business centers. Figure 31 shows the memory cost as a function of the number of objects. Similar to the pattern for the change in the memory cost with the number of cells, the memory cost of the MACSI and the SI increases significantly for an increasing number of objects. In comparison, the memory cost of the ITD-tree is relatively low and stable, which is similar to the pattern shown in Figure 21. This is mainly because the ITD-tree uses delta increment updates and deletes redundant moving objects in a timely fashion. Based on the aforementioned experimental results and from the perspective of space consumption, the MACSI integrates semantic space and cell space and needs more memory compared to the ITD-tree and the SI, although it still performs well for actual application scenarios in terms of memory costs.

5.2. Results of the Experiments Using the Real Dataset

Figure 32 shows the results for the semantic cells, objects, trajectory queries and semantic updates listed in Table 3 for the real data environment. For fine-grained semantic queries, the MACSI only requires 16 ms to query a specific moving object and 7 ms to query a specific semantic cell. In comparison, due to the lack of the capacity to execute fine-grained semantic queries, the SI and the ITD-tree require more than 2 s to execute a specific semantic cell query and more than 1 s to execute a specific semantic object query. Clearly, the MACSI has better query performance in fine-grained semantic-related queries. For coarse-grained semantic-related queries, the MACSI is significantly advantageous over the ITD-tree and comparable to the SI in terms of performance. The MACSI only requires 192 ms to execute a coarse-grained semantic moving object query and 16 ms to execute a coarse-grained semantic cell query, whereas the ITD-tree has particularly low coarse-grained semantic query execution efficiency. For semantic trajectory queries, the specific semantic trajectory query efficiency increases by over one fold when using the semantic structure proposed in the present study compared to the SI. For semantic update-related operations, the MACSI only requires 4 ms to execute a semantic update operation, which is better than the SI (145 ms) and the ITD-tree (165 ms). The MACSI has better performance in semantic update operations.
To demonstrate the reliability improvement from using MACSI to extend single-floor applications to multi-floor indoor spaces using spatial syntax and caloric costs, a moving object is located at a certain location in the real data environment, and the 10-nearest semantic cells are identified (e.g., the 10-nearest lavatories to object O1; the position of the moving object and the search results are shown in Figure 33). The actual arrival time is measured using the timers in mobile phones. Table 6 and Table 7 compare the actual arrival times among MACSI, ITD-tree and SI. As shown in Table 6, the actual arrival time from the location of the moving object to D is 47 s. By comparison, B and C, which are located on the same floor as the moving object, take 75 s and 105 s, respectively. ITD-tree and SI are indexes based on a single-floor indoor space. When these indexes search in spatial space (e.g., a k-nearest neighbor search), the floor where the moving object is located will be searched first, followed by different floors, and thus, the ranking result of ITD-Tree and SI is B-C-D, which is unreliable. In comparison, MACSI incorporates indoor cells on different floors into a unified index, and its ranking result is D-B-C (as shown in Table 7), which is more reliable. As another example, ITD-tree and SI place J (located on the 5th floor) at the end of the sequence even though the actual arrival time to move from the location of the moving object to J requires only 70 s, which is superior to other locations (e.g., G, H, I). By analyzing the other sorting results shown in Table 6 and Table 7, we can clearly conclude that the search results of MACSI are more comprehensive and reliable than indexes based on single-floor indoor spaces.
For memory costs, the MACSI memory cost is 238 kb for the real data, the SI is 117 kb, and the ITD-tree is 68 kb. Similar to the simulated data, the MACSI consumes more memory than the ITD-tree and SI, although its memory cost is still maintained at a low level. In addition, other experimental parameters were observed, e.g., the initialization and node insertion processes of the MACSI are relatively complex. The execution time required for the initialization and node insertion process of the MACSI are fairly long. Therefore, the MACSI is suitable for applications that are insensitive to initialization and insertion time but sensitive to real-time queries.

6. Conclusions and Outlook

The MACSI expands single-floor indoor adjacency cellular spaces. In addition, it subdivides open cells (e.g., hallways and lobbies) using space syntax to ensure the reasonableness of the adjacency cellular spaces and to optimize connected cells (e.g., stairs and elevators) based on the caloric cost. Given the specific needs of indoor semantic queries, the present study proposes a MGSH-tree and uses inverted indexing to improve the semantic query efficiency and expansion capability. Furthermore, a formal representation for indoor semantic trajectories based on the MGSH-tree is proposed, and the semantic trajectories of moving objects are indexed. A comparative analysis of the MACSI, ITD-tree and SI using simulated-data and real-data environments confirmed that the MACSI expands the application of indexing from single-floor indoor spaces to multi-floor indoor spaces and provides more accurate spatial query results. In addition, the MACSI has better spatial and sematic query performance, lower semantic update costs, and better semantic expansion capability. In addition, the MACSI uses auxiliary tables to combine cellular and semantic spaces; thus, the MACSI’s memory cost is higher than that of the ITD-tree and SI, although it still has a good memory cost control capability, which can meet the practical requirements of certain applications.
Currently, several studies addressing the indexing of indoor moving objects remain to be completed. We plan to make improvements in the following areas in the future. Future research could consider dynamic adjacency matrices to adapt to structural changes in buildings. Additionally, an outdoor Euclidean space could be seamlessly connected with an indoor cellular space to realize integrated indexing of indoor and outdoor moving objects. We only consider the response time and memory cost in the current evaluation. In the future, we can learn from the ideas applied in big data applications [57], which collect user interaction data from mobile phones and then evaluate indices from different angles, such as user satisfaction, actual arrival time, and other indicators.

Acknowledgments

This study was supported by the National Science-technology Support Plan of China (Grant No. 2015BAJ02B00), and Youth Foundation of Institute of Remote Sensing and Digital Earth, CAS (Y5SJ1100CX).

Author Contributions

Hui Lin, Ling Peng and Tianhe Chi had the original idea for the study; Hui Lin and Tianyue Liu designed the experiments; Hui Lin and Si Chen performed the experiments; Hui Lin, Ling Peng and Si Chen wrote the paper.

Conflicts of Interest

The authors declare no conflict of interest.

References

  1. Klepeis, N.E.; Nelson, W.C.; Ott, W.R.; Robinson, J.P.; Tsang, A.M.; Switzer, P.; Behar, J.V.; Hern, S.C.; Engelmann, W.H. The national human activity pattern survey (NHAPS): A resource for assessing exposure to environmental pollutants. J. Expo. Anal. Environ. Epidemiol. 2001, 11, 231–252. [Google Scholar] [CrossRef] [PubMed]
  2. Subway, B. Passenger Flow Information. Available online: http://www.bjsubway.com/support/cxyd/klxx/ (accessed on 7 March 2016).
  3. Petrenko, A.; Bell, S.; Stanley, K.; Qian, W.; Sizo, A.; Knowles, D. Human Spatial Behavior, Sensor Informatics, and Disaggregate Data; Springer: Cham, Switzerland, 2013. [Google Scholar]
  4. Schougaard, K.R.; Grønbæk, K.; Scharling, T. Indoor Pedestrian Navigation Based on Hybrid Route Planning and Location Modeling; Springer: Berlin, Germany, 2012. [Google Scholar]
  5. Liu, T.; Chi, T.; Li, H.; Rui, X.; Lin, H. A GIS-oriented location model for supporting indoor evacuation. Int. J. Geogr. Inf. Sci. 2014, 29, 305–326. [Google Scholar] [CrossRef]
  6. Want, R. Rfid explained: A Primer on Radio Frequency Identification Technologies. In Synthesis Lectures on Mobile & Pervasive Computing; Morgan & Claypool Publishers: San Rafael, CA, USA, 2006. [Google Scholar]
  7. Bahl, P.; Padmanabhan, V.N. Radar: An in-building RF-based user location and tracking system. In Proceedings of the Nineteenth Annual Joint Conference of the IEEE Computer and Communications Societies (INFOCOM 2000), Tel Aviv, Israel, 26–30 March 2000.
  8. Bell, S.; Jung, W.R.; Krishnakumar, V. Wifi-Based Enhanced Positioning Systems: Accuracy through Mapping, Calibration, and Classification. In Proceedings of the 2nd ACM Sigspatial International Workshop on Indoor Spatial Awareness, San Jose, CA, USA, 3–5 November 2010.
  9. Wheeler, A. Commercial applications of wireless sensor networks using zigbee. IEEE Commun. Mag. 2007, 45, 70–77. [Google Scholar] [CrossRef]
  10. Jin, P.Q.; Na, W.; Zhang, X.X.; Yue, L.H. Moving object data management for indoor spaces. Chin. J. Comput. 2015. [Google Scholar] [CrossRef]
  11. Berry, P.L.J.; Bell, S. Pointing accuracy: Does individual pointing accuracy differ for indoor vs. Outdoor locations? J. Environ. Psychol. 2014, 38, 175–185. [Google Scholar] [CrossRef]
  12. Bell, S.; Wei, T.; Jung, W.R.; Scott, A. A conceptual model of trust for indoor positioning systems. In Proceedings of the 3rd ACM Sigspatial International Workshop on Indoor Spatial Awareness, Chicago, IL, USA, 1–4 November 2011.
  13. Wei, T.; Bell, S. Impact of Indoor Location Information Reliability on Users’ Trust of an Indoor Positioning System; Springer: Berlin/Heidelberg, Germany, 2012. [Google Scholar]
  14. Alamri, S.; Taniar, D.; Safar, M.; Al-Khalidi, H. Spatiotemporal indexing for moving objects in an indoor cellular space. Neurocomputing 2013, 122, 70–78. [Google Scholar] [CrossRef]
  15. Jensen, C.S.; Lu, H.; Yang, B. Indexing the trajectories of moving objects in symbolic indoor space. In Proceedings of the 11th International Symposium (SSTD 2009), Aalborg, Denmark, 8–10 July 2009.
  16. Alamri, S.; Taniar, D.; Safar, M. Indexing moving objects in indoor cellular space. In Proceedings of the 2012 15th International Conference on Network-Based Information Systems (NBiS), Melbourne, Australia, 26–28 September 2012; pp. 38–44.
  17. Alamri, S.; Taniar, D.; Safar, M.; Al-Khalidi, H. A connectivity index for moving objects in an indoor cellular space. Pers. Ubiquitous Comput. 2014, 18, 1–15. [Google Scholar] [CrossRef]
  18. Ben, T.; Qin, X.; Wang, N. A semantic-based indexing for indoor moving objects. Int. J. Distrib. Sens. Netw. 2014, 2014, 1–12. [Google Scholar] [CrossRef]
  19. Šaltenis, S.; Jensen, C.S.; Leutenegger, S.T.; Lopez, M.A. Indexing the positions of continuously moving objects. In Proceedings of the ACM International Conference on Management of Data and Symposium on Principles of Database Systems, Dallas, TX, USA, 15–18 May 2000.
  20. Tao, Y.; Papadias, D.; Sun, J. The TPR*-tree: An optimized spatio-temporal access method for predictive queries. In Proceedings of the 29th International Conference on Very Large Data Bases, Berlin, Germany, 9–12 September 2003; pp. 790–801.
  21. Tao, Y.; Papadias, D. MV3R-tree: A spatio-temporal access method for timestamp and interval queries. In Proceedings of 27th International Conference on Very Large Data Bases (VLDB 2001), Roma, Italy, 11–14 September 2001; pp. 431–440.
  22. Nascimento, M.A.; Silva, J.R.O. Towards historical R-trees. In Proceedings of the 1998 ACM Symposium on Applied Computing, Atlanta, GA, USA, 27 February–1 March 1998; pp. 235–240.
  23. Pfoser, D.; Jensen, C.S.; Theodoridis, Y. Novel approaches in query processing for moving object trajectories. In Proceedings of the 26th International Conference on Very Large Data Bases (VLDB 2000), Cairo, Egypt, 10–14 September 2000; pp. 395–406.
  24. Frentzos, E. Indexing objects moving on fixed networks. In Proceedings of the International Symposium on Advances in Spatial and Temporal Databases (SSTD 2003), Santorini Island, Greece, 24–27 July 2003; pp. 289–305.
  25. Almeida, V.T.D. Indexing the trajectories of moving objects in Networks. In Proceedings of the 16th International Conference on Scientific and Statistical Database Management, Santorini Island, Greece, 21–23 June 2004.
  26. Ding, Z.M. An index structure for frequently updated network-constrained moving object trajectories. Chin. J. Comput. 2012, 35, 1448–1461. [Google Scholar] [CrossRef]
  27. Vanclooster, A.; Nico, V.D.W.; De Maeyer, P. Integrating indoor and outdoor spaces for pedestrian navigation guidance: A review. Trans. GIS 2016, 20, 491–525. [Google Scholar] [CrossRef]
  28. Worboys, M. Modeling indoor space. In Proceedings of the 3rd ACM SIGSPATIAL International Workshop on Indoor Spatial Awareness (ISA 2011), Chicago, IL, USA, 1–4 November 2011; pp. 1–6.
  29. Zlatanova, S.; Sithole, G.; Nakagawa, M.; Zhu, Q. Problems in indoor mapping and modelling. ISPRS 2013, XL-4/W4, 36–68. [Google Scholar] [CrossRef]
  30. Kim, J.S.; Kang, H.Y.; Lee, T.H.; Li, K.J. Topology of the prism model for 3D indoor spatial objects. In Proceedings of the Tenth International Conference on Mobile Data Management: Systems, Services and Middleware, Taipei, Taiwan, 18–20 May 2009; pp. 698–703.
  31. Elfes, A. Using occupancy grids for mobile robot perception and navigation. Computer 1989, 22, 46–57. [Google Scholar] [CrossRef]
  32. Demyen, D.; Buro, M. Efficient triangulation-based pathfinding. In Proceedings of the 23rd AAAI Conference on Artificial Intelligence, Vancouver, BC, Canada, 2007; pp. 161–163.
  33. Mekni, M. Automated Generation of Geometrically-Precise and Semantically-Informed Virtual Geographic Environments Populated with Spatially-Reasoning Agents; Universal-Publishers: Boca Raton, FL, USA, 2010. [Google Scholar]
  34. Wallgrün, J.O. Hierarchical Voronoi Graphs; Springer: Berlin/Heidelberg, Germany, 2010. [Google Scholar]
  35. Penninga, F.; Oosterom, P.V.; Kazar, B.M. A Tetrahedronized Irregular Network Based DBMS Approach for 3D Topographic Data Modeling; Springer: Berlin/Heidelberg, Germany, 2006. [Google Scholar]
  36. Zhao, F.; Luo, H.Y.; Lin, Q.; Yan, M.A. Node localization algorithm based on kernel function and Markov chains. J. Commun. 2010, 31, 195–204. [Google Scholar]
  37. Jensen, C.S.; Lu, H.; Yang, B. Graph model based indoor tracking. In Proceedings of the Tenth International Conference on Mobile Data Management (MDM 2009), Taipei, Taiwan, 18–20 May 2009; pp. 122–131.
  38. Yang, B.; Lu, H.; Jensen, C.S. Probabilistic threshold K nearest neighbor queries over moving objects in symbolic indoor space. In Proceedings of the International Conference on Extending Database Technology (EDBT 2010), Lausanne, Switzerland, 22–26 March 2010; pp. 335–346.
  39. Yuan, W.; Schneider, M. Supporting continuous range queries in indoor space. In Proceedings of the 2010 Eleventh International Conference on Mobile Data Management, Kansas City, MO, USA, 23–26 May 2010; pp. 209–214.
  40. Kang, H.Y.; Kim, J.S.; Li, K.J. Strack: Tracking in indoor symbolic space with RFID sensors. In Proceedings of the 18th SIGSPATIAL International Conference on Advances in Geographic Information Systems, San Jose, CA, USA, 2–5 November 2010; pp. 502–505.
  41. Becker, T.; Nagel, C.; Kolbe, T.H. A multilayered space-event model for navigation in indoor spaces. In 3D Geo-Information Sciences; Springer: Berlin/Heidelberg, Germany, 2008; pp. 61–77. [Google Scholar]
  42. Li, X.; Claramunt, C.; Ray, C. A grid graph-based model for the analysis of 2D indoor spaces. Comput. Environ. Urban Syst. 2010, 34, 532–540. [Google Scholar] [CrossRef]
  43. Zlatanova, S.; Liu, L.; Sithole, G. A conceptual framework of space subdivision for indoor navigation. In Proceedings of the 5th ACM Sigspatial International Workshop on Indoor Spatial Awareness, Orlando, FL, USA, 5–8 November 2013; pp. 37–41.
  44. Zlatanova, S.; Liu, L.; Sithole, G.; Zhao, J.; Mortari, F.; Liu, L.; Sithole, G.; Zhao, J.; Mortari, F. Space Subdivision for Indoor Applications; Delft University of Technology: Delft, The Netherlands.
  45. Shin, S.S.; Kim, G.; Bae, H.Y. Adaptive cell-based index for moving objects in indoor. Ksii Trans. Internet Inf. Syst. 2012, 6, 1815–1830. [Google Scholar] [CrossRef]
  46. Hillier, B. Space Is the Machine; Cambridge University Press: Cambridge UK, 1996. [Google Scholar]
  47. Jiang, B.; Claramunt, C. Integration of space syntax into GIS: New perspectives for urban morphology. Trans. GIS 2002, 6, 295–309. [Google Scholar] [CrossRef]
  48. Jiang, B.; Claramunt, C.; Klarqvist, B. Integration of space syntax into GIS for modelling urban spaces. Int. J. Appl. Earth Obs. Geoinf. 2013, 2, 161–171. [Google Scholar] [CrossRef]
  49. Jin, P.; Zhang, L.; Zhao, J.; Zhao, L.; Yue, L. Semantics and modeling of indoor moving objects. Int. J. Multimed. Ubiquitous Eng. 2012, 7, 153–158. [Google Scholar]
  50. Lymberopoulos, D.; Liu, J.; Yang, X.; Choudhury, R.R.; Handziski, V.; Sen, S. A realistic evaluation and comparison of indoor location technologies. In Proceedings of the 14th International Conference on Information Processing in Sensor Networks, Seattle, WA, USA, 14–16 April 2015; pp. 178–189.
  51. Bassett, D.R.; Vachon, J.A.; Kirkland, A.O.; Howley, E.T.; Duncan, G.E.; Johnson, K.R. Energy cost of stair climbing and descending on the college alumnus questionnaire. Med. Sci. Sports Exerc. 1997, 29, 1250–1254. [Google Scholar] [CrossRef] [PubMed]
  52. Butts, N.K.; Dodge, C.; Mcalpine, M. Effect of stepping rate on energy costs during stairmaster exercise. Med. Sci. Sports Exerc. 1993, 25, 378–382. [Google Scholar] [CrossRef] [PubMed]
  53. Chuan, T.K.; Abdul Rashid, A. Heart rate, oxygen uptake, and energy cost of ascending and descending the stairs. Med. Sci. Sports Exerc. 2002, 34, 695–699. [Google Scholar]
  54. Froelicher, V.F.; Myers, J. Effect of exercise on the heart and the prevention of coronary heart disease—Exercise and the heart (fifth edition)—Chapter thirteen. Exerc. Heart 2006, 419–459. [Google Scholar]
  55. Li, Q.; Zheng, Y.; Xie, X.; Chen, Y.; Liu, W.; Ma, W.Y. Mining user similarity based on location history. In Proceedings of the 16th ACM SIGSPATIAL International Symposium on Advances in Geographic Information Systems (ACM-GIS 2008), Irvine, CA, USA, 5–7 November 2008; pp. 1–10.
  56. Rick, C. New algorithms for the longest common subsequence problem. J. ACM 1977, 24, 664–675. [Google Scholar]
  57. Liang, T.; Lai, H.; Ku, Y. Personalized content recommendation and user satisfaction: Theoretical synthesis and empirical findings. J. Manag. Inf. Syst. 2006, 23, 45–70. [Google Scholar] [CrossRef]
Figure 1. Euclidean distance and real distance.
Ijgi 05 00176 g001
Figure 2. Moving object distance in an outdoor space.
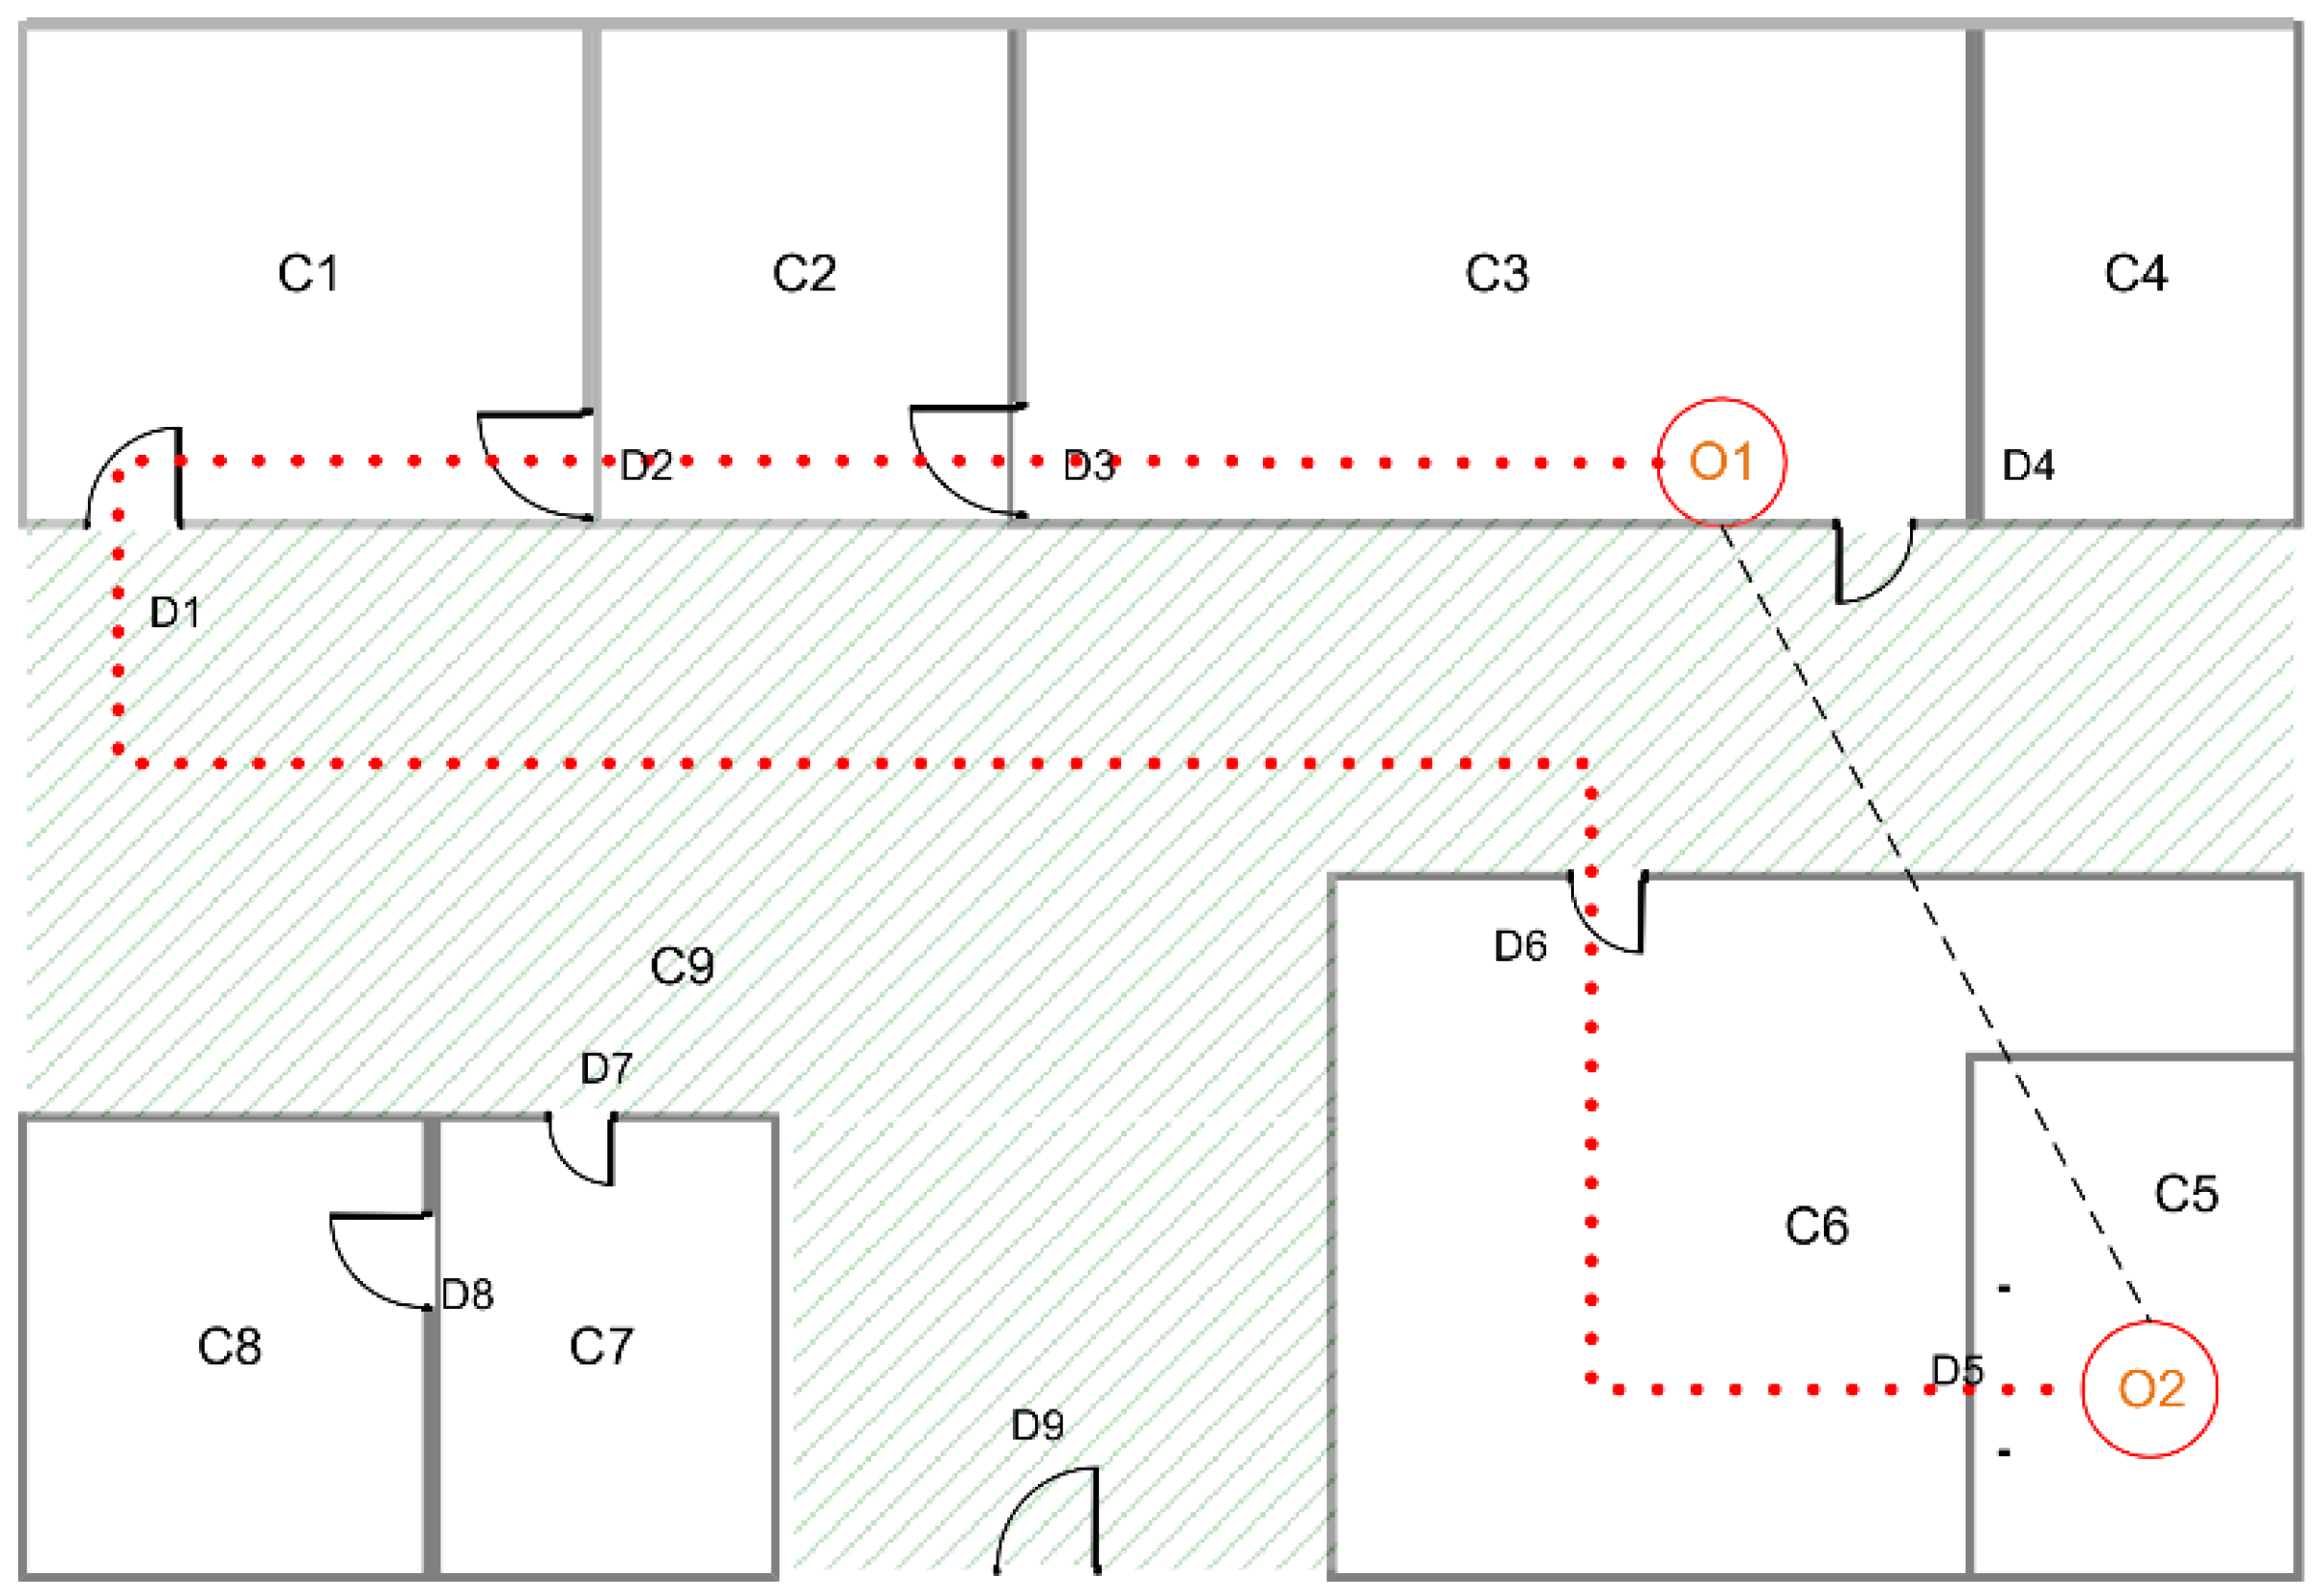
Ijgi 05 00176 g002
Figure 3. Record of a moving object’s travel through an indoor space.
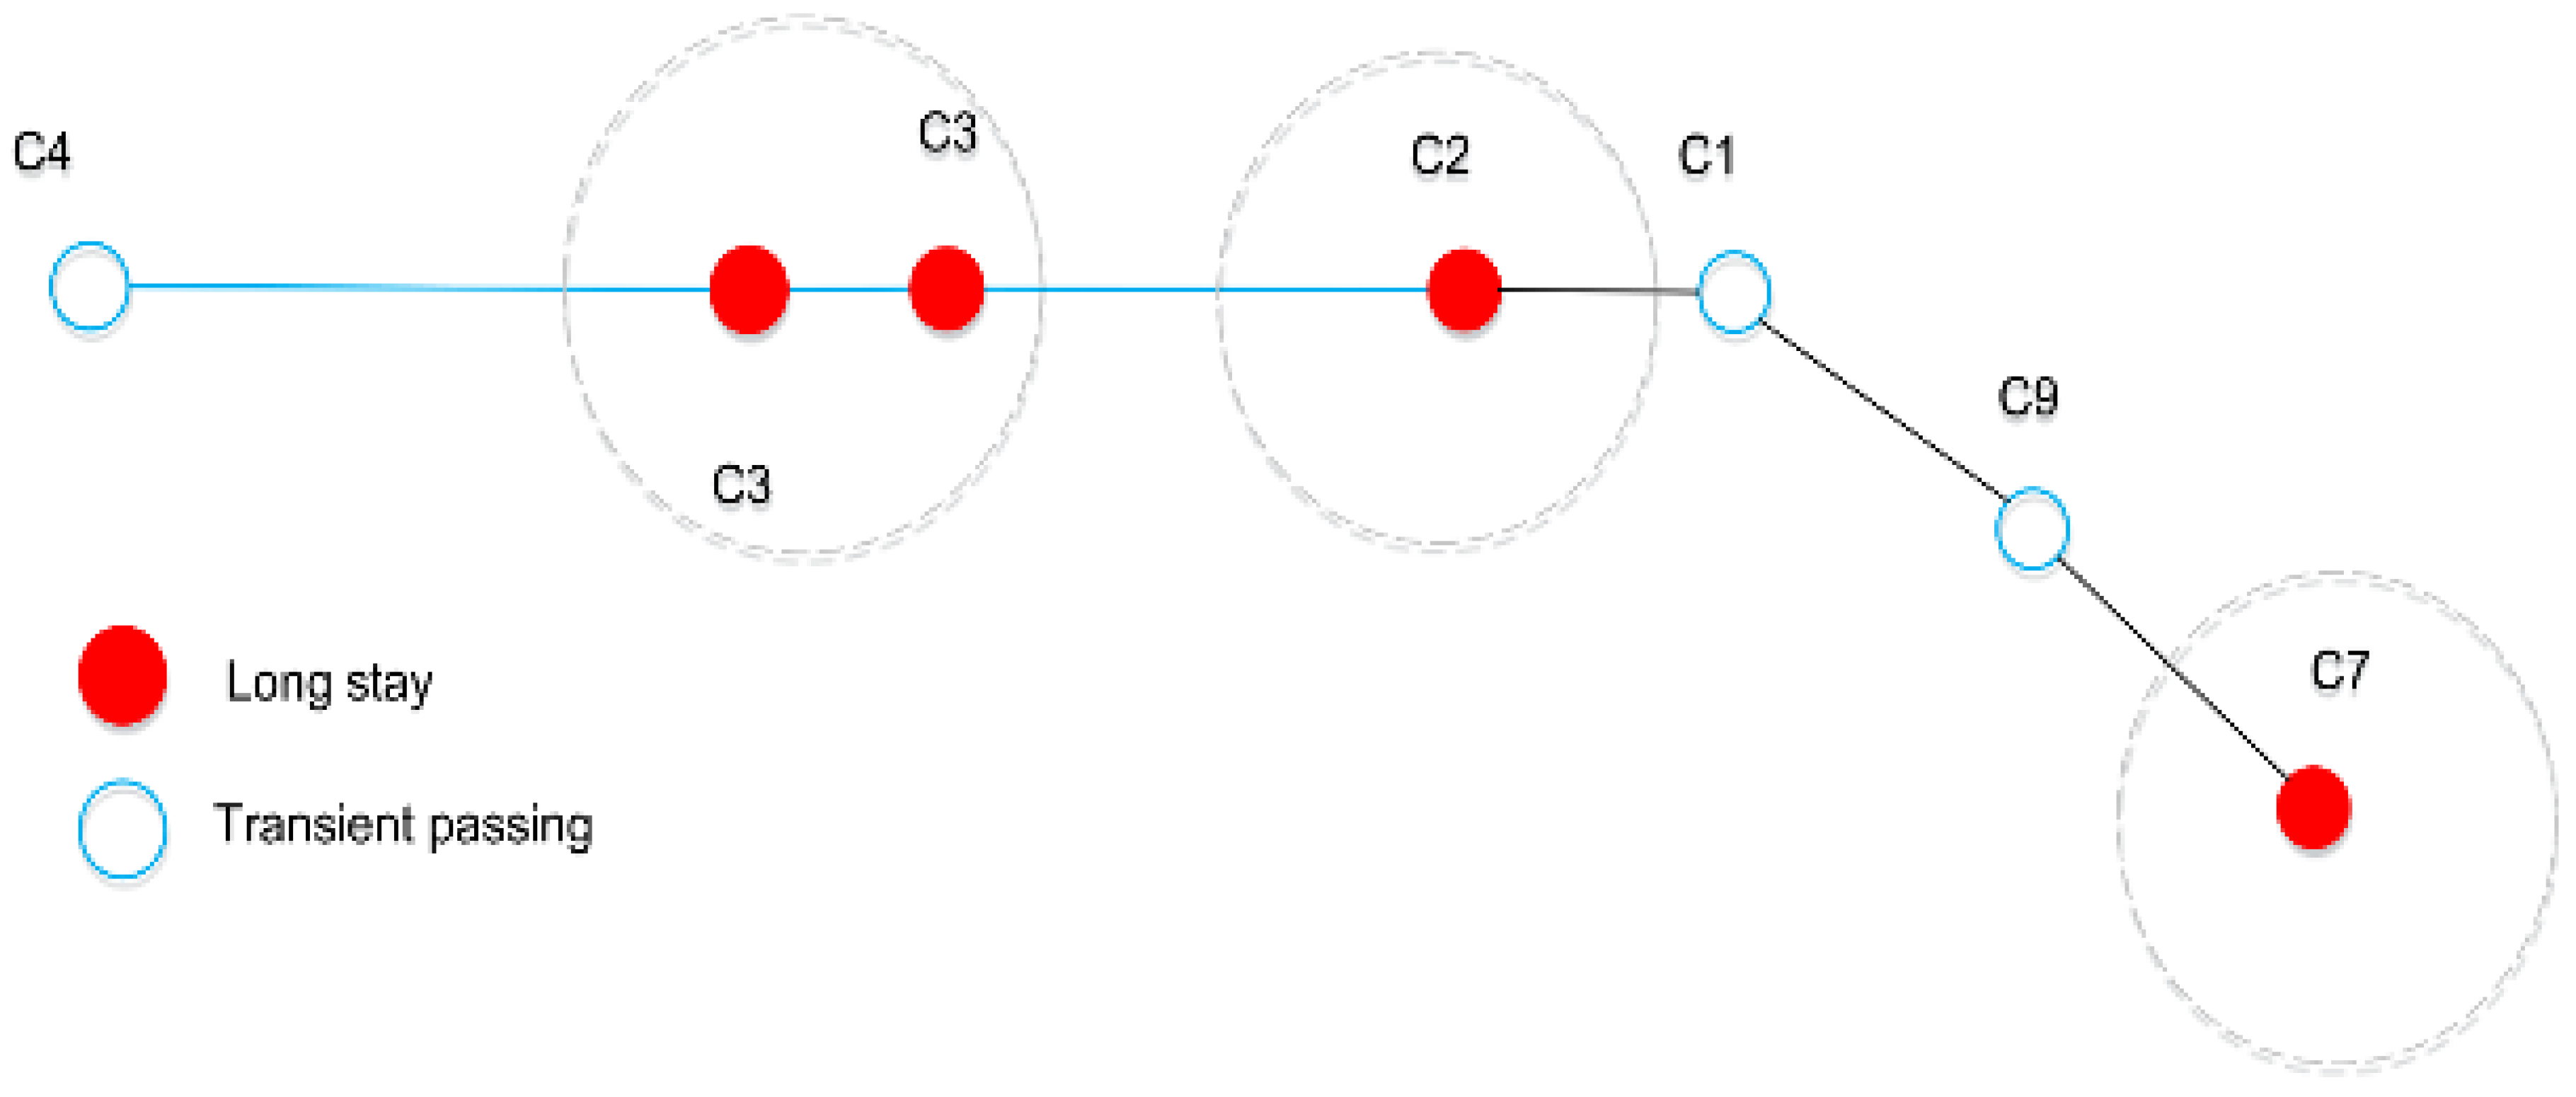
Ijgi 05 00176 g003
Figure 4. The sequence of a moving object trajectory.
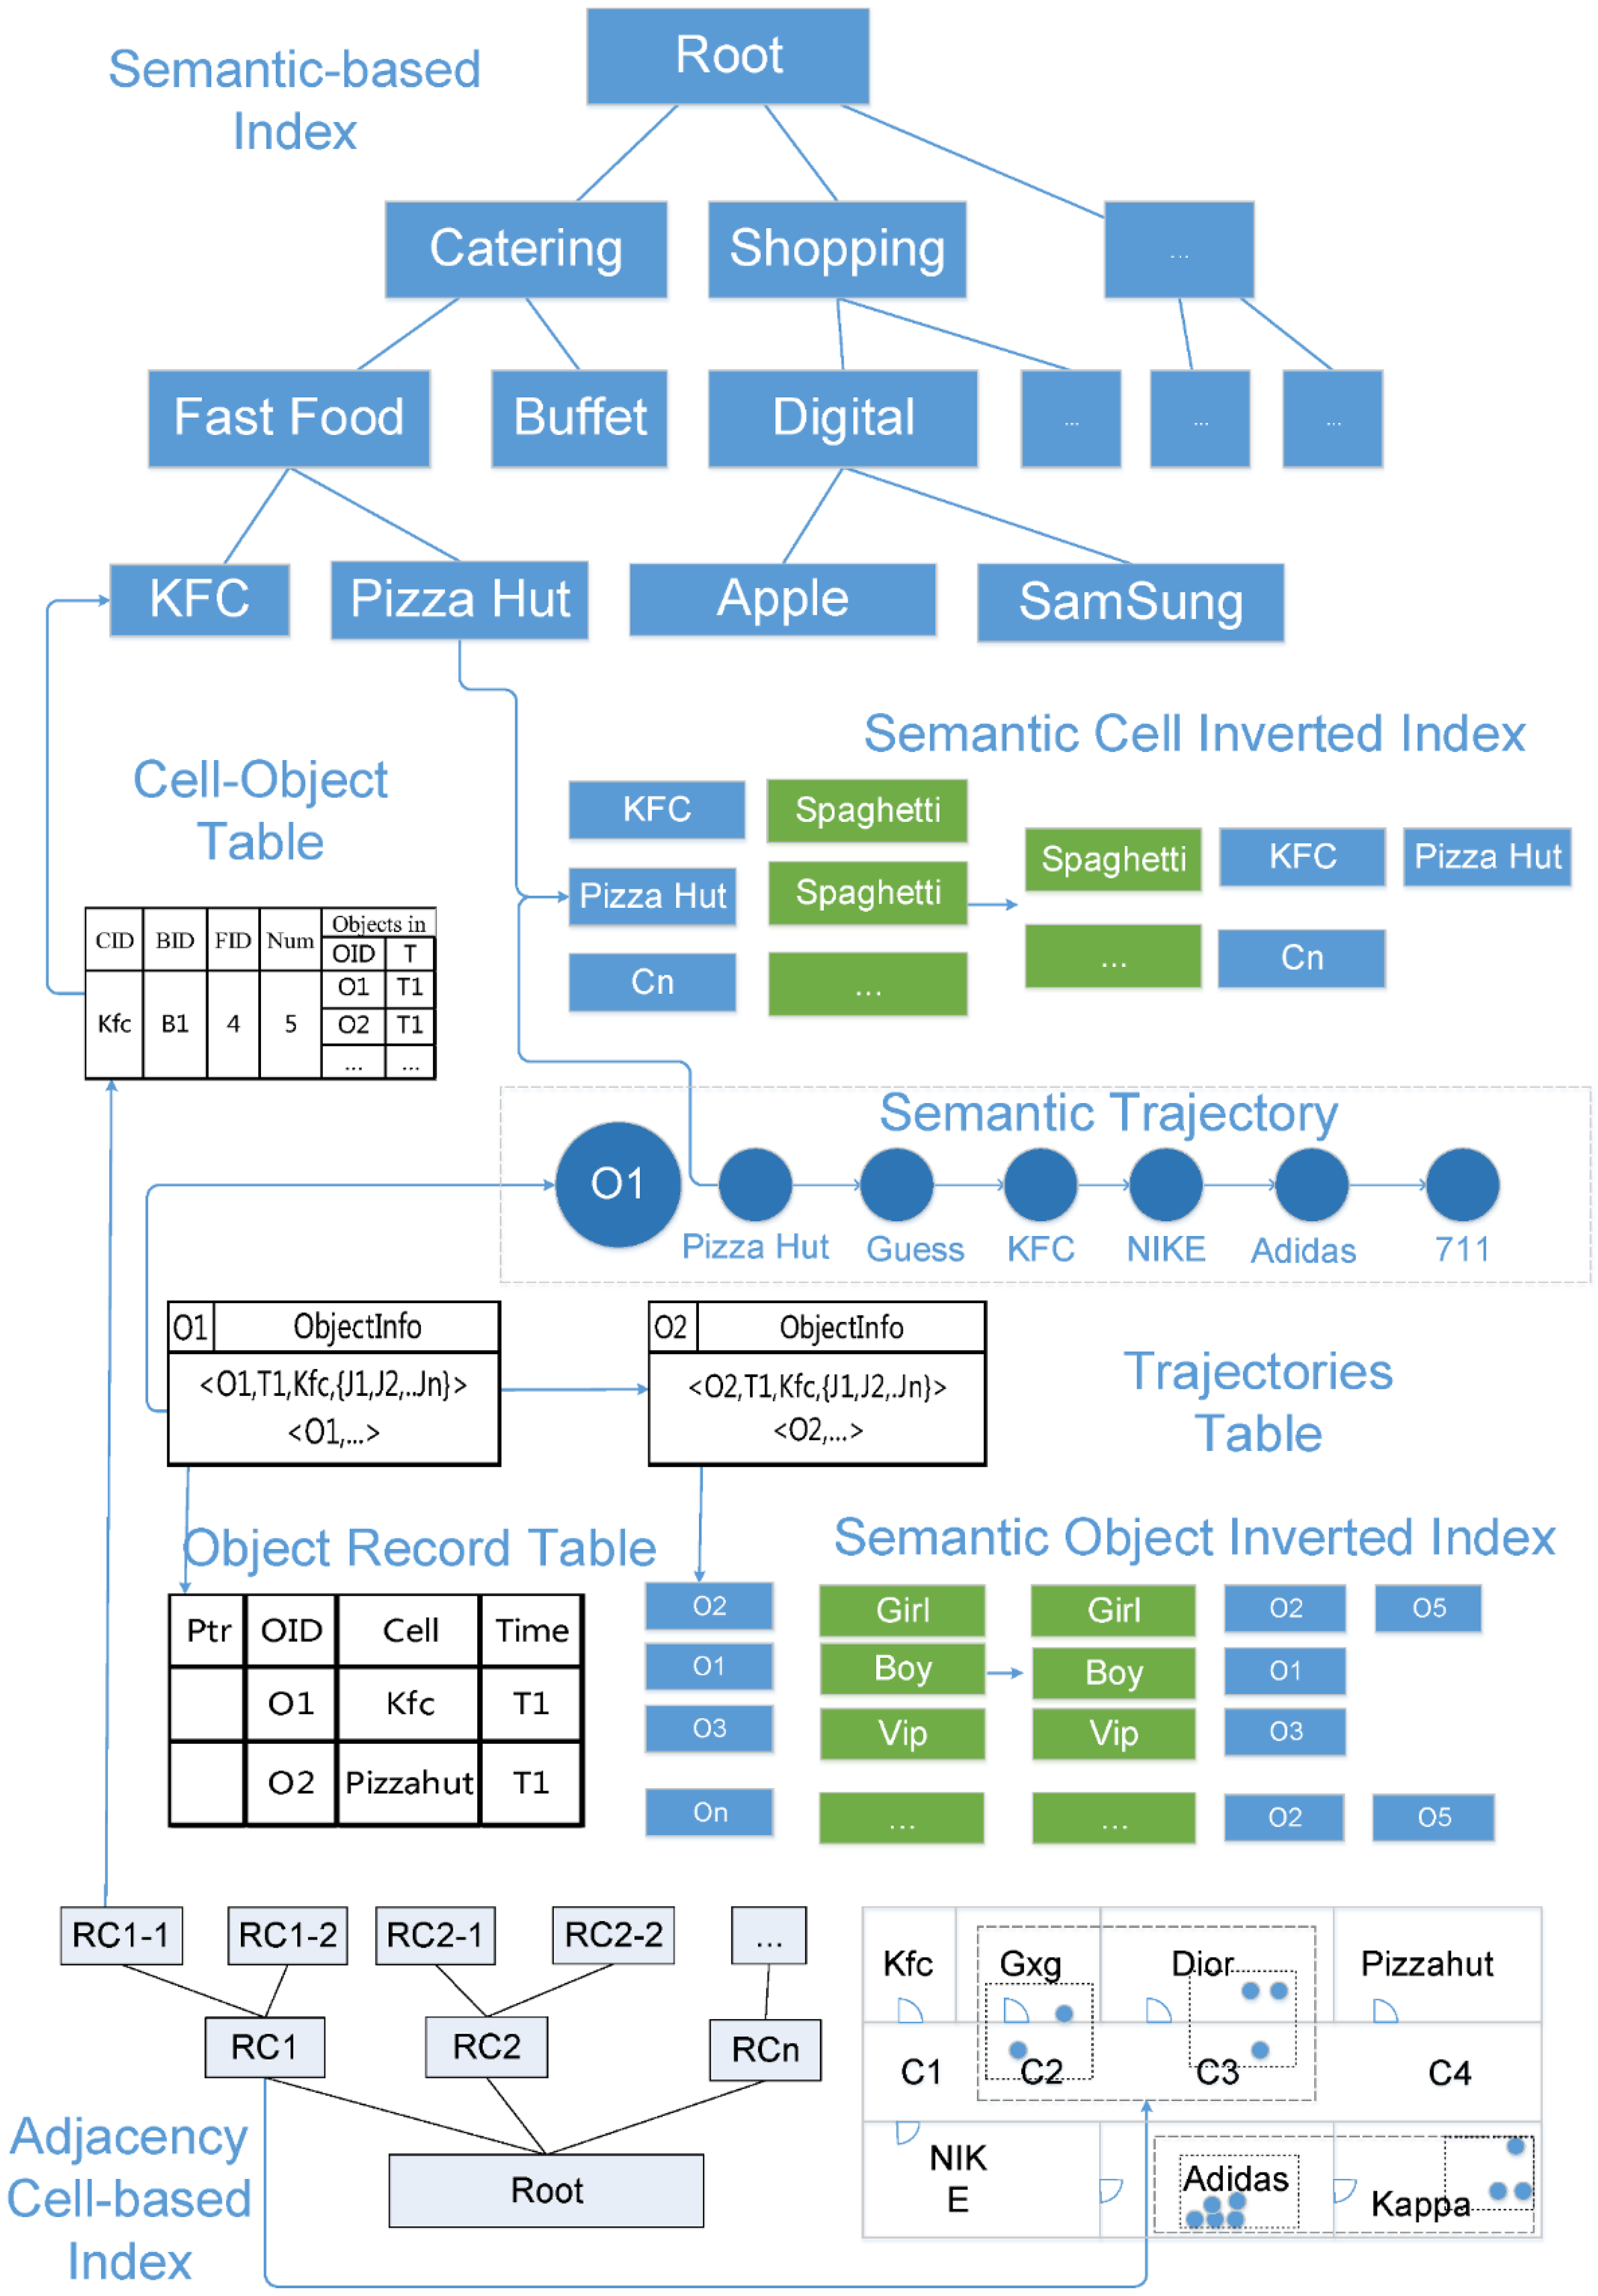
Ijgi 05 00176 g004
Figure 5. Overall structure of the MACSItree. Dark backgrounds indicate semantic-related elements.
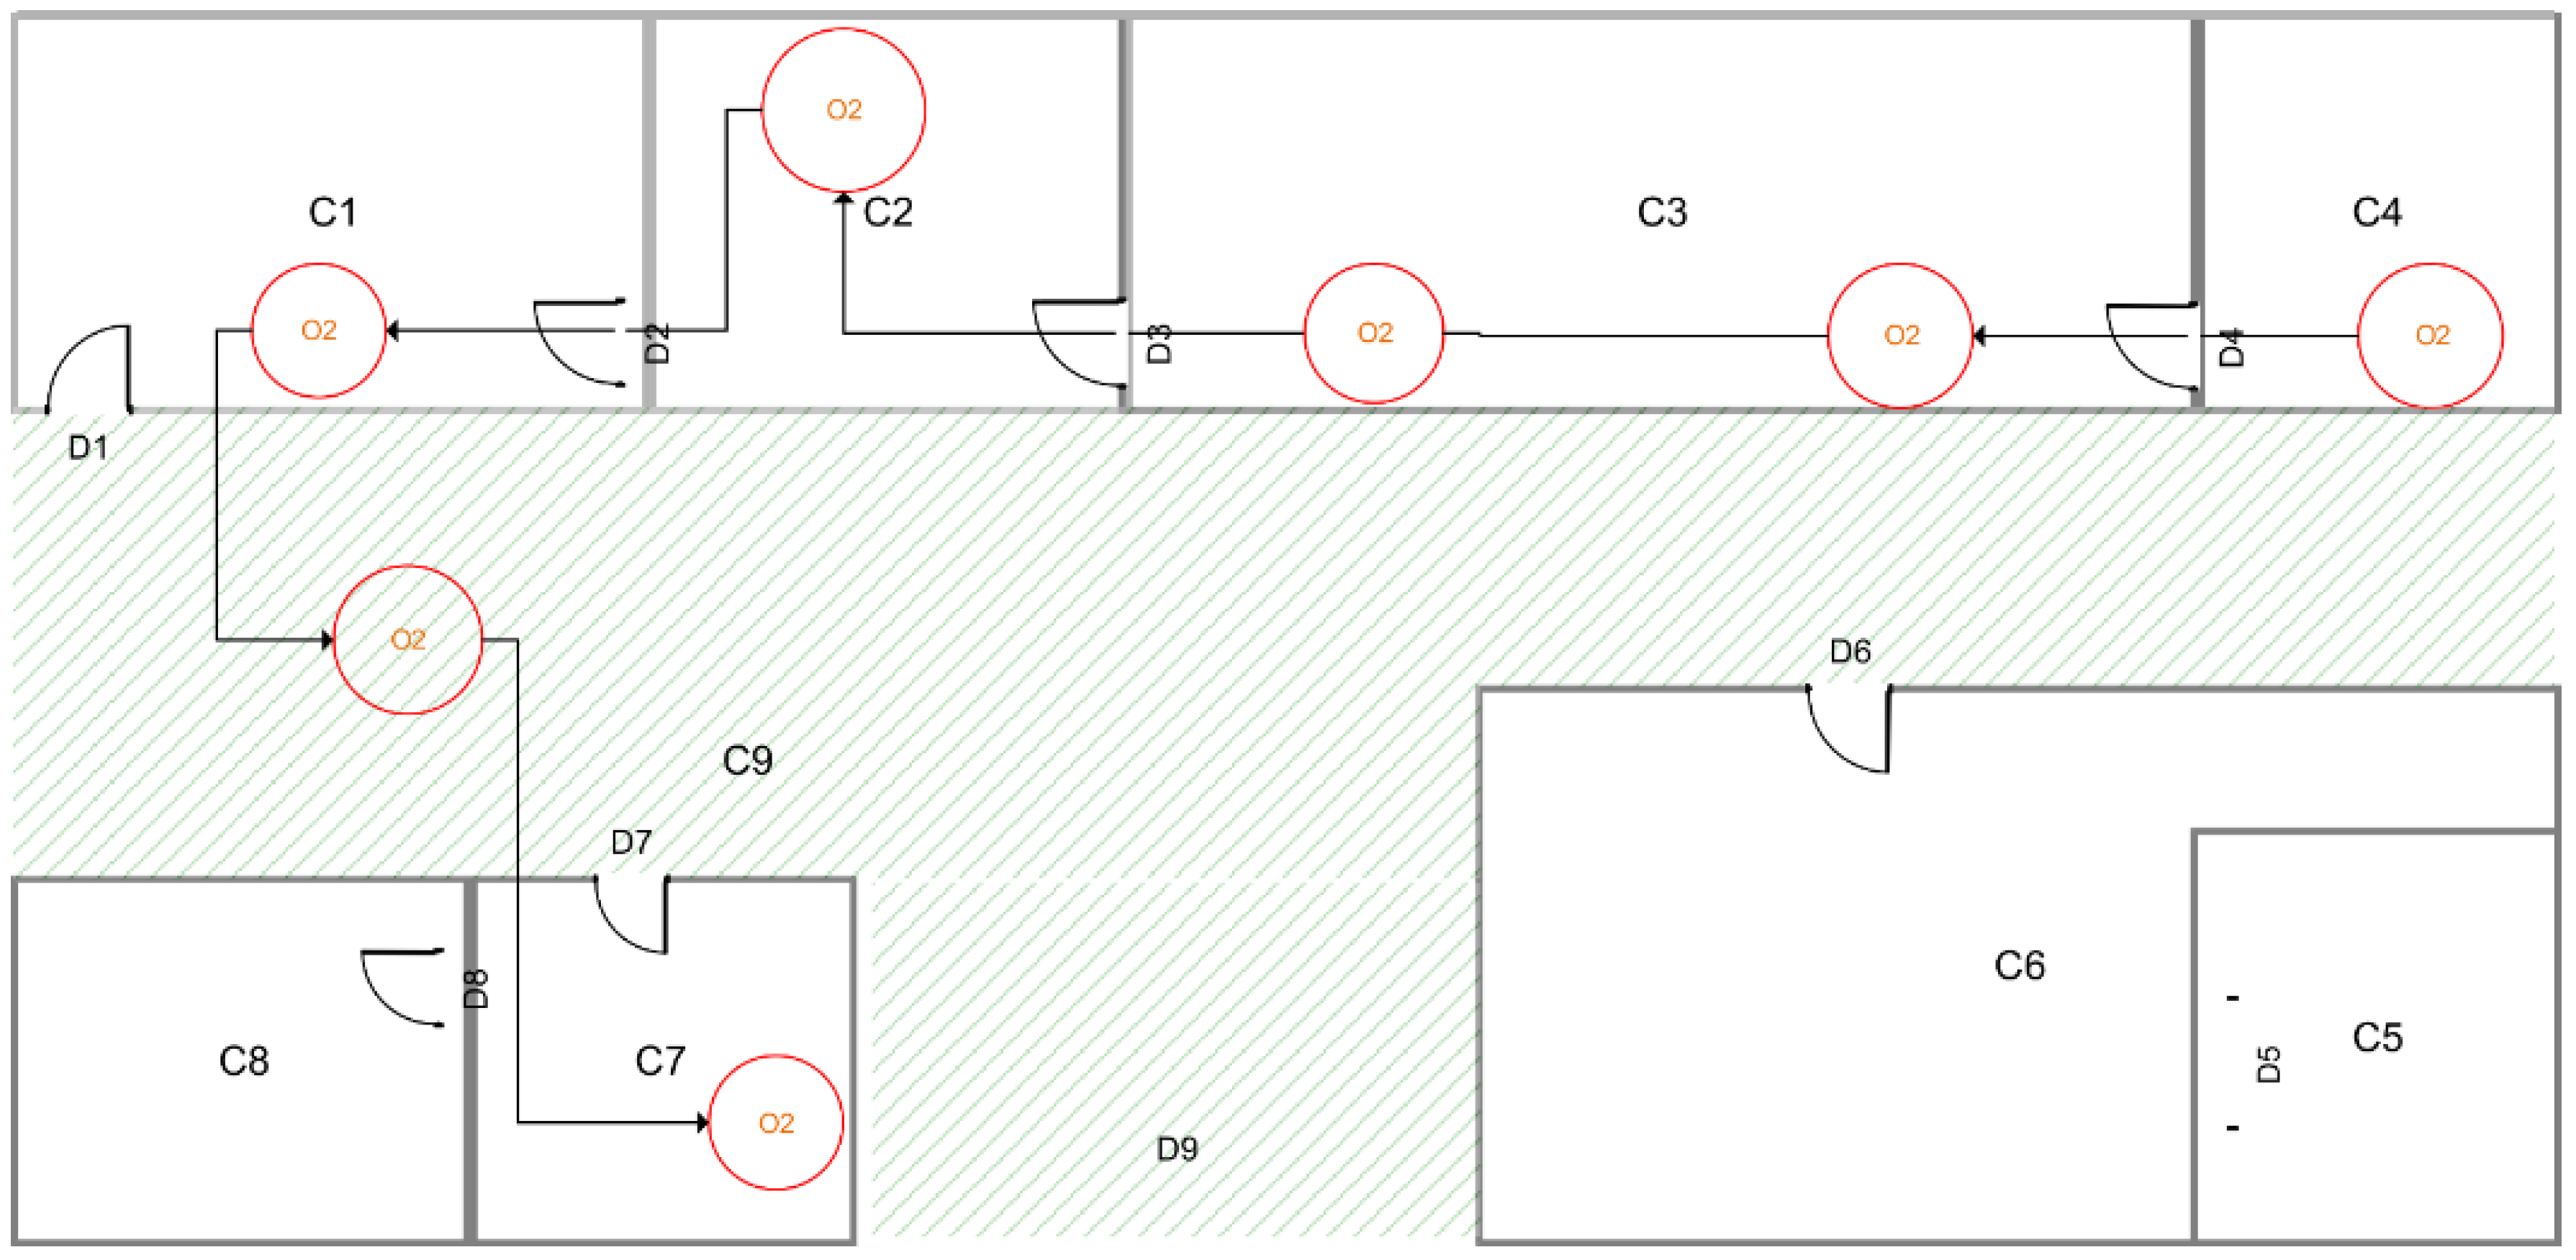
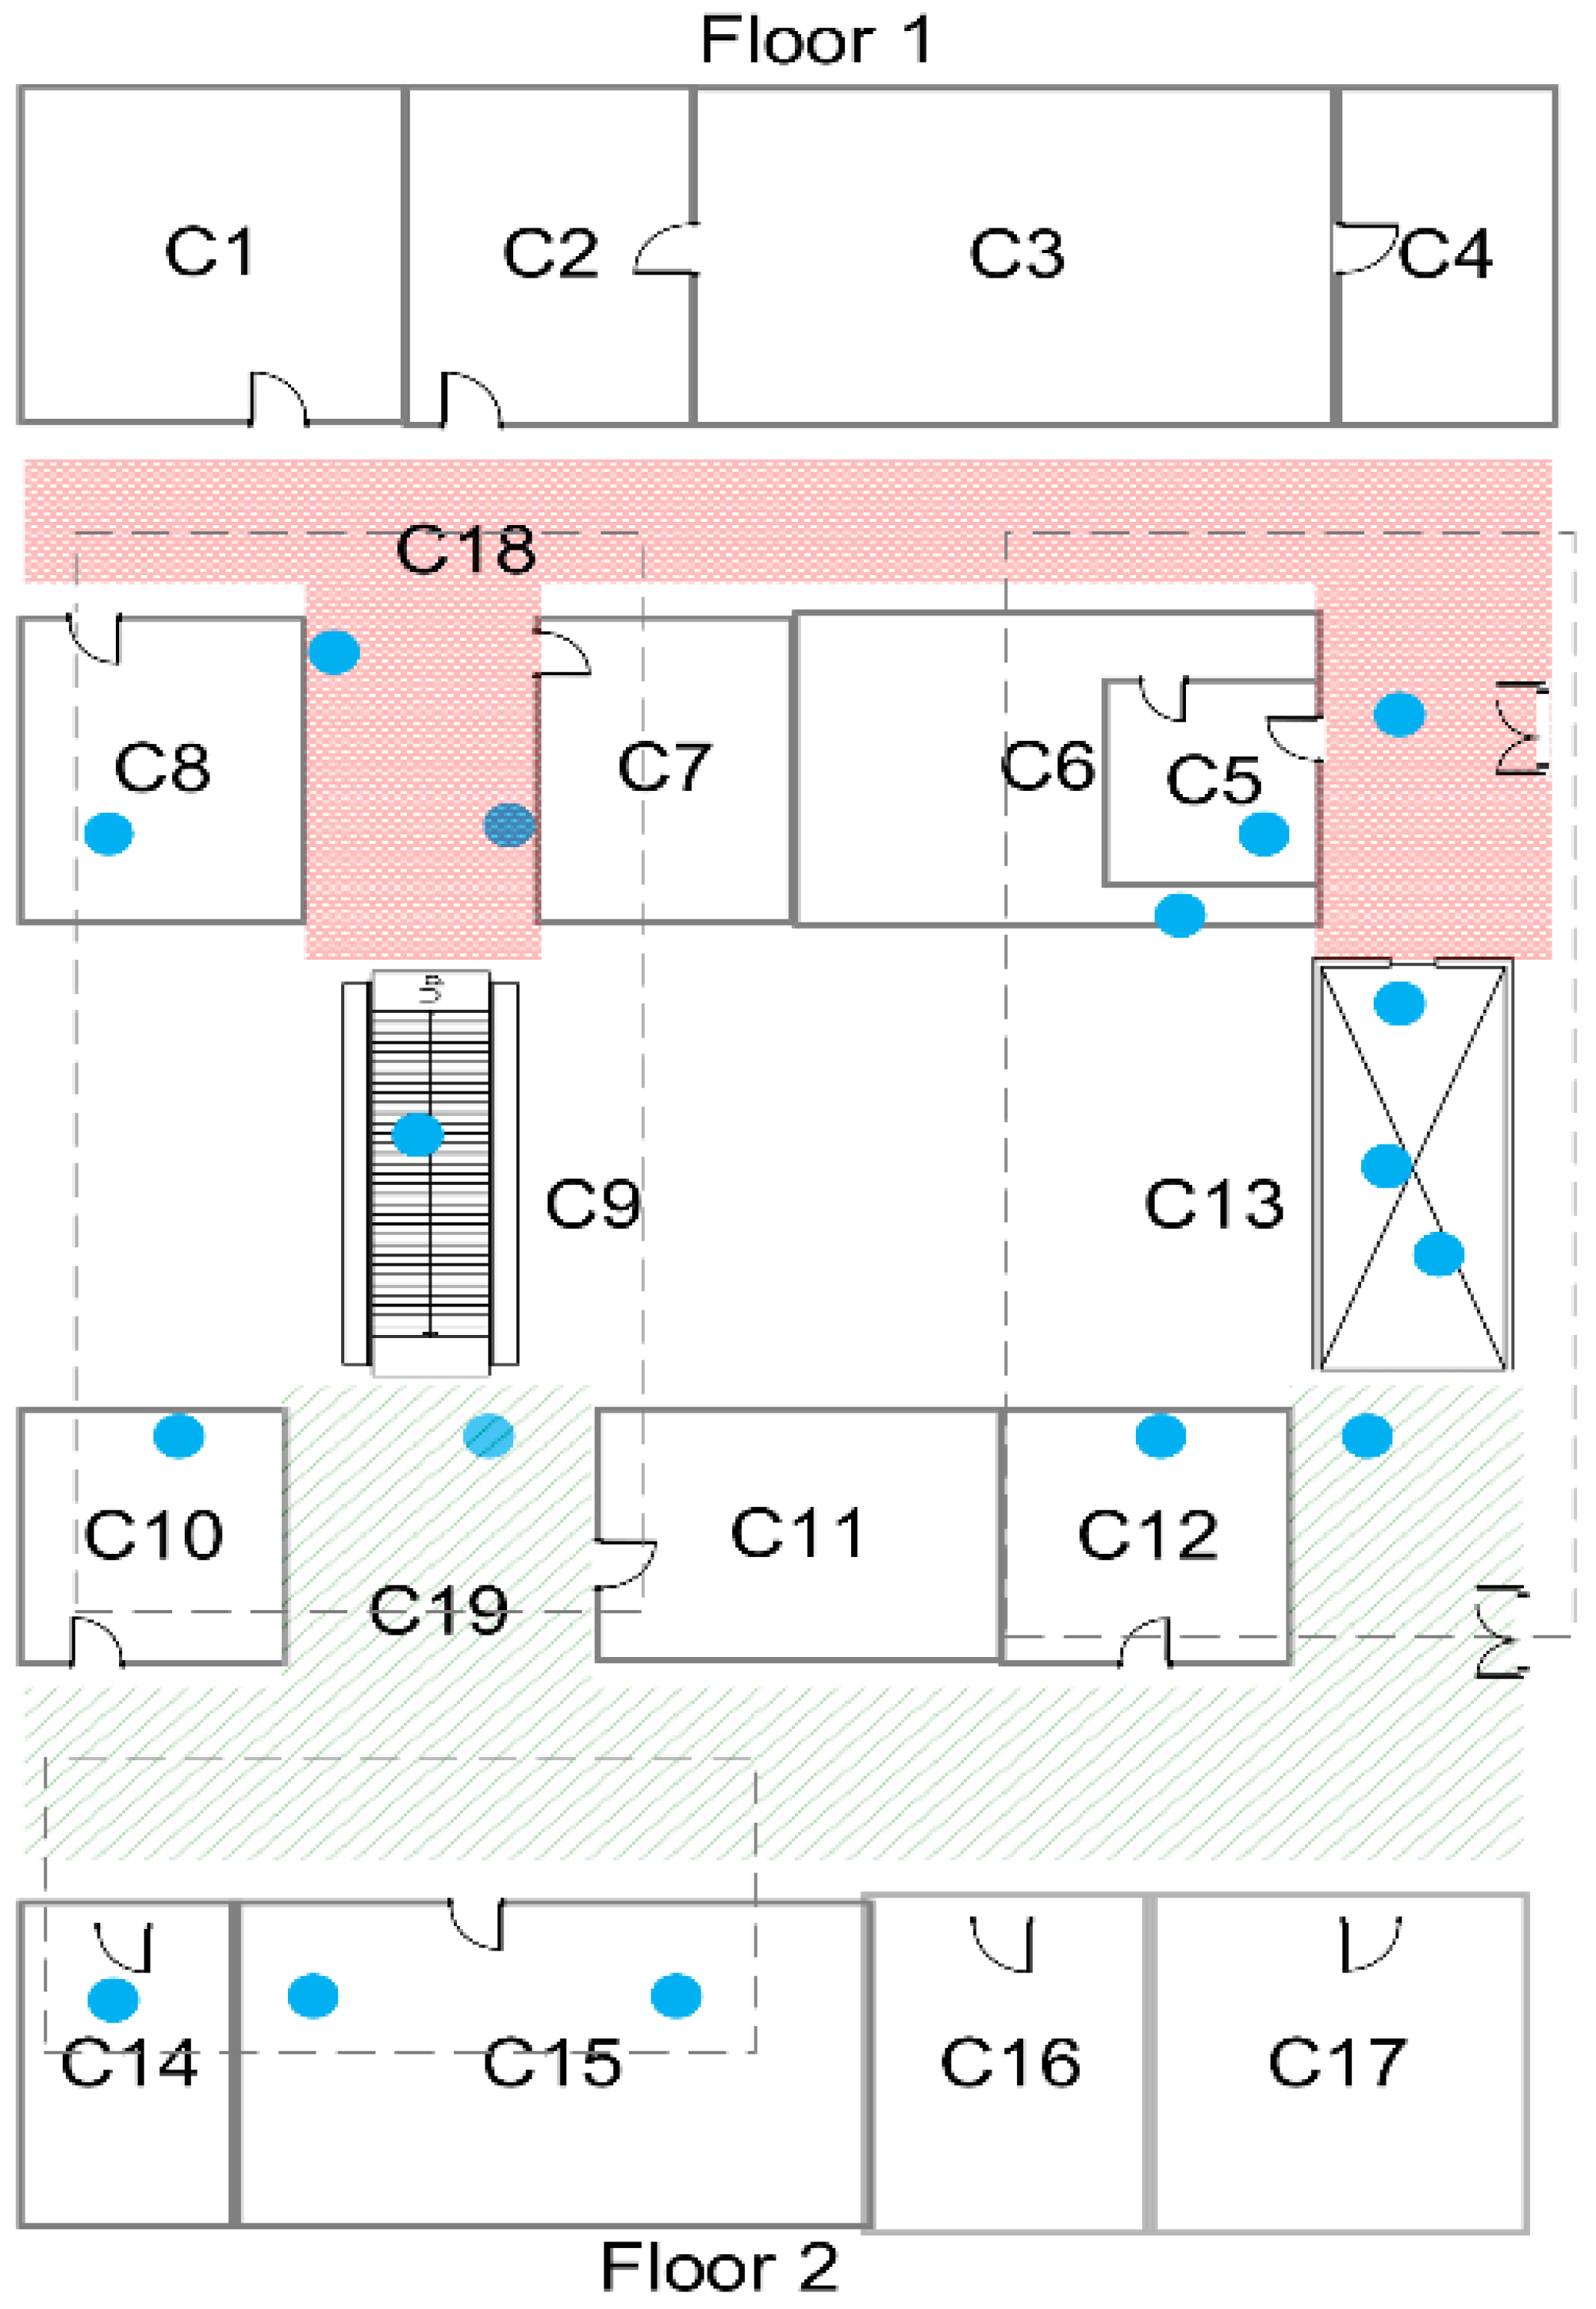
Ijgi 05 00176 g005
Figure 6. Indoor cellular space. C9 is the stairwell, C13 is the elevator, and C18 is the hallway. The top view is floor 1, and the bottom view is floor 2.
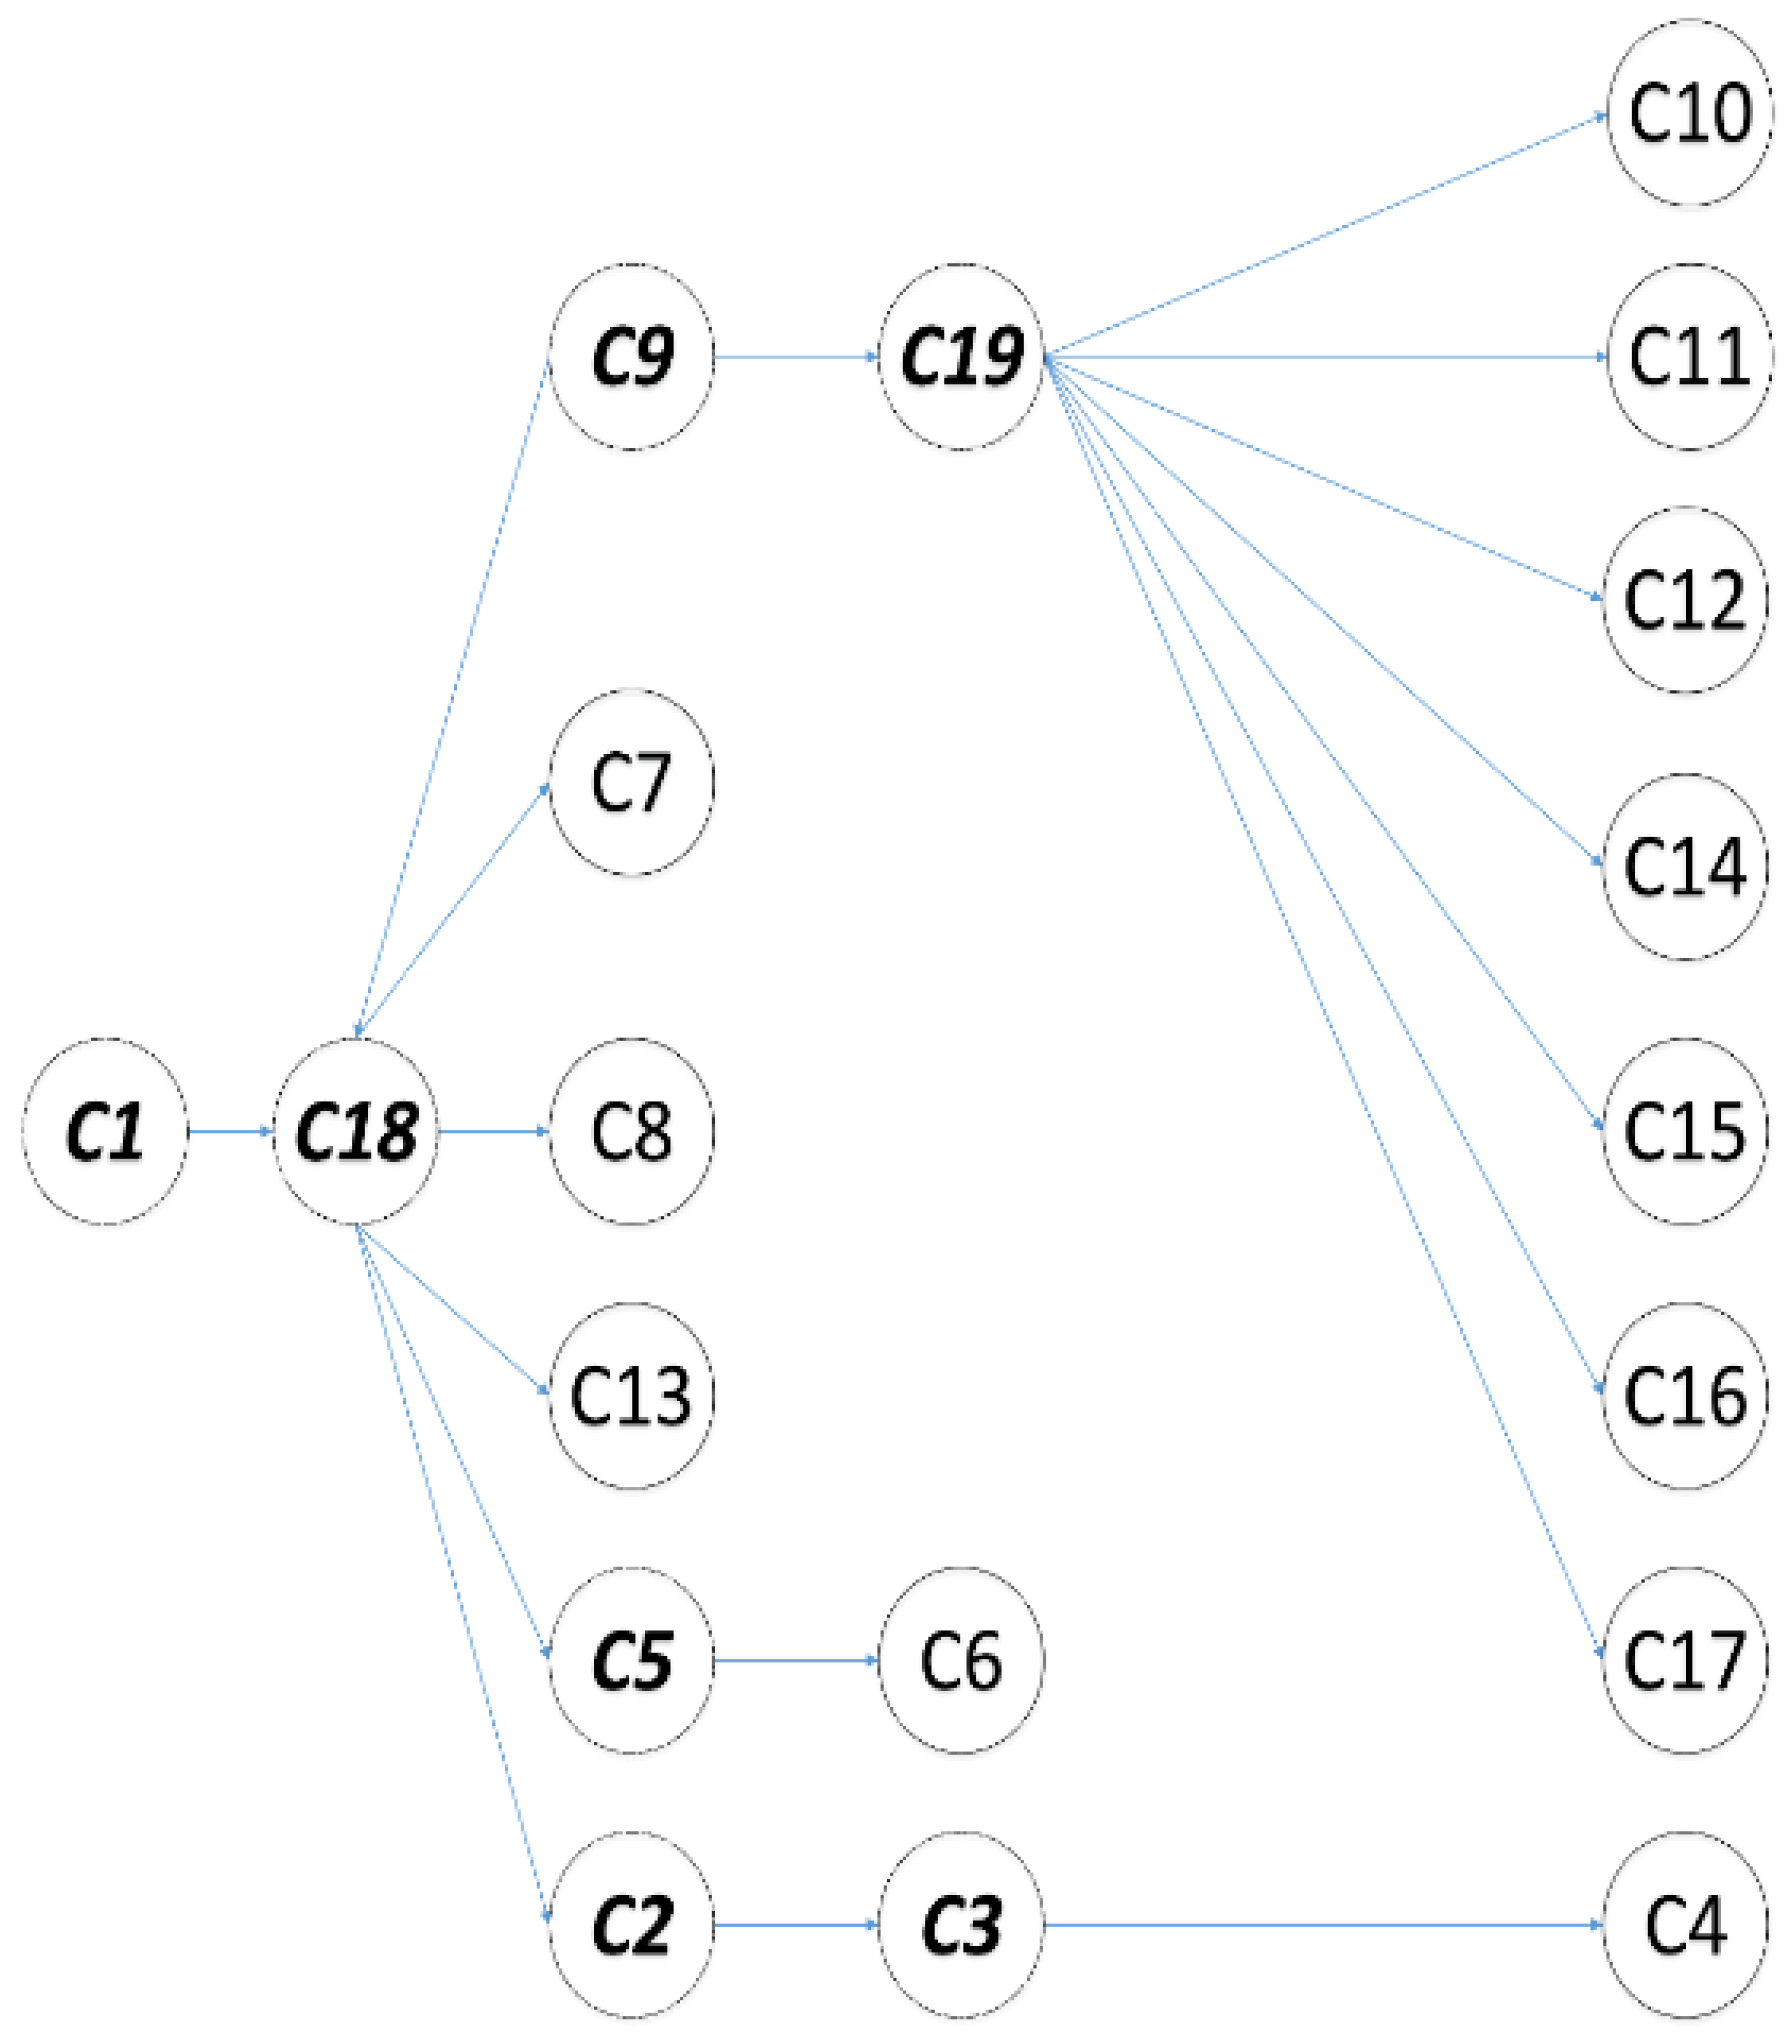
Ijgi 05 00176 g006
Figure 7. Expansion algorithm. The points with bold italic numbers are expansion points.
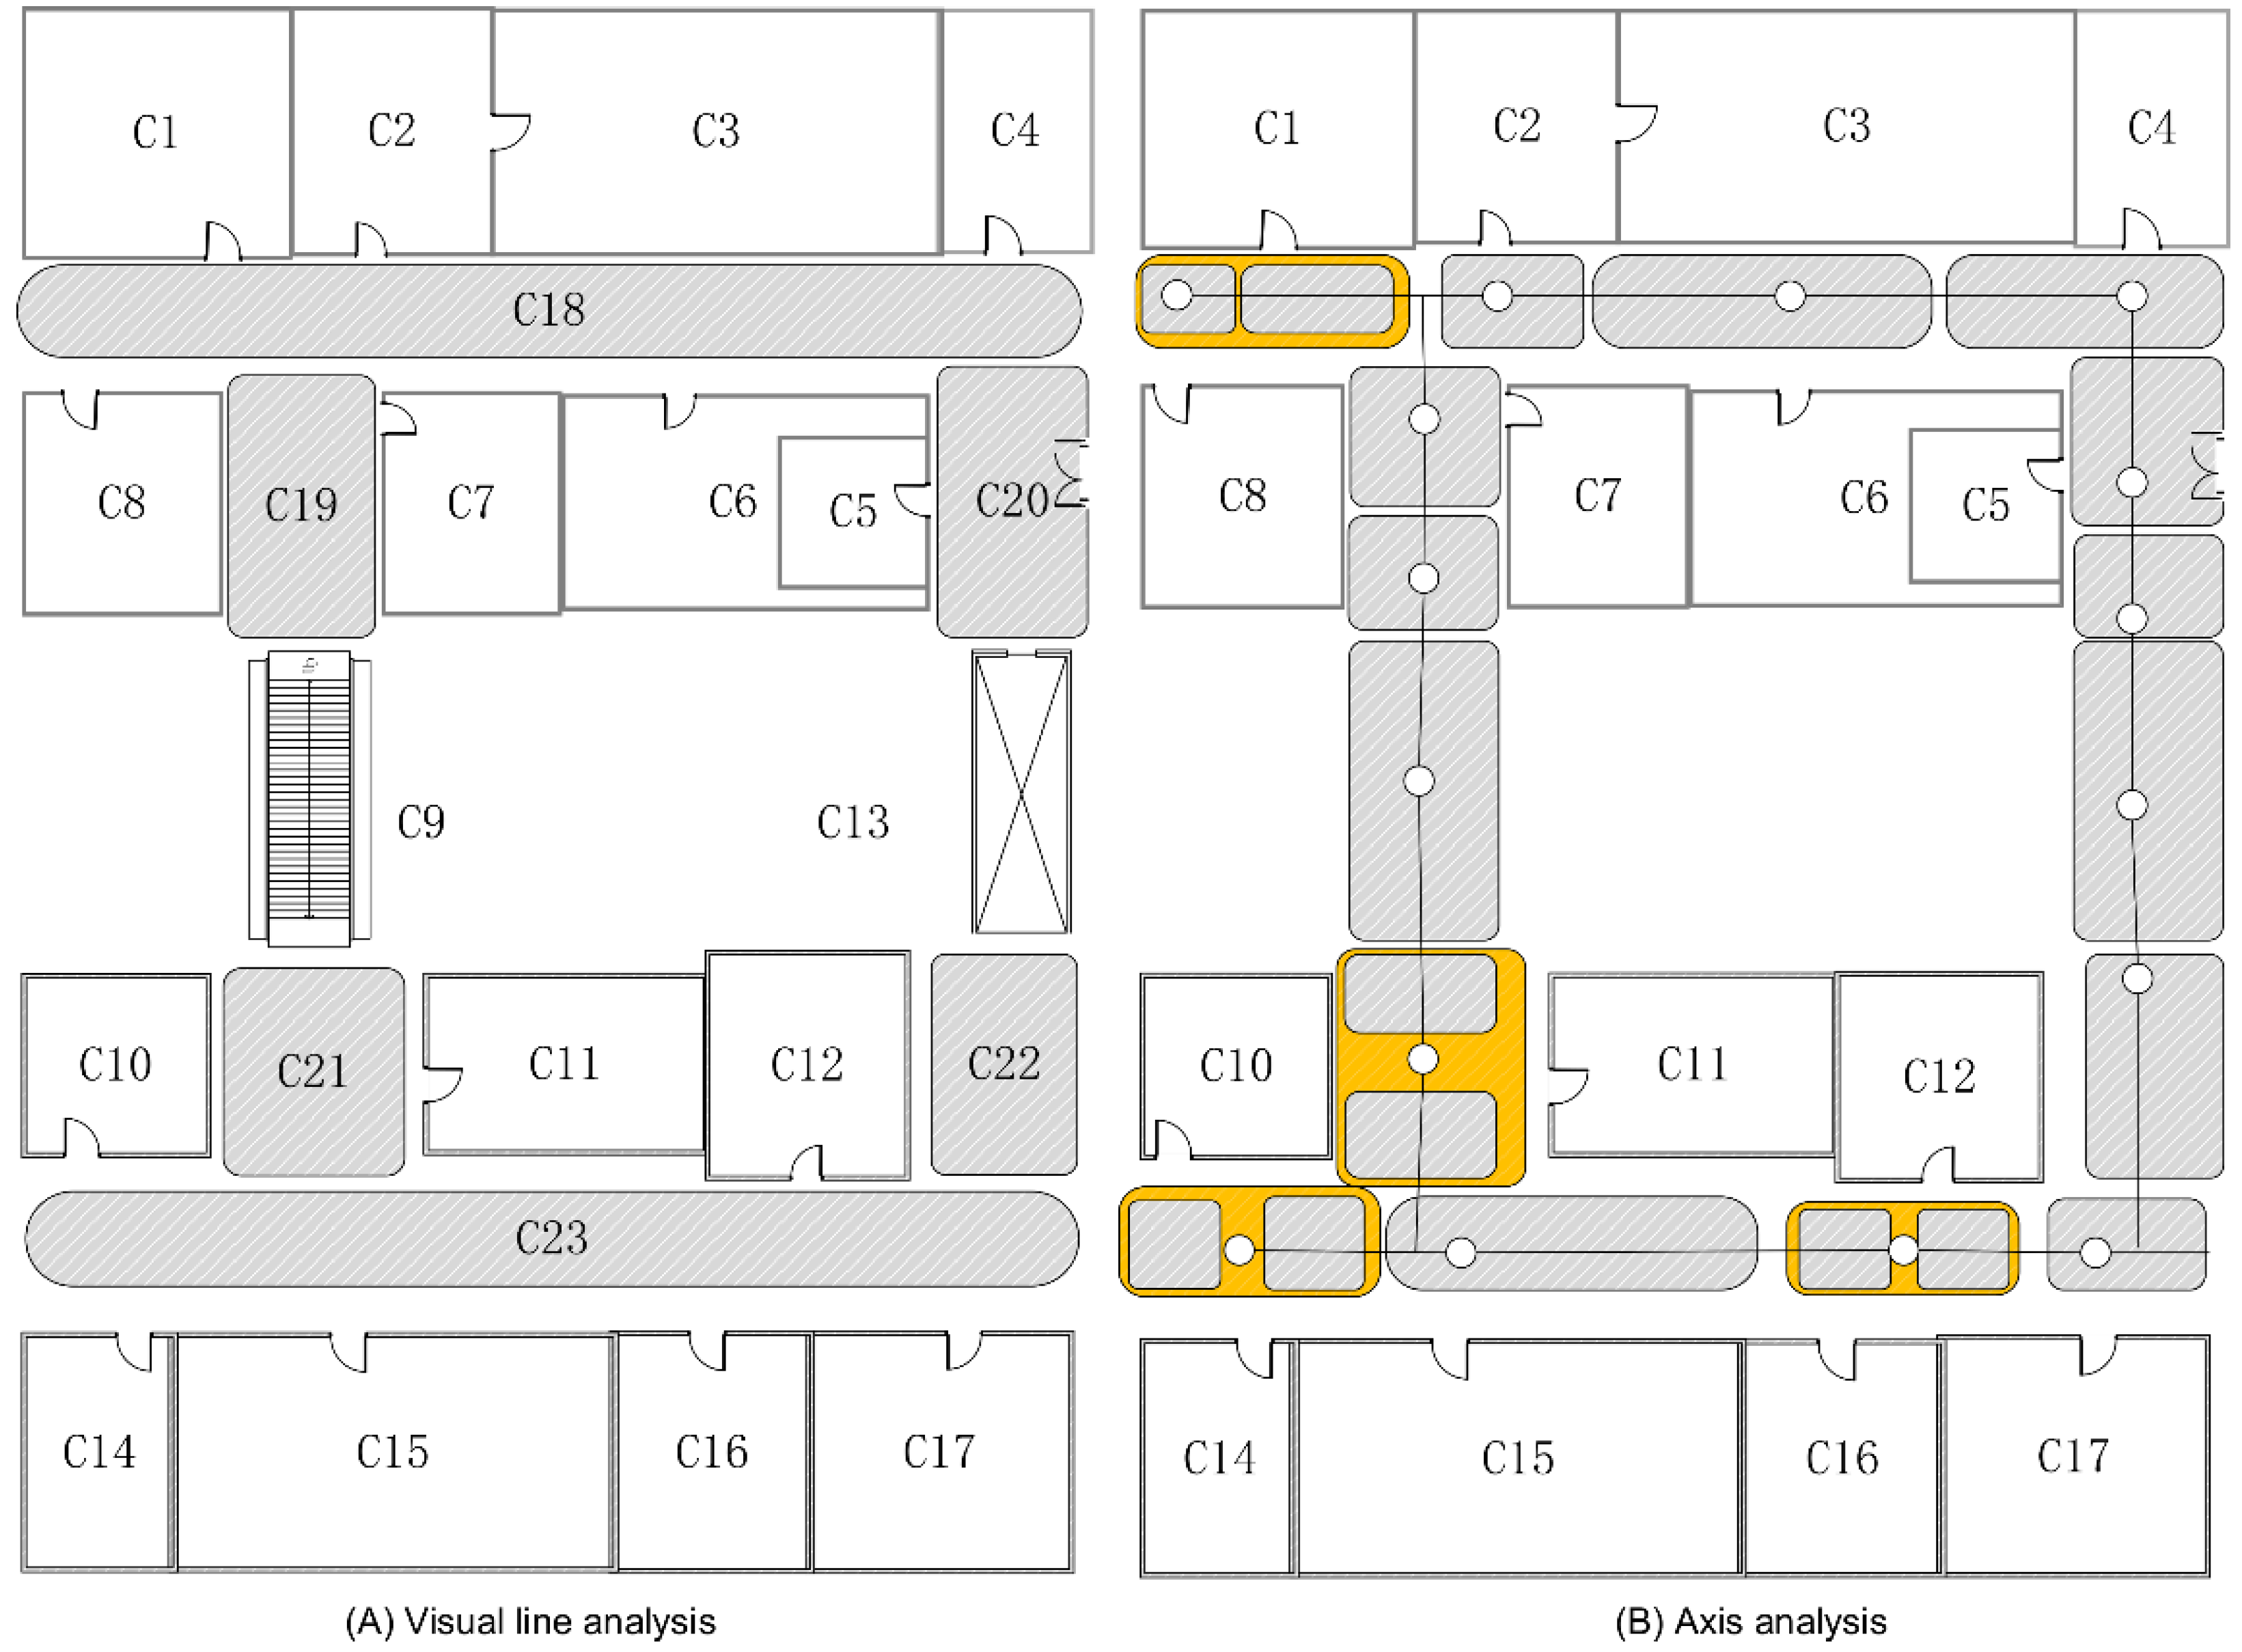
Ijgi 05 00176 g007
Figure 8. (A,B) Visual line analysis and axis analysis.
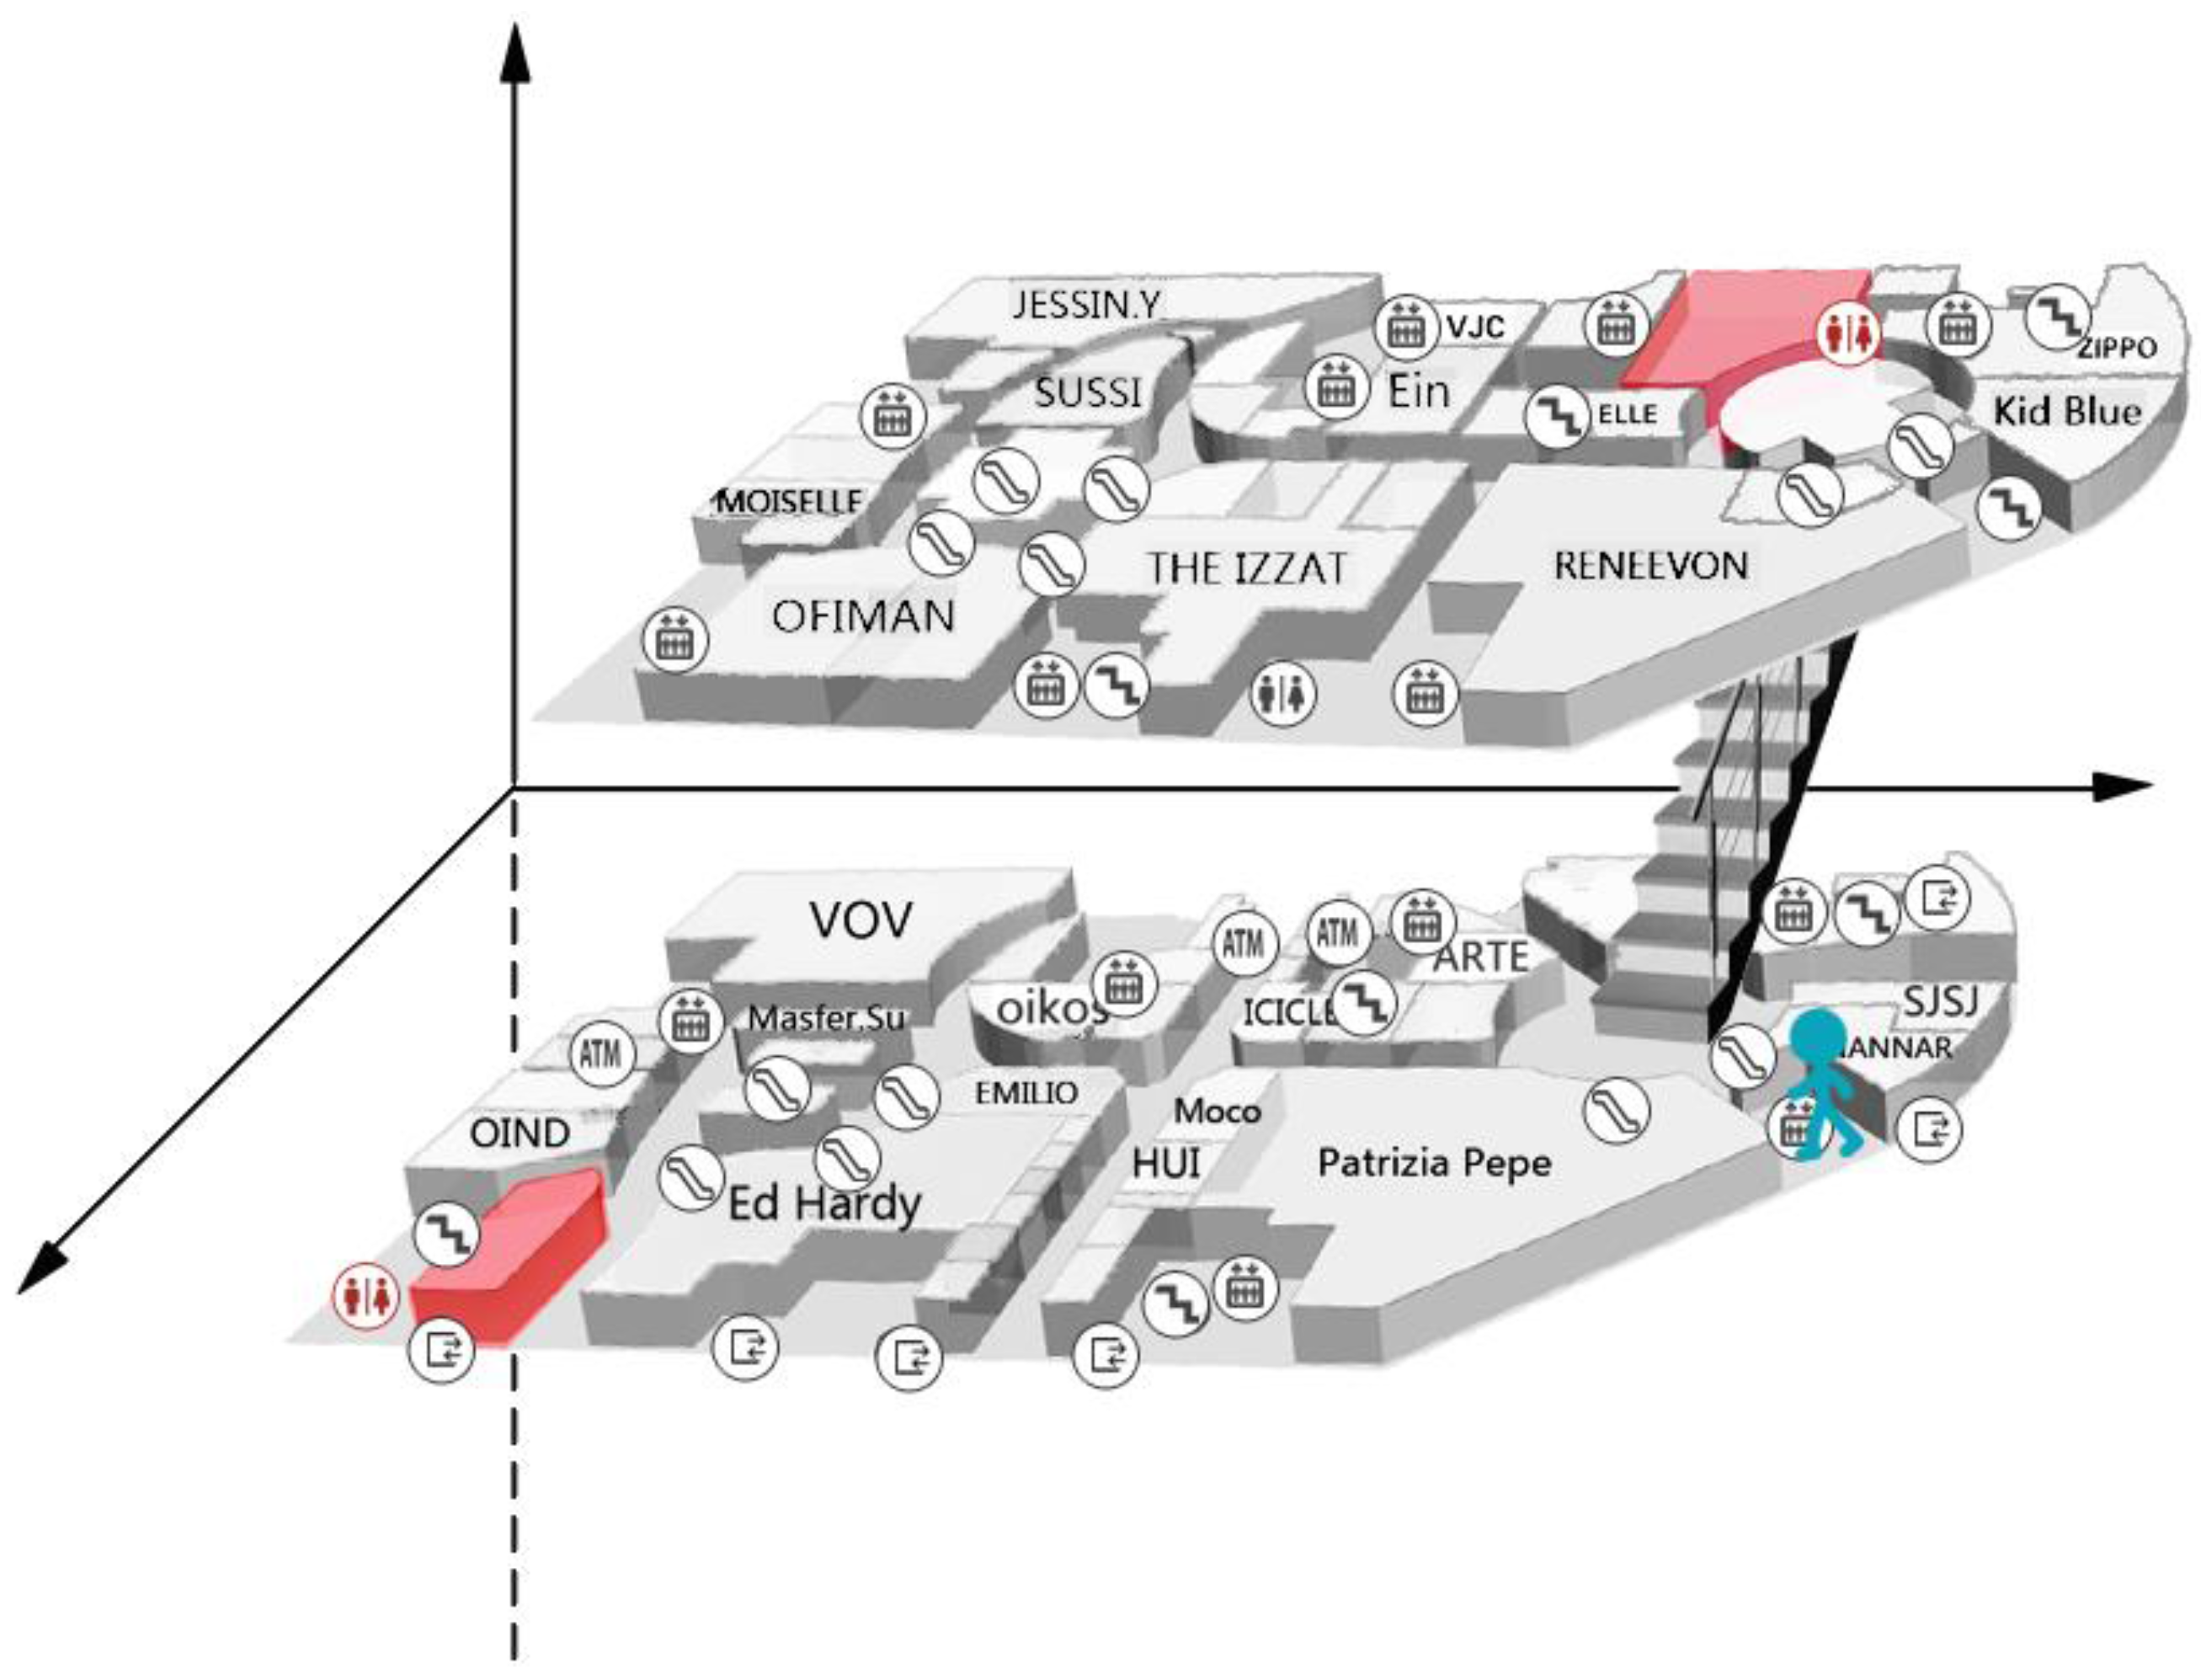
Ijgi 05 00176 g008
Figure 9. Multi-floor plane. Red regions denote the toilets, and the blue figure is the moving object.
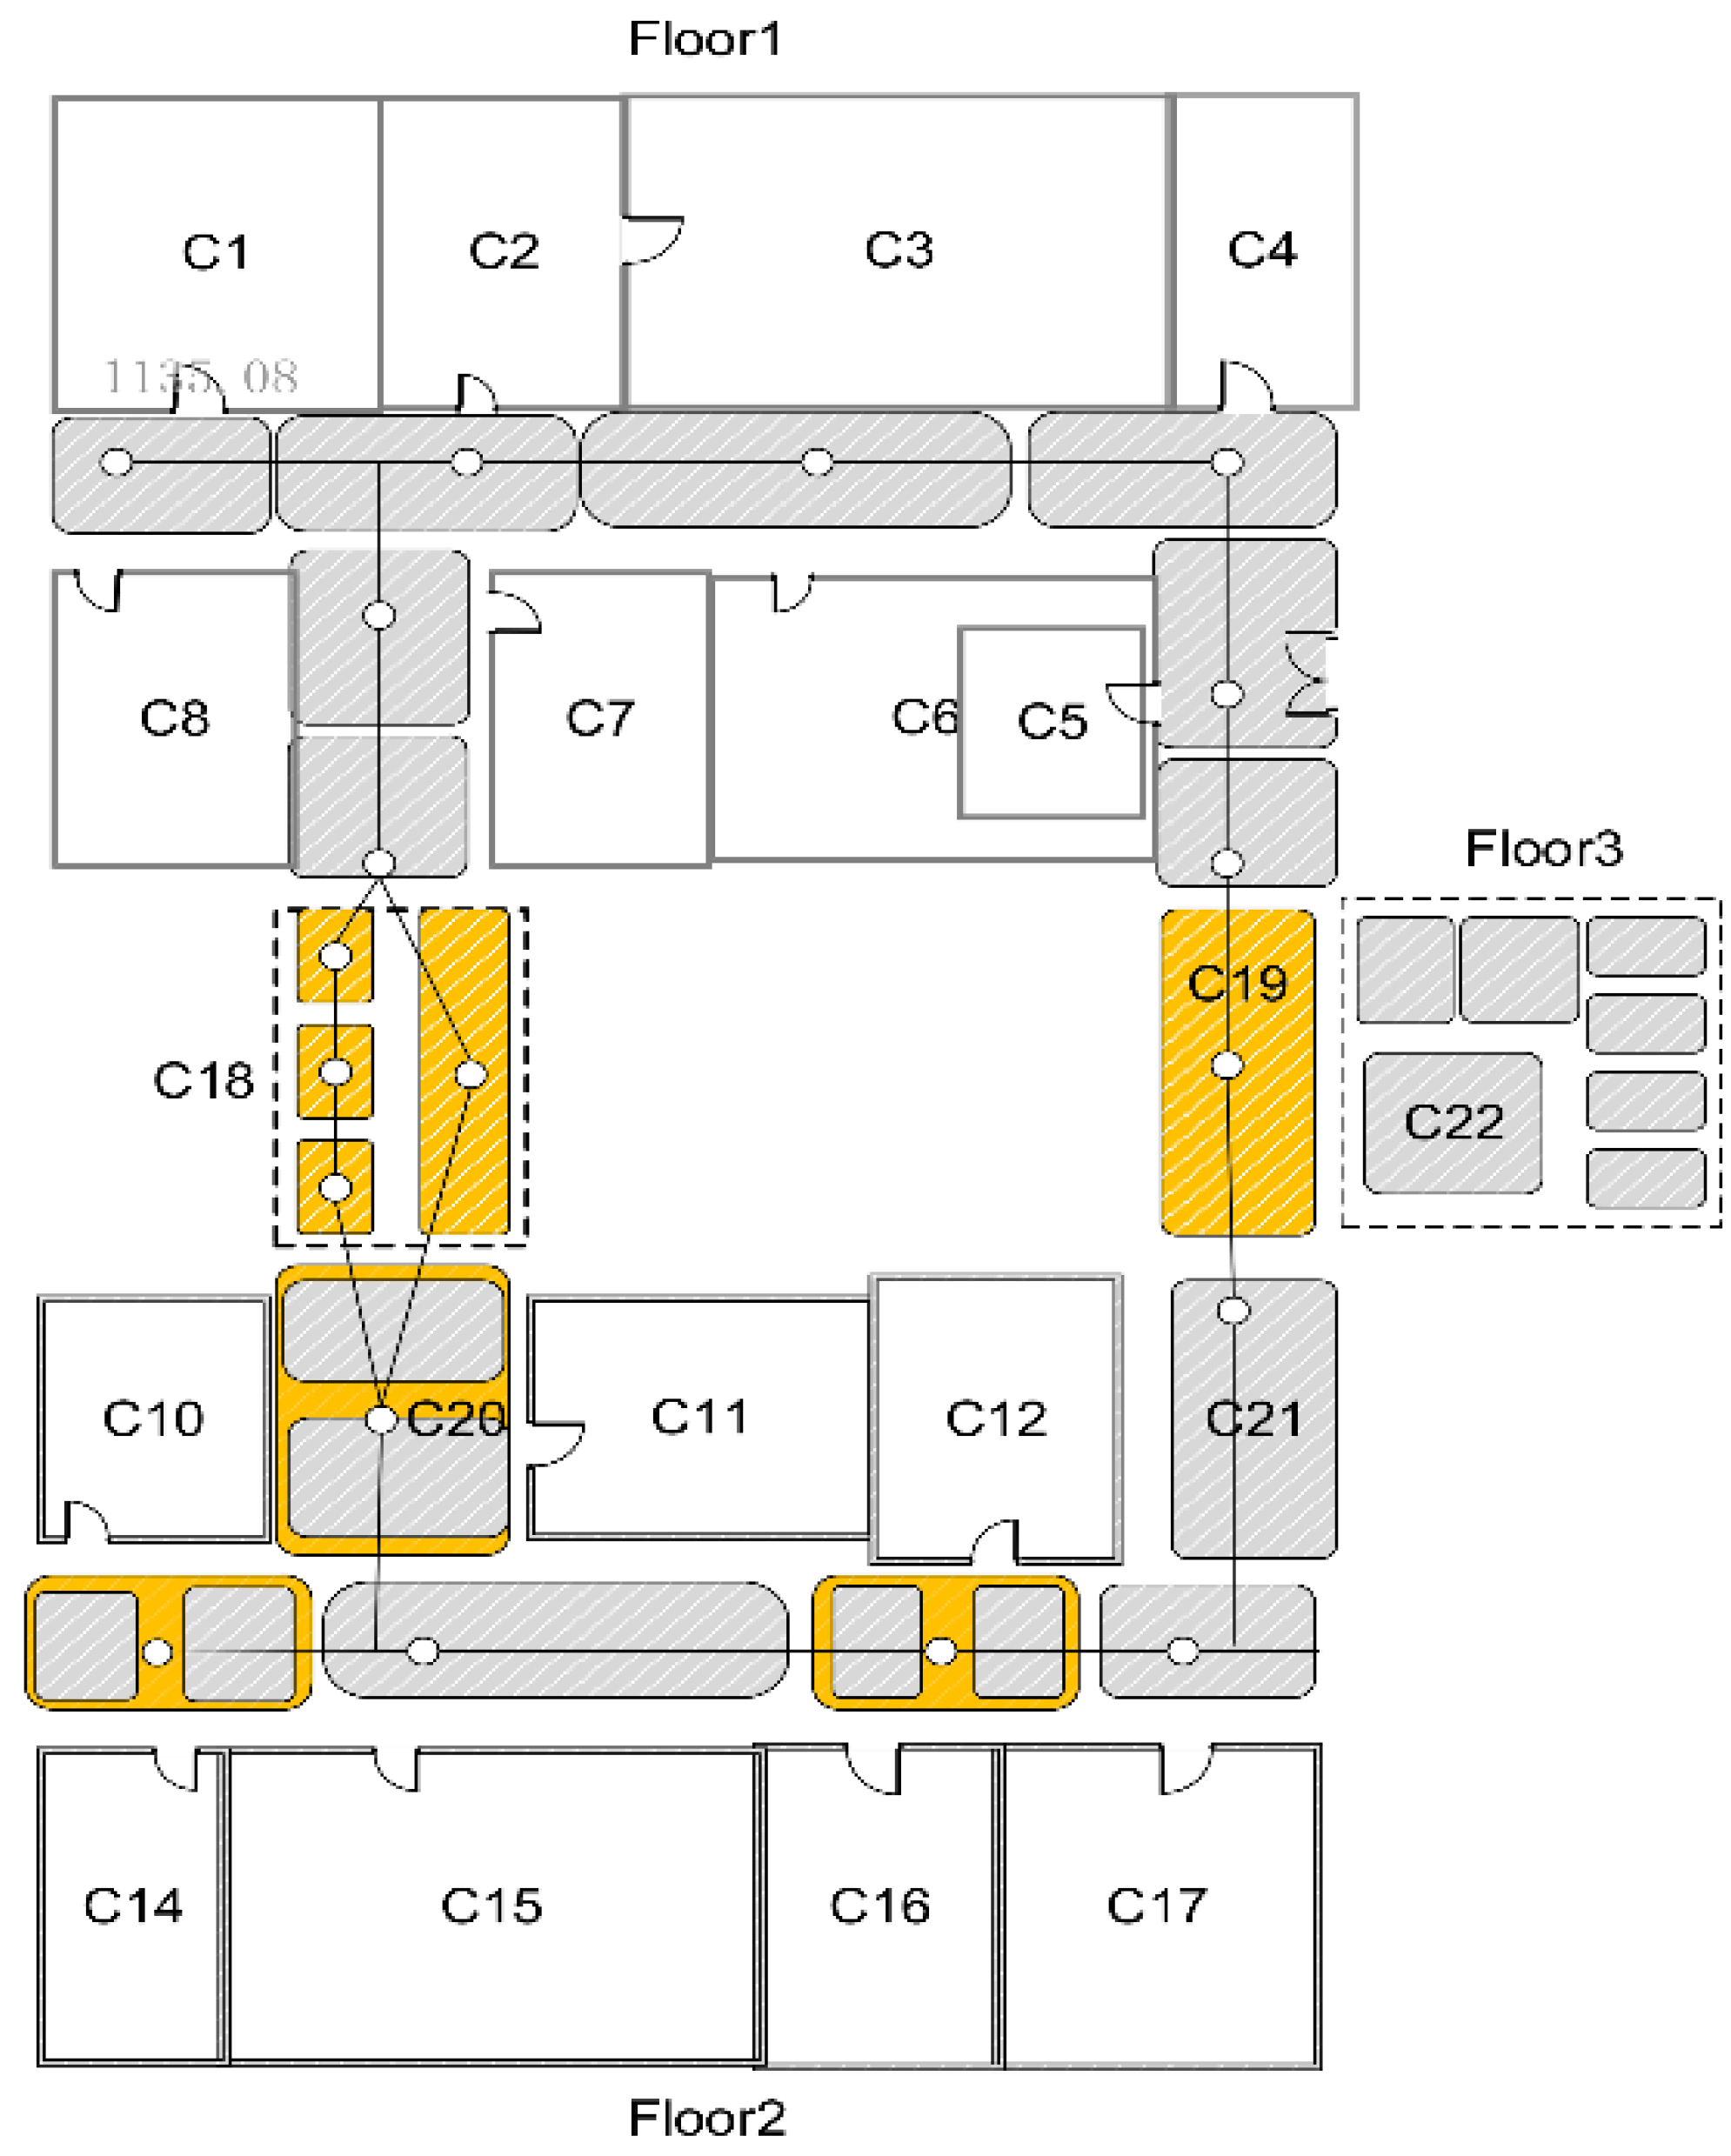
Ijgi 05 00176 g009
Figure 10. Multi-floor indoor cellular space.C18 is the stairwell, and C19 is the elevator.
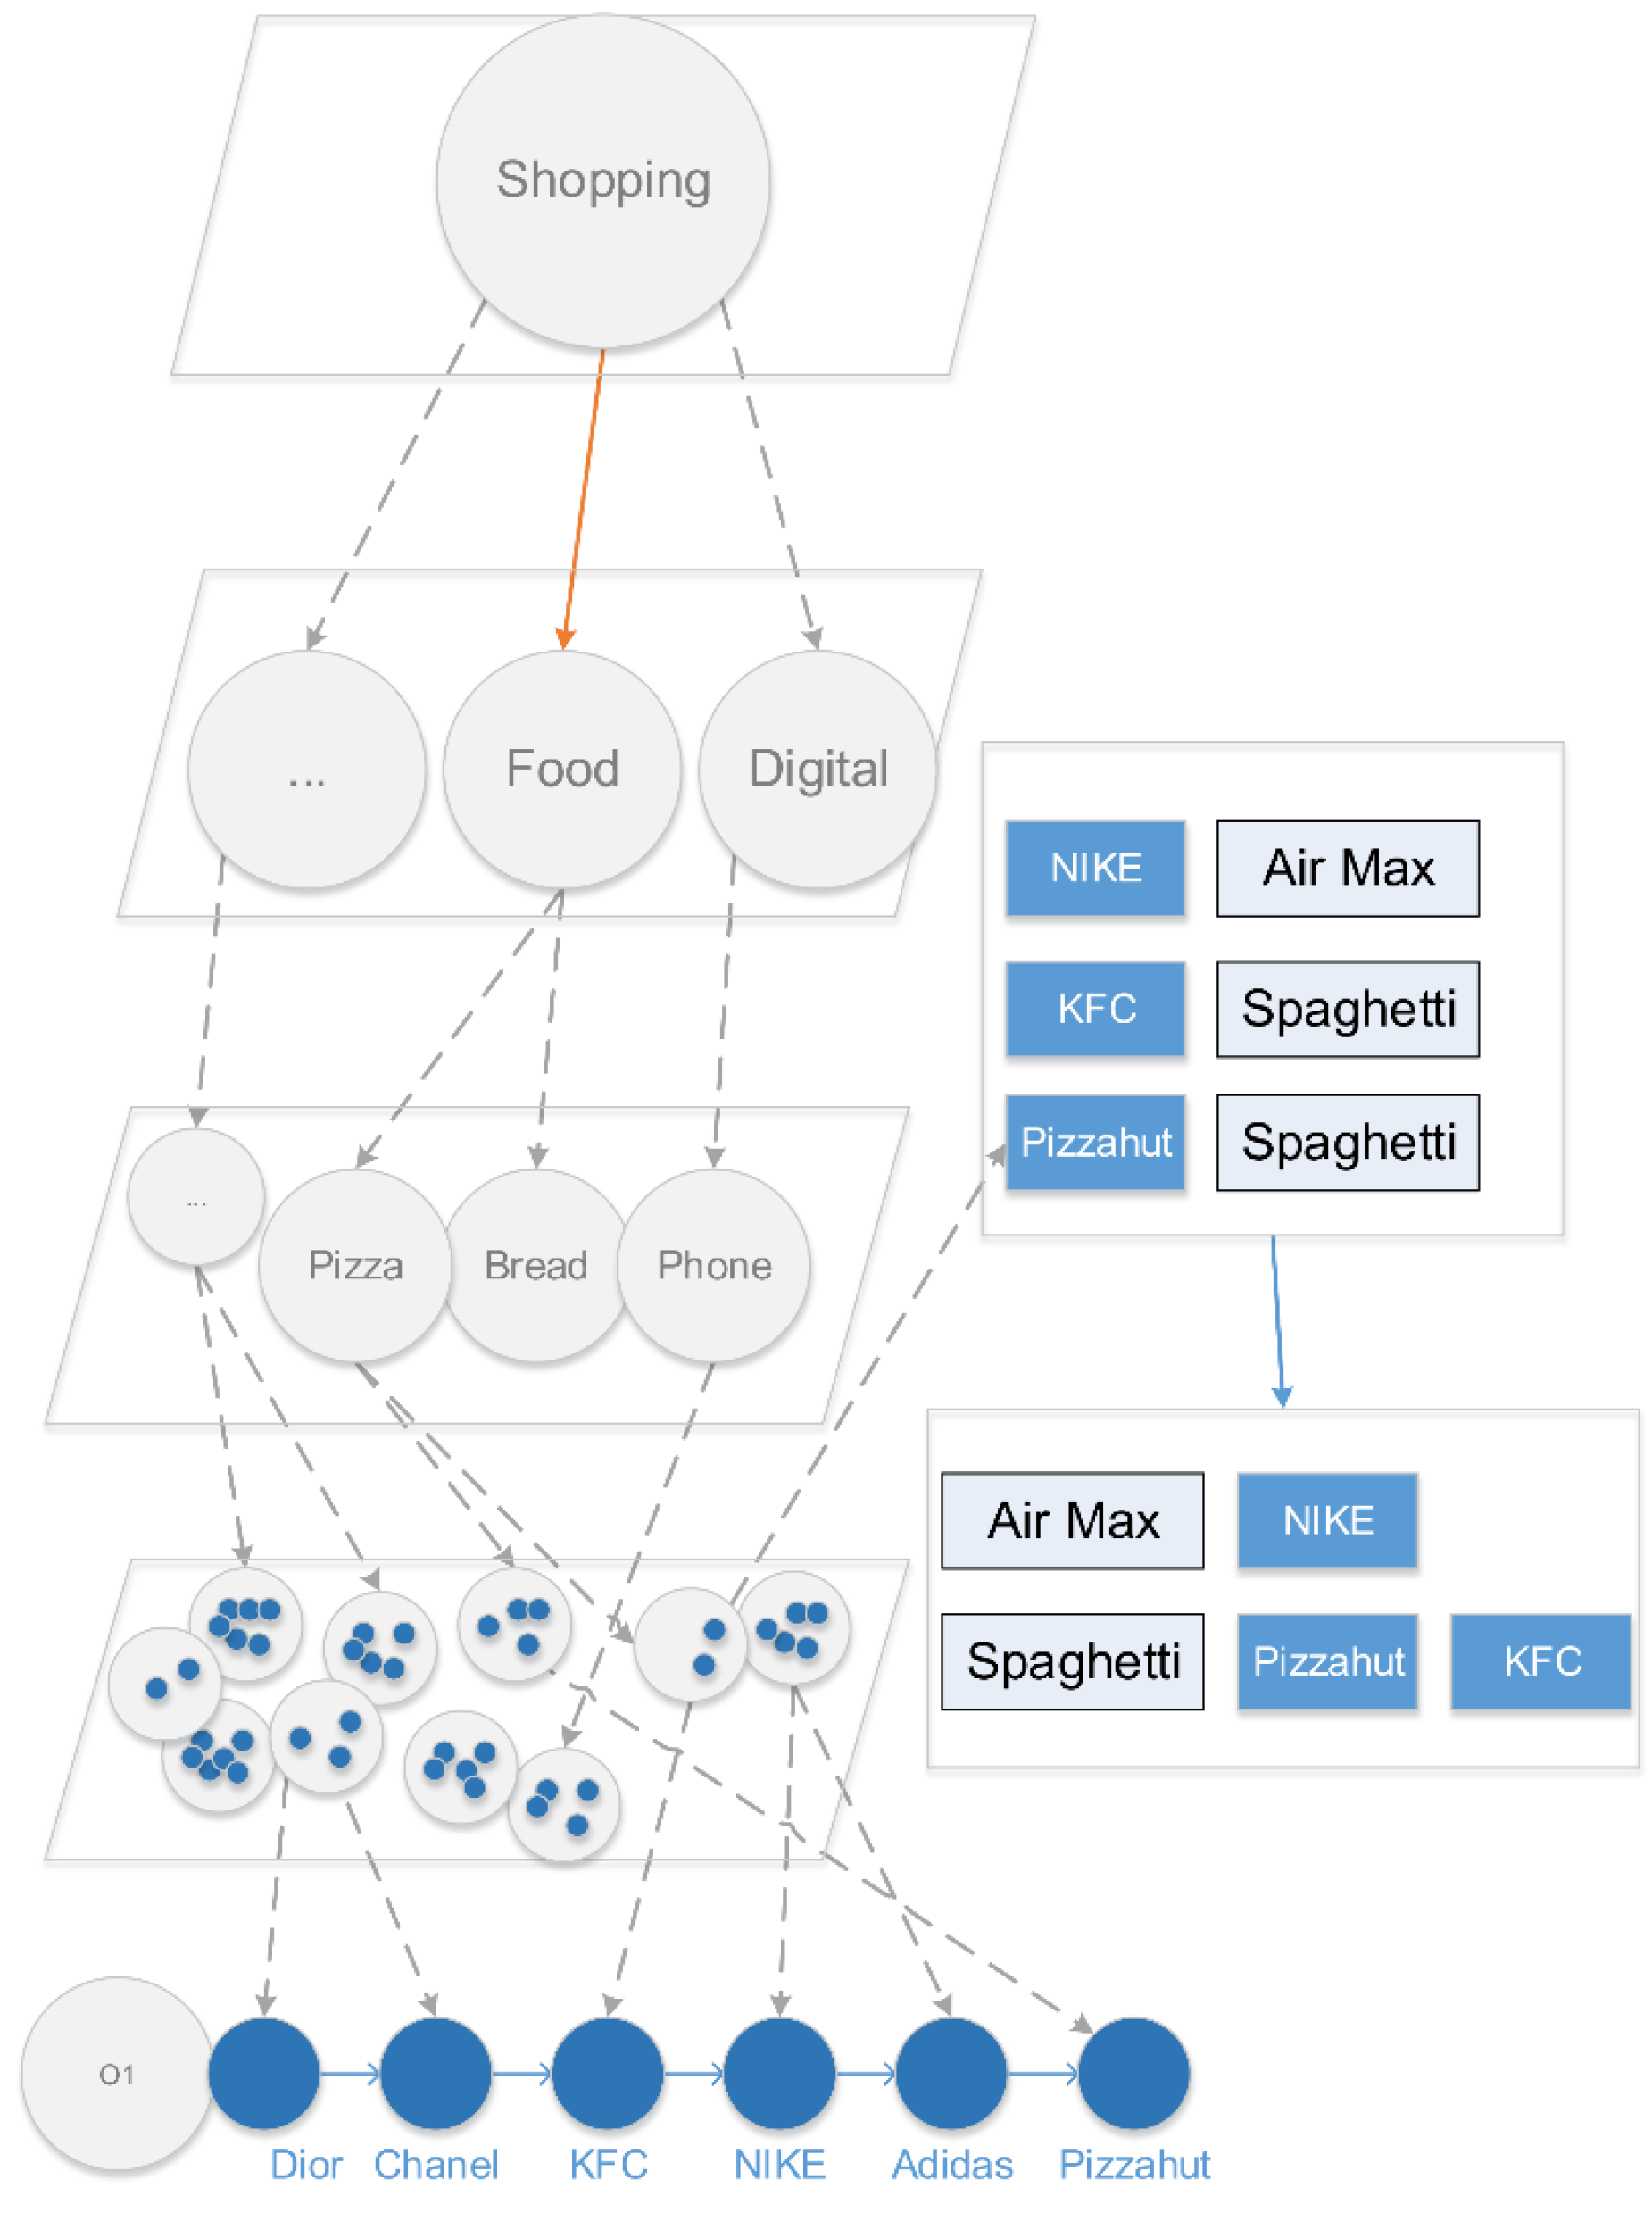
Ijgi 05 00176 g010
Figure 11. Multi-granularity semantic hierarchy tree.
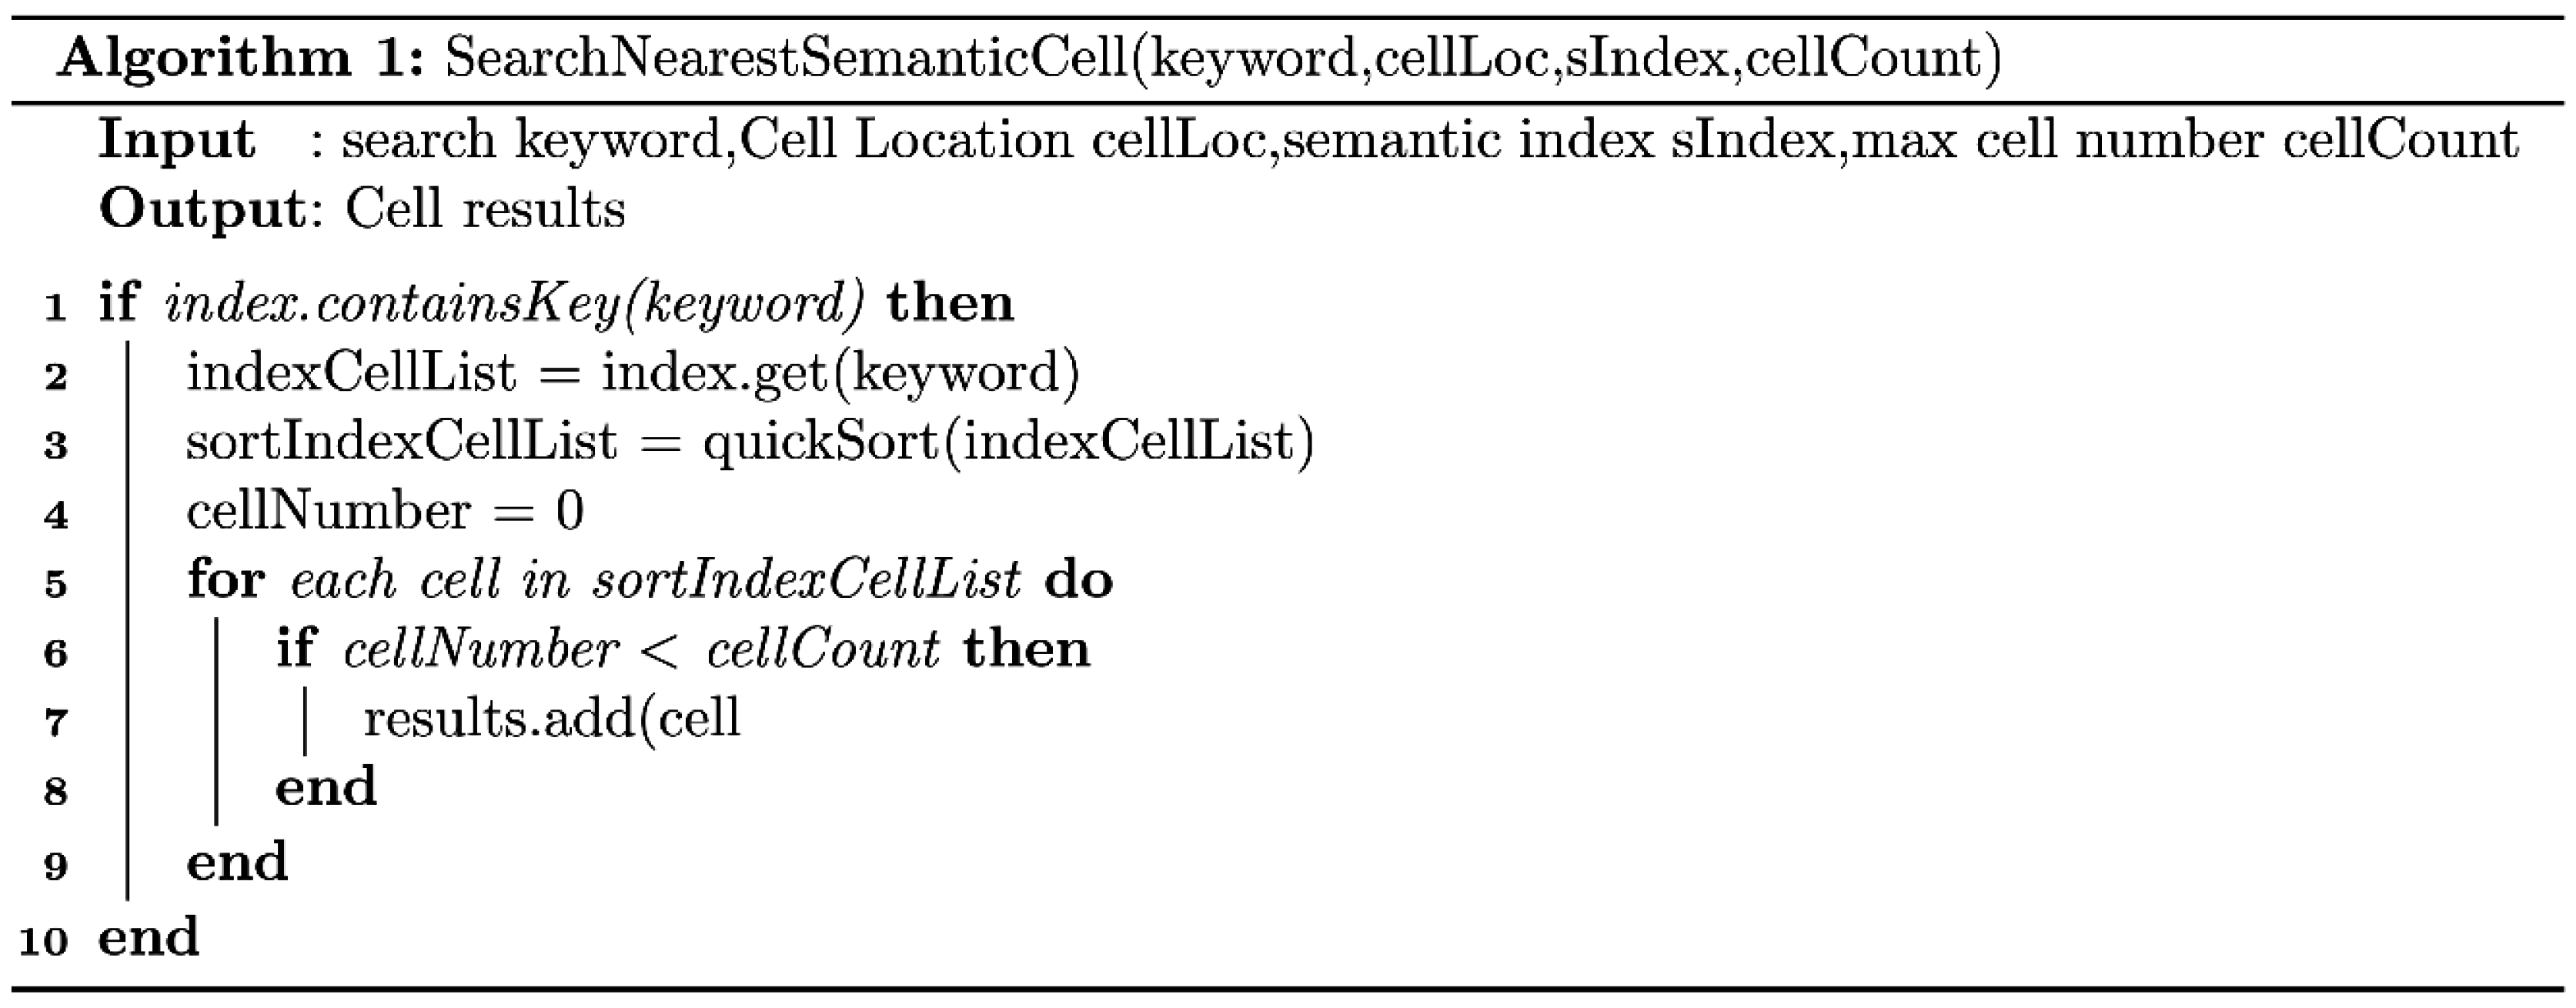
Ijgi 05 00176 g011
Figure 12. The algorithm for nearest semantic cell search.
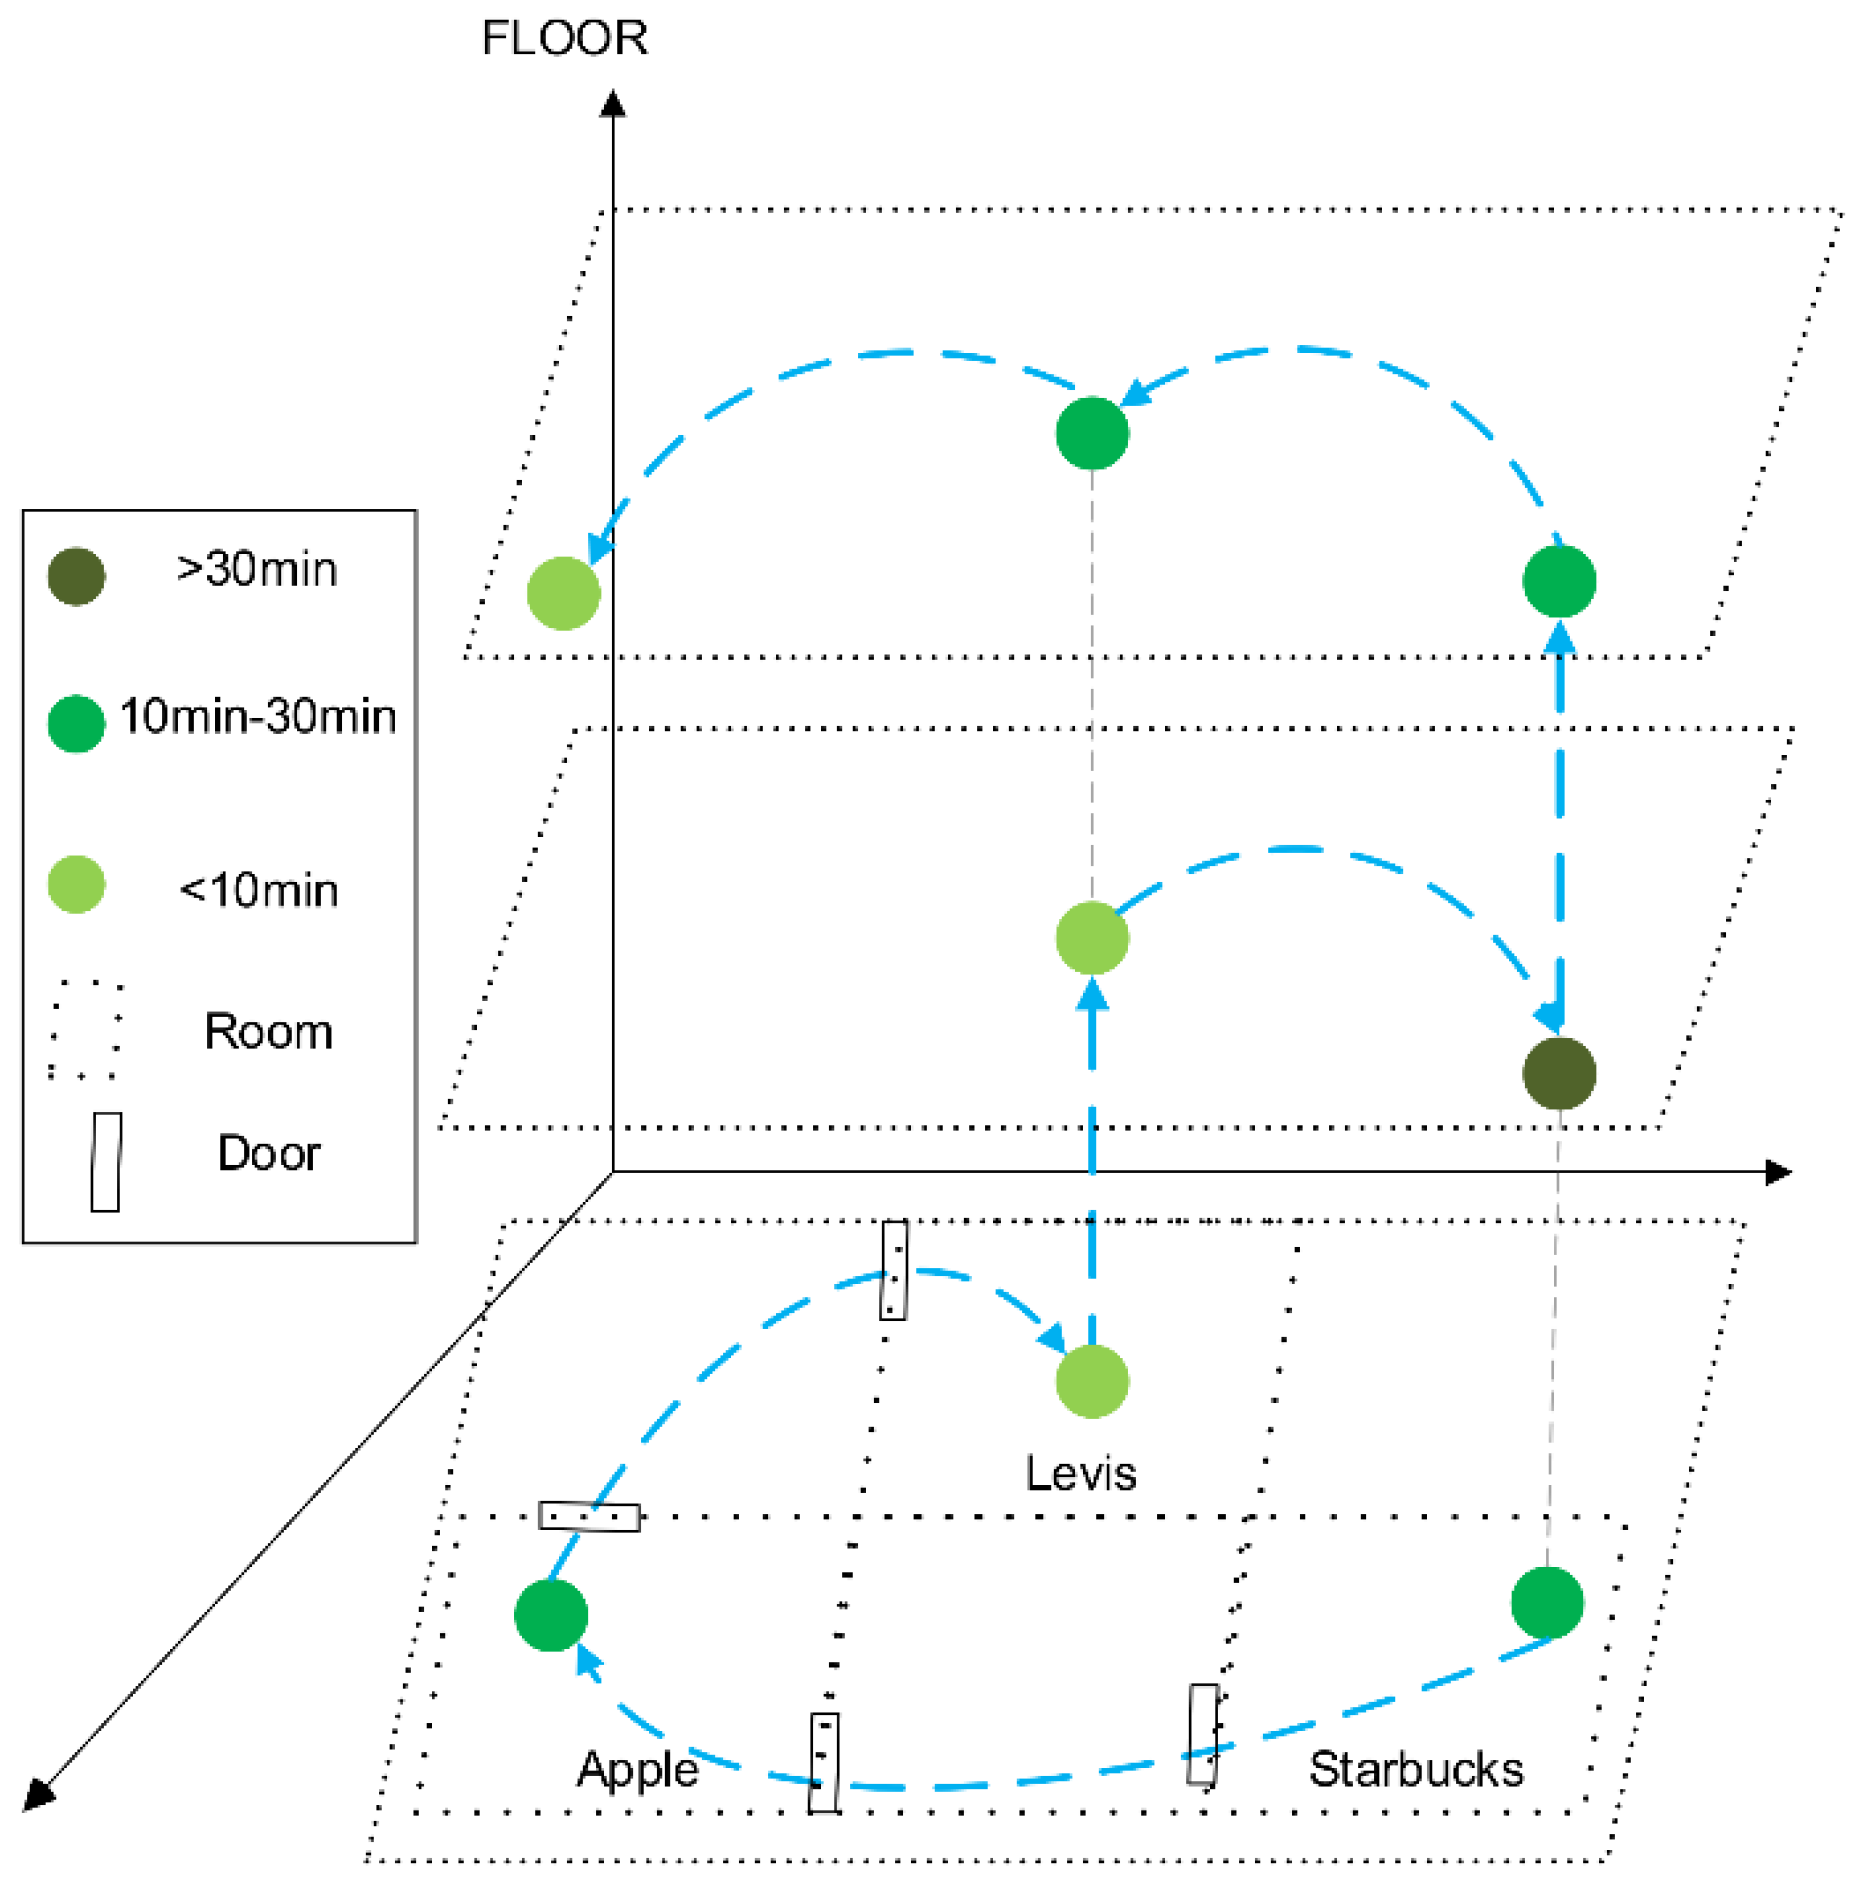
Ijgi 05 00176 g012
Figure 13. Semantic trajectory. The circle represents the moving object.
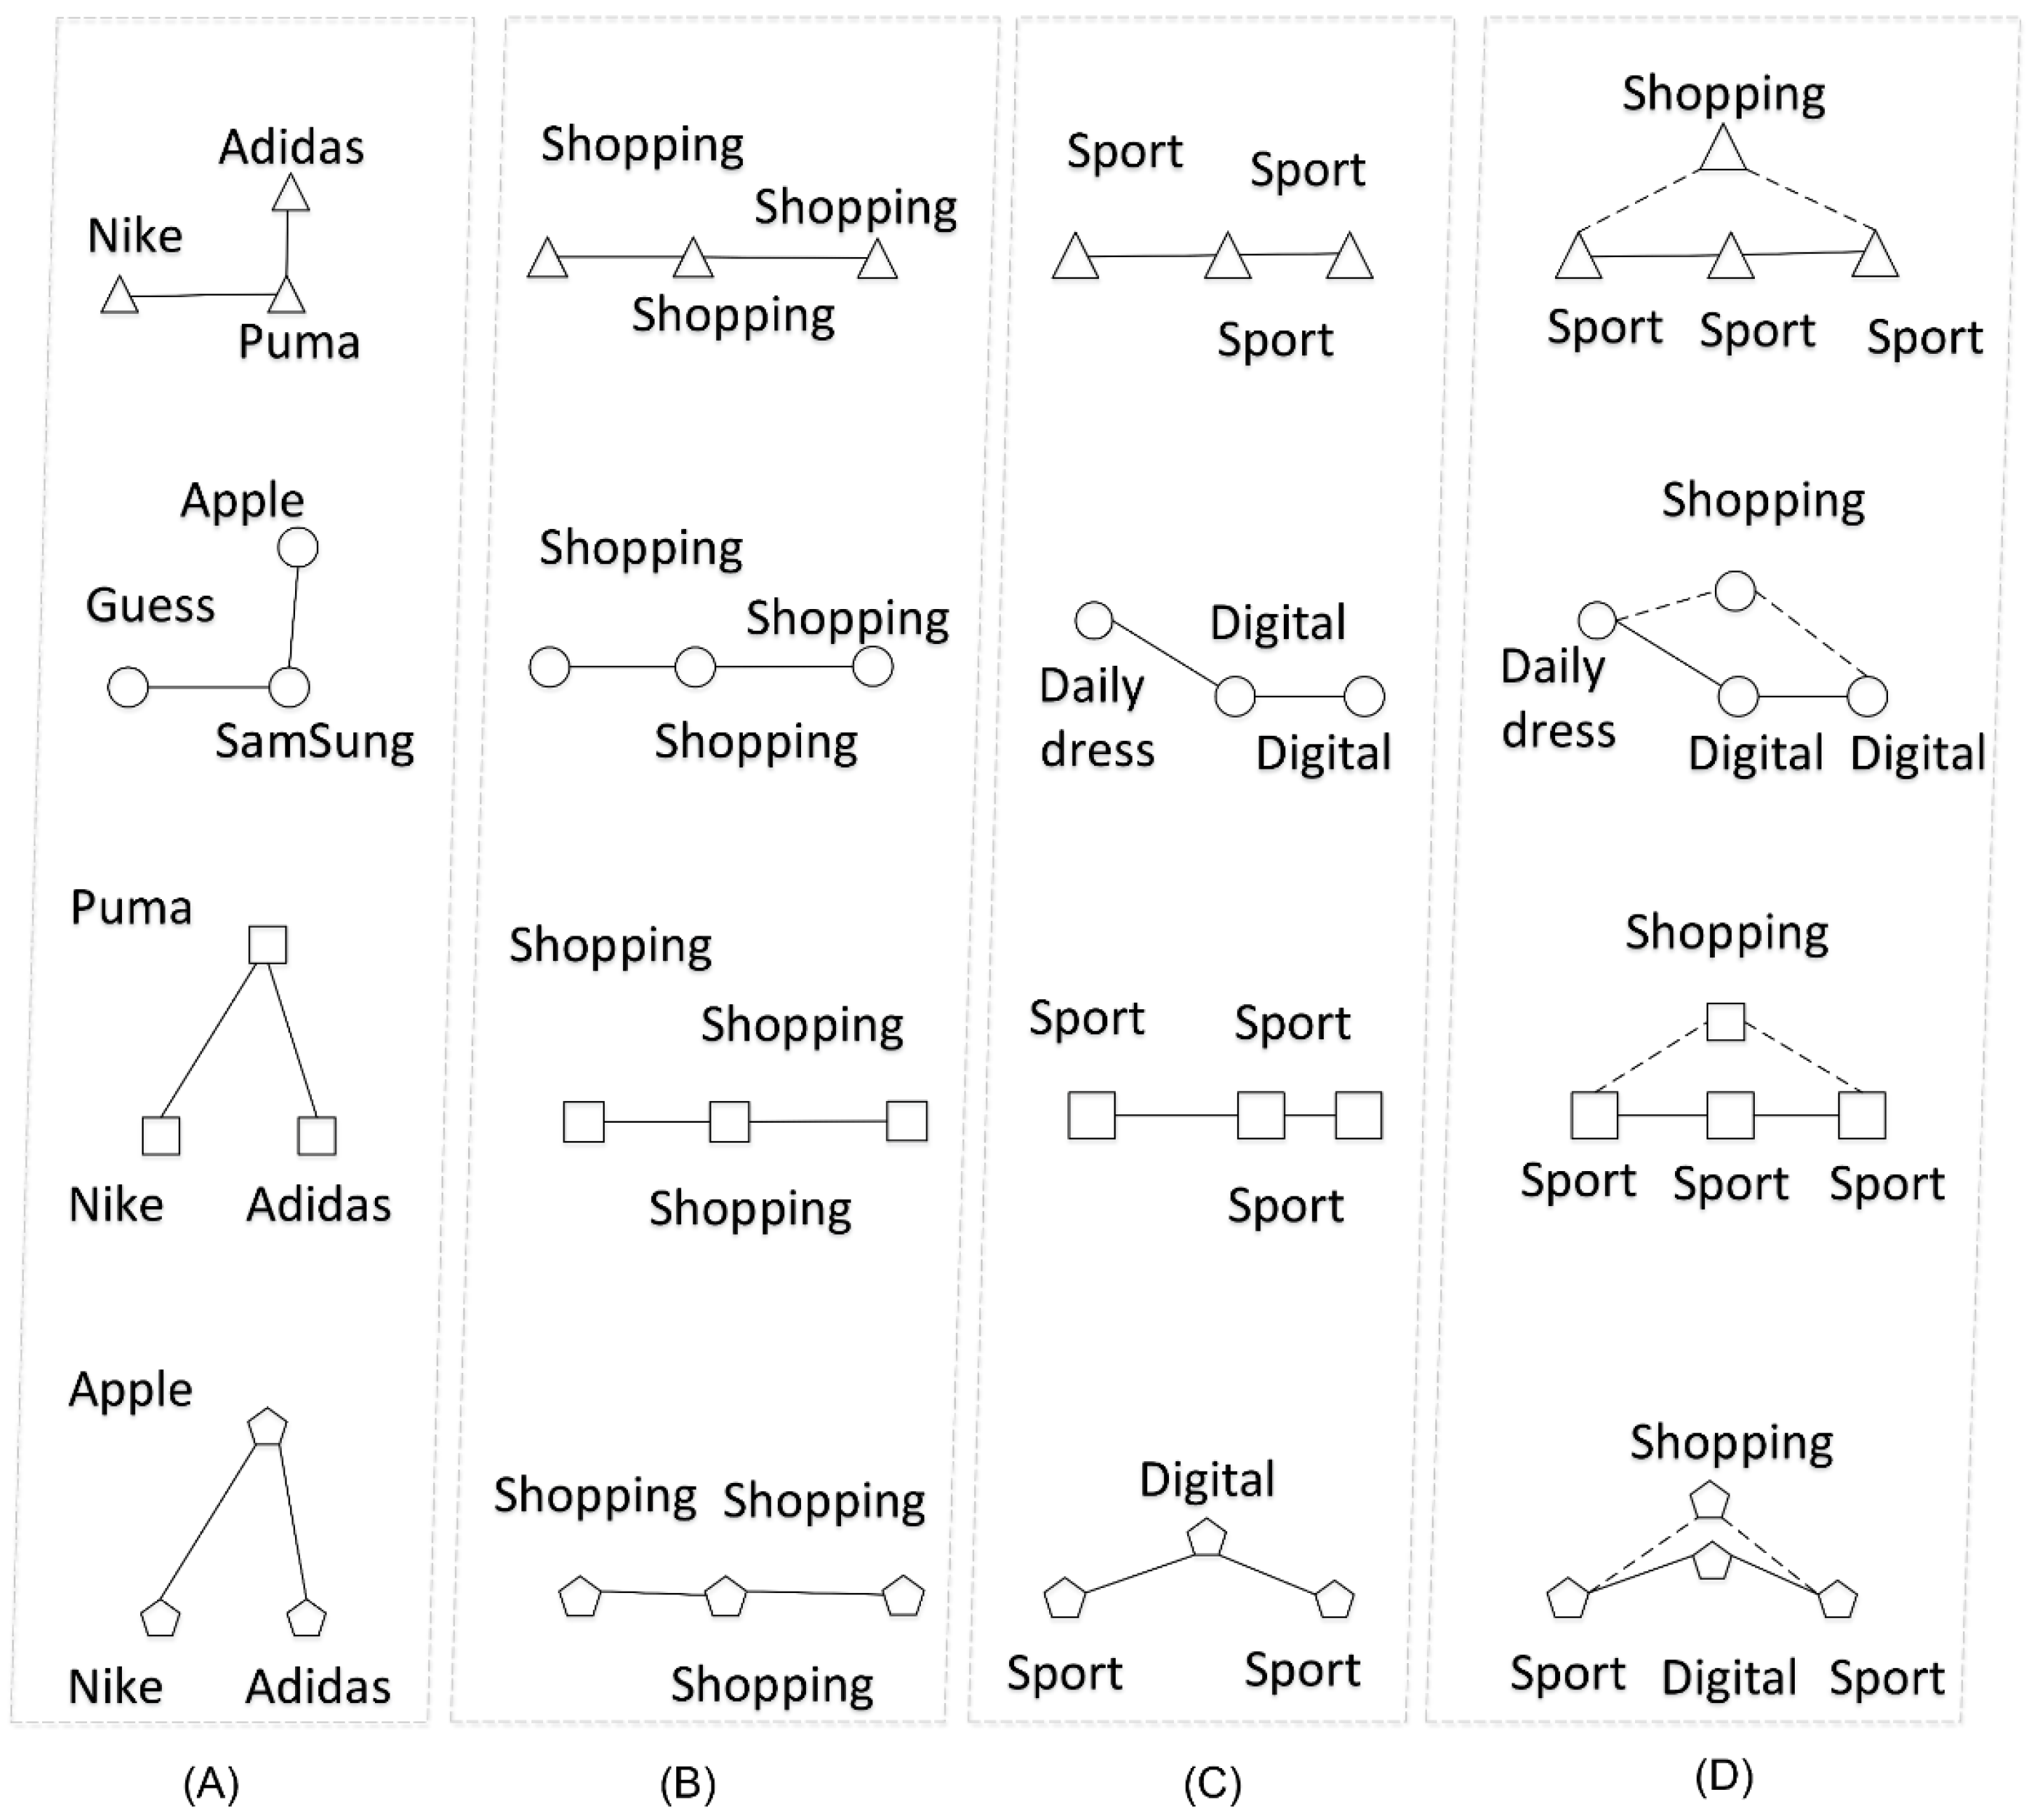
Ijgi 05 00176 g013
Figure 14. Multi-granularity semantic trajectory. The triangles, circles, rectangles, and pentagons denotes users 1, 2, 3, and 4, respectively: (A) The shapes of the indoor planar trajectories is not suitable for evaluating user similarity; (B) Using only the coarse-grained semantic information can’t reflect the differences visually; (C) Using only the fine-grained semantic hierarchy will cause the measurement of the similarity between users to fall into a local trap; (D) Multi-granularity semantic trajectory is consistent with the actual situation.
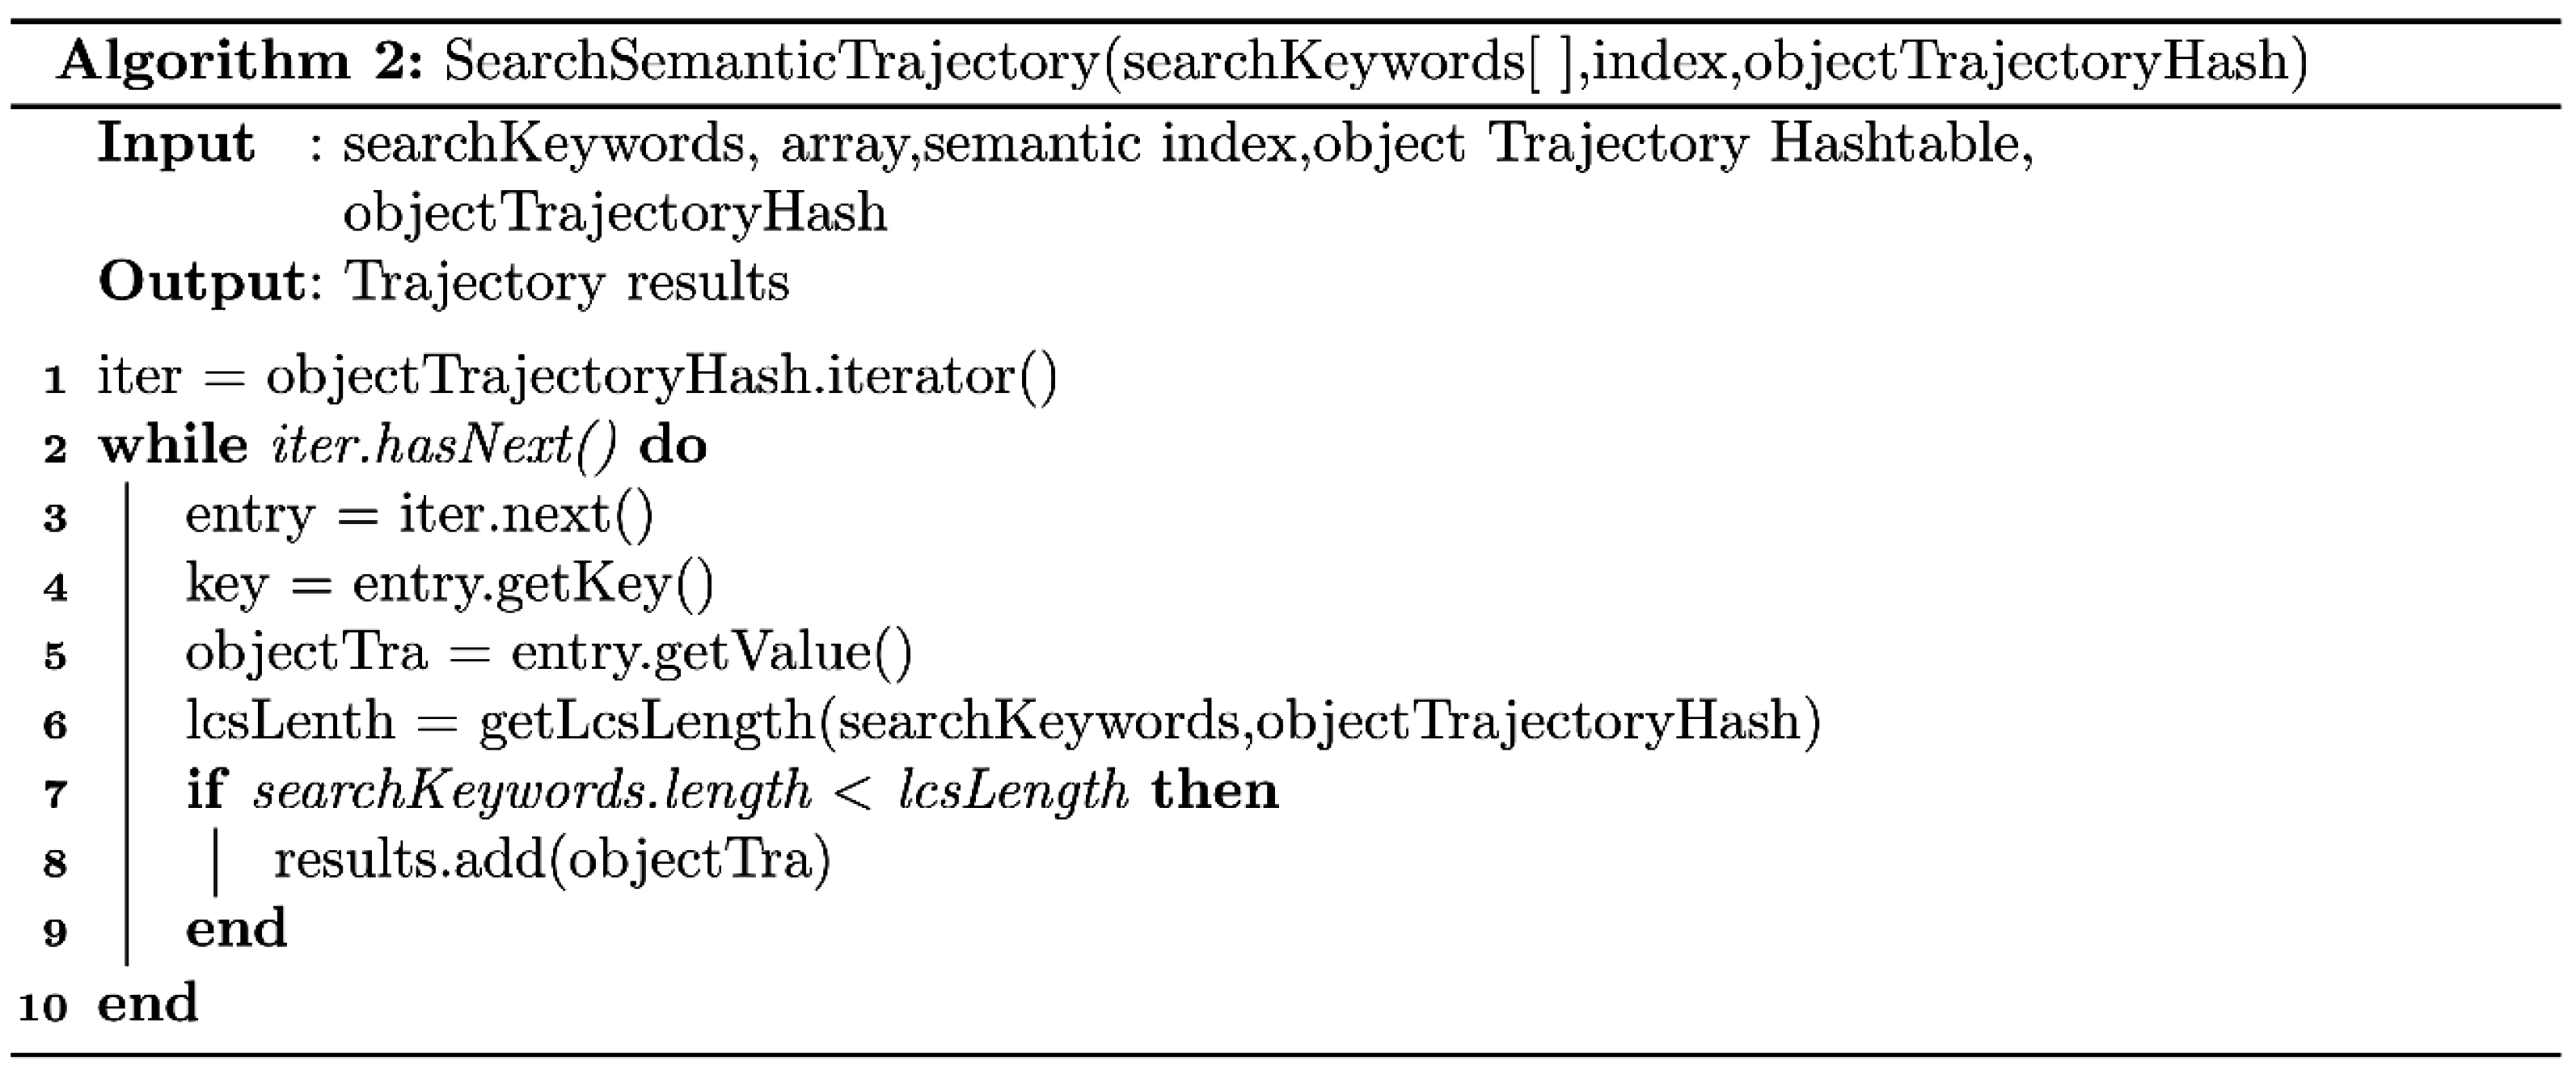
Ijgi 05 00176 g014
Figure 15. The semantic trajectory query algorithm.
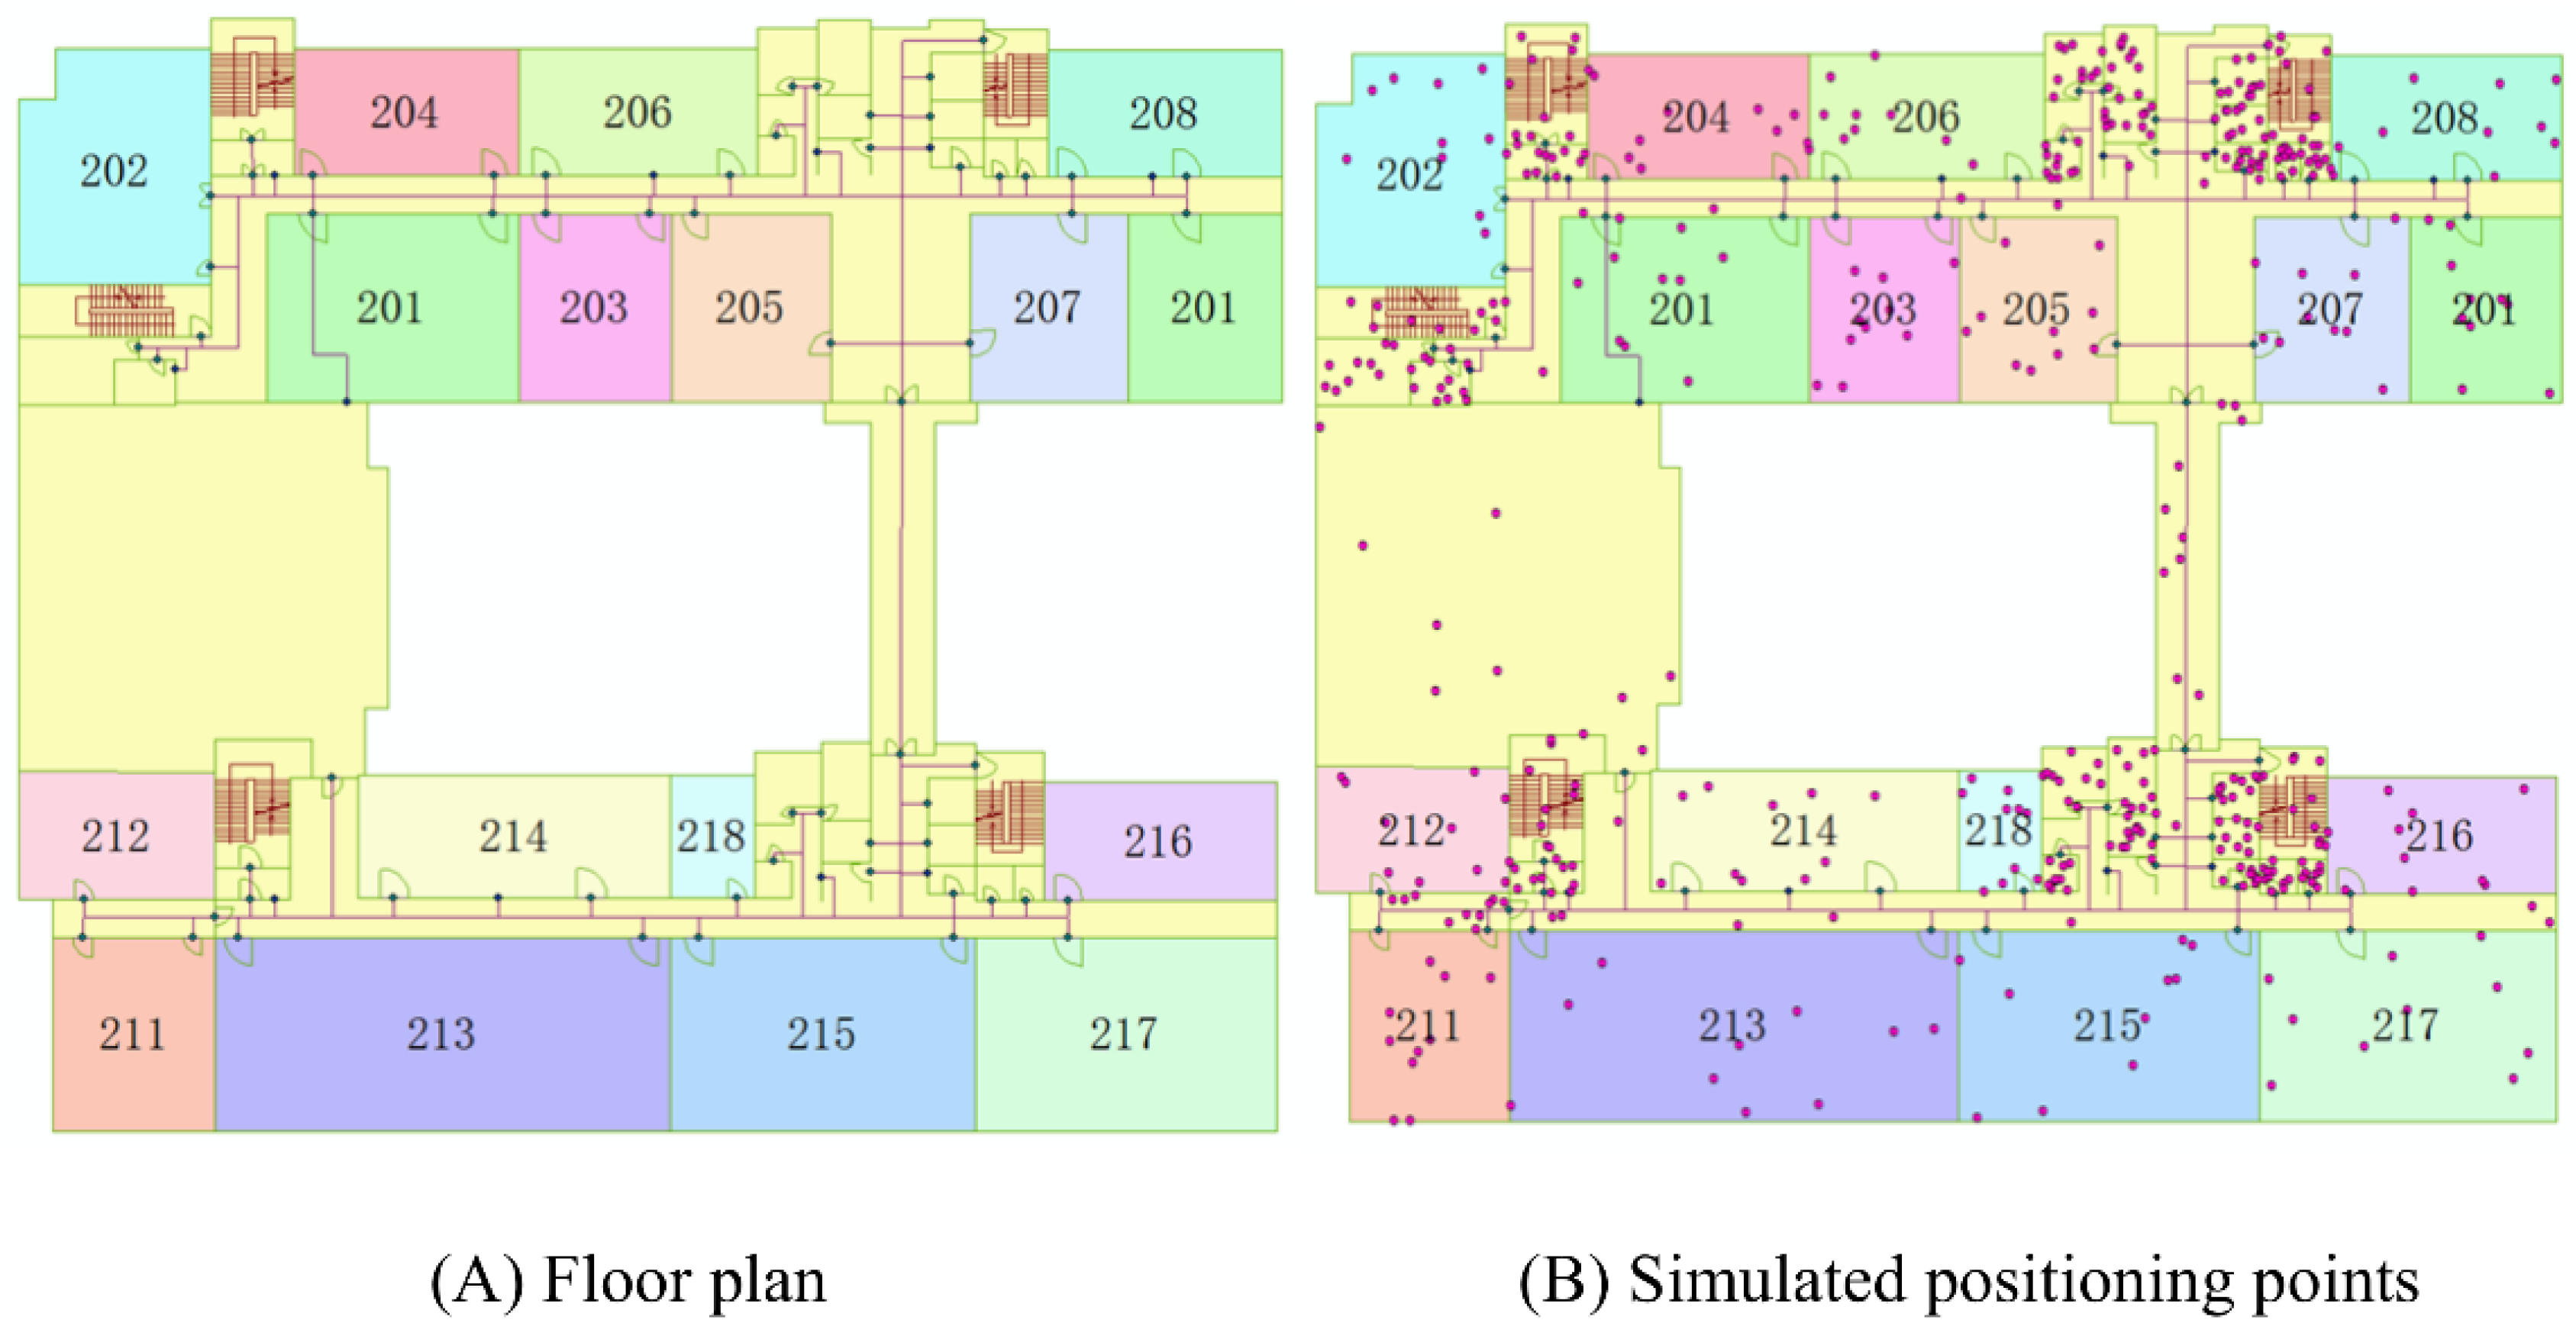
Ijgi 05 00176 g015
Figure 16. (A,B) Simulated floor plan and the positioning points.
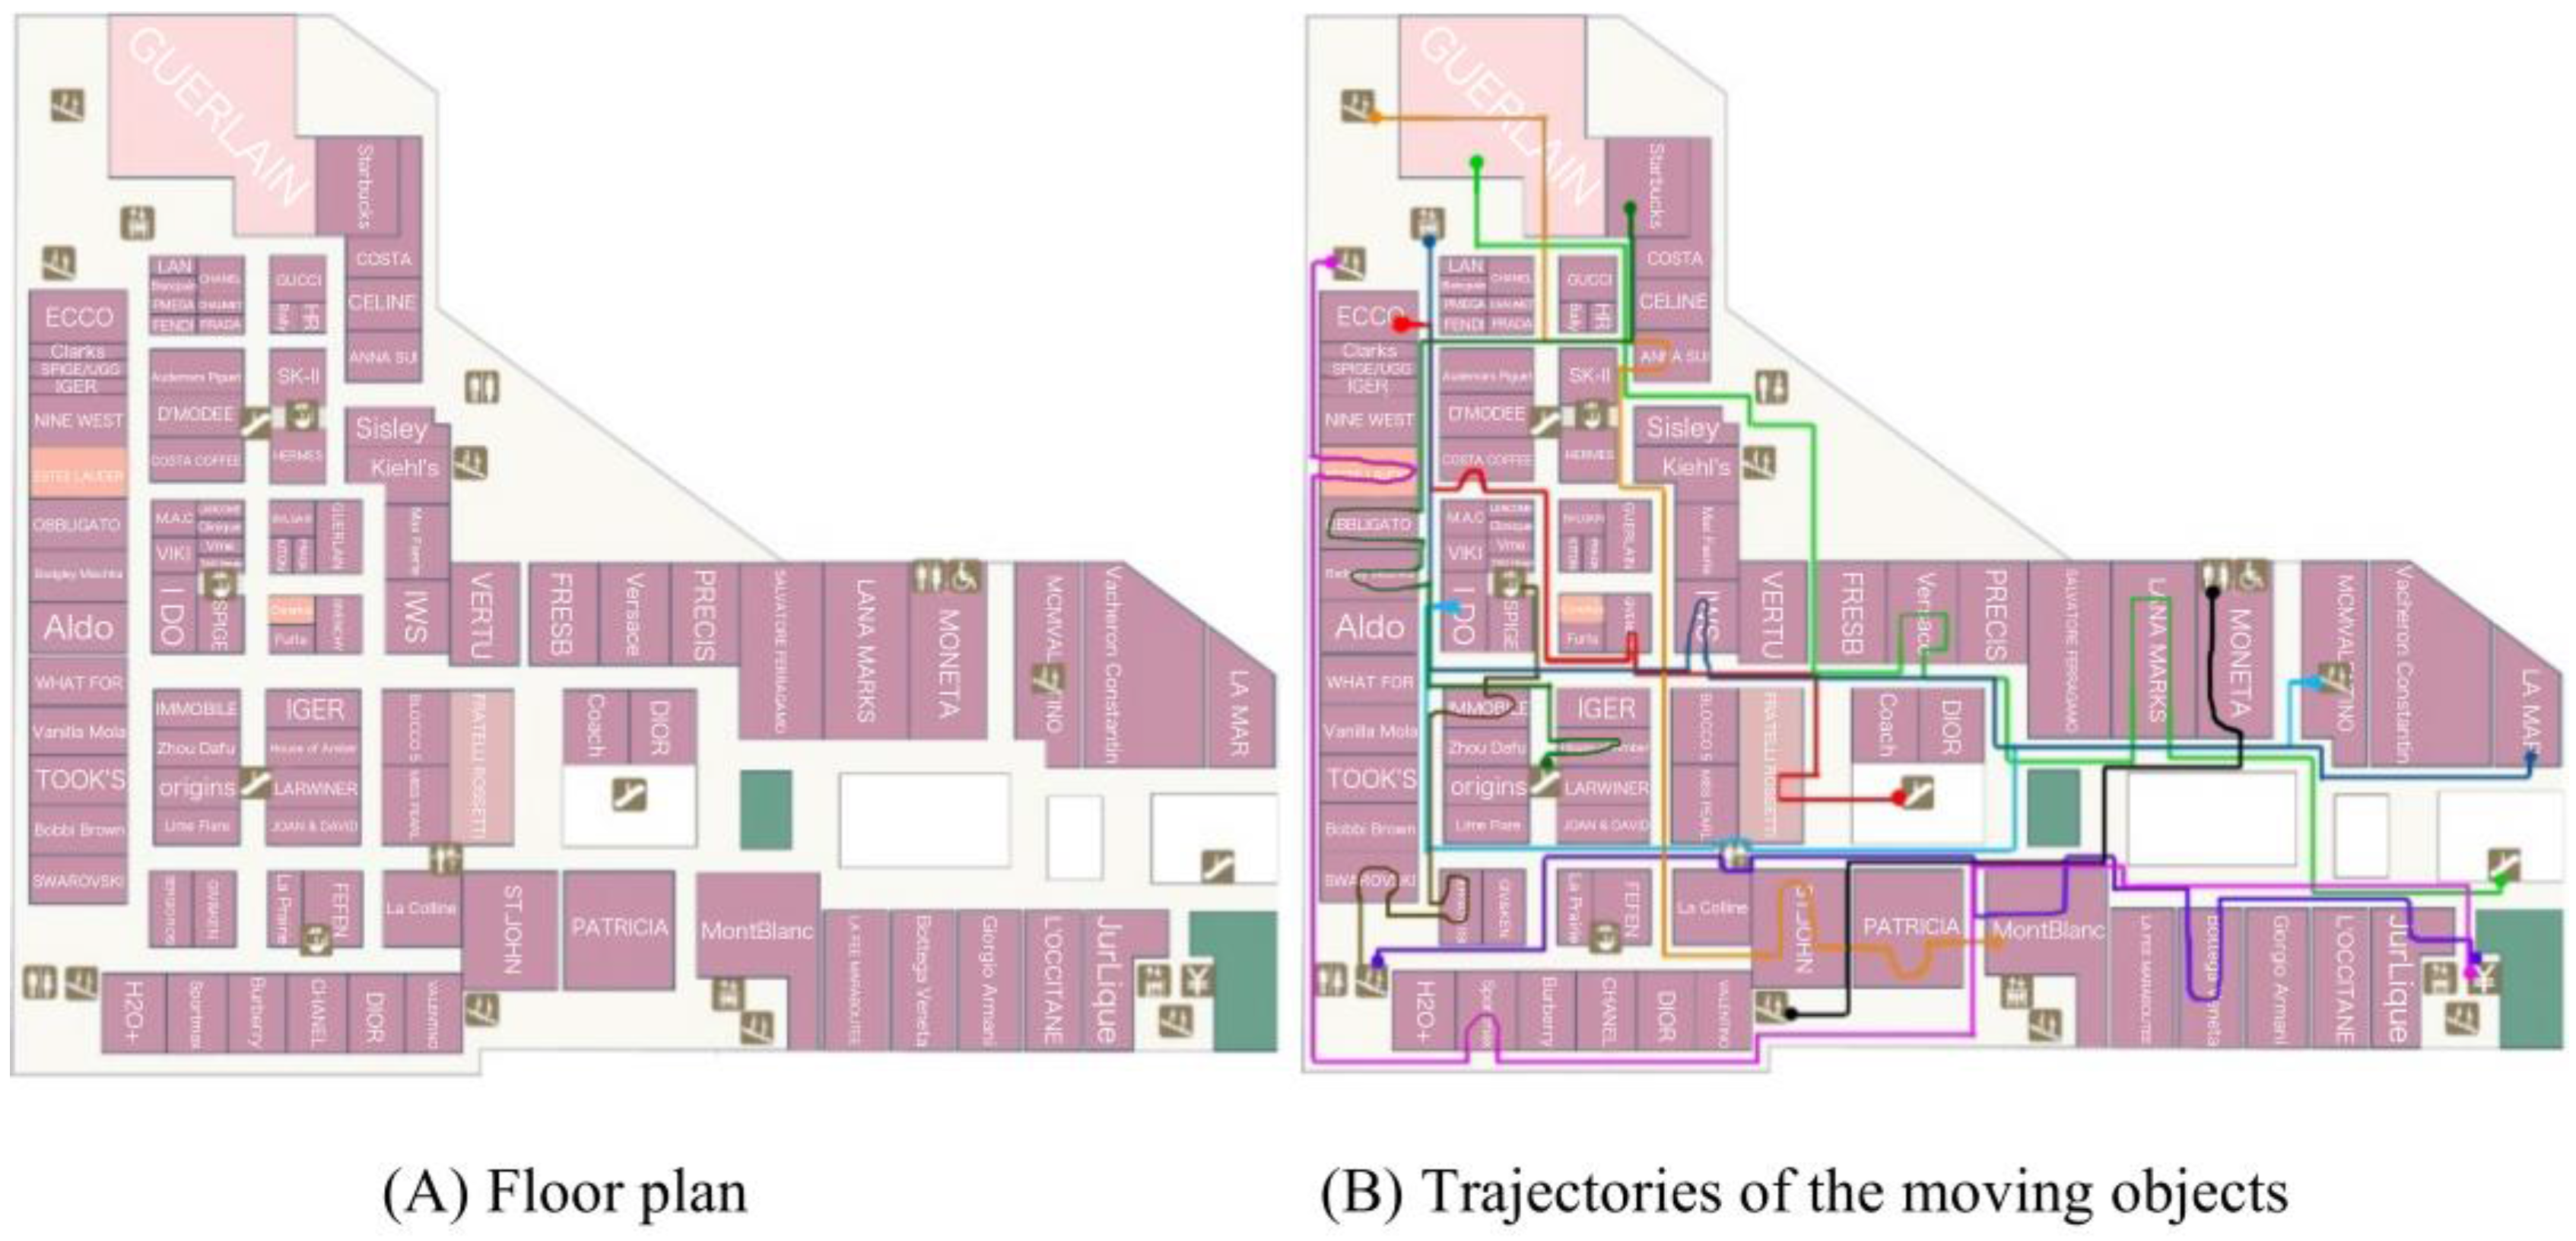
Ijgi 05 00176 g016
Figure 17. (A,B) Floor plan of the real environment and the trajectories of the moving objects.
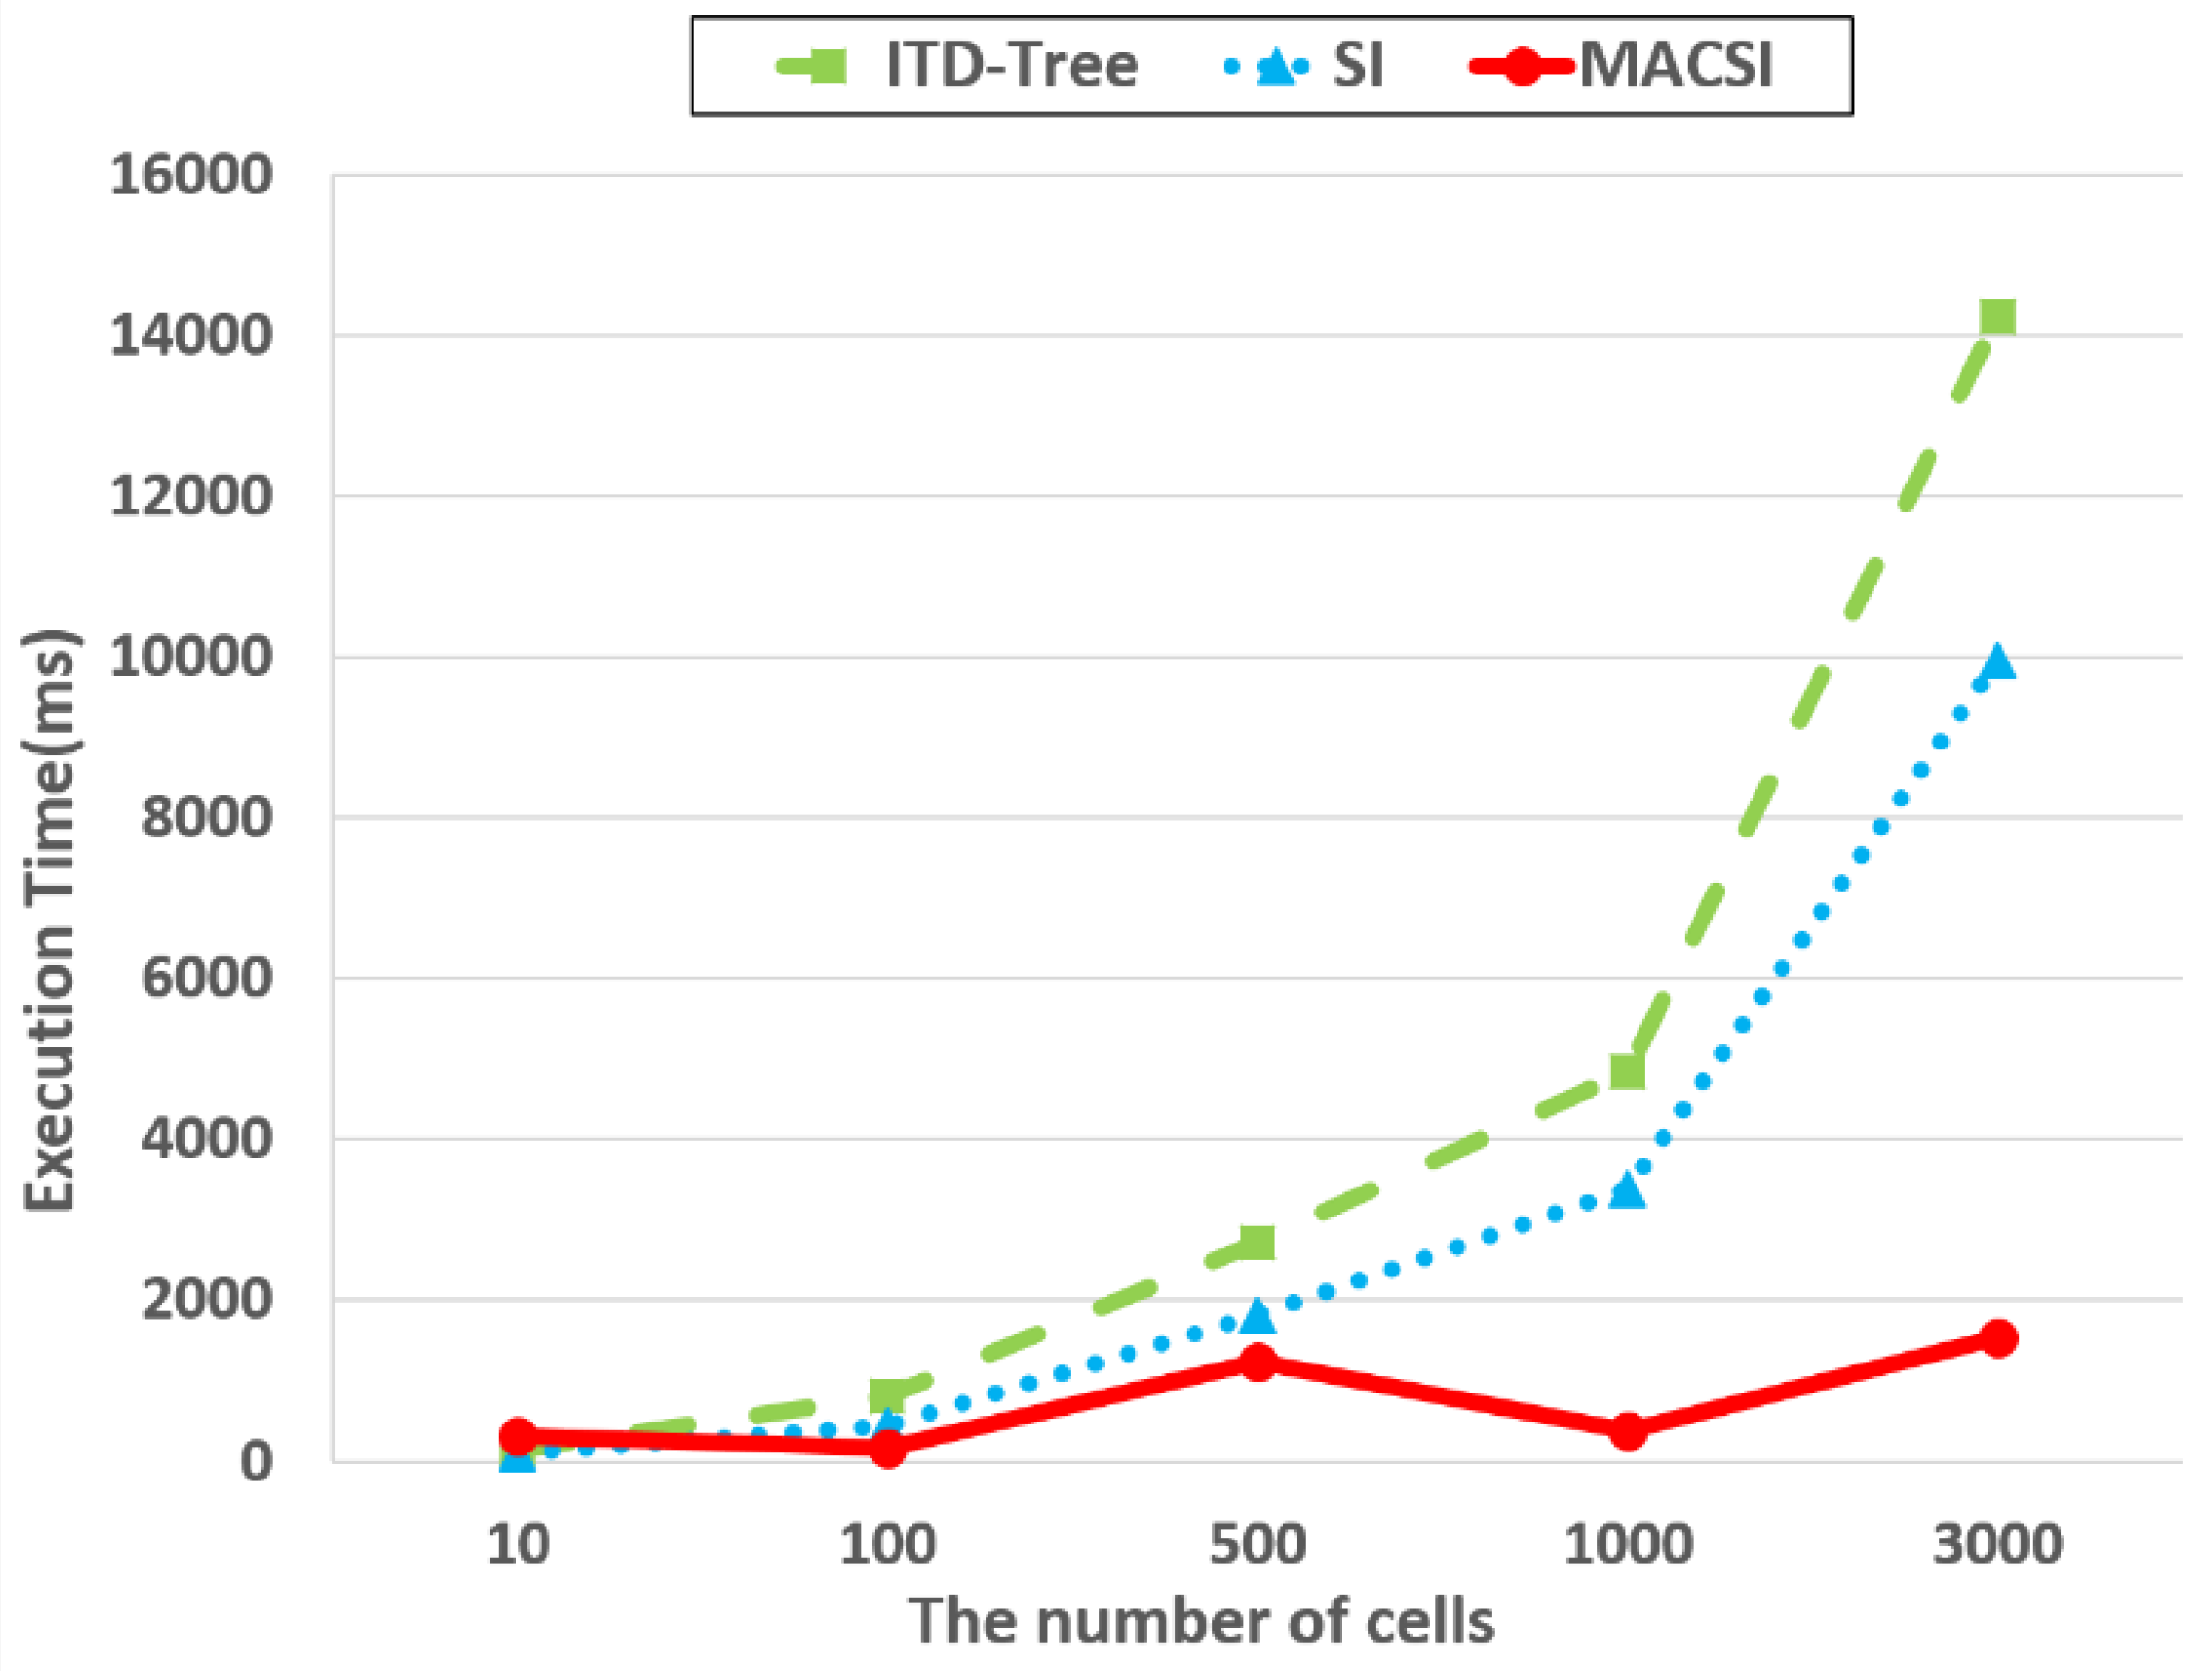
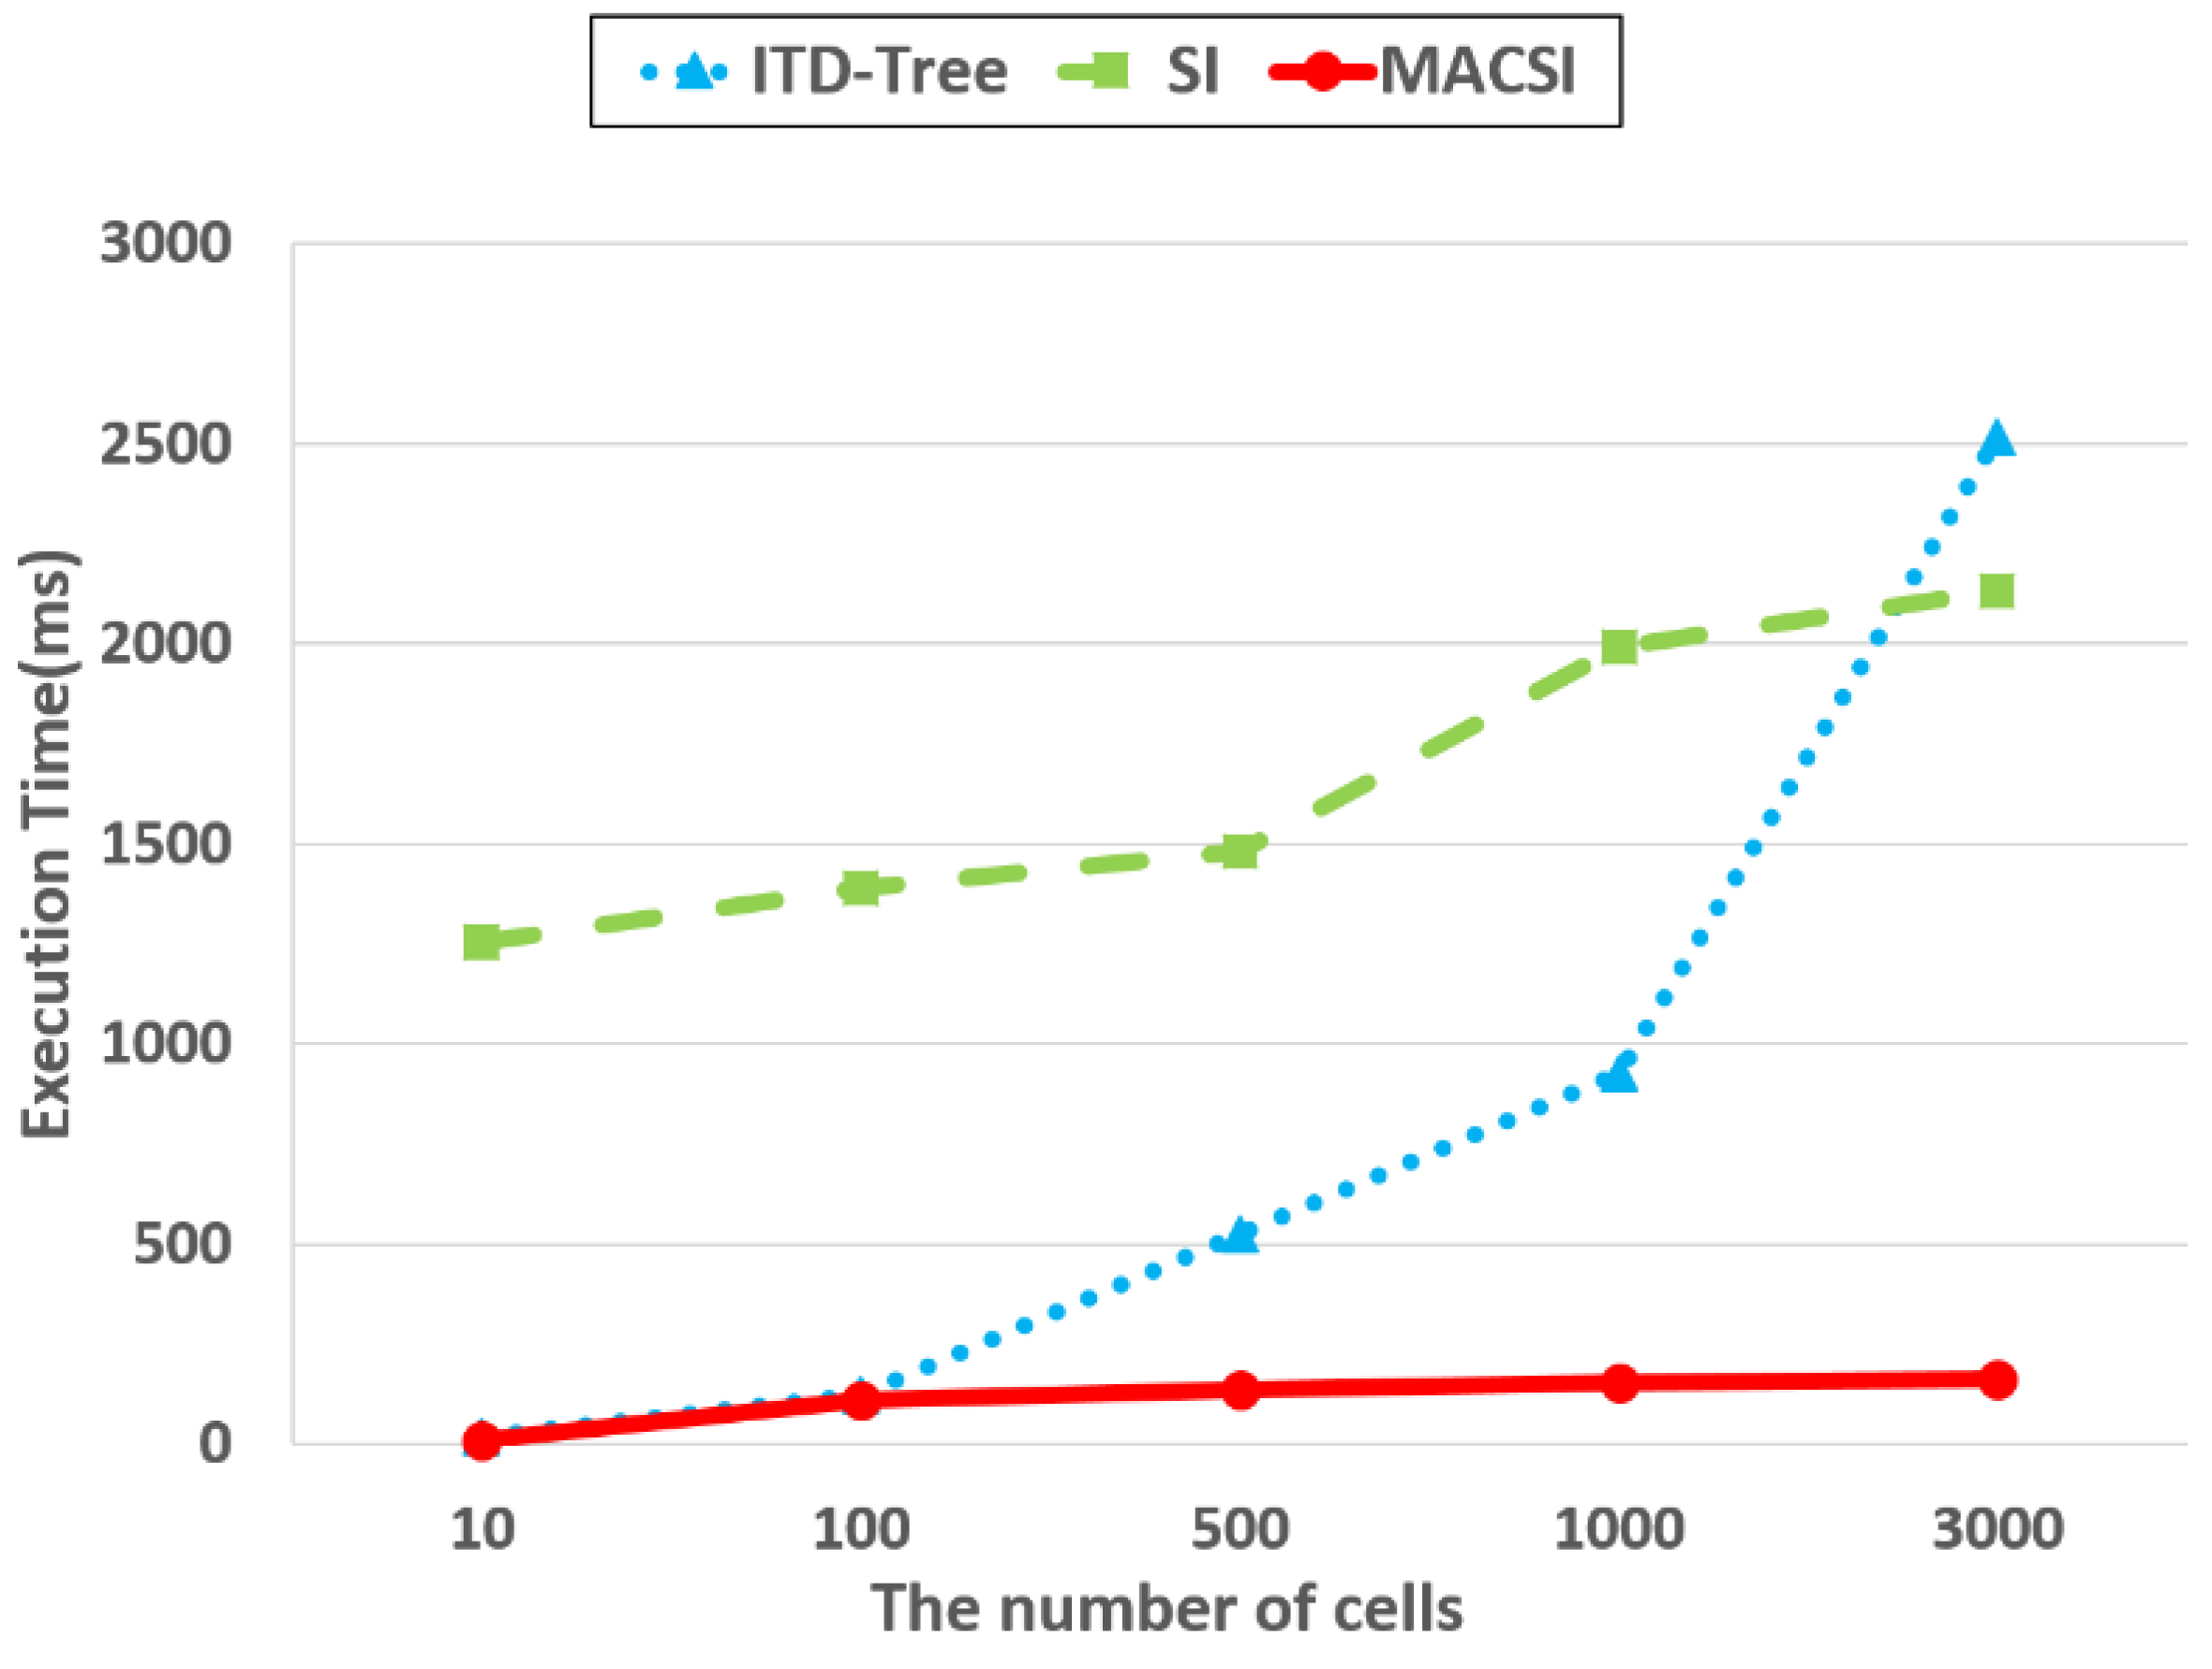
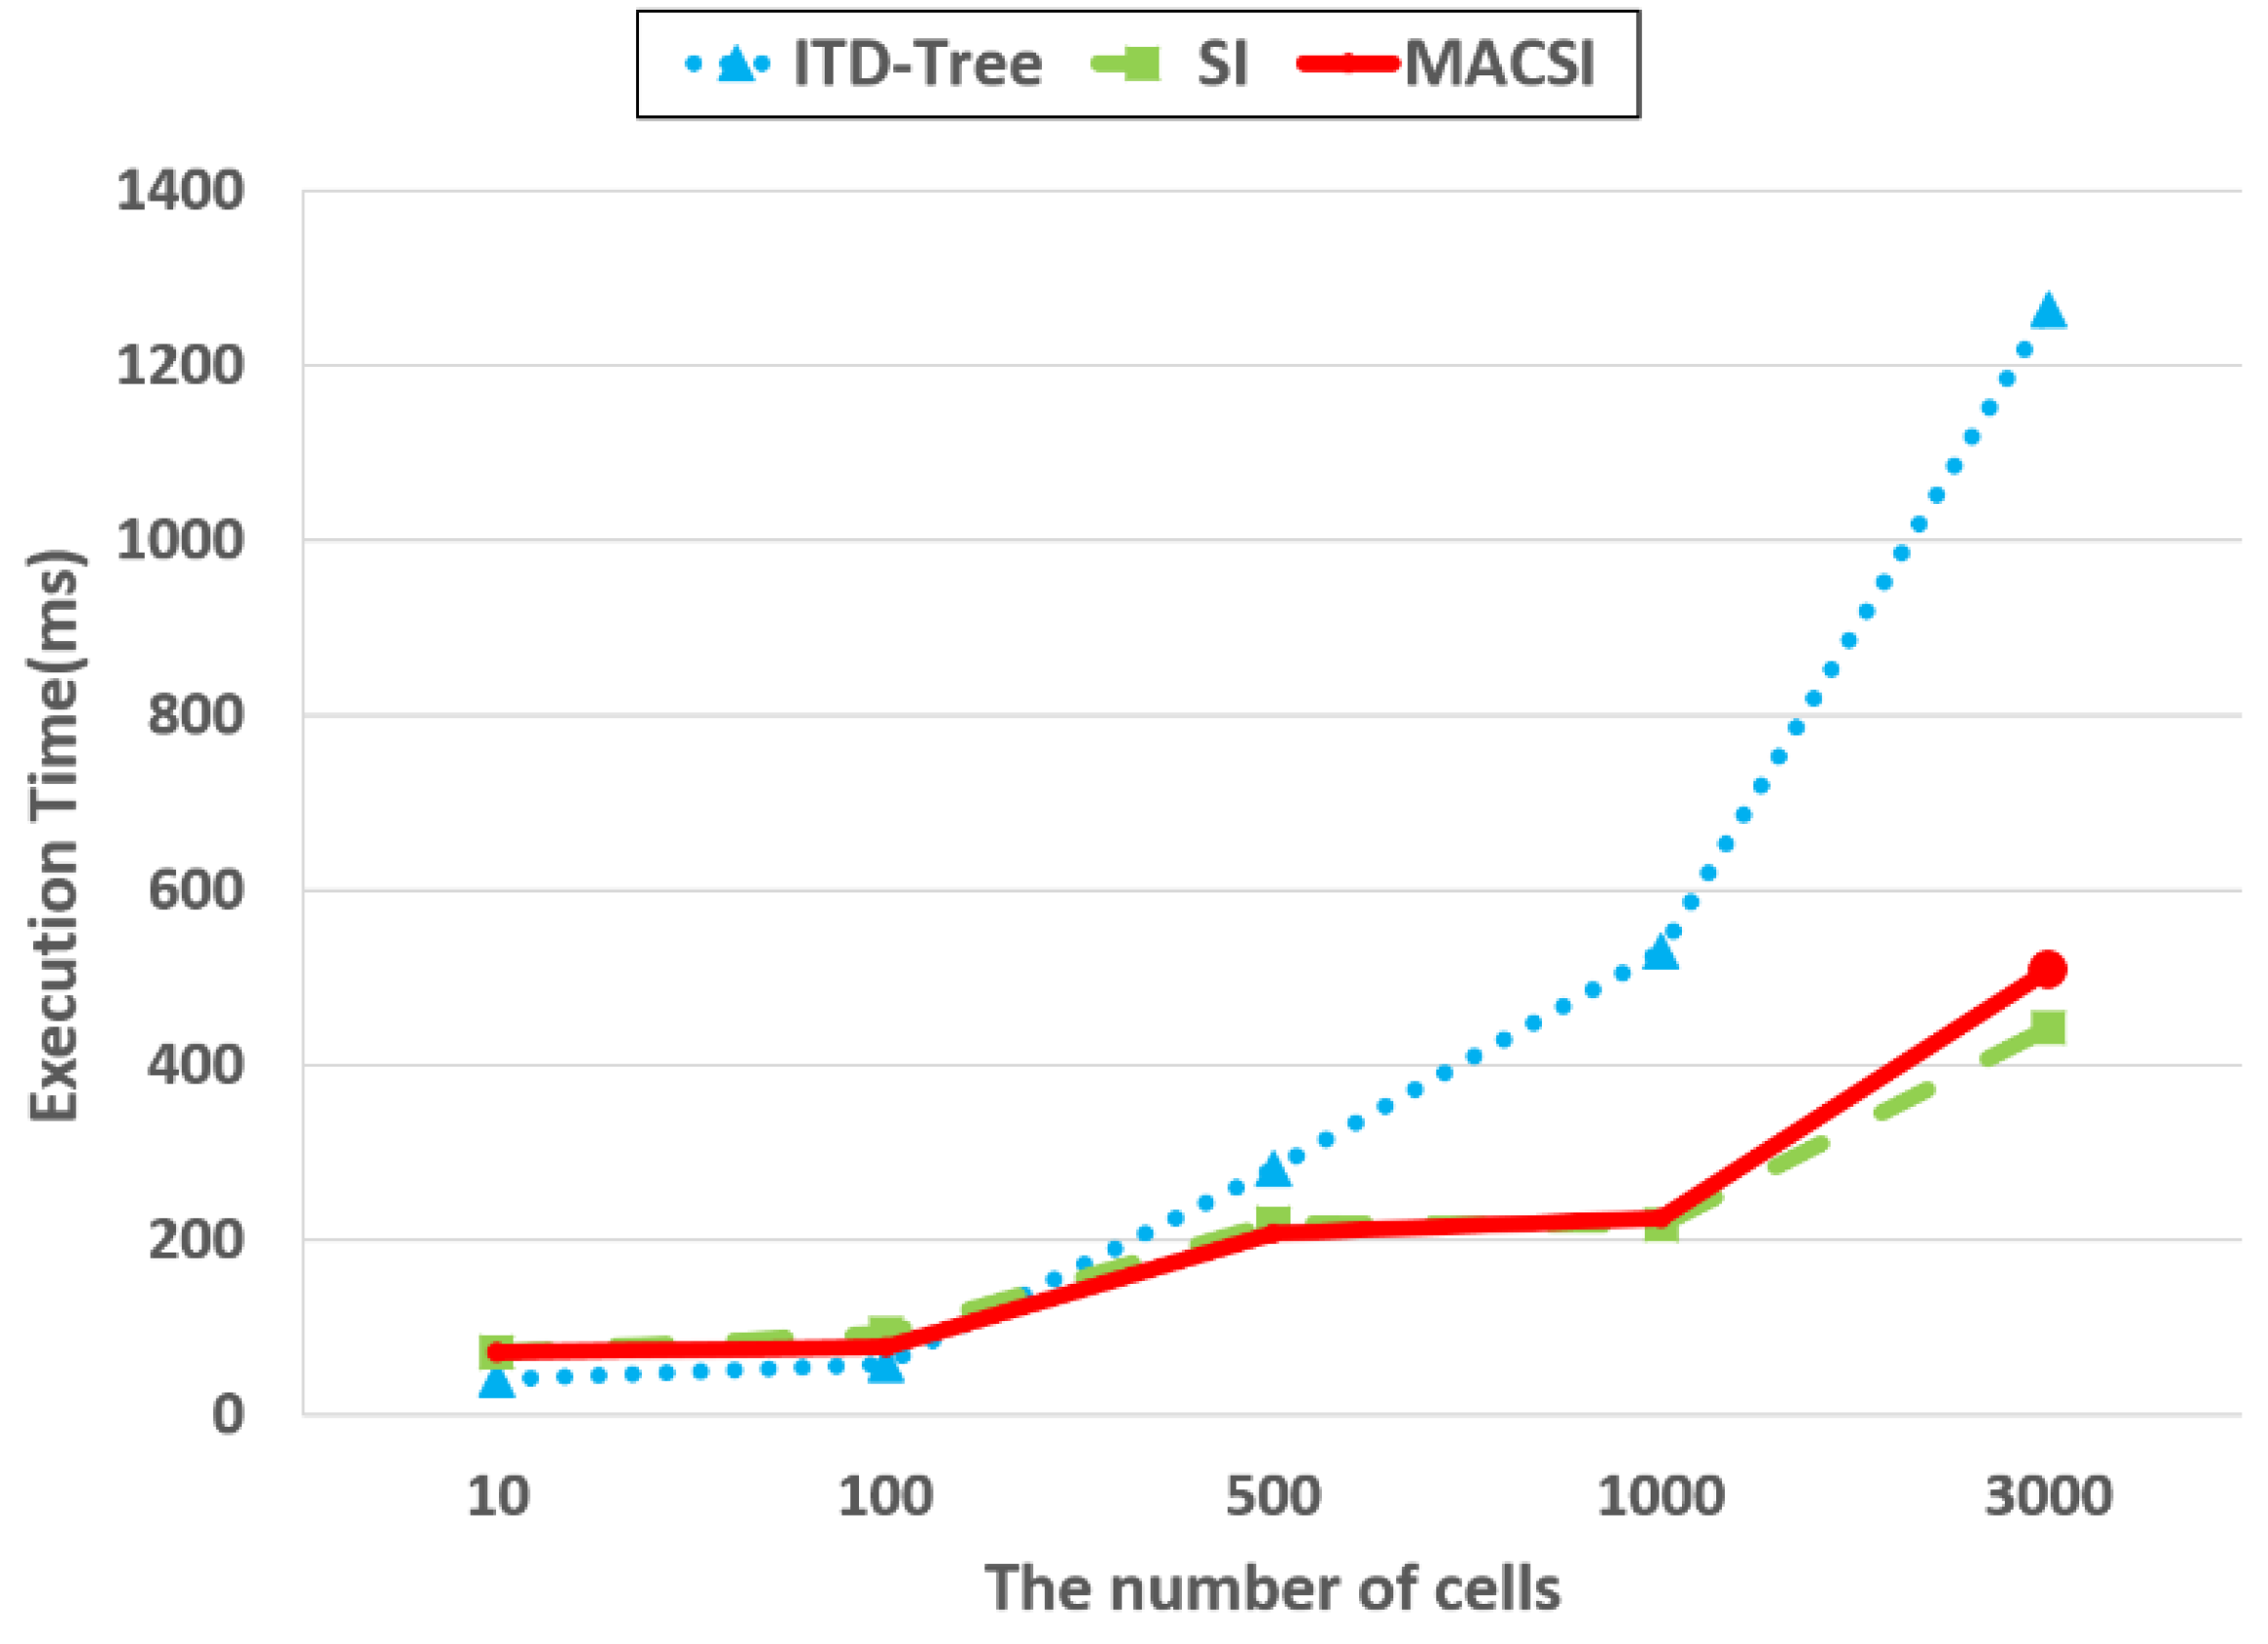
Ijgi 05 00176 g017
Figure 18. The effect of cell number on fine-grained semantic cell query.
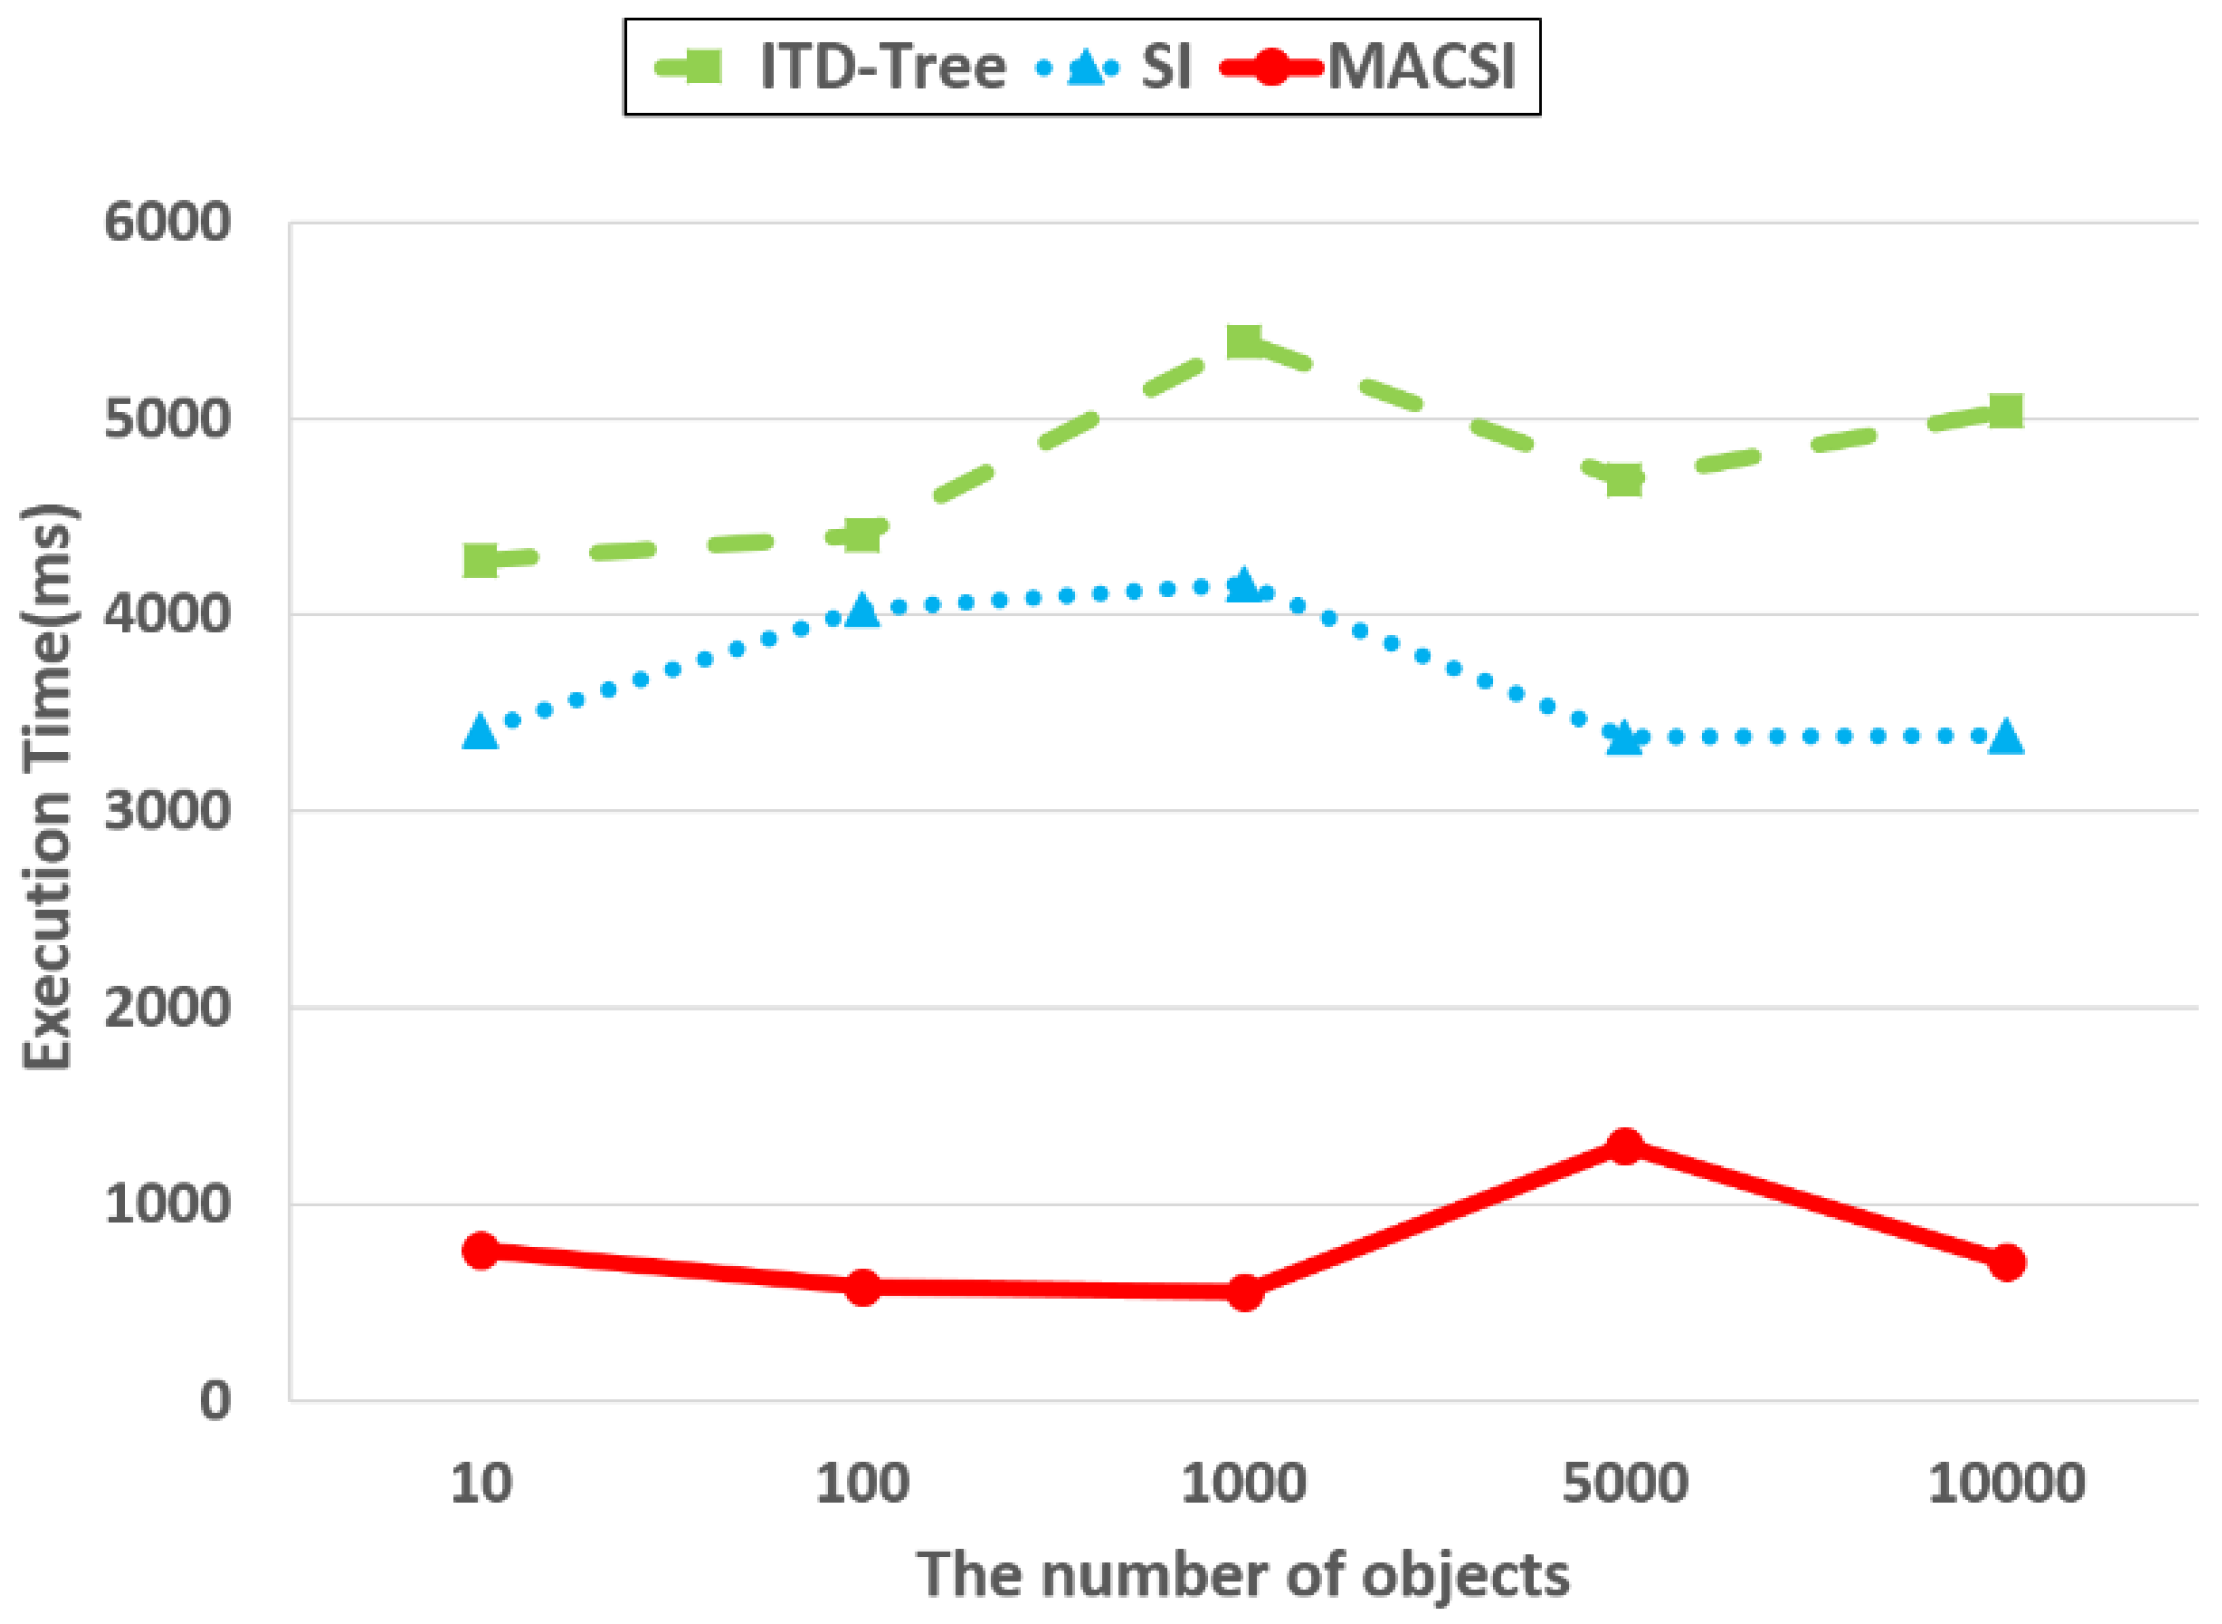
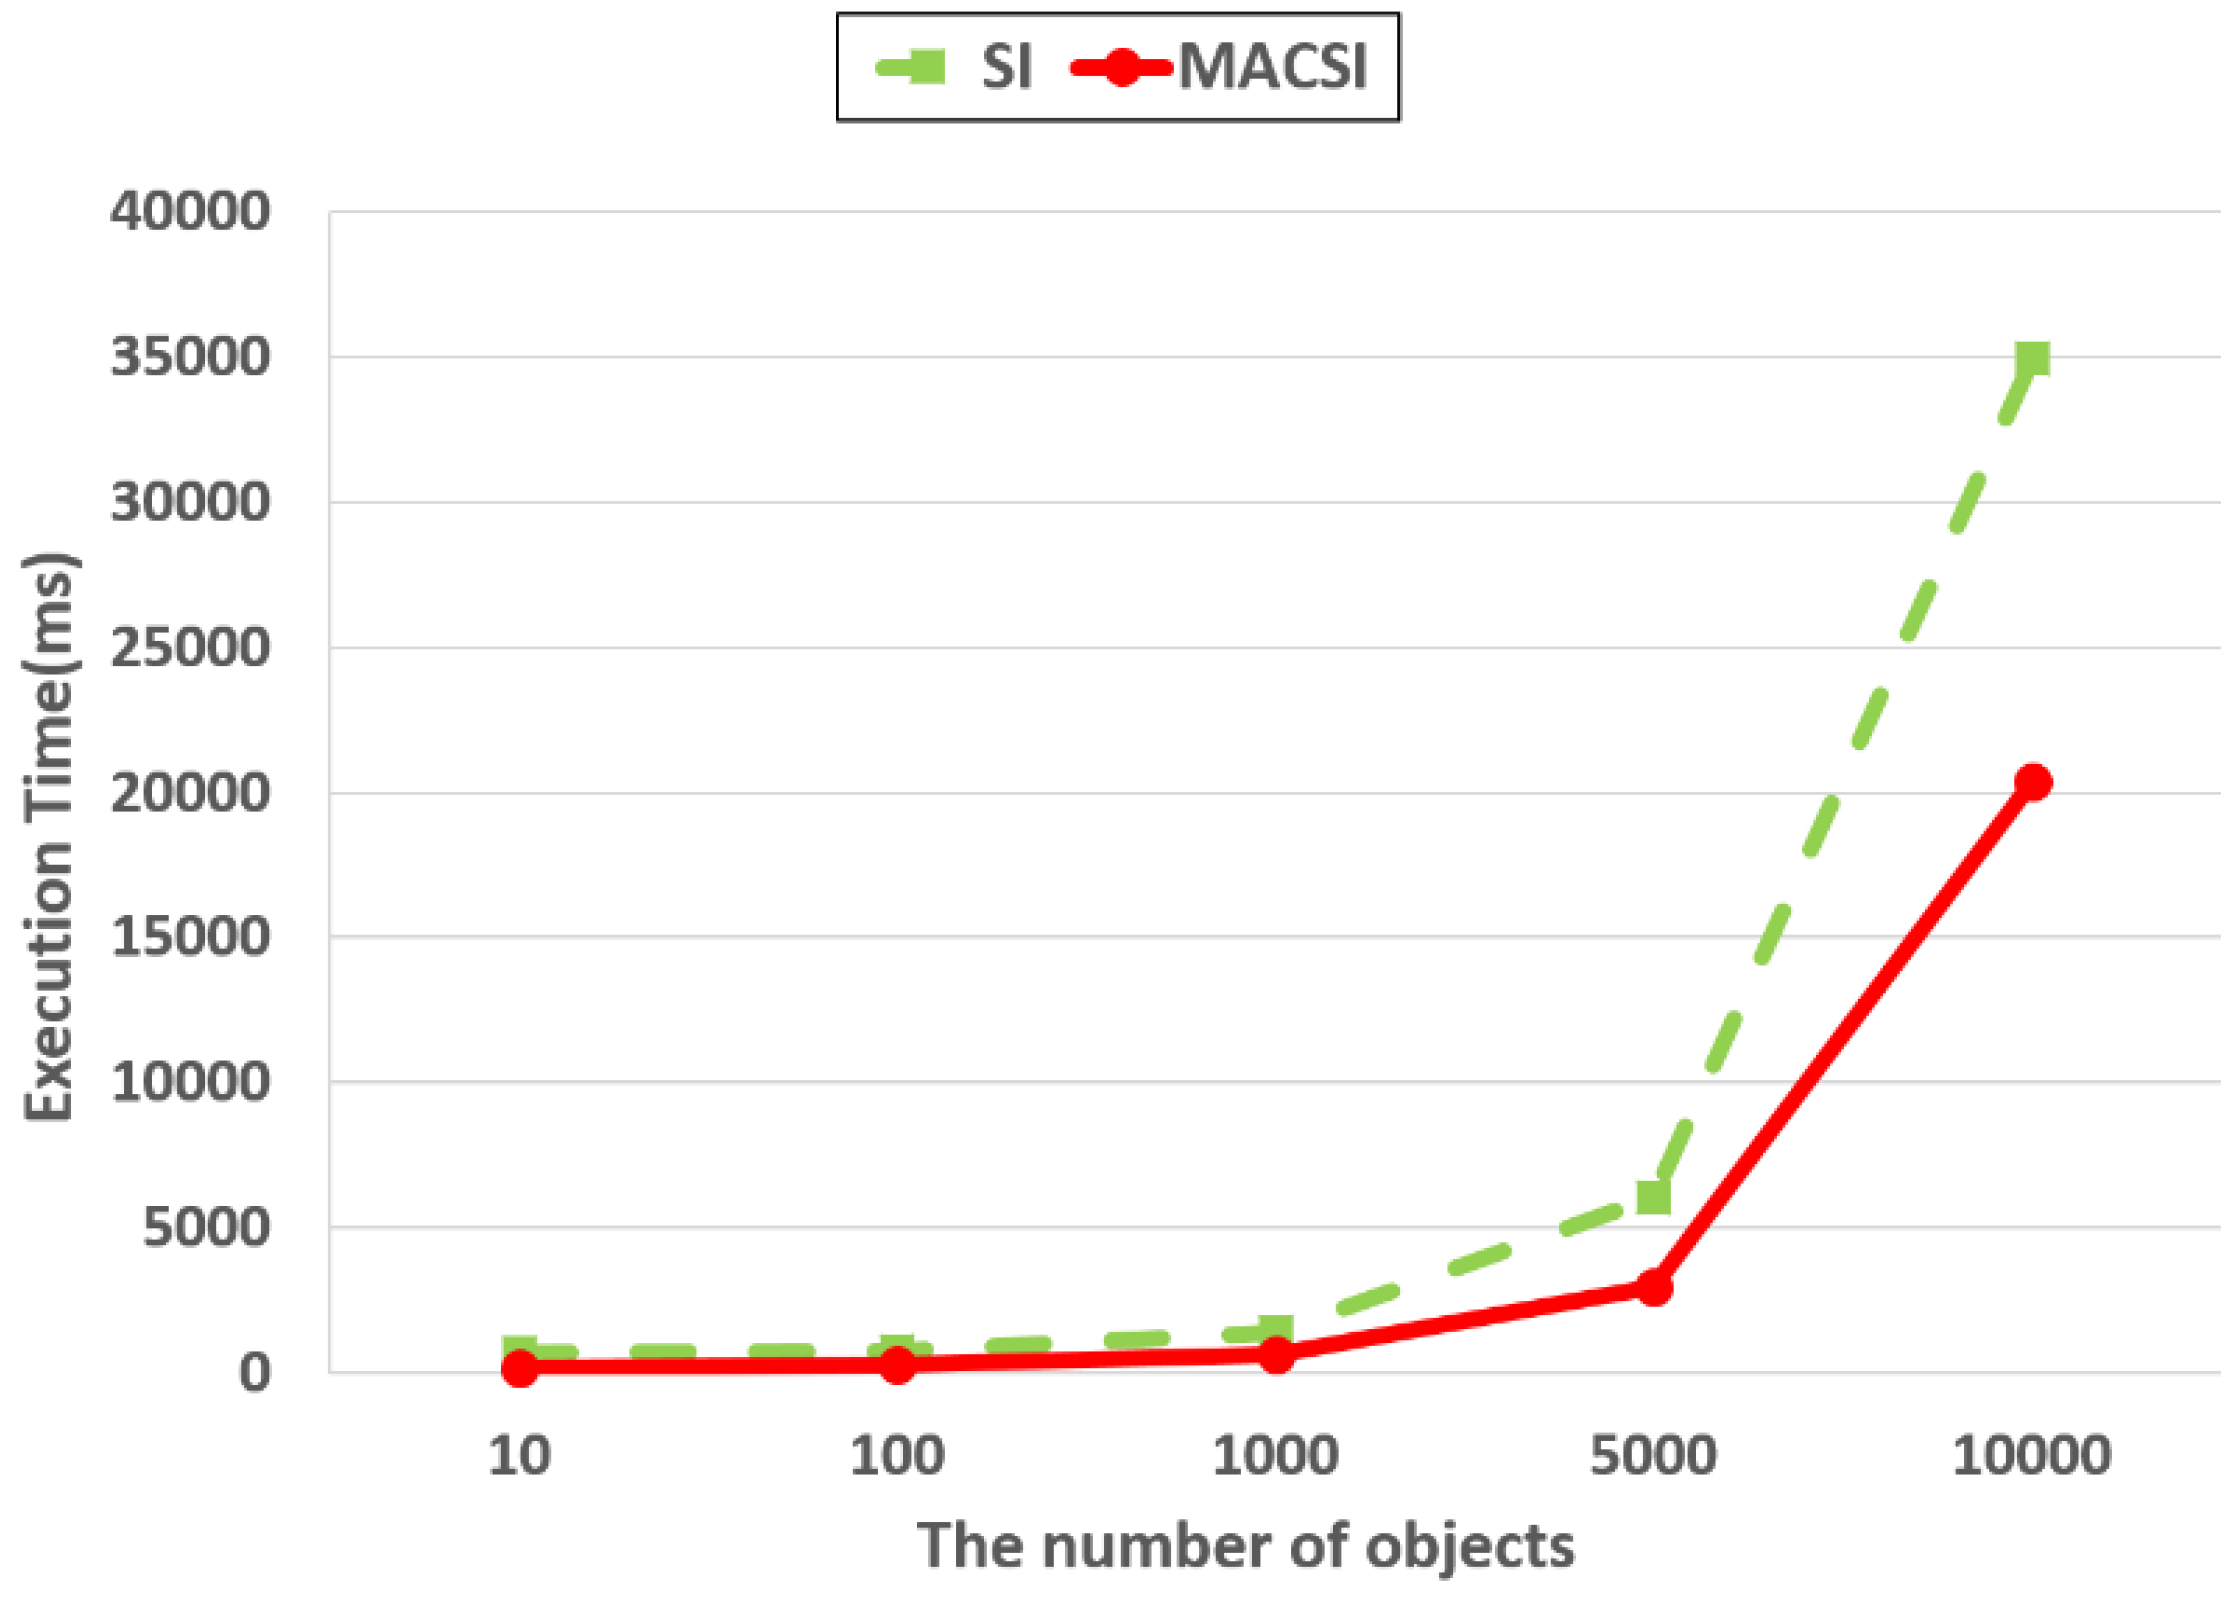
Ijgi 05 00176 g018
Figure 19. The effect of object number on fine-grained semantic cell query.
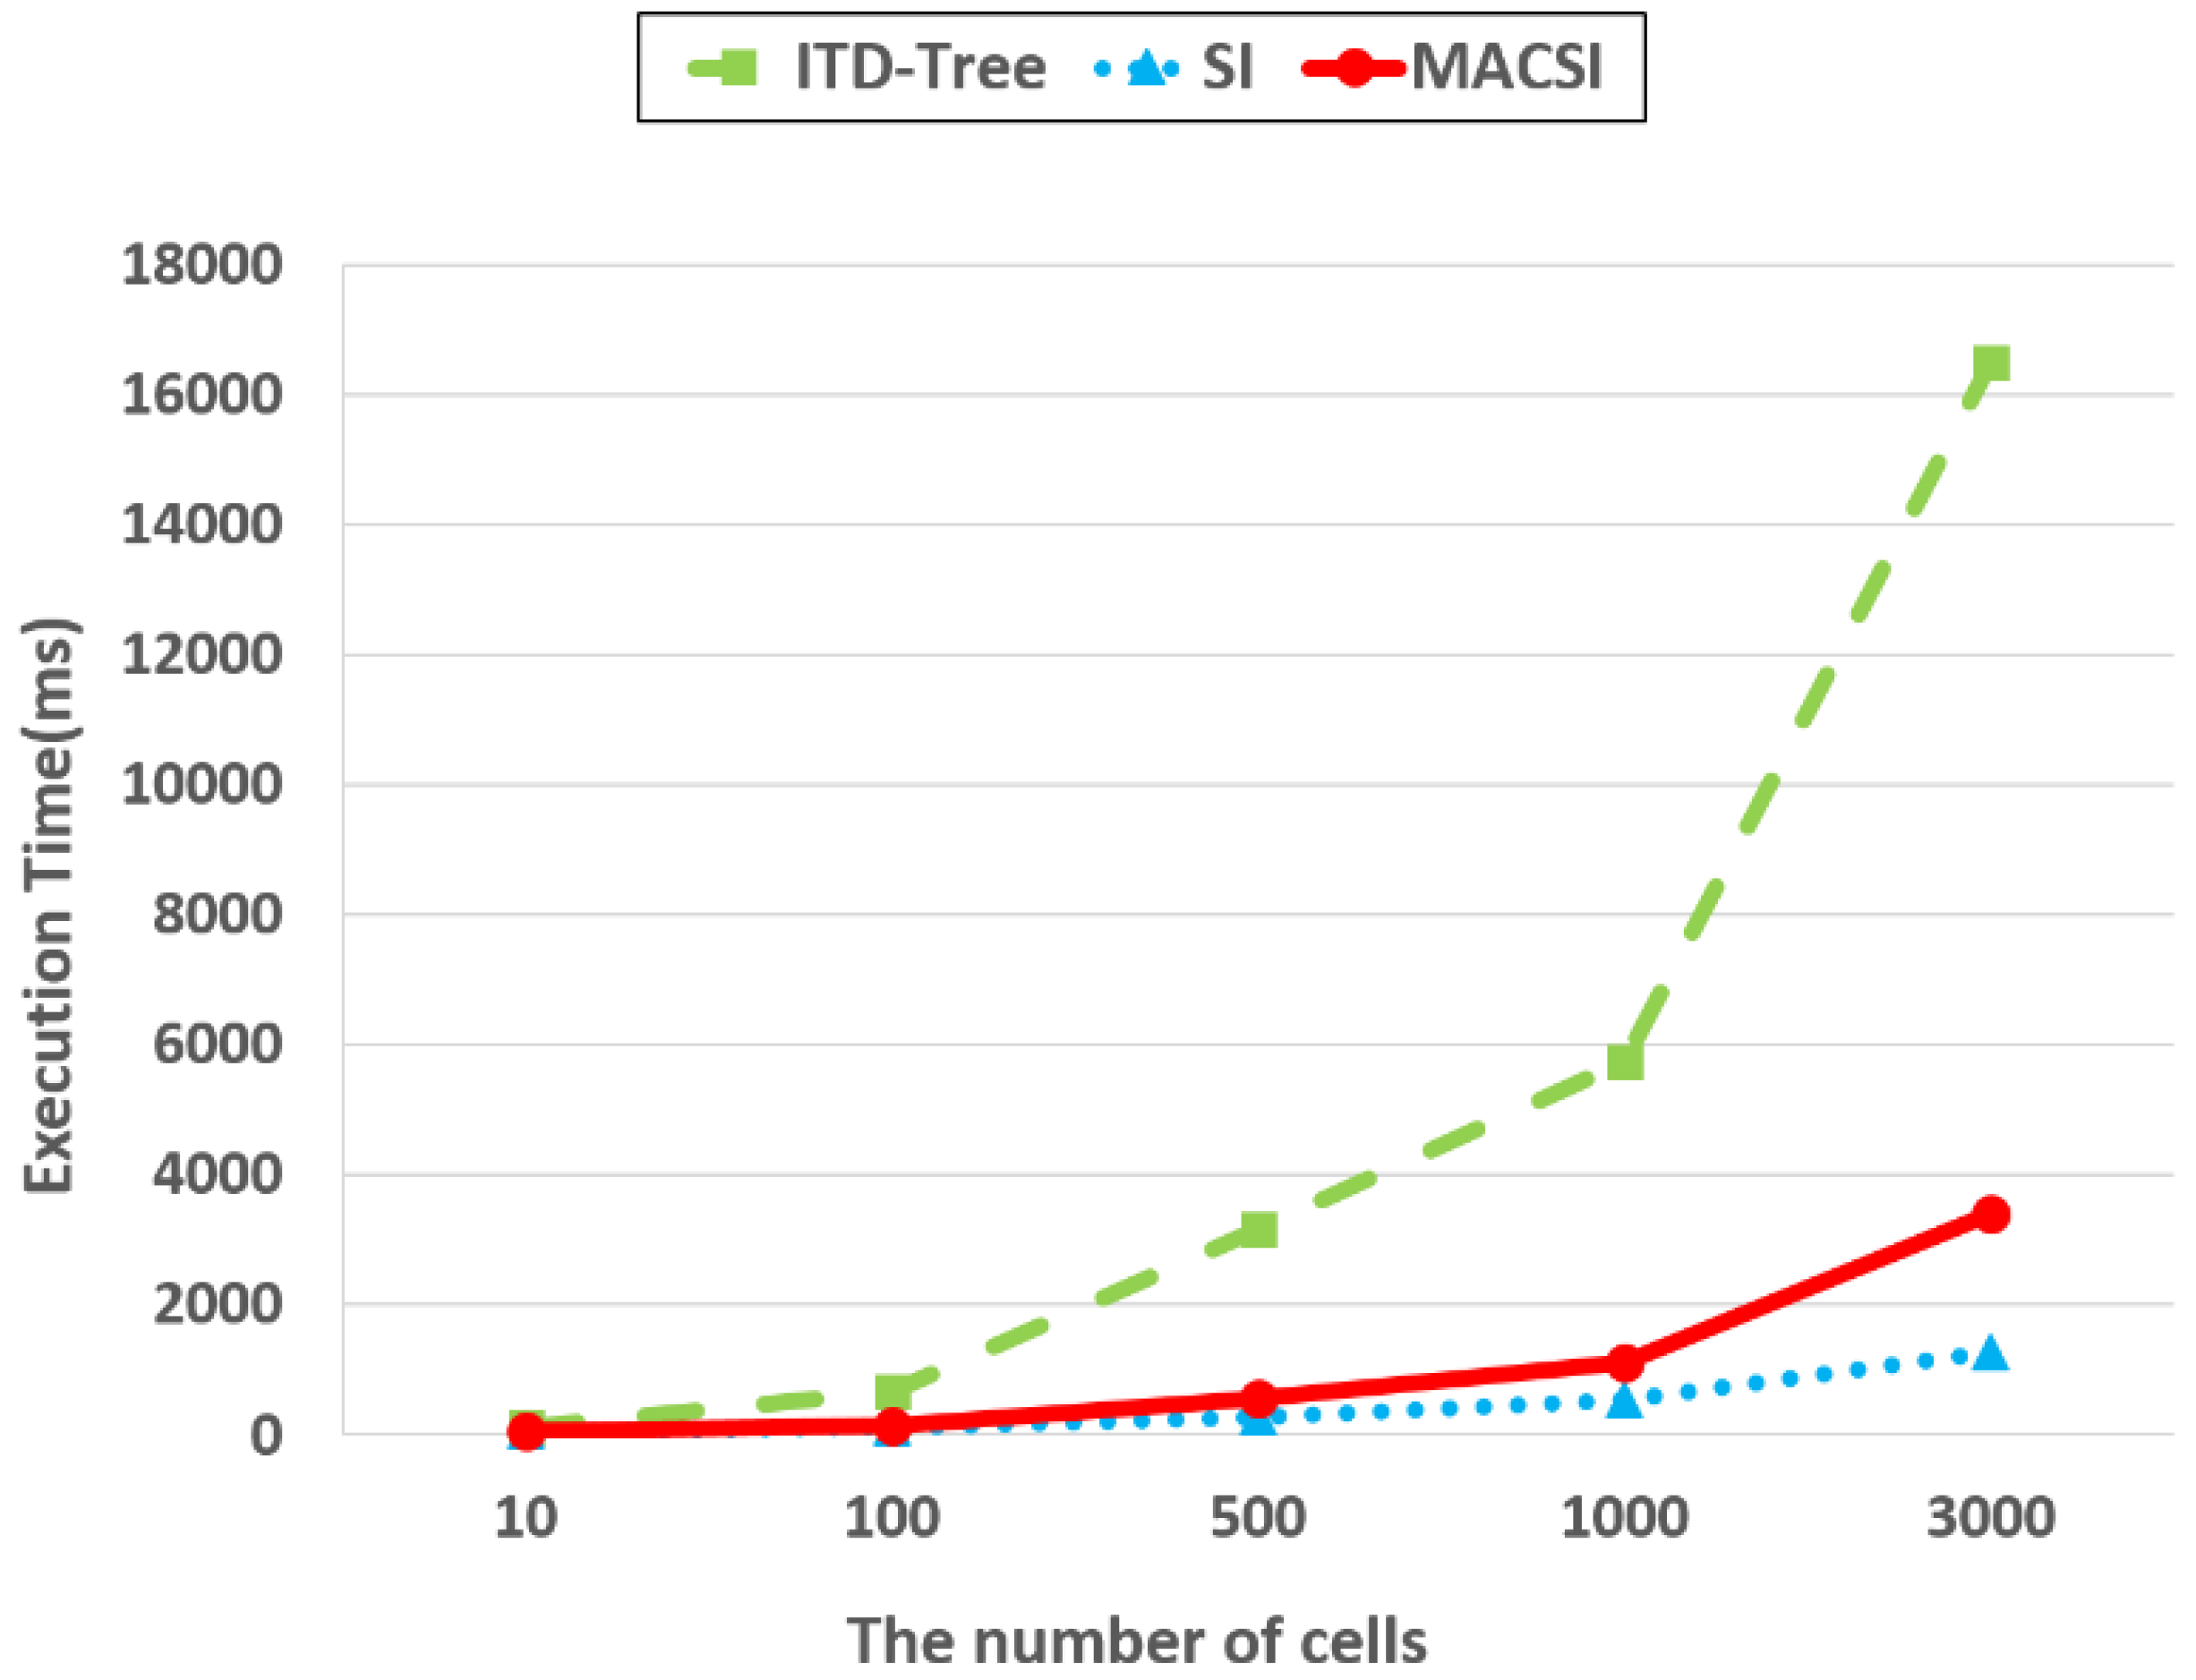
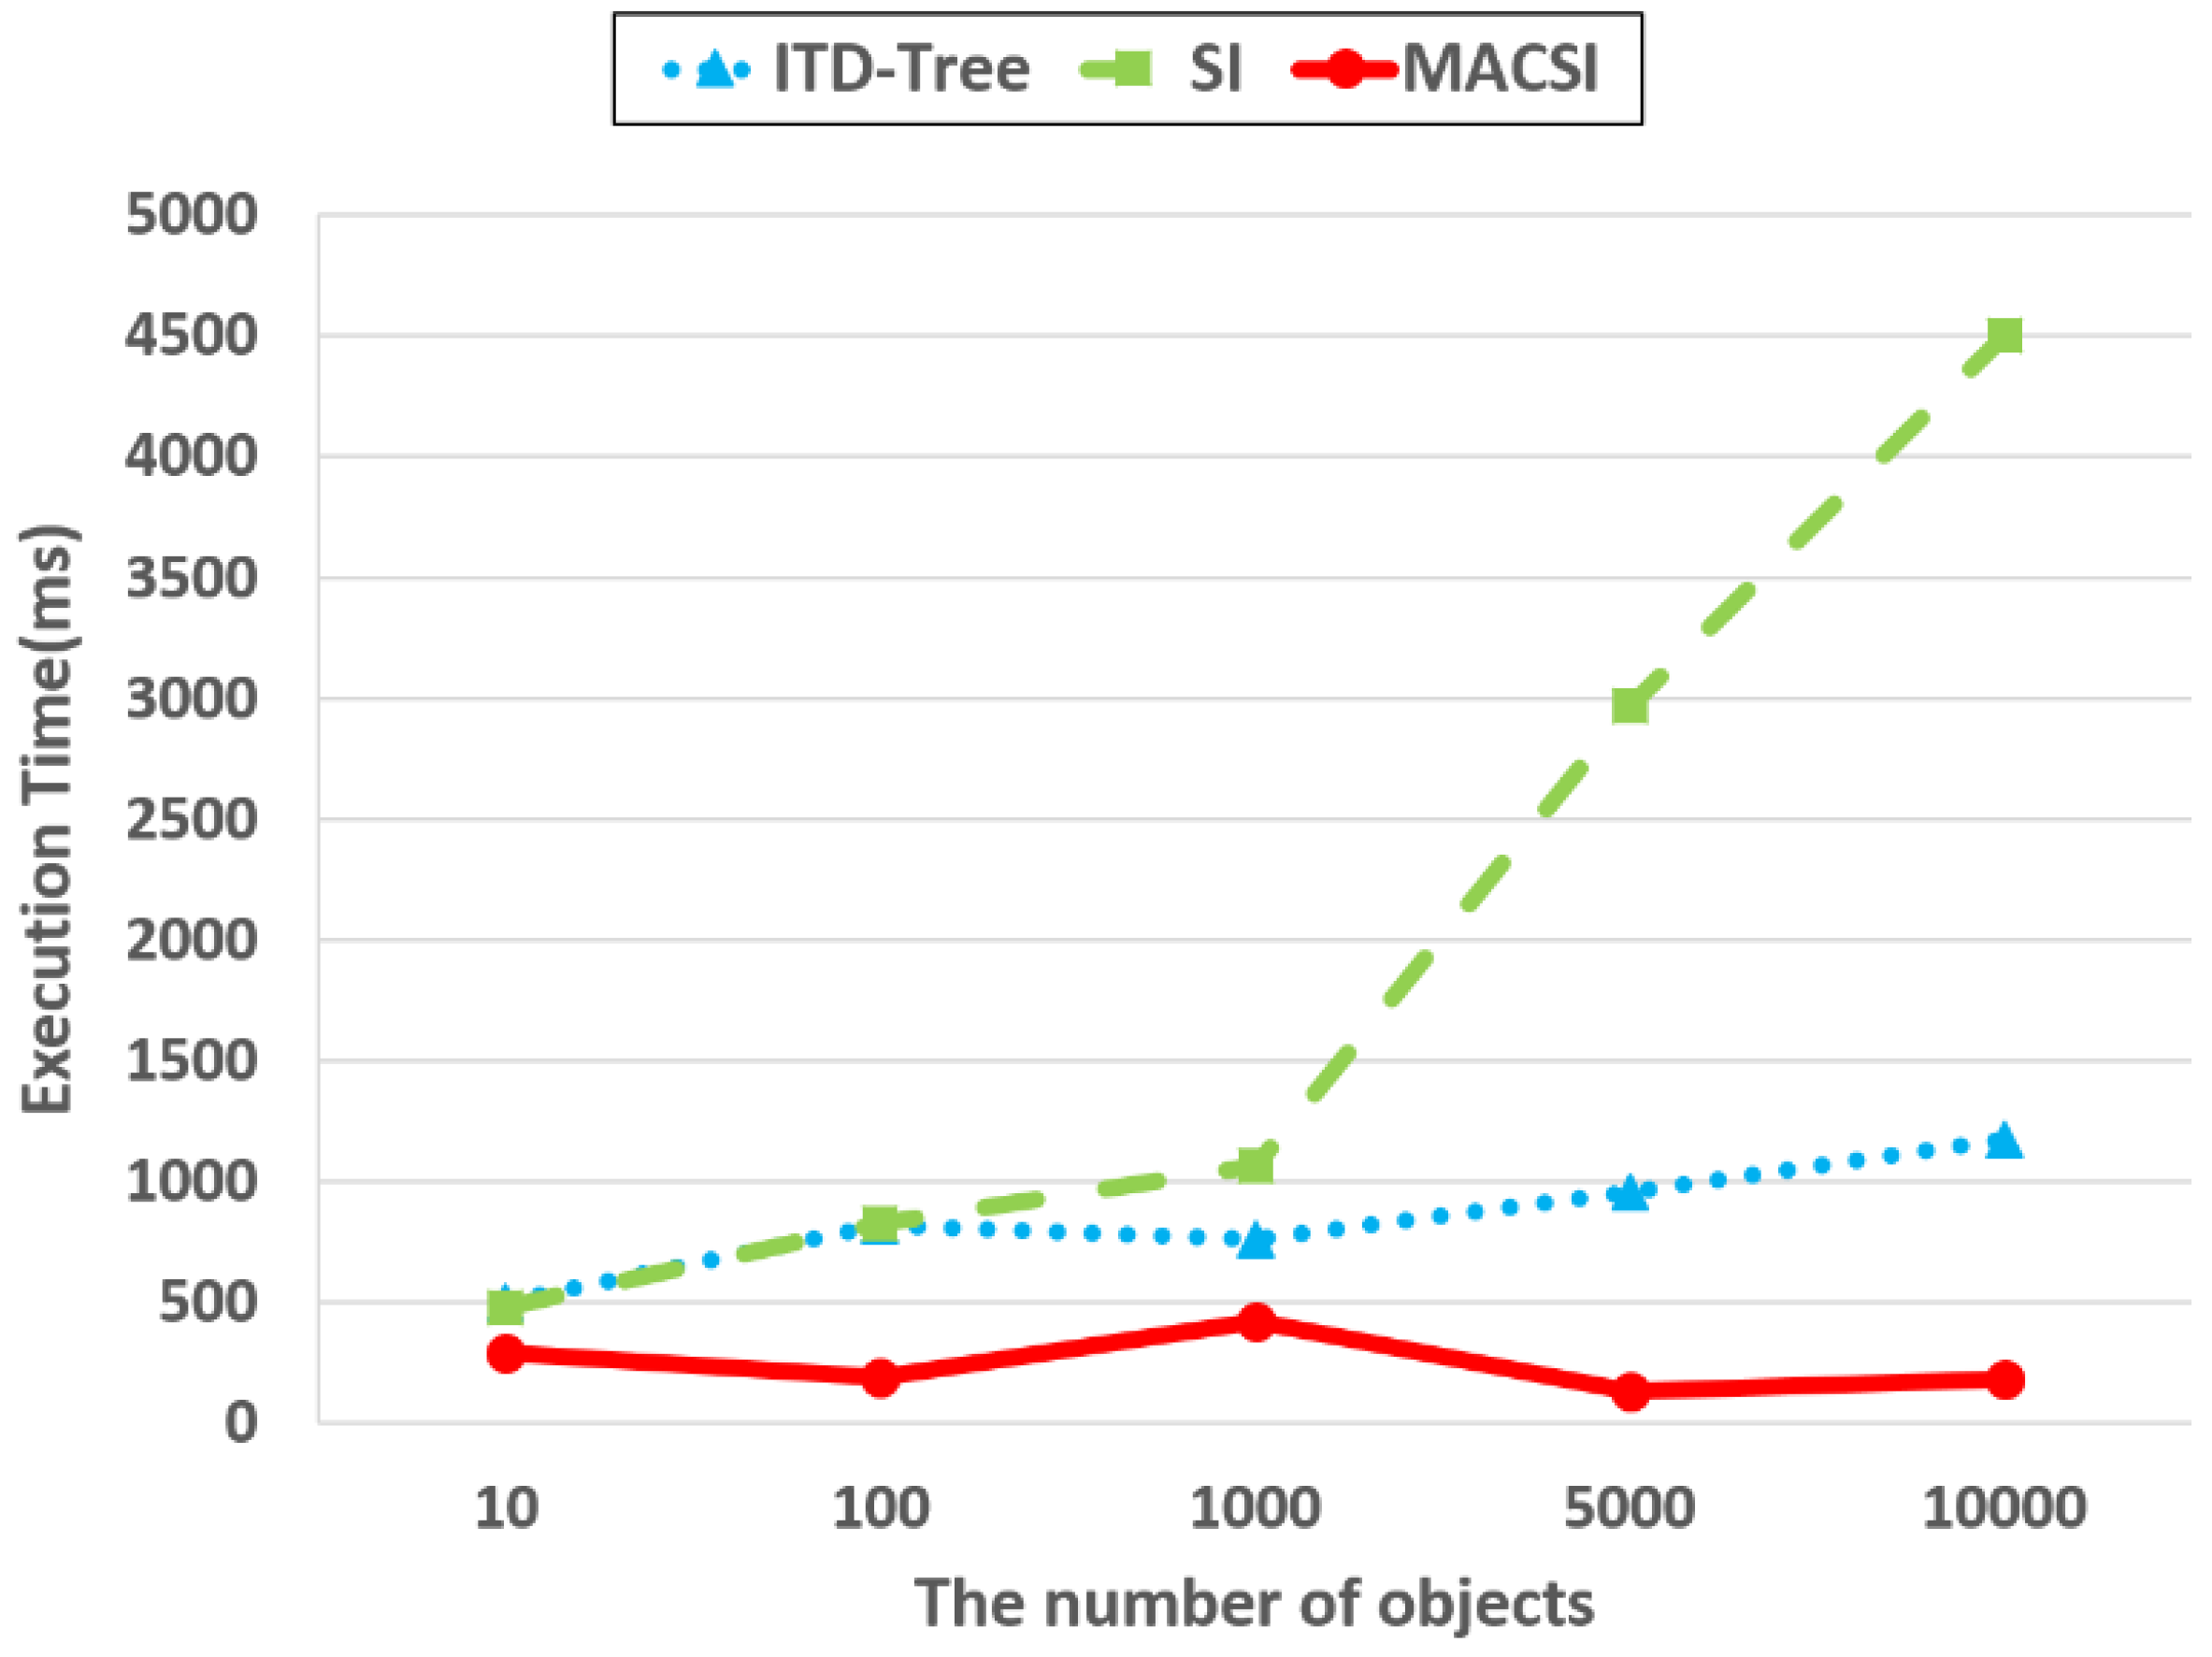
Ijgi 05 00176 g019
Figure 20. The effect of cell number on the coarse-grained semantic cell query performance.
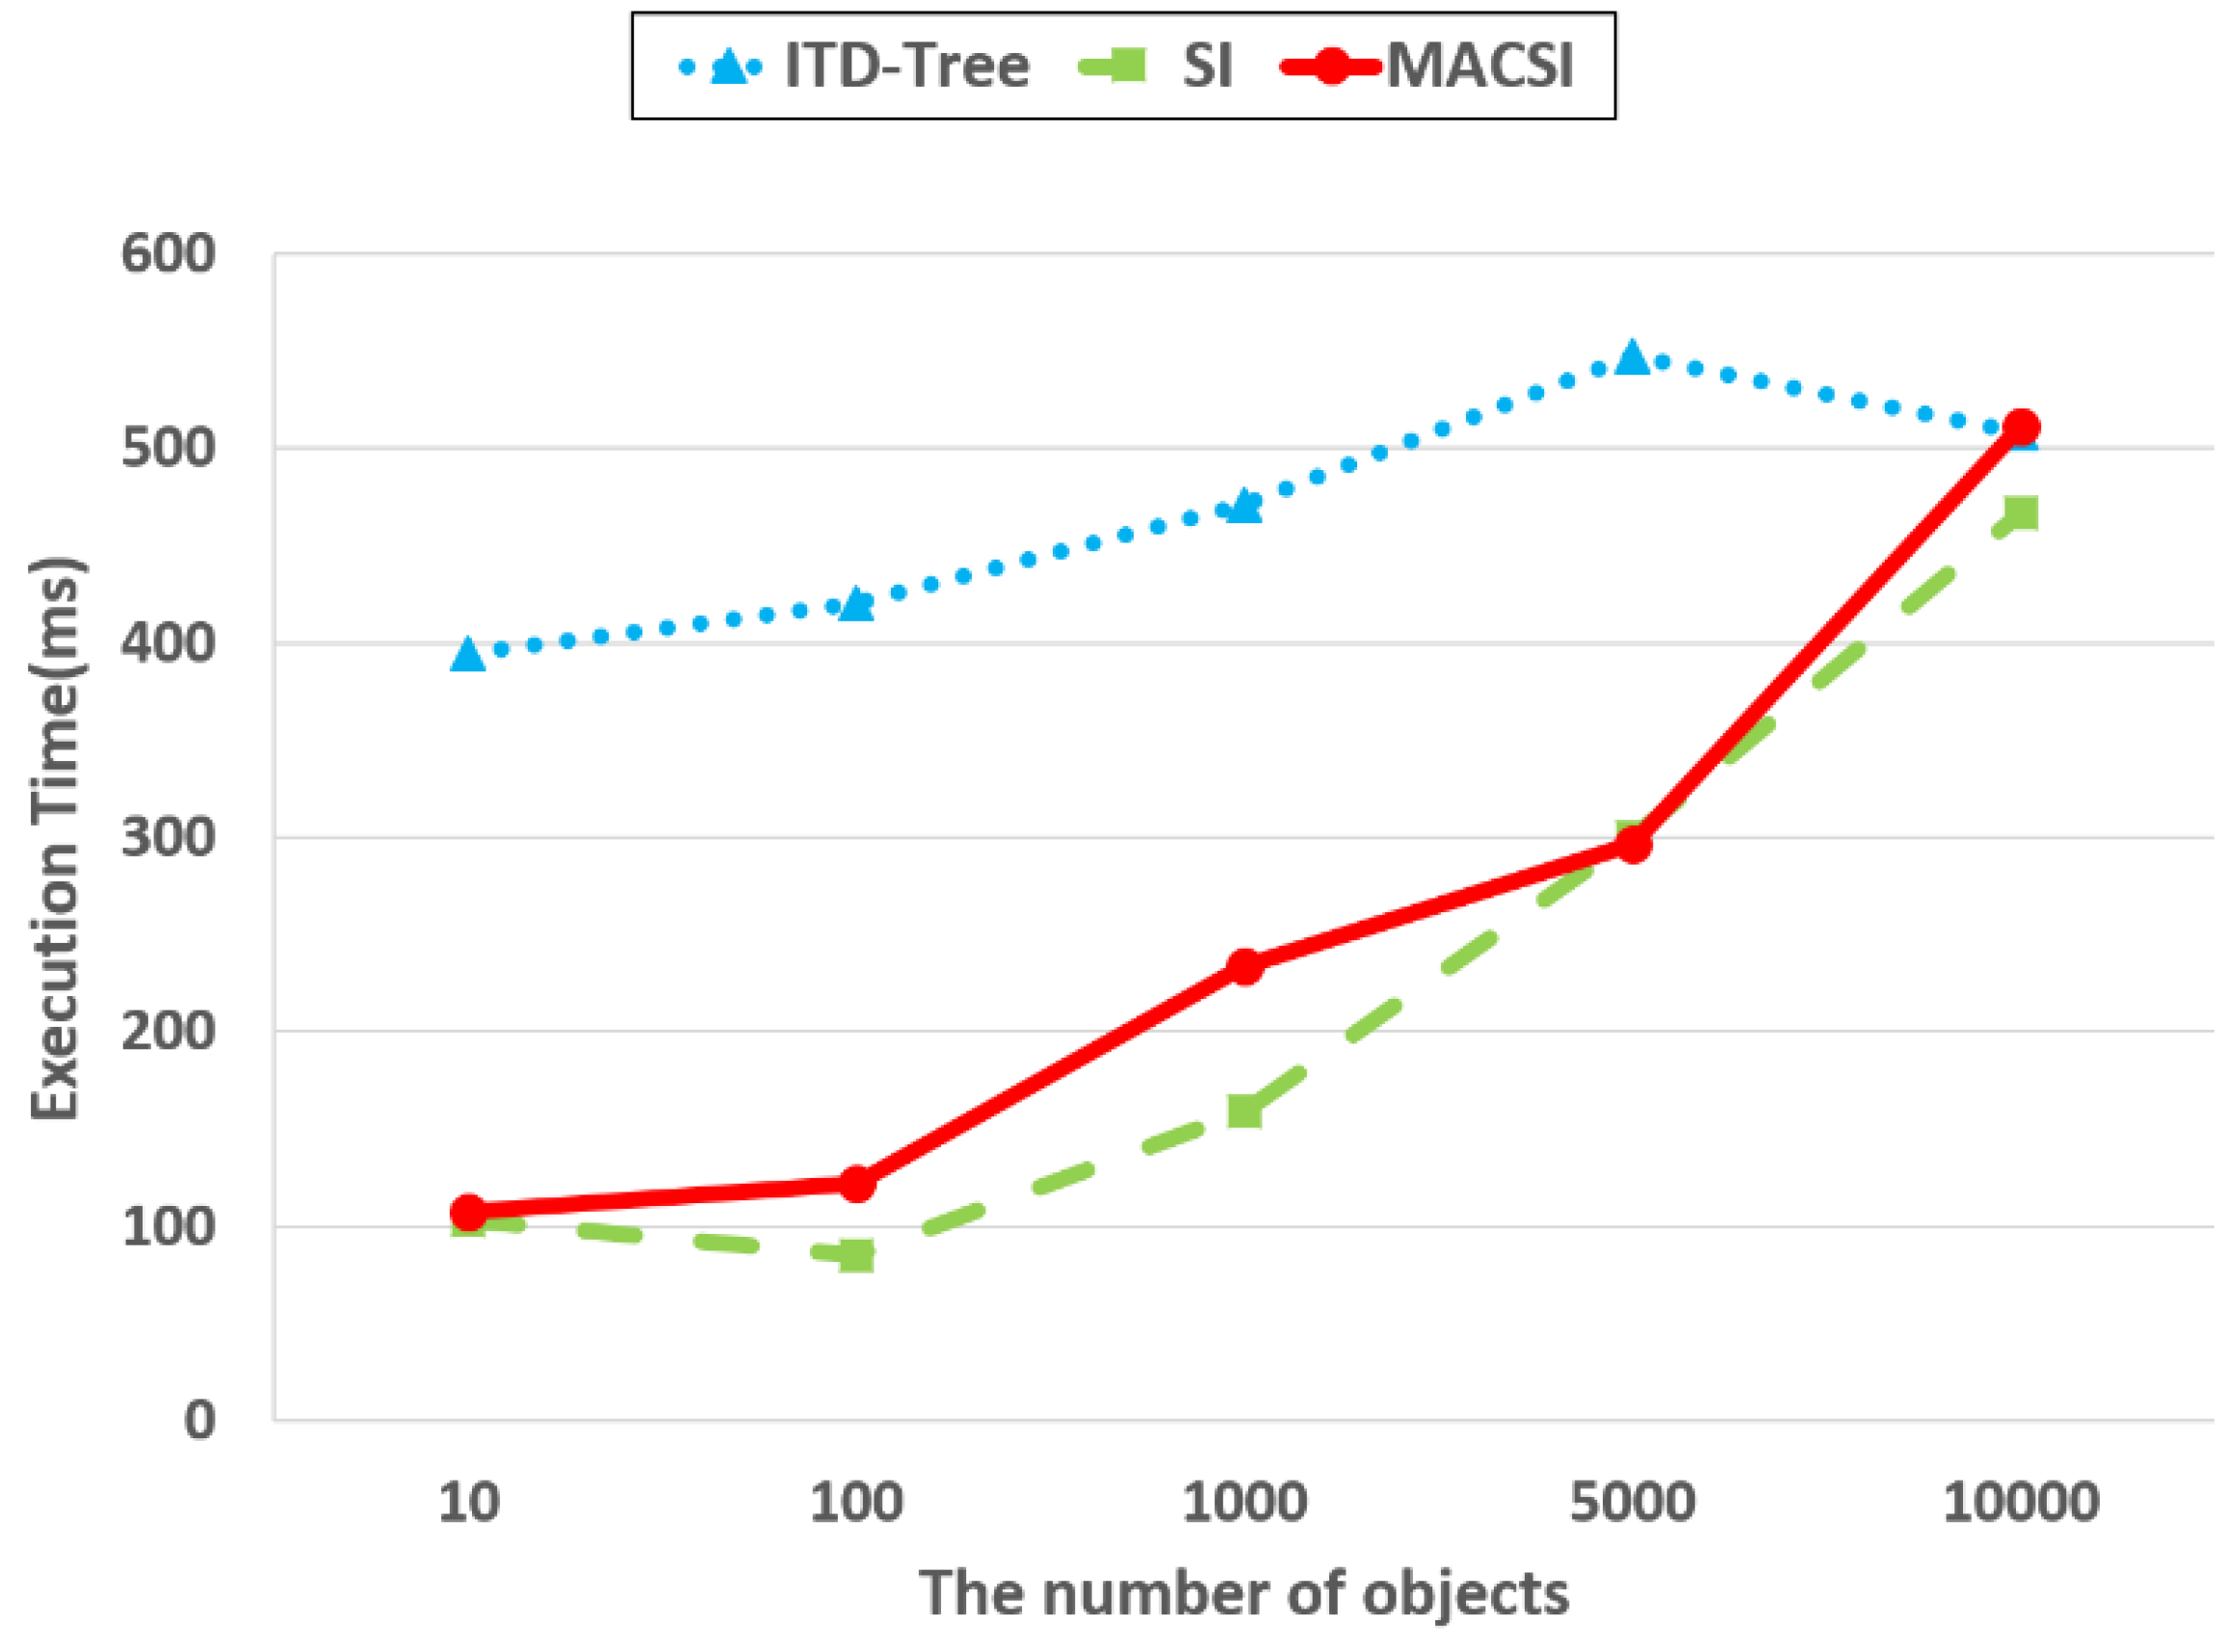
Ijgi 05 00176 g020
Figure 21. The effect of object number on the coarse-grained semantic cell query performance.
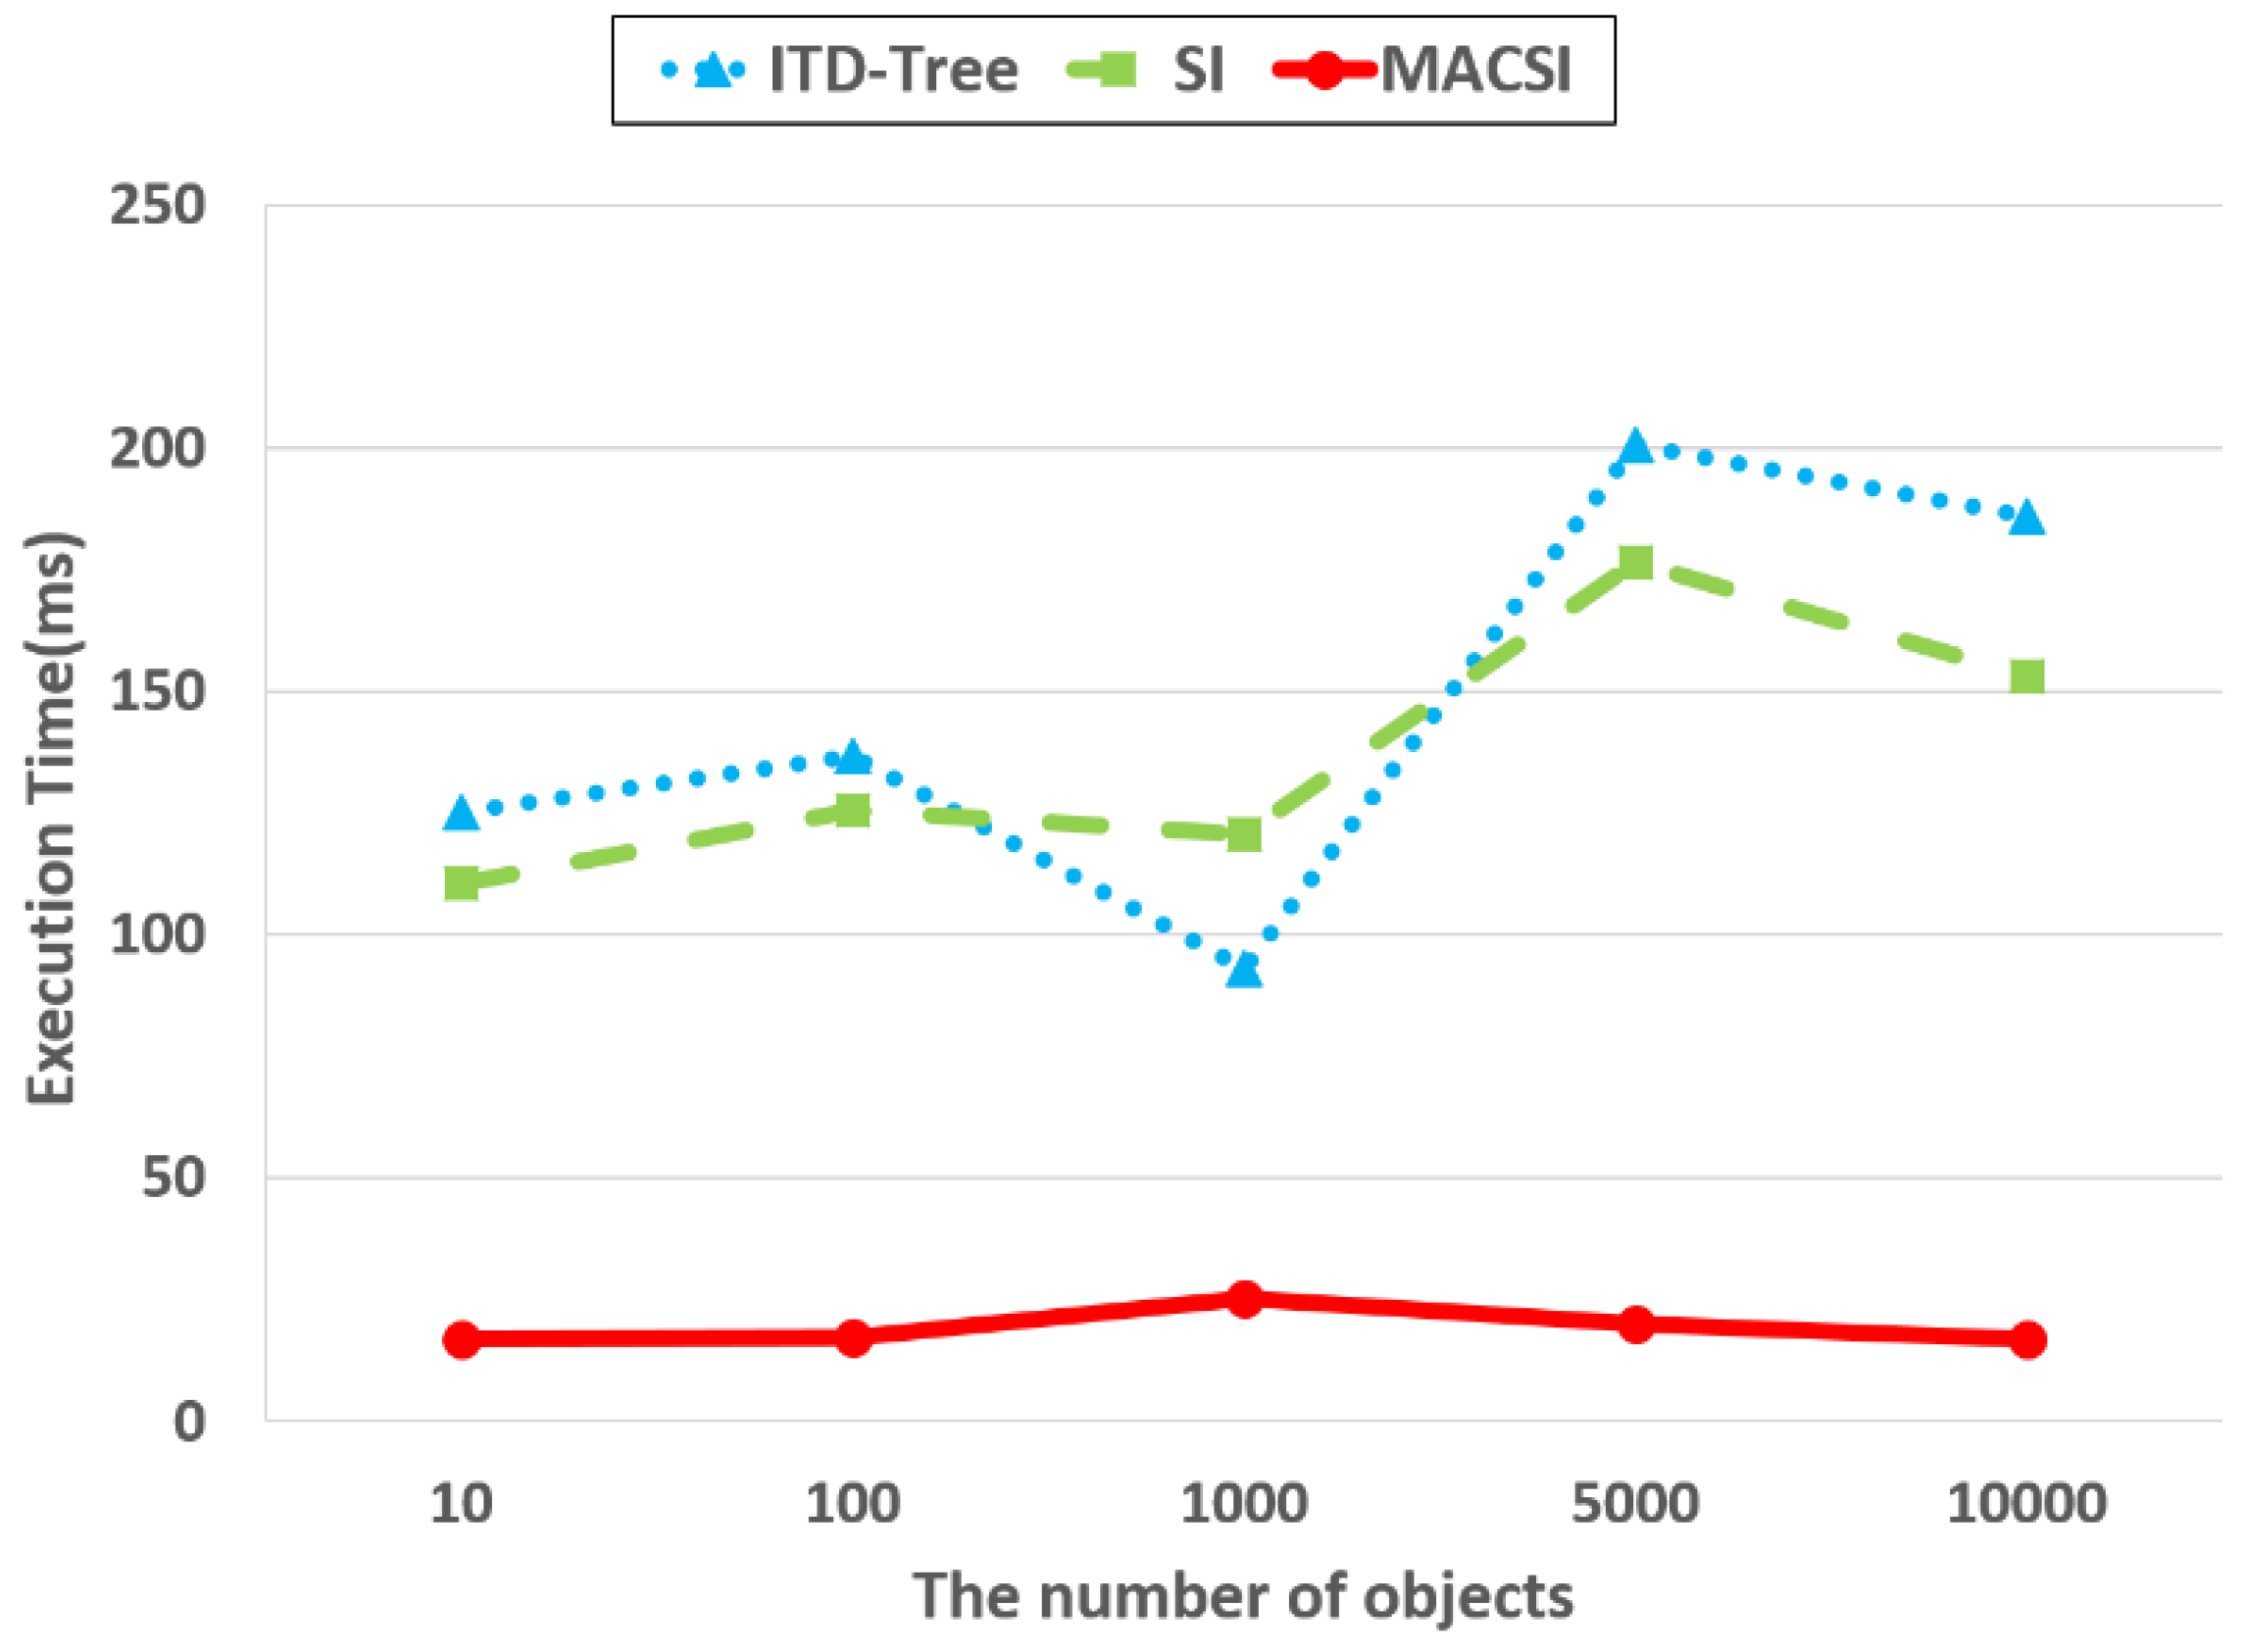
Ijgi 05 00176 g021
Figure 22. The effect of cell number on the fine-grained semantic object query performance.
Ijgi 05 00176 g022
Figure 23. The effect of object number on the fine-grained semantic object query performance.
Ijgi 05 00176 g023
Figure 24. The effect of cell number on the coarse-grained semantic object query performance.
Ijgi 05 00176 g024
Figure 25. The effect of object number on the coarse-grained semantic object query performance.
Ijgi 05 00176 g025
Figure 26. The effect of cell number on the semantic trajectory query performance.
Ijgi 05 00176 g026
Figure 27. The effect of object number on the semantic trajectory query performance.
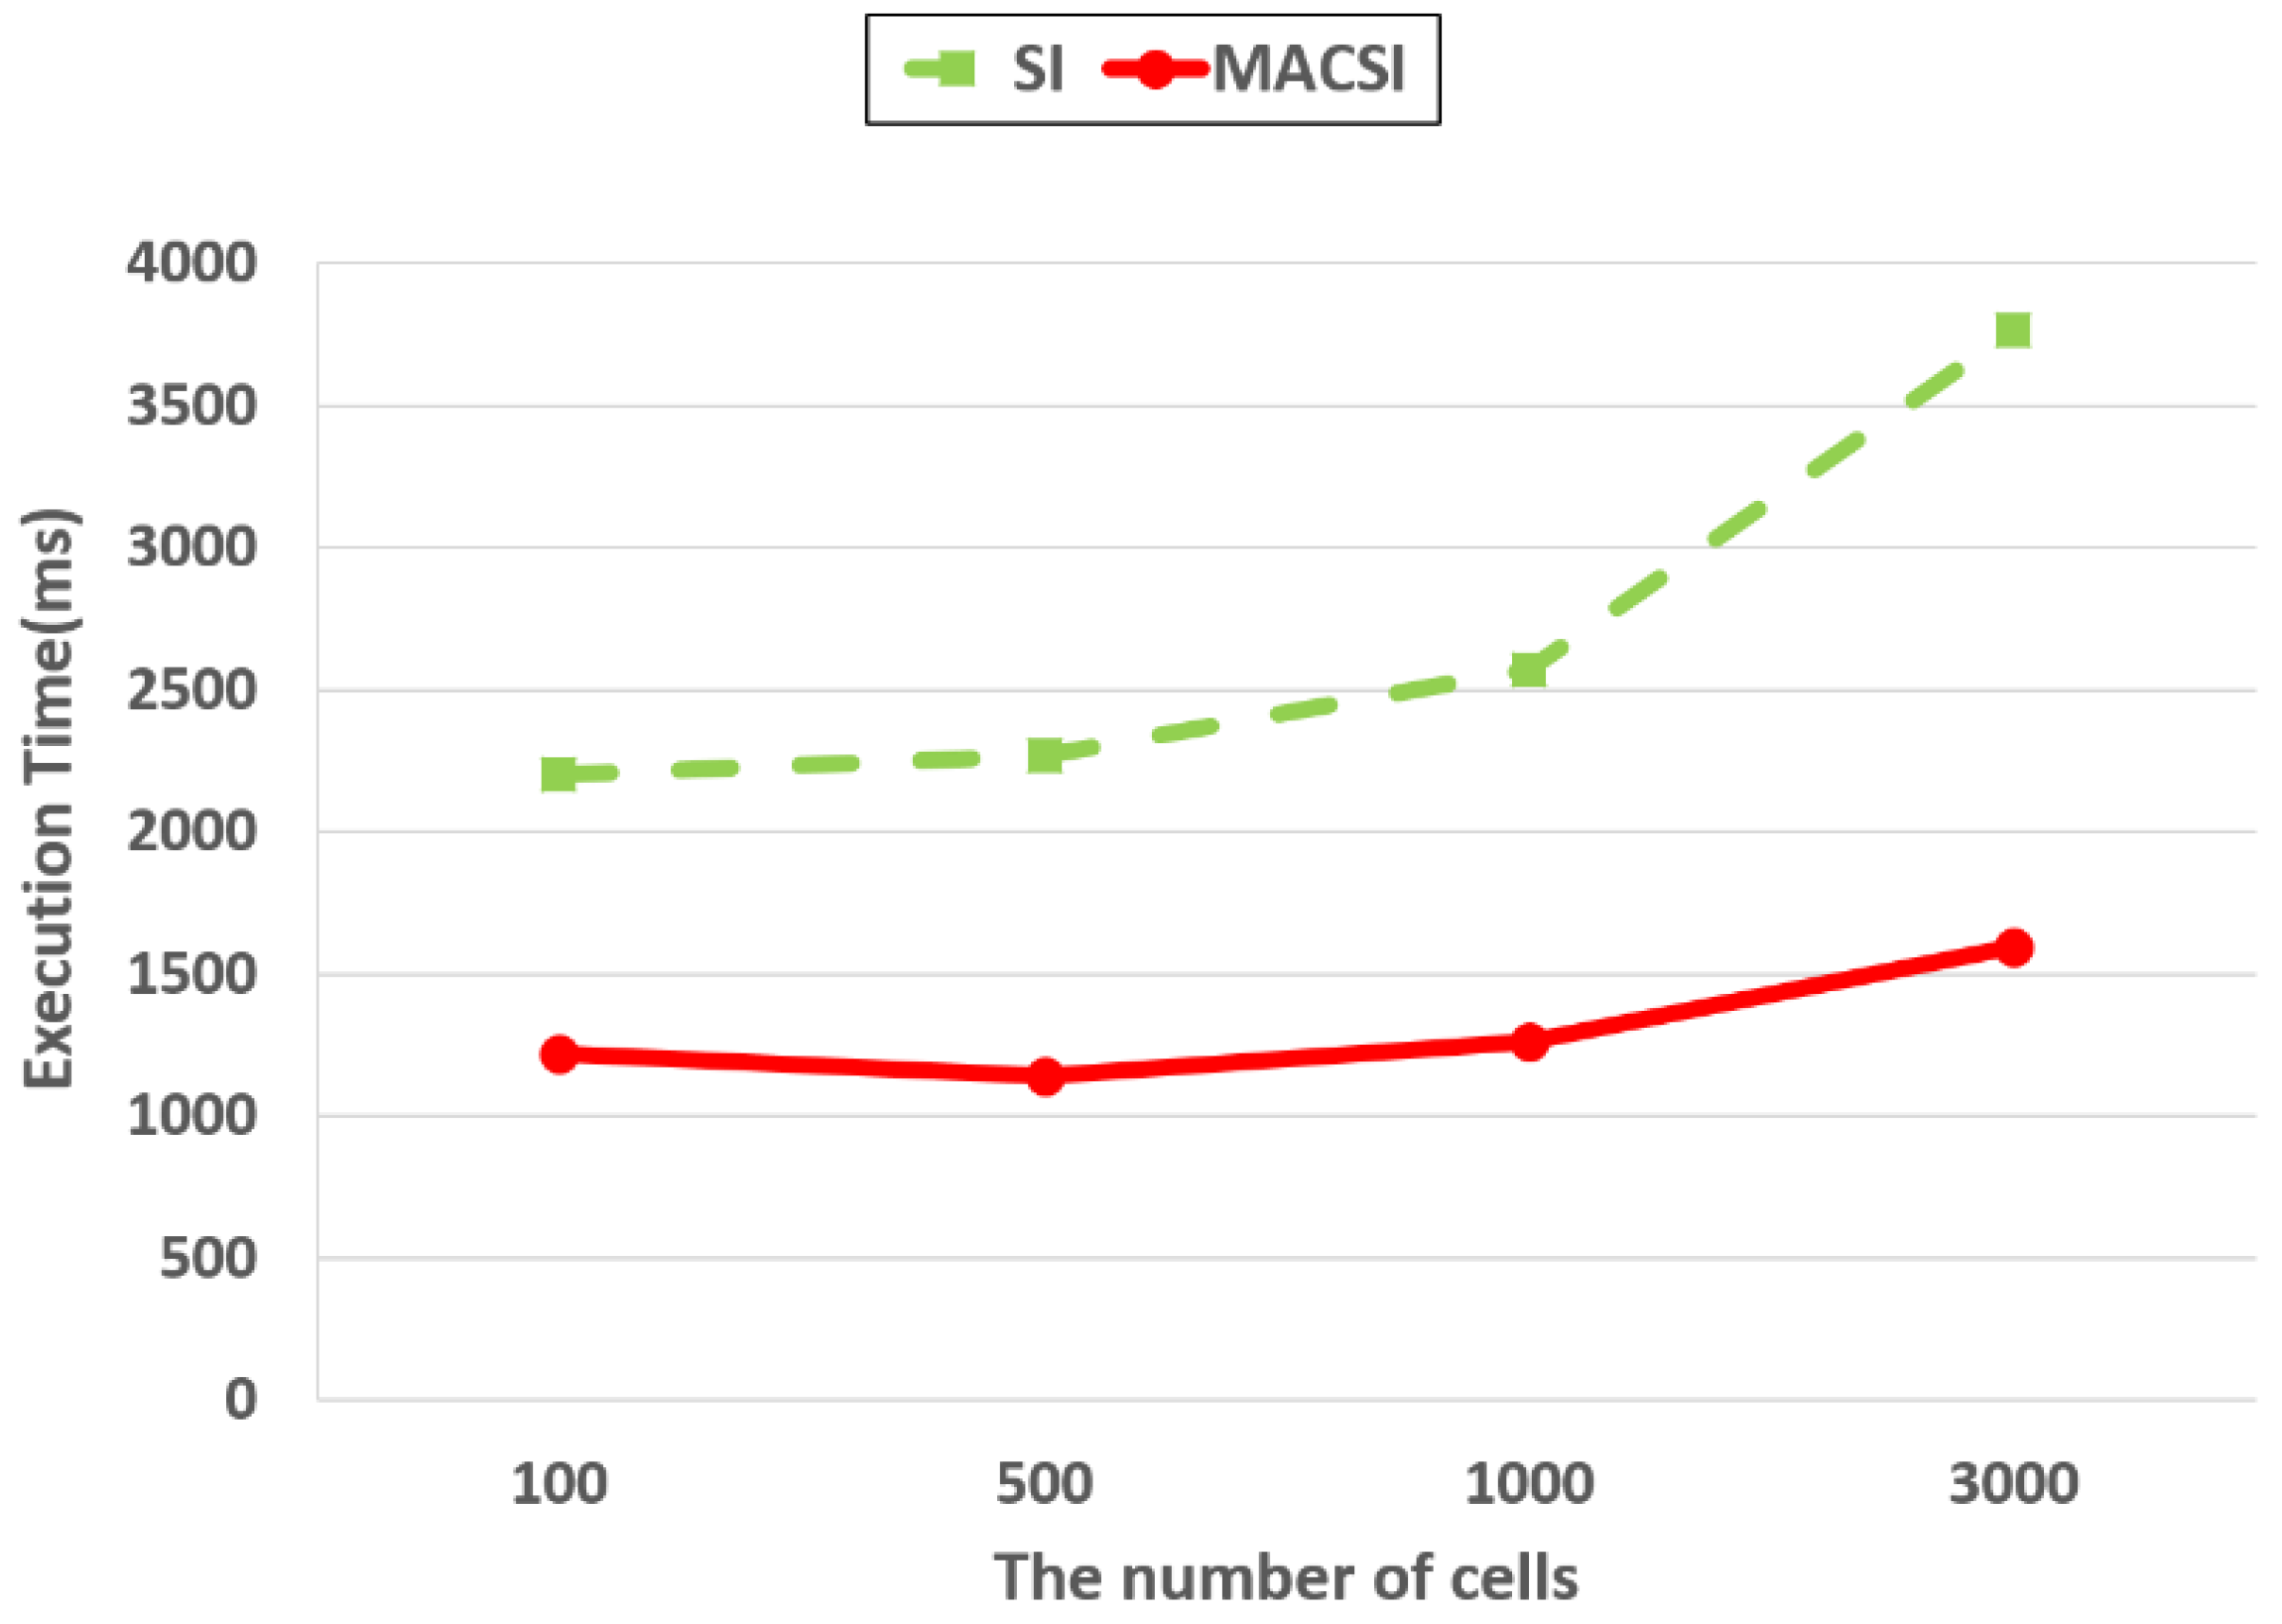
Ijgi 05 00176 g027
Figure 28. The effect of cell number on the update performance.
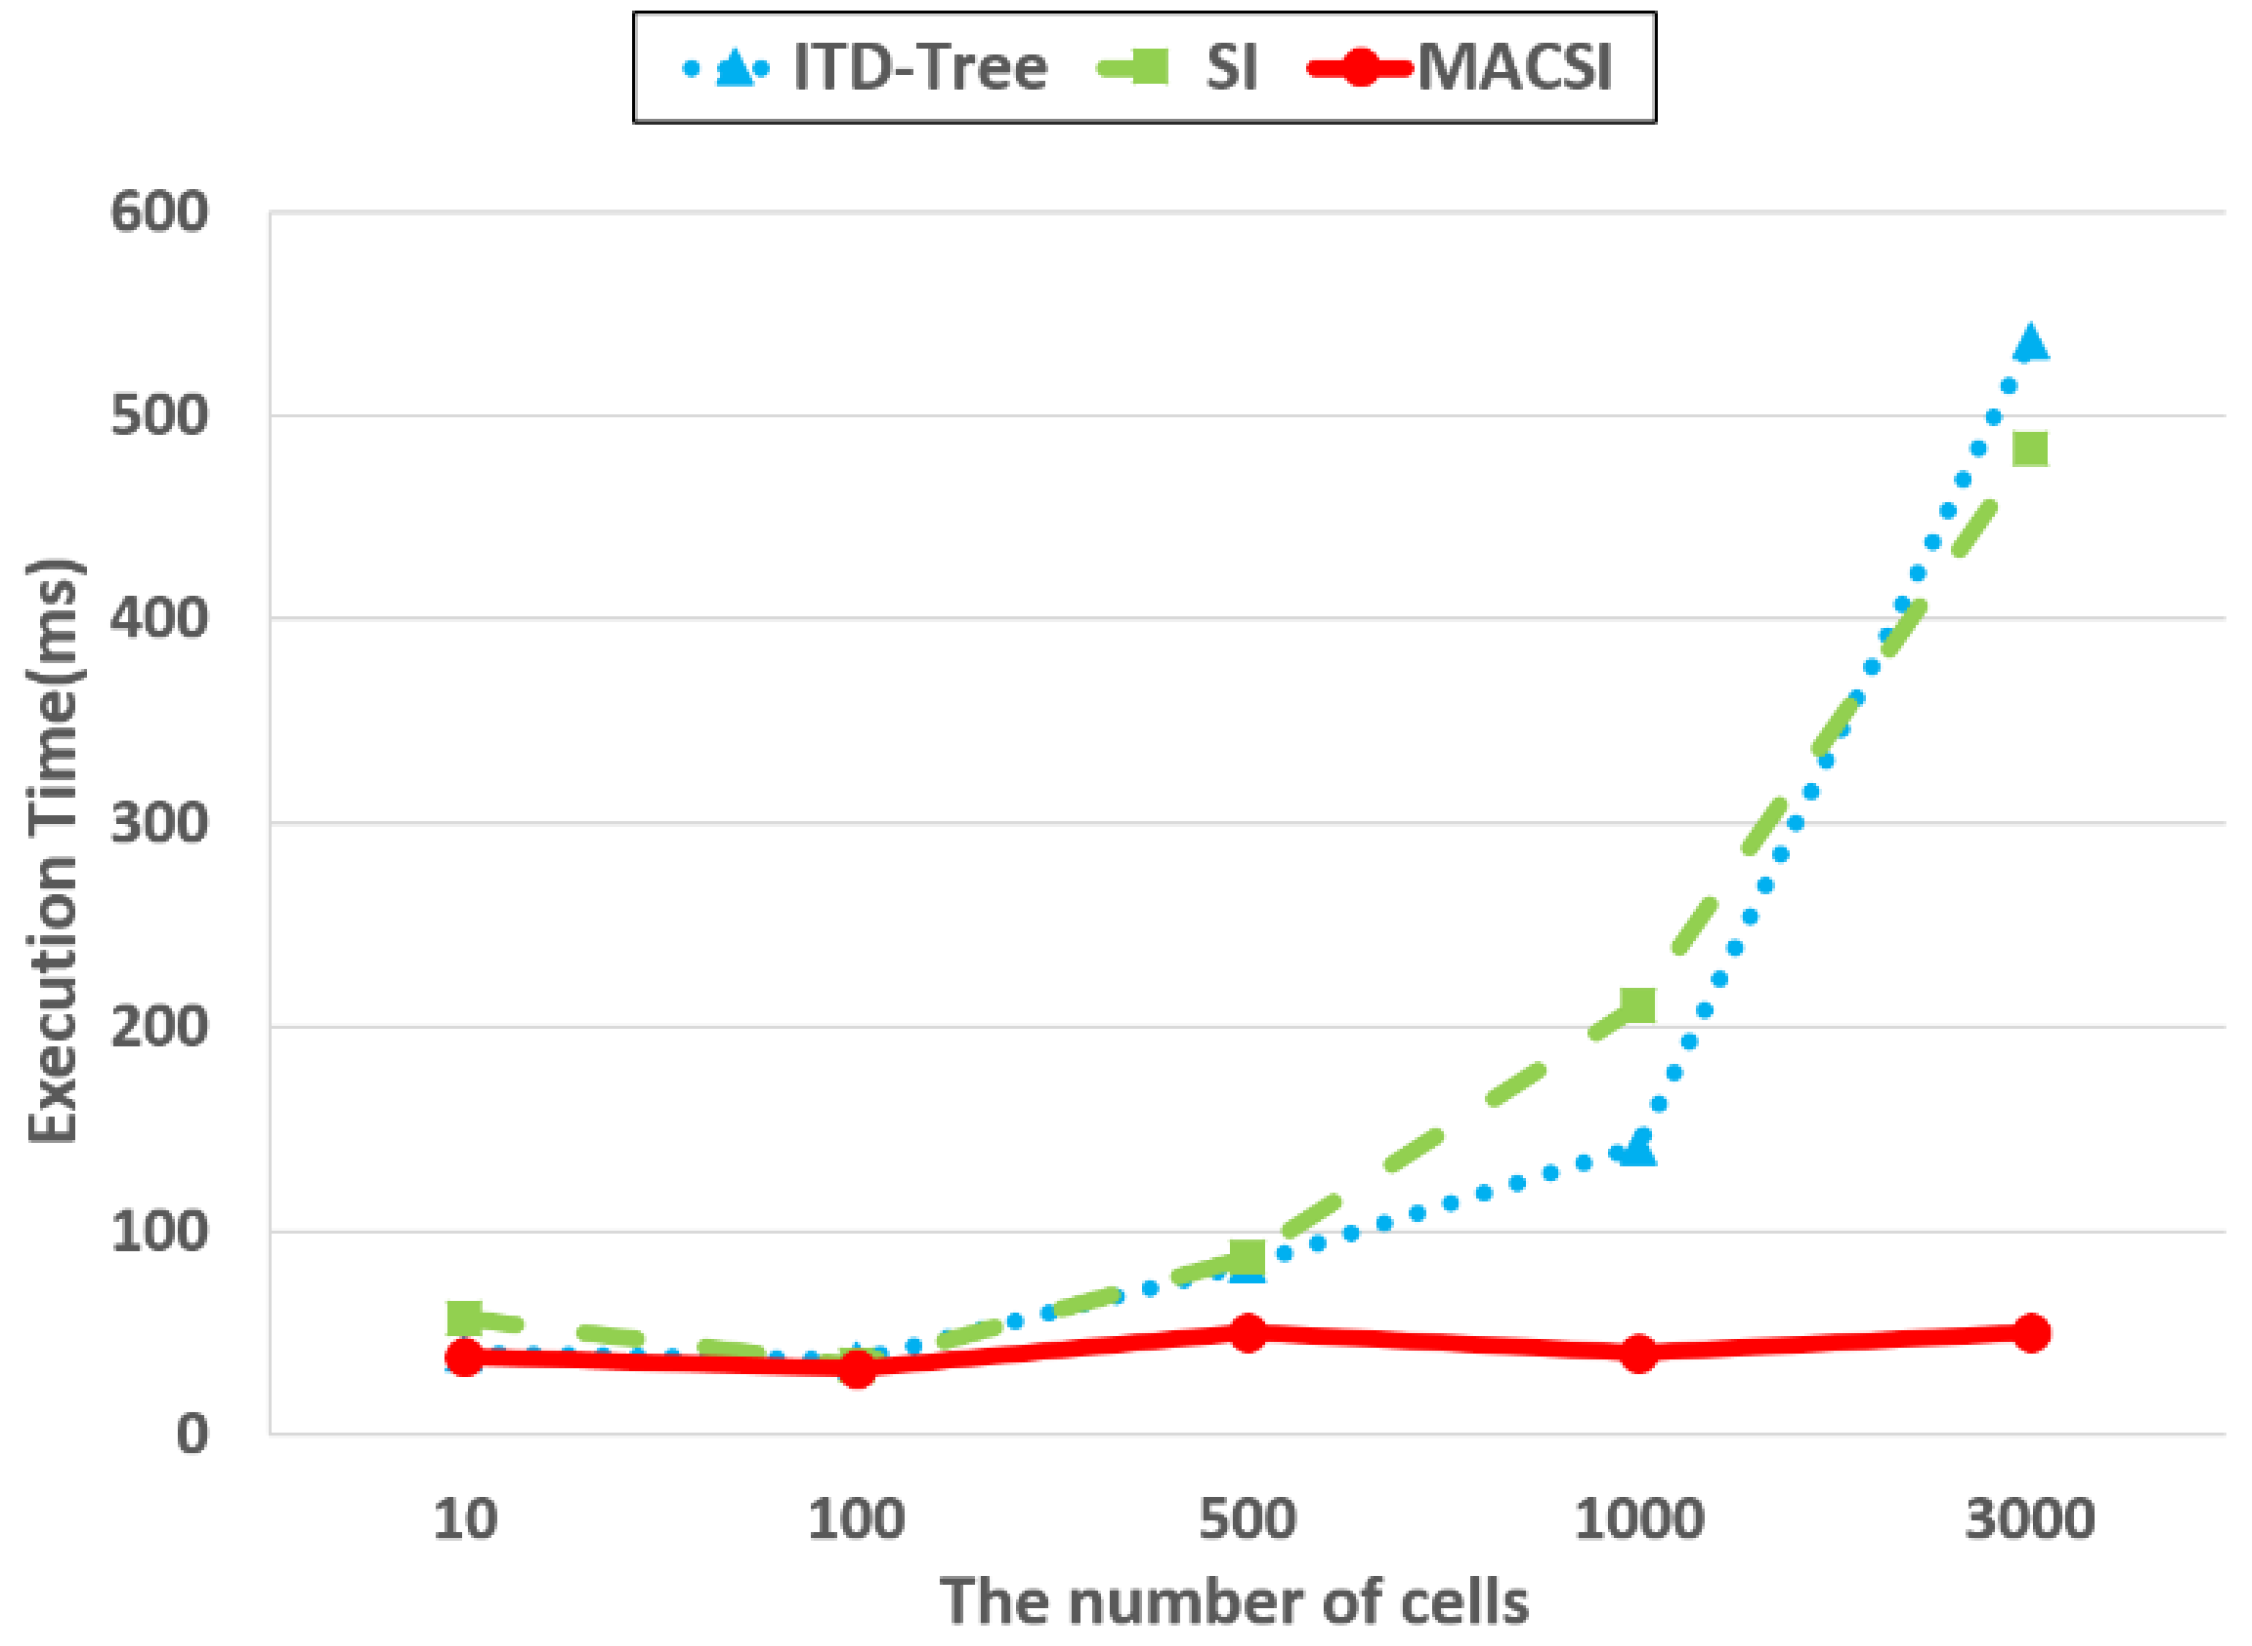
Ijgi 05 00176 g028
Figure 29. The effect of object number on the update performance.
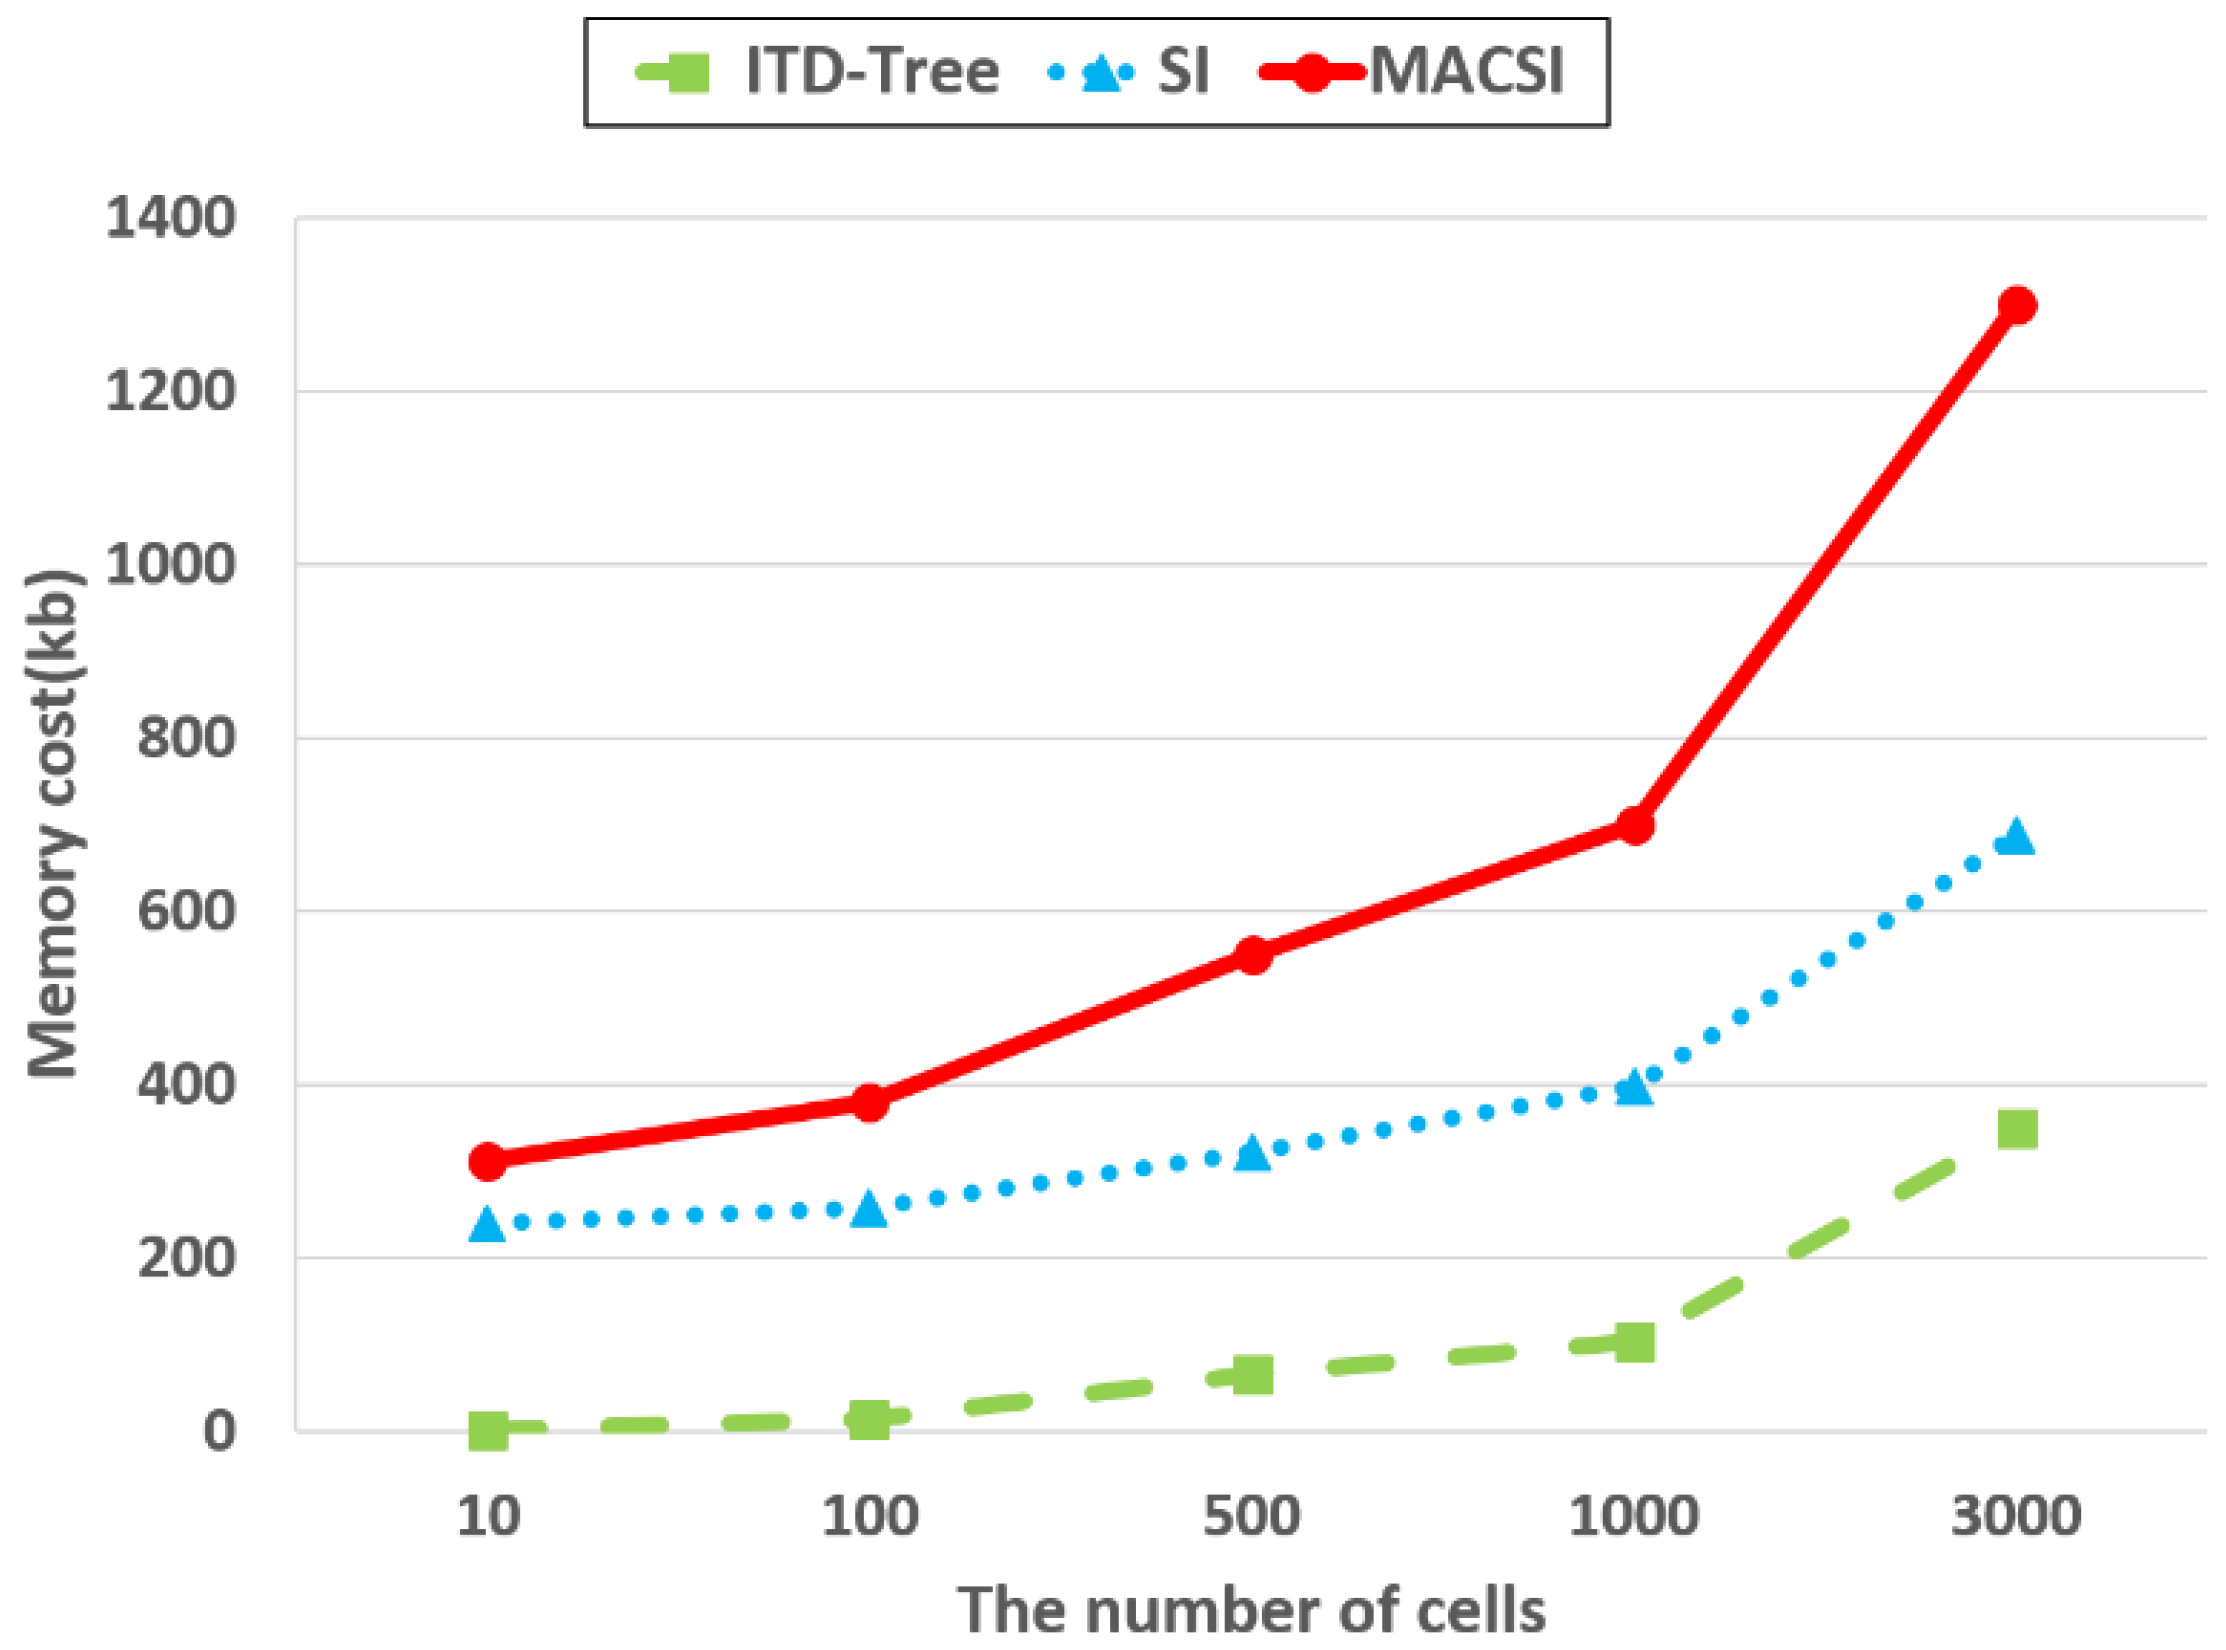
Ijgi 05 00176 g029
Figure 30. The effect of cell number on memory costs.
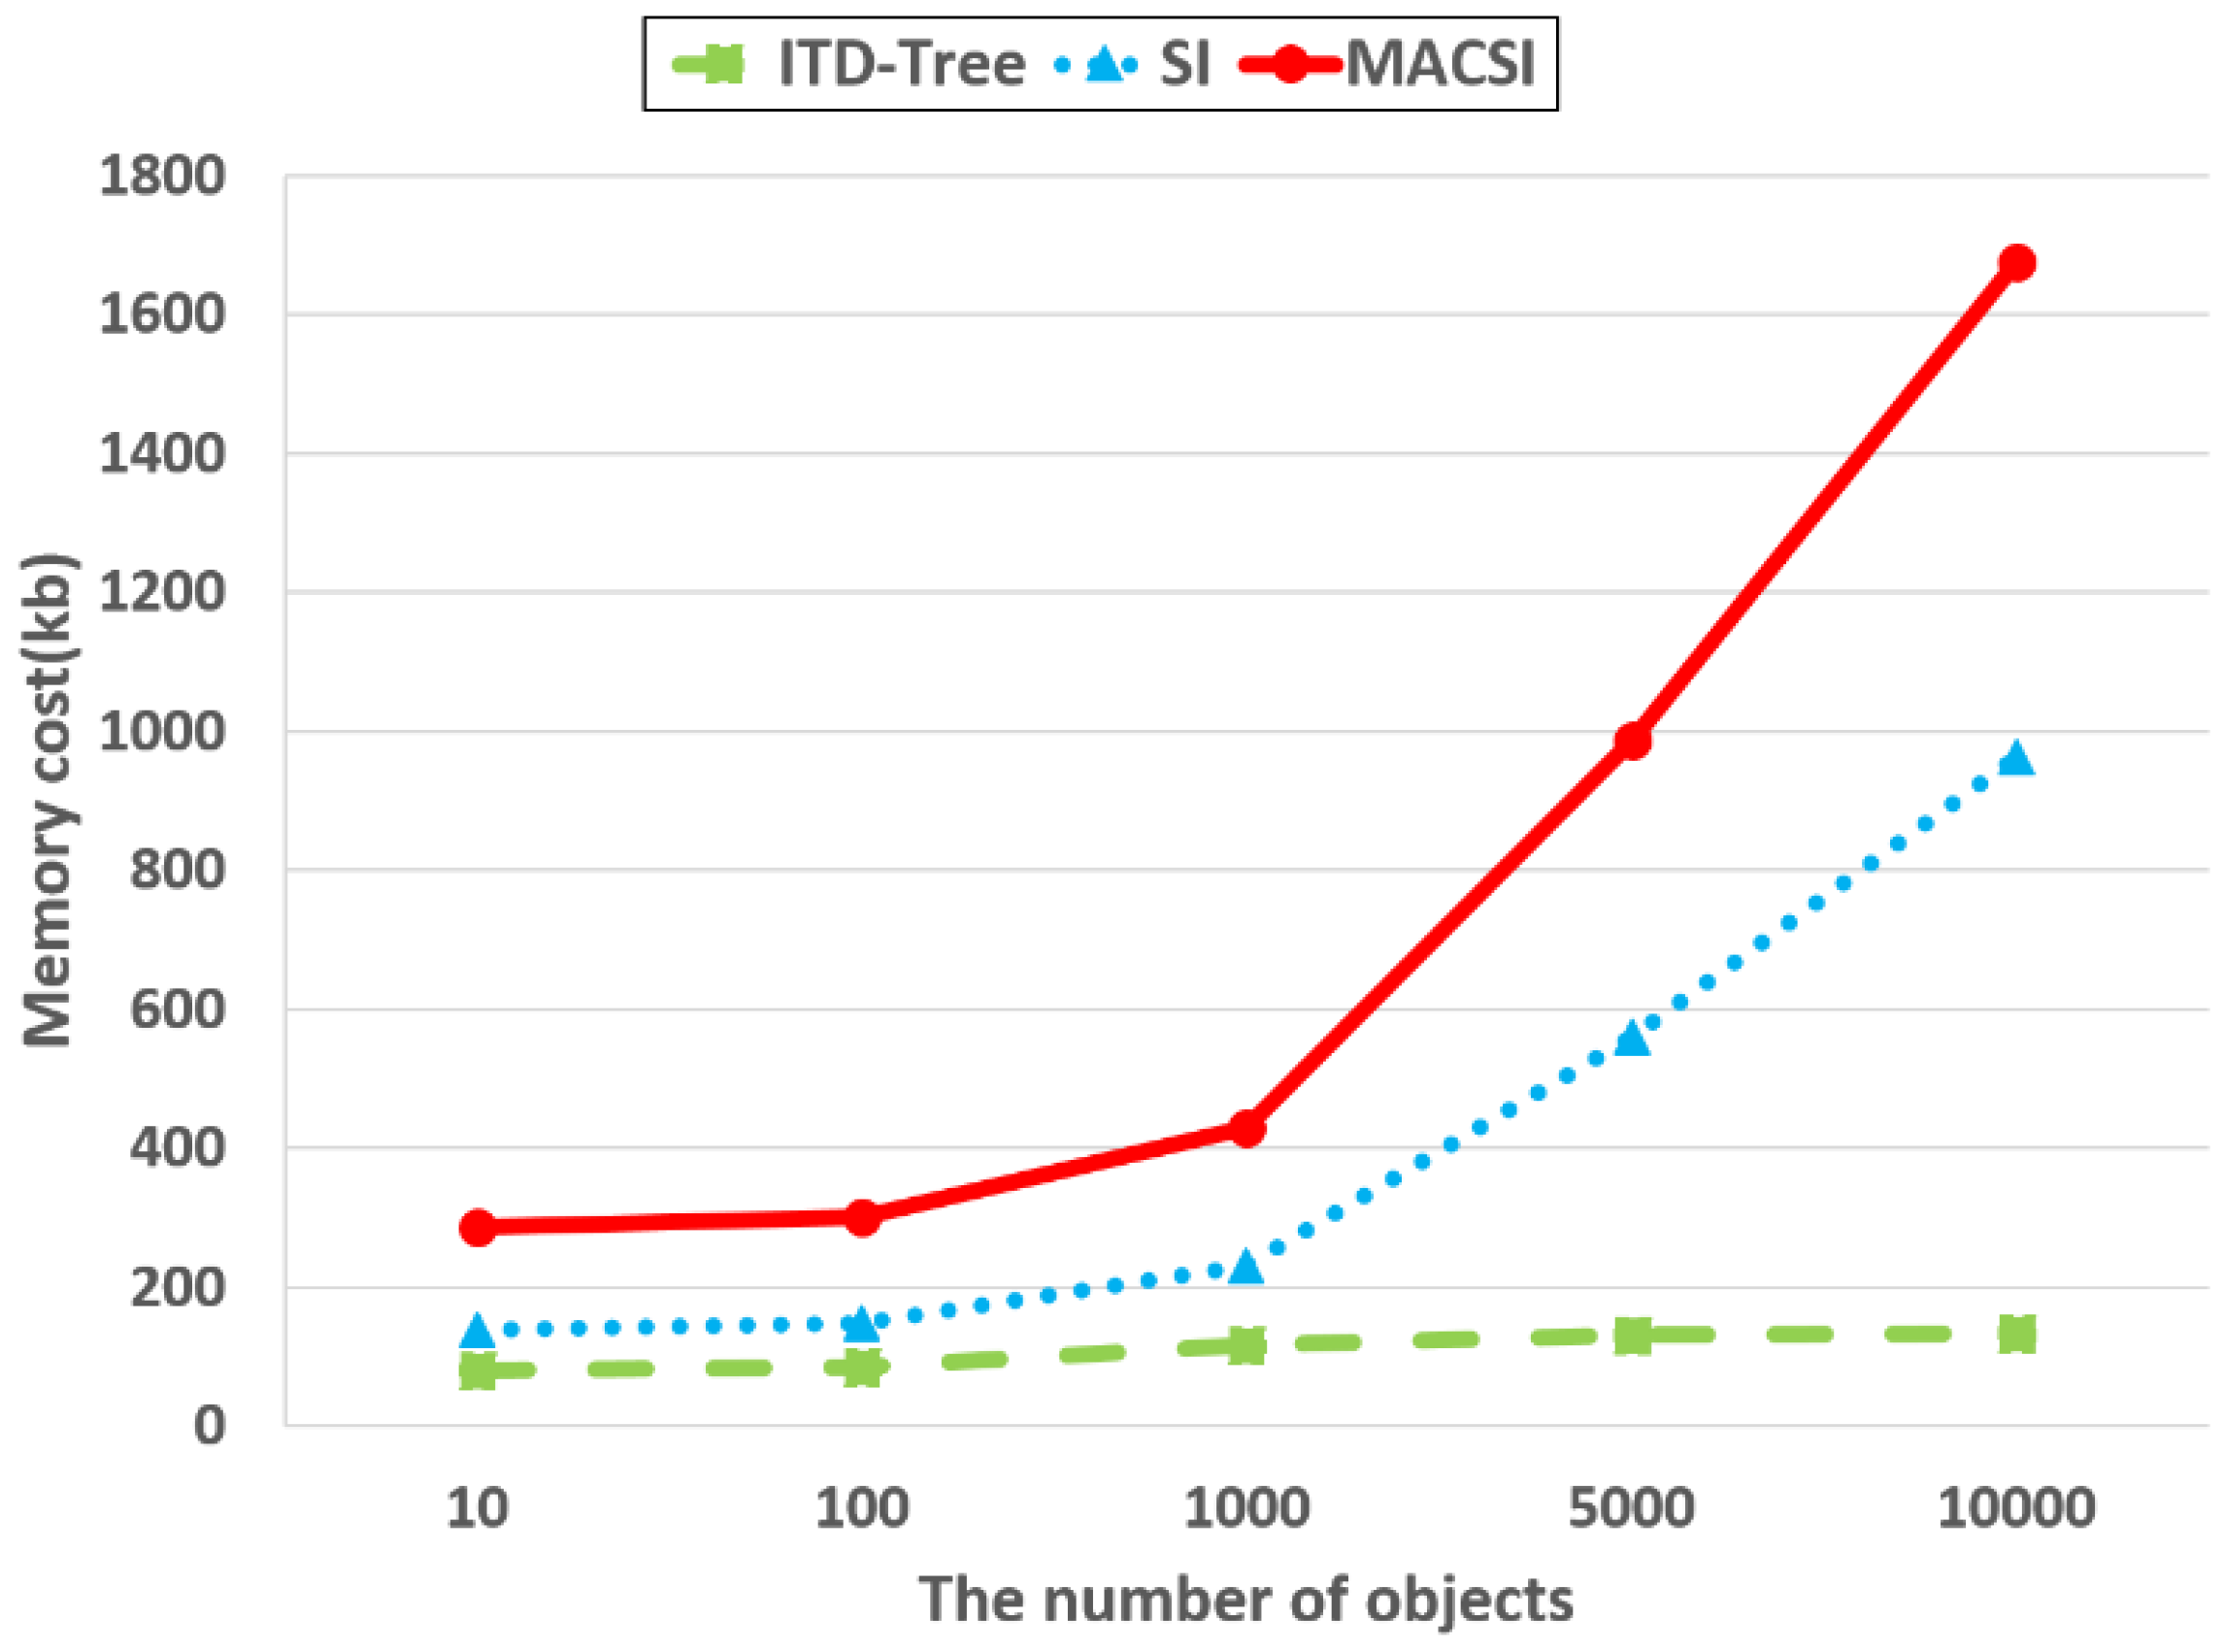
Ijgi 05 00176 g030
Figure 31. The effect of object number on memory costs.
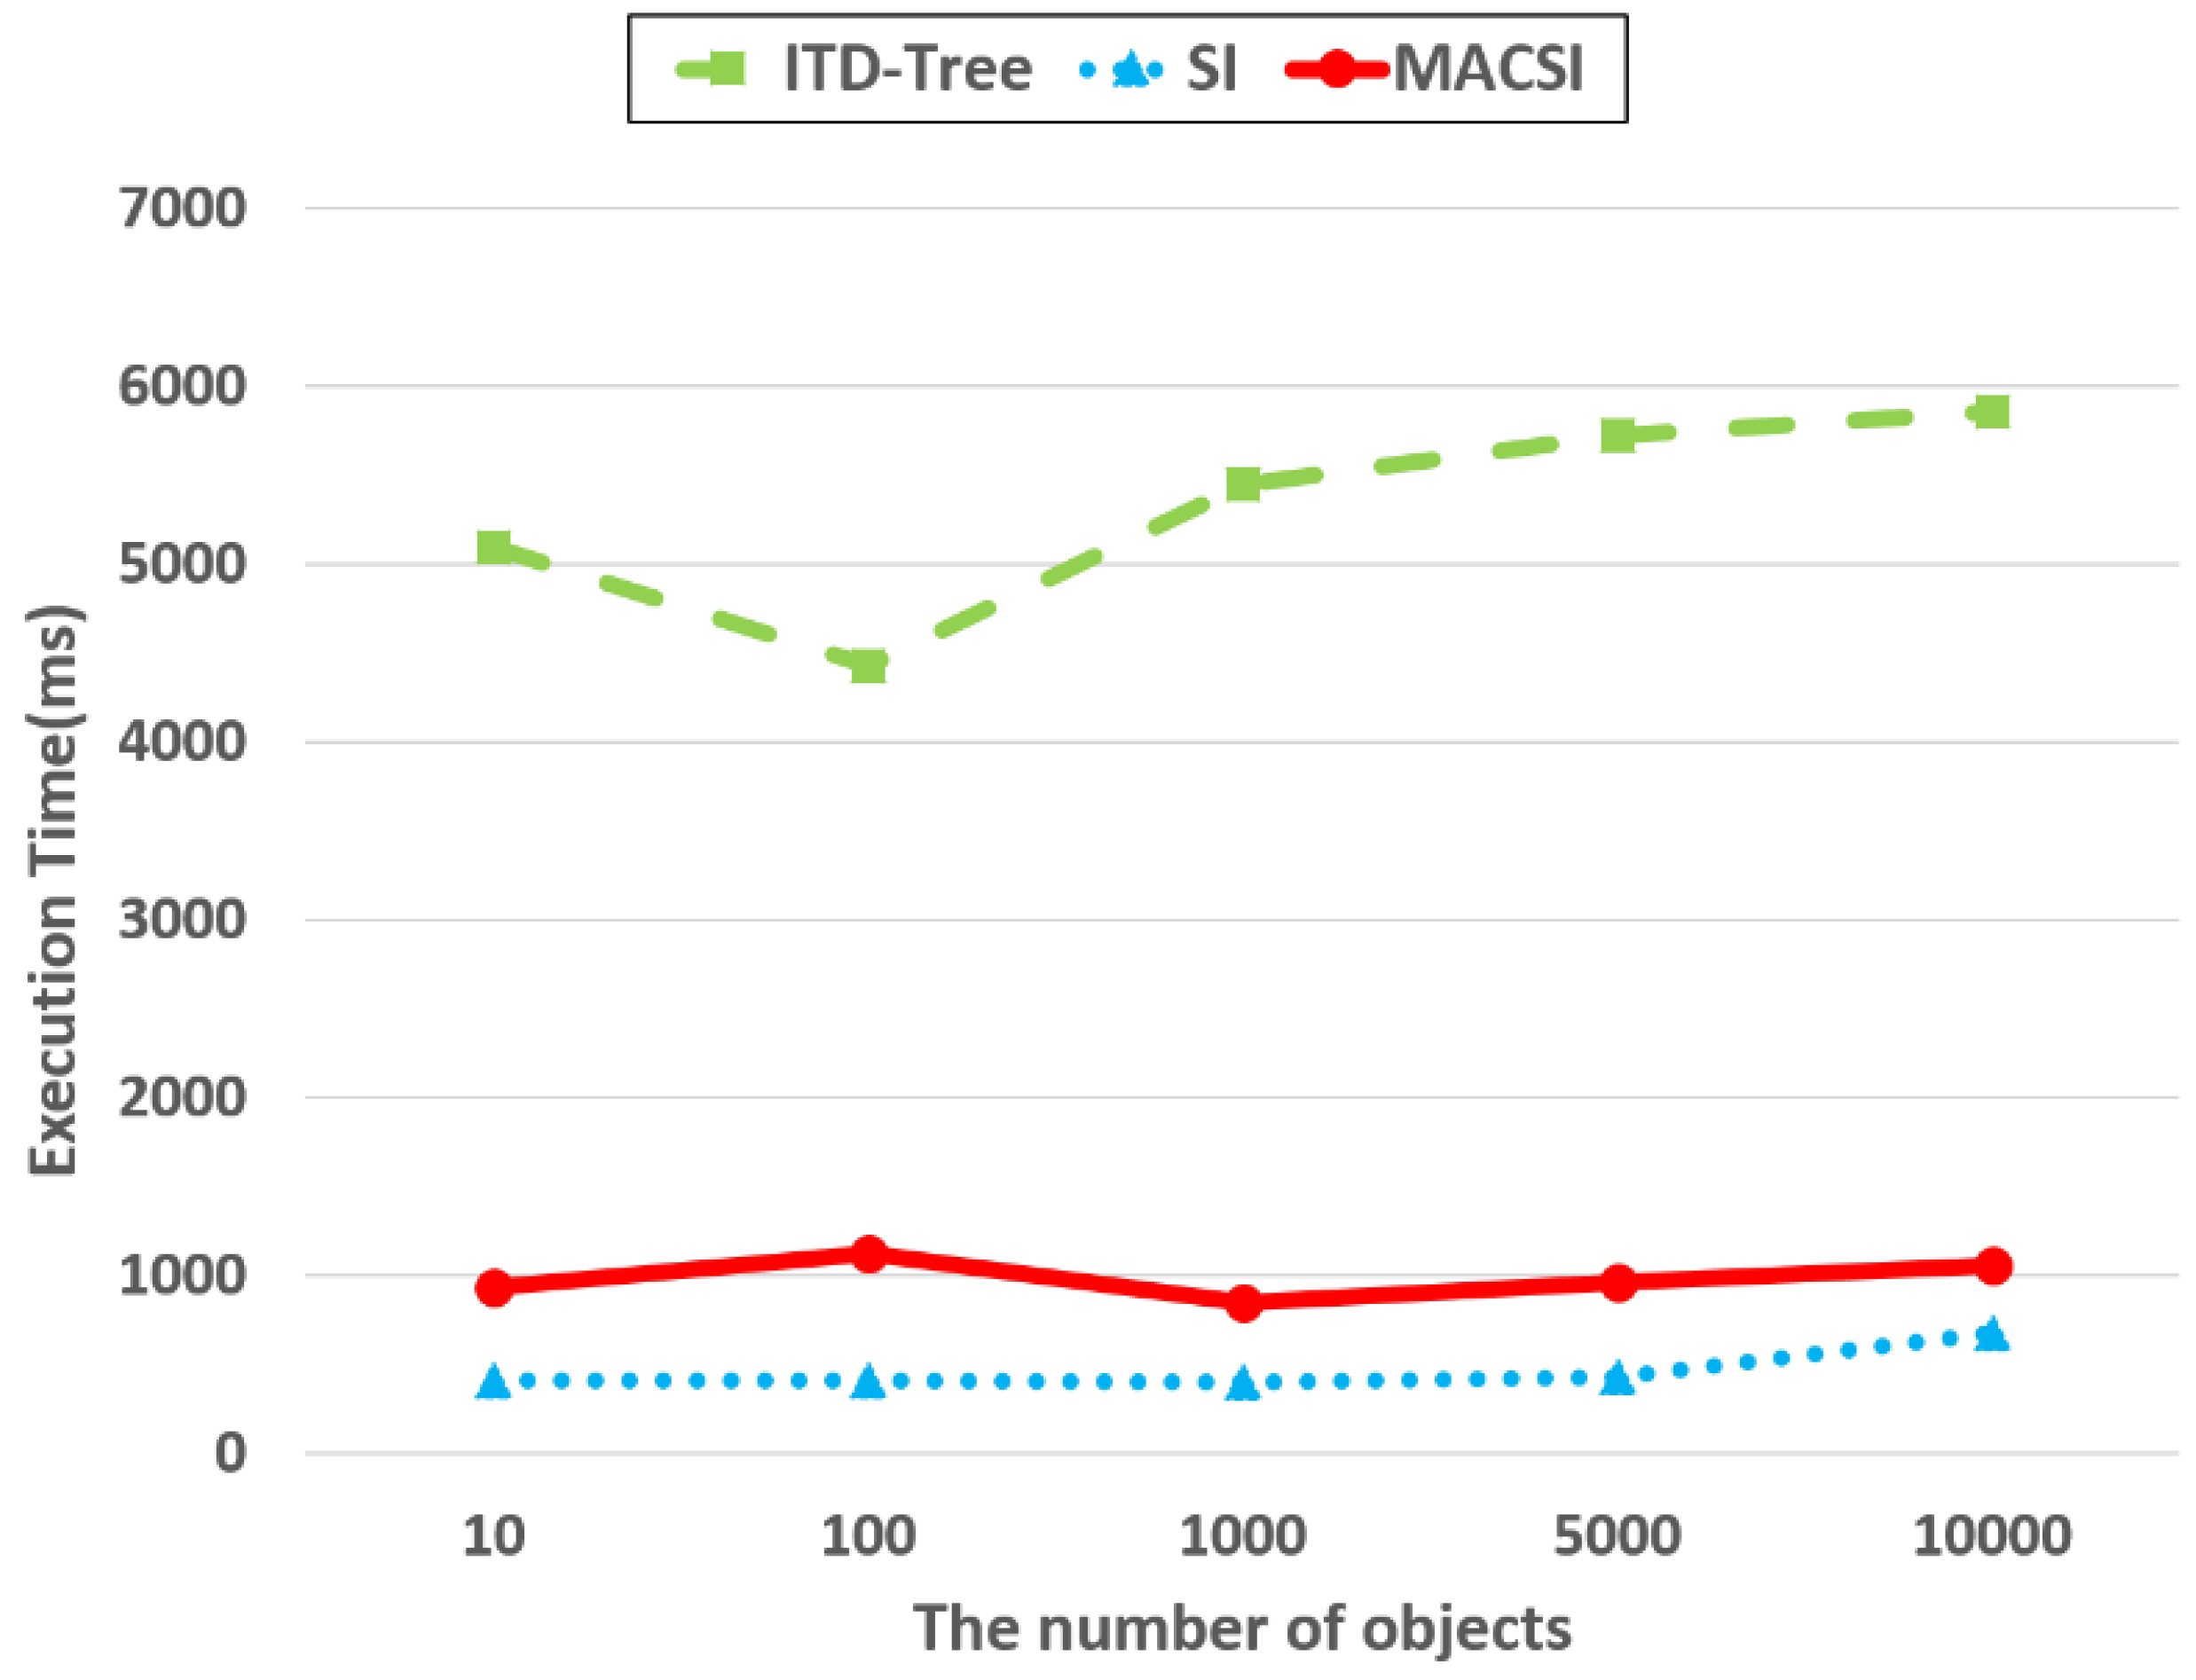
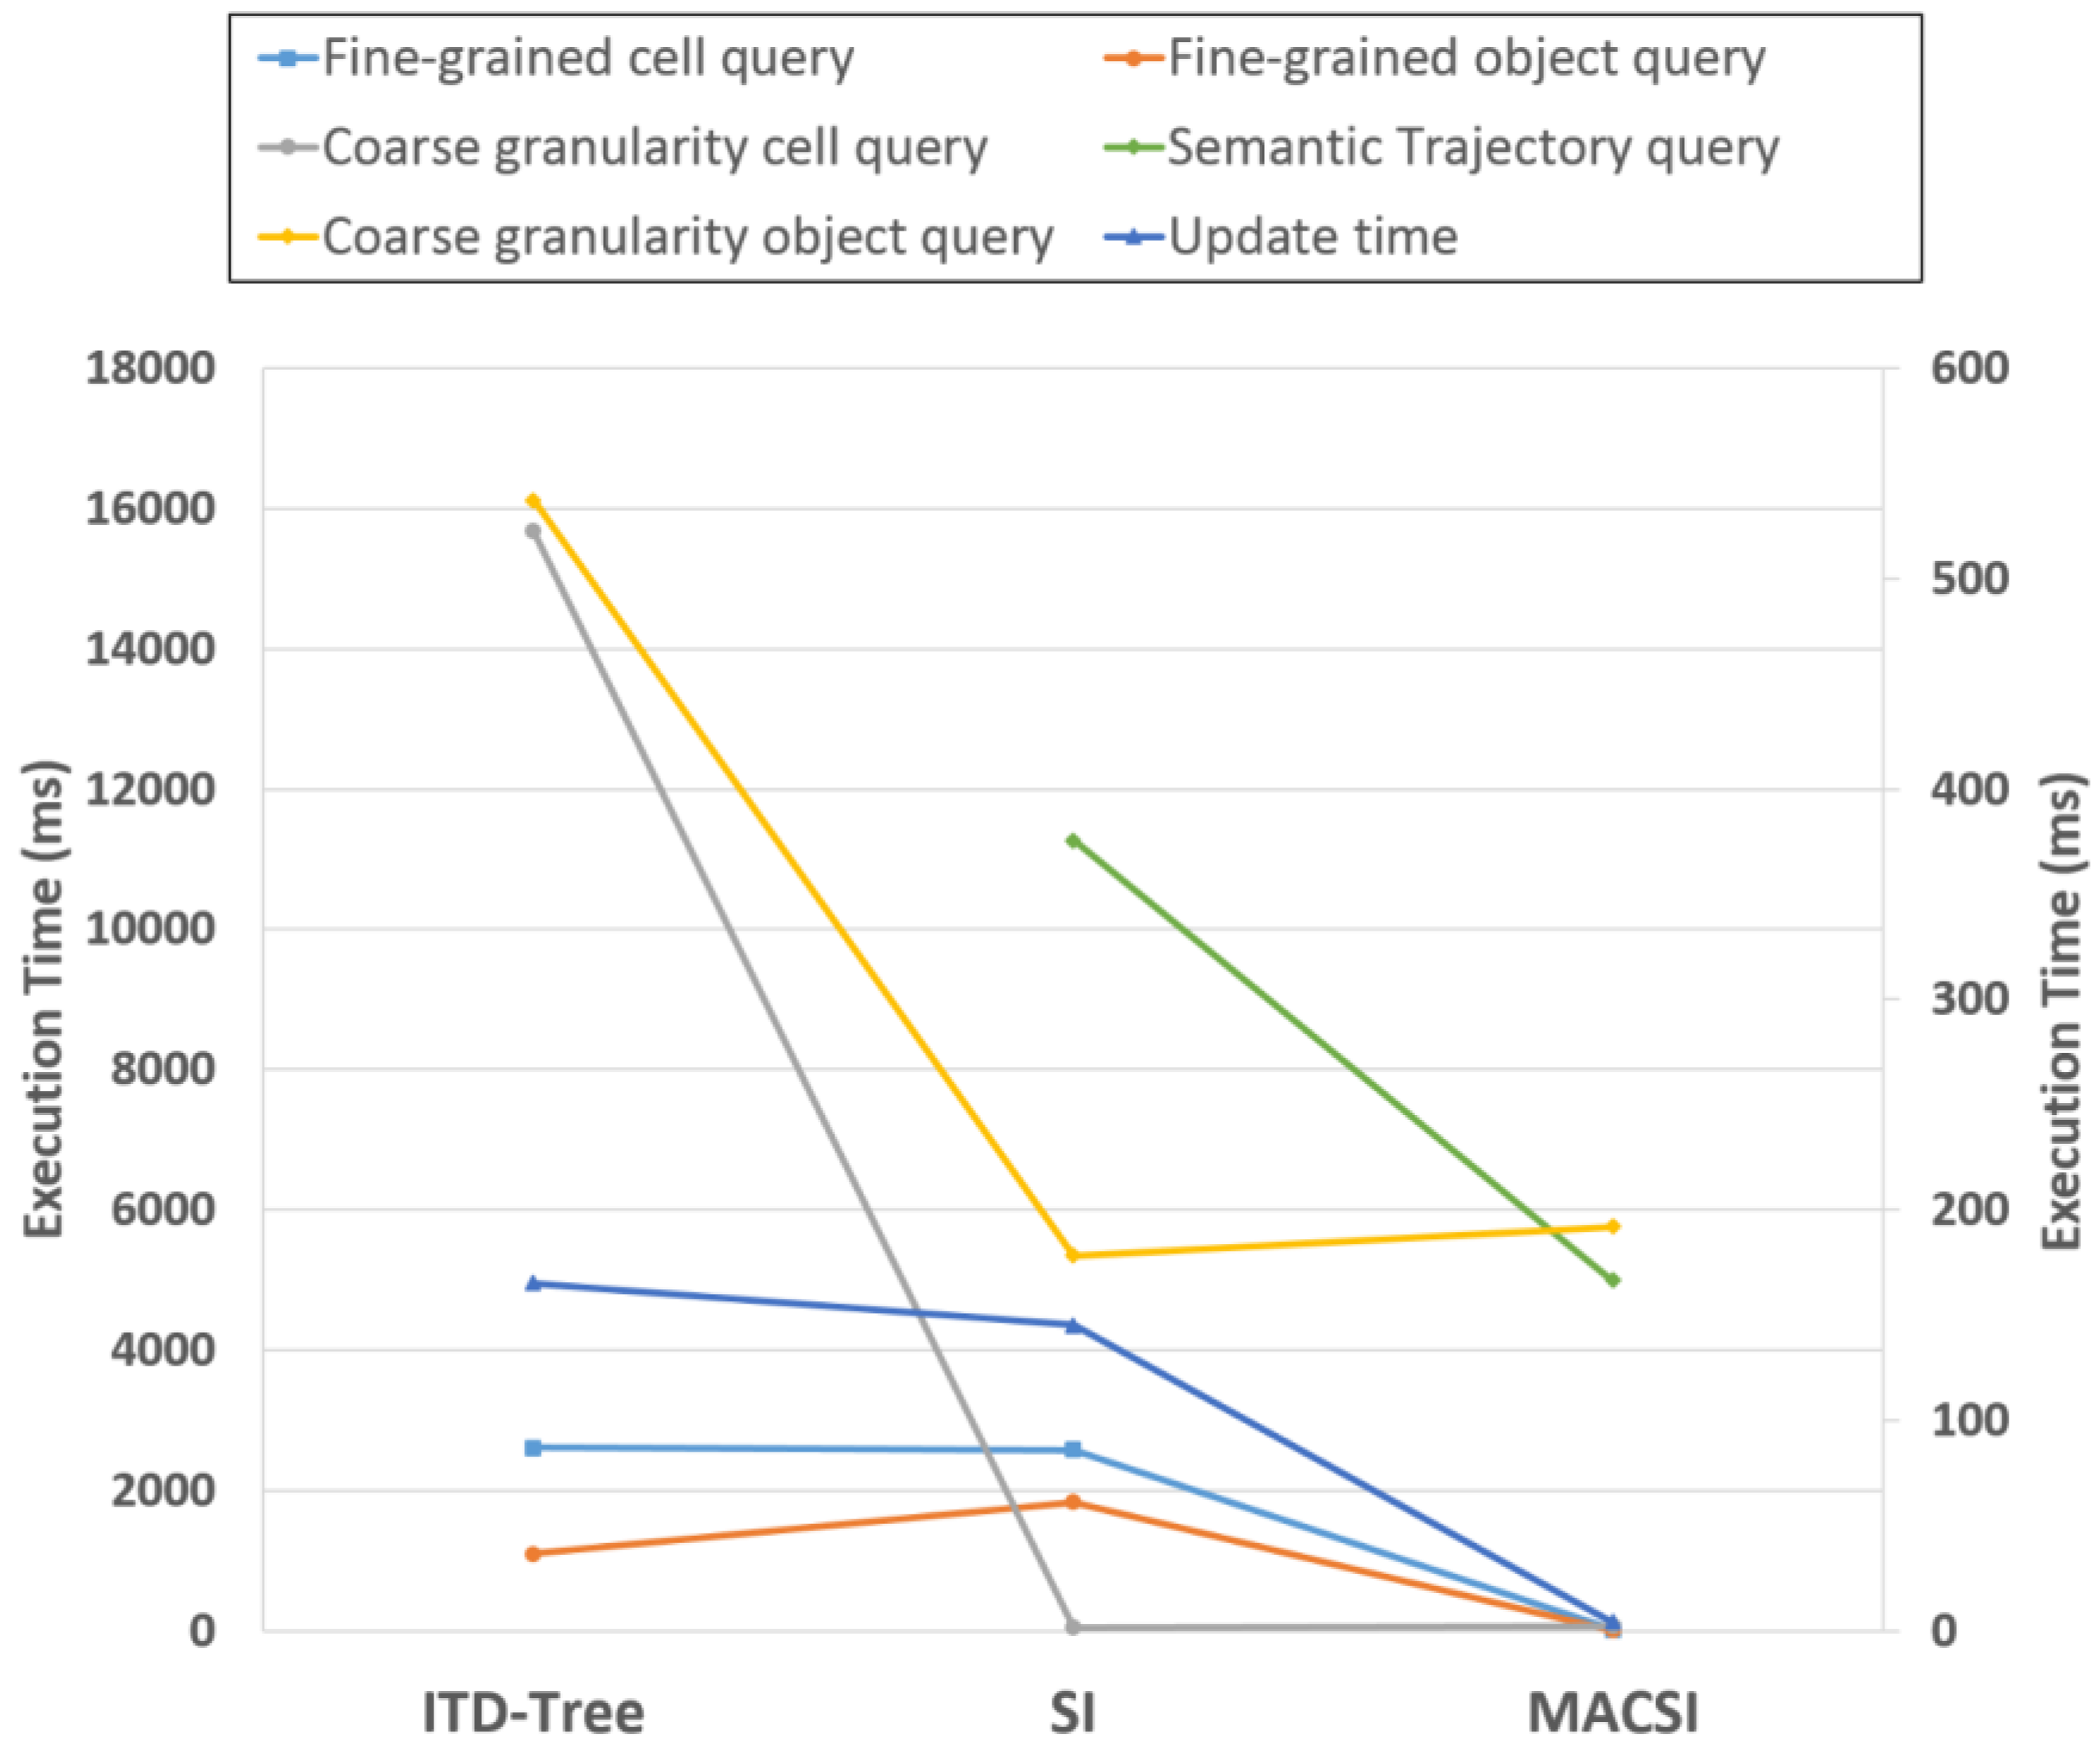
Ijgi 05 00176 g031
Figure 32. Real dataset result. (ITD-Tree, Si and MACSI are distributed in the abscissa axis, respectively. It is obvious that the overall trend of the system response time is ITD-Tree > SI > MACSI. Additionally, MACSI showed better performance than ITD-Tree and SI in semantic cells, and objects’ queries as well as updates).
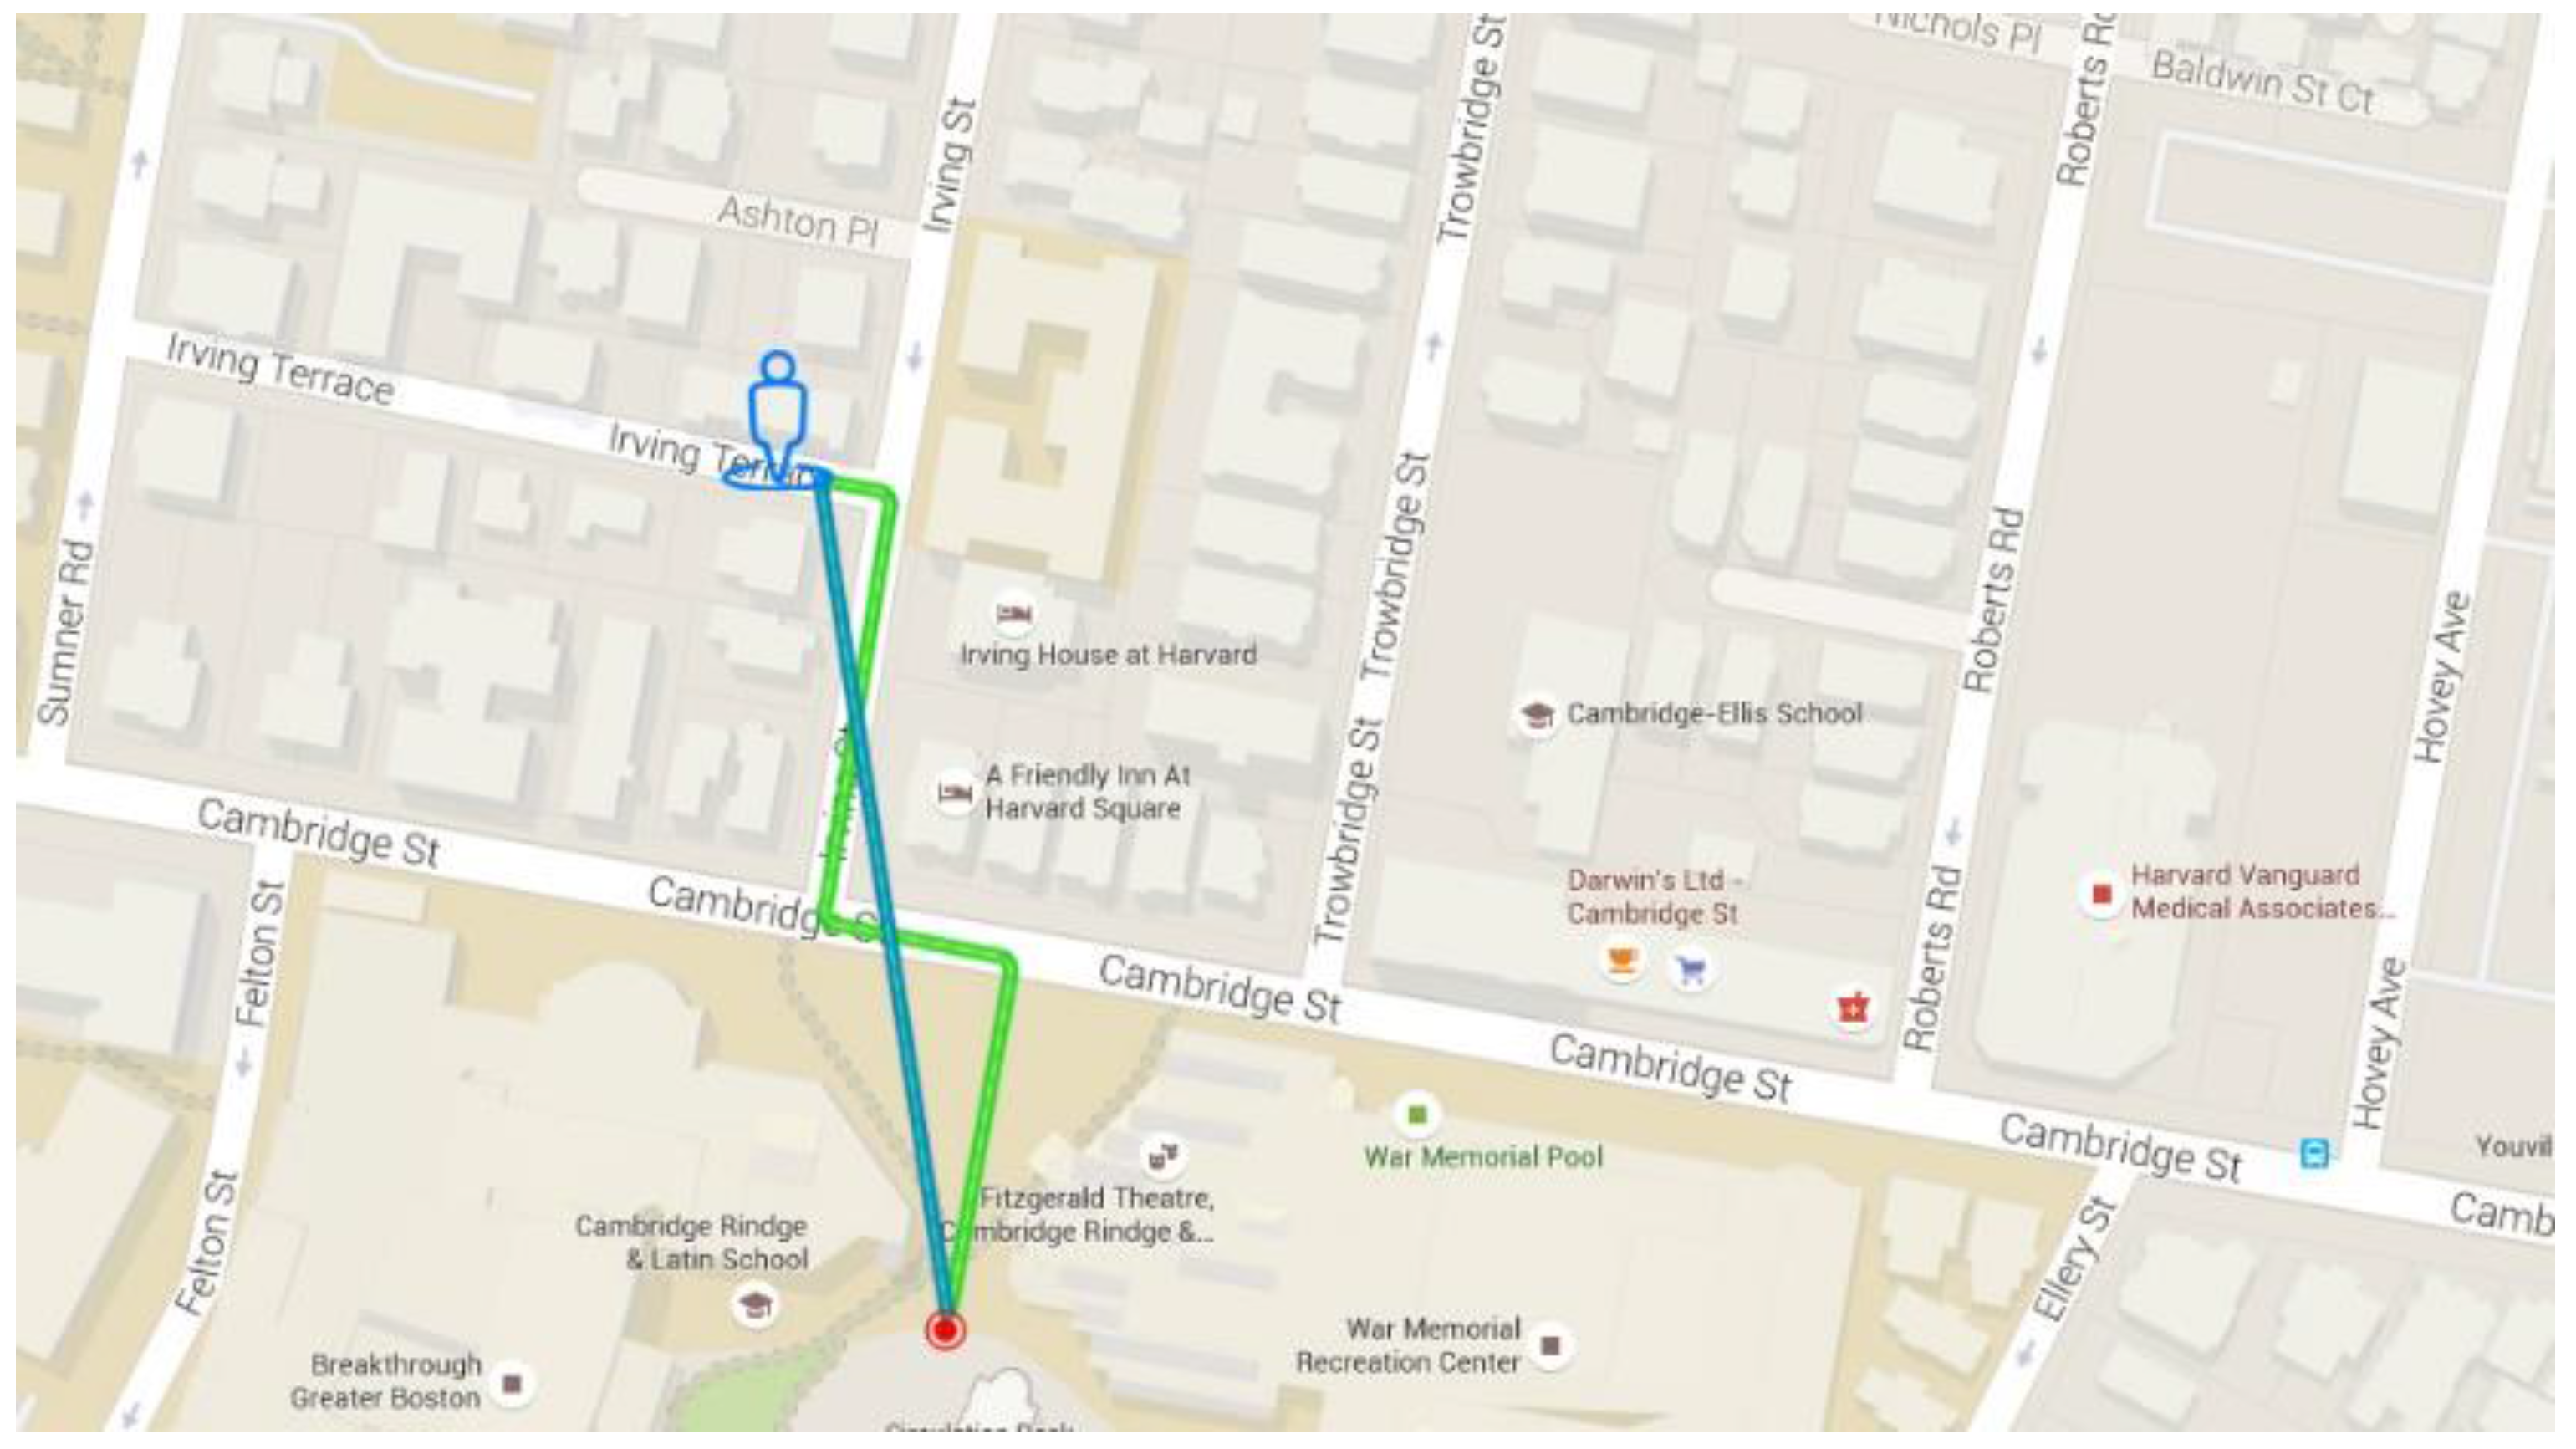
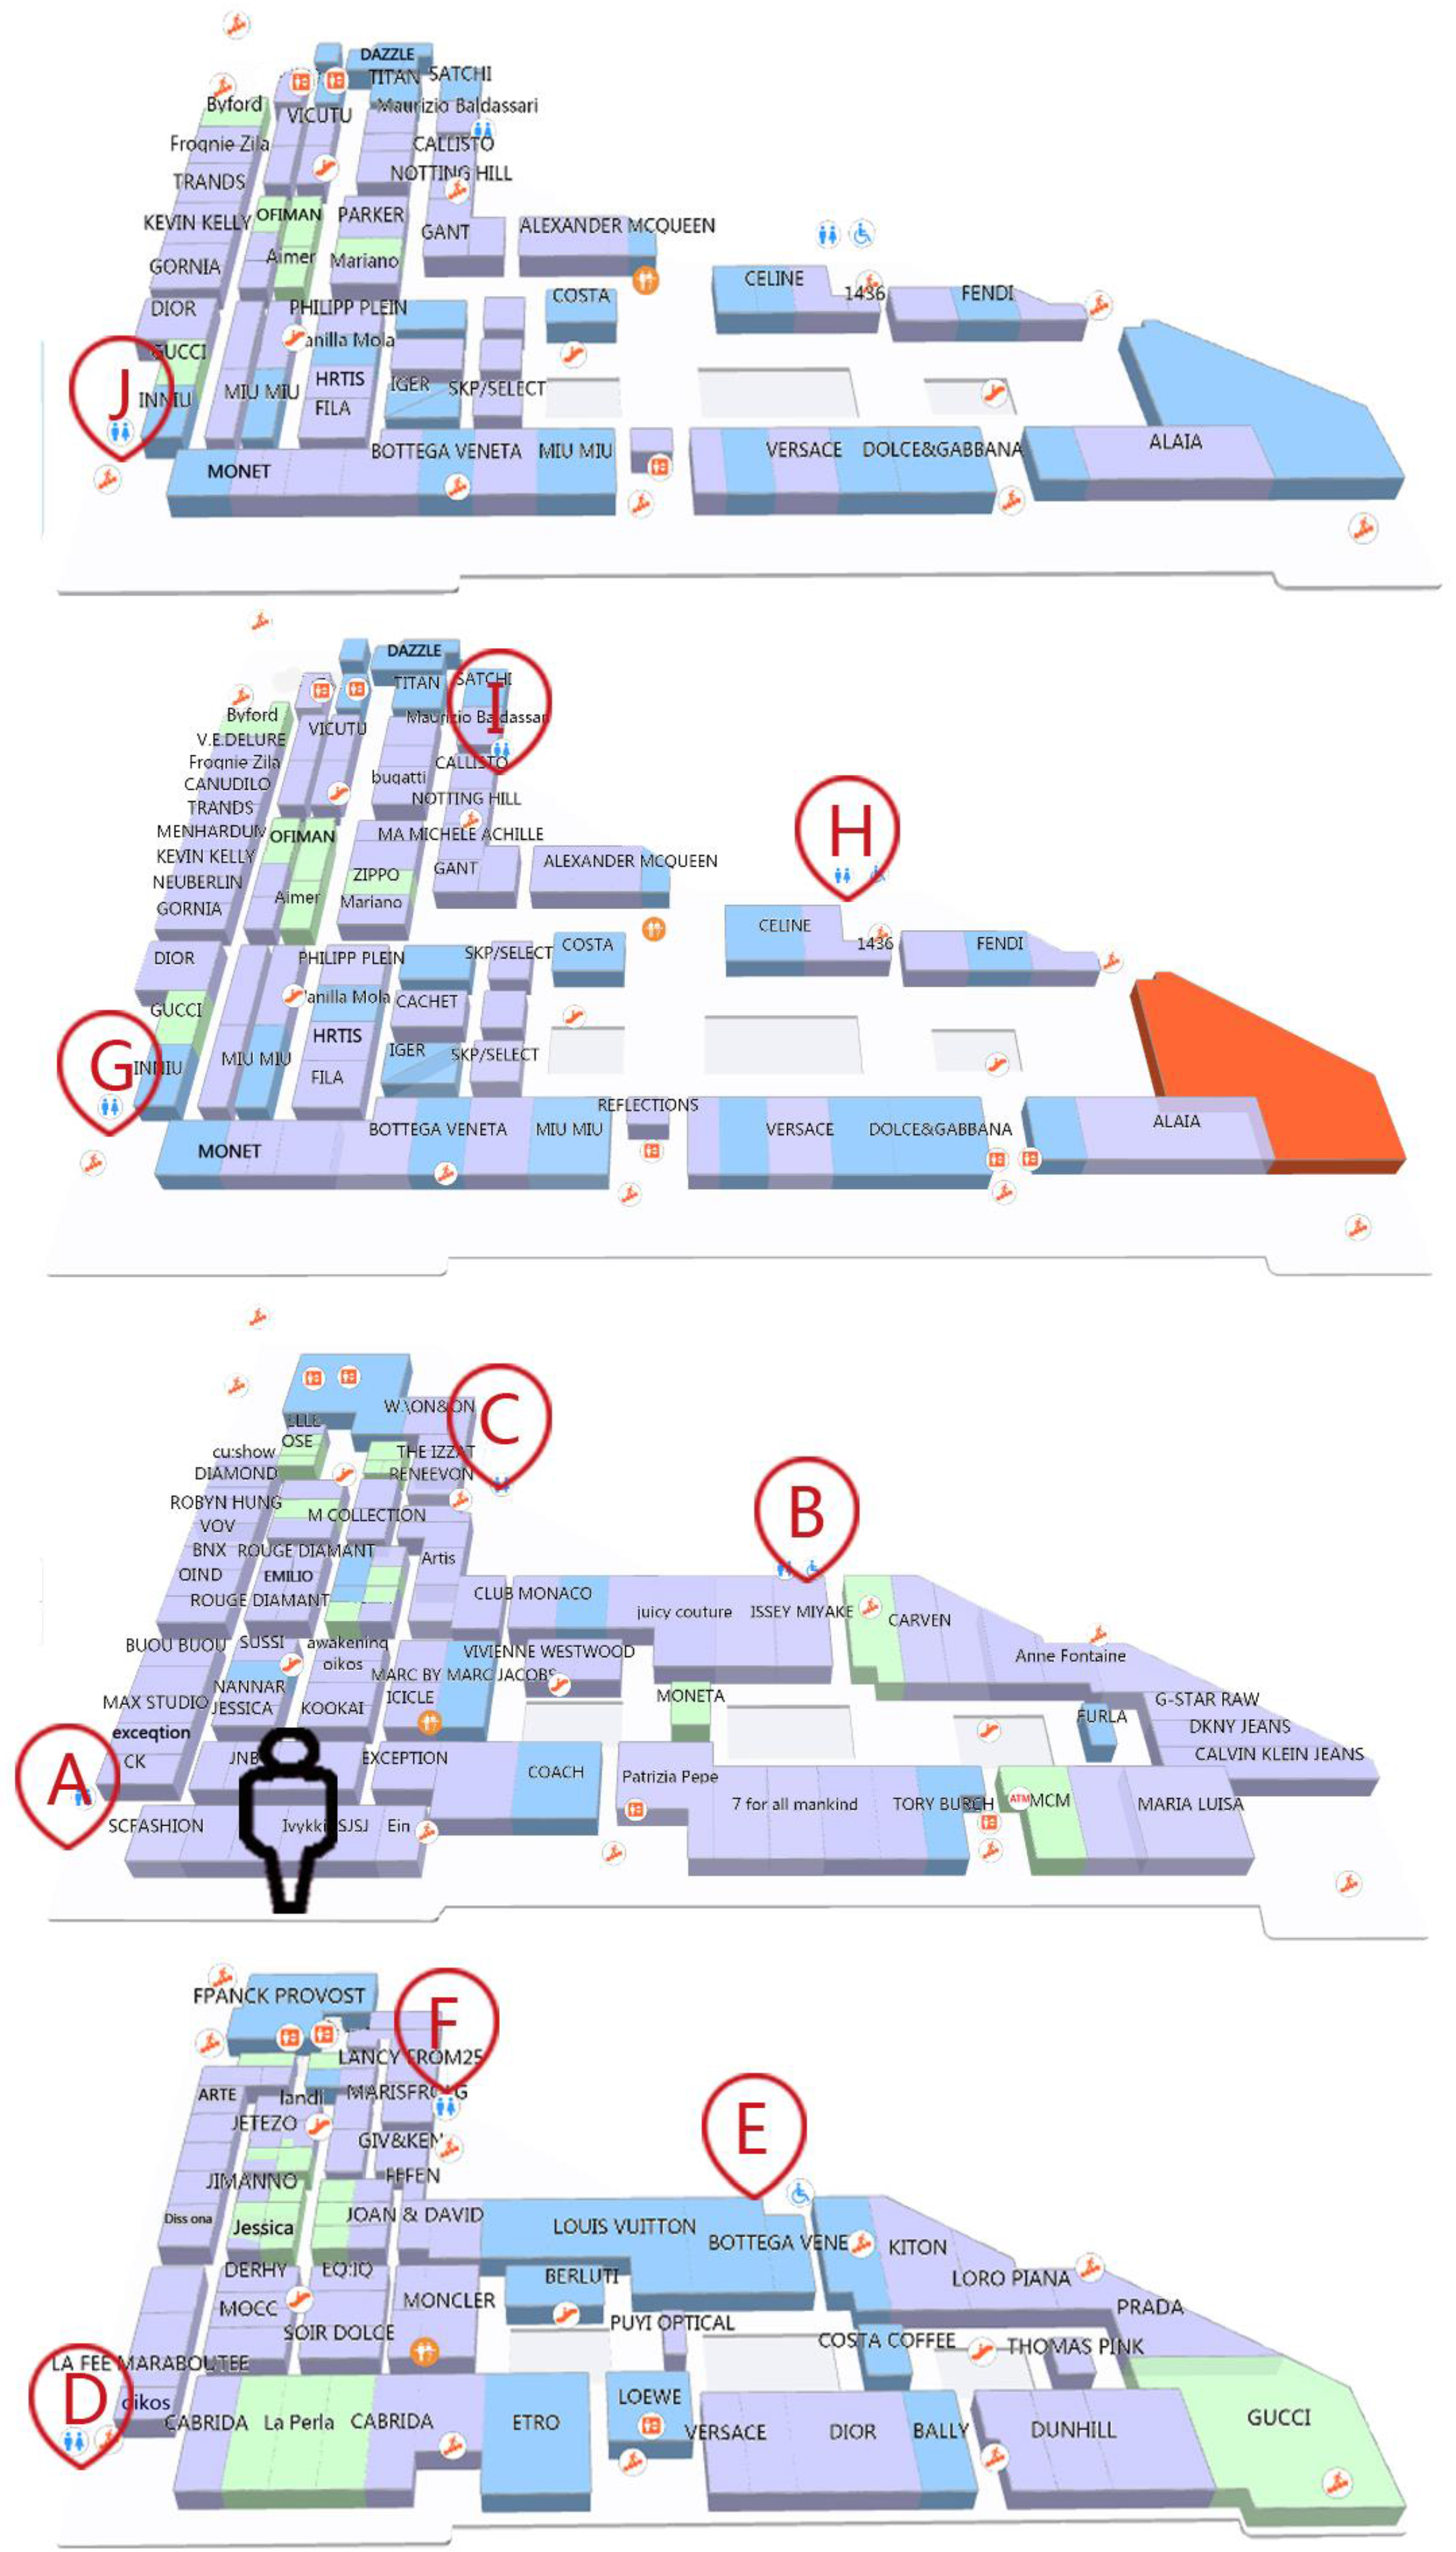
Ijgi 05 00176 g032
Figure 33. The positions of the moving object and locations of the search results. (The black humanoid is the location of the moving object, and (AJ) denote the 10-nearest lavatories to the moving object; (AC) are located on the 3rd floor; (DF) are on the 2nd floor; (GI) are the 4th floor; and (J) is on the 5th floor.)
Ijgi 05 00176 g033
Table 1. Notations used throughout this paper.
NotationMeaning
CCellular space
TTime
OMoving object
CIDCell ID
FIDFloor ID
BIDBuilding ID
EDist(Oi, Oj)The Euclidean distance between Oi and Oj
CDist(Oi, Oj)The number of hops of the cells between Oi and Oj
RDist(Oi, Oj)The actual distance between Oi and Oj
STreeSemantic tree
SRootThe root of semantic tree
SiTrSemantic trajectory
Table 2. Indoor positioning log.
IDCellStart TimeEnd Time
p1C1St1Et1
p2C2St2Et2
Et3
pnCnStnEtn
Table 3. Queries used in the experiments conducted in the present study.
Query TypeExamples
Coarse-grained semantic objects queryReturn all the security guards in a shopping mall
Fine-grained semantic objects queryReturn very important person (VIP) customers in a shopping mall whose birthdays are today
Coarse-grained semantic cells queryReturn the lavatory nearest to object O1
Fine-grained semantic cells queryReturn the restaurant that sells fried squid rings nearest to object O1
Complex semantic trajectories queryReturn objects that habitually go to the movie theater after shopping in a shopping mall
Table 4. The adjacency distance table.
C1C2C3C4C5C19
C1023423
C2201223
C3310134
C4421045
C5223403
C19334530
Table 5. The adjacency distance table.
C1C2C18C19C20C21C22
C10357888
C23046777
C185406157
C197660511
C206515046
C218751402
C228771620
Table 6. The actual arrival times of ITD-Tree and SI to the 10-nearest lavatories in the real dataset.
OrderFloor NumberDestinationTime
13A22 s
23B75 s
33C105 s
42D47 s
52E135 s
62F165 s
74G46 s
84H132 s
94I172 s
105J70 s
Table 7. The actual arrival times of MACSI to the 10-nearest lavatories in the real dataset.
OrderFloor NumberDestinationTime
13A22 s
22D47 s
34G46 s
43B75 s
55J70 s
63C105 s
72E135 s
84H132 s
92F165 s
104I172 s

