1. Introduction
Yemen is one of the countries described by the United Nations (UN) as a complex humanitarian crisis. There are about 15 million people out of a total population of 24 million requiring some form of humanitarian assistance. According to the 2015 Yemen Humanitarian Needs Overview, 10.6 million Yemenis are food insecure [
1] and 13 million are without adequate safe drinking water or sanitation [
2]. One million children under the age of five years are malnourished, while over one million are either internally displaced, primarily migrants from the Horn of Africa, or Yemenis returning from the Kingdom of Saudi Arabia [
3].
The threats of conflicts, acts of terrorism, insecurity, access constraints, natural disasters such as flooding, landslides, pandemics and many more undermine the efforts of humanitarian assistance. In addition, Yemen’s humanitarian crisis continues to be driven by under-development, weak governance, environmental stress, demographic pressure, dwindling natural resources, extreme poverty and continued political instability. At the beginning of 2015, there was a significant increase in conflict in Yemen with the Al Houthis, a group belonging to the Shia form of Islam, expanding their control across many governorates in the country. The expansion of the Al Houthis met fierce resistance from the local tribes and elements of the Al Qaeda of the Arab Peninsular (AQAP) and its affiliates. On 26 March 2015, a Saudi-led coalition began airstrikes targeting Al Houthi positions and military installations. At the end of March, all international staff of humanitarian actors in Yemen, including the UN, evacuated all their staff out of the country. The fighting has also escalated in the south between the Al Houthis and the Popular Committees. The World Health Organization reports that over 2000 people have been killed with over 8000 injured since 19 March 2015. The crisis has generated over a million internally displaced persons [
4].
At the beginning of April 2015, the UN launched an appeal of US$274 million to reach 7.5 million people with life-saving assistance and protection covering a three-month period. The appeal identified priority needs in the areas of health, water and sanitation, protection, emergency shelter, non-food items and food aid. At the beginning of July 2015, the United Nations declared the Yemen humanitarian emergency as Level 3, a category reserved for the most severe, large-scale and complex crises. The Yemen humanitarian emergency has further increased the vulnerability of the Yemeni people. The crisis has revealed that some places are more vulnerable to the humanitarian crisis than others, with the demographic characteristics of the Yemeni people also contributing to this vulnerability [
5,
6].
1.1. Vulnerability to Humanitarian Crisis
In this paper, we broadly define humanitarian emergency drawing from Byrne and Baden [
7] six pronged classification, which includes: (1) emergencies of natural rapid onset (e.g., earthquakes, cyclones); (2) emergencies of technological rapid onset (e.g., fuel, chemical and nuclear accidents); (3) emergencies of slow onset (triggered by natural disasters such as drought and pest attacks); (4) permanent emergencies (e.g., structural poverty); (5) emergencies of mass population displacements; and (6) “complex” emergencies (generally associated with civil war and armed conflicts). The Humanitarian Coalition defined humanitarian emergency as an event or series of events that represents a critical threat to the health, safety, security or well-being of a community or other large group of people, usually over a wide area [
8]. Most of the humanitarian crisis in the world are caused by natural disasters but quite a substantial number have also been caused by civil war and armed conflicts [
9].Yemen’s humanitarian crisis is caused by poverty, extensive violence and loss of lives, massive displacement of populations, widespread damage to property and the economy, war and insecurity. In this paper, humanitarian crisis and humanitarian emergencies are used interchangeably.
The concept of vulnerability is highly contested and is often used with differing connotations [
10,
11,
12]. While there are many different definitions of vulnerability [
12,
13], in this paper, we define vulnerability as being a function of both the physical environment and of the socio-economic and political context which increase the susceptibility of a community during humanitarian emergencies.
Evidence from recent humanitarian crisis, such as in Libya, Syria, Iraq, Central African Republic and Yemen, suggest that vulnerability to humanitarian emergencies vary between populations, age groups, households, communities, and the location in general [
2,
3,
14,
15,
16].
A lot has been done to understand the circumstances and needs of people in order to tailor appropriate responses during humanitarian crisis [
9] using tools such as the Multi-cluster/sector Initial Rapid Assessment (MIRA), Assessment Capacities Project (ACAPS), risk and early warning initiatives such as the drought early warning system in Karamoja, Uganda, and the World Food Programme’s Comprehensive Food Security and Vulnerability Assessment. However, less has been done to understand vulnerability to humanitarian crisis, specifically the potential impact of humanitarian crisis on people and places. Given the devastating impact of the Yemen humanitarian crisis, humanitarian agencies need understanding of who and what places are vulnerable to the crisis to enable them to prepare context-specific and effective responses for individuals based on their vulnerability and the vulnerability of the governorates in which they live.
The current approaches to measuring vulnerability broadly falls into the categories of the indicator approach using both quantitative [
6,
17] and qualitative, engineering approaches focusing on loss estimations with an emphasis on the hazard component, and the broader aspects of vulnerability such as trying to capture institutional aspects [
11]. By far, the use of indicators is the most used in the literature. Numerous indices to estimate various vulnerabilities exist, with different conceptual frameworks and methodologies, underpinning the lack of a consensus [
18]. Cutter, Boruff and Shirley [
6] used the hazards of place vulnerability model to create an index of social vulnerability to environmental hazards, calling it the Social Vulnerability Index (SoVI). The SoVI approach has been applied at various spatial and temporal scales [
17,
19,
20,
21,
22] in the areas of climate change, mortality, morbidity, heat waves, flood disasters and agriculture [
23,
24,
25,
26].
Use of indices to assess vulnerability in the field of humanitarian assistance, refugee camp situation, humanitarian funding, and humanitarian crisis also exist, with most available at the national scale. These include the Global Vulnerability Assessment (GVCA), and the Forgotten Crisis Assessment (FCA) of the European Union, the Humanitarian Response Index [
27], the IDP Vulnerability Assessment and Profiling (IVAP) [
28] , Global Hunger Index [
29], and the Global Conflict Risk Index [
30]. At the beginning of 2015, the United Nations and European Commission released the results of its Index for Risk Management (INFORM) [
31]. INFORM is a tool for predicting where humanitarian crisis will occur based on a series of indicators that measure hazards and exposure, vulnerability, and capacity across 191 countries. Most of the current tools for assessing vulnerability to humanitarian crisis operate at a national or regional scale. National scale assessments of vulnerability and its consequent rankings are of strategic relevance but provide limited operational value in addressing local scale vulnerability reduction.
The development of a geospatial vulnerability assessment that can identify places and characteristics of populations with the greatest risk to humanitarian crisis at sub-national scale is scant in the literature. Despite the years of conflict, studies of Yemen’s vulnerability to humanitarian crisis are limited. Empirical evidence of the underlying factors that generate vulnerability to humanitarian crisis in Yemen is lacking. Developing an index of social vulnerability to humanitarian emergencies will provide a useful tool for comparing spatial variability in social vulnerability. Such an index can also be linked to physical vulnerability in calculating the overall vulnerability of a place to humanitarian emergency.
Measuring vulnerability of governorates in Yemen is a pre-requisite to any attempt in reducing the impact of humanitarian crisis. The goal of this study is to develop a relative ranking of social vulnerability of governorates in Yemen to humanitarian emergencies, and determine the underlying factors that contribute to the increase or decrease of it. Specific objectives include: (i) developing a methodology that uses a Geographic Information Systems (GIS) that maps social vulnerability; and (ii) determining the geographies of social vulnerability of governorates in Yemen to humanitarian emergencies.
1.2. Framework for Assessing Social Vulnerability to Humanitarian Crisis
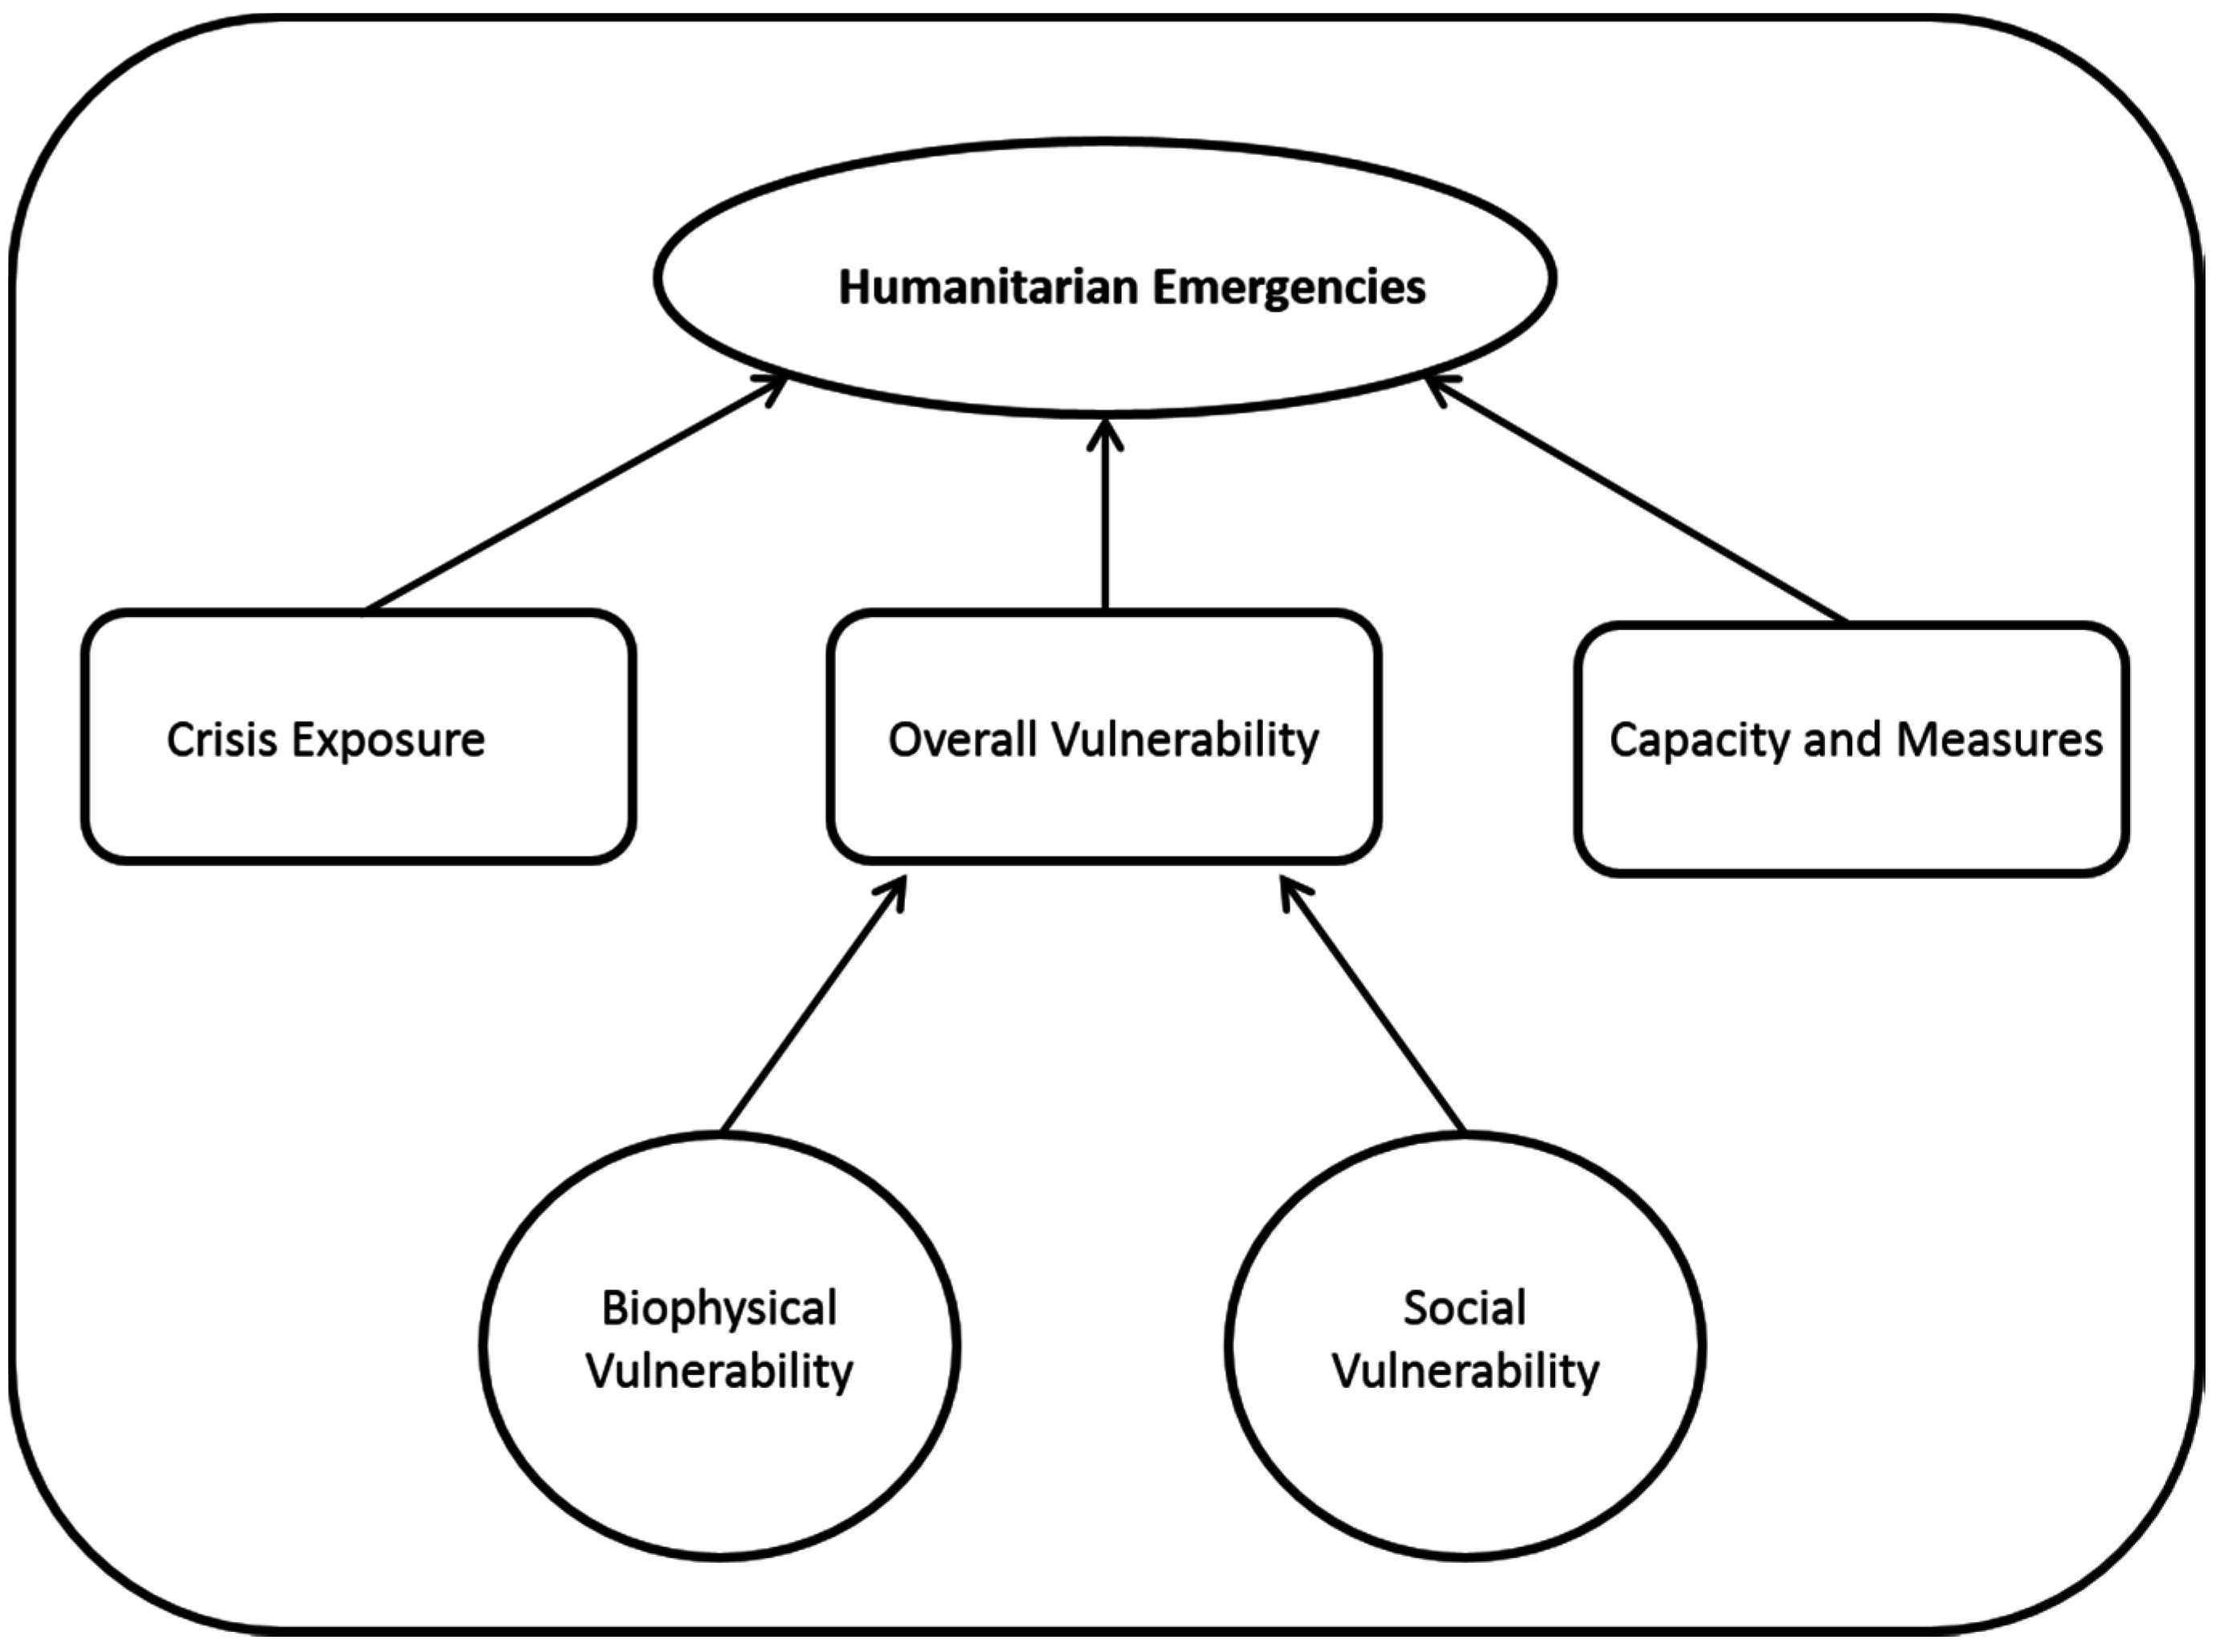
Vulnerability to humanitarian crisis generally means the potential for human suffering. The overarching goal of responding to humanitarian crisis is to alleviate human suffering. In this paper, the risk of humanitarian emergencies is the sum of crisis exposure, vulnerability and capacity measures (see
Figure 1). With low capacity and high vulnerability, the risk of humanitarian emergencies will be high. However, with high vulnerability, even with a high capacity, the risk of humanitarian emergency is high even with a low magnitude crisis exposure. The overall vulnerability is viewed as a combination of physical and socioeconomic characteristics to provide a measure of the overall vulnerability of the community, which Cutter [
12] termed the place vulnerability [
12,
32]. The focus of this paper is assessing social vulnerability of governorates of Yemen to humanitarian emergencies. Adapting Cutter’s definition [
6], we define social vulnerability to humanitarian crisis as a “measure of both the sensitivity of a population to events and conditions that trigger humanitarian crisis and its ability to respond to and recover from the impacts of such emergencies and crisis”.
Figure 1.
Humanitarian Crisis Framework.
Figure 1.
Humanitarian Crisis Framework.
1.3. Vulnerability to Humanitarian Crisis Factors
Empirical evidence suggests that different groups of people often experience different degrees of injury, loss and disruption from the same or similar event and also manifest differential ability to cope and recover [
33,
34]. Different groups of people are affected by crises in different ways based on their conditions and the conditions of the places in which they live [
6]. Some will have more resources, human and material, to deal with the crisis, whilst others will not have the required resources. A number of vulnerability factors to humanitarian crisis exists in the literature [
27,
29,
30]. In addition, the most commonly cited vulnerable groups and socio-economic and demographic characteristics of vulnerability can be found in the literature [
6,
35,
36,
37,
38,
39].
Evidence from Yemen and other countries experiencing severe humanitarian situation suggests that the most vulnerable groups and factors influencing vulnerability include age (the under-five, the elderly above 60 years, particularly the frail and impoverished), children under five years, particularly those that are malnourished, malnourished lactating mothers, large families, households that are food insecure, women, female headed households, widows and divorced, socio-economic status, households below the poverty line and, in the case of Yemen, including the Social Welfare Fund Beneficiaries, ethnic minorities such as the Mohamedsheen, and people displaced, particularly those from the Horn of Africa, internal displacement, and Yemenis deported from the Kingdom of Saudi Arabia [
2,
3,
14,
15,
16]. Significant also are special needs populations such as the disabled, infirmed, and stranded migrant workers looking for opportunities to go to the Kingdom of Saudi Arabia and other Gulf countries [
2,
14,
15,
16]. In humanitarian crisis, such as in South Sudan, women and girls are extremely vulnerable as they are increasingly in danger of sexual and gender-based violence [
9]. In refugee and IDP camps resulting from humanitarian crisis, women and children are over-represented [
40].
Despite the fact that the identified vulnerable groups are often the most affected during a humanitarian crisis, it is the intersection of the various groupings that further increases vulnerability. Being poor, female-headed household with malnourished children below five will be disproportionately affected by a humanitarian crisis. Consensus exists that other factors that also influence vulnerability include insufficient access to resources, information, knowledge and technology, limited access to political power and representation, beliefs and customs, and building stock; all of which will, in turn, be influenced by the socio-economic and demographic factors [
6,
34]. Remittances have been cited as playing a vital role in supporting families affected by humanitarian crisis [
40,
41]. According to the World Bank, 62% of the remittance into Yemen in 2014 originated from the Kingdom of Saudi Arabia. However, at the beginning of 2014, due to changes in the labor laws in the Kingdom of Saudi Arabia, a large number of Yemenis were deported to Yemen thereby significantly reducing the amount remitted and further adding to the vulnerability of families that depended on migrant remittance.
2. Methods
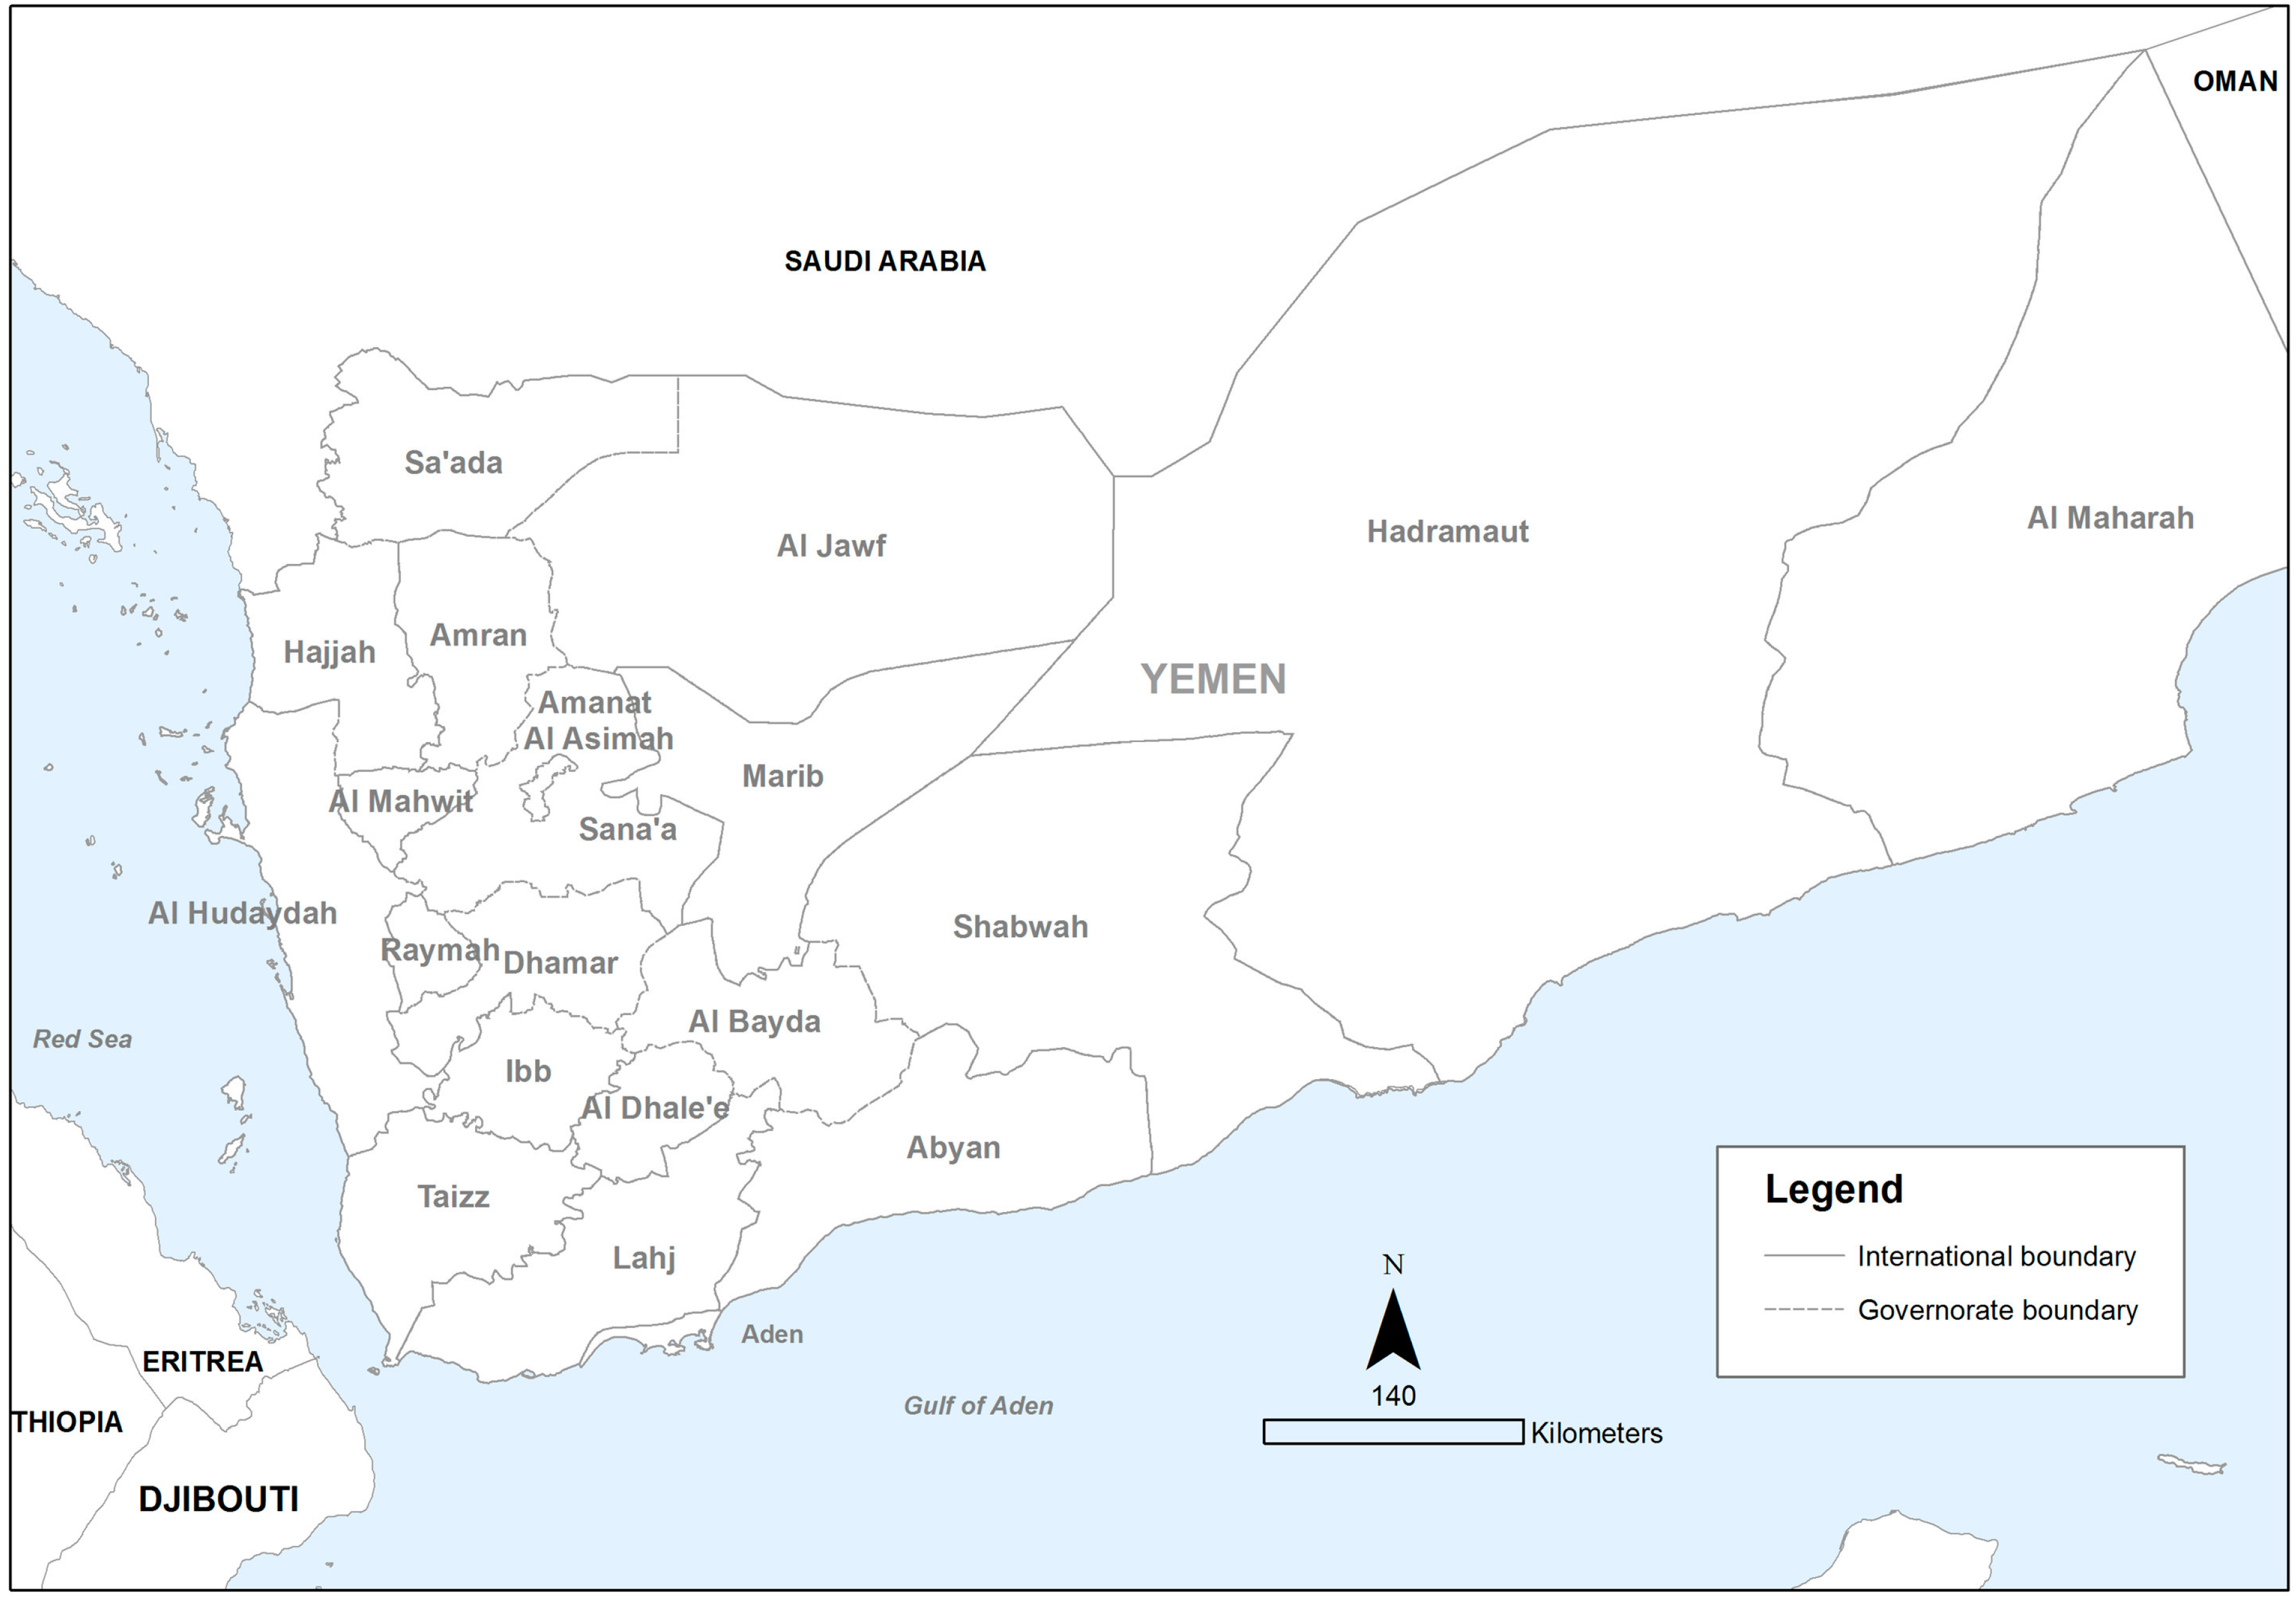
According to the Yemen Central Statistics [
42], Yemen is bordered by Oman on the northeast, Saudi Arabia in the north, by the Red Sea in the west and the Arabian Sea in the south (
Figure 2). Yemen has an area of 527,970 km
2 (203,850 sq mi), including the islands of Perim at the southern end of the Red Sea and Socotra at the entrance to the Gulf of Aden. Yemen is a mountainous country with only the coastal plains being the lowest-lying areas. The elevation ranges from sea level to about 3666 m (12,028 ft) with an average elevation of about 2000 m (6600 ft). The southwestern tip of Yemen links up with the Bab el-Mandeb Strait, which links with the Horn of Africa. It is this close proximity with the Horn of Africa that contributes to thousands of African migrants from Eritrea, Somalia, Ethiopia and Djibouti crossing into Yemen with the hope of reaching the gulf countries. Yemen generally has a hot and extremely dry climate except in the western highlands, where the climate is more moderate. Yemen can be divided geographically into five major areas: the Mountainous area, the Coastal area, the Plateau area, the Desert (Al-Ruba Al-Khali) area, and the Yemeni islands. In terms of administrative division, Yemen is composed of four Regions at the national level (northern, southern, western and eastern), 22 Governorates, 333 Districts and over 37,000 Settlements. In the context of Yemen, governorate scale is where most of the decisions relating to delivery of humanitarian assistance occurs.
Due to armed conflicts and insecurity in the past years, up-to-date data on needs and on prevailing conditions are not available. Most of the up-to-date data on socio-economic variables are scarce. The last census was conducted in 2004, while the recent Yemen National Demographic Health Survey, which was completed in 2014, has still not been made public. For this research, we used the 2012 governorate level socioeconomic and demographic data from the Yemen Central Statistics Office to construct an index of social vulnerability.
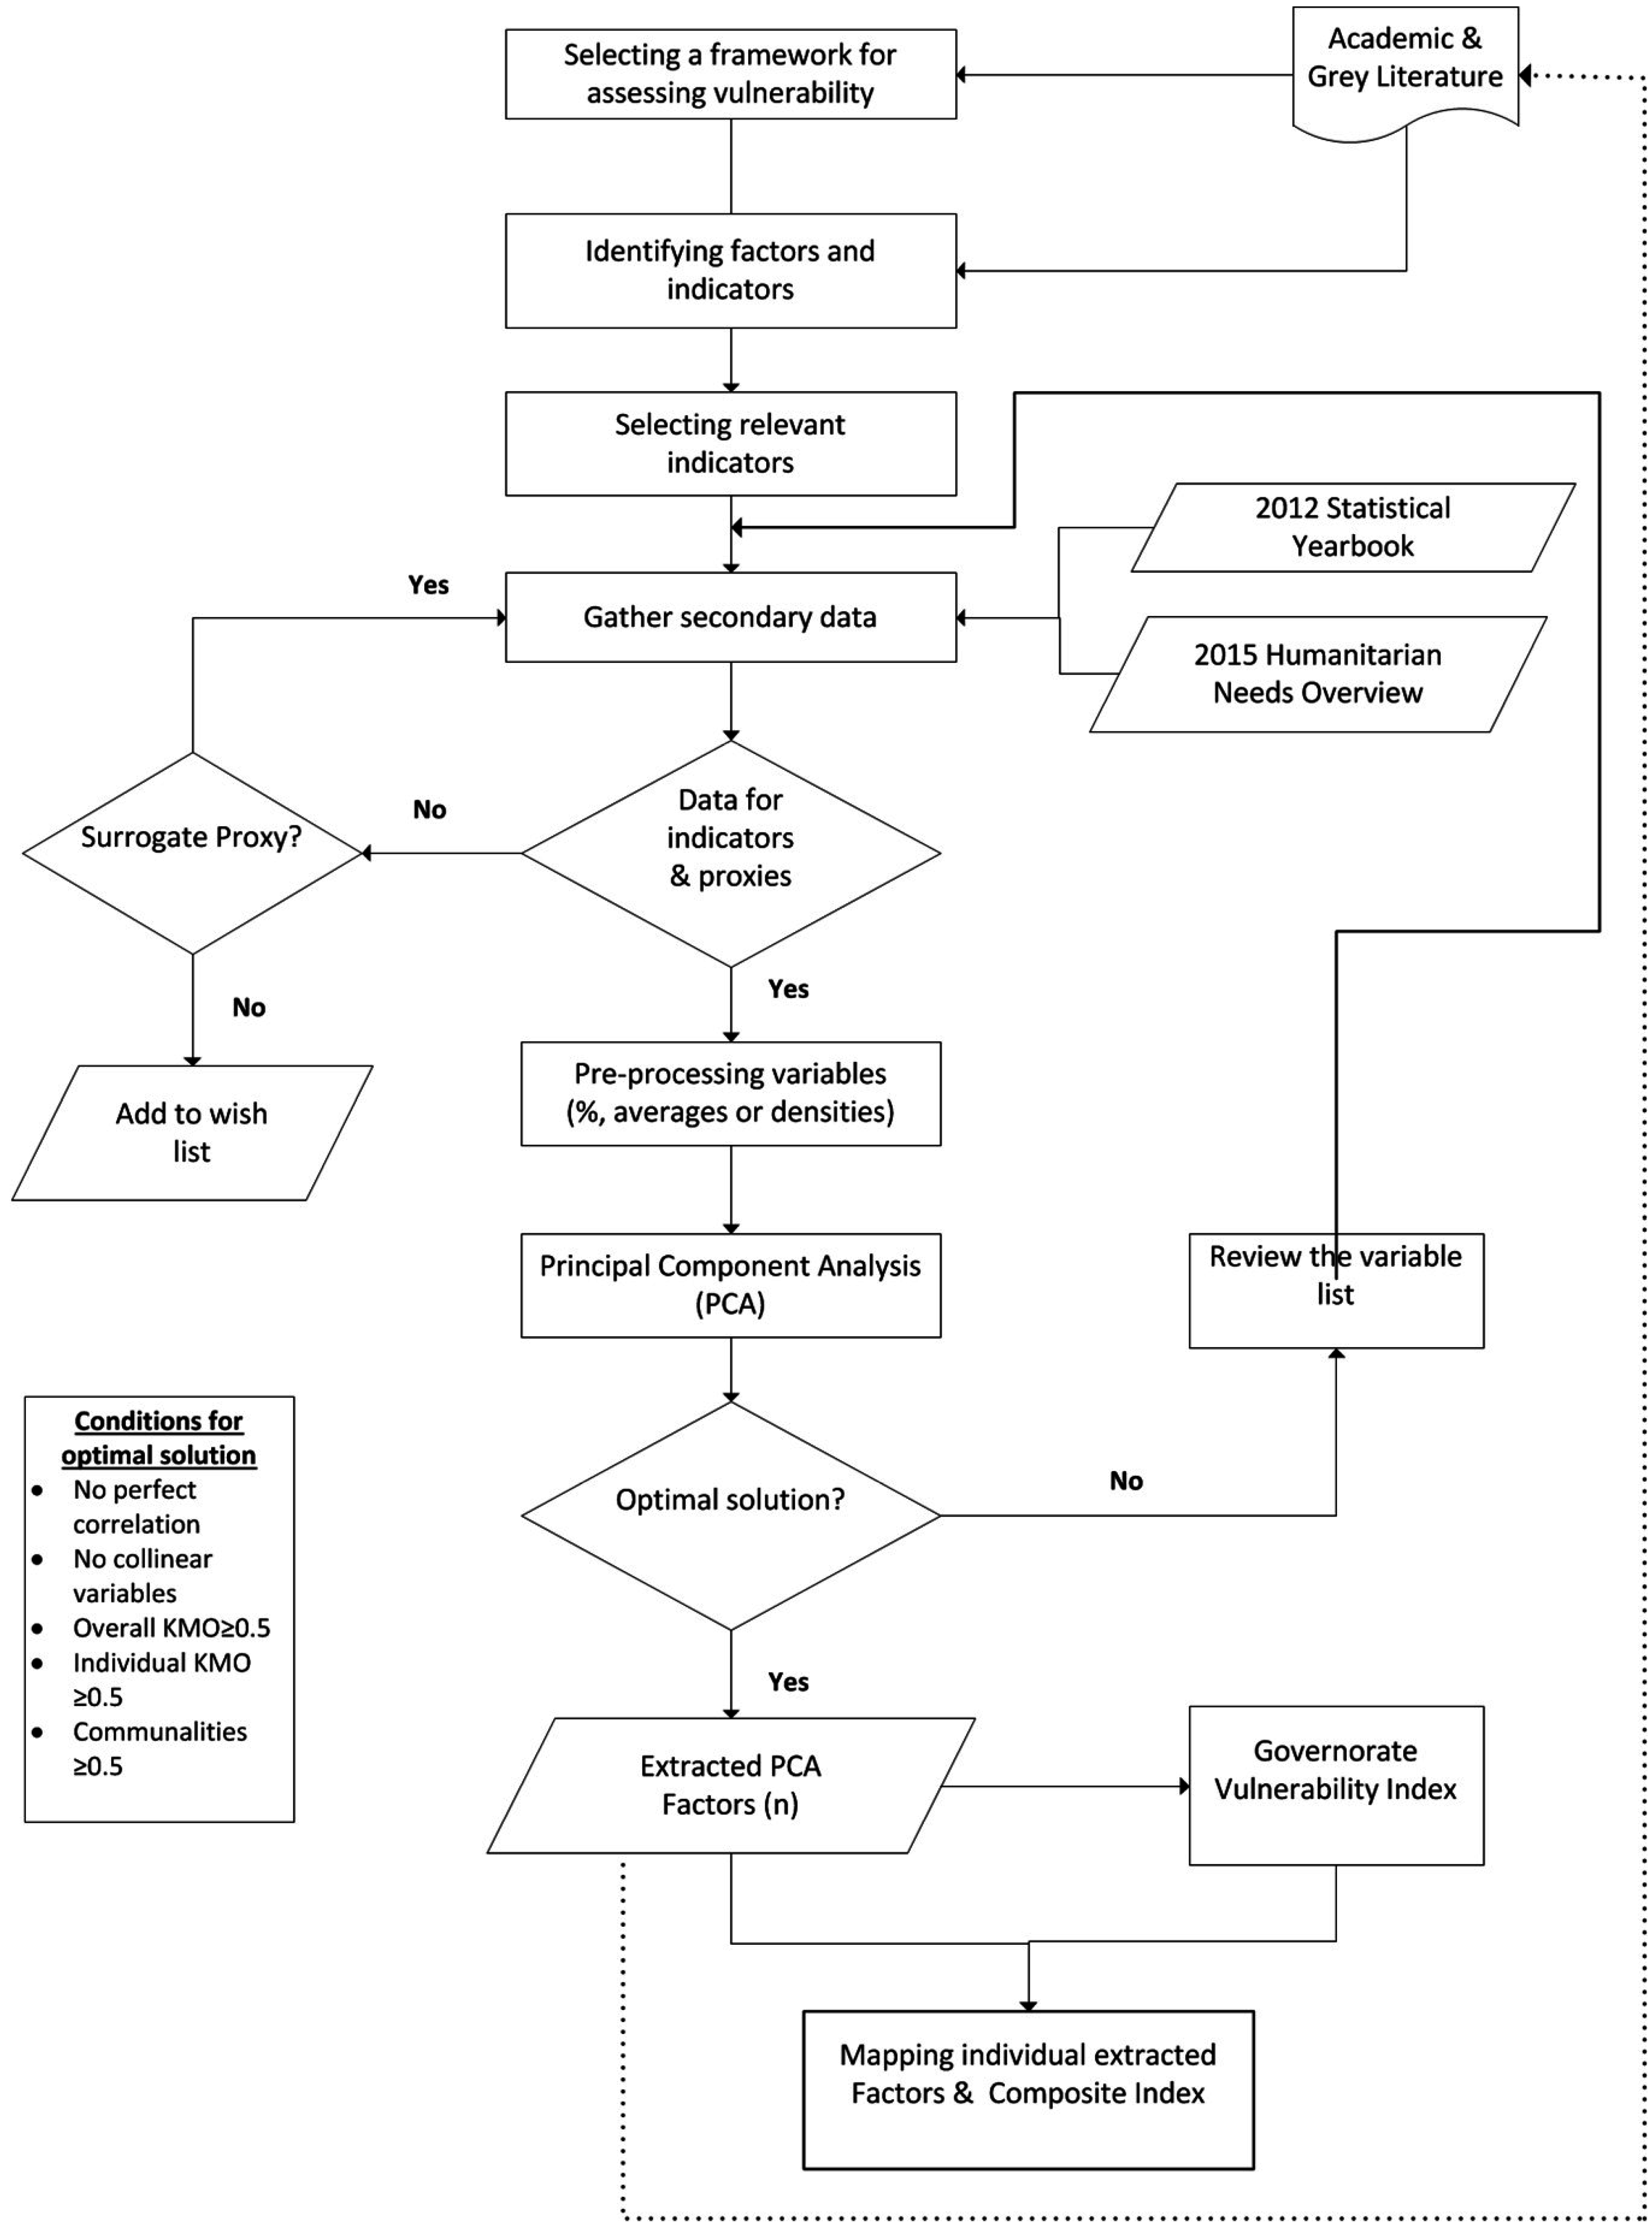
Using the literature, appropriate indicators were selected to represent social vulnerability of governorates of Yemen [
6,
26,
30,
43]. The methodology used is shown in
Figure 3. An initial list of 80 variables was selected and data for these variables were gathered for 22 governorates. Most of the data was gathered from the 2012 Yemen Statistical Yearbook [
44] with the rest obtained from the Yemen Humanitarian Programme Cycle, particularly the 2015 Humanitarian Needs Overview [
3,
16].
Figure 2.
Map of Yemen showing administrative boundaries and locations of governorates.
Figure 2.
Map of Yemen showing administrative boundaries and locations of governorates.
In preparing the data for the social vulnerability analysis, raw data was converted either to percentages, averages or density functions and exported into statistical software called Statistical Package for Social Scientists (SPSS) version 18. The 80 variables were subjected to exploratory data analysis and tested for multicollinearity [
6,
45] to ensure that variables were not double counted. After testing for collinearity, 10 of the variables were removed as they showed a nearly perfect correlation with other variables. Considering that the variables were in different measurement units, the remaining 70 variables were standardized using the Z-score approach [
6,
46]. This was required in order to ensure that the variables could be aggregated [
6].
Considering that social vulnerability is a multi-dimensional concept, we used a Principal Component Analysis (PCA) as the tool to quantify its multivariate nature and for data reduction [
8,
11,
28]. With the 70 variables standardized, we ran the PCA several times using a varimax rotation option, eigenvalue greater than 1 and with Kaiser normalization applied with a pairwise exclusion option for missing values [
17,
21,
47]. For optimal PCA solution, all the variables had correlation coefficients below 0.8, a Kaiser-Meyer-Olkin (KMO) minimum of 0.5, and we ensured that all variables in the communality table were also above 0.5 [
48,
49].
After several runs of PCA, the 70 variables were further reduced to 45.
Table 1 shows the selected social variables used in constructing the index of social vulnerability to humanitarian emergencies. With optimal PCA solution, 12 factors were retained with no changes made. The 12 factors had eigenvalues greater than 1 and explained 92% of variance among the 22 governorates.
Table 2 shows the 12 factors with the loaded variables. Factor scores were calculated for each of the 12 factors for each governorate using estimated scoring coefficients in SPSS (version 18.0; SPSS Inc.). Cutter, Boruff and Shirley [
6] scaled all variables that increased social vulnerability to be positive and all those that reduced it to be negative. In this study, the extracted factors either have all the variables in same positive direction or have some variables in positive direction and others in the negative direction. Jolliffe [
50] noted that the sign of any extracted PCA factor was completely arbitrary, and that reversing the sign of a factor does not change the variance. In this study, individual variables were not scaled.
Figure 3.
Methodology for assessing social vulnerability of governorates in Yemen.
Figure 3.
Methodology for assessing social vulnerability of governorates in Yemen.
Table 1.
Social variables and the concept of social vulnerability each variable addresses.
Table 1.
Social variables and the concept of social vulnerability each variable addresses.
| Variables | Social Vulnerability Concept | Variables | Social Vulnerability Concept |
|---|
| Percent of population under five years old | Age | Percent of population under 5 years malnourished | Nutrition |
| Percent over 60 year old | Age | Percent of population under 5 years stunted | Nutrition |
| Total IDPs and Returnees | Displacement | Percent of female population on Social Welfare Fund | Poverty |
| Total Refugees and Migrants | Displacement | Percent of population on Social Welfare Fund | Poverty |
| Agricultural area under cultivation as a percent of total land | Economy | Percent households in poverty 2006 | Poverty |
| Agricultural area cropped as a percent of total land | Economy | Number of gender based violence reported | Protection |
| Percent of population that cannot read and write | Education | Percent of households without safe drinking water | Sanitation |
| Percent of population with secondary education | Education | Percent of households without sanitary latrines | Sanitation |
| Percent of population with unknown education | Education | Percent of households with agricultural land | Socioeconomic status |
| Percent of population with masters education | Education | Percent of households living in huts | Socioeconomic status |
| Percent females population unemployed | Employment | Percent of households using Trucks for water sources | Wealth |
| Percent total population unemployed | Employment | Percent of households using 5 gallon water containers for hauling water | Wealth |
| Average number of people per household | Family structure | Percent of households using other water sources | Wealth |
| Percent females | Gender | Percent of households using public electricity | Wealth |
| Percent of population under 5 years without vaccination | Health | Percent of households using private electricity | Wealth |
| Percent of population under 5 years diarrhea infection | Health | Percent of households using cooperative electricity | Wealth |
| Child mortality rate | Health | Percent of households using private generator for electricity | Wealth |
| Under five mortality rate | Health | Percent of households using kerosene for lighting source | Wealth |
| Percent of asphalt roads | Infrastructure | Percent of households using gas for lighting source | Wealth |
| Hospital beds/10,000 | Infrastructure | Percent of households using other light sources | Wealth |
| Hospitals/10,000 | Infrastructure | Percent renter-occupied housing unit | Wealth |
| Health personnel/10,000 | Infrastructure | Percent of households food insecure | Wealth |
| Percent of population under 5 years wasting | Nutrition | - | - |
Due to the lack of a defensible weighting scheme and an established relationship between the variables and the extracted factors [
51], two aggregation methods were used. In the first approach, the factors were given equal weighting and placed in an additive model [
6,
46] to produce the Yemen Social Vulnerability Index to Humanitarian Crisis (SoVIHC). In the second approach, using the PCA derived variances of the twelve factors, weights were derived and multiplied against the factor scores of each governorate and then placed also in an additive model. The 12 factor scores and the composite SoVIHC of both the unweighted and weighted factors were exported into ArcGIS 10.1 and mapped as standard deviations from the mean into five categories. Mapping vulnerability using this approach highlights the degree to which some governorates are more vulnerable than others whilst also highlighting their geographic variability.
Table 2.
The twelve underlying factors used to construct the social vulnerability index of governorates of Yemen.
Table 2.
The twelve underlying factors used to construct the social vulnerability index of governorates of Yemen.
| Factor | Name | Percent Variance Explained |
|---|
| 1 | Education | 15.67 |
| 2 | Lack of Basic Services: Poor Sanitation, electricity, housing, health | 15.57 |
| 3 | Social Welfare Fund Population | 8.57 |
| 4 | Poverty and Unemployment | 8.04 |
| 5 | Poor Housing and Illiteracy | 6.63 |
| 6 | Special Groups (Children and the Elderly) | 6.57 |
| 7 | Inadequate Water and Limited Education | 6.34 |
| 8 | Infrastructure; inadequate buildings, hospital facilities | 6.11 |
| 9 | Child Mortality and Health | 5.30 |
| 10 | Internal Displacement | 5.22 |
| 11 | Health, Water and Sanitation Infrastructure | 4.63 |
| 12 | Refugee and Migrant | 3.35 |
3. Results and Discussion
Twelve composite factors were extracted that differentiated governorates of Yemen according to their relative level of social vulnerability to humanitarian emergencies. These factors explained 91.8% of the variance. Each of the twelve factors is described below.
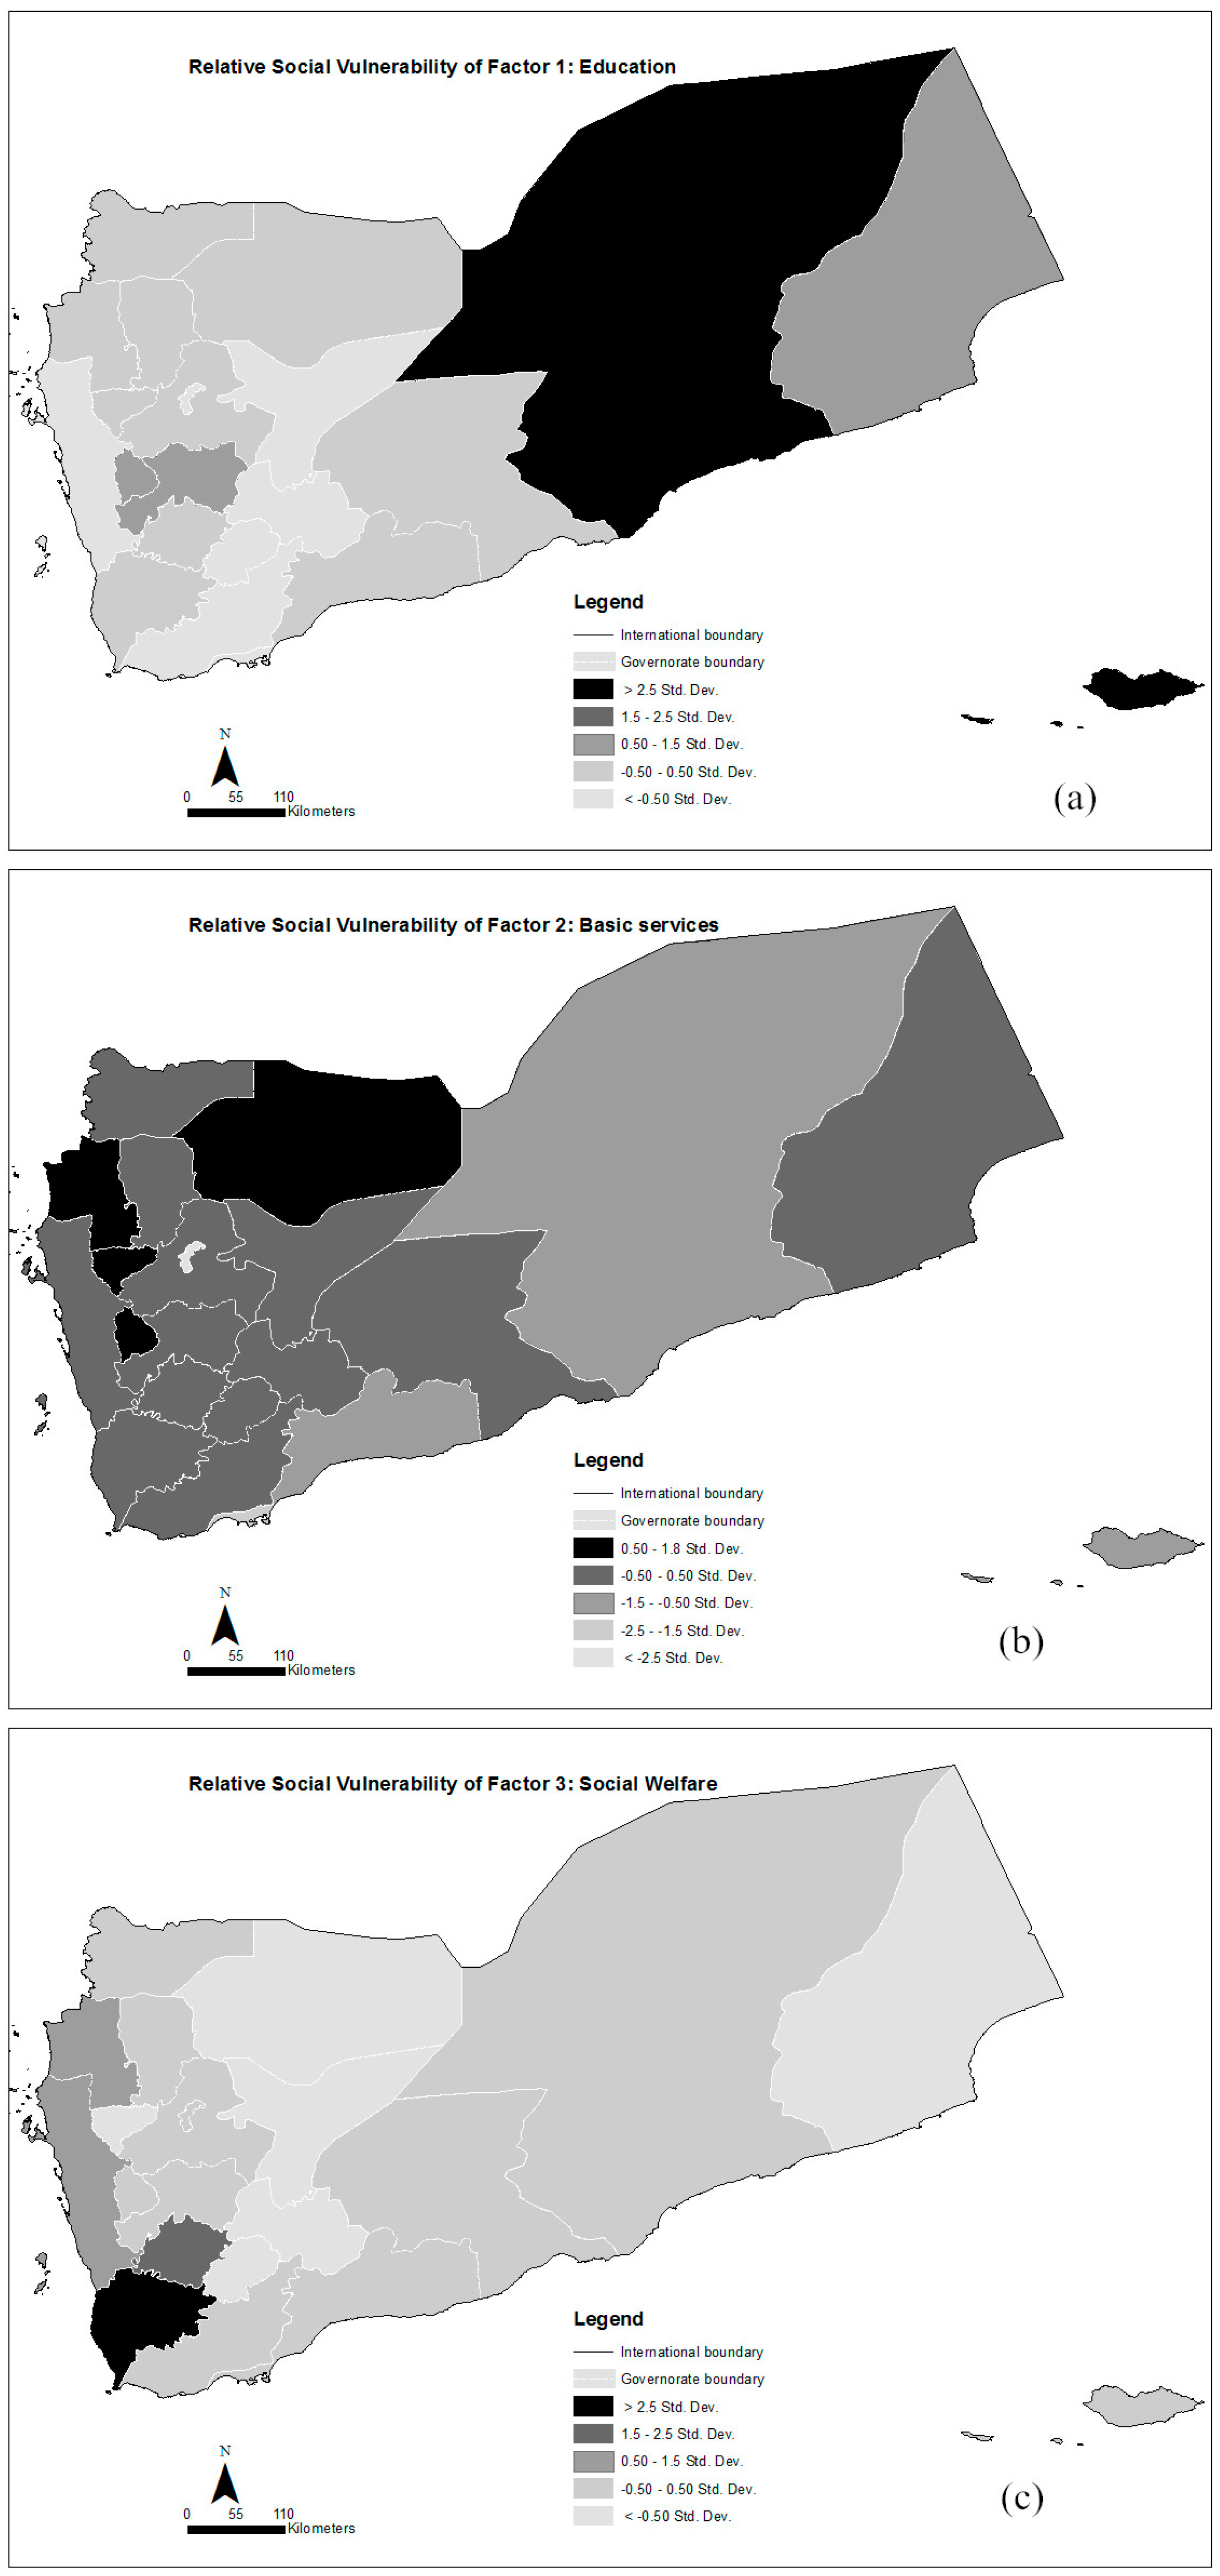
Education: Educational attainment is linked to socioeconomic status with higher levels of education attained resulting in better jobs, higher earnings and savings. Lower education may affect people’s ability to understand and access critical information during humanitarian emergency periods [
34]. The first factor, explaining 15.7% of the variance, broadly relates to educational level of the population in the governorates. There is agreement that the educational level reduces vulnerability as the literate are able to participate in decision making as in camp environments or are able to access information relating to their entitlement. Years of conflict in Yemen has led to most of the schools to be dilapidated, children out of school and in some cases internally displaced populations housed in schools. Based on this factor, the most vulnerable governorate is Hadramaut, followed by Raymah and Dhamar (
Figure 4a). The least vulnerable governorates are Sana’a, the capital city, Marib, Al Bayda, Al Dhale’e, Lahj and Aden.
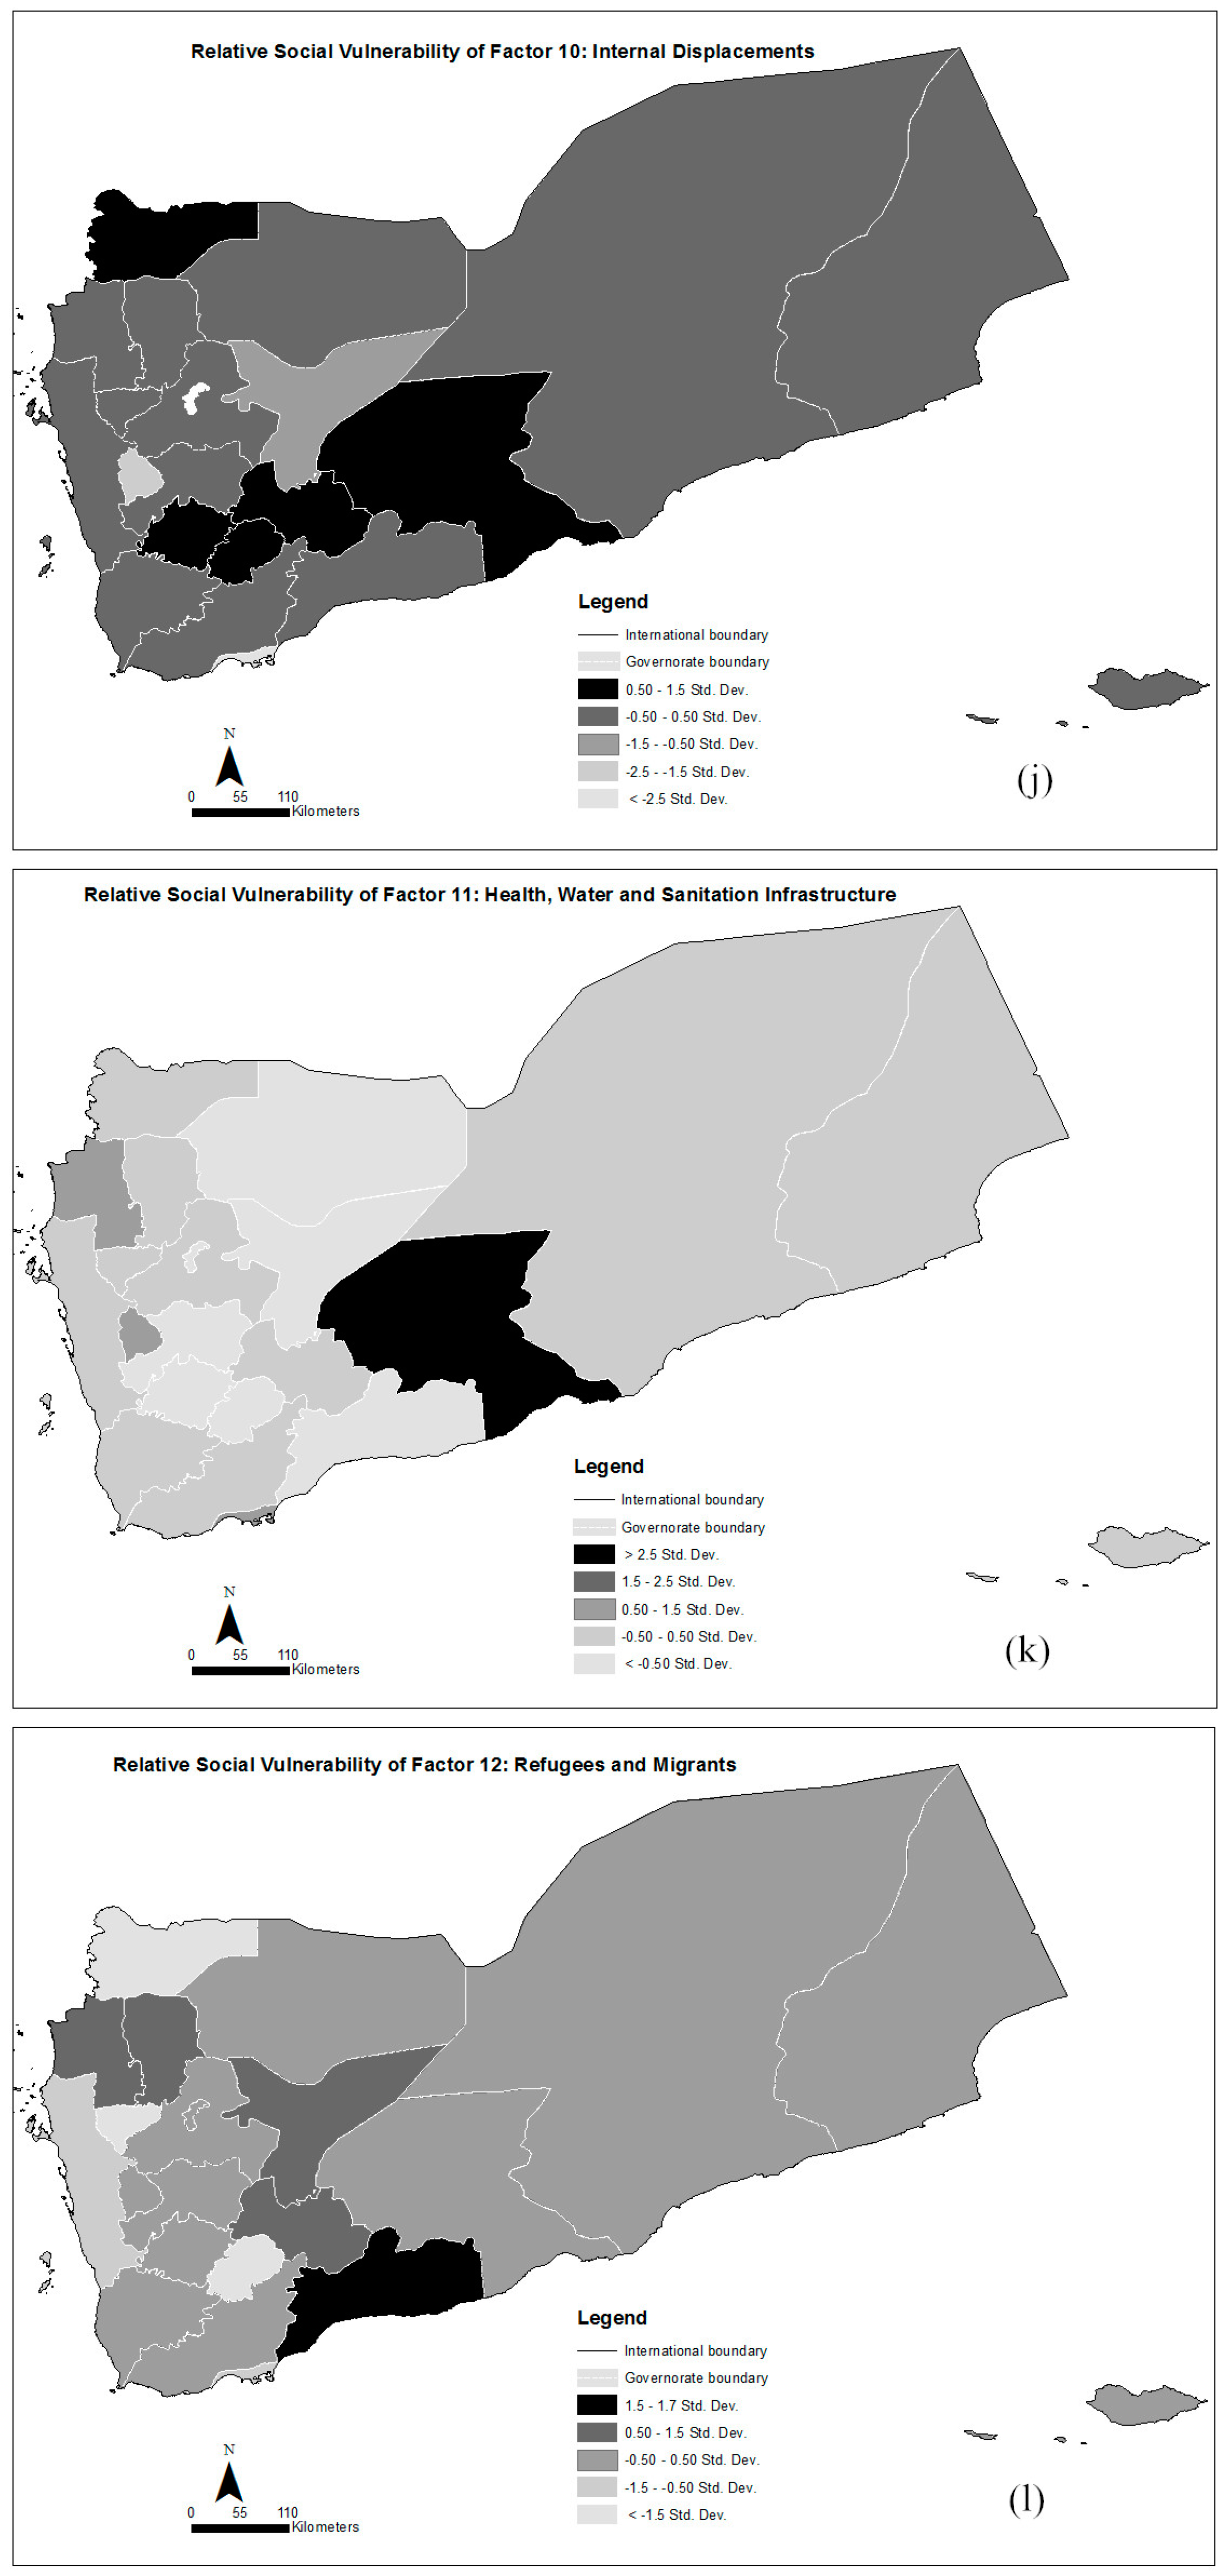
Figure 4.
Spatial distribution and levels of social vulnerability for the different factors. (
a) Education; (
b) Basic Services; (
c) Social Welfare; (
d) Poverty and unemployment; (
e) Housing and Illiteracy; (
f) Special Groups; (
g) Adequate Water Sources; (
h) Infrastructure; (
i) Child Mortality and Health; (
j) Internal Displacement; (
k) Health, Water and Sanitation Infrastructure (
l) Refugees and Migrants. Governorate names are available from
Figure 2 and
Figure 5.
Basic Services: The second underlying factor relates to a lack of basic services. The findings agree with present narrative of the underlying causes of vulnerability in Yemen in the humanitarian discourse. In humanitarian emergencies, such as the Yemen crisis following the airstrikes of 26 March 2015, basic services in the areas of electricity, clean water, rule of law and governance have collapsed. These have increased the vulnerability of the population. This factor explains 15.6% of the variance in the governorates. All governorates are generally affected, except Sana’a, the capital city. The most vulnerable includes Hajjah in the west, Al Jawf in the north and Raymah in the west (
Figure 4b).
Social Welfare: The third underlying factor relates to governorates with higher populations on social welfare funding support. Recipients of the social welfare are categorized by the government as the poorest. In humanitarian emergencies, such as the 26 March Yemen war, the social welfare fund becomes suspended, leaving thousands of beneficiaries without the needed livelihood support. Households that benefitted from the fund may find it difficult to cope with the crisis. They may not be able to relocate to other safe governorates as they lack the means to do so. They may also find it difficult to recover even after the crisis. This result also agrees with the present narrative of the underlying causes of vulnerability in Yemen. This factor explains 8.6 percent of the variance in the governorates. The most vulnerable are coastal governorates of Hajjah, Hudaydah, and Taizz, and include Ibb in the west (
Figure 4c).
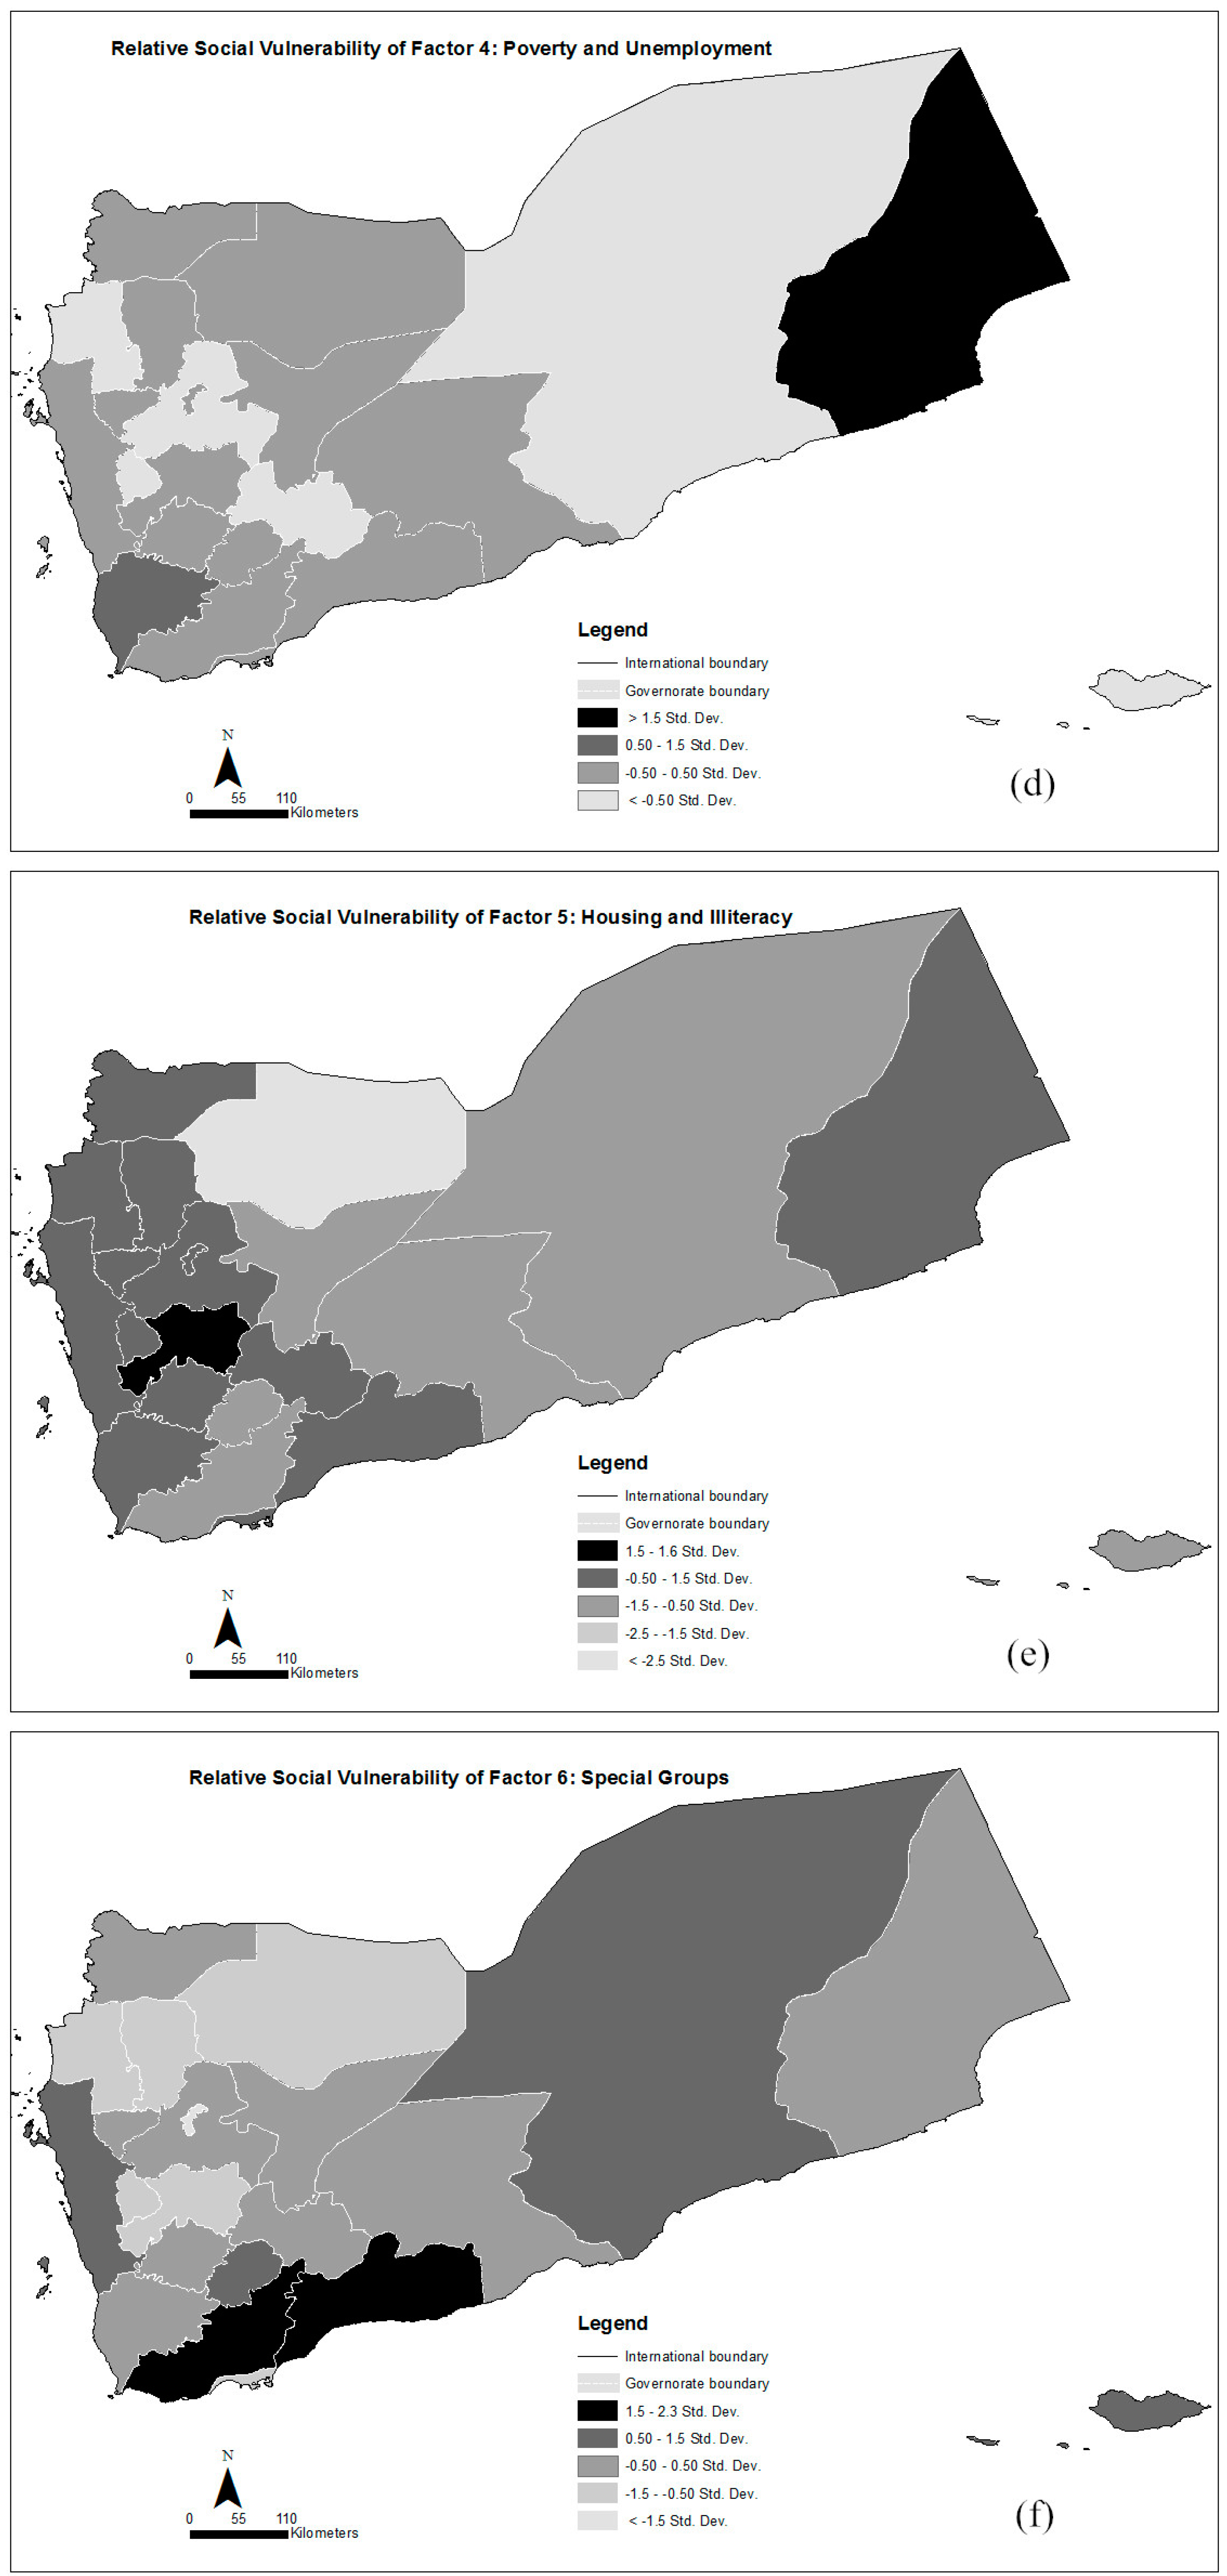
Poverty: The fourth factor, poverty and unemployment, explains 8.0% of the variance in the governorates. Governorates with high poverty rate and higher unemployed population will be highly vulnerable in a humanitarian crisis. The World Bank describes Yemen as the poorest compared to other Middle Eastern countries, with 37.3% of Yemenis living in poverty (less than US$2 per day). Poverty is a determining factor of vulnerability during humanitarian emergencies as poor families are severely impacted. There are limited opportunities for Yemenis in improving their poverty level. Wealth enables communities to cope with humanitarian emergencies through social safety nets, insurance and other entitlement programs [
6]. The most vulnerable governorates are Al Maharah in the east and Taizz in the south-west (
Figure 4d).
Housing and Illiteracy: The quality of housing is an indicator of the state of the economy of a governorate, which may have consequences on its recovery state after an emergency. The fifth underlying factor relates to poor housing and a higher percentage of illiteracy. This factor explains 6.6% of the variance in the governorates. All governorates are greatly affected except Al Jawf (
Figure 4e). There is a correlation between illiteracy population and the quality of houses they occupy. Their illiteracy may limit their chances of getting better jobs with most involved in manual jobs, which may be severely affected during the emergency.
Special Groups (Children and the Elderly): Two of the demographic groups that are mostly affected by humanitarian emergencies are the elderly (60 years and above) and children under five years, and these are represented in the sixth factor. The elderly may be sick or having mobility constraints, making them dependent on other members of the family who may be struggling themselves. The elderly may find themselves marginalized from decision making that may affect them [
52]. Children, together with women, make up the bulk of refugees and internally displaced populations caused by war [
53]. This factor explains 6.6% of the variance in the governorates and correlates with narratives on vulnerable groups in Yemen and in other disaster situations [
6,
26,
46,
54]. The most vulnerable are Lahj, Abyan, Hudaydah, AL Dhale’e, and Hadramaut (
Figure 4f).
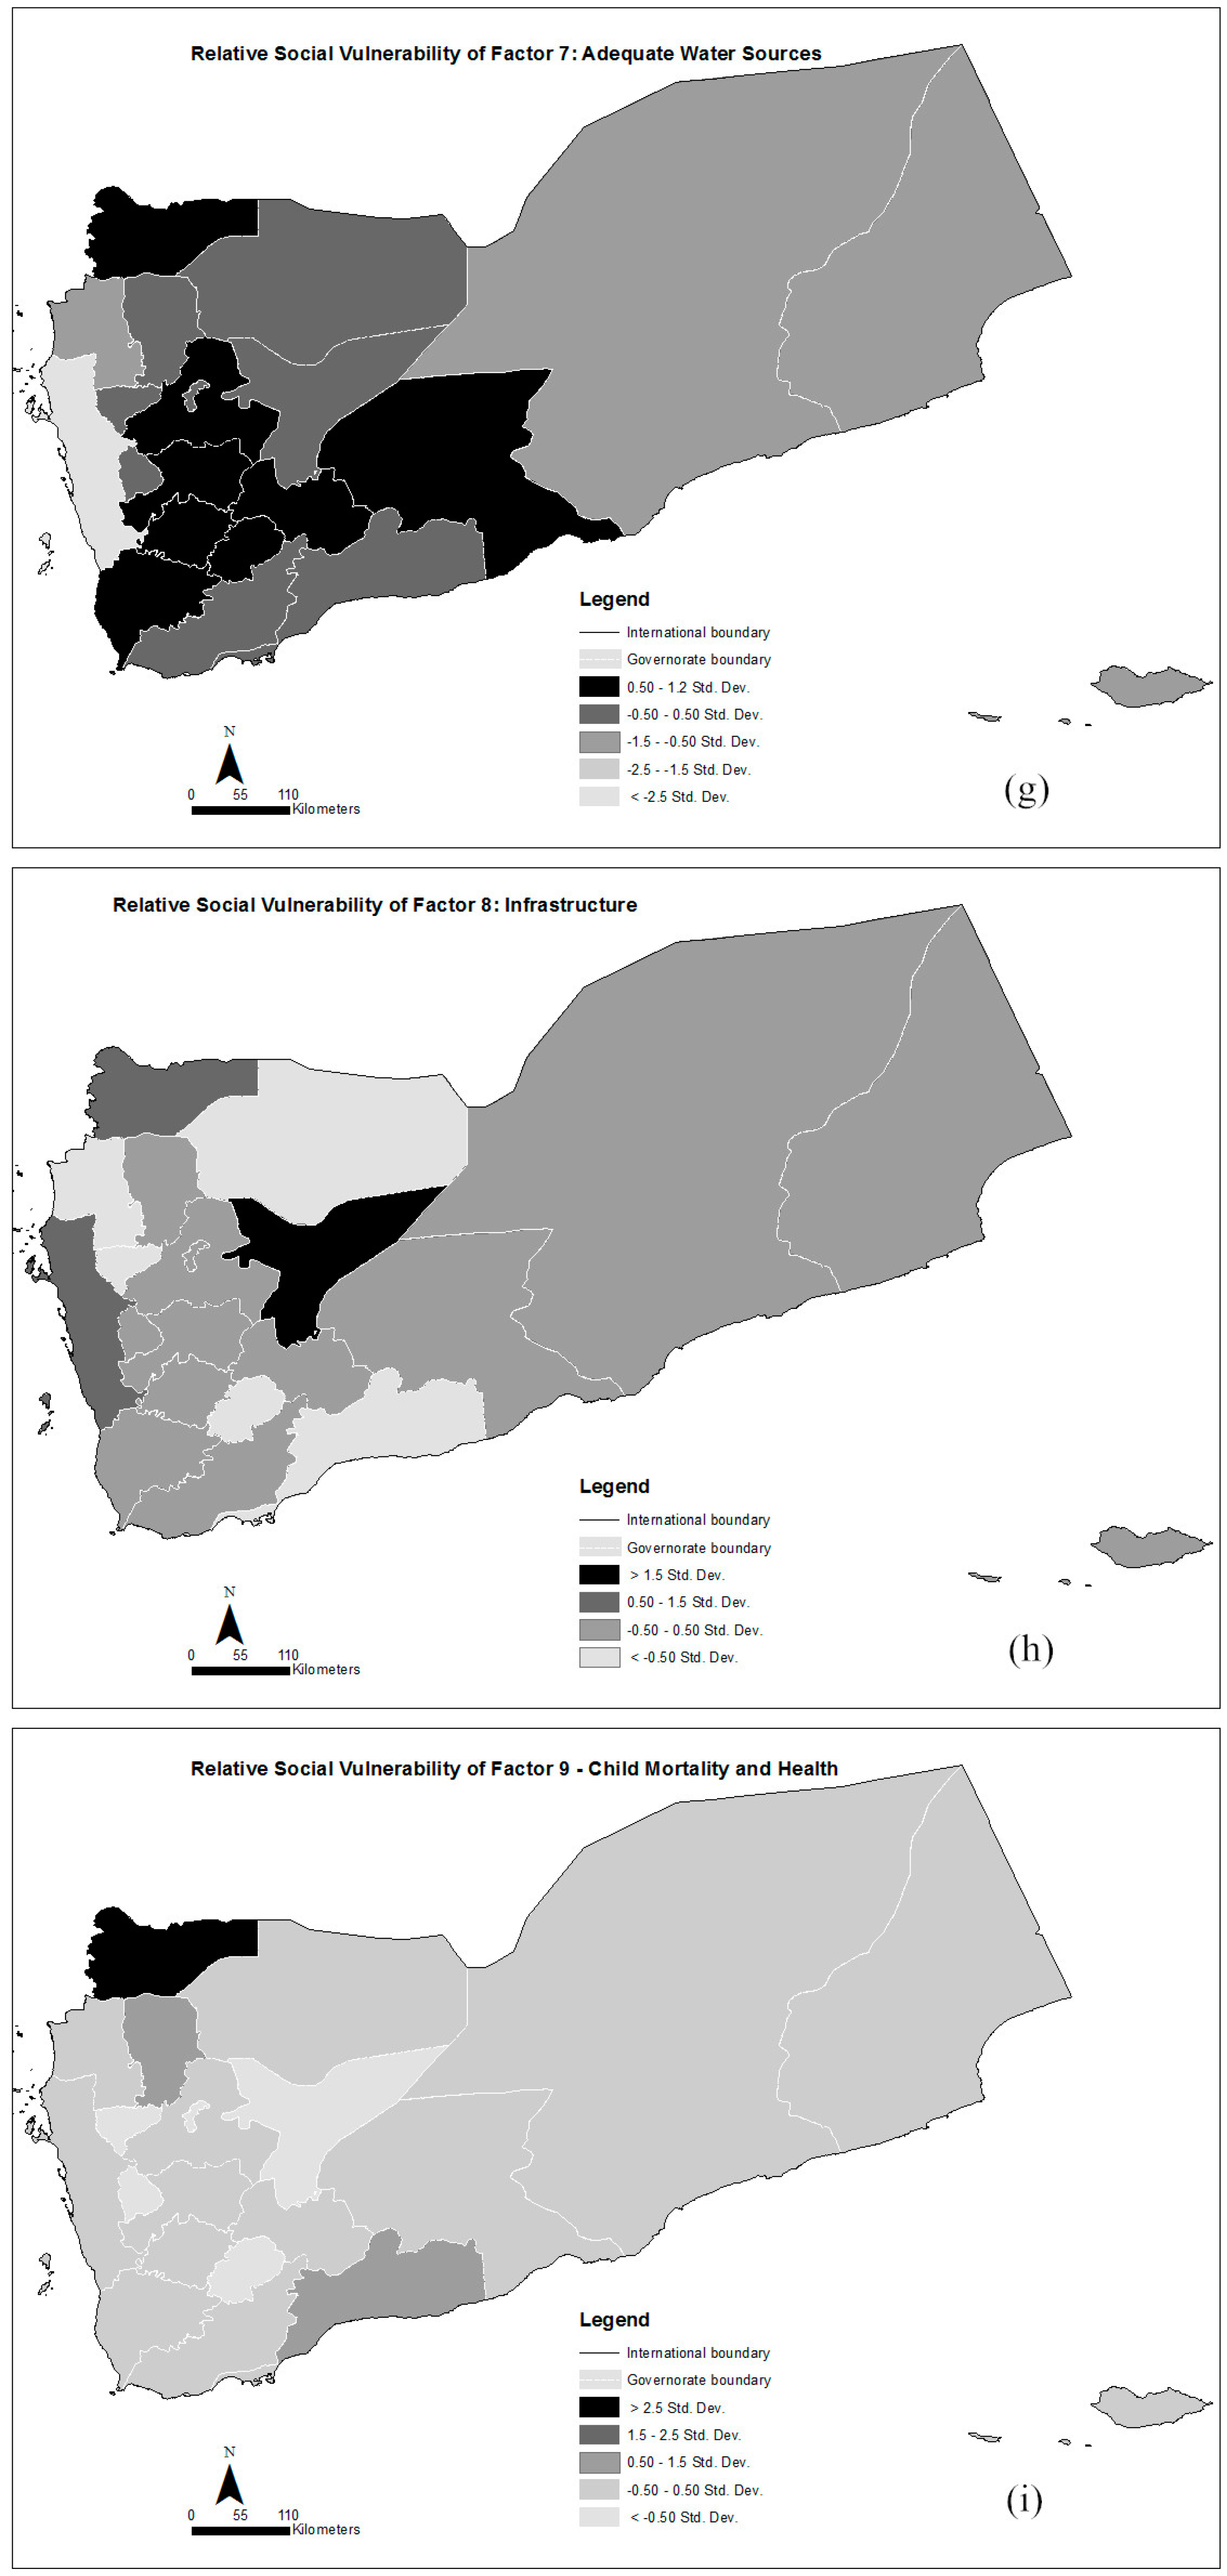
Water Sources: Access to adequate drinking water and sanitation are critical demands in humanitarian emergencies. Lack of adequate drinking water has been cited as a contributing factor for most of the mortality during humanitarian emergencies [
55]. The current humanitarian emergency in Yemen due to the bombing by the coalition forces and internal armed clashes has seen water trucking collapse due to a lack of fuel, with hospitals and health centers without running water. The seventh factor of inadequate water sources explains 6.3 percent of the variance in the governorates. All governorates are generally affected except Hudaydah, Hajjah, Hadramaut and Al Mahara (
Figure 4g). The Yemen humanitarian crisis has over 13 million people that require access to clean water and sanitation.
Infrastructure (buildings, hospitals): The eighth factor is inadequate infrastructure in terms of buildings, hospital facilities, sanitation and health. Lack of adequate buildings is indicative of a growing proportion of the Yemen population inhabiting poor quality buildings such as huts. Yemen is one of the poorest countries in the Middle East. It has two physicians per 10,000 people (2003–2012) compared to Jordan with 25.6 [
56]. As a percentage of GDP, Yemen’s health expenditure is 5.5% compared to Jordan with 8.4%. The 26 March 2015 war in Yemen has witnessed bombings leading to collapse of many of the buildings and near collapse of the hospitals and sanitation. This factor explains 6.1% of the variance in the governorates. The most vulnerable are Marib, Sa’ada and Hudaydah (
Figure 4h).
Child Mortality and Health: The ninth factor (child mortality and health) explains 5.3% of the variance in the governorates. Compared to other Middle Eastern countries, such as Iraq, Jordan, Oman and Syrian Arab Republic, using 2003 to 2012 data, Yemen has the highest infant and under five mortality in the region [
56]. Child mortality is highest in humanitarian emergencies due to poor care, lack of adequate nutrition, dehydration, diarrheal and water borne diseases [
55,
57]. The under-five mortality, child mortality, and diarrheal infections loaded positively on this factor. Governorates with high under five and child mortality compounded by diarrheal infections have relatively high vulnerability to humanitarian crisis. The most vulnerable are Sa’ada, Amran and Abyan (
Figure 4i). These three governorates have also witnessed conflict in the past few years.
Internal Displacement: The United Nations Refugee agency (UNHCR) reports that the recent crisis has led to over 1 million Internally Displaced Persons (IDPs) moving from governorates and districts characterized by frequent bombings and violent armed clashes to other areas perceived to be calm. Internal displacement explains 5.2% of the variance in the governorates. Most of the IDPs stay in camps, public buildings and schools. However, many also stay with the host communities, most of whom are relatives. Over the years, the coping strategies of host communities harboring IDPs have diminished considerably, further adding to the vulnerability in these governorates. All governorates are generally affected except Raymah and Marib, with Sana’a City the most vulnerable (
Figure 4j).
Health, Water and Sanitation Infrastructure: Health, Water and Sanitation Infrastructure explains 4.6 percent of the variance in the governorates. Health care providers, health facilities and access to water are important during a humanitarian crisis and even post-crisis. During humanitarian emergencies, these facilities are significantly affected, contributing to people’s vulnerability. The most vulnerable are Shabwah, Hajjah, Raymah and Aden (
Figure 4k).
Refugees and Migrants: The twelfth factor, relating to Refugees and Migrants, explains 3.4% of the variability in governorates. The most vulnerable governorates are Abyan, Hajjah, Amran, Marib and Al Bayda (
Figure 4l). Yemen hosts about 243,000 refugees, most of them from Somalia. At the end of December 2014, about 92,000 migrants, mostly from the Horn of Africa, crossed into Yemen. Hajjah hosts over 20,000 Ethiopian stranded migrants hoping to cross into the Kingdom of Saudi Arabia.
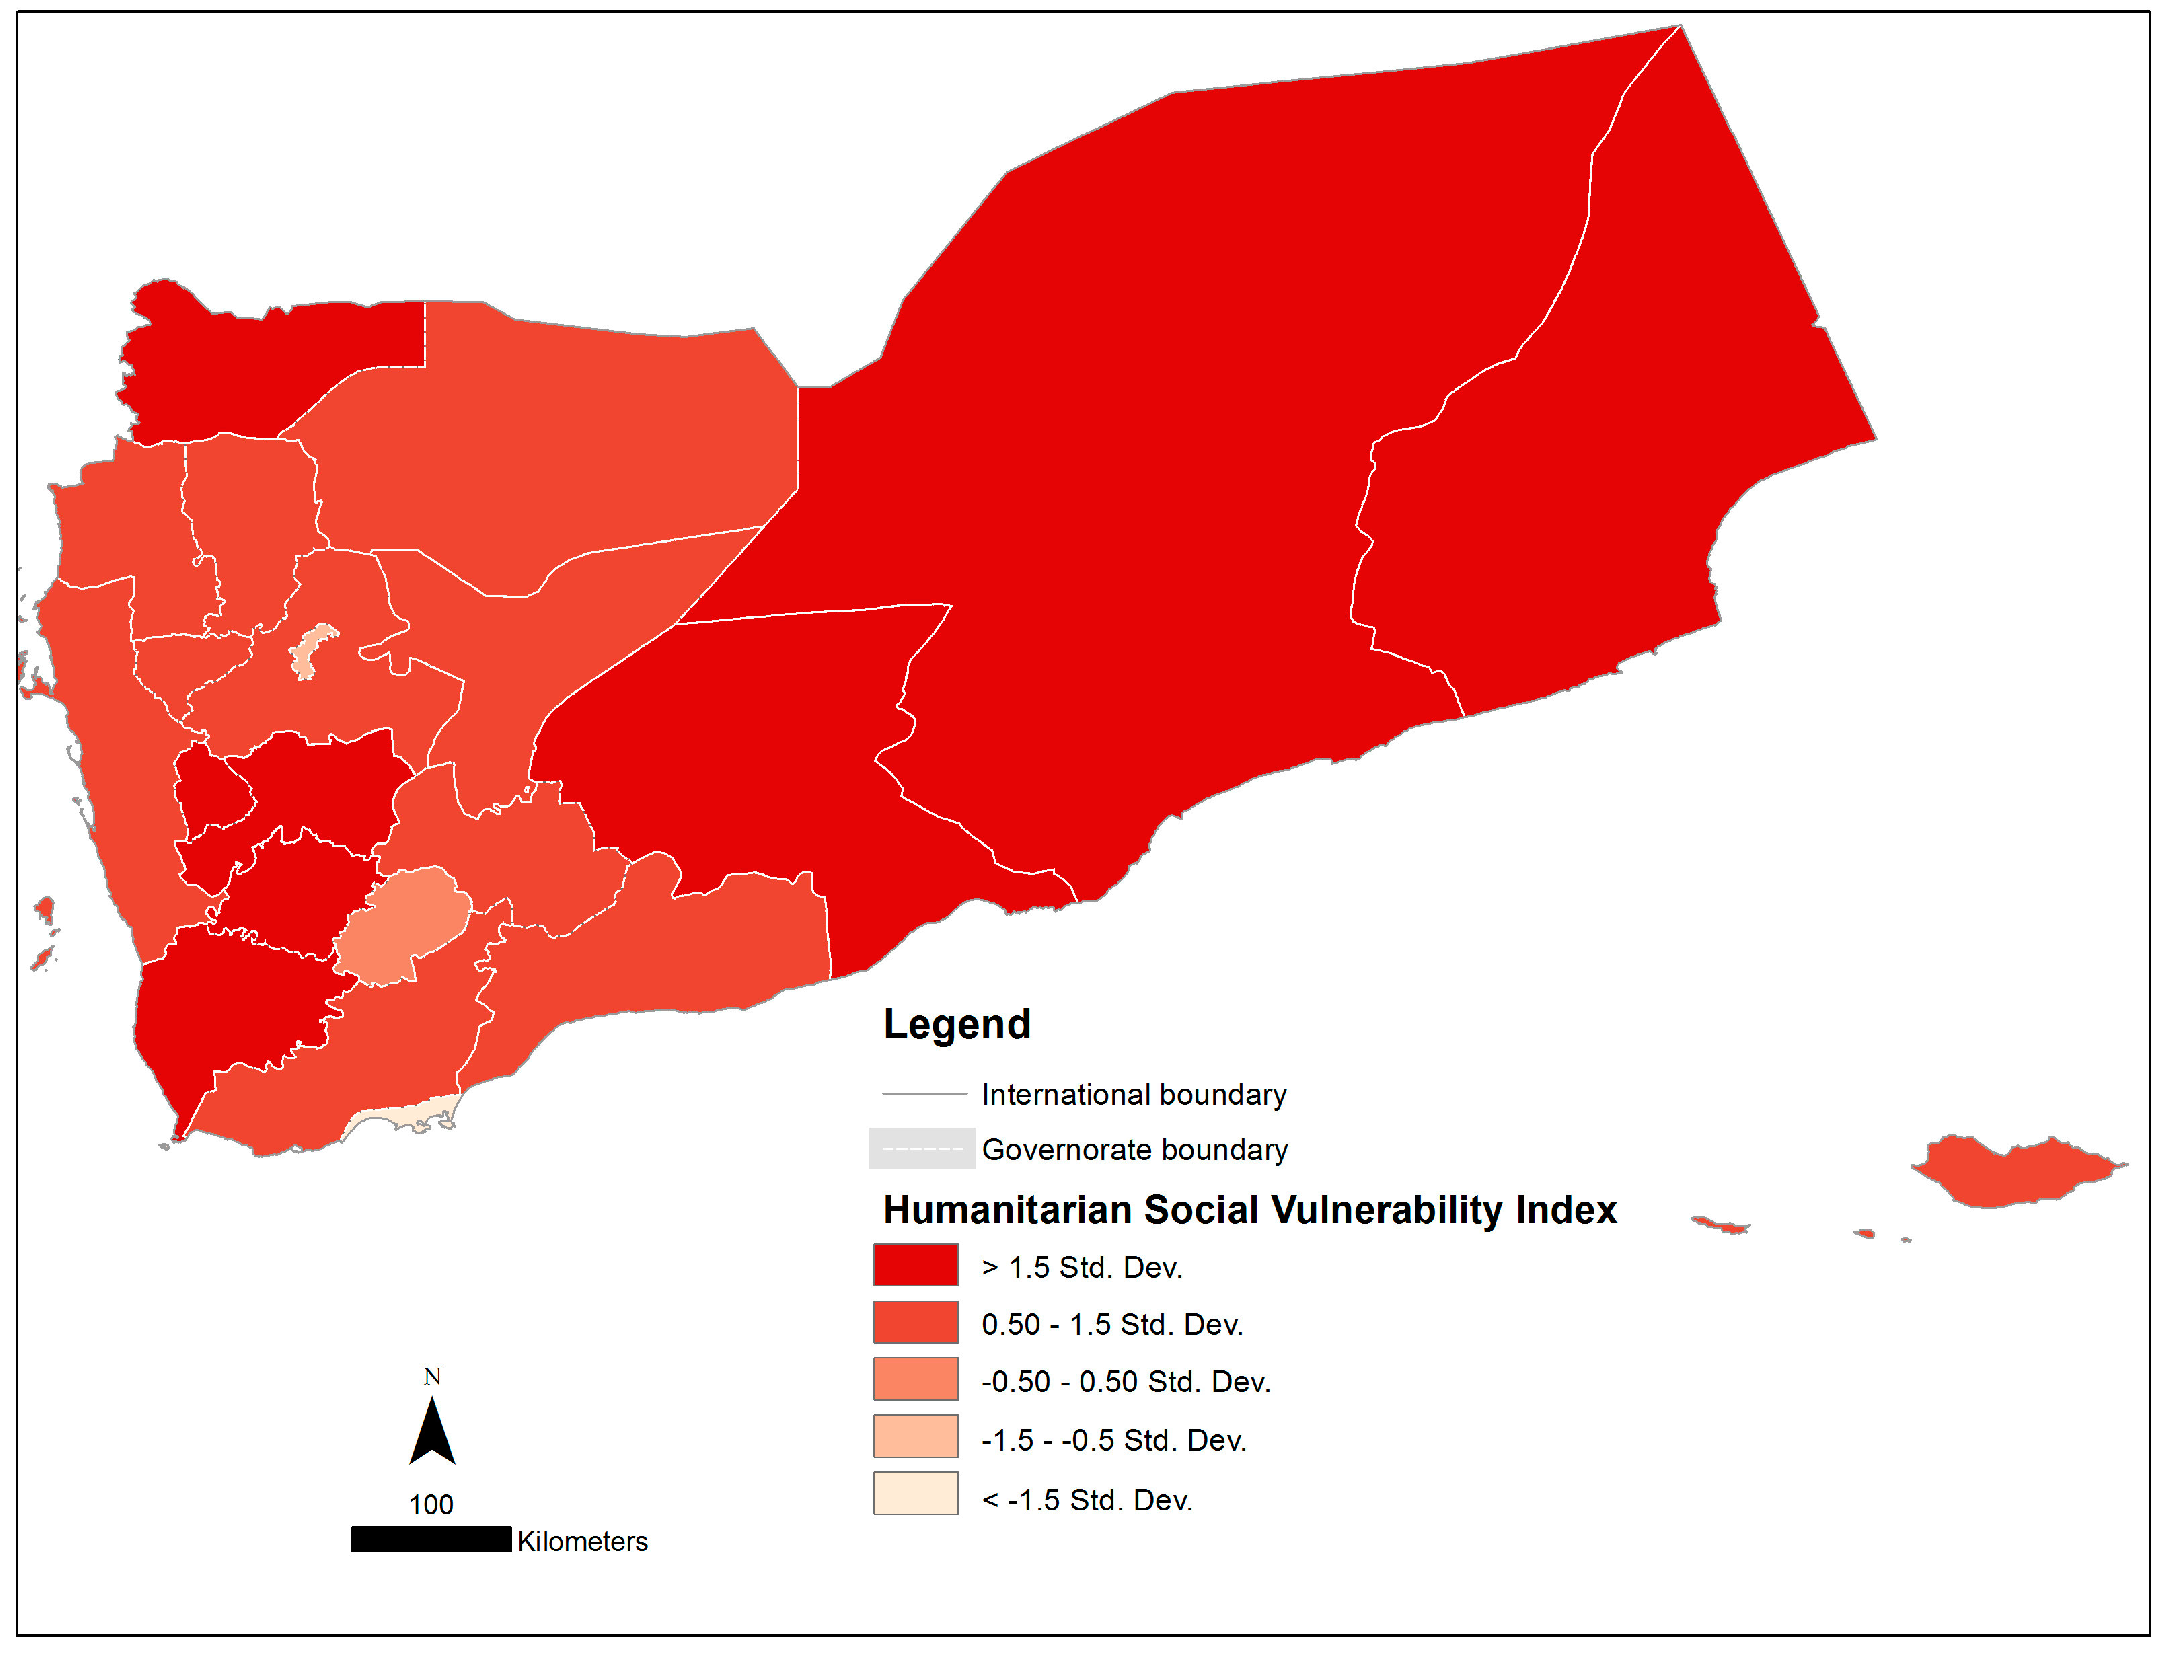
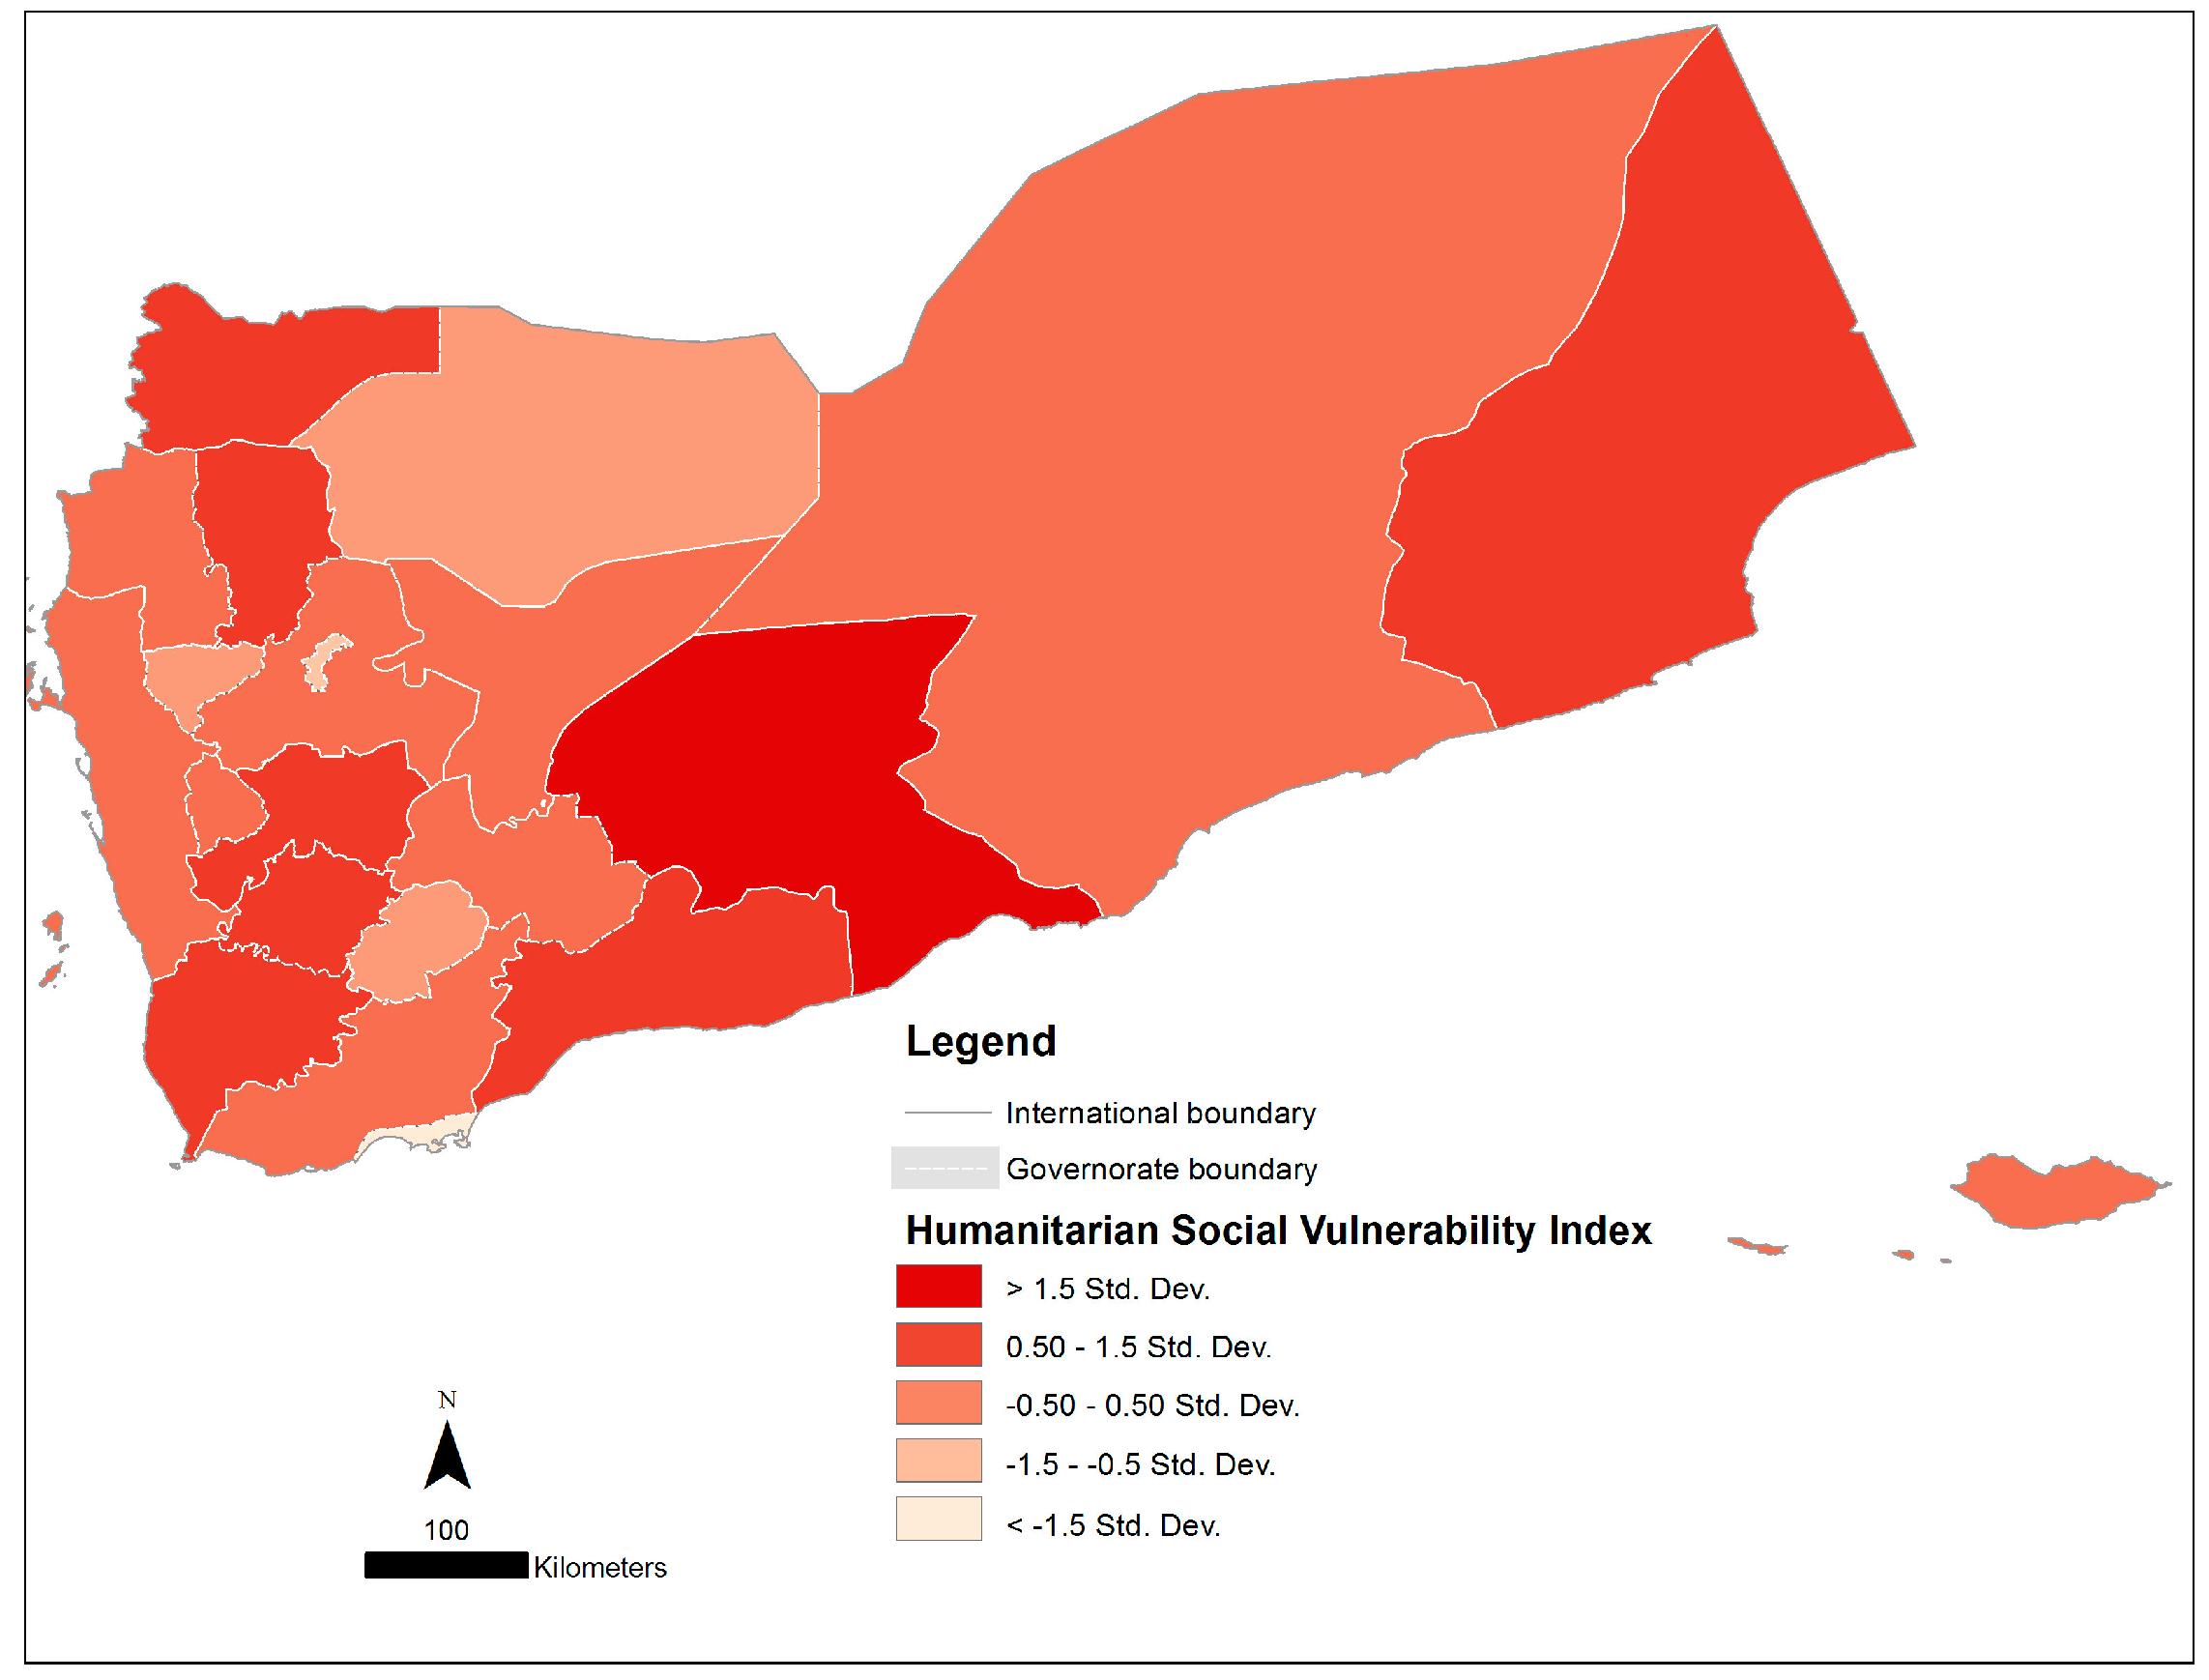
The overall calculated social vulnerability (SoVIHC) ranges from −0.7 to 0.42, with a mean vulnerability score of −0.00048 and standard deviation of 0.28 (
Figure 5). There is a notable coastal and conflict dimension to social vulnerability of governorates to humanitarian crisis in Yemen. The most vulnerable governorates include Sa’ada and Amran in the north, Taizz in the southwest, Dhamar and Ibb in the central part, Abyan and Shabwah in the south and Al Mahara in the east of the country. Half of these are coastal (Taizz, Abyan, Shabwah and Al Maharah) and the others are mountainous (Sa’ada, Amran, Dhamar and Ibb), but also not far from the coast. With the exclusion of Taizz and Al Maharah, these vulnerable governorates have experienced conflicts, armed clashes and violence in the past few years. Between 2004 and 2010 the government of Yemen fought six wars with the Al Houthi tribes of Sa’ada governorate, leading to the displacement of over 300,000 persons [
14]. Most of the IDPs moved to Hajjah and Amran. In Hajjah, thousands of IDPs have lived in camps since 2004 in deplorable conditions that lack most of the basic services.
Figure 5.
Social Vulnerability Index to Humanitarian Crisis of governorates in Yemen (unweighted).
Figure 5.
Social Vulnerability Index to Humanitarian Crisis of governorates in Yemen (unweighted).
For a very long time, Sa’ada governorate has been without the presence of a strong central governing authority, with the Houthi’s as de-facto authorities. Limited employment opportunities and strict control by Houthies have left the governorate one of the most vulnerable in the country. Sa’ada is also one of the worst affected since the beginning of the war on 26 March 2015.
Most of the governorates of Yemen exhibit moderate levels of social vulnerability (
Figure 5). These are mostly found in the west, central part and extend to the south, with the sole governorate of Hadramaut in the east. Sana’a City (Amanat Al Asimah), Al Mahwit, Al Dhale’e and Al Jawf exhibit the least social vulnerability (
Figure 5).
In addition to conflict, the most vulnerable and moderately vulnerable governorates are characterized by weak governance, severe lack of basic services, high illiteracy, extreme poverty and limited livelihood opportunities to cope with the humanitarian crisis [
2,
3,
16]. These underlying drivers of vulnerability are consistent with the derived 12 factors that influence social vulnerability to humanitarian crisis of governorates in Yemen.
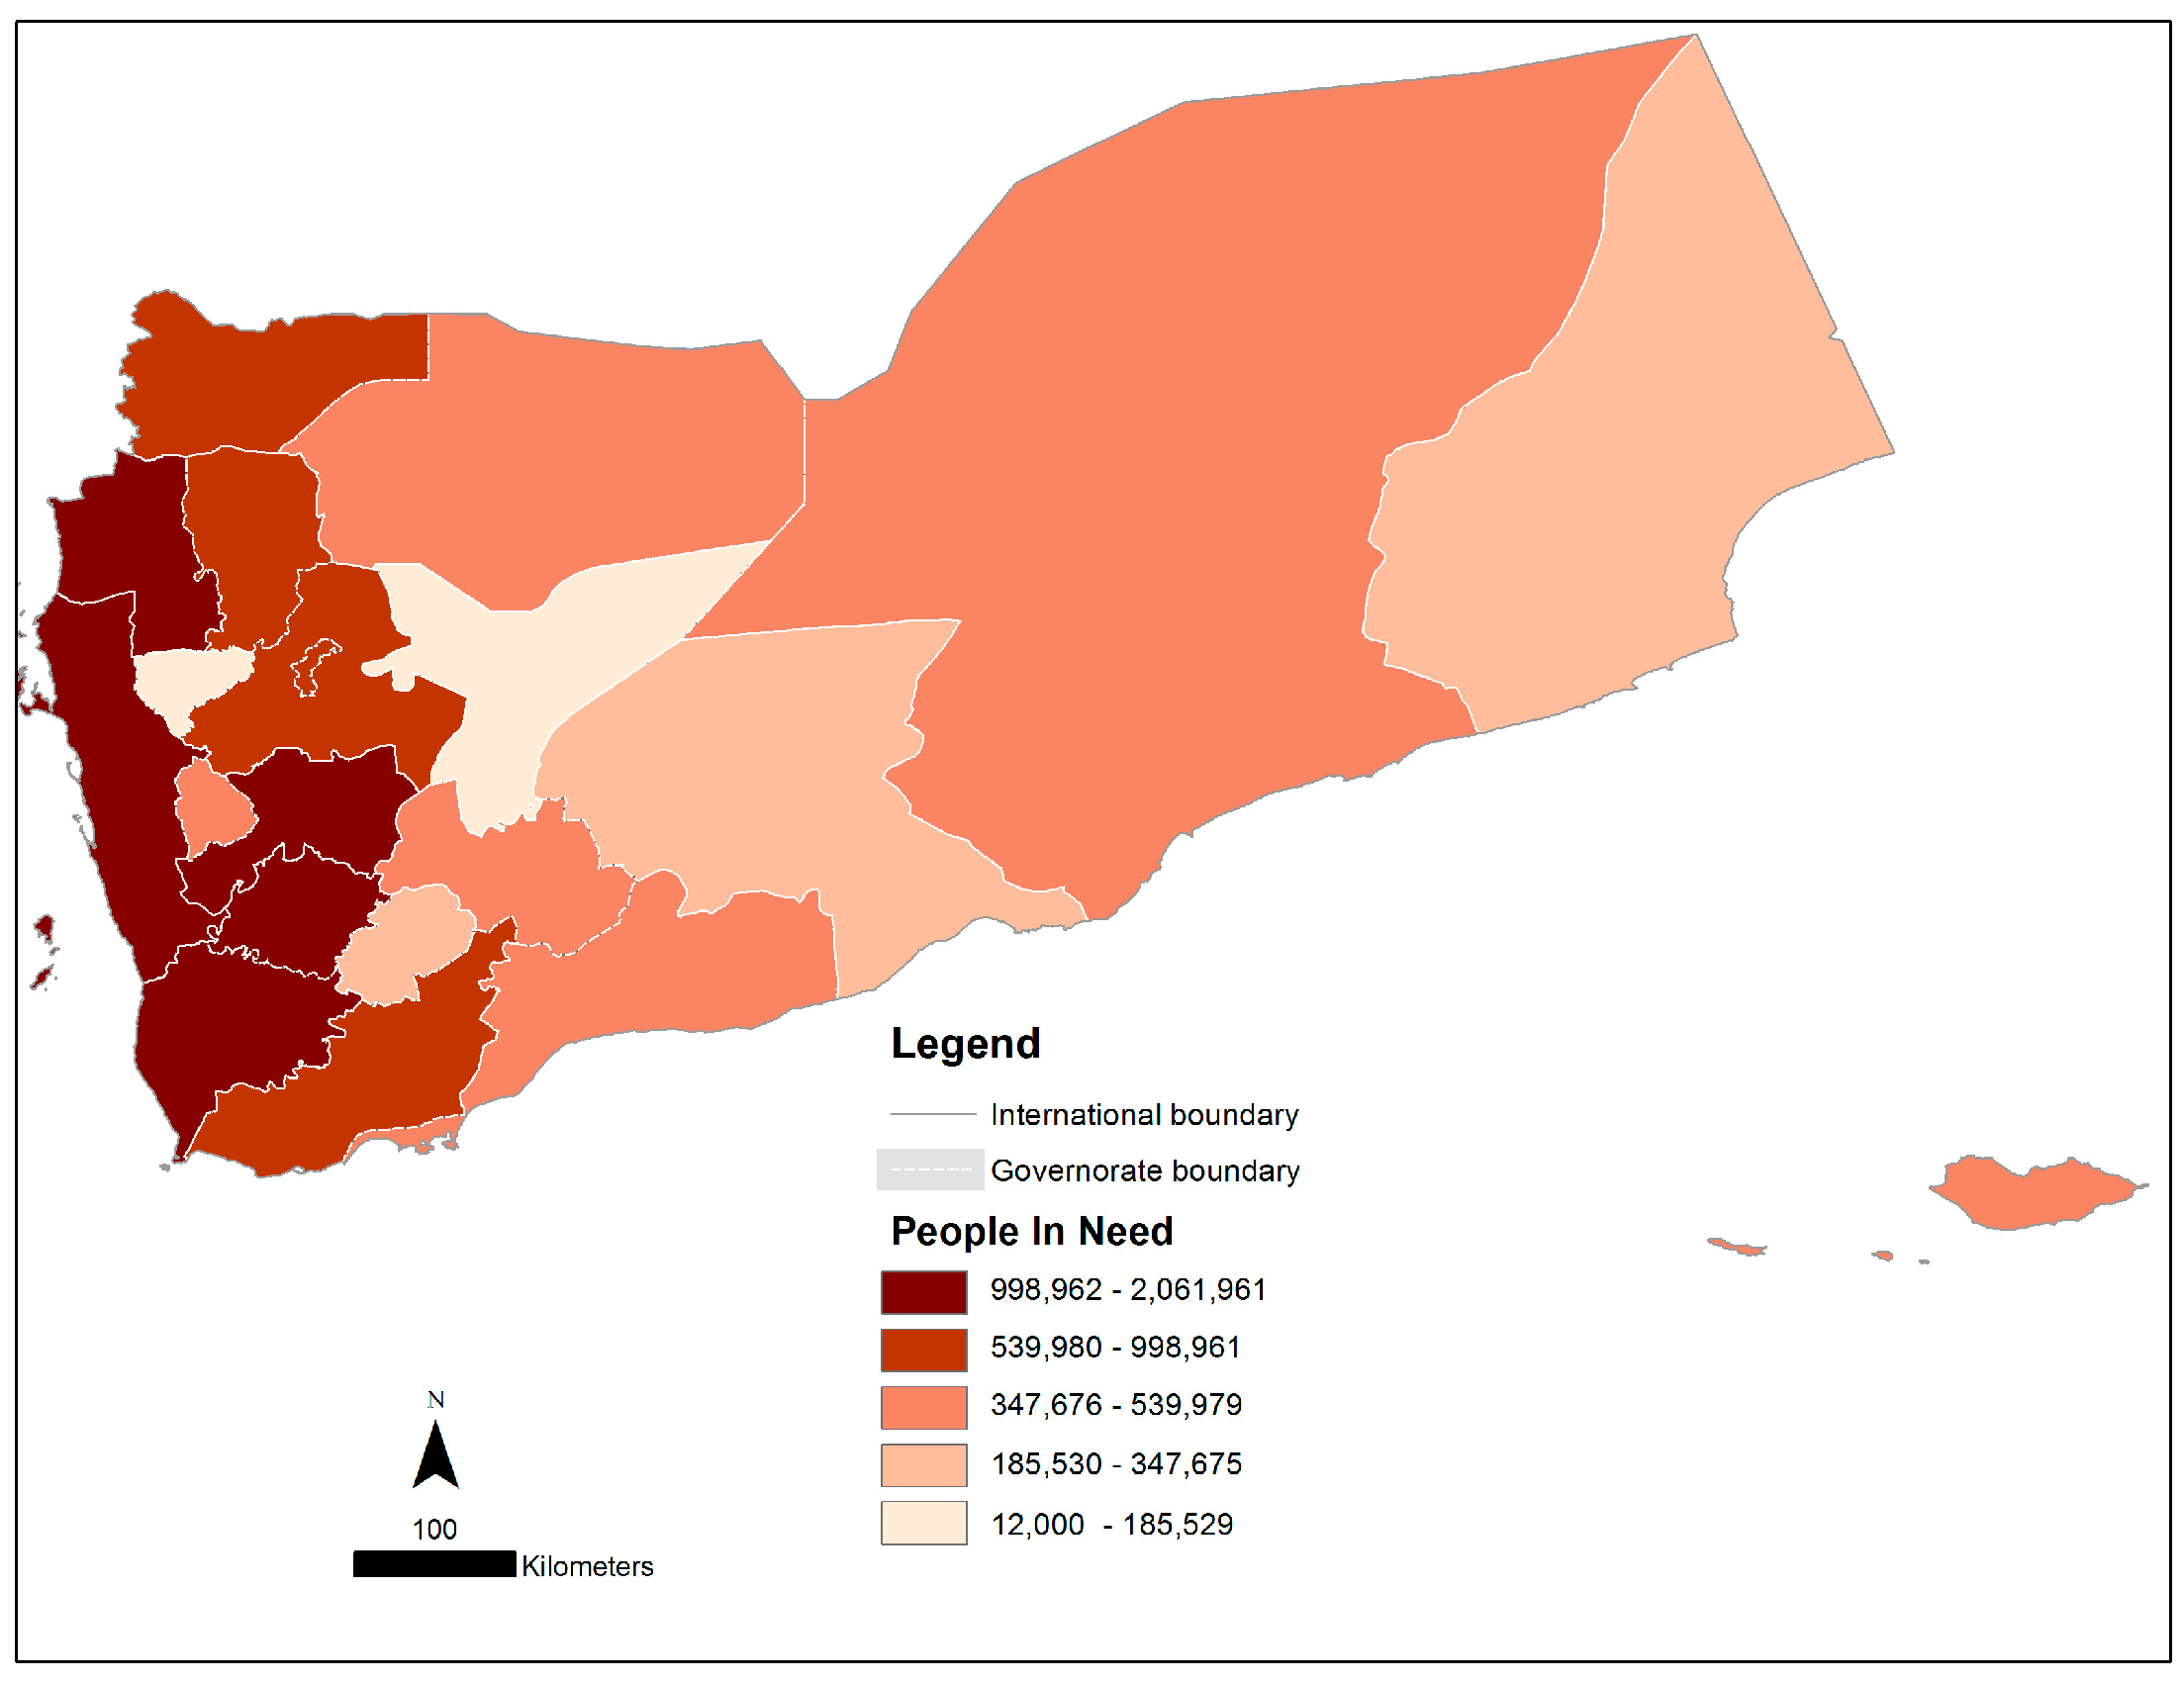
To test the robustness and usefulness of the SoVIHC, we compared the mapped SoVIHC to the Humanitarian Needs map of the 2015 Yemen Humanitarian Programme Cycle (
Figure 6). Visually there are correlations between some of the governorates such as Taizz, Ibb and Dhamar, which exhibit very high social vulnerability (
Figure 5) and at the same time with a very high number of people in need (
Figure 6). However, this is not the case for most of the other governorates. Al Mahara and Shabwah, two of the governorates with very high relative social vulnerability index have a low number of people in need. To further test this relationship, we conducted a simple correlation between the social vulnerability index and the 2015 humanitarian needs. There is a weak but positive relationship (
r = 0.19, S = 0.4). This finding shows that social vulnerability does not necessarily correlate with current humanitarian needs.
Figure 6.
2015 Population in needs in governorates in Yemen.
Figure 6.
2015 Population in needs in governorates in Yemen.
Figure 7.
Social Vulnerability Index to Humanitarian Crisis of governorates (weighted).
Figure 7.
Social Vulnerability Index to Humanitarian Crisis of governorates (weighted).
Comparing the spatial variability between the unweighted and weighted SoVIHC (
Figure 5 and
Figure 7), there is broad agreement between the two mapping methods except in the governorates of Amran, Abyan, Al Jawf, Al Mahwit, and Hadramaut.
4. Conclusions
A number of humanitarian crises have risen in the last decade [
9] with consequences of increase in vulnerability of people and places. Although the link between social vulnerability and humanitarian crisis is understood, yet very little has been done, particularly in the area of its assessment to understanding the underlying factors that contribute to an increase or decrease of it in Yemen.
In this study, we used GIS to bring together socio-economic data that represent the underlying determinants of social vulnerability of governorates of Yemen to create a spatial index that measures social vulnerability towards humanitarian crisis. GIS was used to create a spatial index for each of the twelve underlying factors of social vulnerability. Using GIS we also mapped the social vulnerability index and the twelve factor indices to reveal the spatial distribution and variability of social vulnerability, thus contributing to our understanding of the geography of vulnerability in Yemen.
In this study, socio-economic and demographic data at governorate level for Yemen of mostly 2012 was used to construct a relative ranking of social vulnerability to humanitarian emergencies. Using data-reduction techniques and a GIS, a methodology to identify, rank and determine the underlying factors influencing social vulnerability to the humanitarian emergencies was developed. Using SoVIHC, the 22 governorates of Yemen were ranked based on their social vulnerability, putting Sa’ada and Amran in the north, Taizz in the southwest, Dhamar and Ibb in the central part, Abyan and Shabwah in the south and Al Mahrah in the east as the most vulnerable governorates. The SoVIHC index also ranked Al Jawf in the north, Al Mahwit in the west, Sana’a City in the center and Al Dhale in the south as the least vulnerable governorates. Our findings reveal that the differences in social vulnerability between the governorates are primarily driven by twelve factors, of which education, lack of basic services in health, water and sanitation, electricity, quality housing, poverty, limited livelihood opportunities, weak governance, and internal and external displacement are major determinants of social vulnerability to humanitarian crisis. This finding also shows that conflicts and armed clashes also contribute to social vulnerability of governorates in Yemen. These drivers of social vulnerability are consistent with the underlying drivers of vulnerability in the humanitarian crisis in Yemen [
1,
2,
15]. The SoVIHC method used here provides a means of characterizing the multivariate nature of the social vulnerability of governorates of Yemen, identifying and mapping those governorates with greater susceptibility to humanitarian crisis. The study shows that social vulnerability of the governorates of Yemen to humanitarian crisis is not evenly distributed.
The results of the social vulnerability analysis and the maps provide empirical evidence in addressing the objectives of the study. Using the SoVIHC method, context relevant underlying factors influencing social vulnerability have been derived at governorate level. The derived factors are consistent with the literature for vulnerability studies conducted at local scales [
6,
36,
58].
The SoVIHC method identifies the underlying dimensions of social vulnerability from a large set of socioeconomic data and reduces the original dataset to a smaller set of factors based on intercorrelated variables. We recognize that the derived social vulnerability indices are judged based on the input variables, the methodological choices made and the rigorous data reduction process. We also recognize that due to data limitation, indicators like remittances, female-headed households and population of minorities in each of the governorates were not captured. It is also important to point out that in naming the derived underlying factors and interpreting them, some element of subjectivity may have been introduced [
49]. The study does not identify which Yemeni individuals will be most affected during the humanitarian crisis and their location in the governorates, however, it can throw light on which governorates with relatively higher vulnerability will be affected and pinpoint the underlying causes of their vulnerability. This information is particularly important for planning response-based needs of people bearing in mind their vulnerability. It is also important for vulnerability reduction to humanitarian crisis as it enables authorities to identify governorates and populations that require vulnerability and risk reduction, mitigation and adaptation. Knowledge of the underlying determinants of social vulnerability to humanitarian crisis and the geographies will enable development of policies and plans that are context driven. The conflict, armed clashes and war should be ended for any meaningful development to take place. Poverty as a determinant of social vulnerability can be addressed within the framework of poverty reduction, and increasing job and other livelihood opportunities. Education has been revealed as another determinant of social vulnerability. The government and the international community should undertake efforts to increase school enrolment. The government should embark on ensuring basic services are provided with access to affordable health, clean water and electricity to all to stimulate the economy. Embarking on these will contribute to reducing vulnerability to humanitarian crisis.


