1. Introduction
OpenStreetMap (OSM) is a collaborative mapping project founded in London (UK) in 2004. With the project, private citizens create freely accessible spatial data, which can present an alternative to official data [
1]. Today, OSM is a very popular project and for certain applications it “has become a potential competitor to public and commercial geodata providers” [
2], at least in terms of accuracy of the position of objects [
3].
User-generated or crowdsourced geoinformation, also known as Volunteered Geographic Information (VGI) [
4], can enhance geographic data and the knowledge about or understanding of the environment. Nonetheless, concerns about the quality and value of these data exist [
5]. Typically, the contributors of VGI are non-experts; they may be unqualified, untrained volunteers focusing on their fields of interest, and in case of OSM, the users can modify or edit features immediately after registration [
1,
5,
6,
7].
Heipke [
8] points out the benefits user-generated data yields due to the incorporation of local knowledge. Indeed, utilizing user-generated OSM data can be beneficial; it is cost-free and enables the use of potentially up-to-date data at any time. Additionally, OSM can easily be shared under its “Open Data Commons Open Database License (ODbL)”. In contrast, authoritative data are often costly and the use and sharing of data are usually restricted. Furthermore, updates of authoritative data are commonly associated with further costs.
As already mentioned, it is essential to address the quality of VGI data. In order to do this, the fitness-for-use concept has been described “as the closeness of the agreement between data characteristics and the explicit and/or implicit needs of a user for a given application in a given area” [
9]. Spatial data quality can be defined through several quality characteristics, and standards are available for describing them. Quality principles for geographic information were previously described in the standards ISO 19113 [
10] on quality principles and ISO 19114 [
11] on quality evaluation procedures. Both standards were later revised and conflated in ISO 19157 with the title “Geographic information-Data quality”. ISO 19157 [
12] outlines six data quality elements: Completeness, Thematic Accuracy, Logical Consistency, Temporal Quality, Positional Accuracy, and Usability Element. In this work, the focus is on completeness, defined as “the presence and absence of features, their attributes and relationships” [
12] as well as on classification correctness; a data quality element of thematic accuracy.
One of the first systematic attempts to assess OSM quality was conducted by Haklay [
6]. The author compared the OSM data with an Ordnance Survey dataset by analyzing the positional accuracy and completeness of the road network based on methods developed by Goodchild and Hunter [
13] and Hunter [
14]. Girres and Touya [
15] extended this work to the French OSM dataset by using several quality parameters including the attribute accuracy. The authors show the advantages of flexibility and responsiveness of the data, as well as the disadvantage of heterogeneity in the OSM dataset. Several authors have developed further methods and tools in order to address the quality of OSM data. Graser
et al. [
16] presented a freely usable tool consisting of models and algorithms to evaluate the quality of street networks by addressing positional accuracy, network length and attribute completeness. Ludwig
et al. [
17] compared the German street network of OSM with Navteq by automatically matching road objects, and Zielstra and Zipf [
18] analyzed the completeness of the road network comparing OSM and TeleAtlas. The result of the latter study showed that “freely available data provided is not yet a sufficient replacement for the proprietary TeleAtlas data” [
18]. Helbich
et al. [
19] investigated the positional accuracy of road junctions by also comparing OSM with TeleAtlas. Furthermore, Pourabdollah
et al. [
20] developed a method to conflate OSM and Ordnance Survey road attributes. There are several further studies addressing the quality of the OSM street networks e.g., [
2,
21,
22,
23,
24] and it has also been shown that the quality and coverage of OSM data depends on the users mapping behavior. Usually, the data are denser in urban areas in comparison to rural areas [
24].
Besides the extrinsic analyses mentioned above (where two different datasets are compared), Haklay
et al. [
3] applied an intrinsic approach, which relies on only one dataset to evaluate the spatial data quality (here positional accuracy) by taking Linus’ Law into account. With this approach, the authors were able to show that the OSM positional accuracy increased along with the number of contributors. The framework of Barron
et al. [
25] developed a set of intrinsic OSM quality analysis for describing the fitness-for-use for a set of usage types, but without focusing on LULC (land use and land cover), which is addressed in this paper. With such an approach no ground truth dataset is necessary, but the authors of [
25] remark that “absolute statements on data quality are only possible with a high quality reference dataset as a basis for a comparison.” Mooney
et al. [
26] combined intrinsic and extrinsic analyses. They investigated quality metrics to evaluate OSM data quality with or without ground-truth information.
Besides quality analyses of linear OSM features, other studies dealt with areal features. Hecht
et al., Kunze
et al. [
27,
28] and Klonner
et al. [
29] addressed the quality of buildings. They compared OSM building features with data from official sources in Germany or Austria. In Germany, a higher completeness in urban areas in comparison to rural areas was detected. However, the absolute OSM building completeness in general was low [
27]. A detailed study by Fan
et al. [
30] investigated building footprints in regard to completeness, semantic accuracy, positional accuracy, and shape accuracy by comparing OSM with ATKIS (Authoritative Topographic-Cartographic Information System). The authors concluded that the completeness of building footprints is high but that further building attributes are commonly lacking.
Even though there are many studies addressing the quality of OSM data, few focus on land use and land cover. Schoof [
31] compared OSM and the German ATKIS Base DLM land cover data in three study regions, each covering 25 km
2 in Niedersachsen, northwestern Germany. The author addressed completeness and positional accuracy for both linear and areal features. Regarding areal features the focus was on the categories vegetation and built-up areas, comparing the area sizes. The author showed that the ATKIS Base DLM has, with one exception, larger area values than OSM [
31]. Jokar Arsanjani and Vaz [
32] conducted another study focusing on land use and land cover. The authors assessed the accuracy of OSM in comparison to the Global Monitoring for Environment and Security Urban Atlas. The completeness index and kappa statistics were derived for several large metropolitan areas in Europe. The resulting kappa values strongly vary between the investigated cities. Furthermore, Mooney
et al. [
33] examine the representation of OSM features tagged as natural or land use. For instance, the authors calculated the mean distance between vertices and concluded that many LULC polygons are under-represented while others are over-represented in respect to the number of points [
33].
It has been suggested to effectively check VGI data against official data before use [
1]. With this in mind, the current study compares the LULC in OSM with an authoritative LULC dataset. More precisely, a comparison of the OSM “naturals” dataset with the German authoritative ATKIS DLM dataset is conducted for a region of about 1300 square kilometers comprising both urban and rural areas. The aim of the study is to assess the quality of OSM land use as well as land cover data. It is investigated if the data can be used instead of, or in addition to, authoritative data. The study is a part of a larger project in cooperation between the Heidelberg GIScience group, Central Institute of Mental Health in Mannheim, and the Karlsruhe Institute of Technology. The intended longitudinal study addresses the possible relationship between well-being or mental health and land use, among others. It would be beneficial to use freely available geodata in order to cover a larger region and to reduce the need for costly updates of authoritative data.
2. Study Area and Data
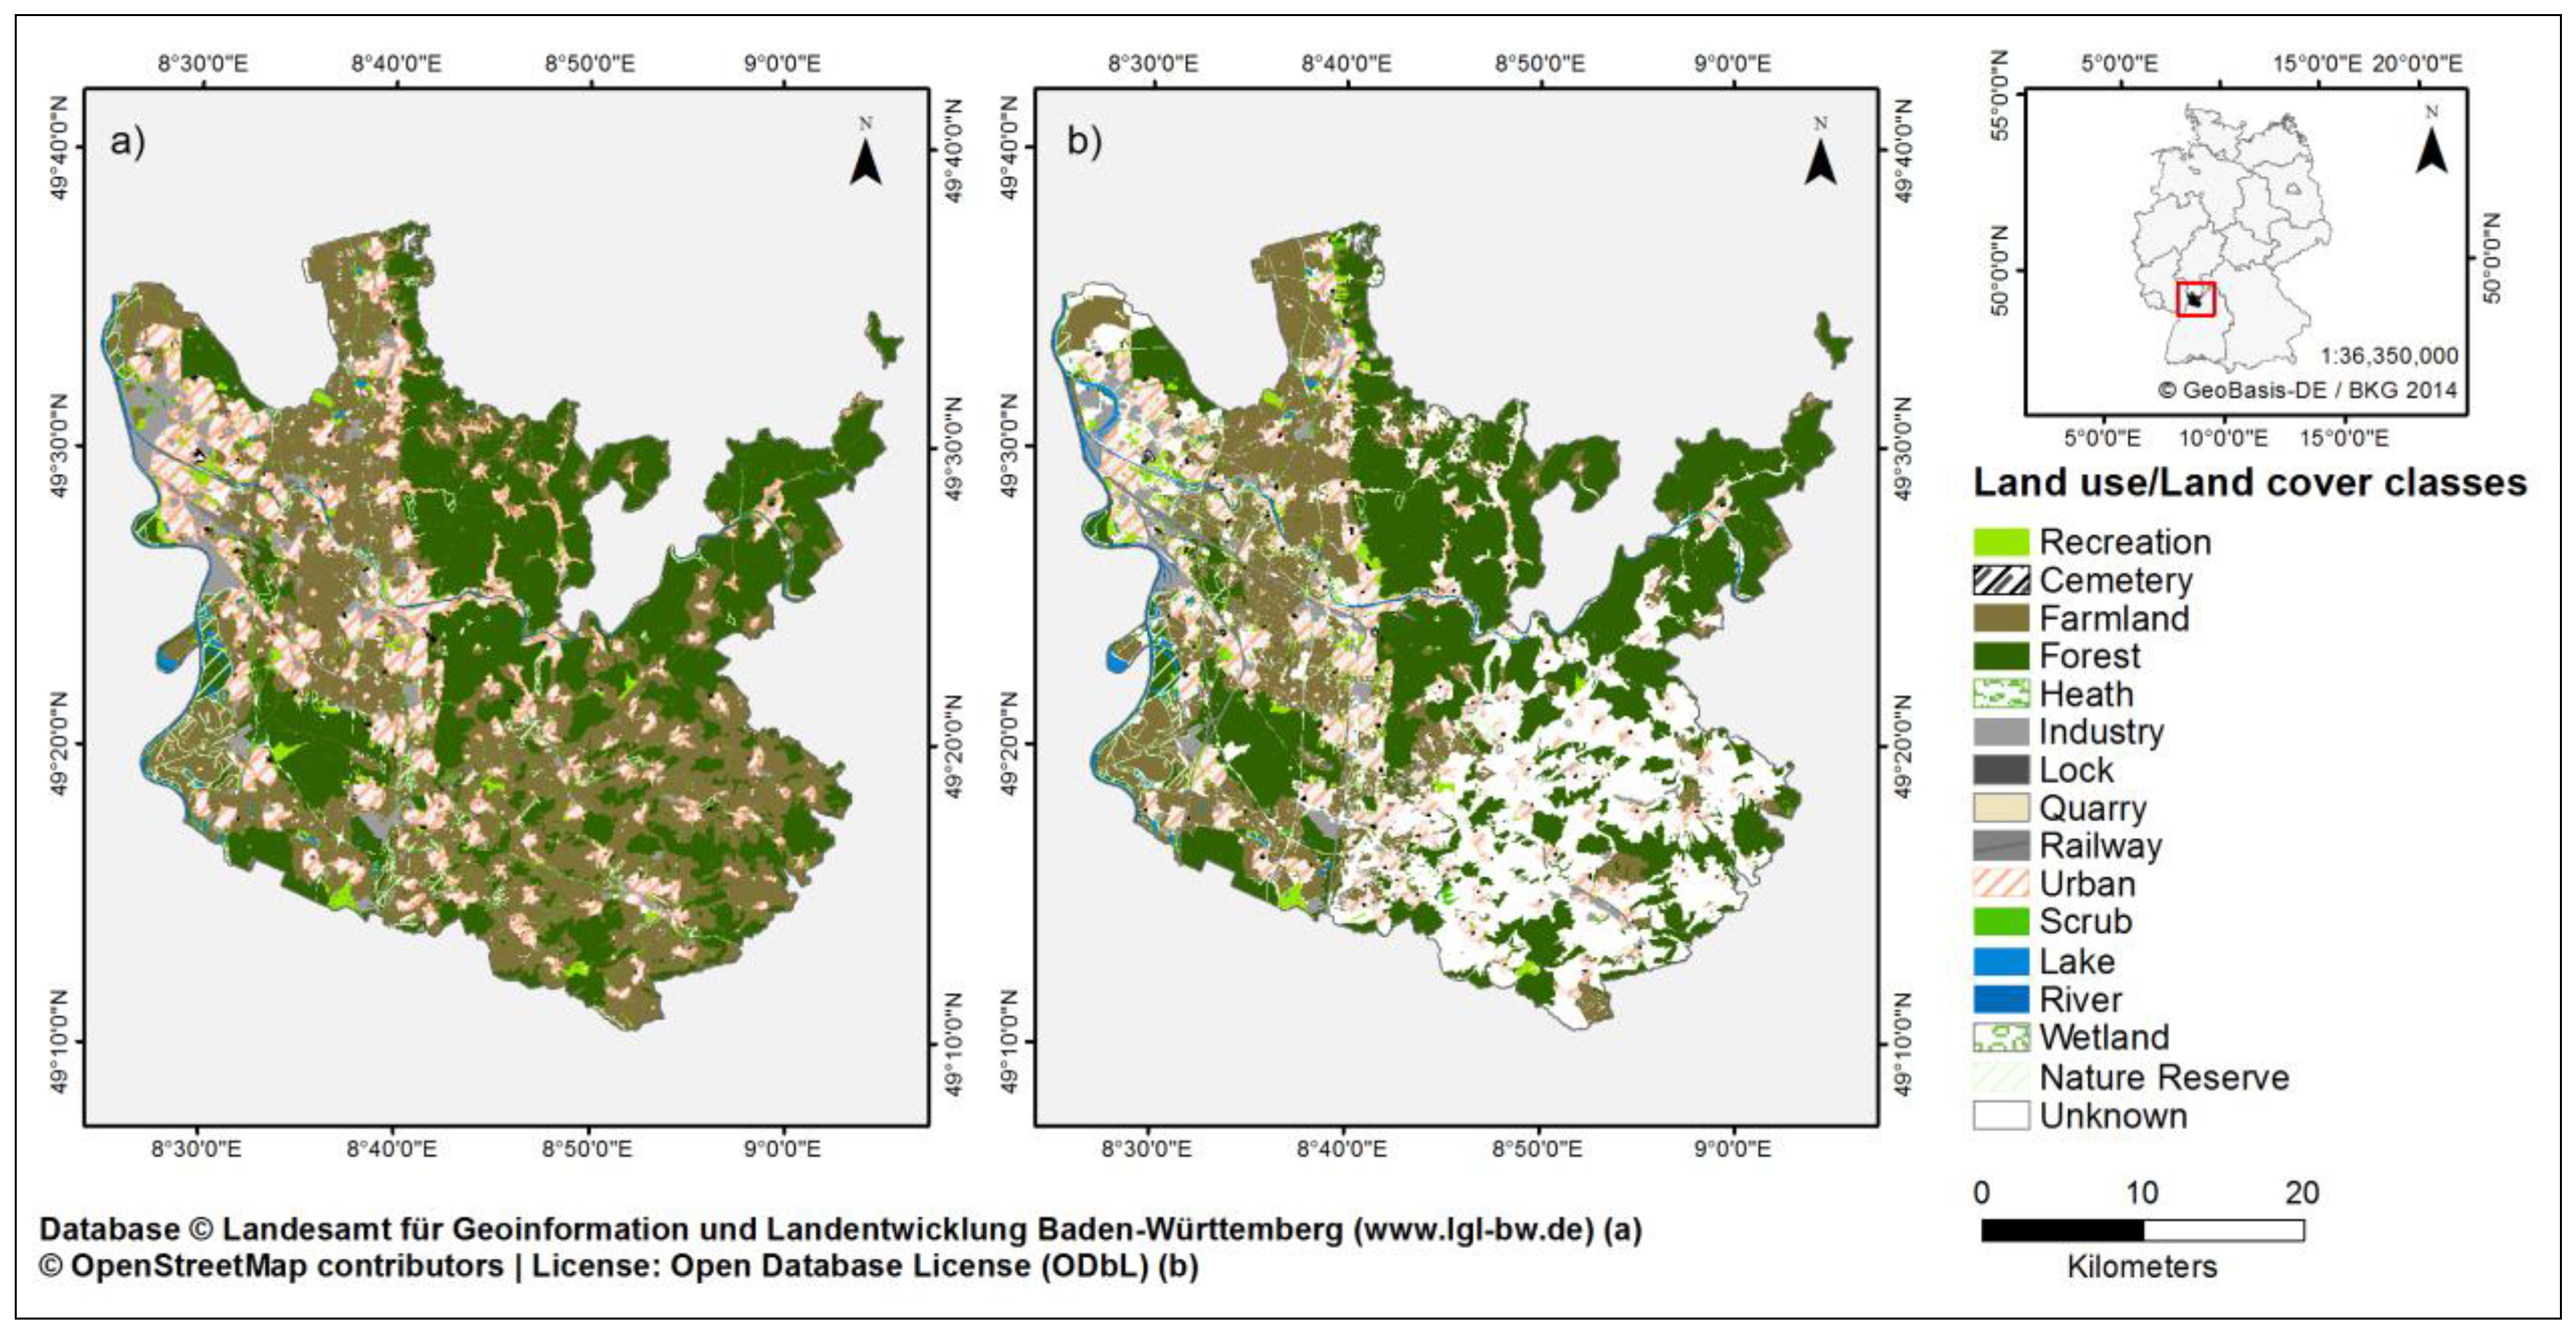
Our study area is the Rhine-Neckar region, located in southern Germany in the Federal State of Baden-Württemberg (
Figure 1). The region comprises 54 municipalities and includes both rural areas and the cities Mannheim (~318,000 inhabitants, Nexiga GmbH, 2014) and Heidelberg (~151,000 inhabitants, Nexiga GmbH, 2014), among others. The total region covers about 1300 km², with built-up areas covering approximately 19% of it. This study addresses the quality of OSM land use and land cover data by comparing the data with the authoritative data set ATKIS Base DLM version 6.0. This dataset is provided by the mapping agency Landesamt für Geoinformation und Landentwicklung Baden-Württemberg (LGL—Baden-Württemberg State Office for Geoinformation and State development). The data have a scale of 1:25,000 (the highest resolution for nationwide land use datasets in Germany) and consist of 103 different object categories, 46 of which are polygon features. The minimum area for acquisition is between 0.1 ha and 1 ha with differences between categories. For instance, a minimum width of 12 meters is required for streams, whereas other areas such as sport facilities and power plants are captured without any restriction regarding minimum area. The dataset is the only consistent nationwide authoritative dataset for land use in Germany. For the large study area used in this article, this is the best reference available, but there might be limitations due to data actuality and scale.
Figure 1.
Land use/Land cover of the study area (Rhine-Neckar region) from (a) ATKIS Base DLM, and (b) OpenStreetMap.
Figure 1.
Land use/Land cover of the study area (Rhine-Neckar region) from (a) ATKIS Base DLM, and (b) OpenStreetMap.
The OpenStreetMap data were retrieved from the OSM database (Osmosis schema). The data have been processed according to Goetz
et al. [
34] and were extracted from the database as shapefiles. The OSM “naturals” objects contain elements tagged with “landuse”, “leisure”, “natural”, “tourism”, and “waterway”. According to that, land use as well as land cover features are included and cover 76% of the total study area (
Figure 1).
Both the ATKIS and the OSM datasets are vector based. However, the DLM has a fixed scale, while in the OpenStreetMap natural dataset the level of detail and consequently the scale varies, as shown by the study of Touya and Reimer [
35]. Both datasets are from 2014, OSM was downloaded in March and the Base DLM was obtained in May. The ATKIS Base DLM is updated at least twice a year. Therefore, a similar actuality can be assumed for both datasets.
3. Methodology
The comparison of the crowdsourced OSM and the DLM datasets is executed through a semantic harmonization (
Section 3.1) and a polygon preprocessing part (
Section 3.2), which lead to an area related map comparison with a confusion matrix (
Section 3.3).
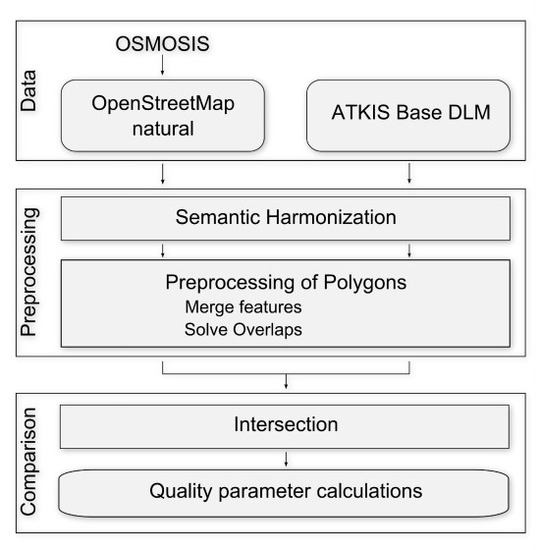
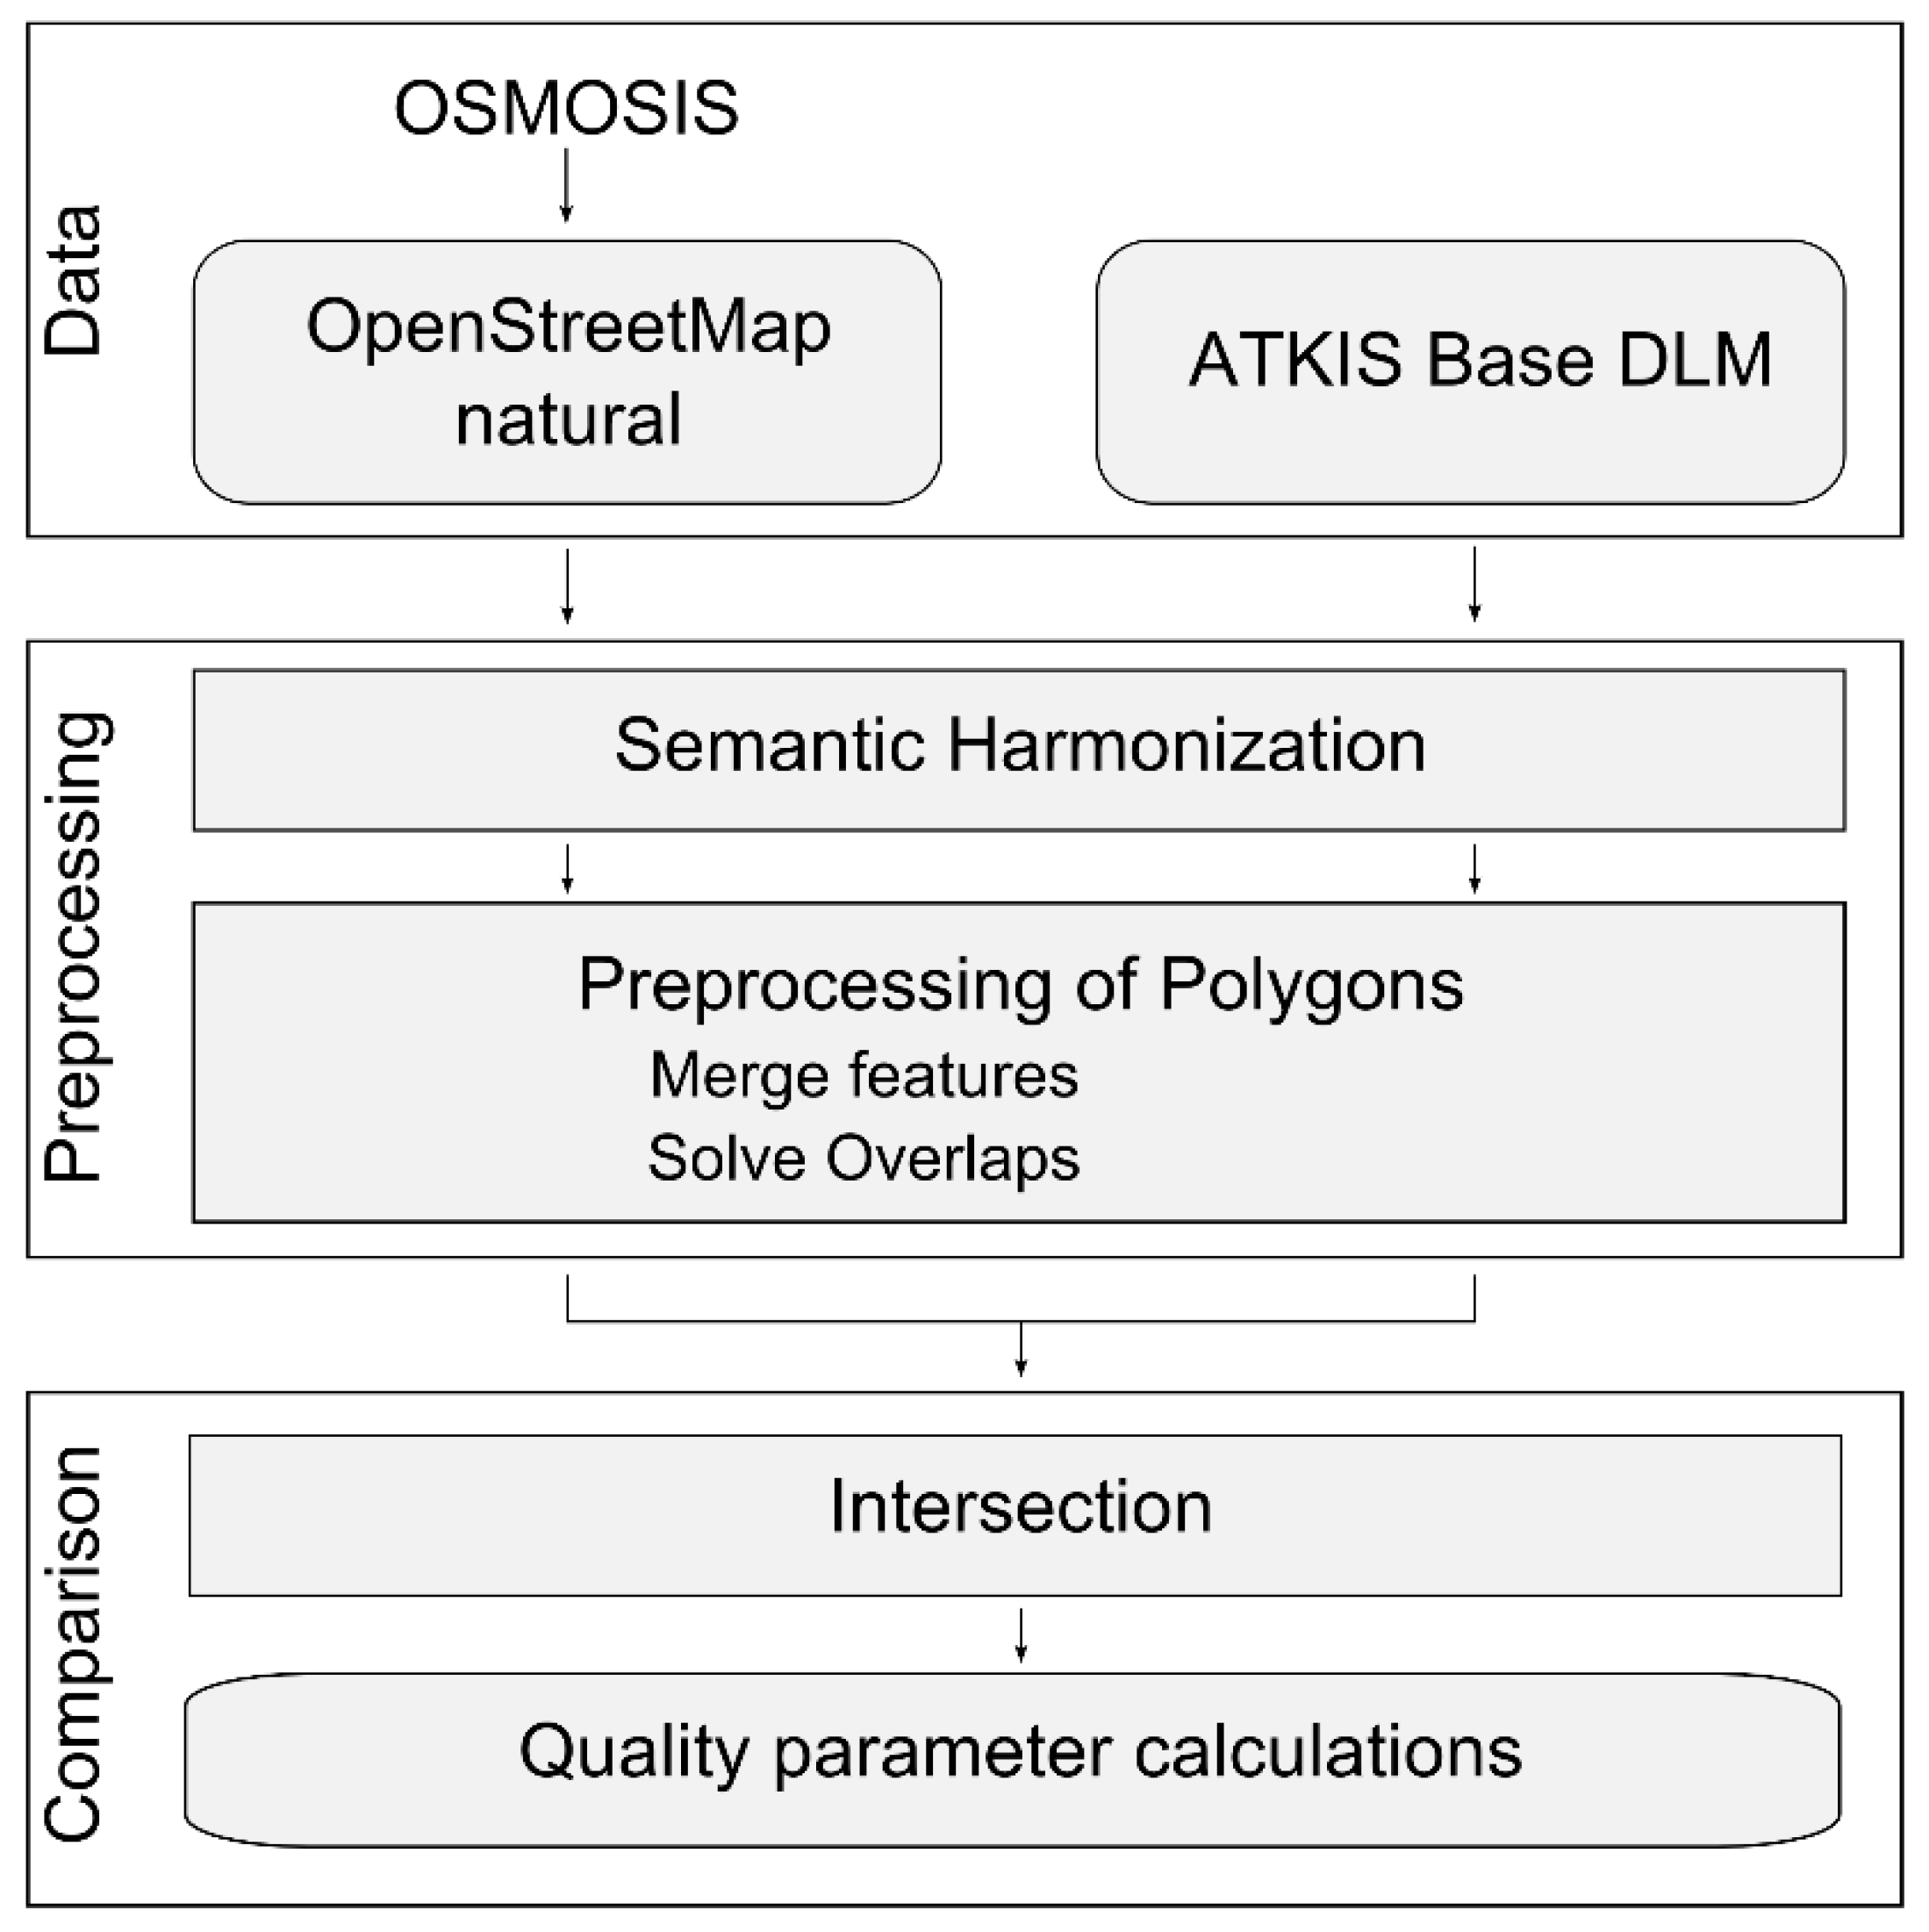
Figure 2 visualizes this procedure. The semantic harmonization was accomplished by translating the German ATKIS DLM nomenclature terms into English and subsequently comparing the OSM and DLM datasets’ descriptions. Next, merging all polygons within a class solved overlaps within the classes. Afterwards, further inconsistencies were solved; overlapping of polygons from different classes had to be solved in order to allow a comparison using kappa statistics. After the preprocessing the datasets were intersected, the area values were calculated and a confusion matrix was built in order to assess the OSM map quality. This chapter explains the preprocessing and the analyses more in detail.
Figure 2.
Workflow for the comparison between OSM and ATKIS Base DLM.
Figure 2.
Workflow for the comparison between OSM and ATKIS Base DLM.
3.1. Semantic Harmonization
It is common that different LULC datasets use different semantics. The ATKIS DLM is a German system, thus the names of the categories first had to be translated into English in order to allow an OSM-DLM comparison. Furthermore, the DLM provides 46 polygon object categories, whereas OSM “naturals” has 52 categories for the study area (after processing according to [
34]). In order to allow for comparison of the datasets, a dictionary was built. First, for each OSM category a corresponding ATKIS category was manually identified. Next, these categories were grouped to classes to enable a comparison. With this approach 15 comparable LULC classes were formed (see
Table 1). In addition to these, a class named “unknown” was introduced containing the categories where OSM data could not be matched to any ATKIS DLM class, and
vice versa. In the OSM data 25.3% of the total area is covered by the “unknown” class, while 1.49% of the area in the DLM being labeled “unknown”.
Some categories required extra attention. Nature reserve for example had to be evaluated separately, because it is an administrational object including several land cover classes like forest among others. Urban or residential areas also overlap with other classes; they are included in the comparison, being given the lowest priority in overlaps. Consequently, overlaps with urban areas were solved by removing these areas from the urban class. The new class, “unknown”, in the DLM refers to several of the original classes, which cannot be compared with existing data in OSM because the land use is ambiguous. These areas mainly consist of major roads, highway junctions, areas of mixed land use, areas with special functional character, and areas with unknown land use. The new OSM class, “unknown”, consists of areas where no LULC information is available (95%) and areas covered by other classes that cannot be matched to the DLM (5%). Once the dictionary was created, the polygon objects needed to be preprocessed.
3.2. Preprocessing of Polygons
A comparison of the OSM and the DLM dataset requires the same spatial reference. OSM uses the World Geodetic System 1984 (WGS 84), which is appropriate as a global reference, but causes contortions in local areas. In contrast, the ATKIS DLM is delivered in the Gauss–Krüger coordinate system zone 3. For this study both datasets were projected to the European Terrestrial Reference System 1989/UTM zone 32N, a coherent European coordinate system suitable for the study area. Subsequently, the datasets were reclassified according to
Table 1. Polygons belonging to the same class were merged in order to avoid spatial overlaps within the same class as prevalent in OSM. Possible topological errors in vector data result from features belonging to at least two classes within one dataset [
36]. Because this study aims at analyzing the accuracy of OSM by using kappa statistics, a dataset without overlapping polygons is a precondition [
37].
Overlaps between classes exist in both datasets and were mainly related to the class “urban”. Within the DLM, overlaps are also caused by the classes “industry”, “railway” and “lock”, which occasionally overlap with other land use classes. In order to deal with the overlaps in the ATKIS DLM, the following rules were established: In case of an overlap with the urban class, the non-urban class was given priority. The only exception was for the class “unknown” in which case the urban area was given priority. Another rule ensured that “lock” was given priority over “river” and “railway”. Otherwise all lock areas would have been removed. For all other overlaps, individual decisions were made after a visual examination of aerial images.
Table 1.
A dictionary between OSM and ATKIS Base DLM.
Table 1.
A dictionary between OSM and ATKIS Base DLM.
| Class | OSM | ATKIS Base DLM |
|---|
| Farmland | Farmland, farm, meadow, orchard, vineyard | Farmland 1 |
| Forest | Forest, wood | Forest 2 |
| Industry | Industrial, commercial, landfill, boatyard | Industry and commercial, port 3 |
| Scrub | Scrub | Grove 4 |
| Recreation | Allotments, village_green, golf_course, park, pitch, recreation_ground, sports_centre, stadium, water_park, zoo | Sport, leisure and recreation areas 5 |
| River | Riverbank | Harbour basin, stream water 6 |
| Lake | Water | Backwater 7 |
| Railway | Railway | Rail traffic 8 |
| Cemetery | Cemetery | Cemetery 9 |
| Quarry | Quarry | Mining, open-cast mining, pit, quarry 1° |
| Wetland | Wetland | Marsh, moor 11 |
| Lock | Lock | Lock 12 |
| Heath | Heath | Heath 13 |
| Urban | Residential | Built-up area 14 |
| Nature reserve | Nature_reserve | Nature, environment or soil- conservation law 15 |
| Unknown | Other classes/no data | e.g. mixed land use, area with special functional character, unknown land use 16 or major roads |
In OSM, no specific class besides “urban” could be associated with topological errors. However, a large proportion of the overlaps were due to sliver polygons that may arise when borders are not aligned in OSM. Sliver polygons can also result from different user perspectives with the same area being tagged as both “scrub” and “forest” for example. Other occurring errors are due to smaller areas within a larger area, for example a lake located within a forest. In most cases, forest areas are covered by large polygons. The outer borders of these polygons may be drawn based on an aerial image without consideration of smaller non-forest areas inside. If the lake is mapped at a later point it will overlap with the larger forest polygon.
OSM polygons smaller than 20 m2 were merged with the adjacent polygon having the longest shared border. For the remaining topology problems, at first, smaller classes were given priority (e.g., a forest lake was given priority over forest). If the best choice could not be determined based on the polygon sizes, land use classes were favored over land cover classes. The ‘urban’ class was given lowest priority (as in the proceeding with the DLM) with the exception of the unknown class. Analysis of aerial images was used to solve remaining errors. Finally, the land use category natural reserve was compared separately, all polygons within this class were merged and therefore no overlaps occurred.
3.3. Area Related Map Comparison
In order to address the quality of the OSM dataset, the LULC map comparison was conducted based on polygons. Both the OSM completeness and correctness were evaluated. Completeness is an element of spatial data quality [
38] and this study addresses the completeness of objects. An investigation of the completeness of attributes would be another possibility, which is beyond the scope of this study. Another measure for spatial data quality is the mentioned correctness. According to ISO 19157 [
12] classification correctness is a data quality element of thematic accuracy and defined as “comparison of the classes […] to a universe of discourse (e.g., ground truth or reference data).” In addition to completeness and correctness, Cohen’s kappa is derived in order to further address the agreement between the OSM and DLM datasets. Kappa is a well-known measure of agreement in the field of remote sensing [
39].
After extracting the relevant features and preprocessing the data according to
Section 3.1 and
Section 3.2, the overlapping and non-overlapping areas of the resulting OSM dataset with the adjusted ATKIS DLM dataset were identified. Next, the area in hectare was calculated and a confusion matrix was derived. Based on the matrix the completeness, correctness and kappa could be calculated.
The True Positive (TP), False Positive (FP) and False Negative (FN) values were derived for every single LULC class separately. True Positives are the overlapping areas in the same class in the observed (OSM) and reference dataset (DLM). False Positives are areas, which belong to the evaluated class in OpenStreetMap, but not in the DLM. Correspondingly, False Negatives are areas belonging to the class of interest in the DLM but not in OSM. Completeness (1) and correctness (2) are calculated according to [
40]:
Completeness and correctness are also known as producer’s and user’s accuracy, respectively. Completeness is an accuracy measure, which indicates the omission errors and correctness measures the commission errors [
41]. Cohen’s kappa [
42] is a statistical measure to quantify the agreement between images. It is often used to assess the quality of classification on basis of remote sensing images, along with completeness and correctness [
39]. The kappa index may be below 0 (meaning that there is less agreement than agreement by chance), equal to 0 (which indicate an agreement equivalent to chance) or up to 1 (which indicates a total agreement) [
43] between two images or maps. This study uses the kappa index to address the overall quality of OSM.
4. Results and Discussion
The bars in
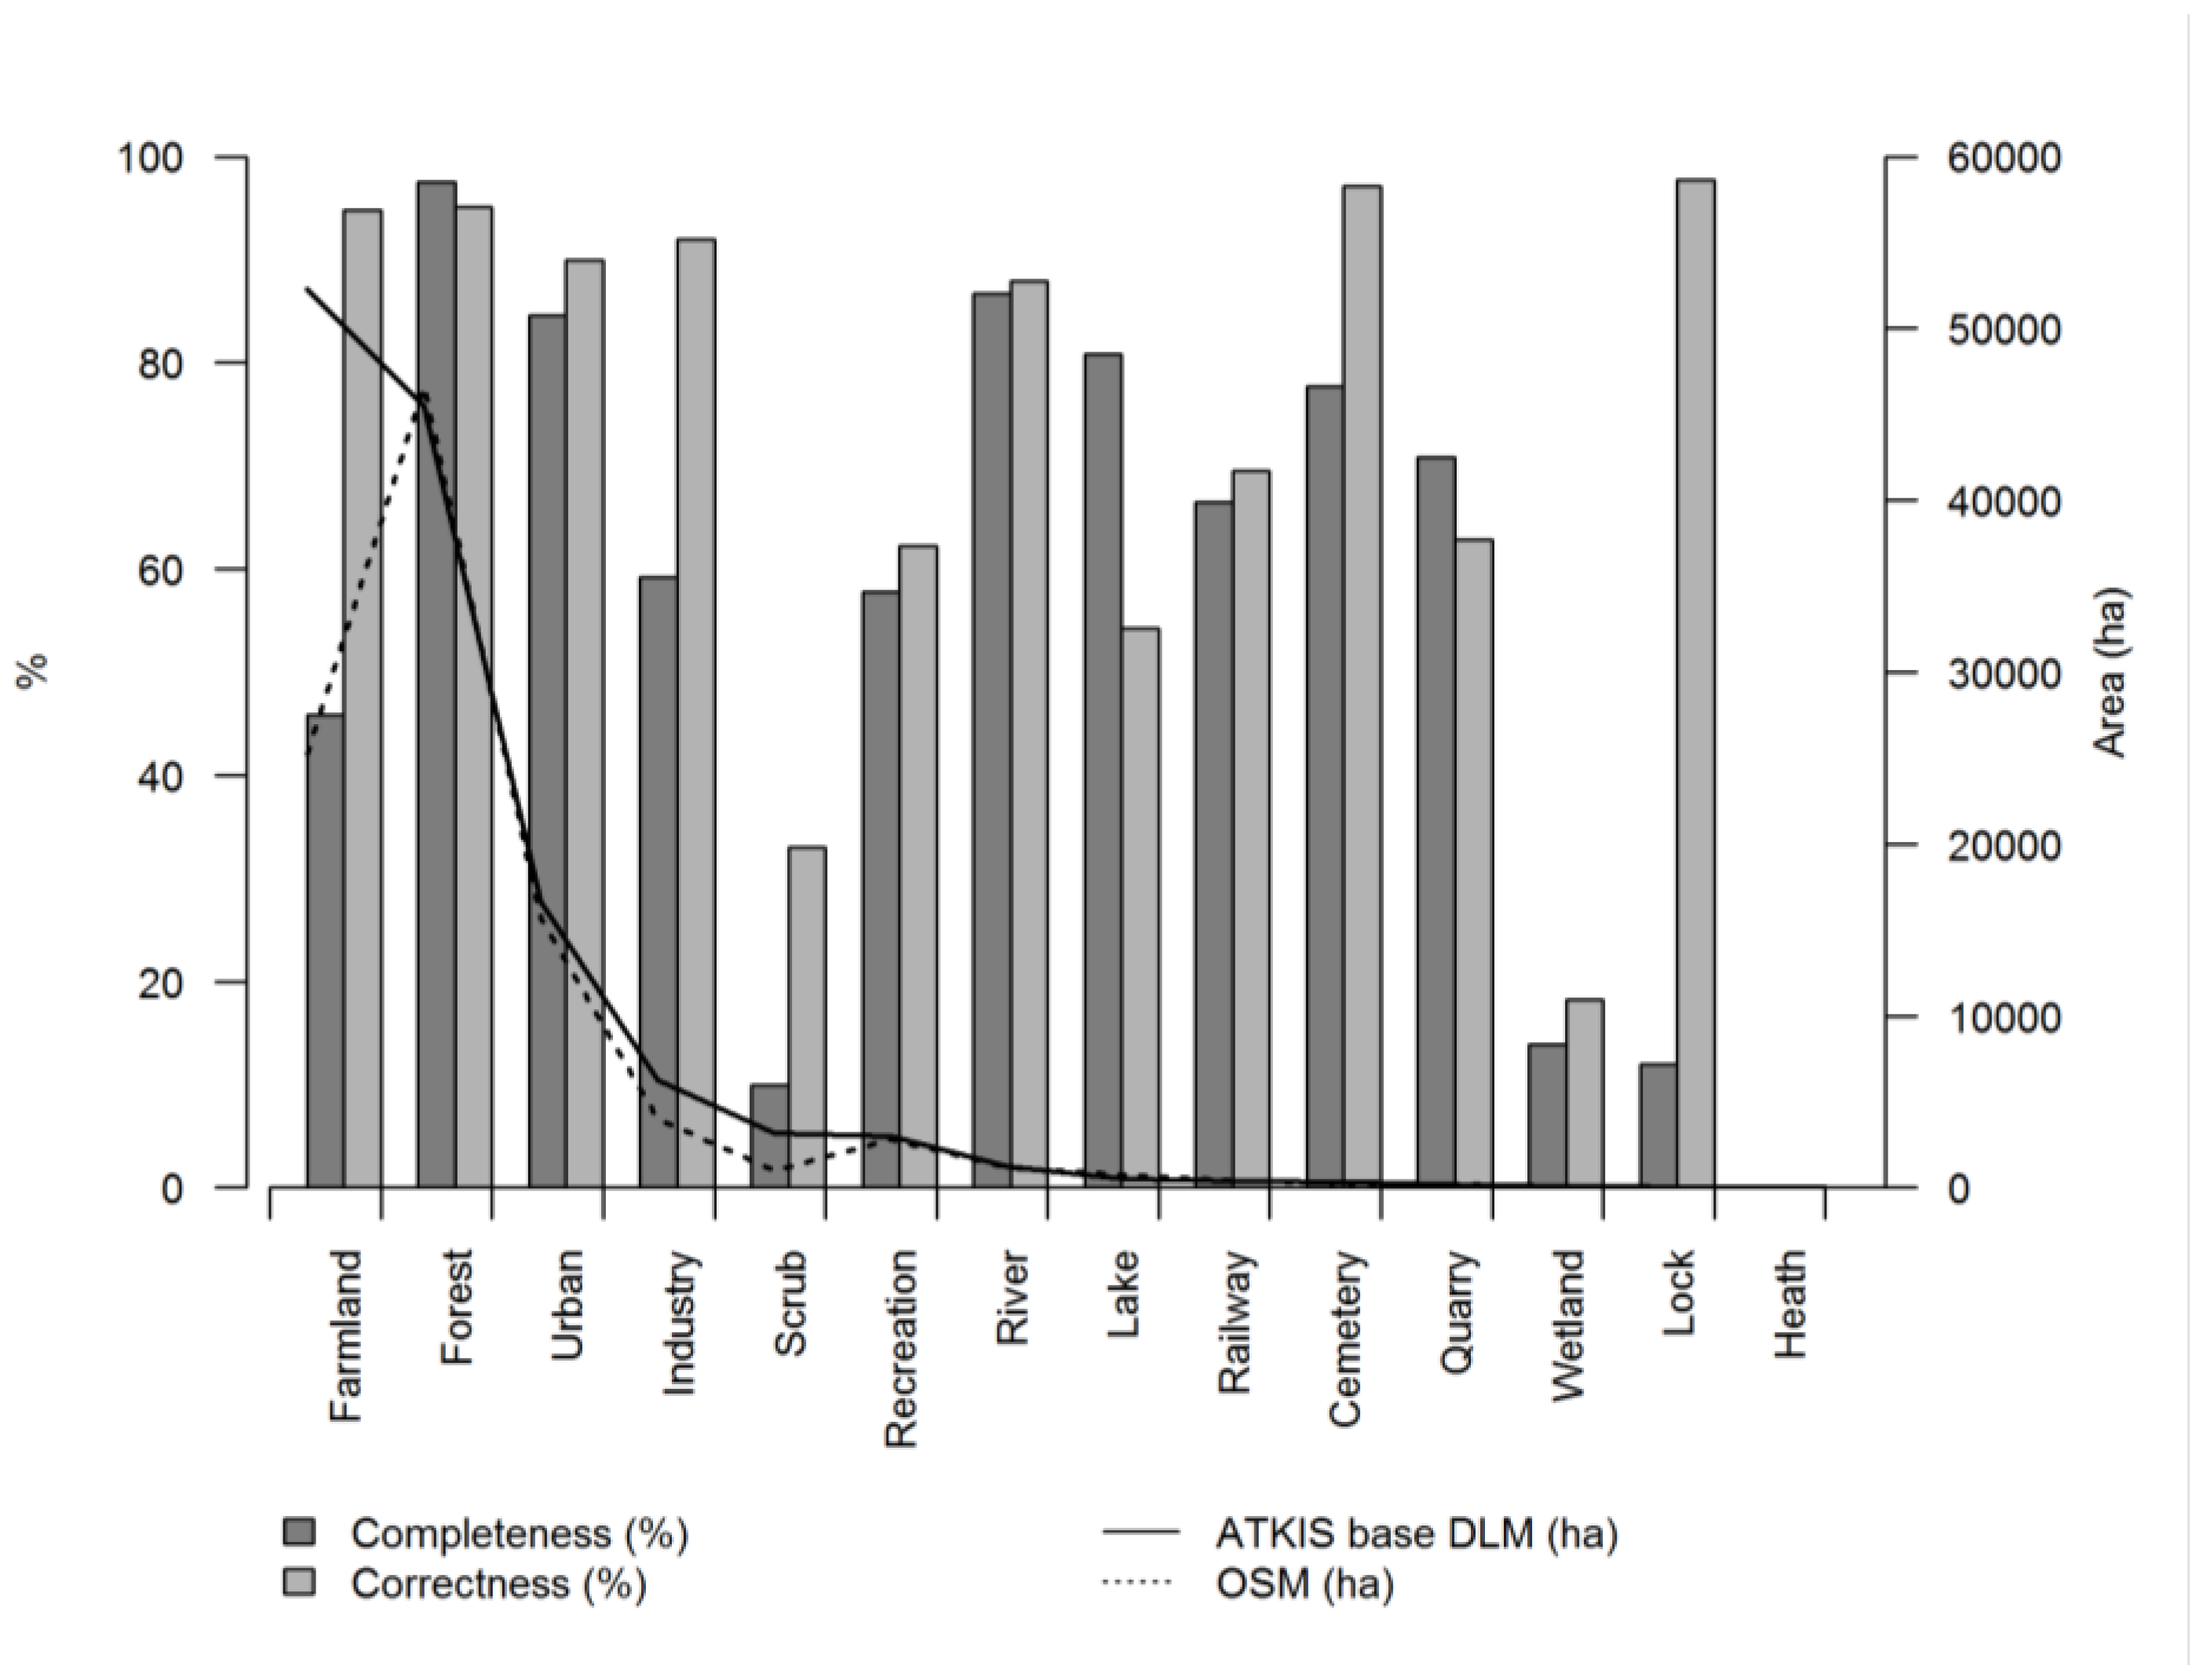
Figure 3 show the completeness and correctness of the OSM dataset for 14 classes. The absolute areas of the land use classes are included in the figure as lines. The class unknown is not included, because the content of the class is not comparable between the data sets. The figure shows both land cover and land use classes. The DLM data shows that a large area is covered by farmland (approx. 52,300 ha) and forest (approx. 45,400 ha), with other LULC classes like lock and heath only covering comparably small areas (approx. 13 and 4.8 ha, respectively). The illustration also displays forest comprising a comparably large area (approx. 46,600 ha) in OSM. Furthermore, this class is being mapped with the highest accuracy, as both completeness (97.6%) and correctness (95.1%) are relatively high. One reason for false positive areas in forest, which reduce the correctness value, is that in some regions the structure might be similar to scrub and therefore the users mapped these areas as forest. Recreation areas, which might be relevant for the well-being of people, show a moderate completeness (57.8%) as well as correctness (62.3%). On the other hand, rivers are comparably complete (86.7%) and correctly (87.9%) mapped. One reason can be that both forest and rivers are land cover categories that can be easily identified in remote sensing images due to their structure and color, but recreation is a land use category incorporating different land covers (e.g., a pitch with an athletic track). The former is therefore comparably easy to map. Another explanation of the high values could be related to data imports, investigated for the OSM road network in the US by [
44] for instance. Usage of ATKIS Base DLM is restricted and associated with financial costs. Additionally, data cannot legally be imported to OSM. Therefore, we can assume that there are no significant imports from the DLM in OSM. Nevertheless the completeness pattern of farmland might also be explained by data imports from other sources. The class shows a low completeness (45.9%) but a high correctness (94.8%), and it is obvious that primarily the western part of the study area is well mapped (see
Figure 1). However, the western part is also more urbanized than the eastern part, consequently a higher interest or higher number of OSM users could explain the higher coverage as well.
Rather small classes such as cemeteries and lock show a high correctness (97.2% and 97.7%, respectively), but the completeness values (77.7% and 12.0%, respectively) show that many areas are missing. For the lock class the low completeness is assumingly due to the mapping behavior of the OSM users. The area around the actual lock is not included in OSM, but in the administrative DLM dataset. For the heath class no results are visible, because the areas are comparatively small in OSM (ca. 2 ha) and in the DLM (ca. 5 ha) and the data simply do not overlap. For these examples, the correctness values are higher than the completeness ones, while, for three categories (forest, lake and quarry), the completeness is higher than the correctness. This might be an indicator of false or inaccurately mapping of some areas.
Nature reserve is a land use covering several land use and land cover classes. The separate evaluation results of the OSM nature reserve class show a completeness of 72.92% and a high correctness of 98.58%.
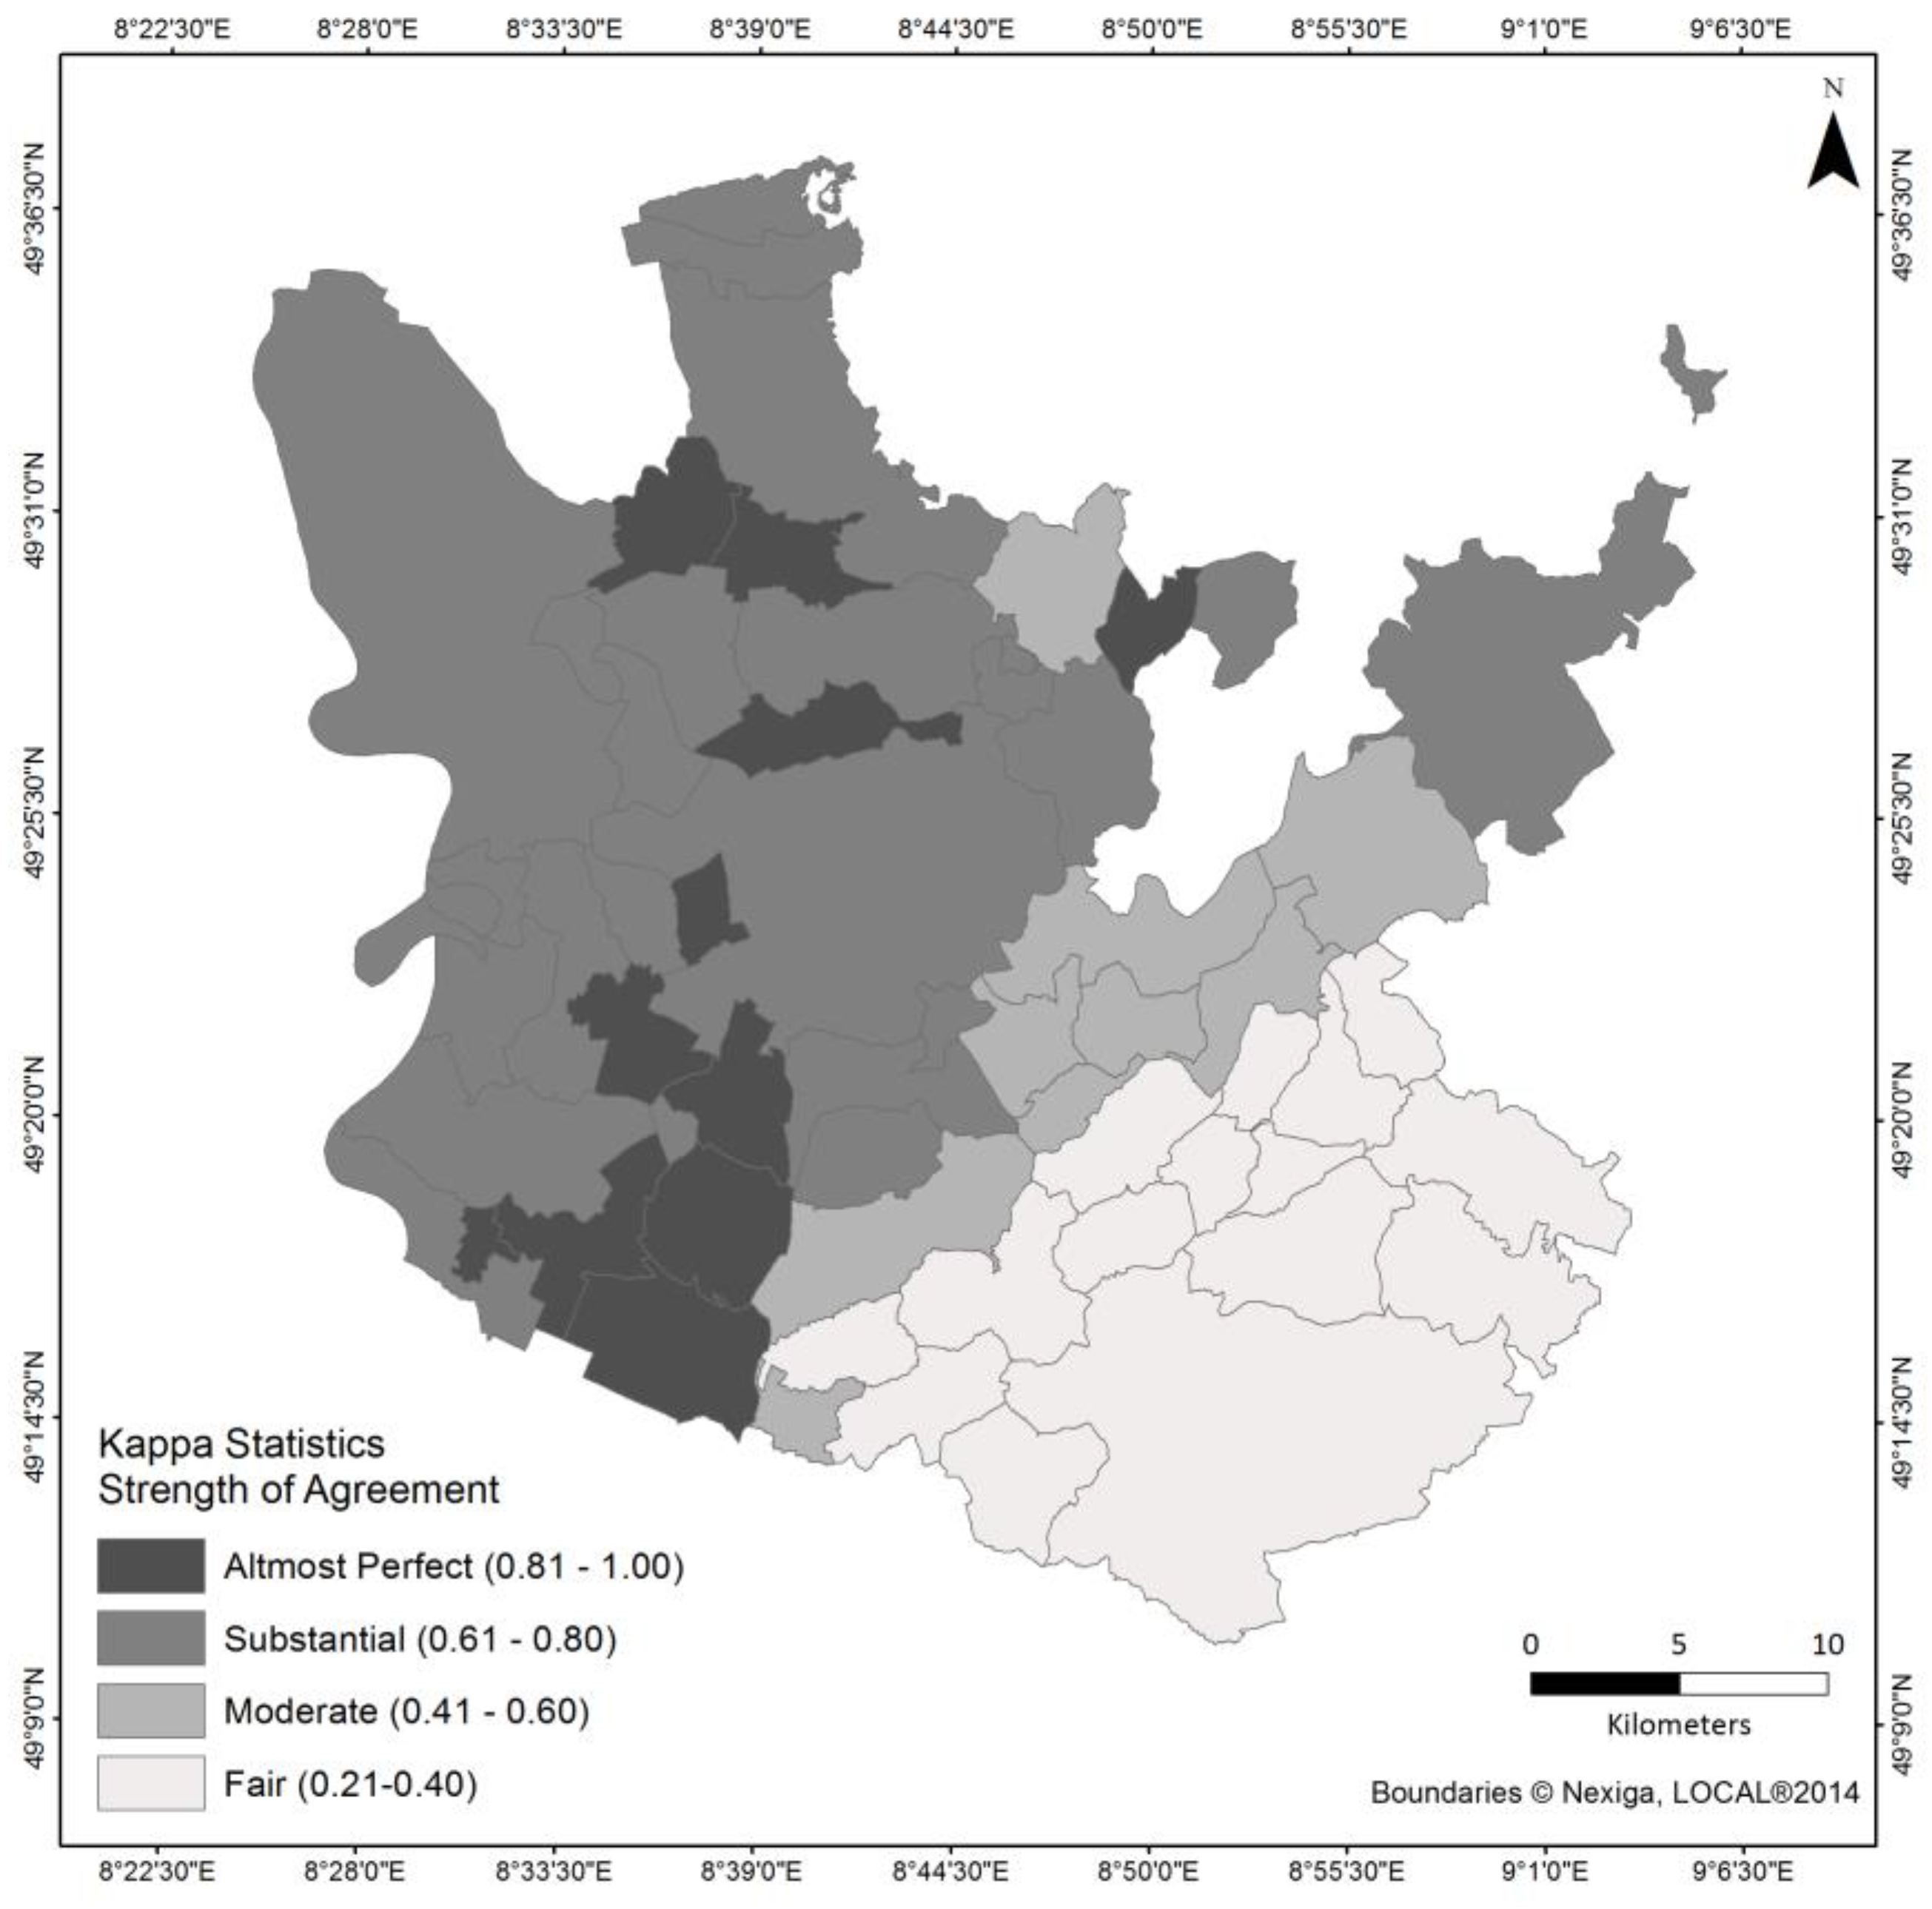
Kappa was used as an indicator for the OSM LULC data quality. The resulting kappa of 0.61 shows a positive agreement between OSM and the DLM. According to the labeling of kappa categories of Landis and Koch [
43] the measured agreement is substantial (0.61 to 0.80).
The calculation of kappa for each municipality gives a more detailed insight into the spatial distribution of the OSM map accuracy (
Figure 4). In the western part, the strength of agreement is substantial to almost perfect classified according to Landis and Koch [
43]. The municipalities with the lowest kappa values are located in the southeastern, more rural, part of the study area. Here missing farmland areas result in the rather low kappa values (see
Figure 1). The differing scales of the datasets might influence the results. In order to investigate this factor, both datasets were converted to a raster with a resolution of 50 meters. This coarse resolution (in comparison to the vector dataset) reduces potential inequalities at the polygon borders. The derived kappa index (0.61) for the study area did not change, and neither did it change when a raster resolution of 20 meters was chosen. These findings indicate that the scale in this study area seems to have minor influence on the results. Nevertheless, further research is required to investigate the influence of scale in this context, as for example Touya and Reimer [
35] already did for individual objects.
Figure 3.
Completeness and correctness of the OSM dataset in comparison to the reference data set ATKIS Base DLM. The lines show the coverage in hectare.
Figure 3.
Completeness and correctness of the OSM dataset in comparison to the reference data set ATKIS Base DLM. The lines show the coverage in hectare.
Figure 4.
Cohen’s kappa for the municipalities in the study area classified according to Landis and Koch [
43].
Figure 4.
Cohen’s kappa for the municipalities in the study area classified according to Landis and Koch [
43].
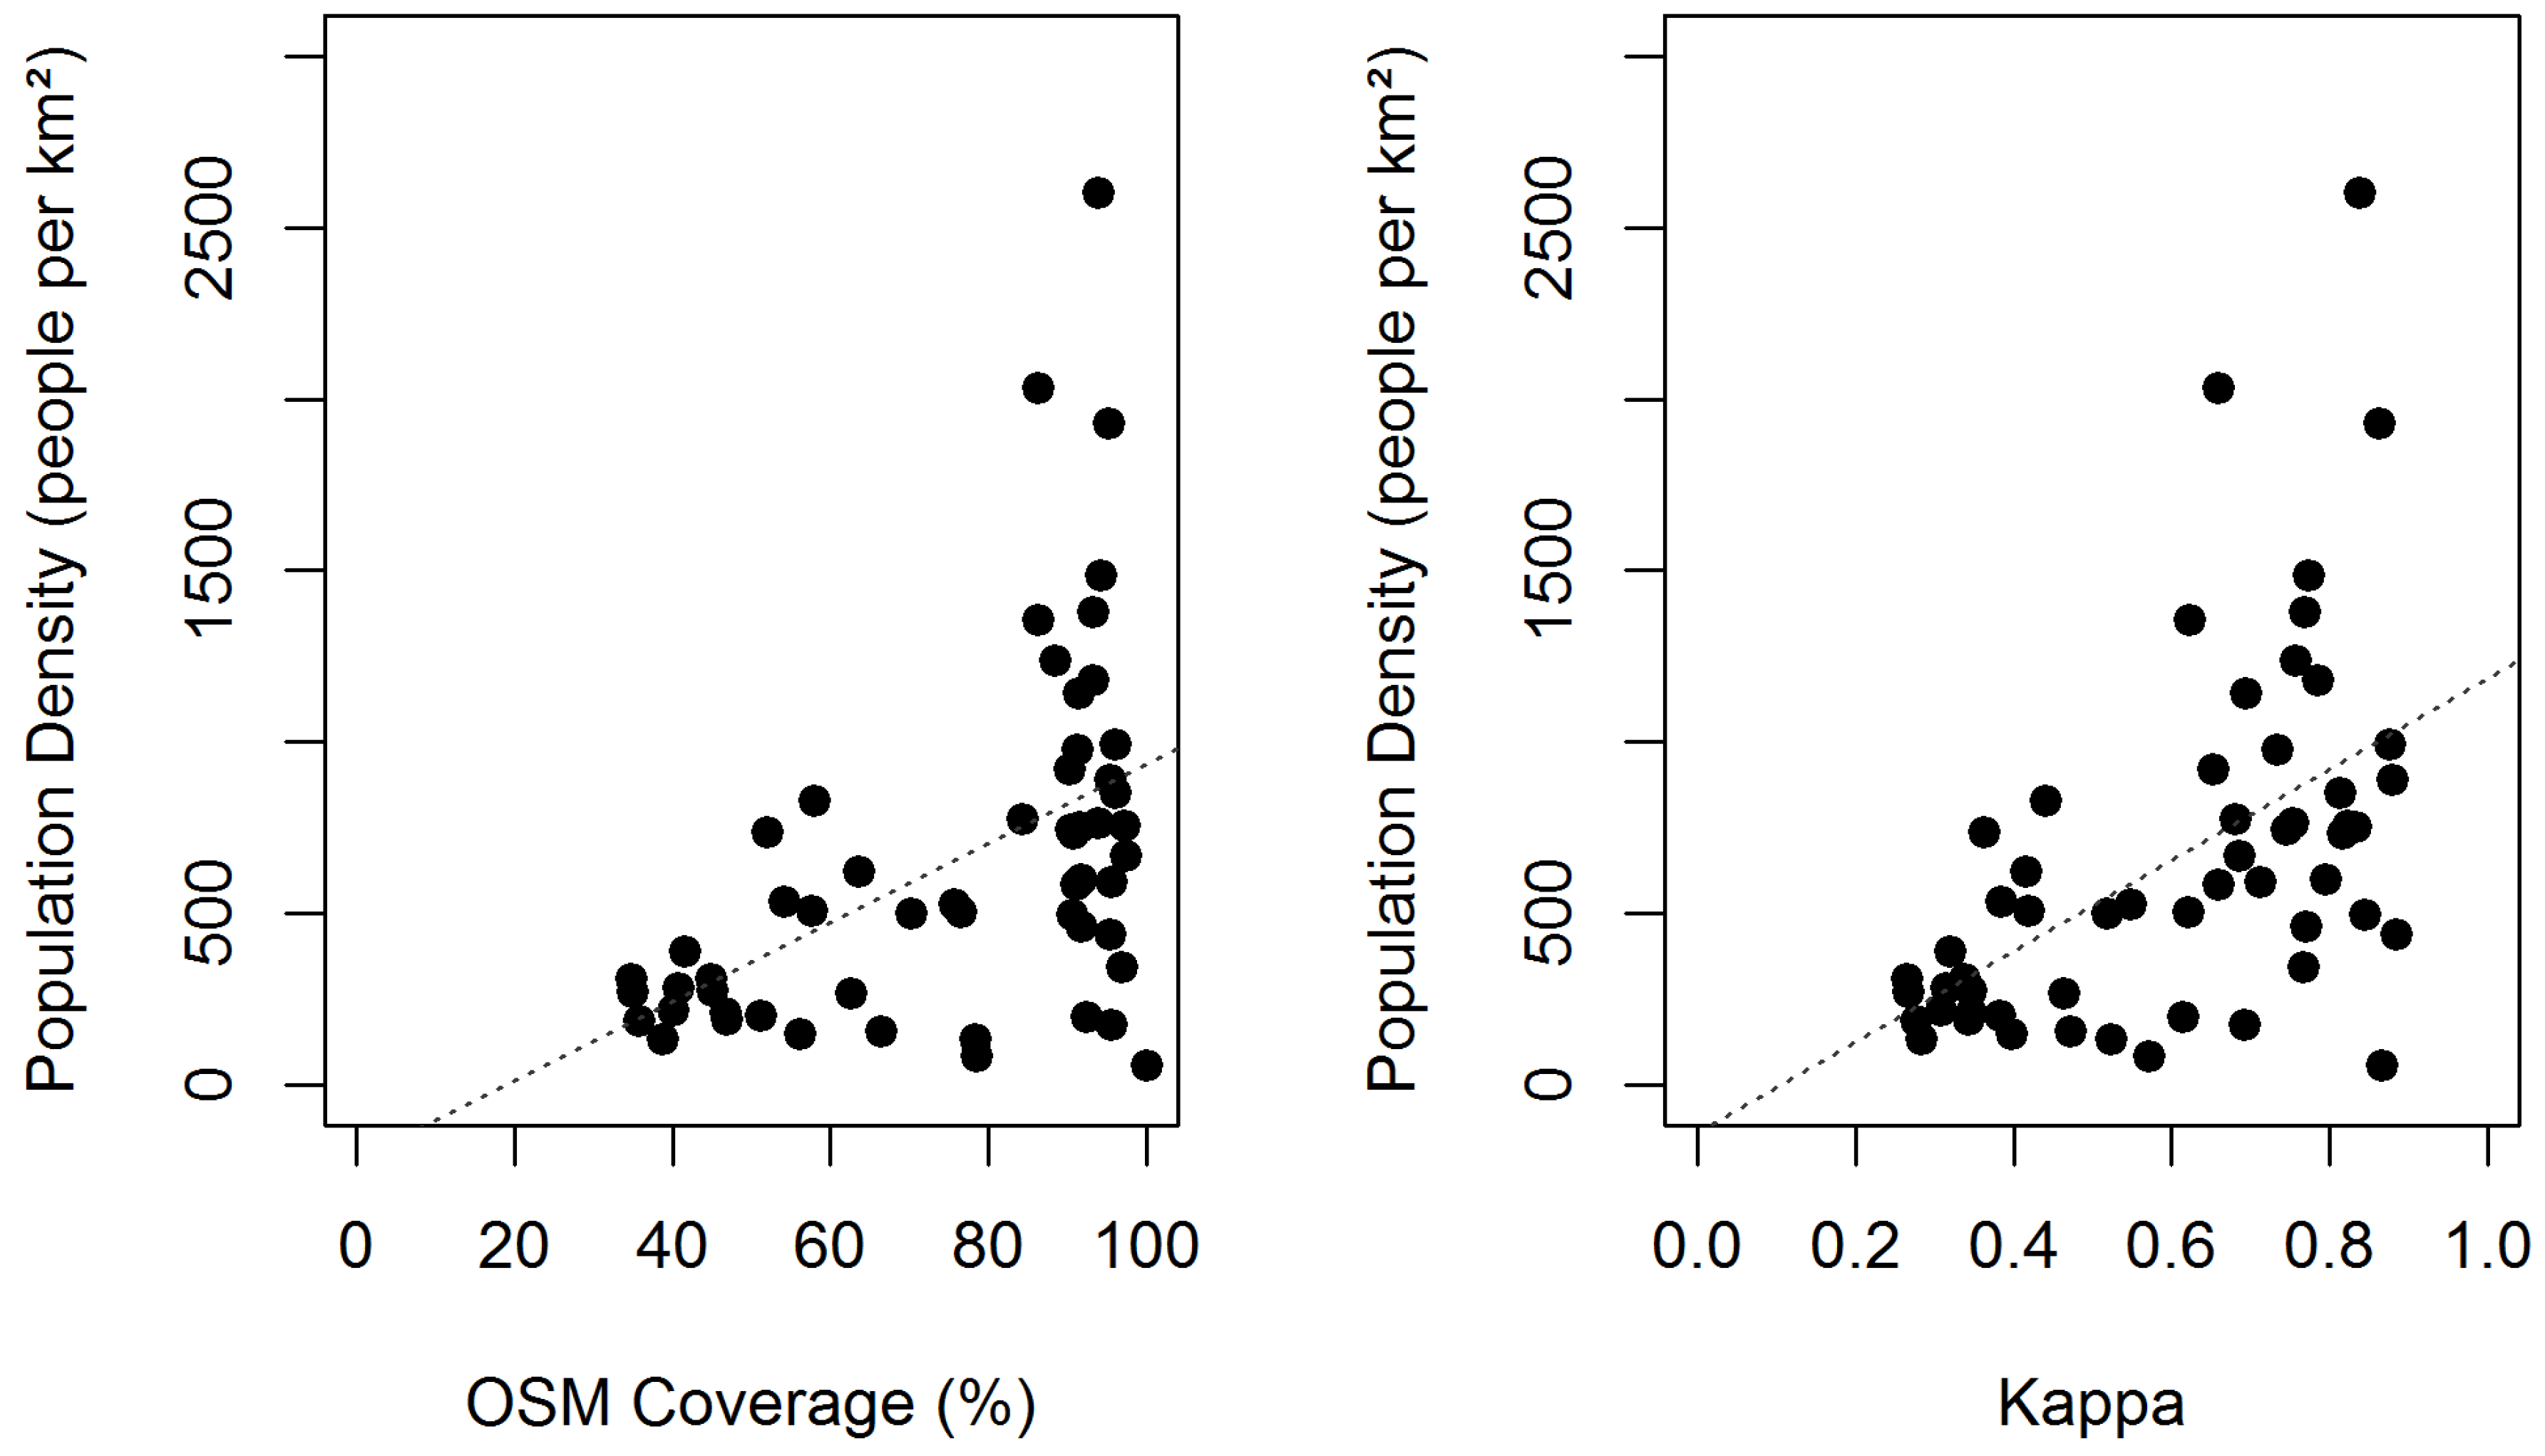
To investigate a possible link between urbanization and OSM quality, the relation of population density and OSM coverage, as well as population density and kappa were visualized (
Figure 5). The figure depicts that a higher population density tends to lead to higher OSM coverage. However, it also illustrates that municipalities with a low population density may have either low or high OSM coverage. The same applies to the relation of population density and kappa. Nevertheless, it can be stated that both the OpenStreetMap coverage and kappa tend to be higher in municipalities with higher population density.
Figure 5.
Relation of OSM Coverage (mapped OSM area/municipality area) and kappa to population density for the municipalities in the study area (Population density data © Statistisches Landesamt Baden-Württemberg, Stuttgart, 2013).
Figure 5.
Relation of OSM Coverage (mapped OSM area/municipality area) and kappa to population density for the municipalities in the study area (Population density data © Statistisches Landesamt Baden-Württemberg, Stuttgart, 2013).
5. Conclusions
OpenStreetMap is a freely available data source, yet often contested due to data quality concerns. Heterogeneity and incompleteness are some of the major concerns. Al-Bakri and Fairbairn [
1] suggest testing VGI data against official data before using it. In this study, the quality of the OSM “naturals” dataset retrieved from Osmosis was addressed by using the German ATKIS Base DLM as a reference dataset. Completeness, correctness and kappa were derived to address the spatial data quality.
The results show that the completeness and correctness results were heterogeneous. Forest, which covers a large share of the study region, was the land use with the highest completeness, while also showing high correctness. Several other classes had low completeness (e.g., farmland, urban) and higher correctness, indicating that the features present are accurately mapped, yet with a lot of features missing. Other classes showed a higher completeness than correctness (e.g., quarry, lake), suggesting that in comparison fewer features are missing, but with more wrongly or inaccurately mapped features. The calculations revealed that one class had completeness above 90% and six out of 15 classes (incl. nature reserve, excl. unknown) have a correctness above 90%.
As an overall measure for thematic accuracy, the kappa statistics were derived. The result of 0.61 can be interpreted as substantial agreement between the two data sources. A further analysis showed differences between urbanized and rural areas. In our study region, the more densely populated areas tended to have both higher OSM coverage and higher kappa values.
To summarize the results, the study revealed that the quality of OSM land use and land cover features varies between the investigated classes. Some classes show higher correctness and completeness than others and might therefore be applicable for specific purposes. If a full completeness and high correctness, as in an official dataset is required, OSM is not sufficient according to this study. Neither is a replacement of the German DLM through OSM LULC data advisable at the current state and for the investigated region. Nevertheless, for this study region, forest is an example of a land use class, which (depending on the application) might be derived from OSM instead of authoritative data and in general there might be missing data, but when it is mapped, it is mostly correct. In the future, it will be beneficial if land use and land cover in OSM will be improved regarding adding new features and adding precision to existing features to create a consistent dataset for several applications or to address a possible relationship of land use and people’s well-being. Finally, further research in more study regions is required in order to investigate the spatial data quality and the fitness-for-use of OpenStreetMap LULC data in more detail.


