Abstract
This paper presents a new perspective of national power—sustainable national power (SNP)—emphasizing both the traditional comprehensive national power (CNP) and social and environmental sustainability. We propose a measurement to quantify the SNP based on the measurement of comprehensive national power and a sustainable adjusted index. In addition, density-equalizing maps are adopted to visualize the sustainable national power of countries in order to gain a better understanding for its current state and future development from a cartographic perspective. China and its neighboring countries are selected as a case study area. The results show that China outperforms other countries in most of the CNP dimensions but performs poorly in various SNP-adjusted dimensions within the study area. The composite score shows that China is with the highest regional SNP, followed by Japan, Russia, South Korea and India. Furthermore, time series of cartograms reveal evidence showing power transitions among countries. In addition, the effectiveness of cartograms for cartographic communication is discussed.
1. Introduction
Comprehensive national power (CNP), the most widely used index to comprehensively measure and represent the global or regional competiveness and influence of a country, plays a central role in international relations theory [1]. Previous theories consider that the growth of states means the extension of power radius and the expansion of living (interest) space (e.g., [2,3]). However, under the background of globalization, economic radiation, and political and cultural influences become the main means of states growth instead of land occupation. National power requires new interpretation and measurement under the background of sustainable development.
In this paper, we present a new perspective of national power—its sustainability. In the next section, we will first define sustainable national power from the perspective of social and environmental sustainability. Then, we review previous work measuring comprehensive national power and sustainable competitiveness. Based on these works we construct an indicator system and present a measurement to quantify sustainable national power. Then we select China and its neighboring countries as a case study area and apply our model to this area. Results are analyzed and, finally, conclusions are drawn.
2. Definition of Sustainable National Power
Power can be understood in different disciplines. For example, from the perspective of Geopolitics, Mattos defined national power as “the integrated expression of all capacities which a nation possesses at a considered moment for promoting internally and externally the achievement of national objectives, in spite of whatever challenges to it” [4,5].
Over the past few decades, there has been an increasing consensus on sustainable development of human beings to achieve prosperity in the future. In the report, Our Common Future, published by the World Commission on Environment and Development (WCED) in 1987, sustainable development was defined as the “development that meets the needs of the present without compromising the ability of future generations to meet their own needs” [6]. In the Global Competitiveness Report, released by the World Economic Forum (WEF), sustainable competitiveness is defined as “the set of institutions, policies, and factors that make a nation productive over the longer term while ensuring social and environmental sustainability” [7].
In a similar fashion, we define sustainable national power (SNP) as the capability of a nation that makes it maintain higher competitiveness over the long term by ensuring social and environmental sustainability. A higher level of social and environmental sustainability is critical to a country for it to be more productive, more creative, and less vulnerable to external challenges and, thus, can contribute to its national power.
3. Related Work
3.1. Measuring Comprehensive National Power
Earlier studies used single variable approaches to measure national power. For example, territory and population were considered as the most obvious and available indicators to represent power [8]. Other variables, such as gross domestic product (GDP), armed forces personnel, military expenditure, and resource and energy consumption were also frequently employed in empirical studies [9,10]. Single indicators have the advantage of simplicity. However, single variable approaches are limited to one aspect of national power and cannot express different facets of countries [1]. Thus, to measure the overall competitiveness and influences of countries, a composite indicator is required.
Numerous multivariable models have been proposed to measure national power (Table 1). Cline’s power equation is among the most famous [11]. He used the critical mass (population + territory), economic capability, military capability, strategic purpose, and national will to quantify national power. The Correlates of War Project use six indicators to measure state power: total population, urban population, armed forces personnel, military expenditures, iron and steel production, and energy consumption [12]. The Strategic Assessments Group assess power based on four indicators: gross domestic product (GDP), population, defense spending, and technological innovation [13]. Karl listed eight indicators for power measurement: economic performance (GDP), social development (life expectancy), educational performance (international student assessment scores), government performance (corruption), energy production, military expenditure, arms production, and nuclear weapons capability [14].
Since Joseph Nye coined the term ‘soft power’ and distinguished it from ‘hard power’ in 1990, efforts have been made to integrate hard power and soft power into quantitative power measurement [15]. Different from hard power, soft power emphasizes the ability of influences to other countries through non-force means, such as cultural influence, educational appeal, and technological endowment. According to Nye, it is the “ability to get what you want through attraction rather than coercion or payments” (p.x in [16]). Essentially, some components of previous power measurement models belong to soft power, such as the strategic purpose (S) and national will (W) in Cline’s model, and the cultural power and political power in Yan’s model. However, it is difficult to quantify soft power directly although some indicators are available. For example, the number of foreign exchange students and tourist visits were used to measure cultural appeal [12].

Table 1.
Examples of previous national power measurement models.
| Source | Year | Formula Description |
|---|---|---|
| German [17] | 1960 | Power = N × (L + P + I + M), |
| Where N = nuclear capability, L = land, I = industrial base, and M = military. | ||
| Cline [11] | 1975 | Power = (C + E + M) × (S + W), |
| Where C = critical mass (population and territory), E = economic capability, M = military capability, S = strategic purpose, and W = national will. | ||
| Matto [4] | 1977 | Power = (C + E + M) × (S + W + P), |
| Where C = critical mass (population and territory), E = economic capacity, M = military capacity, S = strategic concepts held by a state, W = national will, and P = capacity to persuade or convince. | ||
| Small and Singer [18] | 1982 | Power = (ME + AF + IP + EC + UP + TP)/6 |
| Where ME = military expenditure, AF = armed forces personnel, IP = iron production, EC = energy consumption, UP = urban population, and TP = total population. | ||
| Kadera and Sorokin [1] | 2004 | Power = (ME × AF × IP ×EC × UP ×TP)1/6, |
| Where symbols are the same as Small and Singer’s model above. | ||
| Chang [19] | 2004 | |
| Where CM = critical mass (population + land area), E = economic strength, and M = military strength. | ||
| Hafeznia et al. [9] | 2008 | Power = EC + PL + CL + SC + MI + TR + ST + TN + AS, |
| Where EC = economical factor, PL = political factor, CL = cultural factor, SC = social factor, MI = military factor, TR = territorial factor, ST = scientific and technological factor, TN = trans-national factor, and AS = astro space factor. | ||
| Yan [20] | 2008 | Power = (M + E + C) × P, |
| Where M = military power, E = economic power, C = cultural power, and P = political power. |
3.2. Measuring Sustainable Development and Competitiveness
Several approaches are ongoing to measure sustainability at the country level. A notable approach is the Global Competitiveness Index (GCI) developed by the World Economic Forum [21]. The GCI measures the economic foundations of national competitiveness using 12 pillars, which include over 100 indicators. According to the GCI, global economies are classified into foctor-, efficieny-, and innovation-driven stages. Based on the GCI, the GCR introduces two adjusted indices: Social sustainability coefficient and environmental sustainability coefficient. Then, the sustainable competitiveness (the sustainability-adjusted GCI) is measured by multiplying the GCI and the adjusted coefficients.
A second approach is the Human Development Index (HDI) released by the United Nations Development Program (UNDP) [22]. The HDI only uses three dimensions and the four simplest indicators: Health (life expectancy at birth), education (mean years of schooling and expected years of schooling), and standard of living (gross national income per capita). The HDI is the geometric mean of the three dimensional indices. Then, countries are divided into very high, high, medium, and low human development groups. Similar to GCI, HDI also adopts a series of adjusted indices to cover gender inequality and poverty.
Efforts have also been put into measuring specific aspects of social and environmental sustainability. For example, Van de Kerk and Manuel developed the Sustainable Society Index (the SSI) for sustainable society measurement [23]. The SSI is composed of 22 indicators in five categories: Personal development, clean environment, well-balanced society, sustainable use of resources, and sustainable world. In terms of environmental sustainability metrics, contributions include Ecological Footprint developed by WWF [24], and the Millennium Development Indicators developed by the United Nations [25].
4. Measuring Sustainable National Power
4.1. Framework of SNP Measurement
Based on the definition of sustainable national power, we calculate SNP by following three steps: (1) measuring CNP using a traditional approach; (2) introducing and measuring a SNP-Adjusted Index; and (3) calculating SNP by multiplying CNP and SNP-Adjusted Index (Equation (1)). The use of multiplication means that in extreme conditions, if CNP = 0 or SNP-Adjusted Index = 0, the final SNP = 0.
where CNP and SNP-Adjusted Index are calculated using Equations (2) and (3), which are described in the following two sections, respectively.
SNP = CNP × SNP-Adjusted Index
4.2. Measuring CNP
Based on previous CNP measurement models, we distinguish five dimensions, namely, critical mass (CM), economic strength (E), technological strength (T), military strength (M), and cultural appeal (CA) for CNP measurement. Each dimension is composed of a set of indicators (Table 2). Most of the indicators are derived from previous studies.
- Critical mass (CM). Adopted from Cline’s model, critical mass contains the very basic variables to form power: land, population, resources and energy.
- Economic strength (E). Only GDP is included in this dimension, as GDP is among the top power indices and even considered as the best single index of a nation’s power [26,27]. Here we use GDP to represent a nation’s economic capability.
- Technological strength (T). With the development of technology, it has become increasingly important for economic and military growth. We consider technological strength as an essential dimension of national power though it has been emphasized by only a few studies (e.g., [9]). We select R&D expenditure, number of researchers, scientific papers and patent applications as indicators to measure technological strength.
- Military strength (M). Military expenditure, armed forces personnel and nuclear capability are most frequently used indicators of military strength and thus are adopted in our model. In addition, we select arms imports and exports to represent the level of arms development.
- Cultural appeal (CA). It cannot be ignored that the influence of a nation’s culture is becoming increasingly significant. We consider cultural appeal as a dimension of comprehensive national power as Yan [20] and Hafeznia et al. [9] did. We use several indicators to measure cultural appeal involving the number of feature films, Olympic medals, world heritage sites, international fairs and exhibitions, and international students.
It should be noted that the dimensions of “hard power” and “soft power” are not explicitly distinguished in our model because “the distinction between hard power and soft power is not entirely persuasive” (p.xi in [13]). For example, as Nye pointed out, economic resources and military resources can produce both hard- and soft-power behavior [15].
The final CNP is calculated using Equation (2).
Indicator values are firstly normalized to 1–100 using either Equation (3) or (4). The CNP score is calculated by successive aggregations of scores from the lowest indicator level all the way up to the overall CNP score. Indicators within a dimension are aggregated with equal weight (i.e., an arithmetic mean is used). The final CNP scores are normalized to 0–100 (low–high).
Table 2.
Dimensions and indicators for CNP measurement.
| Critical Mass (CM) | Economic Strength (C) | Military (M) |
|---|---|---|
|
|
|
|
| |
|
| |
|
| |
| Technological Strength (T) | Cultural Appeal (CA) | |
|
| |
|
| |
|
| |
|
| |
|
4.3. Measuring SNP-Adjusted Index
4.3.1. Calculation of SNP-Adjusted Index
SNP-adjusted Index is calculated as the geometric mean of the Social-adjusted Index and Environmental-adjusted Index (Equation (5)). The use of geometric mean is adopted from HDI [28]. The adjusted indices are normalized to 0–1 (low–high).
where the calculation of Social-adjusted Index and Environmental-adjusted Index is described below.
SNP-adjusted Index = (Social-adjusted Index × Environmental-adjusted Index)1/2
4.3.2. Calculation of Social-Adjusted Index
Three dimensions have been identified and corresponding indicators are selected for measuring Social-adjusted Index as shown in Table 3:
- Healthy and decent life. A key element of a country’s power is its people. As stated by Merritt, “A healthy, skilled population may be a capability; an equally large but disease-ridden and illiterate population can be a load on a government's capacities” (p. 143 in [29]). A high income and improved sanitation facilities are basic requirements for a healthy and decent life. Obviously, a high standard of living will naturally expect a long life expectancy.
- Education. Education is a prerequisite for individuals to master basic living skills. Furthermore, good quality of higher education plays the fundamental role in an innovative society. We use years of schooling and literacy rate to represent basic level of education. Particularly, we adopt tertiary school enrollment to measure the potential of education to creativity and technology for a country. In addition, expenditure on education is included because it is the guarantee of educational resources and facilities.
- Well-balanced society. A well-balanced society consists of a number of elements. Government performance is a prominent one. We select the Worldwide Governance Indicators (WGI) developed by World Bank [30] to measure governance. The WGI is a composite index measured by six dimensions of governance (namely, voice and accountability, political stability and absence of violence, government effectiveness, regulatory quality, rule of law, and control of corruption). Other most relevant indicators such as gender inequality, poverty, unemployment, population growth, and aging population are also included to measure the society dimension.
Table 3.
Dimensions and indicators of Social-adjusted Index measurement.
| Healthy and Decent life | Education | Well-Balanced Society |
|---|---|---|
|
|
|
|
|
|
|
|
|
|
| |
|
| |
|
4.3.3. Calculation of Environmental-Adjusted Index
We highlight three dimensions for measuring Environmental-adjusted Index (Table 4):
- Renewable resources. Efficient use of renewable resources can benefit our future generations by decreasing traditional fossil energy depletion and reducing greenhouse gas emissions. Promoting uses of renewable resources can also facilitate new technique development and initiate new markets. Balancing the use of renewable and non-renewable resources to meet present’s needs while support next generations plays a critical role in environmental sustainability. Here we use renewable energy consumption, renewable freshwater resources and renewable source supply to measure this dimension.
- Natural resources and biodiversity. Biodiversity provides raw materials for our daily life and supports economic growth. It is also the key to maintain the stability of the planet ecosystem. Here, we use a composite indicator to measure the biodiversity potential.
- Carbon reduction. Climate change has posed great challenges on human beings such as global warming and extreme weather events [31,32]. In its latest report, the Intergovermental Panel on Climate Change (IPCC) concluded that the global mean-surface temperature increased 0.85 degree from 1880 to 2012 and that the increase of carbon dioxide (CO2) emissions in the atmosphere is the main driving force [33]. Responding to climate change requires intergovernmental cooperation, but individual counties should take corresponding responsibilities. Developing countries should keep a good balance between economic development and greenhouse gas emissions. Here, we use CO2 emissions to measure the level of a nation’s carbon reduction.
Table 4.
Dimensions and indicators of Environmental-adjusted Index measurement.
| Renewable Resources | Natural Resources and Biodiversity | Carbon Reduction |
|---|---|---|
|
|
|
|
| |
|
|
5. Visualizing Power Using Density-Equalizing Maps
“Cartography are more than techniques and maps are more than tools” [34]. Maps provide us with not only visualization of geographically distributed data, but also an approach to further understand the information and explore the pattern under the data. The thematic map, such as choropleth maps, the commonly used form to present data, has the advantage of being easily recognized. However, such thematic maps are criticized for their visual inequality [35,36].
Different from conventional thematic maps, density-equalizing maps, or value-by-area maps, or cartograms, distort areas of polygons in proportion not to on the ground area but to its attribute values, making them appear to be visually striking and attention attracting. From the perspective of Cartography, density-equalizing maps are projections from the geographic space to the conceptual space [37]. Cartograms provide us with a visual equality representation and have become a popular perspective to rethink reality [38,39].
Cartograms are not new. Since the first cartogram created by Raisz [40], which used rectangles to show distribution of various economic attributes of the United States in 1934, a great number of cartograms have been generated and applied to mapping different fields, such as census, election returns, and public health. Probably the most famous cartogram is the US election results designed by Gastner and colleagues [36,41]. The cartogram of the US election results outperforms the traditional choropleth maps in that the density-equalizing maps treat every vote with equal importance, resulting in a higher accuracy of the distribution of the two sides of the participant supporters. Dorling created Dorling cartograms that use circles regardless of the shape and topology for census mapping [35]. Dorling contended that “each person and each household is given equal representation in the image” [35]. Another example is the Worldmapper project (http://www.worldmapper.org) consisting of numerous-area cartograms of global socioeconomic, environmental, and political conditions that aim at reshaping our understanding of the world [42,43,44]. Others cartograms are used to present state spending on research and development (R&D) [39], global earthquake risk [45], population and wealth distribution [46], to support education in school cartography [47], and so on. Researchers in public health also employ density-equalizing maps to visualize and analyze disease and health-related issues (e.g. [48,49,50,51,52]).
Cartograms are able to inherently represent the process of power growth and distribution. First, the cartogram generation process is analogous to the state competition for living space. Algorithms to generate cartograms ensure that the total area of the resultant maps is the same as that of the original (i.e., the space and resources are limited). Polygons that have higher values will gain more area (i.e., more powerful states are more competitive for more living spaces and resources for growth; on the contrary, less powerful states are restrained). Consequently, the space is redistributed according to state power and the geographical space is transformed into a power space. Second, both living (interest) space and cartogram are conceptual spaces instead of a real space. The cartogram can be viewed as a metaphor of the power.
6. A Case Study
6.1. Study Area
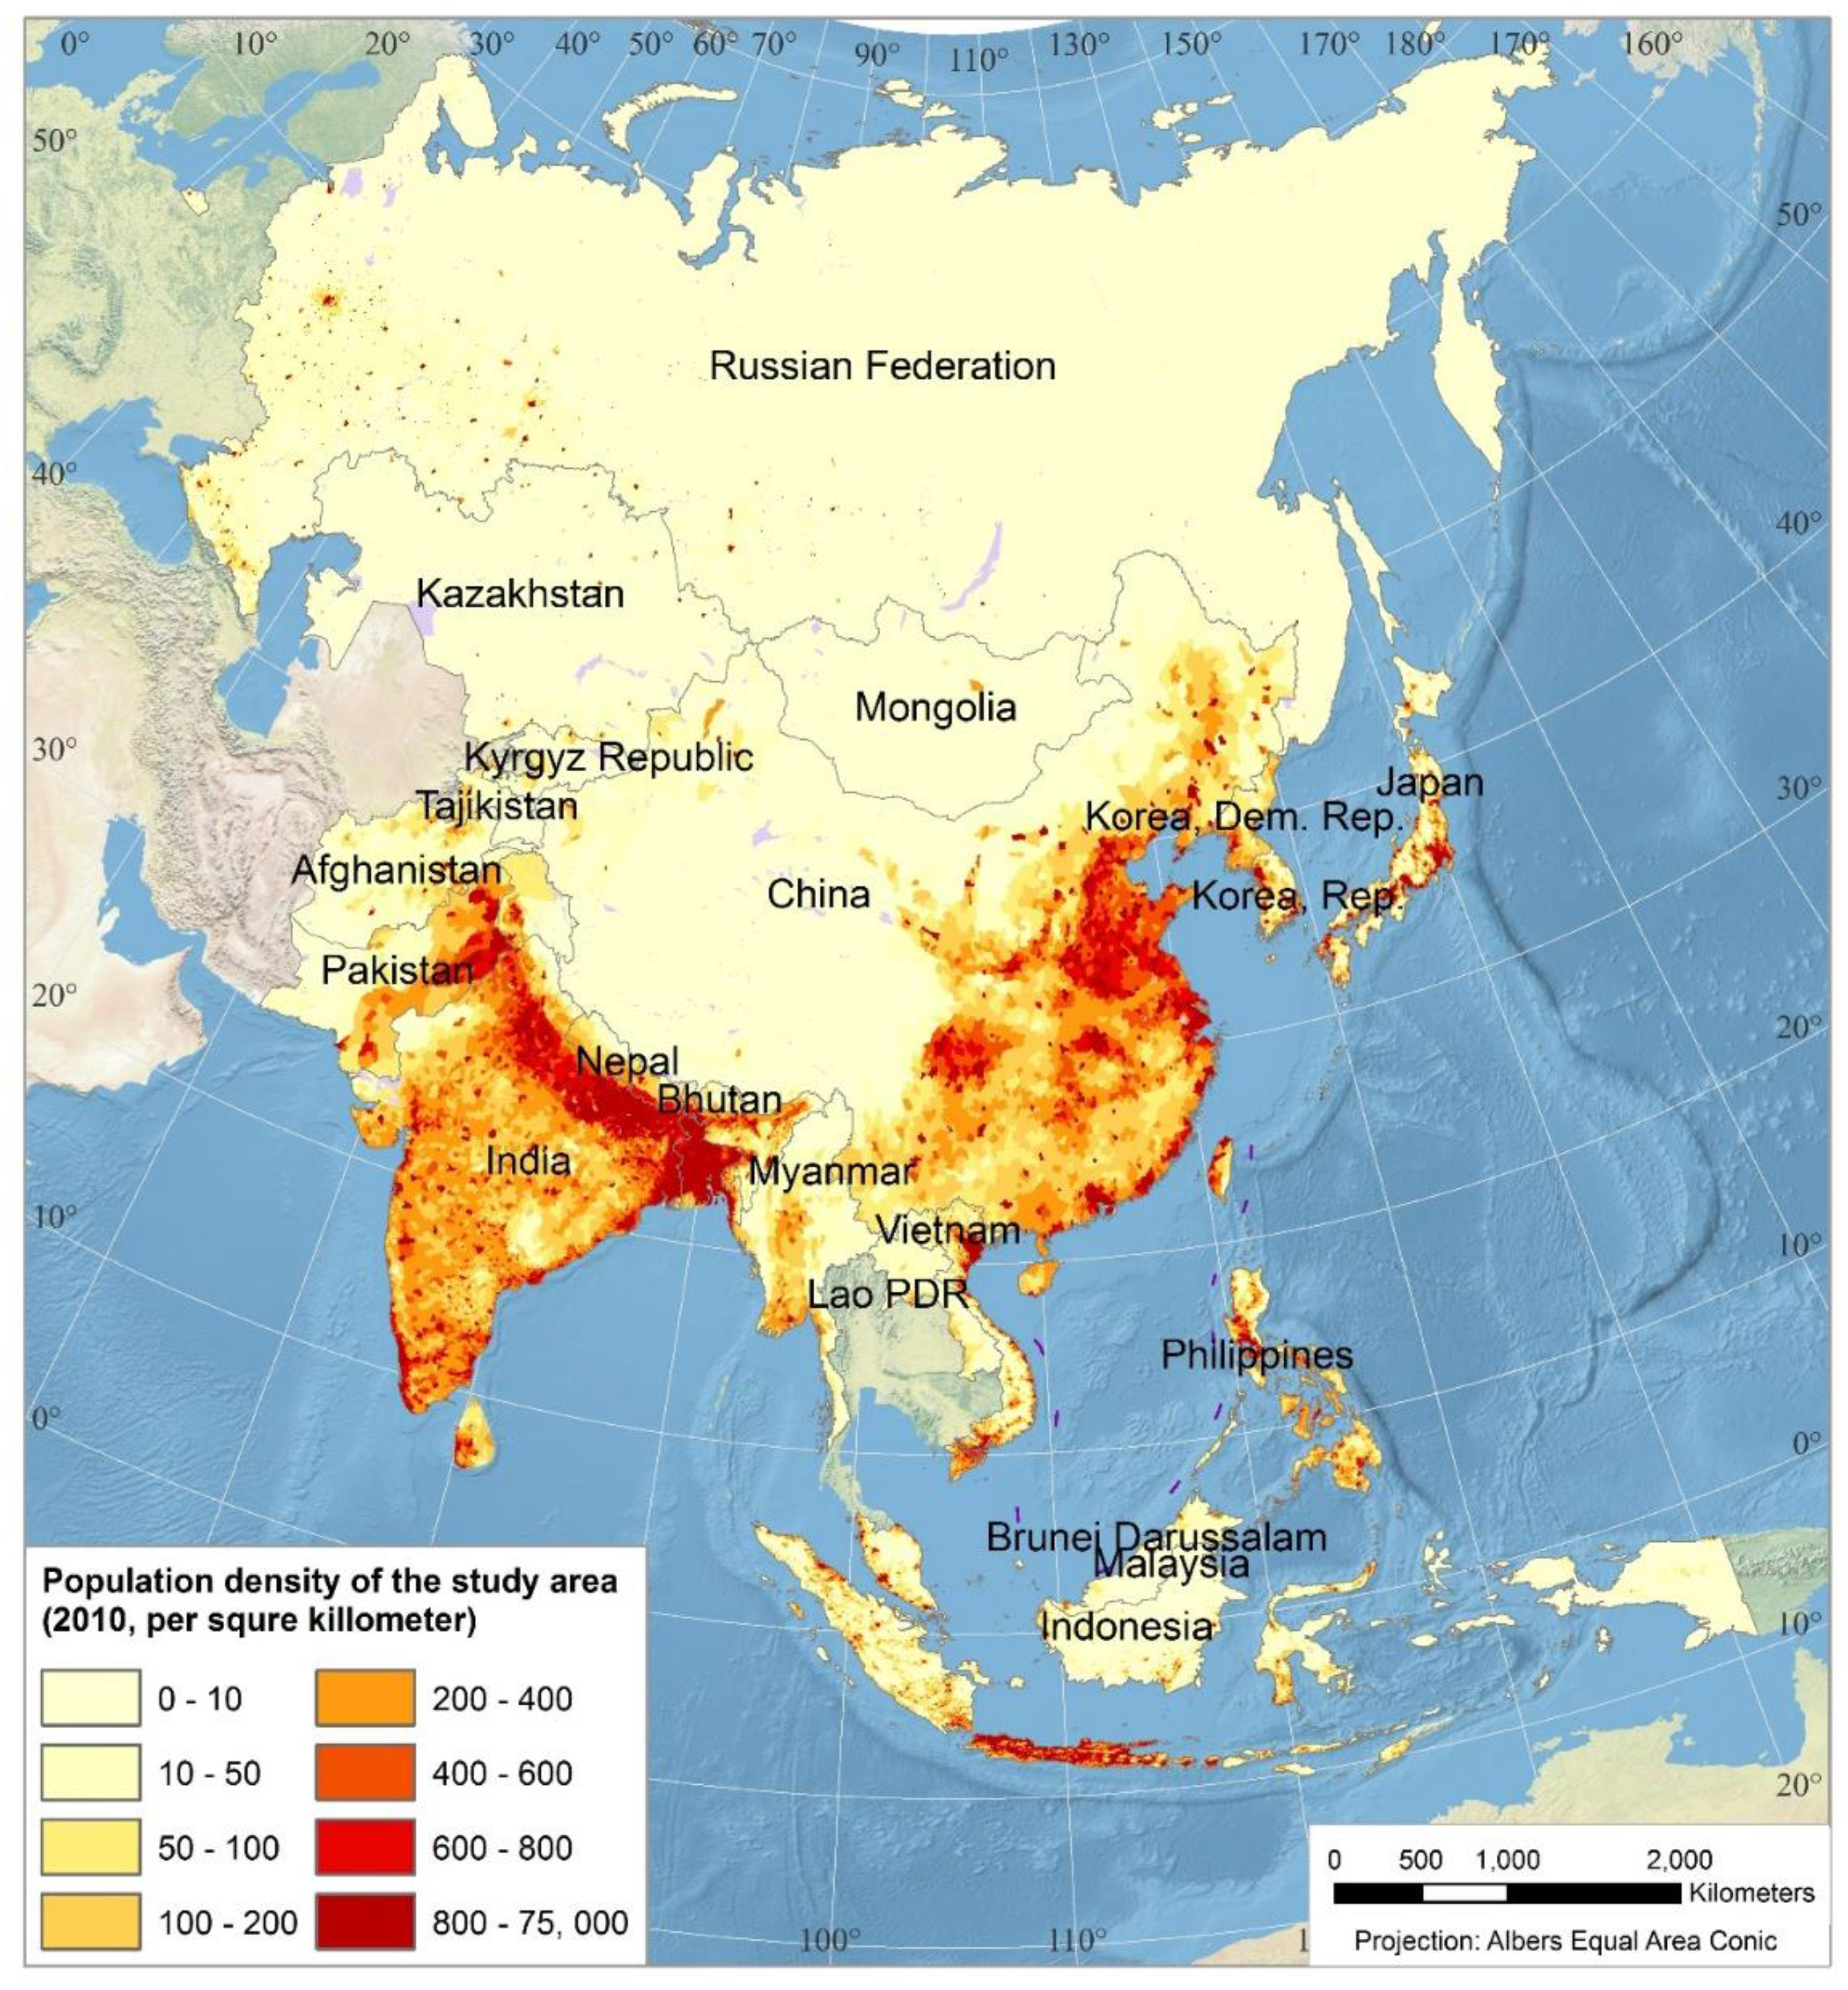
China and its neighboring countries are selected as the study area (21 countries in total, see Figure 1). The study area is chosen because the countries in this area differ significantly in socioeconomic development level (consisting of developed, developing, and undeveloped countries; the world’s top two largest populations), history and culture, political institution, and natural environment (including inland, maritime space, and island countries; the world’s first and third largest land areas), making the power composition very complicated. Furthermore, China is located where Spykman called “rimland” sections of the Eurasia continent [53]. The rise of China in the past few decades has attracted much attention on its power growth [54,55,56].

Figure 1.
Study area and population density.
Figure 1.
Study area and population density.
6.2. Data and Software
Multiple data sources are used for CNP measurement (see Supplementary Material), such as World Bank Open Data [57] and World Economic Forum (WEF) Reports [21,58]; the estimated GDP of 2019 are from World Economic Outlook Database of International Monetary Fund [59]; the vector boundary shapefiles of countries and raster basemap with shaded relief and water are from free data of Natural Earth (http://www.naturalearthdata.com/). Please refer to the Supplementary Material for a full list of the indicators and the raw data of the measurements.
Numerous algorithms has been proposed to generate cartograms aimed at controlling the shape distortion, preserving the topology of the polygons to enhance the readability, and improving the computing efficiency (e.g., [36,60,61,62,63,64,65]). For example, Dougenik, et al. [66] presented an algorithm that assumes forces exerted from each polygon centroid to the coordinates of boundary point, making these points displaced. After a given number of iterations, each polygon reaches its desired area. Gastner and Newman [36] proposed a diffusion-based method to construct density-equalizing maps. This algorithm let the population density flow from a high-density area to a low-density area until density is equal. The Gastner and Newman method exhibits better results than previous ones and, thus, is adopted in this paper.
Many web tools and software can generate cartograms, such as ArcView [67], GeoDa [68], ScapeToad (http://scapetoad.choros.ch/), and MAPresso (http://www.mapresso.com/). In this paper, we adopted Gastner and Newman’s algorithm [36], which was integrated into ESRI ArcGIS 10.0 (http://www.esri.com) as an extension tool by Tom Gross to generate density-equalizing maps [69]. Projection of Asia North Albers Equal Area Conic (datum: WGS 1984) was used before transforming to cartograms. Since in the transformed spaces, projection, data, and scale bar lose their original meaning in geographic space, these information was excluded in resultant maps. All maps were designed and printed from ESRI ArcGIS. In order to facilitate region recognition, reference graticules of 10 degree and a raster basemap with shaded relief and water are used. For maps of aggregated index, an e based exponential transform was applied to the data before the map generation to reach a visually striking effect, which, meanwhile, exaggerated the differences among countries.
6.3. Results
6.3.1. Power Distributions in Conceptual Spaces
Figure 2 and Figure 3 show the results of the CNP and SNP scores of 2014, respectively. All counties are distorted according to the country population and the space is reshaped on this brand new display. The top three counties are analyzed below.
China tops the CNP scores, followed by Japan, Russia, India, and South Korea (Table 5). The country ranks at the top in four dimensions (critical mass, economic strength, technological strength, and cultural appeal) of CNP (Table 6). The great quantity of population, land area, and natural resources lays a solid foundation for development of economy, which further enhances the strength of technology and military. China’s high investment in research and development (R&D) enhances the technological output in research. Furthermore, China’s military strength is among top levels (2nd) in the region with its highest expenditure, modernized armed forces and strong nuclear deterrence. Finally, the cultural appeal also constitutes another strength.
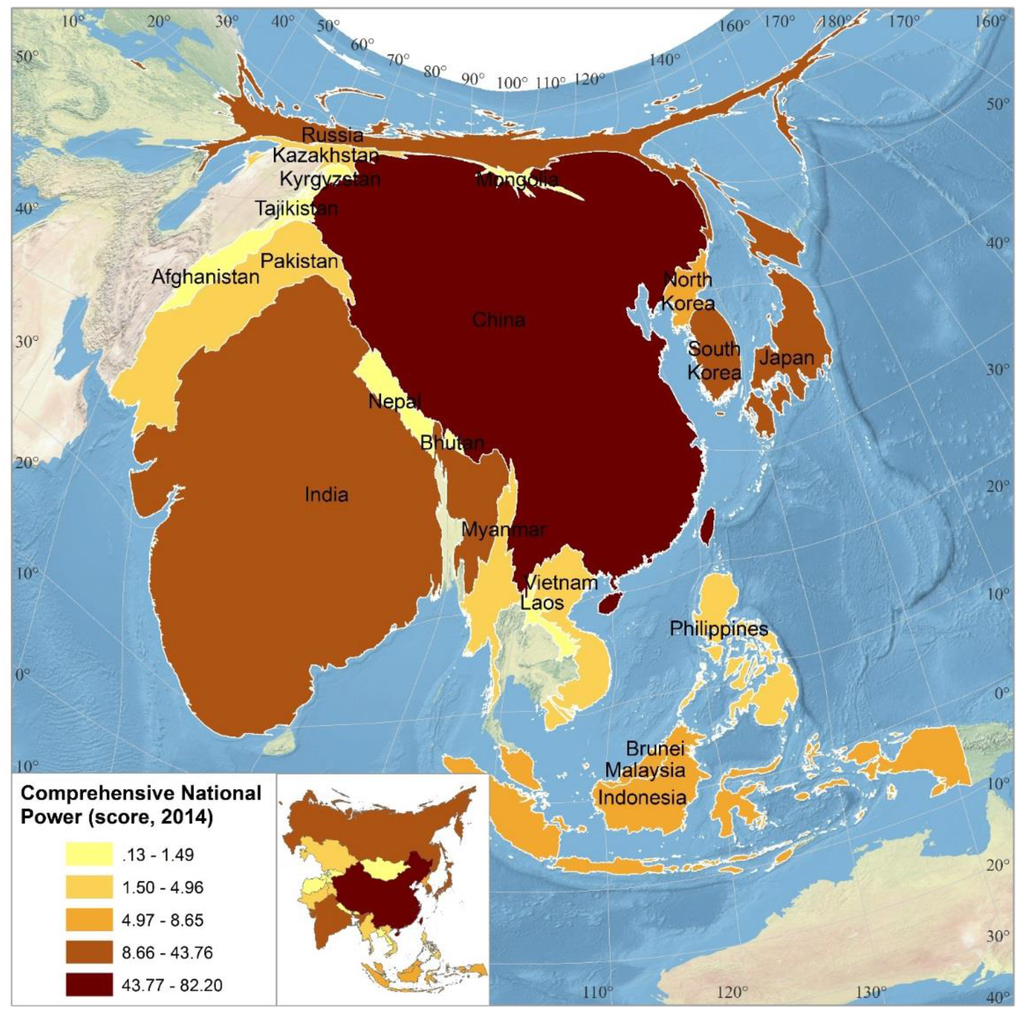
Figure 2.
Cartogram of population and CNP of 2014. Note that the map is a two variable value-by-area cartogram, in which the state size represents the population and state color represents the CNP scores.
Figure 2.
Cartogram of population and CNP of 2014. Note that the map is a two variable value-by-area cartogram, in which the state size represents the population and state color represents the CNP scores.

However, China exhibits the low competiveness in SNP-adjusted index (12th) although it stands in the first place of the final SNP score. The weaknesses in healthy and decent life (8th), education (9th), and a well-balanced society (9th) leads to its 10th position in the social-adjusted SNP index (Table 7). China’s low renewable energy consumption and low per capita renewable water resources contribute to its 13th place in renewable resource scores (Table 8). Another concern comes from its high Carbon Dioxide emissions. High potential of biodiversity and a relative low speed of natural resources depletion constitute a notable strength for environmental sustainability.
Japan ranks the third in CNP but goes up to second in the SNP owing to its better performance in SNP-adjusted index (1st). As an island country, Japan is in shortage of land area and natural resources, resulting in a lower rank in the critical mass dimension (9th). However, the highly developed economy (2nd) shows high competitiveness in the study area. Outstanding performance is also revealed across indicators of technology (2nd) with high research and development (R&D) investment and innovative outputs. Having a medium size but highly informationalized military force with no nuclear forces and high military spending, Japan displays strong military strength (7th). Finally, the CNP of Japan is further enhanced by its strong cultural influence (2nd).
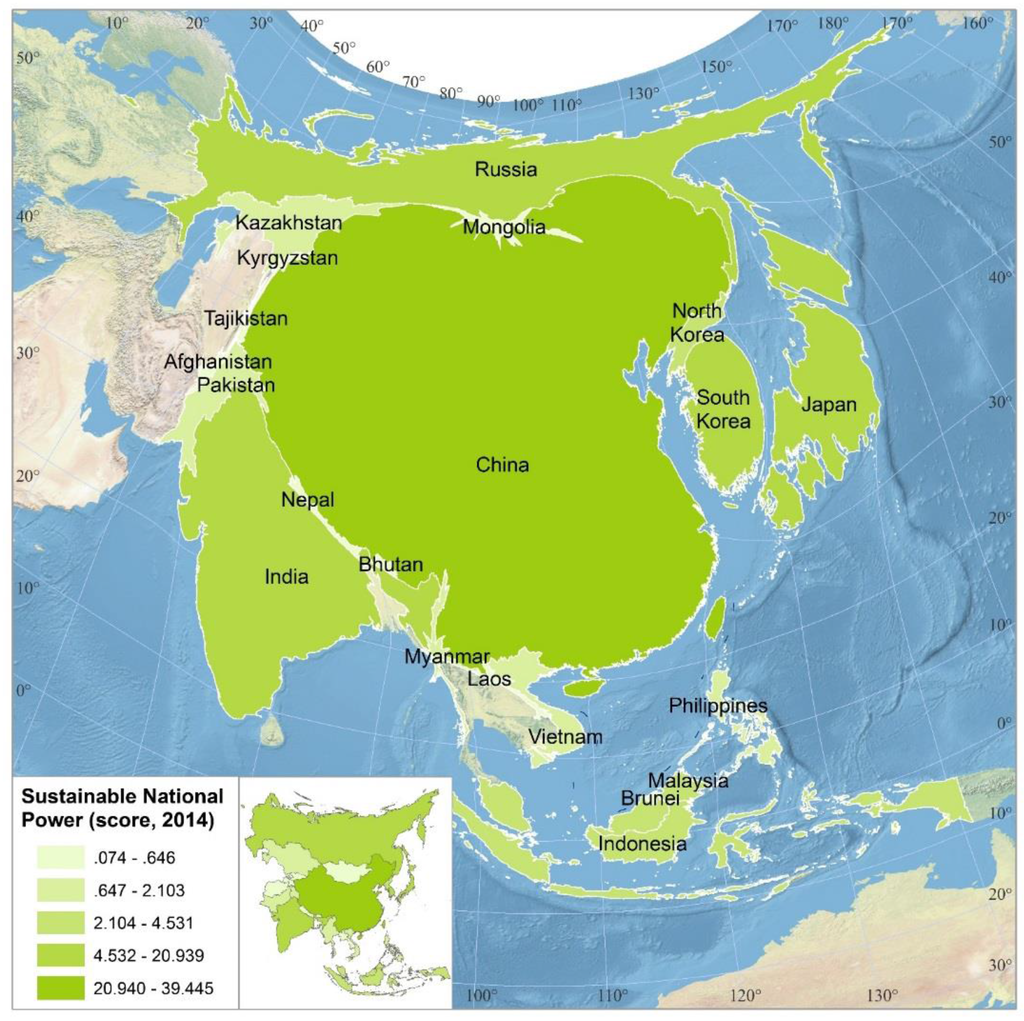
Figure 3.
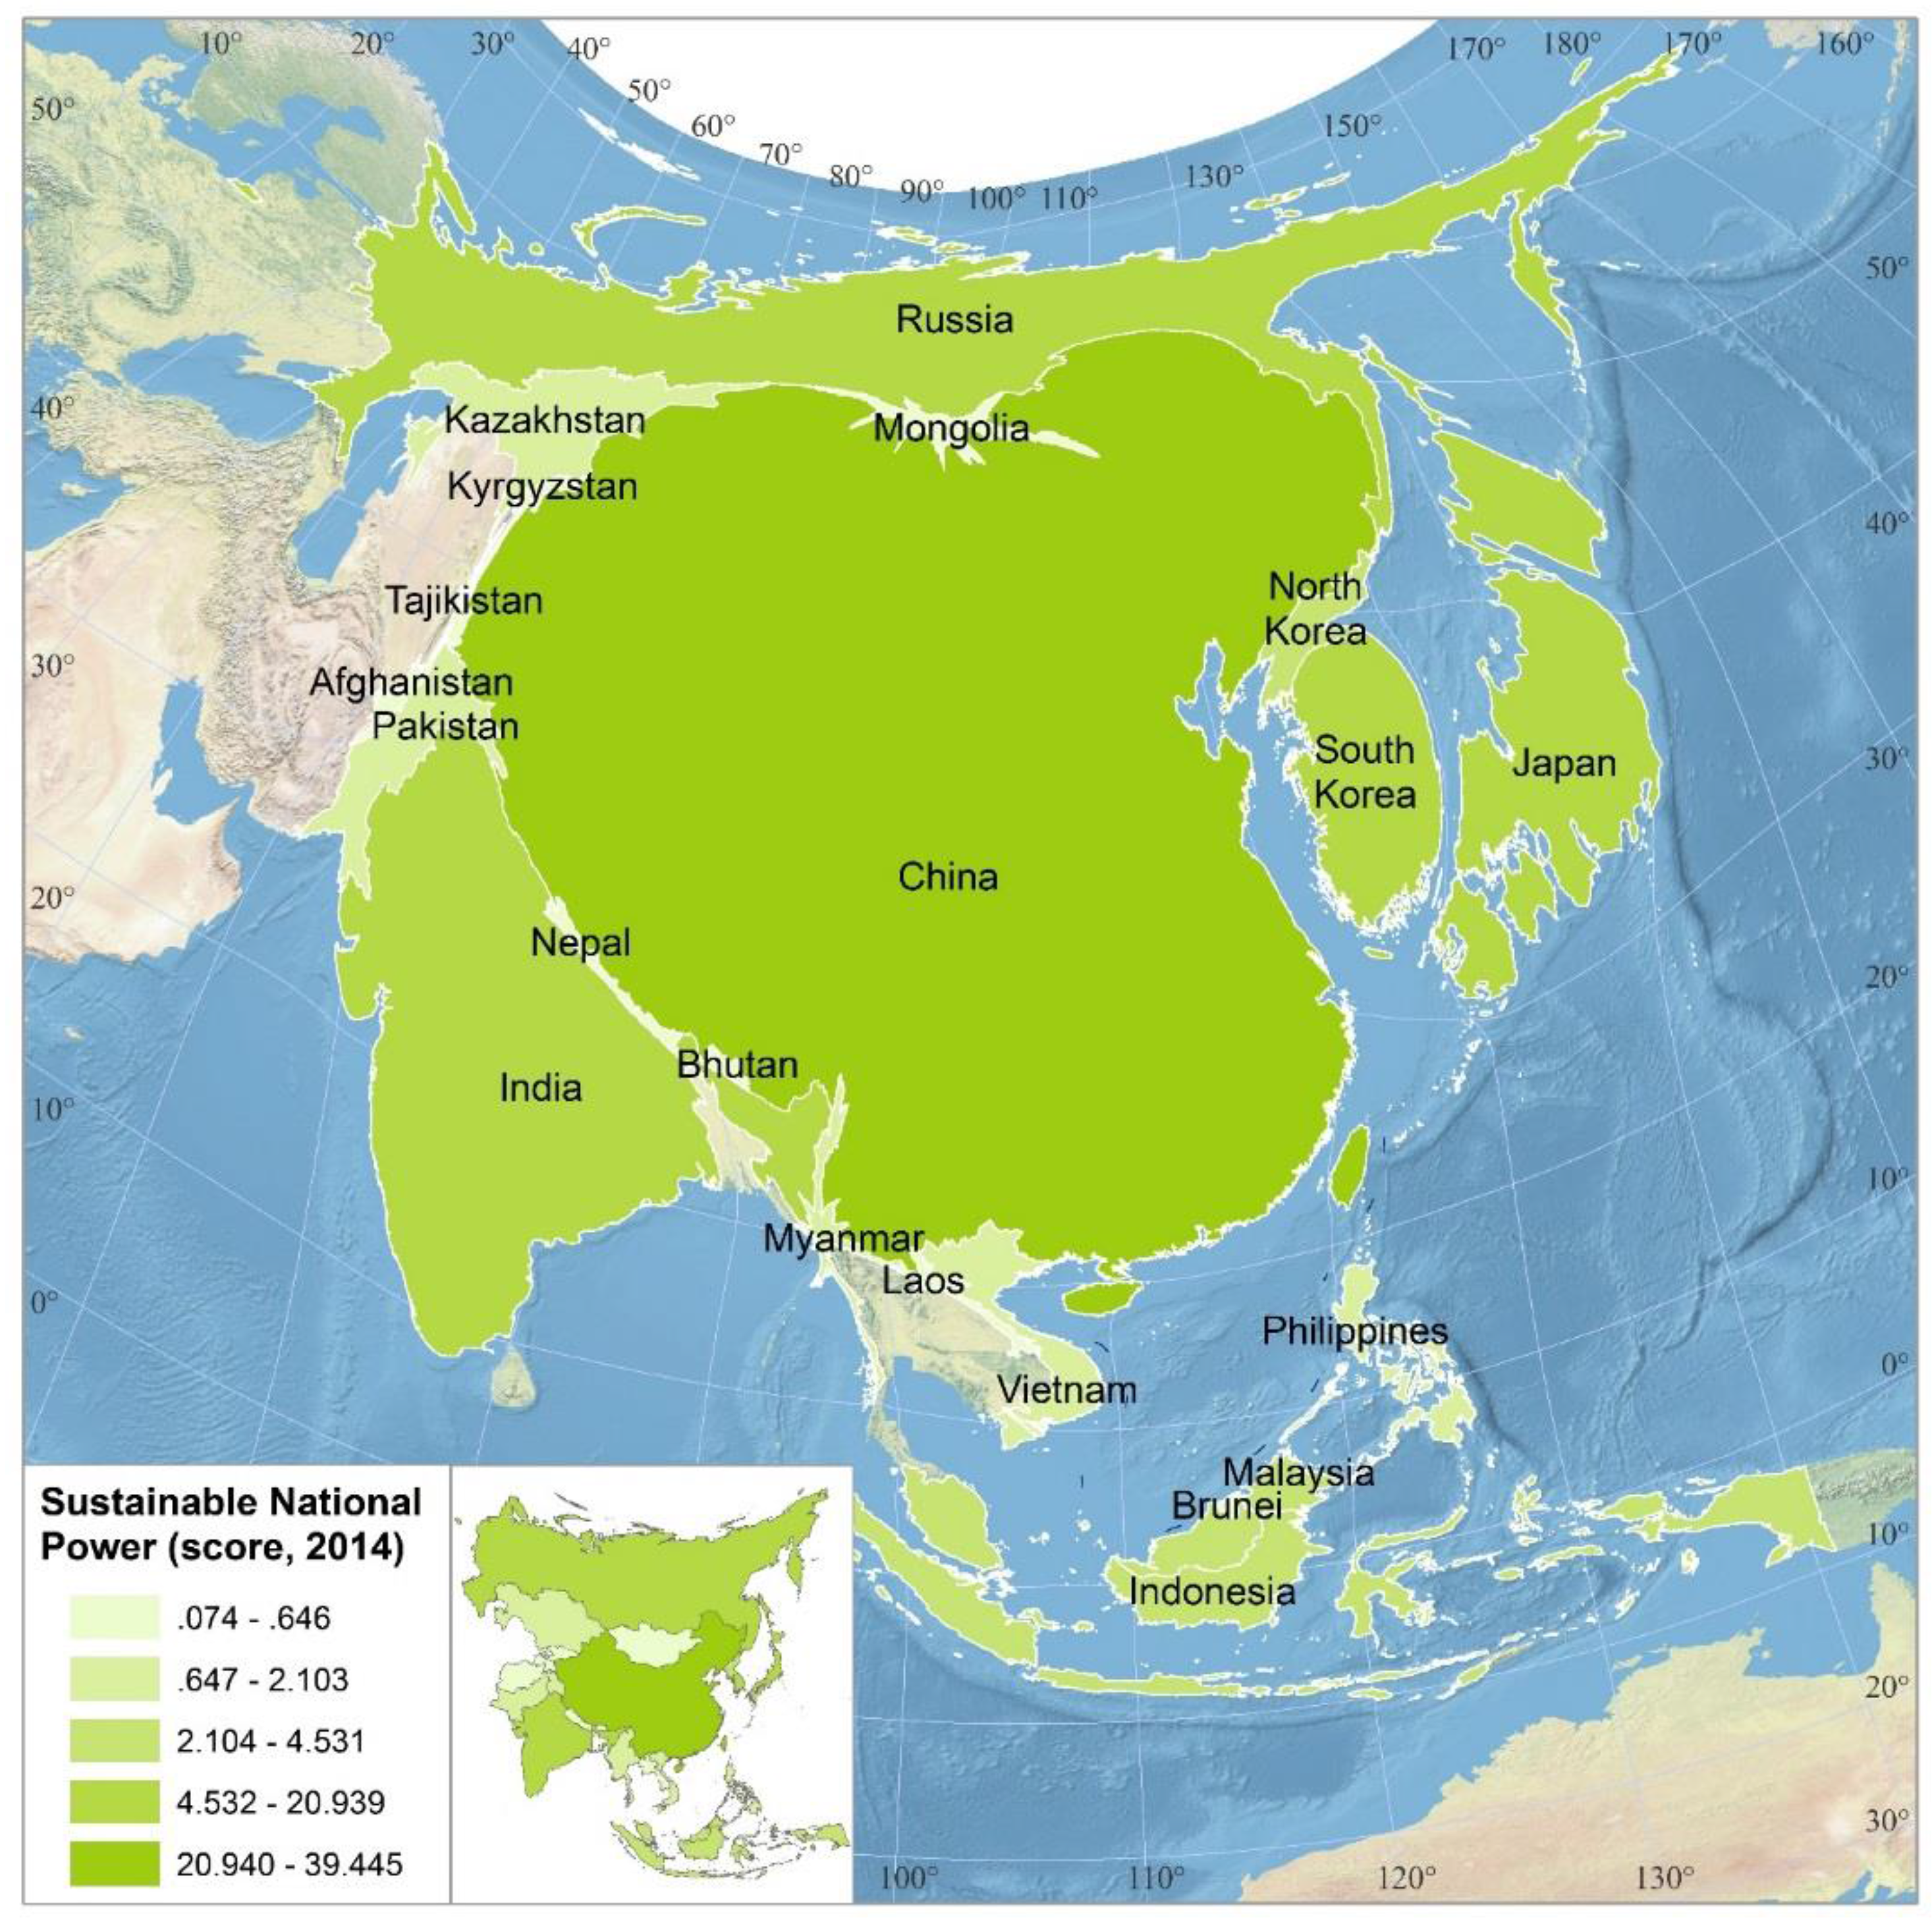
Cartogram of carbon dioxide emissions and SNP of 2014. Note that the map is a two variable value-by-area cartogram, in which the state size represents the total CO2 emissions and state color represents the SNP scores.
Figure 3.
Cartogram of carbon dioxide emissions and SNP of 2014. Note that the map is a two variable value-by-area cartogram, in which the state size represents the total CO2 emissions and state color represents the SNP scores.
Japan also exhibits high competitiveness in the dimension of social-adjusted SNP index (2nd) with its long life expectancy, high GNI per capita, a full coverage of improved sanitation facilities, and a high level of education. The society is supported by its high performance of governance and gender equality. A major concern comes from its negative population growth and a high degree of aging population, resulting in a low rank (14th) of the society dimension. However, Japan presents low competitiveness in environmental-adjusted SNP index (13th) because of its low use of renewable resources (20th) and high carbon dioxide emission per capita (17th).
Russia stands in the third position in SNP on the back of its strong CNP (2nd). Owning to being the largest land in the world with abundant energy and natural resources, Russia exhibits superiorities in the basic power dimension (2nd). The quantity of economy (4th) and technology (4th) show good performance. Nevertheless, Russia’s military strength tops the list, making it a globally powerful force. However, Russia reveals low sustainable performance (13th) resulted from social-adjusted SNP index (6th) and environmental-adjusted index (18th). Efforts need to be made to improve governance and reduce unemployment rates. Russia is also faced with an aging population. In terms of environmental sustainability, low use of renewable resources, high depletion of natural resources, and high carbon dioxide emissions contribute to the main weaknesses.
Table 5.
Results of CNP, SNP-Adjusted Index and SNP of 2014.
| Country | CNP | SNP-Adjusted Index | SNP | |||
|---|---|---|---|---|---|---|
| Score | Rank | Score | Rank | Score | Rank | |
| China | 81.03 | 1 | 0.53 | 10 | 42.58 | 1 |
| Japan | 39.86 | 3 | 0.60 | 1 | 23.74 | 2 |
| Russian Federation | 45.55 | 2 | 0.49 | 13 | 22.35 | 3 |
| Korea, Rep. | 23.19 | 5 | 0.58 | 2 | 13.35 | 4 |
| India | 30.02 | 4 | 0.43 | 17 | 12.93 | 5 |
| Indonesia | 8.52 | 6 | 0.56 | 6 | 4.76 | 6 |
| Malaysia | 7.13 | 7 | 0.57 | 4 | 4.06 | 7 |
| Korea, Dem. Rep. | 5.09 | 9 | 0.45 | 15 | 2.29 | 8 |
| Vietnam | 3.92 | 11 | 0.57 | 5 | 2.22 | 9 |
| Pakistan | 5.09 | 8 | 0.37 | 18 | 1.90 | 10 |
| Philippines | 2.82 | 12 | 0.54 | 9 | 1.52 | 11 |
| Kazakhstan | 4.11 | 10 | 0.35 | 19 | 1.42 | 12 |
| Myanmar | 2.16 | 13 | 0.52 | 12 | 1.12 | 13 |
| Mongolia | 1.48 | 14 | 0.43 | 16 | 0.64 | 14 |
| Nepal | 0.85 | 16 | 0.48 | 14 | 0.41 | 15 |
| Afghanistan | 1.28 | 15 | 0.29 | 20 | 0.37 | 16 |
| Kyrgyz Republic | 0.68 | 17 | 0.54 | 8 | 0.37 | 17 |
| Lao PDR | 0.41 | 19 | 0.52 | 11 | 0.21 | 18 |
| Tajikistan | 0.35 | 20 | 0.55 | 7 | 0.19 | 19 |
| Brunei Darussalam | 0.50 | 18 | 0.29 | 21 | 0.14 | 20 |
| Bhutan | 0.13 | 21 | 0.57 | 3 | 0.07 | 21 |
Table 6.
Results of five CNP dimensions.
| Country | Critical Mass | Economic Strength | Technological Strength | Military Strength | Cultural Appeal | |||||
|---|---|---|---|---|---|---|---|---|---|---|
| Score | Rank | Score | Rank | Score | Rank | Score | Rank | Score | Rank | |
| China | 89.33 | 1 | 100.00 | 1 | 74.52 | 1 | 61.84 | 2 | 79.43 | 1 |
| Russian Federation | 62.64 | 2 | 17.94 | 4 | 21.45 | 4 | 73.04 | 1 | 52.68 | 3 |
| India | 38.29 | 3 | 19.94 | 3 | 10.41 | 5 | 40.89 | 3 | 40.57 | 4 |
| Indonesia | 14.84 | 4 | 8.56 | 6 | 0.70 | 11 | 8.26 | 8 | 10.23 | 7 |
| Kazakhstan | 10.01 | 5 | 2.03 | 10 | 2.82 | 7 | 1.22 | 15 | 4.49 | 10 |
| Pakistan | 5.68 | 6 | 2.37 | 9 | 1.04 | 9 | 13.04 | 6 | 3.34 | 12 |
| Malaysia | 3.83 | 7 | 3.14 | 7 | 8.13 | 6 | 3.14 | 12 | 17.40 | 6 |
| Vietnam | 3.72 | 8 | 1.78 | 11 | 0.71 | 10 | 6.36 | 10 | 7.05 | 8 |
| Japan | 3.49 | 9 | 44.41 | 2 | 72.97 | 2 | 10.33 | 7 | 68.13 | 2 |
| Philippines | 2.97 | 10 | 2.73 | 8 | 0.48 | 13 | 1.95 | 13 | 5.98 | 9 |
| Myanmar | 2.90 | 11 | 0.60 | 12 | 0.01 | 16 | 6.85 | 9 | 0.41 | 18 |
| Mongolia | 2.79 | 12 | 0.10 | 16 | 0.02 | 15 | 0.20 | 20 | 4.32 | 11 |
| Afghanistan | 2.07 | 13 | 0.18 | 13 | 0.00 | 21 | 4.02 | 11 | 0.13 | 20 |
| Korea, Rep. | 1.55 | 14 | 13.60 | 5 | 45.49 | 3 | 15.15 | 5 | 40.15 | 5 |
| Korea, Dem. Rep. | 1.16 | 15 | 20 | 0.64 | 12 | 15.46 | 4 | 3.09 | 13 | |
| Nepal | 0.84 | 16 | 0.17 | 14 | 0.29 | 14 | 1.36 | 14 | 1.61 | 15 |
| Lao PDR | 0.74 | 17 | 0.10 | 17 | 0.01 | 18 | 1.11 | 16 | 0.08 | 21 |
| Brunei Darussalam | 0.49 | 18 | 0.15 | 15 | 1.13 | 8 | 0.32 | 17 | 0.41 | 19 |
| Kyrgyz Republic | 0.42 | 19 | 0.05 | 19 | 0.01 | 17 | 0.22 | 18 | 2.72 | 14 |
| Tajikistan | 0.35 | 20 | 0.07 | 18 | 0.01 | 19 | 0.21 | 19 | 1.10 | 16 |
| Bhutan | 0.09 | 21 | 0.00 | 20 | 0.00 | 20 | 0.00 | 21 | 0.56 | 17 |
Table 7.
Results of dimensions of social-adjusted index.
| Country | Healthy and Decent Life | Education | Well-balanced Society | Social-Adjusted SNP Index | ||||
|---|---|---|---|---|---|---|---|---|
| Score | Rank | Score | Rank | Score | Rank | Score | Rank | |
| Korea, Rep. | 0.93 | 2 | 0.93 | 1 | 0.68 | 4 | 0.85 | 1 |
| Japan | 1.00 | 1 | 0.73 | 4 | 0.53 | 14 | 0.75 | 2 |
| Malaysia | 0.71 | 4 | 0.67 | 7 | 0.80 | 1 | 0.73 | 3 |
| Brunei Darussalam | 0.79 | 3 | 0.61 | 8 | 0.75 | 2 | 0.72 | 4 |
| Kazakhstan | 0.64 | 5 | 0.72 | 6 | 0.66 | 7 | 0.67 | 5 |
| Russian Federation | 0.54 | 7 | 0.80 | 2 | 0.53 | 13 | 0.63 | 6 |
| Kyrgyz Republic | 0.44 | 10 | 0.72 | 5 | 0.60 | 8 | 0.59 | 7 |
| Vietnam | 0.46 | 9 | 0.58 | 11 | 0.68 | 5 | 0.57 | 8 |
| Mongolia | 0.30 | 15 | 0.74 | 3 | 0.67 | 6 | 0.57 | 9 |
| China | 0.48 | 8 | 0.60 | 9 | 0.59 | 9 | 0.55 | 10 |
| Tajikistan | 0.41 | 12 | 0.59 | 10 | 0.54 | 12 | 0.51 | 11 |
| Philippines | 0.38 | 13 | 0.53 | 13 | 0.55 | 10 | 0.49 | 12 |
| Korea, Dem. Rep. | 0.57 | 6 | 0.40 | 21 | 0.49 | 13 | ||
| Indonesia | 0.36 | 14 | 0.54 | 12 | 0.49 | 17 | 0.46 | 14 |
| Bhutan | 0.24 | 17 | 0.28 | 17 | 0.70 | 3 | 0.40 | 15 |
| Myanmar | 0.43 | 11 | 0.25 | 18 | 0.52 | 15 | 0.40 | 16 |
| Lao PDR | 0.30 | 16 | 0.31 | 16 | 0.55 | 11 | 0.38 | 17 |
| Nepal | 0.15 | 19 | 0.37 | 14 | 0.50 | 16 | 0.34 | 18 |
| India | 0.14 | 20 | 0.34 | 15 | 0.48 | 18 | 0.32 | 19 |
| Pakistan | 0.20 | 18 | 0.12 | 19 | 0.47 | 19 | 0.26 | 20 |
| Afghanistan | 0.00 | 21 | 0.09 | 20 | 0.46 | 20 | 0.18 | 21 |
Table 8.
Results of dimensions of environmental-adjusted index.
| Country | Renewable Resources | Natural Resources and Biodiversity | Carbon Reduction | Environmental-Adjusted Index | ||||
|---|---|---|---|---|---|---|---|---|
| Score | Rank | Score | Rank | Score | Rank | Score | Rank | |
| Bhutan | 1.00 | 1 | 0.48 | 11 | 0.97 | 6 | 0.82 | 1 |
| Lao PDR | 0.62 | 4 | 0.52 | 9 | 1.00 | 2 | 0.71 | 2 |
| Nepal | 0.68 | 2 | 0.39 | 12 | 1.00 | 1 | 0.69 | 3 |
| Indonesia | 0.30 | 7 | 0.82 | 1 | 0.91 | 12 | 0.68 | 4 |
| Myanmar | 0.67 | 3 | 0.34 | 14 | 1.00 | 3 | 0.67 | 5 |
| Philippines | 0.28 | 8 | 0.54 | 7 | 0.97 | 7 | 0.60 | 6 |
| Tajikistan | 0.47 | 5 | 0.33 | 15 | 0.99 | 4 | 0.60 | 7 |
| India | 0.26 | 10 | 0.55 | 6 | 0.94 | 10 | 0.58 | 8 |
| Vietnam | 0.25 | 11 | 0.49 | 10 | 0.92 | 11 | 0.56 | 9 |
| Pakistan | 0.32 | 6 | 0.32 | 16 | 0.97 | 8 | 0.54 | 10 |
| Kyrgyz Republic | 0.27 | 9 | 0.27 | 18 | 0.96 | 9 | 0.50 | 11 |
| China | 0.12 | 13 | 0.65 | 3 | 0.72 | 14 | 0.50 | 12 |
| Japan | 0.05 | 20 | 0.75 | 2 | 0.62 | 17 | 0.47 | 13 |
| Afghanistan | 0.07 | 18 | 0.34 | 13 | 0.99 | 5 | 0.46 | 14 |
| Malaysia | 0.11 | 15 | 0.55 | 5 | 0.68 | 16 | 0.44 | 15 |
| Korea, Dem. Rep. | 0.11 | 14 | 0.26 | 19 | 0.88 | 13 | 0.42 | 16 |
| Korea, Rep. | 0.07 | 16 | 0.59 | 4 | 0.51 | 18 | 0.39 | 17 |
| Russian Federation | 0.14 | 12 | 0.53 | 8 | 0.48 | 19 | 0.38 | 18 |
| Mongolia | 0.07 | 17 | 0.19 | 20 | 0.72 | 15 | 0.33 | 19 |
| Kazakhstan | 0.02 | 21 | 0.17 | 21 | 0.34 | 20 | 0.18 | 20 |
| Brunei Darussalam | 0.06 | 19 | 0.28 | 17 | 0.00 | 21 | 0.11 | 21 |
6.3.2. Strength Changes Overtime: Power Redistribution
Spykman [70] pointed that “the elements contributing to strength are not static but dynamic”. The power itself is constantly changing and, therefore, a dynamic understanding of national power should be emphasized. With the high development during the past few decades, there is initial evidence showing that power is redistributed. The most obvious reflection is economic quantity. This power transition process is visualized vividly in Figure 4. For comparison, statistical data of the top five are shown in Figure 5. Japan became the largest economy of this region (the second in the world) in late 1960s and kept its position for over 40 years until China overtook it in 2010. China’s economy continues to grow rapidly and the gap is broadening. China has become the largest trading nation with a trade to GDP ratio of 50.24 percent [57]. With the economic growth, other sectors have been accelerated, such as the high-techniques and education.
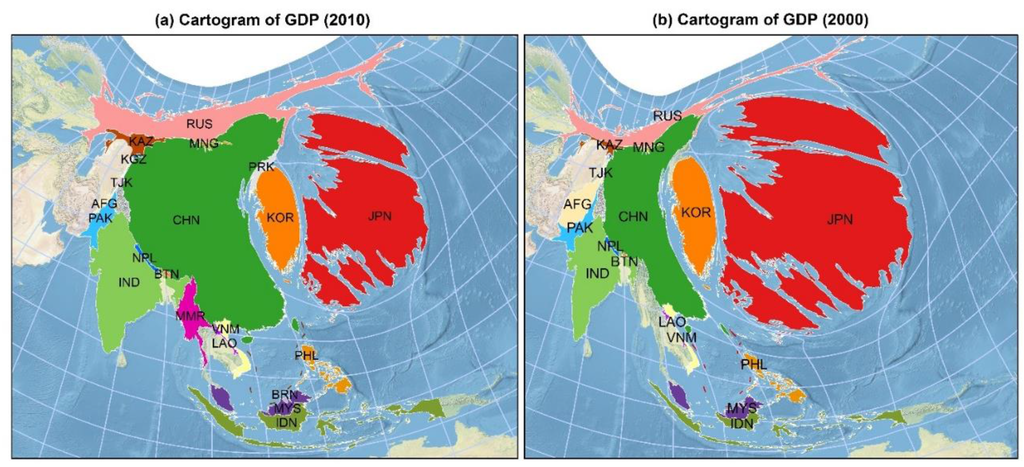
Figure 4.
Power redistribution: Comparison of GDP of (a) 2010 and (b) 2000 through cartograms.
Figure 4.
Power redistribution: Comparison of GDP of (a) 2010 and (b) 2000 through cartograms.

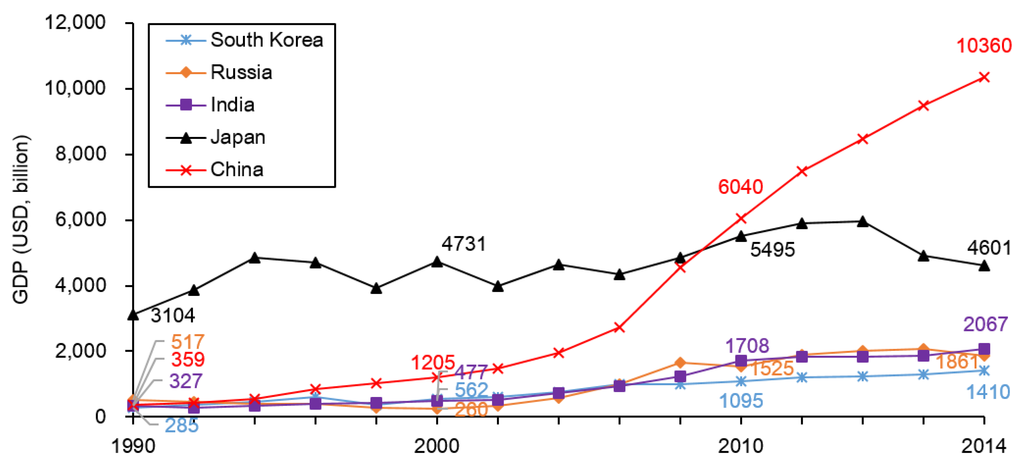
Figure 5.
GDP growth of top five economies at four time points (1990, 2000, 2010, and 2014, respectively).
Figure 5.
GDP growth of top five economies at four time points (1990, 2000, 2010, and 2014, respectively).
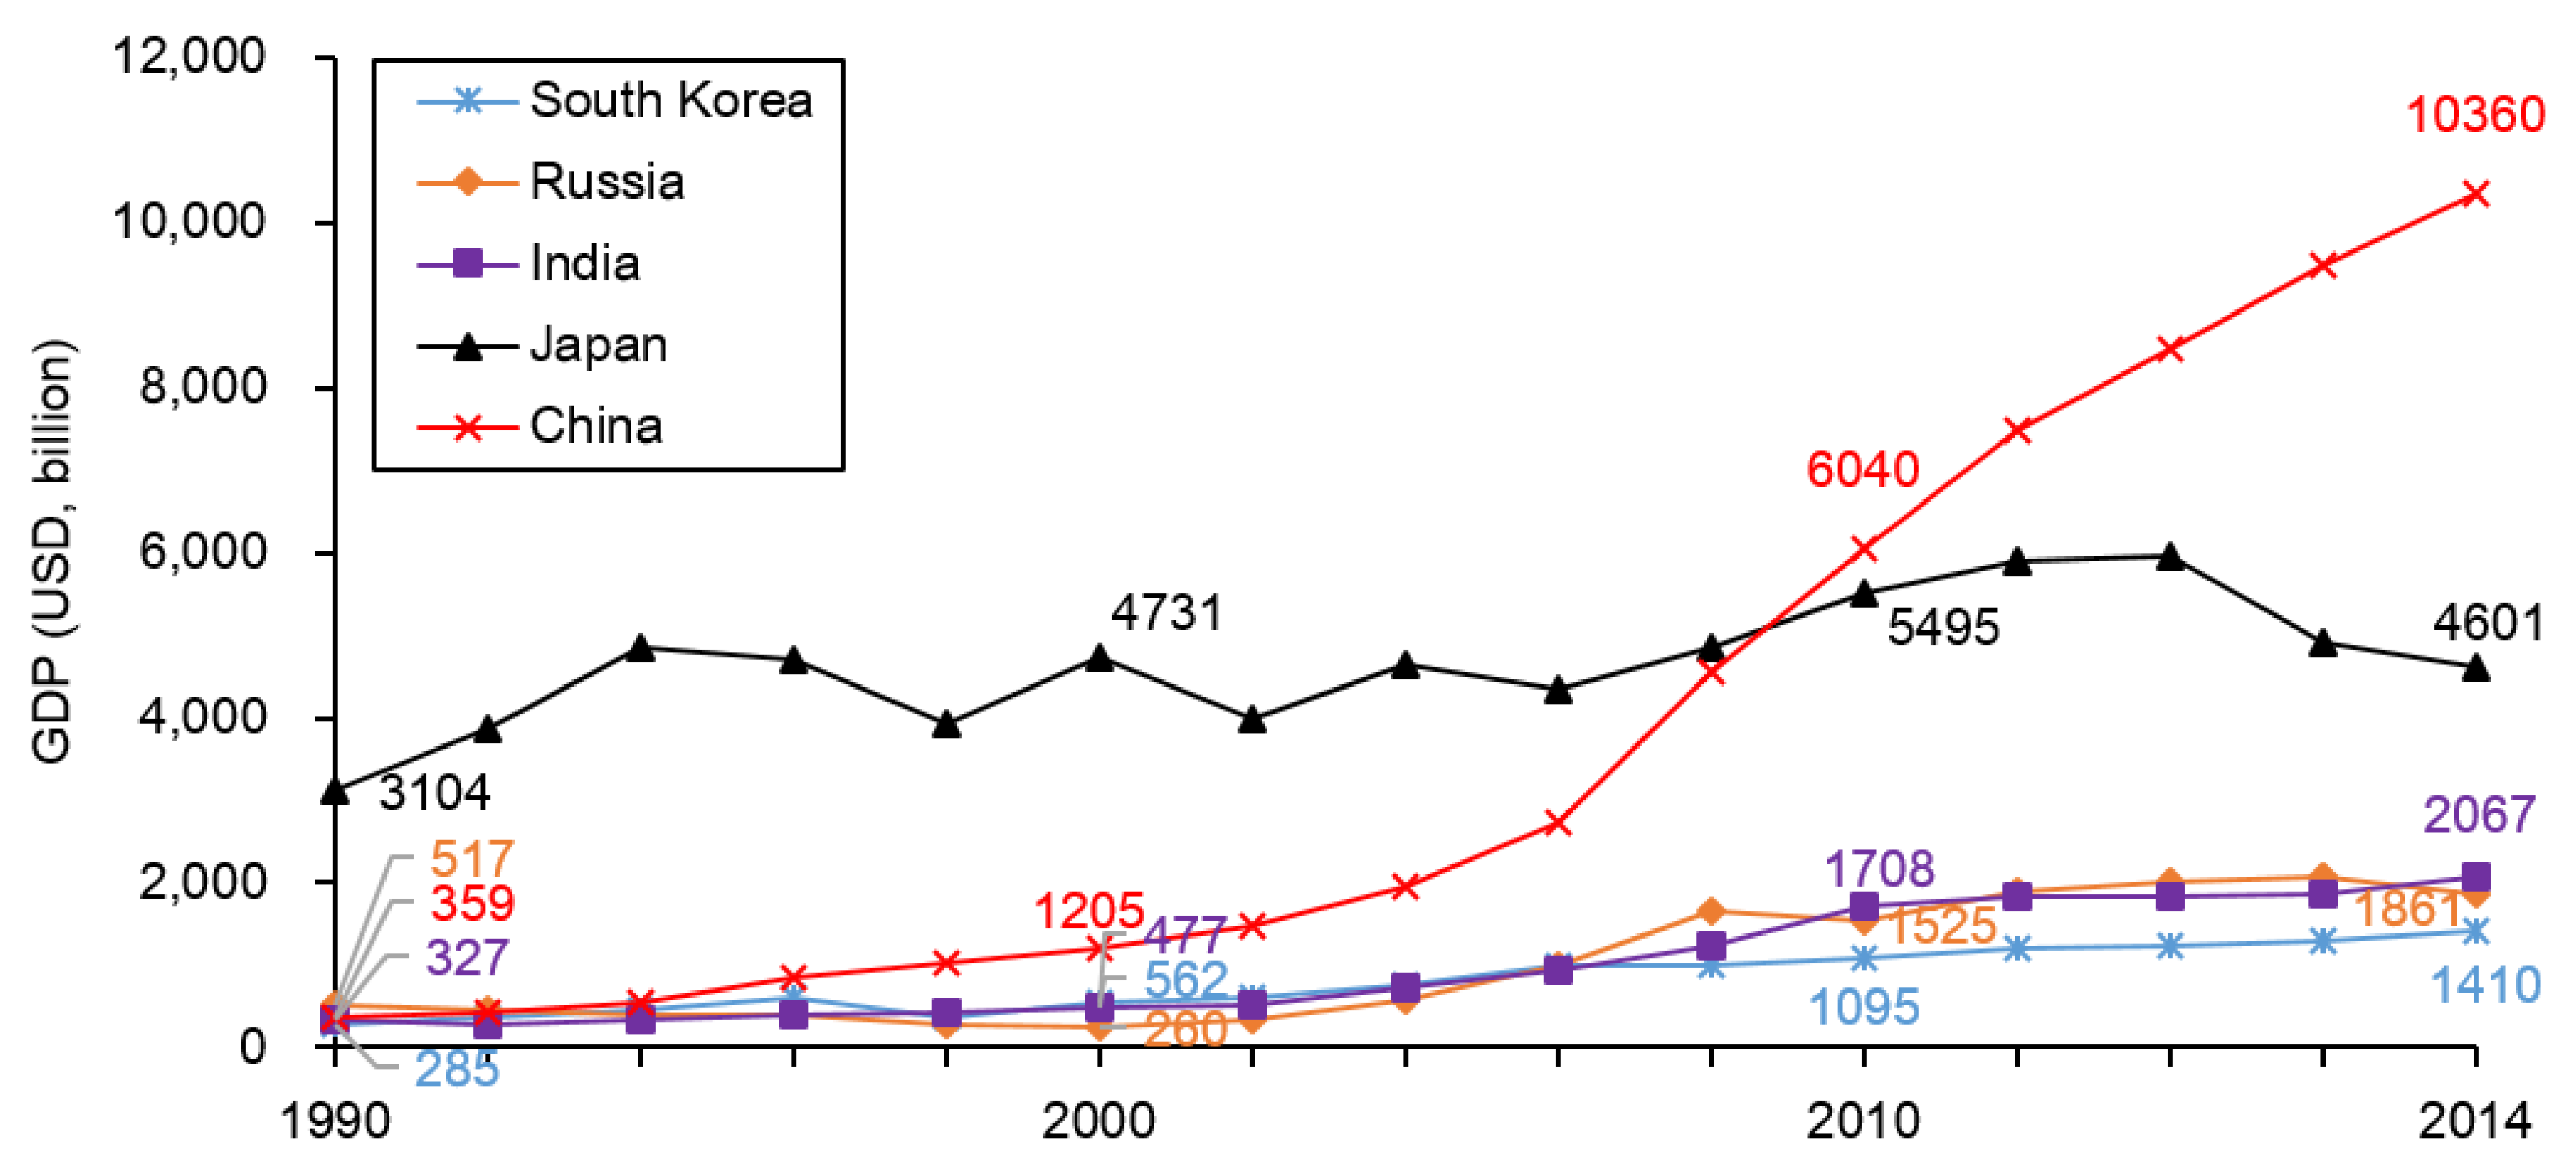
Another economic power transition occurred between Russia and South Korea. After the collapse of the Soviet Union, Russia experienced an economic decline and recovery. The total GDP of Russia was 517 billion USD in 1990 (the second largest economy of this region), about 1.8 times as much as South Korea, but decreased to 260 billion USD, which was less than half of South Korea (562 billion USD) by 2000. During the first decade of 21st century, Russia’s economy recovered and overtook South Korea again by 2010.
To illustrate the power changes, we calculated the CNP in 2000 for comparison. It can be seen from the two intuitive depictions that China overtakes Japan’s position at first place of CNP within the study area. The expanding power space of China and the shrinking of Japan indicate the power growth of the former and the transition between them. Russia also climbs from 4th to the 3rd, taking South Korea’s position.
7. General Discussion
7.1. Re-Visualizing Borders in Conceptual Spaces
It is the political or administrative borders that act as the basic units for our understanding of the world, although these borders are artificial and nonexistent. Our daily lives are structured to these mutually exclusive administrative regions based on borders. Through borders that are projected on maps, we can distinguish different administrative units, such as cities, countries, continents, and the world. We are able to identify countries by retrieving shape information from long-term memory stored in our brain, and then matching map representations. Since these borders represent the geographic world that we are familiar with, it is quite natural that they keep forms similar to reality, making it difficult to re-think their alternative representations [71]. What if the territorial regions are projected to conceptual spaces (e.g., cartograms)? If we see that maps are projections from graphical spaces to conceptual spaces based on attributes, then conventional maps are special cases of such projections, according to their geographical areas. When projected in power spaces, particularly those shown in this paper, borders are the re-organizations of territorial regions showing our re-understanding of the world rather than the administrative divisions that convey political meaning.
7.2. Effectiveness of Cartogram for Cartographic Communication
Despite its popularity, the effectiveness of the cartogram is doubted by researchers because of the difficulties in recognition caused by shape distortions and topology disconnectivity [37,72]. Dent [73] stated, “Communication with cartograms is difficult”. Rittschof, et al. [74] found that successful communication of cartograms requires long-term familiarity with the regions and that cartogram can lead to a greater distortion in mental reconstruction of the region. Empirical studies by Sun and Li [72] have found that qualitative results, such as US election data, is better represented by a cartogram, while quantitative results, such as China population data, is more appropriately shown by conventional thematic maps. To meet three important requirements for cartogram reading: Shape preservation, topology preservation, and visual equalization, Roth, et al. [75] presented an alternative technique to cartogram called value-by-alpha maps, which adjusts the alpha of the color according to the attribute values.
The cartogram of US election results, which was created by Gastner and Newman [36], has been proved to be more effective and accurate than the choropleth maps to represent election outcomes. Both Gastner and Newman [36] and Dorling [35] emphasize the equality of each vote or each household. Dorling argued that “By trying to minimize visual bias, cartograms can be claimed to have advantages in census mapping, being more sensible statistically and more just socially. Their disadvantage is that they are unfamiliar, but we do not learn from familiarity” [35].
8. Conclusions
This paper emphasizes the sustainability of national power and presents a measurement to quantify the sustainable national power. In addition, sustainable national power and its components are visualized using density-equalizing maps to facilitate the understanding of the power for countries’ development. The conceptual space is used as a key theoretical tool to bridge the power space and maps. Specifically, sustainable national power is modeled based on the measurement of comprehensive national power and SNP-adjusted index.
China and its neighboring countries are selected as a case study area and are applied to the proposed model. Results intuitively show that China outperforms other countries in most of the CNP dimensions but performs poorly in various SNP-adjusted dimensions. The SNP score shows China is with the highest regional sustainable national power, followed by Japan, Russia, South Korea, and India. Time series of cartograms reveal evidence showing power transitions among countries.
Maps are visualizations of our knowledge and the way we think about the world. Cartograms are not only depictions that shock our visual attention, but also externalizations of social, economic, and political processes. This paper contributes to the cartographic literature by demonstrating cartograms to visualize radius extension and living space expansion, which are theoretically grounded in international relations and political geography. We hope that it will, not only facilitate the understanding the power of China and neighboring countries, but also provide new thoughts of visualizing knowledge of political phenomena.
Supplementary Files
Supplementary File 1Acknowledgments
This research is supported by the National Natural Science Foundations of China (NSFC, Grant No. 41471382), National Key Technology Research and Development Program of the Ministry of Science and Technology of China (Grant No.2012BAK12B03). Comments from reviewers are appreciated, which helped in the improvement of this article’s quality.
Author Contributions
Hua Liao drafted and finalized the manuscript. Weihua Dong revised the paper. Huiping Liu and Yuejing Ge contributed to the calculation of CNP and revised the paper.
Conflicts of Interest
The authors declare no conflict of interest.
References
- Kadera, K.; Sorokin, G. Measuring national power. Int. Interact. 2004, 30, 211–230. [Google Scholar] [CrossRef]
- Thompson, K.; Morgenthau, H. Politics Among Nations: The Struggle for Power and Peace; Alfred, A., Ed.; Knopf: New York, NY, USA, 1985. [Google Scholar]
- Mearsheimer, J.J. The Tragedy of Great Power Politics; WW Norton & Company: New York, NY, USA, 2001. [Google Scholar]
- Mattos, M.; Viana, L. A Geopolítica e as Projeções do Poder; Biblioteca do Exército: Rio de Janeiro, Brazil, 1977. [Google Scholar]
- Kelly, P.L. Geopolitical themes in the writings of general carlos de meira mattos of brazil. J. Lat. Am. Stud. 1984, 16, 439–461. [Google Scholar] [CrossRef]
- WCED. Our Common Future; WCED: New York, NY, USA, 1987. [Google Scholar]
- WEF. Assessing progress toward sustainable competitiveness. In The Global Competitiveness Report 2014-2015; WEF: Geneva, Switzerland, 2014; pp. 53–83. [Google Scholar]
- Höhn, K.H. Geopolitics and the Measurement of National Power. Ph.D. Thesis, der Universität Hamburg, Hamburg, Germany, 2014. [Google Scholar]
- Hafeznia, M.R.; Hadi Zarghani, S.; Ahmadipor, Z.; Roknoddin Eftekhari, A. Presentation a new model to measure national power of the countries. J. Appl. Sci. 2008, 8, 230–240. [Google Scholar] [CrossRef]
- Hart, J. Three approaches to the measurement of power in international relations. Int. Organ. 1976, 30, 289–305. [Google Scholar] [CrossRef]
- Cline, R.S. World Power Assessment: A Calculus of Strategic Drift; Westview Press: Boulder, CO, USA, 1975. [Google Scholar]
- Chan, S. Is there a power transition between the us and China? The different faces of national power. Asian Surv. 2005, 45, 687–701. [Google Scholar] [CrossRef]
- Treverton, G.F.; Jones, S.G. Measuring National Power; DTIC: Fairfax City, VA, USA, 2005. [Google Scholar]
- Hwang, K. New thinking in measuring national power. In Proceedings of the 2nd Global International Studies Conference, Ljubljana, Slovenia, 20 July 2008; pp. 23–26.
- Nye, J. Notes for a soft power research agenda. In Power in World Politics; Routledge: Oxford, UK; New York, NY, USA, 2007; pp. 162–172. [Google Scholar]
- Nye, J.S. Soft Power: The Means to Success in World Politics; Public Affairs: New York, NY, USA, 2004. [Google Scholar]
- German, F.C. A tentative evaluation of world power. J. Confl. Resolut. 1960, 4, 138–144. [Google Scholar] [CrossRef]
- Small, M.; Singer, J.D. Resort to Arms: International and Civil Wars, 1816–1980; Sage Publications, Inc.: Los Angeles, CA, USA, 1982. [Google Scholar]
- Chang, C.L. A measure of national power. In Proceedings of the 2004 International Seminar at the National University of Malaysia, Bangi, Malaysia, 16–17 February 2004; pp. 16–17.
- Xuetong, Y. Xun zi’s thoughts on international politics and their implications. Chin. J. Int. Politics 2008, 2, 135–165. [Google Scholar] [CrossRef]
- WEF. The Global Competitiveness Report 2014–2015; World Economic Forum: Geneva, Switzerland, 2014. [Google Scholar]
- UNDP. Human Development Report 2014. Sustaining Human Progress: Reducing Vulnerabilities and Building Resilience; UNDP: New York, NY, USA, 2014. [Google Scholar]
- Van de Kerk, G.; Manuel, A.R. A comprehensive index for a sustainable society: The ssi—The sustainable society index. Ecol. Econ. 2008, 66, 228–242. [Google Scholar] [CrossRef]
- McLellan, R.; Iyengar, L.; Jeffries, B.; Oerlemans, N. Living Planet Report 2014: Species and Spaces, People and Places. Available online: http://apo.org.au/node/41529 (accessed on 2 August 2015).
- United Nations. The Millennium Development Goals Report 2014; United Nations: New York, NY, USA, 2014. [Google Scholar]
- Davis, K. Population and power in the free world. In Population Theory And Policy. Selected Readings; Free Press of Glencoe: Glencoe, Illinois, 1958; pp. 342–356. [Google Scholar]
- Casetti, E. Power shifts and economic development: When will China overtake the USA? J. Peace Res. 2003, 40, 661–675. [Google Scholar] [CrossRef]
- UNDP. Technical Notes of Human Development Index. Available online: http://hdr.undp.org/sites/default/files/hdr14_technical_notes.pdf (accessed on 25 July 2015).
- Merritt, R.L.; Zinnes, D.A. Validity of power indices. Int. Interact. 1988, 14, 141–151. [Google Scholar] [CrossRef]
- Kaufmann, D.; Kraay, A.; Mastruzzi, M. The worldwide governance indicators: Methodology and analytical issues. Hague J. Rule Law 2011, 3, 220–246. [Google Scholar] [CrossRef]
- Dong, W.; Liu, Z.; Liao, H.; Tang, Q.; Li, X.E. New climate and socio-economic scenarios for assessing global human health challenges due to heat risk. Clim. Change 2015, 4, 505–518. [Google Scholar] [CrossRef]
- Dong, W.; Liu, Z.; Zhang, L.; Tang, Q.; Liao, H.; Li, X.E. Assessing heat health risk for sustainability in Beijing’s urban heat island. Sustainability 2014, 6, 7334–7357. [Google Scholar] [CrossRef]
- IPCC. Summary for Policymakers; IPCC: 1202 Genève, Switzerland.
- Lobben, A.K. Tasks, strategies, and cognitive processes associated with navigational map reading: A review perspective. Prof. Geogr. 2004, 56, 270–281. [Google Scholar]
- Dorling, D. Map design for census mapping. Cartogr. J. 1993, 30, 167–183. [Google Scholar] [CrossRef]
- Gastner, M.T.; Newman, M.E. Diffusion-based method for producing density-equalizing maps. Proc. Natl. Acad. Sci. USA 2004, 101, 7499–7504. [Google Scholar] [CrossRef] [PubMed]
- Tobler, W. Thirty five years of computer cartograms. ANNALS Assoc. Am. Geogr. 2004, 94, 58–73. [Google Scholar] [CrossRef]
- Webb, R. Cartography: A popular perspective. Nature 2006, 439, 800–800. [Google Scholar] [CrossRef] [PubMed]
- Butler, D. Swollen with success. Nature 2008, 455, 270–271. [Google Scholar] [CrossRef] [PubMed]
- Raisz, E. The rectangular statistical cartogram. Geogr. Rev. 1934, 24, 292–296. [Google Scholar] [CrossRef]
- Gastner, M.T.; Shalizi, C.R.; Newman, M.E. Maps and cartograms of the 2004 US presidential election results. Adv. Complex Syst. 2005, 8, 117–123. [Google Scholar] [CrossRef]
- Dorling, D.; Barford, A.; Newman, M. Worldmapper: The world as you’ve never seen it before. IEEE Trans. Visual. Comput. Graph. 2006, 12, 757–764. [Google Scholar] [CrossRef] [PubMed]
- Hennig, B. Rediscovering the World: Map Transformations of Human and Physical Space; Springer: Berlin, Germany, 2012. [Google Scholar]
- Hennig, B.D. The human planet. Environ. Plan. A 2013, 45, 489–491. [Google Scholar] [CrossRef]
- Hennig, B.D. Gridded cartograms as a method for visualising earthquake risk at the global scale. J. Maps 2014, 10, 186–194. [Google Scholar] [CrossRef]
- Li, L.; Clarke, K.C. Cartograms showing China’s population and wealth distribution. J. Maps 2012, 8, 320–323. [Google Scholar] [CrossRef]
- Reyes Nuñez, J.J. The use of cartograms in school cartography. Themat. Cartogr. Soc. 2014, 327–339. [Google Scholar]
- Houle, B.; Holt, J.; Gillespie, C.; Freedman, D.S.; Reyes, M. Use of density-equalizing cartograms to visualize trends and disparities in state-specific prevalence of obesity: 1996–2006. Am. J. Public Health 2009, 99, 308–312. [Google Scholar] [CrossRef] [PubMed]
- Khalakdina, A.; Selvin, S.; Merrill, D.W.; Erdmann, C.A.; Colford, J.M., Jr. Analysis of the spatial distribution of cryptosporidiosis in aids patients in san francisco using density equalizing map projections (demp). Int. J. Hyg. Environ. Health 2003, 206, 553–561. [Google Scholar] [CrossRef] [PubMed]
- Kusma, B.; Scutaru, C.; Quarcoo, D.; Welte, T.; Fischer, T.C.; Groneberg-Kloft, B. Tobacco control: Visualisation of research activity using density-equalizing mapping and scientometric benchmarking procedures. Int. J. Environ. Res. Public Health 2009, 6, 1856–1869. [Google Scholar] [CrossRef] [PubMed]
- Selvin, S.; Merrill, D.; Schulman, J.; Sacks, S.; Bedell, L.; Wong, L. Transformations of maps to investigate clusters of disease. Soc. Sci. Med. 1988, 26, 215–221. [Google Scholar] [CrossRef]
- Sui, D.Z.; Holt, J.B. Visualizing and analysing public-health data using value-by-area cartograms: Toward a new synthetic framework. Cartogr. Int. J. Geogr. Inf. Geovisual. 2008, 43, 3–20. [Google Scholar] [CrossRef]
- Spykman, N.J.; Nicholl, H.R. Geography of the Peace; Harcourt: SanDiego, CA, USA, 1944. [Google Scholar]
- WorldBank. China 2030: Building a Modern, Harmonious, and Creative, High-Income Society. Available online: http://www.worldbank.org/content/dam/Worldbank/document/China-2030-complete.pdf (accessed on 7 October).
- Yang, R. Soft power and higher education: An examination of China’s confucius institutes. Global. Soc.Educ. 2010, 8, 235–245. [Google Scholar] [CrossRef]
- Butler, D. China: The great contender. Nature 2008, 454, 382–383. [Google Scholar] [CrossRef] [PubMed]
- WorldBank. World Bank Open Data: Free and Open Access to Data about Development in Countries around the Globe. Available online: http://data.worldbank.org/ (accessed on 14 October 2014).
- WEF. The Travel & Tourism Competitiveness Report 2013; WEF: Geneva, Switzerland, 2013. [Google Scholar]
- IMF. World Economic Outlook Database. Available online: http://www.imf.org/external/pubs/ft/weo/2014/01/weodata/index.aspx (accessed on 14 October 2014).
- Henriques, R.; Bação, F.; Lobo, V. Carto-som: Cartogram creation using self-organizing maps. Int. J. Geogr. Inf. Sci. 2009, 23, 483–511. [Google Scholar] [CrossRef]
- Inoue, R.; Shimizu, E. A new algorithm for continuous area cartogram construction with triangulation of regions and restriction on bearing changes of edges. Cartogr. Geogr. Inf. Sci. 2006, 33, 115–125. [Google Scholar] [CrossRef]
- Keim, D.A.; North, S.C.; Panse, C. Cartodraw: A fast algorithm for generating contiguous cartograms. IEEE Trans. Visual. Comput. Graph. 2004, 10, 95–110. [Google Scholar] [CrossRef] [PubMed]
- Keim, D.A.; Panse, C.; North, S.C. Medial-axis-based cartograms. IEEE Trans. Comput. Graph. Appl. 2005, 25, 60–68. [Google Scholar] [CrossRef]
- Kocmoud, C.; House, D. A constraint-based approach to constructing continuous cartograms. In Proceedings of the 1998 Symposium Spatial Data Handling, Vancouver, Canada, 12–15 July 1998.
- Sun, S. A fast, free-form rubber-sheet algorithm for contiguous area cartograms. Int. J. Geogr. Inf. Sci. 2013, 27, 567–593. [Google Scholar] [CrossRef]
- Dougenik, J.A.; Chrisman, N.R.; Niemeyer, D.R. An algorithm to contruct continuous area cartograms. Prof. Geogr. 1985, 37, 75–81. [Google Scholar] [CrossRef]
- Jackel, C.B. Using arcview to create contiguous and noncontiguous area cartograms. Cartogr. Geogr. Inf. Syst. 1997, 24, 101–109. [Google Scholar] [CrossRef]
- Anselin, L.; Syabri, I.; Kho, Y. Geoda: An introduction to spatial data analysis. Geogr. Anal. 2006, 38, 5–22. [Google Scholar] [CrossRef]
- Gross, T. Cartogram Geoprocessing Tool Version 2. Available online: http://arcscripts.esri.com/details.asp?dbid=15638 (accessed on 14 October 2014).
- Spykman, N.J. America’s Strategy in World Politics: The United States and the Balance of Power; Transaction Publishers: New Jersey, NJ, USA, 1942. [Google Scholar]
- AntiAtlas. Re-Visualizing Border Cartographies through Art: From Lines to Flows and Portals|Gabriel Popescu. Available online: http://www.antiatlas.net/en/2013/09/28/re-visualizing-border-cartographies-through-art-from-lines-to-flows-and-portals-gabriel-popescu/ (accessed on 5 October 2014).
- Sun, H.; Li, Z. Effectiveness of cartogram for the representation of spatial data. Cartogr. J. 2010, 47, 12–21. [Google Scholar] [CrossRef]
- Dent, B.D. Cartography-Thematic Map Design; WCB McGraw-Hill: Boston, MA, USA, 1999. [Google Scholar]
- Rittschof, K.A.; Stock, W.A.; Kulhavy, R.W.; Verdi, M.P.; Johnson, J.T. Learning from cartograms: The effects of region familiarity. J. Geogr. 1996, 95, 50–58. [Google Scholar] [CrossRef]
- Roth, R.E.; Woodruff, A.W.; Johnson, Z.F. Value-by-alpha maps: An alternative technique to the cartogram. Cartogr. J. 2010, 47, 130–140. [Google Scholar] [CrossRef] [PubMed]
© 2015 by the authors; licensee MDPI, Basel, Switzerland. This article is an open access article distributed under the terms and conditions of the Creative Commons Attribution license (http://creativecommons.org/licenses/by/4.0/).