Article

A Geoweb-Based Tagging System for Borderlands Data Acquisition

1
College of Geography and Environment, Shandong Normal University, Jinan 250014, China
2
National Geomatics Center of China, Beijing 100830, China
3
School of Geosciences and Info-Physics, Central South University, Changsha 410083, China
*
Author to whom correspondence should be addressed.
ISPRS Int. J. Geo-Inf. 2015, 4(3), 1530-1548; https://doi.org/10.3390/ijgi4031530
Submission received: 29 May 2015 / Revised: 10 August 2015 / Accepted: 12 August 2015 / Published: 21 August 2015
(This article belongs to the Special Issue Borderlands Modeling and Analysis)

Abstract

:
Borderlands modeling and understanding depend on both spatial and non-spatial data, which were difficult to obtain in the past. This has limited the progress of borderland-related research. In recent years, data collection technologies have developed greatly, especially geospatial Web 2.0 technologies including blogs, publish/subscribe, mashups, and GeoRSS, which provide opportunities for data acquisition in borderland areas. This paper introduces the design and development of a Geoweb-based tagging system that enables users to tag and edit geographical information. We first establish the GeoBlog model, which consists of a set of geospatial components, posts, indicators, and comments, as the foundation of the tagging system. GeoBlog is implemented such that blogs are mashed up with OpenStreetMap. Moreover, we present an improvement to existing publish/subscribe systems with support for spatio-temporal events and subscriptions, called Spatial Publish/Subscribe, as well as the event agency network for routing messages from the publishers to the subscribers. A prototype system based on this approach is implemented in experiments. The results of this study provide an approach for asynchronous interaction and message-ordered transfer in the tagging system.

1. Introduction

Borderland is a natural transition and convergence area where people, goods, services, and ideas flow across boundaries or seas from state to state. Such cross-border commonalities, which cannot be divided by politically dictated and artificial boundary lines, potentially contribute to sustainable development within the world [1,2]. However, because the spatial region used in borderland research usually covers several regions of neighboring countries, it is difficult for borderland information to be collected by one research institution or government [3]. This has limited the progress of borderland-related research and application. For instance, the Nepal earthquake in 2015, which caused 253 Chinese workers to be trapped in a hydropower station near the Geelong port on the border of Nepal and China, called for cross-border relief assistance. If the crowdsourced reports about trapped persons, medical emergencies, and specific needs, such as food, water, and shelter, can be received and tagged on maps that are updated in real-time by an international group of volunteers, then responders on the ground could quickly begin to use them to determine how, when, and where to direct resources. These report-tagging technologies include crowdsourcing and volunteered geographic information (VGI) from geospatial Web 2.0 communities [4,5], which can provide opportunities for data acquisition in borderland areas.
The geospatial Web 2.0, or Geoweb for short, is a collection of online location-enabled services and infrastructure that engages a wide range of stakeholders in mapping processes [6]. The interactions between individuals and groups and the Geoweb environment do, in some instances, generate VGI, which is becoming especially important where authoritative geographic information is lacking. The spectrum of VGI data sources ranges from image sharing websites such as Flickr, to social media platforms such as Twitter and Foursquare, to more complex mapping portals such as OpenStreetMap (OSM) [7]. The type of information collected can be retrieved from various platforms, such as blogs, wikis and forums. Brent Hall [8] presented a platform named MapChat, a citizen-led production of web-based geographic information where new and/or existing digital map features are linked to annotations or commentary and citizens engage in synchronous discussion. Claus Rinner [9] presented an online map-based discussion forum that enables Internet users to submit place-based comments and respond to contributions from other participants. Geo-Wiki, a geographical semantic wiki system that was introduced in [10], can parse and store multi-source geographical knowledge, mash up with Google Maps and serve geospatial decision-making.
However, the platforms discussed above, such as MapChat, Map-based Forum and Geo-Wiki, only allow online synchronous interaction. Taking the Nepal earthquake for instance, these instant message systems only allow interaction with limited users online, making them unable to meet the asynchronous interaction requirements for other trapped persons and relief agencies. Furthermore, current popular applications of Geoweb, such as OSM or Google Earth, provide online tagging functions; the spatial information is collected by the processing center, processed, and unified [11]. Information-sharing requires the orderly transmission of messages, which enables receivers to issue subscriptions that express their interests in messages with given content regardless of the identity of their publishers. These characteristics make the publish/subscribe paradigm suited to scenarios where the changes appear frequently in borderland regions. To solve this issue, the design and development of a Geoweb-based tagging system for supporting borderlands data acquisition is introduced and illustrated in Figure 1. In this paper, we propose a geospatial blog model, called GeoBlog, to realize multi-participant tagging; GeoBlog, mashed up with map services, enriches the representation and helps users to tag and edit various geographical data. Moreover, to make the tagging message transfer-ordered, we present an enhancement to existing publish/subscribe systems, called Spatial Publish/Subscribe, as well as an event agency network for routing messages from publishers to subscribers.
Figure 1. The general scheme of the tagging system.
Ijgi 04 01530 g001
The remainder of this paper is structured as follows: the next section reviews previous findings of borderland information acquisition, Geoweb technologies and tagging systems, followed by a section on the geospatial blog model and a section on the Spatial Publish/Subscribe model. Afterwards, we present a section on prototyping and implementing a tagging system. The last section provides a summary of the contributions of the findings and directions for future work.

2. Related Works

2.1. Borderland Information Ascquisition

A borderland region generally refers to the land area adjoining and outside state boundary lines, or the ocean area among maritime neighbors, and also has different characteristics or geographic conditions than the inner or central parts of the neighboring nations. The borderlands data is divided into spatial (e.g., vector, raster and geo-referenced) and non-spatial (e.g., census) data [1]. The former directly refer to geographical locations which can be tagged automatically, and the latter, such as census and earthquakes, have particular spatial distributions and relatively large spatial extents so that we can identify and tag them on the map artificially. By the end of 2010, China had completed its digital boundary with a length of over 22,000 kilometers [12]. The European Union has also developed a boundary data model to integrate both the geometric and theme data of European nations.
However, because borderland data cover several regions of neighboring countries, these data are difficult to collect. To obtain the geographic information surrounding a borderland, the borderland area should be divided into multi-level geographical units and the methods of data integration, information fusion, and geographical calculation should be used according to the formulated geographic information index system [13]. The conventional ways to obtain borderland data are field surveying, mapping and census. Moreover, we can also extract information from remote sensing images, including multi-source remote sensing image geometric correction and terrain information extraction [14]. Furthermore, the way to capture border information online is public network information integration, including the process of network search, data extraction, matching and mapping transformation [1]. Some new techniques and approaches have been developed and applied to borderland data acquisition in recent years, such as the stereo panorama [15], focused crawler [16,17] and VGI or crowdsourcing [3].

2.2. Geoweb Technologies and Application

According to the value of Geoweb-based sources of geographic information, there is mounting evidence that institutions can use VGI as a mechanism to build a local capacity to support collaboration, supplement traditional data sources, and inform decision-making [18]. Johnson and Sieber [19] presented results from a series of interviews with key government representatives that identify the SWOT (strengths, weaknesses, opportunities, and threats) of the Geoweb within provincial and municipal governments. Vincenzo Deufemia [20] presented a volunteer-based system supporting archeologists in the digital preservation of petroglyph sites, namely, PetroAdvisor, to provide information that typically consists of petroglyph pictures, descriptions, and several useful metadata, such as geo-referenced information and petroglyph contours. Fuming Shih [21] presented a smartphone-based application that has the capability of empowering citizens involved in crisis situations to contribute via crowdsourcing, and to communicate up-to-date information to others. The emergency coordination platform named Ushahidi-Haiti was illustrated to coordinate disaster response after the 2010 Haiti earthquake [22]. Arguably, one of the most successful VGI projects is OSM, a global mapping application created by volunteers. Based on Wikipedia’s peer production model, OSM provides free, editable, and downloadable coverage for the locations and geometries of topographic features [23]. Fan H.Q. [24] generated 3D buildings from OSM in which 3D buildings were reconstructed using the buildings’ footprints and information about their attributes, which are documented as tags in OSM.
The above-mentioned applications have similar goals and objectives with respect to user-generated content. In particular, all of them are within the VGI paradigm, which is enabled by the Geoweb, location-aware devices, and citizens acting as sensors, and their tools and resources for collecting and processing geographic information from volunteers are readily available [18]. It is a reasonable approach to collect borderlands data.

2.3. Online Tagging System

Traditionally, when we think of connecting information to a geospatial location, we think in terms of maps. There are many online map tagging applications, such as Google Earth, Google Maps and OpenStreetMap, which allow one to render geospatial annotations, as well as provide tools to add annotations directly onto maps [25]. Recently, some researchers have been involved in focused tagging. For instance, in online projects such as OSM and Ushahidi, contributors provide and share large amounts of geographic information, relying on tagging tools [26]. A landmark-based navigation system was presented to add tags containing landmark information for automatic landmark detection [27]. Richter and Winter [28] developed a module that allowed contributors to add tags that contain landmark information on OSM.
At present, these systems are the most popular platforms for tagging and sharing geo-coded information. However, none were built from the ground up with the intention of asynchronous interaction and orderly transmission of messages. In this study, we develop a tagging system to solve the above problems.

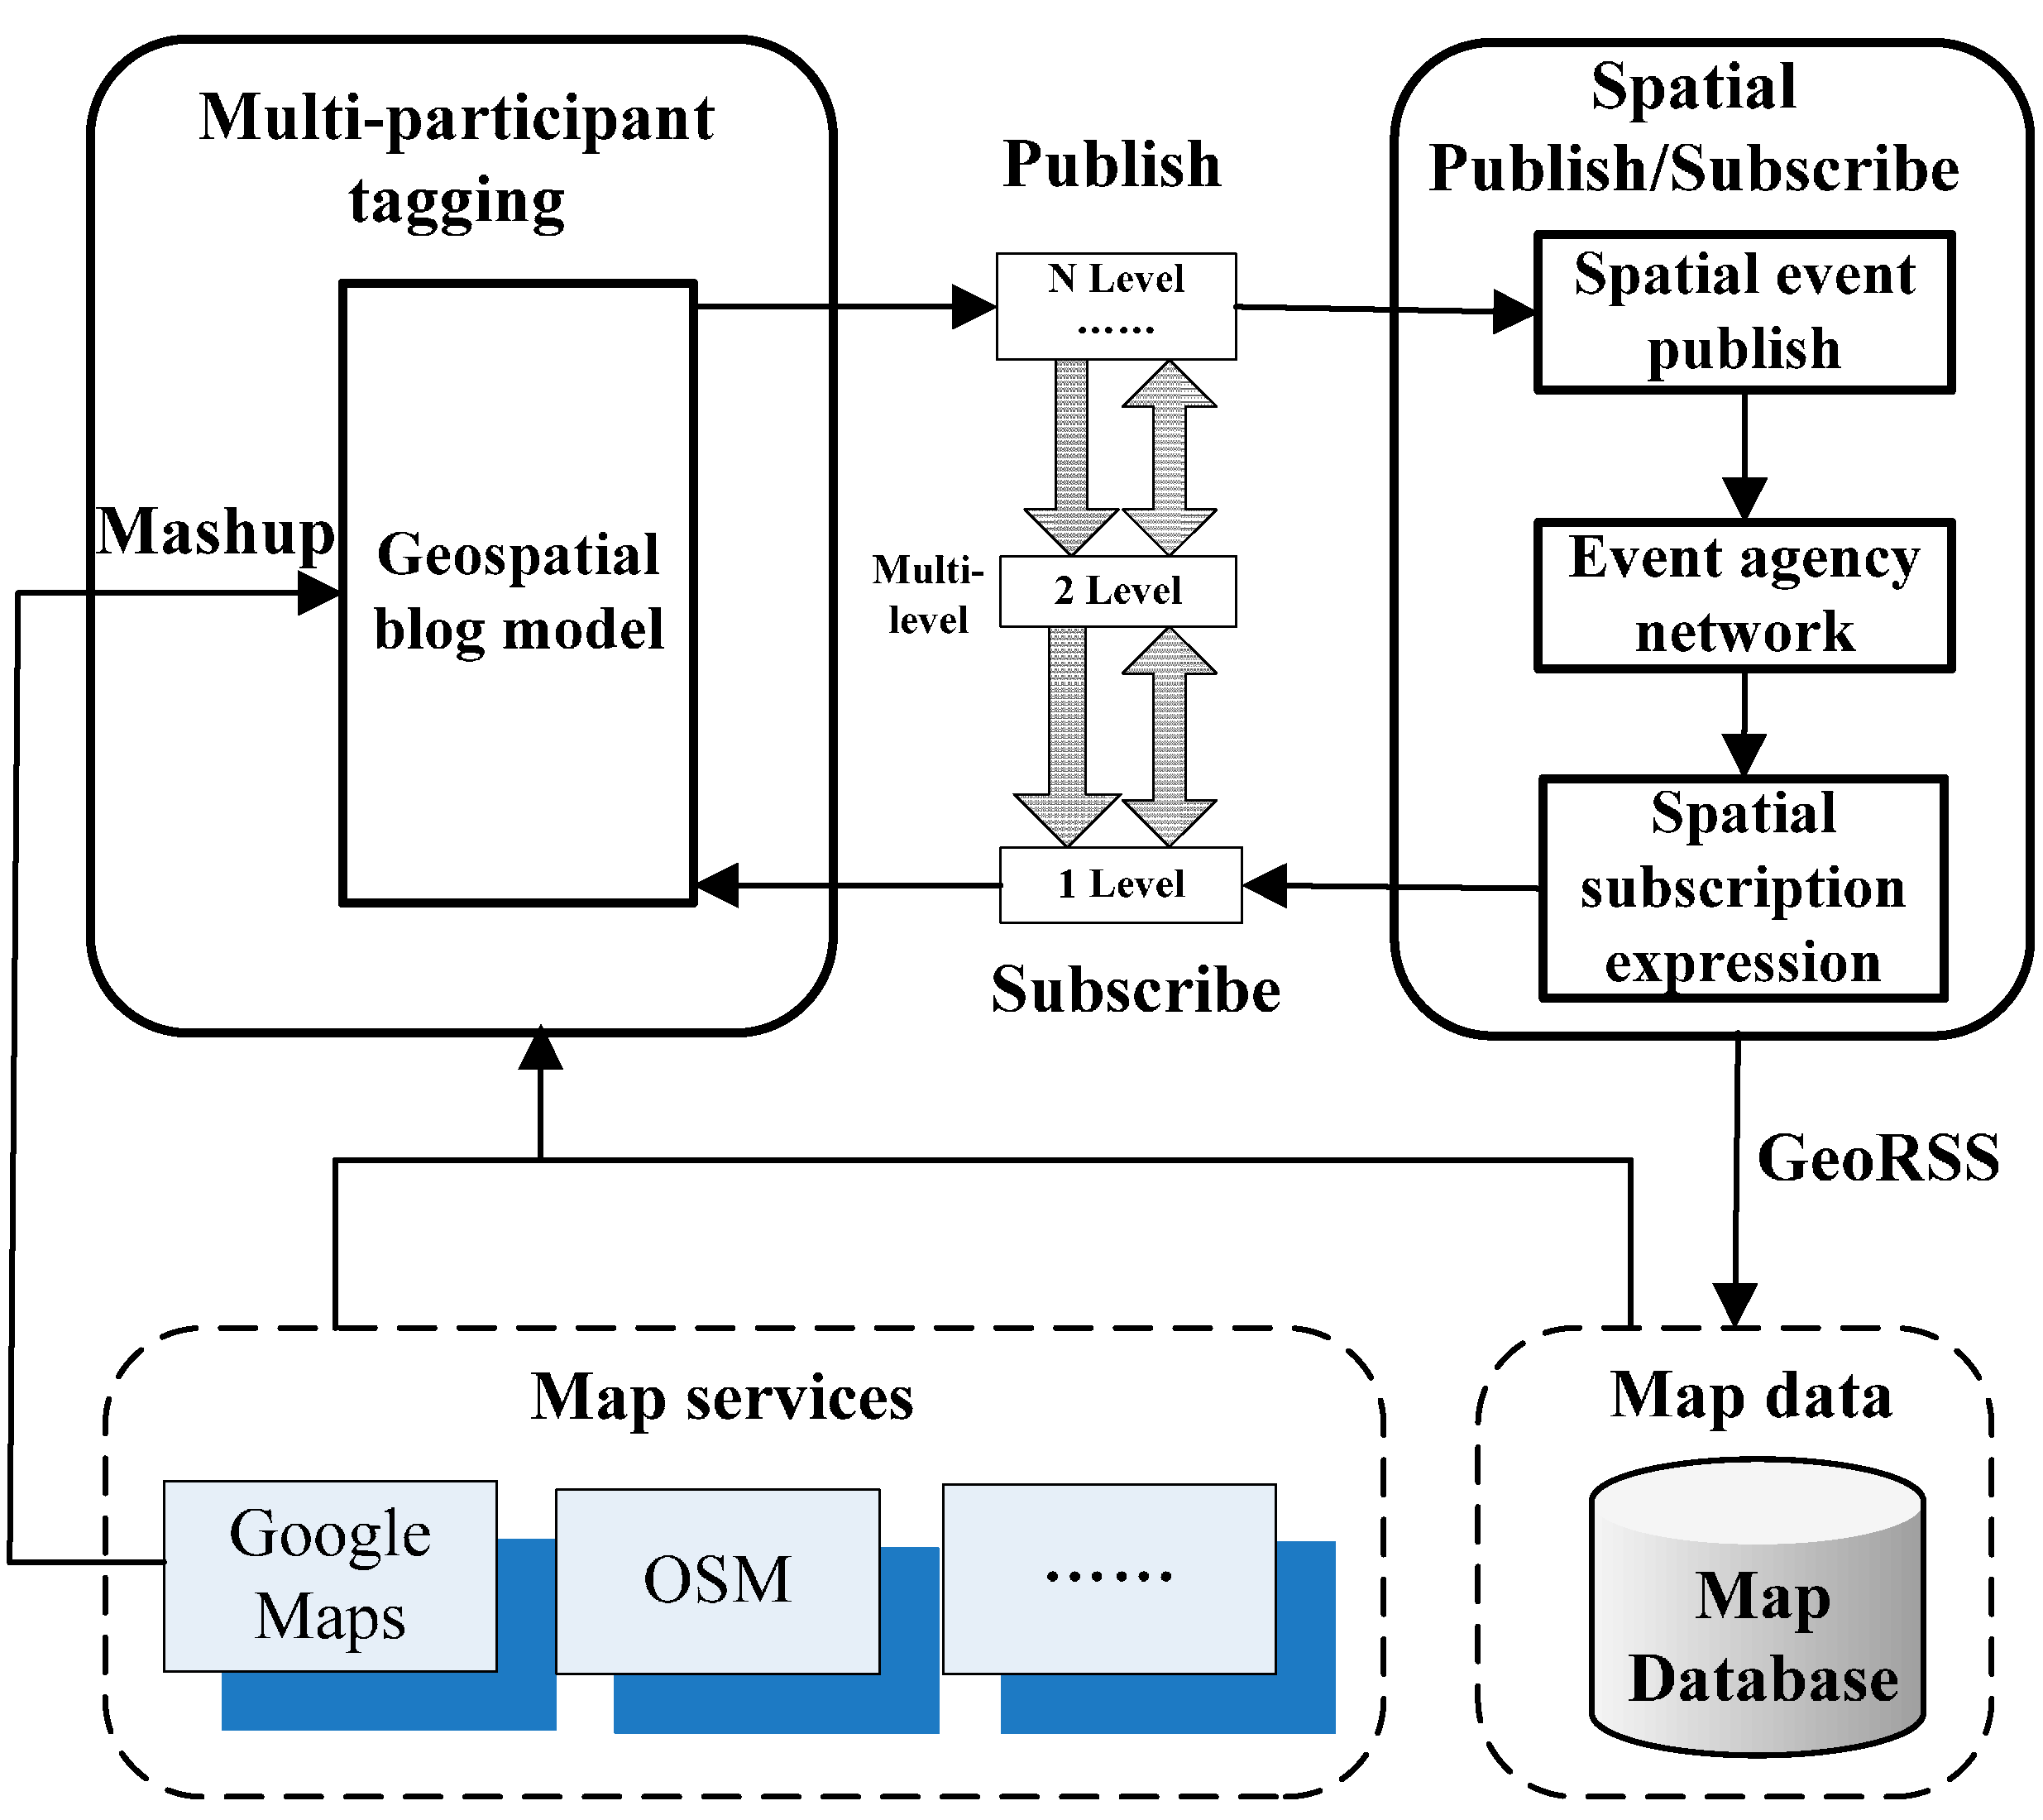
3. GeoBlog Model and Its Implementation
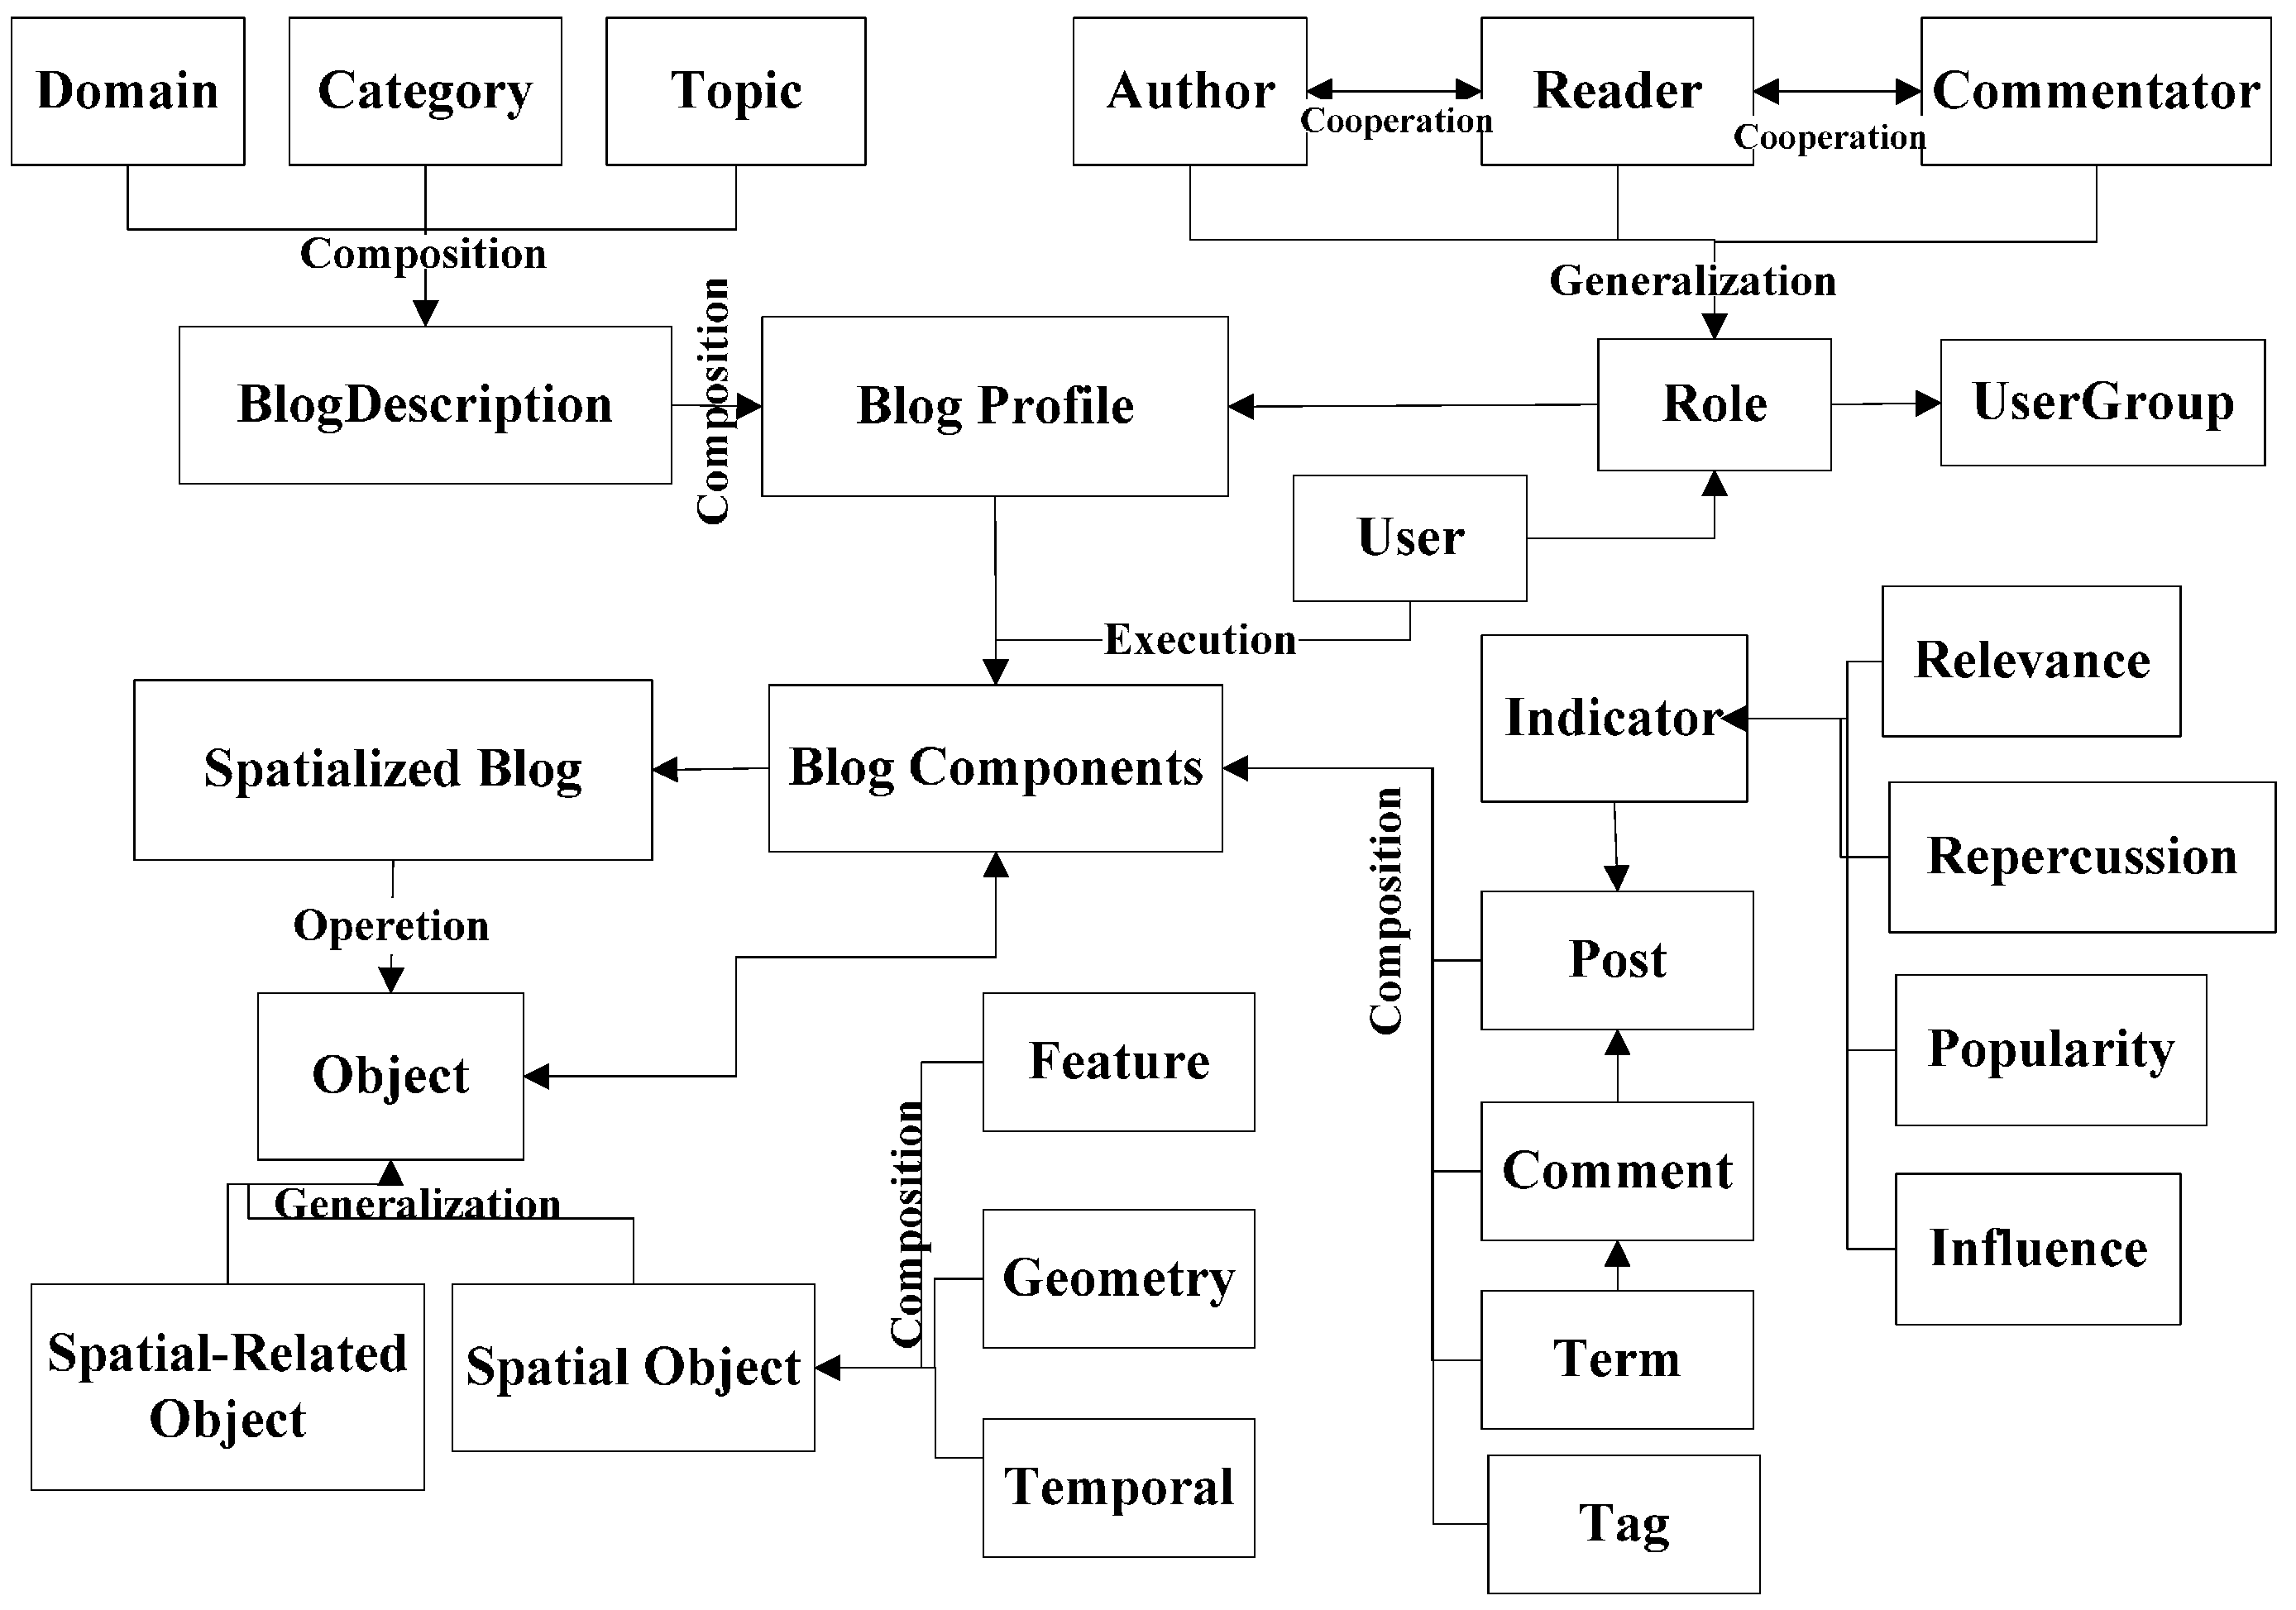
3.1. GeoBlog Model

Taking the Nepal earthquake as an example, almost immediately after the earthquake, the cross-border community, including aid sectors, governments, and emergency response teams, arrived in Nepal to launch extensive search and rescue missions. However, the traditional system lacked the ability to aggregate and socialize transboundary data that came from outside sources, making it difficult to benefit from valuable crowdsourced information [29]. Meanwhile, other sectors were much in demand of interaction and sharing critical information.
Blogs, as social software, are designed for rapid content creation, archiving, and syndication within online communities [10]. Due to the community intelligence, blogs have lately become a valuable source of information. Blogs, used as collaboration environments, support people in associating tags with content that they generate, share, or consume within a community. More generally, by tagging content in the web, one makes this content shareable to other web participants, as well as links it to other web contents. Therefore, a blog is a practical way to capture and share borderland data.
However, such information without explicit geographical semantics cannot be understood and manipulated efficiently by computers. Once a blog system organizes the entries with geographical semantics and display localities, spatial analysis can be performed based on the user-tagged information. In order to develop such system, the domain specific ontologies that take geographical knowledge into account should be built [30]. In information systems, ontology refers to “a formal, explicit specification of a shared conceptualization” [31].
In this paper, we propose a Conceptual Blog Model (CB-Model) as a formal specification to express the information contained in blog data sources. The ontology here is the means for capturing domain knowledge in a generic way that provides a commonly-agreed upon understanding of a domain, which may be reused and shared within communities or applications [32]. The structure provided in the CB-Model can be used by users and applications to tag blog resources. Furthermore, the CB-Model can be used to support web applications in the study of how the information is disseminated within the blogosphere (information spread path). A conceptual specifies knowledge in terms of concepts, relations, and instances. In the following, we introduce the concept, relations, and instances of the CB-Model, as presented in Figure 2.
Figure 2. The conceptual model of GeoBlog.
Ijgi 04 01530 g002
The basic components are described as follows:
Web Participants and their Roles: Basically, a blog has one or more authors who are responsible for continually updating the published content (articles, images, video, etc.). More importantly, web participants are able to actively interact with this content by means of posting a reply to an article (e.g., making a comment to a post). In other words, a web participant can play different roles within blogs. Based on this description, we identify three main roles that an agent can play in the context of blogs: author, reader, and commentator.
User Groups and User Roles: Organizations or institutions are multivalent systems that can be conceived in terms of an organized society of individuals in which each agent plays specific roles and interacts with other agents. Moreover, organizations can have sub-organizations and roles as their “parts.” Considering this, a usergroup is an organization whose members are agents playing specific roles and interacting with other agents. Furthermore, a usergroup can be part of other usergroups and so on.
GeoBlog: Following the above design pattern, we describe a blog and its components. A blog, as a website, is the location (data space) of an online community.
Blog Components: A blog has an internal structure formed by a forum (discussion areas). Each discussion area consists of articles (or posts), which are composed of comments of posts. Furthermore, posts and comments contain several terms. Figure 2 describes the BlogComponent entities, such as Forum, Post, Comment, and Terms.
Blog Profile: We define a blog profile as that which aggregates all relevant aspects of a blog, such as date of creation, update, version, license when applied, etc.
Blog Component Profile: Likewise, we define a blog component profile as that which aggregates all relevant aspects of a blog profile (e.g., date of creation, update, usergroup member, user member, moderator, etc.).
Blog Description: Each BlogComponent entity describes (expresses) a domain of study specific to a category of this domain and has a topic belonging to this category; domain, category, and topic represent BlogDescription entities.
Time Points and Intervals: A blog and its components, such as posts and comments, have a time period of existence, i.e., the duration interval between their date of creation and date of its end of use.
Blog Metrics: Blogs can be classified by their popularity (number of subscriptions), relevance (number of incoming links), repercussion (number of comments), and influence (number of friends). Popularity can be measured, for example, through citations, as well as popularity through affiliation. Popularity, relevance, repercussion and influence are metric entities (quality parameters) that indicate the quality of a blog and are valid for a specific period of time (process).
The basic relationships of the model are described as follows:
Generalization: This refers to the relationship between different things with common attributes such that something is a special type of another thing, connected with the upper and lower nodes through a property inheritance. For example, it is a generalization that a spatial object is a type of object.
Composition: This refers to the relationship between the part and the whole in an organization or structure, which is composed of no inheritance relationship. For example, a blog is composed of posts, comments, and terms, but the posts do not necessarily possess certain attributes of a blog.
Collaboration: This refers to the relationship between division and cooperation among users. The interaction of a blog is completed between different users with executive ability through collaboration.
Possession: This is the definition of a subordinate relationship. For example, the relationship between GeoBlog and spatial objects indicates that the creation process involves spatial representation of spatial objects, etc.

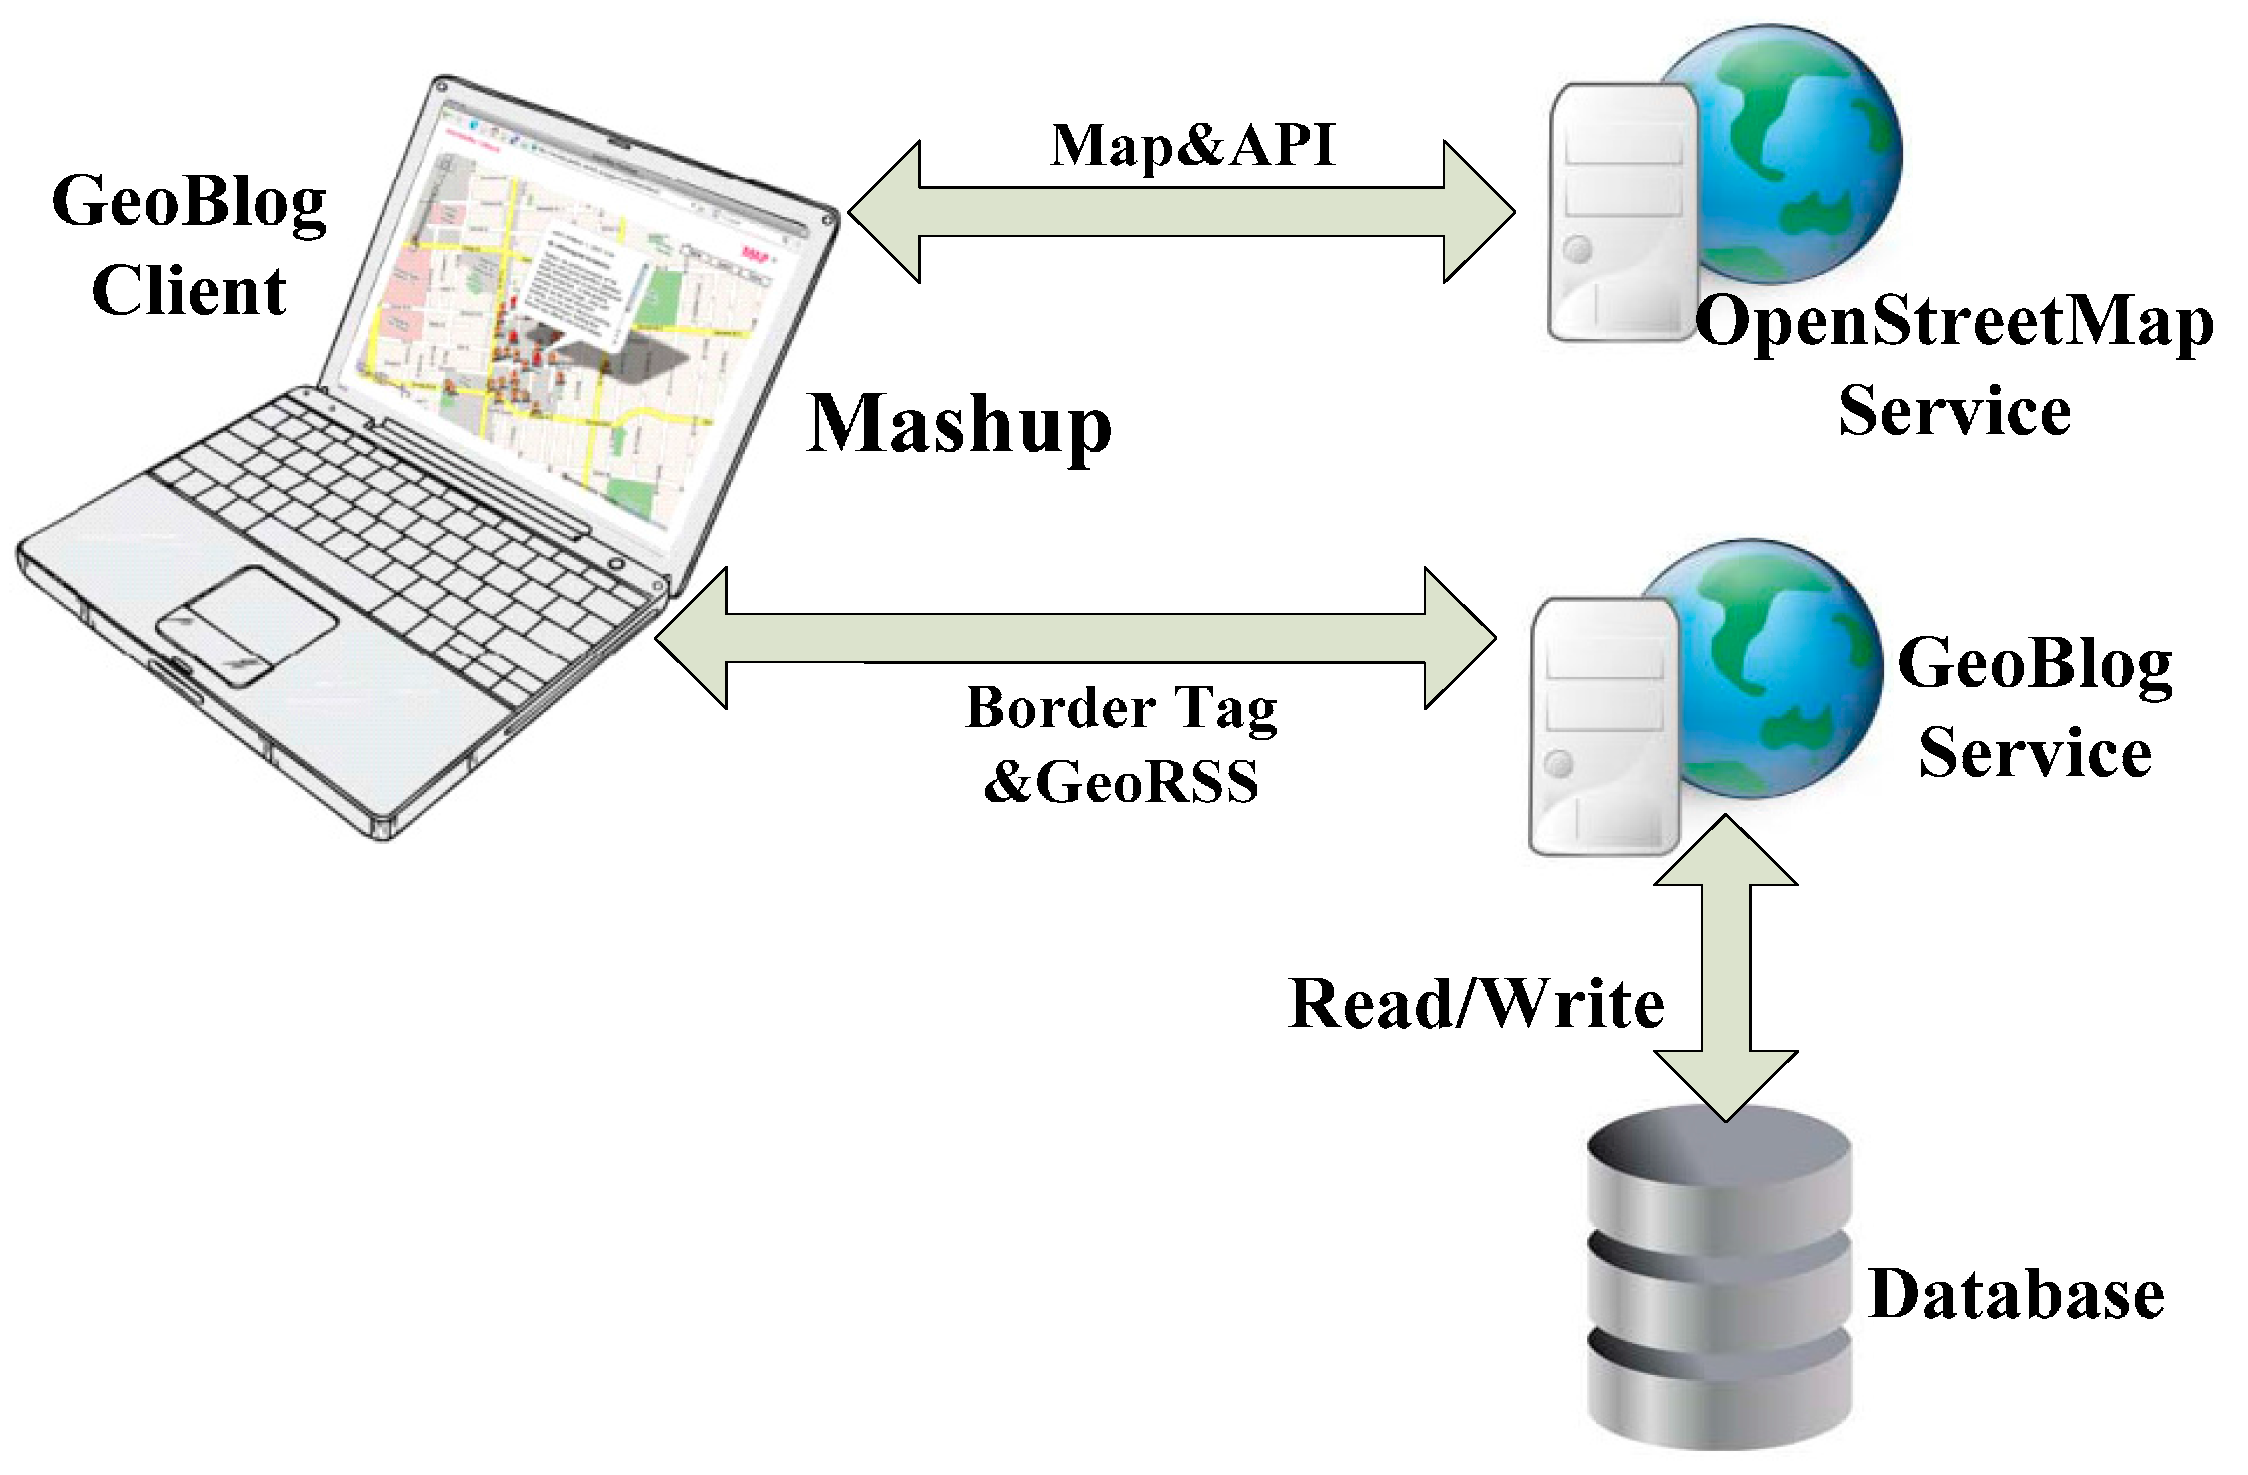
3.2. GeoBlog Mashup with OpenStreetMap

GeoBlog is a location-based content contribution system that needs to be implemented using web technology. The GeoBlog based on mashup technology presented in this paper falls into the category of “Geoweb”, which combines blog services and electronic map services together in web server process. A mashup is a Web application that aggregates multiple services to achieve a new purpose. It is an important feature of Web 2.0 and can be used with software provided as a service [33]. With various mashup techniques, it is convenient for developers to obtain data from a variety of data sources on the web and to integrate these data to build new applications.
As stated by Ramsey [34], “most mashups make use of a base map, a geocoder, and a Web interface.” A map mashup therefore combines at least one map data source or service with added information, often geo-referenced to the map data, to create a new map. While the majority of map mashups are simply for users to add locations or location-related data content onto a map (i.e., geo-referencing data content), we have also seen many mashups with more complex interfaces and powerful functions. For example, mashing up data services from OpenStreetMap, Google Maps, Flickr, YouTube, and a real estate listing to create a comprehensive real estate website is now possible. Moreover, more and more location intelligence has been built into mashups.
Mashup typically follows a three-tier architecture, following a mix of client/server and web service models. As Merrill states, a general mashup architecture consists of three different participants that are logically and physically disjoint [35]. The generic architecture has the mashup client sitting on the top and the data sources and services sitting on the bottom. The middle tier is where the mashup logics reside. It should be noted that the mashup logics for generating mashed content could be either executed on the server or within the web browser. The mashup in this paper consists of three layers: OpenStreetMap, the mashup website, and the mapmaker’s personalization. When OSM is integrated with GeoBlog, the map maker’s personalization can be provided by the blog, and thus geographical acquisitions are supported in addition to locality visualization [28]. As shown in Figure 3, GeoBlog adopts the application of the JavaScript API and integrates OSM services and blog services in an application interface to realize the interaction and mashup between blog services and OSM.
Figure 3. The frame of blog mashup with OpenStreetMap.
Ijgi 04 01530 g003

4. Spatial Publish/Subscribe Model

Borderlands data collection calls for cross-sector collaboration, as well as cross-border assistance provided by neighboring countries. Different sectors and individuals publish borderlands data they capture; meanwhile, other sectors subscribe to the information they are interested in accordingly. For example, for the relief of Chinese workers in the Nepal earthquake, medical sectors paid attention to personnel injuries and disease information to prevent the spread of infections; construction sectors sought out information regarding destroyed roads, bridges and buildings to respond to rescue needs quickly.
Publish/Subscribe has emerged as a communication paradigm able to facilitate the development of complex distributed applications in open network environments [36]. The strong decoupling it introduces between communication parties enables applications to publish information without being aware of the identities of potential receivers or even of their existence. Similarly, it enables receivers to issue subscriptions that express their interests in messages with a given content regardless of the identity of their publishers [37]. These characteristics make the paradigm particularly suited to scenarios where the set of communicating parties is subject to frequent changes, as in borderland regions. In this paradigm, the medical and construction sectors can obtain real-time information accordingly [38].

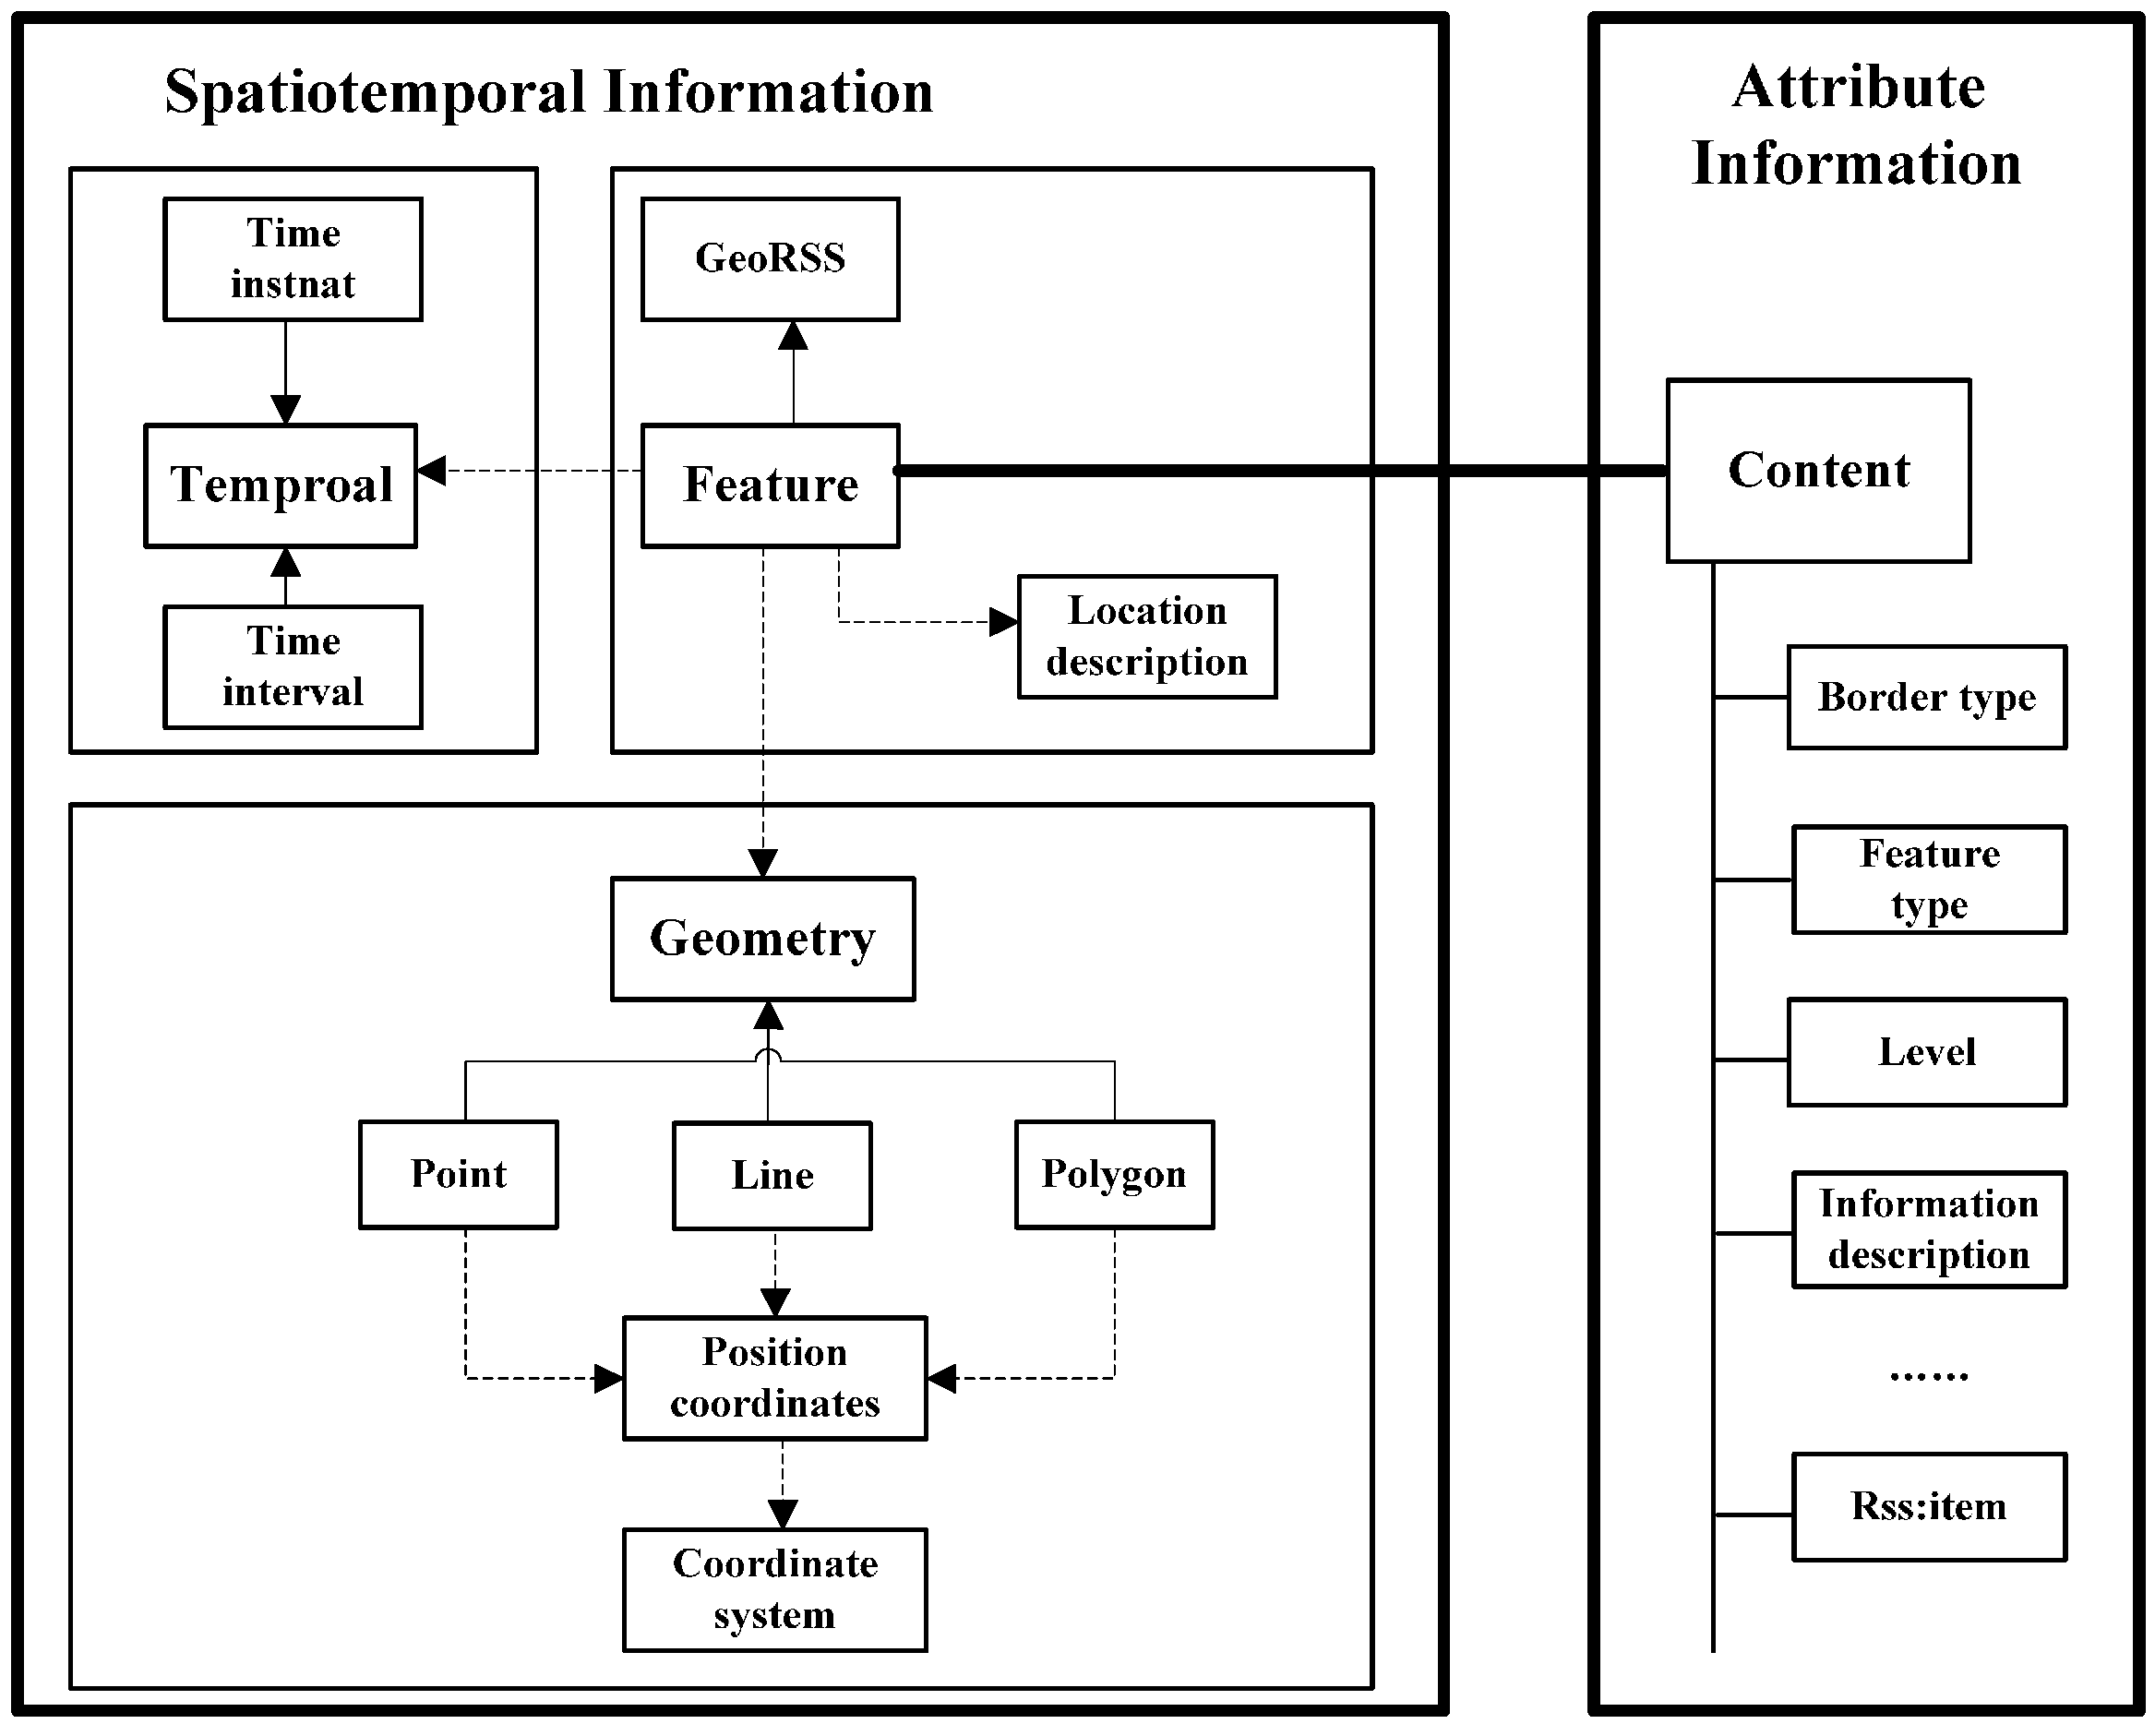
4.1. Spatial Event Model

An event is a collection of pairs, where each pair consists of an attribute name and a value [36]. According to the demand of spatial borderland information publishing, the traditional publishing content description model was extended in this paper. A spatial event is described by a set of properties specified by name-value (NV) pairs. The formation of the description of spatial borderland information is as described in Equation (1):
e = { ( B o u n d T , V C T ) ( S p a T , V C L ) ( C o o r d , V C ) ( T i m e I , V T ) }
(BoundT, Vct) is the borderland type, such as port, island, landscape, etc. The geographical borderland information is described by (SpaT, VCL), where SpaT is a type of space and VCL is the value among “point, line, polygon”. (TimeI, VT) is the time when the object is positioned. (Coord, Vc) is the geographical location specified by a predefined spatial reference system (SRS) or textual description of the location, which could be translated into a geographical location via geocoding. The four properties above describe the three most important dimensions pertaining to a spatial event: who, when and where.
The structure of a spatial event based on GeoRSS is presented as follows. RSS is a text-based web content syndication format, often specified using XML. Files related to RSS are normally called RSS files, or RSS feeds or channels. GeoRSS is an emerging standard for RSS feeds to be described by location or geo-tagged in a standardized way in which the location is encoded [39]. Many map APIs support GeoRSS feeds with either coordinate (lat/long) data or address information specified in XML items. Borderland tagging information is a description of the plotted object elements of space, time and attribute. Therefore, as shown in Figure 4, the design of the event model is composed of two parts: Spatiotemporal and Attribute information. Spatiotemporal information is polymerized by Feature, Temporal and Geometry. Among them, Temporal is composed of the time instant and time interval. Geometry is described by Position coordinate and Coordinate system, which belong to Point, Line and Polygon. Attribute information is composed of Border type, Feature type, and Rss:Item; the model provides an extension of the elements by Rss:Item.
Figure 4. The structure of a spatial event based on GeoRSS.
Ijgi 04 01530 g004

4.2. Spatial Subscription Model

A subscription is a collection of predicates, each of which consists of 3 characteristics: an attribute name, a value, and a relational operator (<, =, ≠, >, ∈, LIKE) [40]. Due to the existing subscription is a structured expression, it cannot express the condition of a spatial subscription. Therefore, it is necessary to extend the “attribute name” of spatial relationships and the corresponding constraints on “operator”. The time-space relationship described in the subscription model mainly includes the relations of time and space in which spatial relations include the topology relation, direction relation and distance relation [41]. The formation of the description on the spatial subscription expression is as shown in Equation (2).
S = { ( A S T 1 , O P 1 , C S T 1 ) ( A S T 2 , O P 2 , C S T 2 ) ... ( A S T m , O P m , C S T m ) }
OPj∈{>, =, <}. ASTj is the variables of time-space relationship. CSTj is the spatial constraint subscription and is the value of the time-space relationship with the current academic research widely used [40]. For instance, the temporal relationship is the range of {Before, Meets, Overlaps, FinishedBy, Contains, Strats, Equals, StartedBy, During, Finishs, Overlapped, MetBy, After} by Allen [41]. The topology relation is the range of {Disjoint, Meets, Overlaps, Equal, Inside, Contains, Covers, Coveredby}. The direction relation is the range of {North (N), North East (NE), East (E), South East (SE), South (S), South West (SW), West (W), North West (NW)}. The distance relation is reserved using the N-ary method, namely, the position attributes of related entities. RST(P,S) denotes the corresponding values of ASTj and CSTj, and is shown in Equation (3): TS(P,S), TP(P,S), TP(P,S), Dir(P,S) and Dis(P,S) represent the time, interval, topology relation, direction relation and distance relation between Publish(P) and Subscribe(S), respectively. Their value is the range of {TIMEINSTANT-R, TIMEPERIOD-R, TOPOLOGY, DIRECTION, DISTANCE}.
R S T ( P , S ) = { T S ( P , S ) CST = TIMEINSTANT-R (datetime) T P ( P , S ) CST = TIMEPERIOD-R (datetime) T p ( P , S ) CST = TOPOLOGY (string) D ir ( P , S ) CST = DIRECTION (string) D is ( P , S ) CST = DISTANCE (decimal) }
Spatial subscription is used by subscribers to express their interest in spatial events. In the spatial pub/sub system, a spatial subscription is defined by Equation (2). The semantic for a spatial subscription is: a notification is sent to a subscriber when an incoming spatial event (based on the spatial event model) meets the Publish (P) and Subscribe (S) requirements.

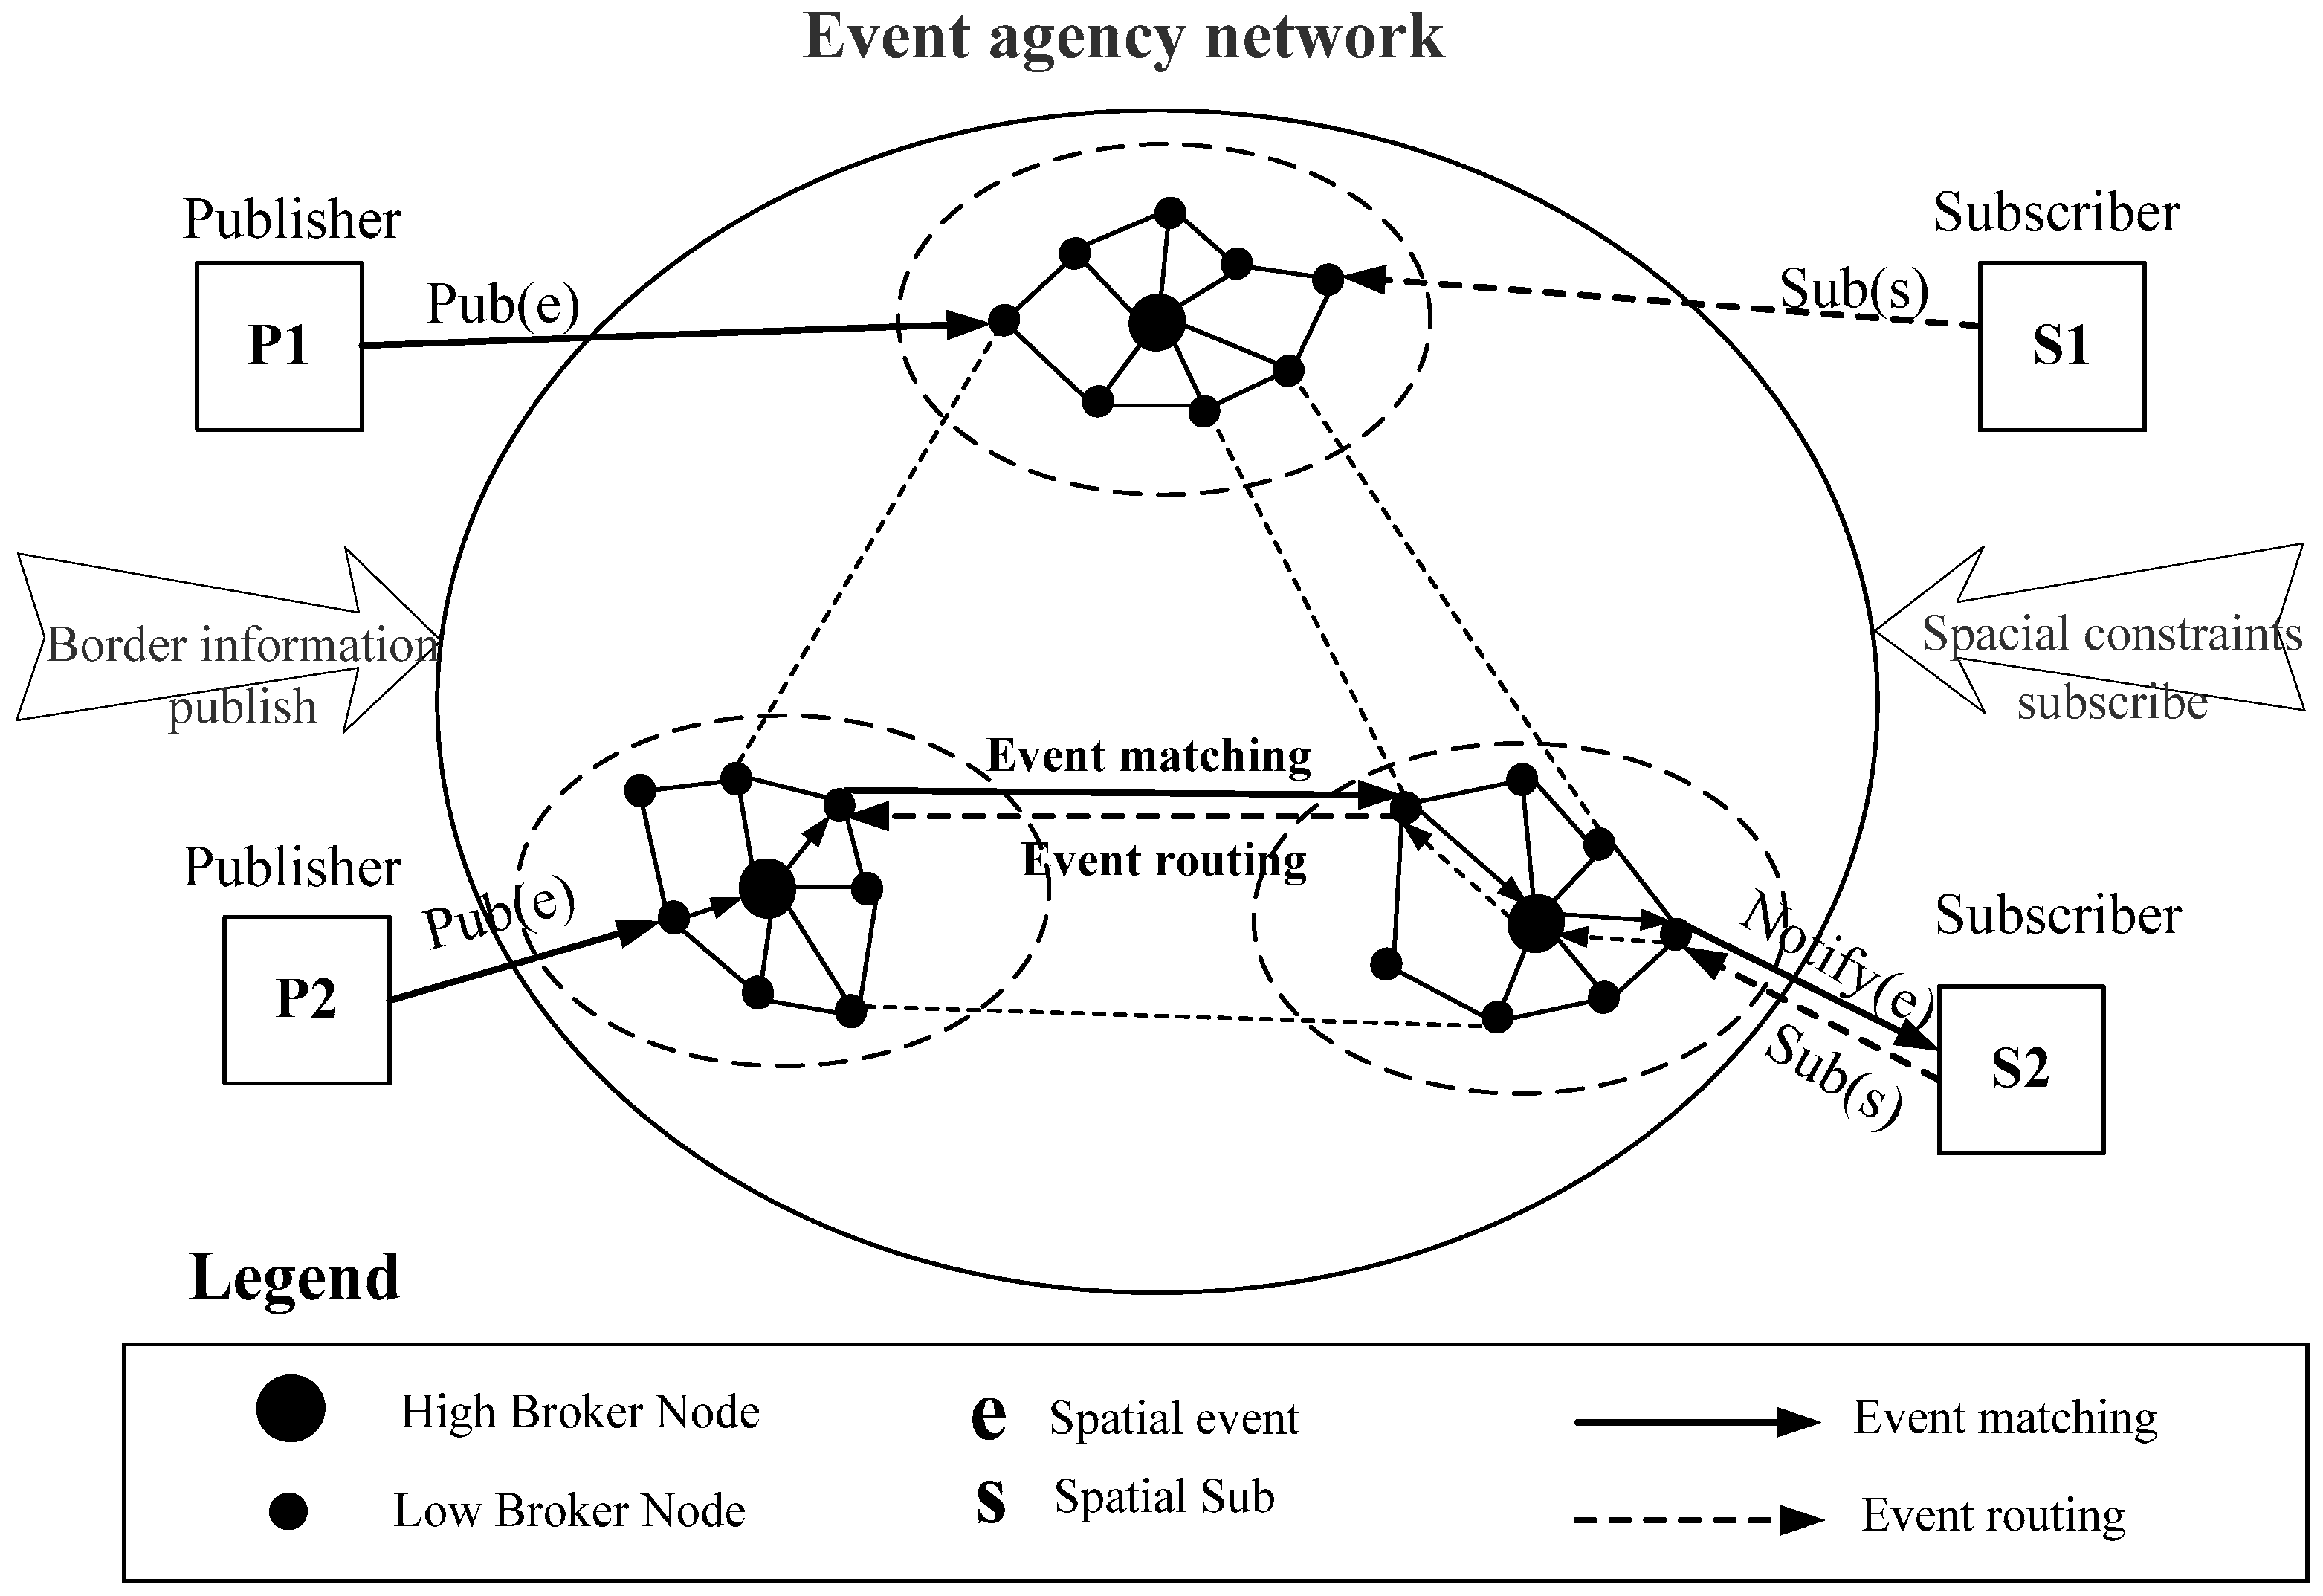
4.3. Event Agency Network

In publish/subscribe systems, typically, there are one or more router nodes, referred to as brokers, which are responsible for routing messages from the publishers to the subscribers [42]. The event brokers form an agent network providing routing, event matching, and forwarding services (see Figure 5). Individual messages are routed based on the content descriptor, referred to as the event information contained within these messages. This information is added by the publisher to describe the message contents. Subscribing entities need to first register their interests in specific content (i.e., the subscriptions) with the broker. Upon receipt of a message (previously issued by a publisher), the broker checks the event information contained within the message with a list of previously registered subscriptions. The broker then proceeds to route the message to subscribers with matching subscriptions. Here, matching refers to the process of evaluating the stored subscriptions against the topic information contained within the message. The event agency network and its route forwarding are defined as follows:
(1)
( B i , e j ) { ( B , e ) | B V ( S , B ) R c B B i n , e S } ;
(2)
Forward(Bi, ej).
In the definition, Bi is the event agency and ej is the event. V = {B1, B2, …} represents the collection of event brokers and Bin denotes the broker of an event source. RC represents the event broker routing table, while (S, B) is one element of RC. S denotes the subscription conditions. e ∈ S denotes the process of event matching, i.e., that a spatial event e is sent to subscription S when a spatial subscription is satisfied by the event. Forward (Bi, ej) denotes routing the event ej to the event broker Bi.
Figure 5. The event agency network of spatial publish/subscribe.
Ijgi 04 01530 g005

5. Prototyping and Implementation

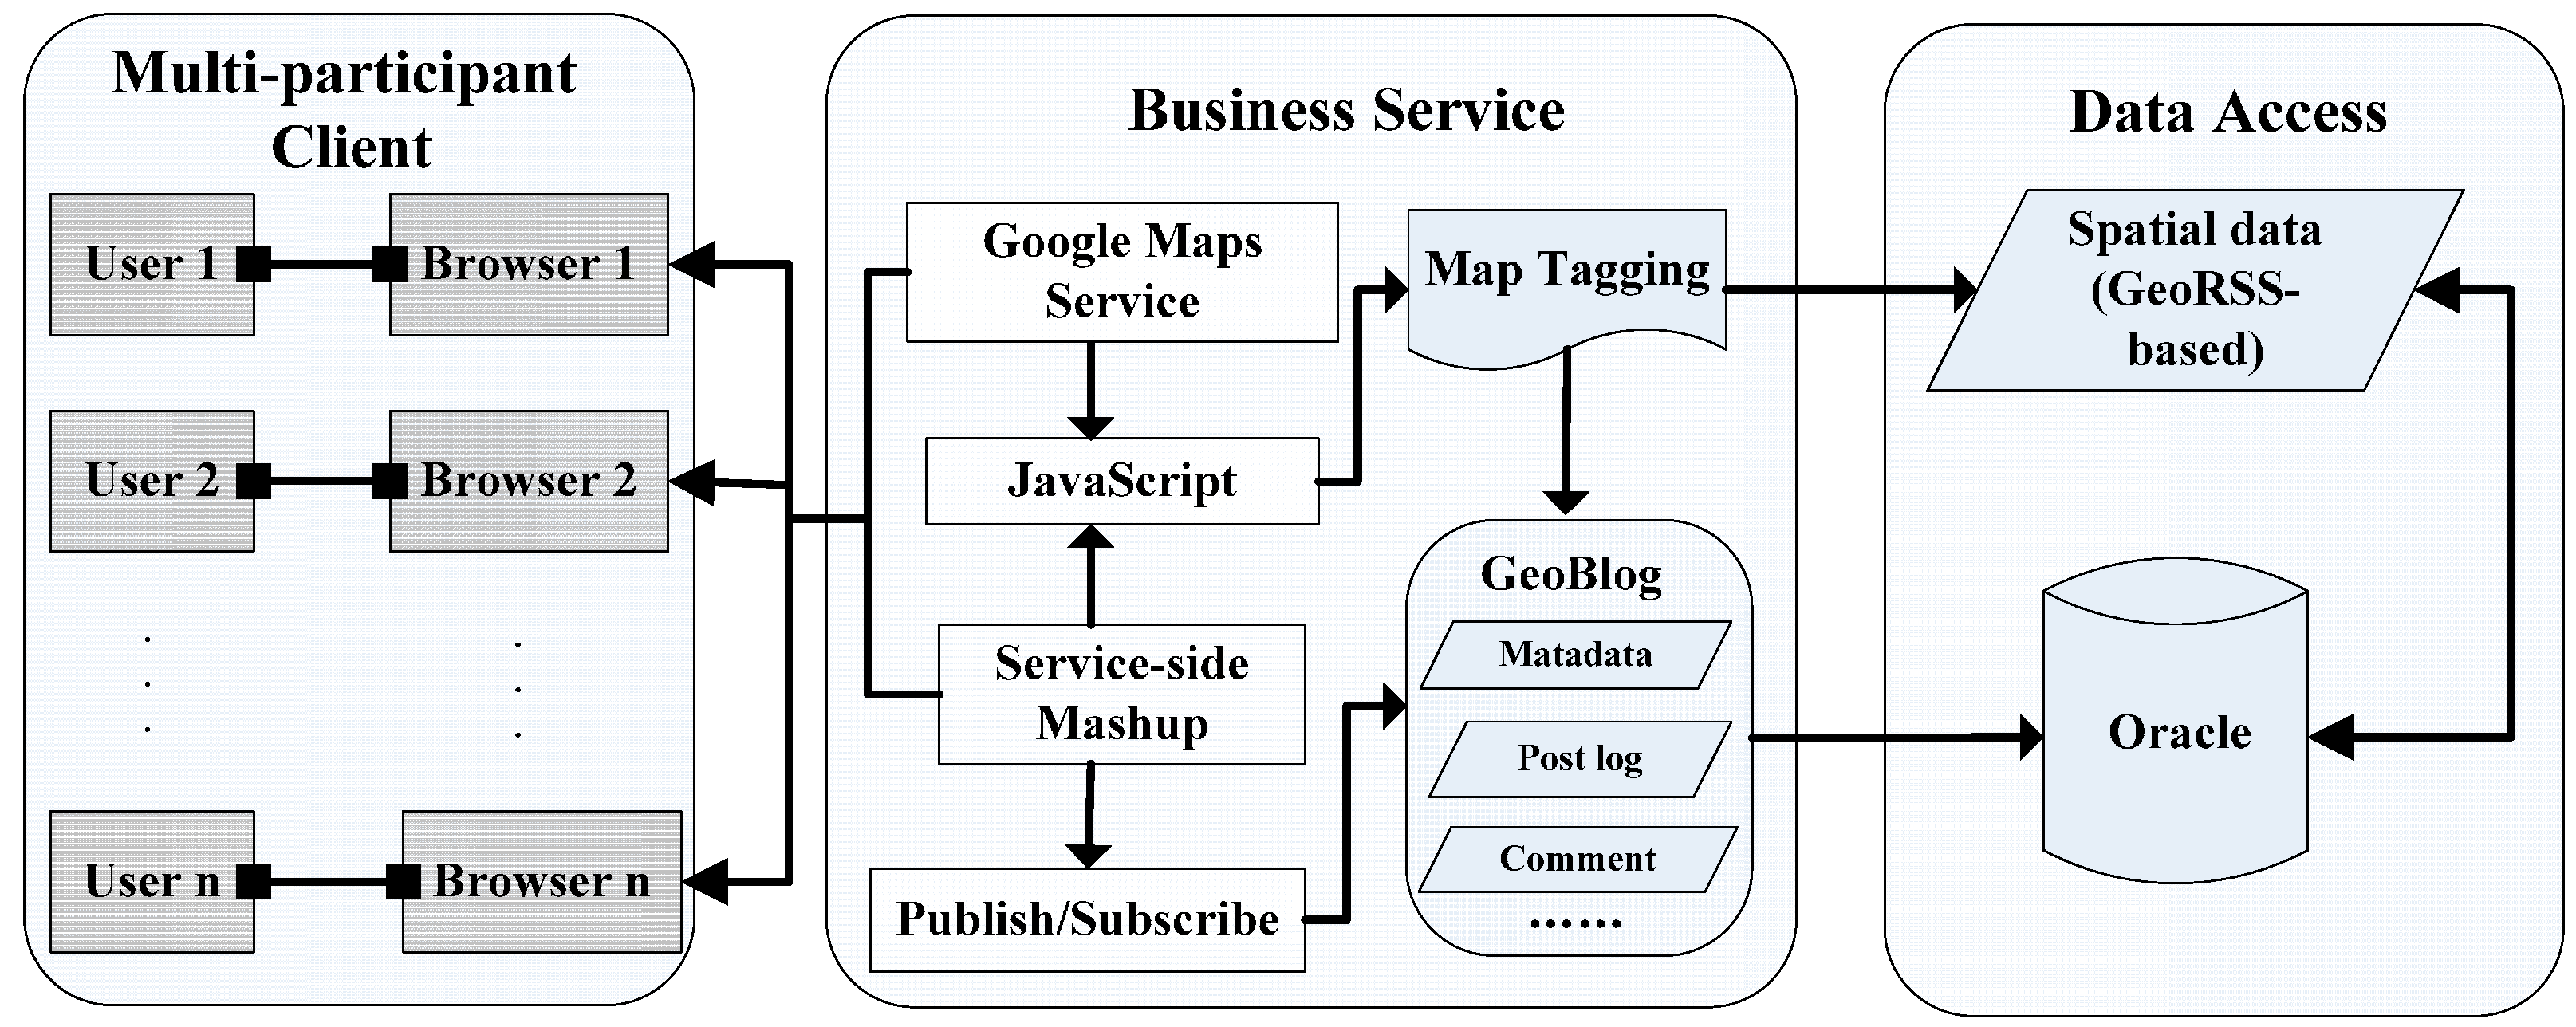
5.1. System Implementation Architecture

The tagging system relies on several Geoweb technologies commonly used for Web development and geospatial applications. As noted above, the main components include GeoBlog with the spatial extension, i.e., the spatial publish subscribe model for designing web-based message transfers, server-side scripting using JavaScript, and the programming tool that provides map tagging functions within the asp.net code using Visual Studio 2010.
The tagging system tool itself consists of a web-based portal that provides secure user authentication (login), access to post and transfer messages, and management tools programmed in asp.net. The multi-participant tagging is presented in a Web-mapping interface mashup with Google Map. For this interface, a series of customized widgets were designed to provide the unique controls and functions required by the tool. Moreover, to create the interactive multi-user environment required for tagging, functions using JavaScript and XML (AJAX) were built into the interface. Upon receipt of new data by the client interface, functions are triggered depending on the content of the data (e.g., a message transfer from publisher to subscriber in GeoBlog).
Figure 6 illustrates the general system implementation architecture of a tagging system based on these components. In general, the tool can be hosted from any asp.net-enabled Web server that has local or remote access to a borderland spatial database. Users can login and use the tool using any modern, standards-compliant browser that supports the use of dynamic HTML and AJAX. The main mapping interface is rendered from a Map Service-side mashup and sent as HTML to the browser, while individual AJAX scripts receive input and return data in response to specific events called by the browser as users interact with the tool. Event data returned from AJAX requests are then processed by corresponding callback JavaScript functions in the browser.
Figure 6. The general architecture of the tagging system.
Ijgi 04 01530 g006

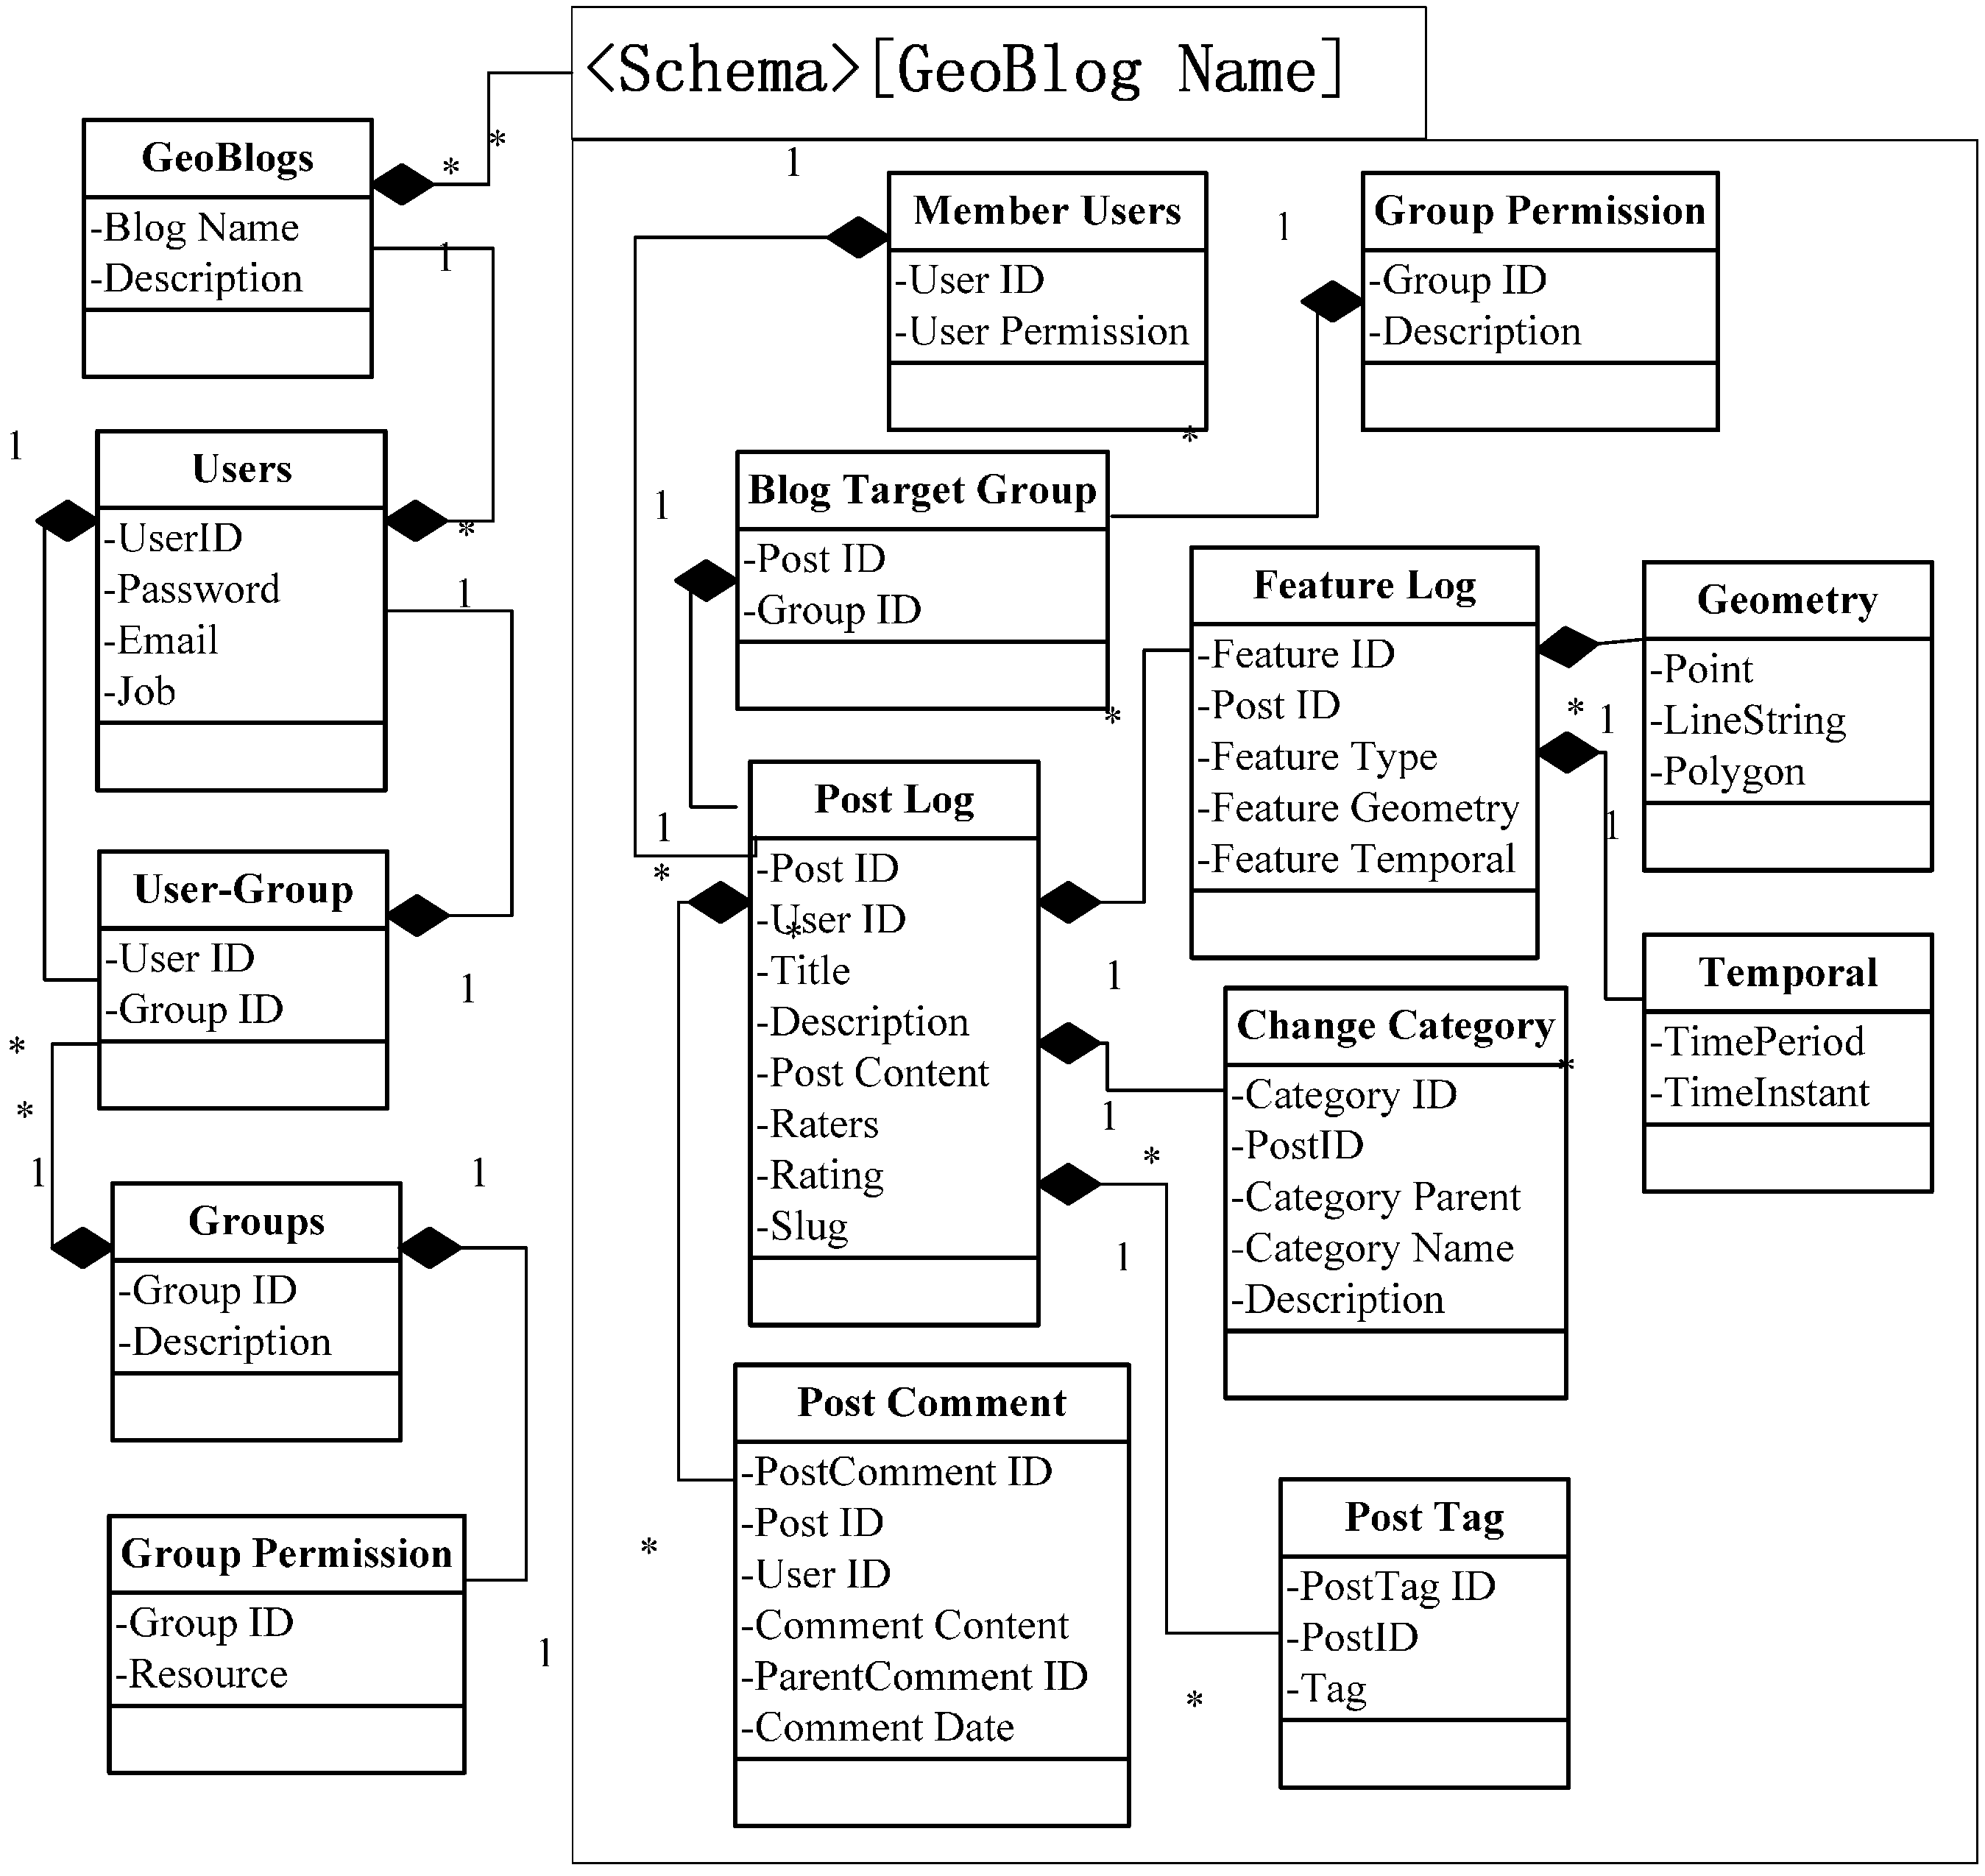
5.2. Tagging System Database Structure

GeoBlog is the main component of the spatial tagging system in this paper. There are two available ways to achieve the spatialization of a blog: one is store the information of the spatial location and blog together in a table and specify the analytic function called spatial data when applying; the other is to establish a specific table, which can express the relationship between the blog and corresponding geographic position. Considering the flexibility and scalability of the relation table, the latter way is adopted in this paper. GeoBlog is composed of external objects including the User, User-Group and blog objects including Post, Category, Comment, Tag, Feature, Geometry and Temporal data.
Given the nature of communication and interaction that needs to take place between users involved in a web-based tagging, an appropriate database schema was needed to facilitate recording and management of user data generated through interaction with the software. Figure 7 shows the general structure of the database schema used for the tagging system. A set of tables stored in a public schema are used to store general metadata describing blogs, users, groups, and membership information. This basic information is presented to users and managed by an administrator through the main website.
The core components in this schema are Post Log and Feature Log. Post Log records the information providers publish, including Post ID, User ID, Title, Post, Post Description, Ratings, Slug and other properties; Feature Log records information including geometry (i.e., point, line, and polygon) and temporal elements (i.e., time point and time period). The geometry contains coordinate information necessary for the elements to be displayed on the map. Blog posts and spatial elements of features are associated through their unique IDs to realize the spatialization of the blog and can be shown and posted on the map. Post Comment include the properties of Post ID, UserID, Comment content, and Comment Date and is related to PostLog by PostID. Post Tag is composed of properties including PostTag ID, Post ID and Tag Content and is related to Post Log by Post ID. The Feature Log includes Geometry and Temporal. Geometry has the attributes Point, Polyline and Polygon. Temporal is composed of TimePeriod and TimeInstant.
Figure 7. The database schema for the tagging system.
Ijgi 04 01530 g007

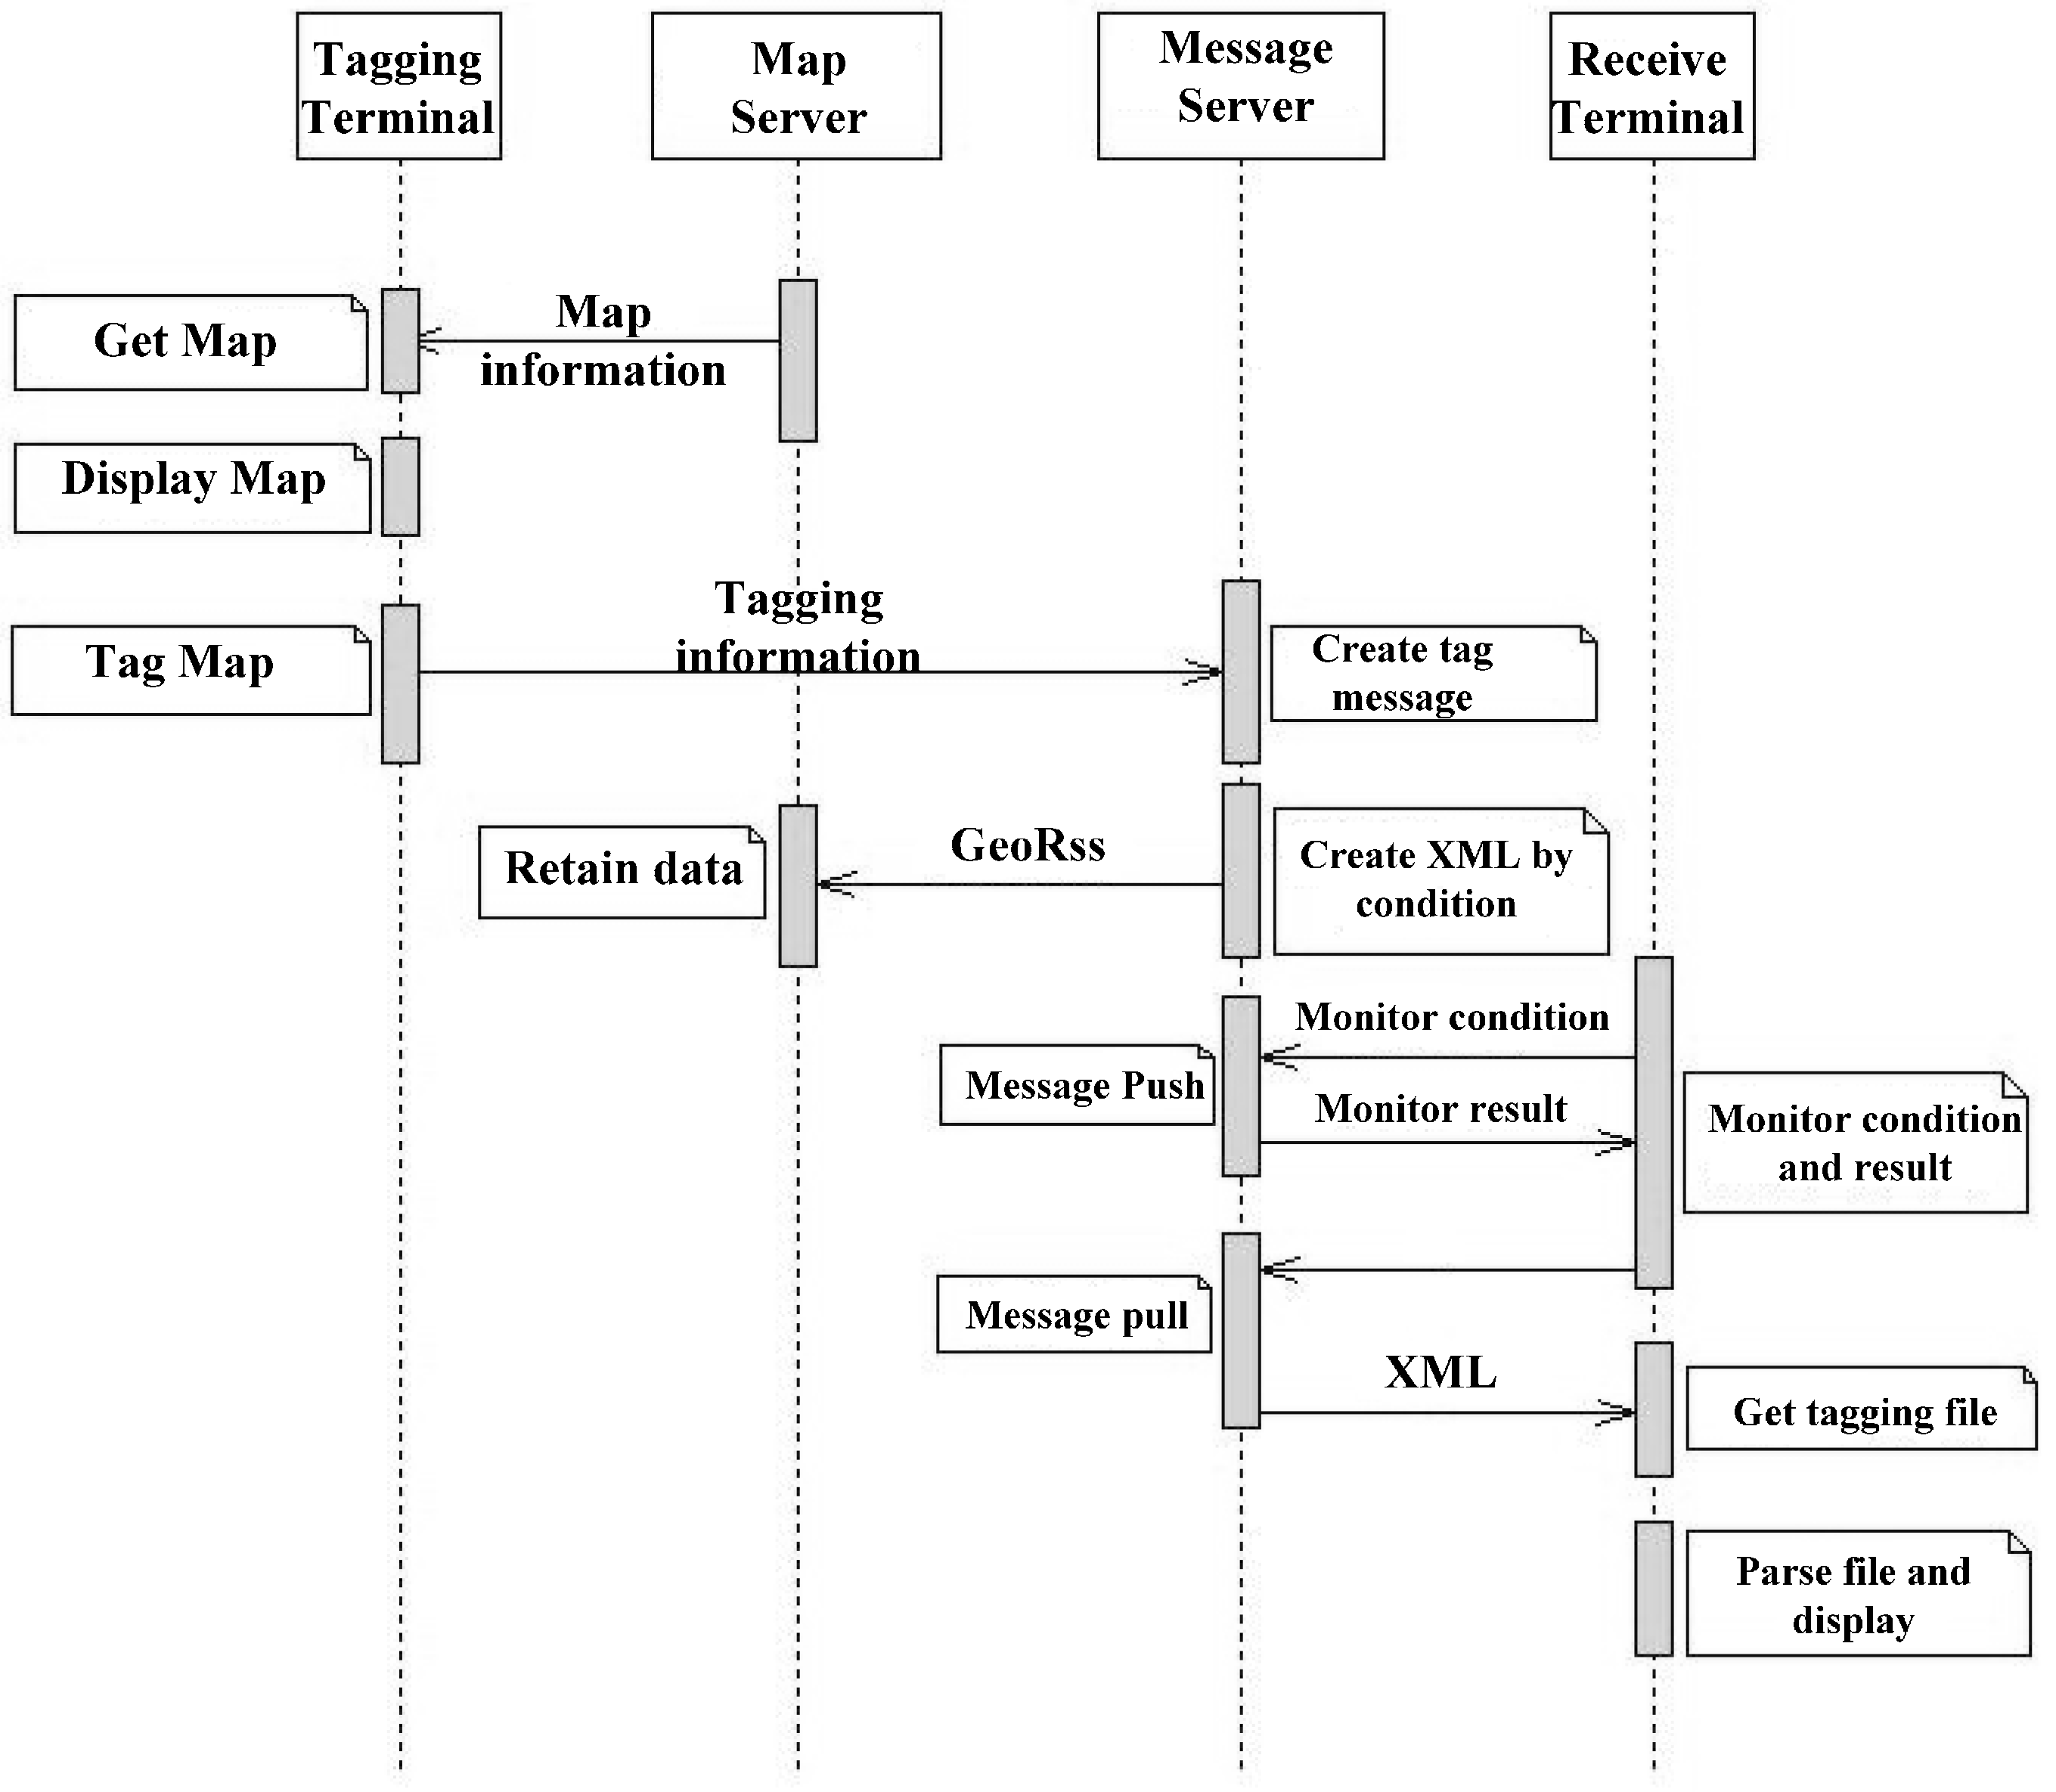
5.3. Transfer of Messages in Tagging System
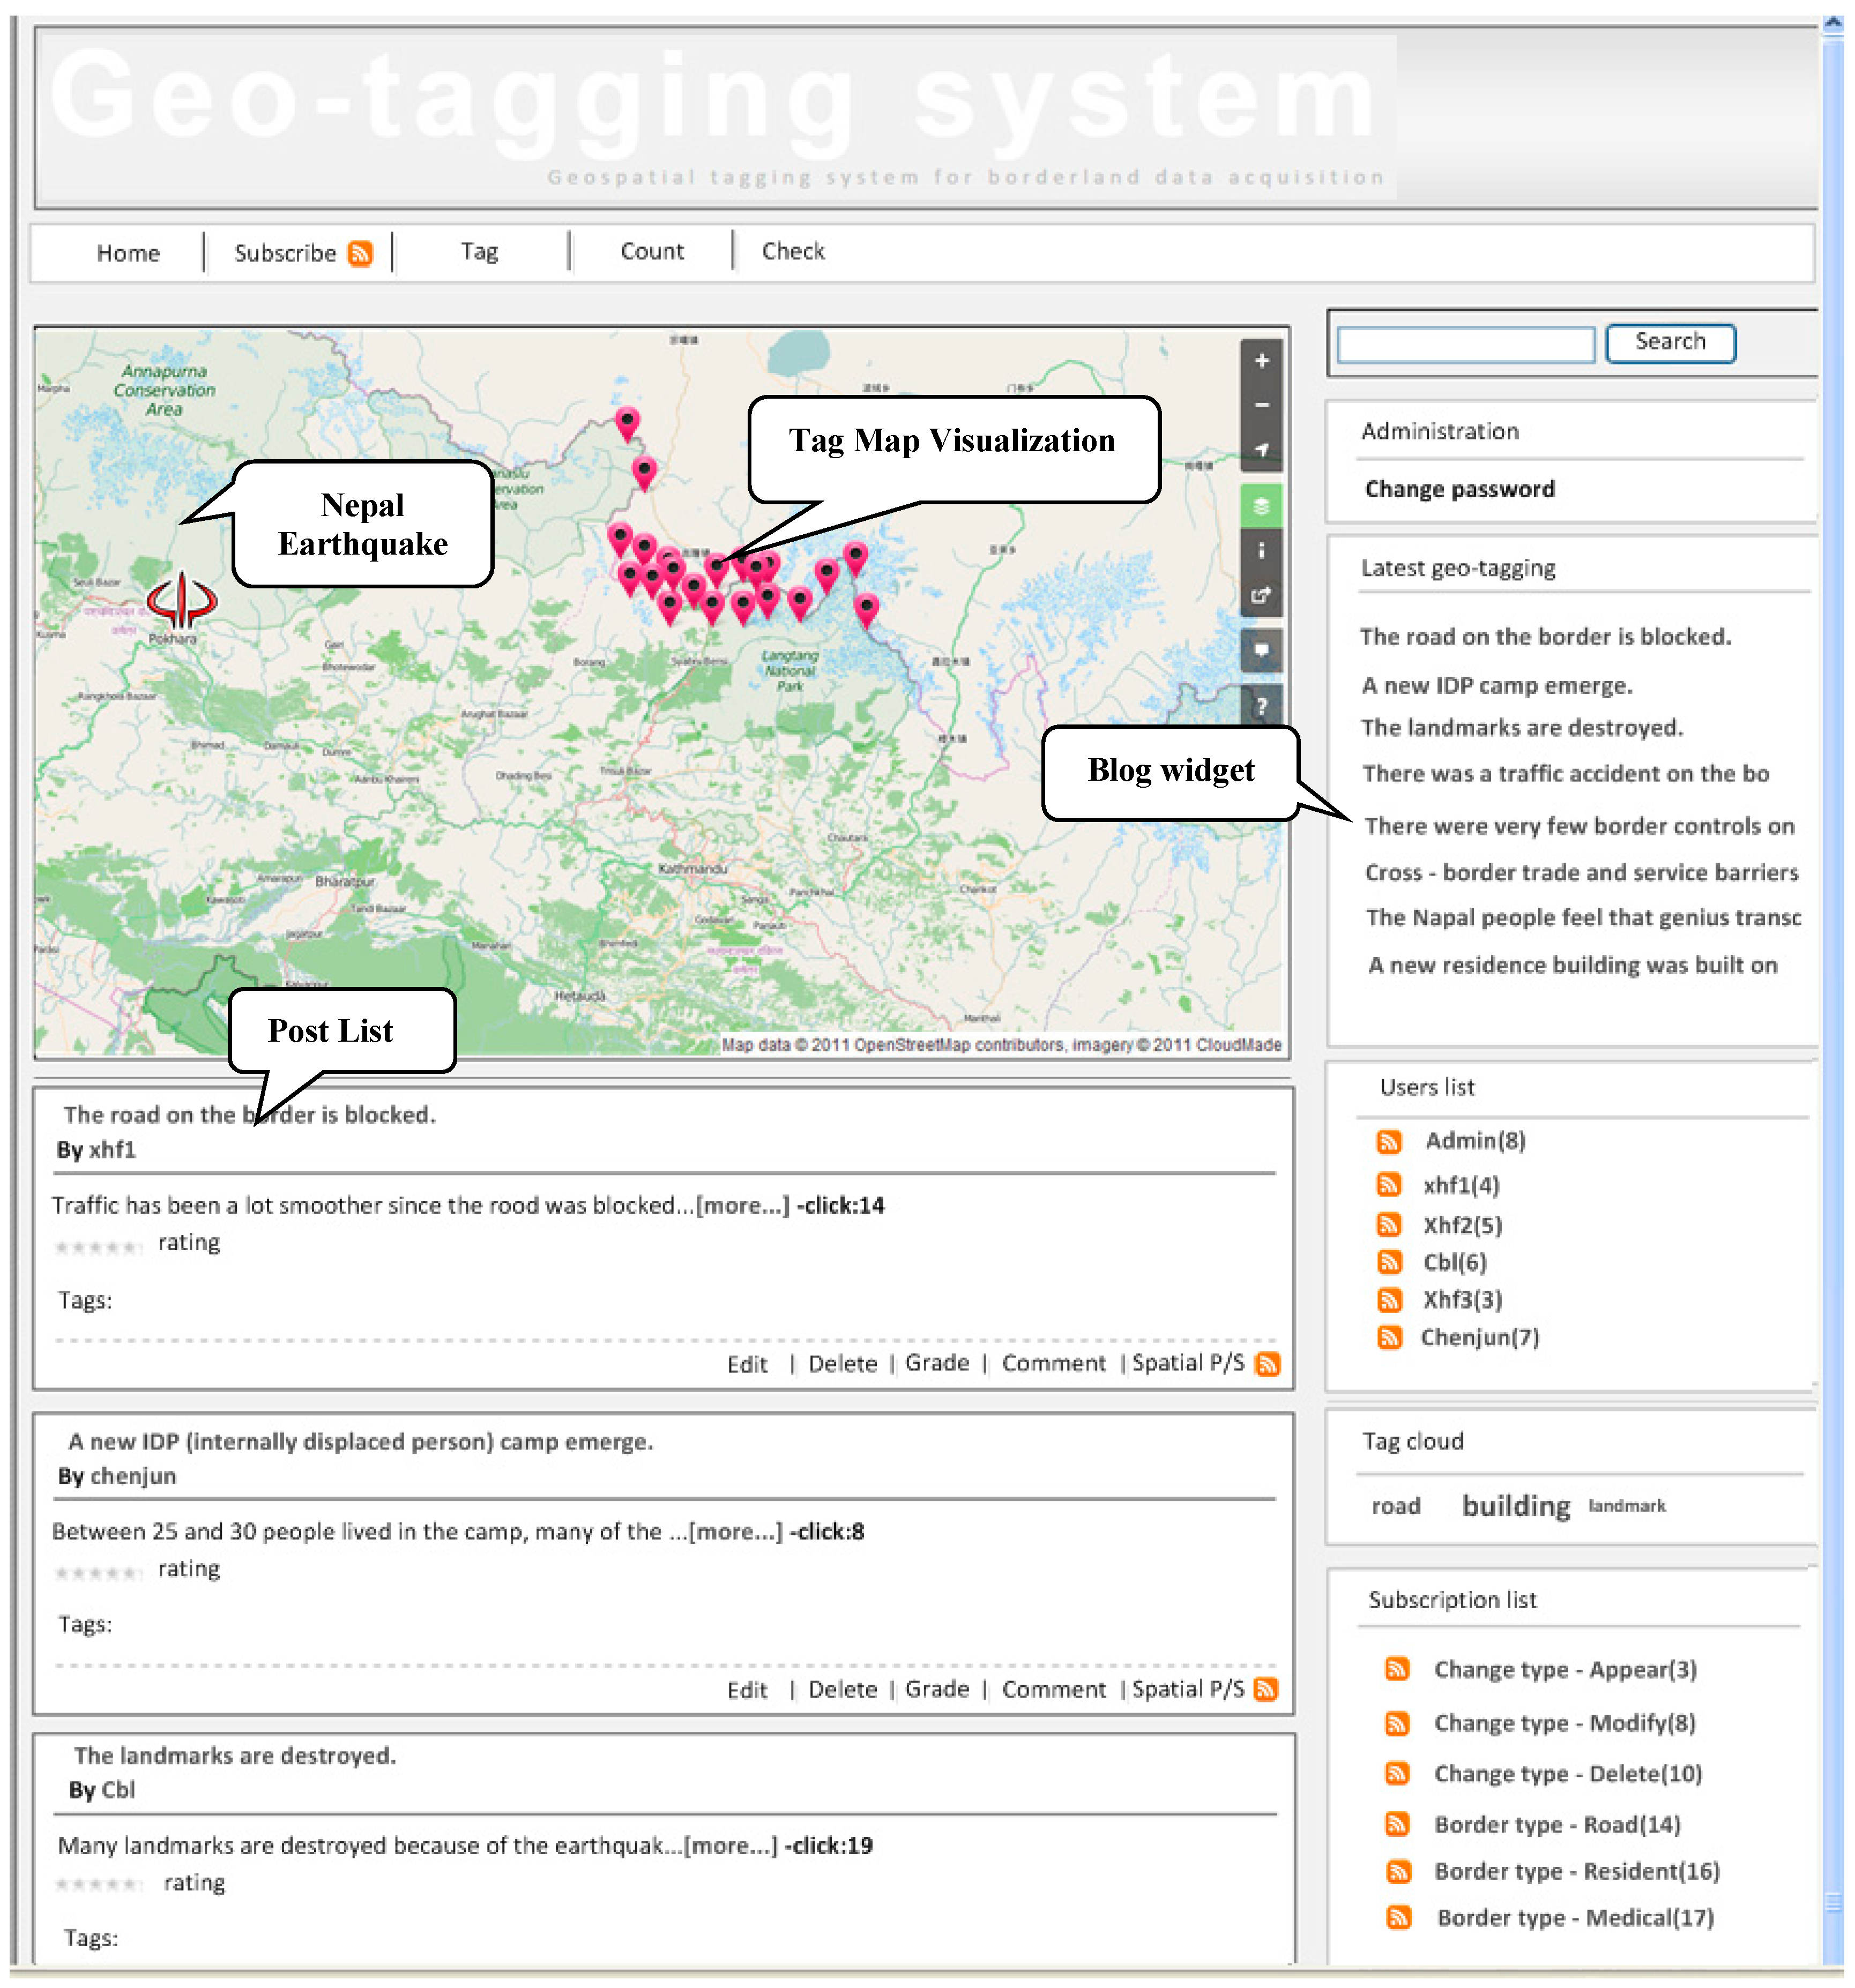
The essence of information transfer is the information search, namely the matching process [43]. Therefore, the process of borderland information tagging relies on the subscription mechanism and event matching, finds all subscriptions with a given event matching efficiently, and completes the ordered delivery of information. The sequence diagram of borderland information ordered delivery is shown in Figure 8. At the stage of tagging, the user (professional or public) queries and calls the map information by using a map server with a web service. The required background map is generated in the operation interface. Map plotting uses the choice of a toolbar in the interface and selects entities and elements in the terrain library to drag, drop and mobilize. It generates the background of corresponding map information data using a tagging parser to capture information with a mouse and then generates news in the message server, stored as an XML document in GeoRSS form, transferring it using a network after plotting. In the stage of network transmission, it makes full use of the transmission characteristics of the XML document, pushes messages in the message server, and transfers XML data through the SOAP protocol. After plotting, information is transferred through the network and event matching in the proxy server is carried out. In the stage of receiving and display, it listens to the message according to the subscription the user is interested in, pulls the message out of the queue, calls the corresponding map using the map server, then parses the map through the form of a geographical chart, storing the received GeoRSS data in the database if needed.
Figure 8. The workflow of borderland information tagging expressed as a UML sequence diagram.
Ijgi 04 01530 g008

5.4. Applications

The geospatial tagging system provides an extension that enables users to tag and edit geographical information of borderlands using Geoweb technologies, such as blogs, mashups, publish/subscribe and GeoRSS. The user-generated geographical border information is tagged and mashed up with OpenStreetMap so that a number of applications can be implemented. In applications, the “relief of Chinese workers in the Nepal earthquake” is used as an example to evaluate the efficiency and effectiveness of our proposed Geoweb-based tagging system. The accident happened on the Geelong port, which lies at the border of Nepal and China, and the trapped Chinese works called for cross-border and cross-sector relief assistance. Moreover, the cross-border community, including aid organizations, governments, and emergency response teams, needed crowdsourced data, which were received and tagged on maps that were updated in real time by the volunteers [44]. Therefore, the topic of “Nepal earthquake” can be used as a representative to evaluate the efficiency and effectiveness of our proposed tagging system for borderland information collection.
Figure 9 illustrates the sample of tagging geospatial data for border acquisition in the border areas of Nepal–China using simulated data. As shown in Figure 9, the bottom-left is the lists of blog posts, which were ordered by tag time. If a user wants to know more information, he (or she) can simply click the link to the post details page. “Tag Map Visualization” in Figure 9 denotes the management of tagging information in the form of a map; the icon on the map is associated with the post list, making the query interactive. The right side in Figure 9 includes blog widgets that are customizable, including “user list”, “latest geo-tagging”, “tag cloud”, “subscription list”, etc. “Check” and “Comment” are the interaction functions in which users can delete and modify posts, and other users can comment, grade, subscribe and/or tag the post author to achieve multi-level interaction between users. According to the above interaction operations, users can participate together to complete the data checking and conflict solving.
Figure 9. Sample screenshot of Geoweb-based tagging system.
Ijgi 04 01530 g009
“Subscribe” and “Spatial P/S” in Figure 9 illustrate the application for the publish/subscribe of border information tagging based on the model and method mentioned in Section 4. The “tag map visualization” denotes that the spatial events posted by users are displayed on the map. There are two ways to subscribe: the first is “Subscribe”, located on the top toolbar, which includes the attribute information related to the subscription during tagging, such as “border type”, “tag user”, “point of interest”; the other is “Spatial P/S”, which includes the spatial information related to tagging information. The instance in Figure 9 shows one subscription within 5 kilometers of the Subscribe Point (28.3932926, 85.329248), in which the subscribe expression is “S1 = (Dis (“28.3932926, 85.329248”), <5 km)”. The event matching process needs calculation of the result of less than 1 km of Dis (P, “28.3932926, 85.329248”). “Subscription list” is the display list of the subscription file in an IE browser. When a spatial event is published, which satisfies the subscription conditions of a space attribute and space, the subscription in “subscription list” will be updated with the pre-set time; by clicking the update, one can enter the interface “tag map visualization”, shown in Figure 9, for event view. The government and organizations, such as the medical and construction sectors, can receive the random comments produced by the tagging system using the Publish/Subscribe functions in the form of GeoRSS or Feeds.
In the application, the developed system was intensively tested using simulated data collected by suppositional volunteers. Geographers, planners, and others increasingly refer to crowdsourced data in geography as VGI [45]. In the future, we plan to disseminate brochures in the scientific community, schools and other places to attract a wide range of volunteers. Furthermore, competitive games such as those used for most computer games could be implemented to make the system more attractive.

6. Conclusions

This paper introduces the design and development of a Geoweb-based tagging system that enables users to tag and edit geographical information for borderlands data acquisition. We first propose a geospatial Conceptual Blog Model to express the information contained in blog data sources, and the concept, relations, and instances of the GeoBlog are introduced in the following sections. GeoBlog mashed up with map services enriches the representation and helps users to tag and edit various geographical data. In the era of web 2.0, blog systems such as GeoBlog provide an approach for individuals to input various geographical data and the asynchronous functions to meet the asynchronous interaction requirements. This apparently widens the data source of geographical information applications. Moreover, to make the tagging message transfer-ordered, we present an enhancement to existing publish/subscribe systems with support for the spatial data type and its associated relational operators, called the Spatial Publish/Subscribe, as well as the event agency network for routing messages from the publishers to the subscribers.
In the future, we plan to improve the geospatial tagging system in the following aspects: (1) by extending the ontology to a GeoBlog model to make it more flexible and practical, as well as by considering the integration between GeoBlog and other data resources, such as video, panoramic photos, etc.; (2) by extending the expression of the spatial publish/subscribe model and optimization of its matching algorithm to meet the requirement of the composite event and subscription; (3) by improving the interface/user design to improve user comprehension; and (4) by performing massive experiments to evaluate system usability and the quality of the data it provides.

Acknowledgments

The work described in this article was supported by the National Natural Science Foundation of China (Grant No: 41501420; 41371366; 41301442; 41301416) and the Pearl River Nova Program of Guangzhou.

Author Contributions

Hanfa Xing developed the framework and wrote the manuscript. Jun Chen contributed experimental equipment and advice for theory research. Xiaoguang Zhou advised regarding the system design and interface.

Conflicts of Interest

The authors declare no conflict of interest.

References

  1. Chen, J.; Li, R.; Dong, W.H.; Ge, Y.; Liao, H.; Cheng, Y. GIS-based borderlands modeling and understanding: A perspective. ISPRS Int. J. Geo-Inf. 2015, 4, 661–676. [Google Scholar] [CrossRef]
  2. Bie, Q.; Zhou, S.; Li, C. The impact of Border policy effect on cross-border ethnic areas. Int. Arch. Photogramm. Remote Sens. Spat. Inf. Sci. 2013, XL-4/W3, 35–40. [Google Scholar] [CrossRef]
  3. Zhou, X.G.; Jiang, Y.; Zhou, K.; Zeng, L. A dynamic integration method for borderland database using OSM data. Int. Arch. Photogramm. Remote Sens. Spat. Inf. Sci. 2013, XL-4/W3, 141–147. [Google Scholar] [CrossRef]
  4. Sui, D.; Elwood, S.; Goodchild, M.F. Crowdsourcing geographic knowledge: Volunteered geographic information (VGI) in theory and practice. Int. J. Geogr. Inf. Sci. 2014, 28, 847–849. [Google Scholar]
  5. Clark, A. Where 2.0 Australia’s environment? Crowdsourcing, volunteered geographic information, and citizens acting as sensors for environmental sustainability. ISPRS Int. J. Geo-Inf. 2014, 3, 1058–1076. [Google Scholar] [CrossRef]
  6. Fast, V.; Rinner, C. A systems perspective on Volunteered Geographic Information. ISPRS Int. J. Geo-Inf. 2014, 3, 1278–1292. [Google Scholar] [CrossRef]
  7. Kumar, C.; Heuten, W.; Boll, S. Visual overlay on OpenStreetMap data to support spatial exploration of urban environments. ISPRS Int. J. Geo-Inf. 2015, 4, 87–104. [Google Scholar] [CrossRef]
  8. Hall, G.B.; Chipeniuk, R.; Feick, R.D.; Leahy, M.G.; Deparday, V. Community-based production of geographic information using open source software and Web 2.0. Int. J. Geogr. Inf. Sci. 2010, 24, 761–781. [Google Scholar] [CrossRef]
  9. Rinner, C.; Keßler, C.; Andrulis, S. The use of web 2.0 concepts to support deliberation in spatial decision-making. Comput. Environ. Urban Syst. 2008, 32, 386–395. [Google Scholar] [CrossRef]
  10. Gao, Y.; Gao, S.; Li, R.-Q.; Liu, Y. A semantic geographical knowledge wiki system mashed up with google maps. Sci. China Technol. Sci. 2010, 53, 52–60. [Google Scholar] [CrossRef]
  11. Elwood, S. Grassroots groups as stakeholders in spatial data infrastructures: Challenges and opportunities for local data development and sharing. Int. J. Geogr. Inf. Sci. 2008, 22, 71–90. [Google Scholar] [CrossRef]
  12. Wang, J.; Cheng, Y.; Mo, H. The spatio-temporal distribution and development modes of border ports in China. Sustainability 2014, 6, 7089–7106. [Google Scholar] [CrossRef]
  13. Chen, J.; Hua, Y.-X.; Wang, F.-L.; Chen, H.-B.; Liu, W.-Z.; Zhou, Z.-W.; Zhang, Y. Research and establishment of China’s digital boundary. Acta Geideica Cartogr. Sin. 2012, 41, 791–796. [Google Scholar]
  14. Chi, H.; Sun, G.Q.; Huang, J.L.; Guo, Z.; Ni, W.; Fu, A. National forest aboveground biomass mapping from ICESat/GLAS data and MODIS imagery in China. Remote Sens. 2015, 7, 5534–5564. [Google Scholar] [CrossRef]
  15. Sun, M.; Dong, N.; Zheng, H.; Jiang, C.; Ren, X. A method of 3D-GIS application aided with stereo panorama technology. Int. Arch. Photogramm. Remote Sens. Spat. Inf. Sci. 2013, XL-4/W3, 123–130. [Google Scholar] [CrossRef]
  16. Hou, D.Y.; Wu, H.; Chen, J.; Li, R. A focused crawler for borderlands situation information with geographical properties of place names. Sustainability 2014, 6, 6529–6552. [Google Scholar] [CrossRef]
  17. Hu, H.; Ge, Y.; Hou, D. Using web crawler technology for geo-events analysis: A case study of the Huangyan Island incident. Sustainability 2014, 6, 1896–1912. [Google Scholar] [CrossRef]
  18. Goodchild, M.F. Citizens as sensors: The world of volunteered geography. GeoJounal 2007, 69, 211–221. [Google Scholar] [CrossRef]
  19. Johnson, P.A.; Sieber, R.E. Motivations driving government adoption of the Geoweb. GeoJournal 2012, 77, 667–680. [Google Scholar] [CrossRef]
  20. Deufemia, V.; Mascardi, V.; Paolino, L.; Polese, G.; Lumley, H.D. A volunteered geographic information system for collecting and rating petroglyph data. J. Vis. Lang. Comput. 2014, 25, 963–972. [Google Scholar] [CrossRef]
  21. Shih, F.; Seneviratne, O.; Miao, D.; Licardi, I.; Kagal, L.; Patton, E.W.; Castillo, C.; Meier, P. Democratizing mobile app development for disaster management. In Proceedings of the Workshop on AI Problems and Approaches for Intelligent Environments and Workshop on Semantic Cities, Beijing, China, 3–9 August 2013.
  22. Heinzelman, J.; Waters, C. Crowdsourcing Crisis Information in Disaster Affected Haiti; Special Report No. 252; United States Institute of Peace: Washington, DC, USA, 2010. [Google Scholar]
  23. Haklay, M.; Weber, P. OpenStreetMap: User-generated street maps. IEEE Pervasive Comput. 2008, 7, 12–18. [Google Scholar] [CrossRef]
  24. Fan, H.Q.; Zipf, A.; Fu, Q.; Neis, P. Quality assessment for building footprints data on OpenStreetMap. Int. J. Geogr. Inf. Sci. 2014, 28, 700–719. [Google Scholar] [CrossRef]
  25. Xing, H.F. Models of spatial marking and reporting for geographic updating. Acta Geideica Cartogr. Sin. 2014, 43, 880–881. [Google Scholar]
  26. Ballatore, A.; David, C.; Michela, B. Computing the semantic similarity of geographic terms using volunteered lexical definitions. Int. J. Geogr. Inf. Sci. 2013, 27, 2099–2118. [Google Scholar] [CrossRef]
  27. Quesnot, T.; Roche, S. Measure of landmark semantic salience through geosocial data streams. ISPRS Int. J. Geo-Inf. 2014, 4, 1–31. [Google Scholar]
  28. Richter, K.F.; Winter, S. Harvesting user-generated content for semantic spatial information: The case of landmarks in OpenStreetMap. In Proceedings of the Surveying & Spatial Sciences Biennial Conference, Wellington, New Zealand, 21–25 November 2011; pp. 75–86.
  29. Imran, M.; Elbassuoni, S.; Castillo, C.; Diaz, F.; Meier, P. Practical extraction of disaster-relevant information from social media. In Proceedings of the 22nd International Conference on World Wide Web companion, Florence, Italy, 18 May 2013; pp. 1021–1024.
  30. Delgado, F.; Martínez-González, M.M.; Finat, J. An evaluation of ontology matching techniques on geospatial ontologies. Int. J. Geogr. Inf. Sci. 2013, 27, 2279–2301. [Google Scholar] [CrossRef]
  31. Egenhofer, M.J. Toward the semantic geospatial web. In Proceedings of the 10th ACM International Symposium on Advances in Geographic Information Systems, McLean, VA, USA, 8–9 November 2002; pp. 1–4.
  32. Campos, A.; Dividino, R. Blog Ontology (BloOn) & Blog Visualization System (BloViS). In Proceedings of the IEEE First International Workshop on Ontologies in Interactive Systems, Liverpool, UK, 1 September 2008; pp. 83–88.
  33. Li, S.; Gong, J. Mashup: A new way of providing web mapping/GIS services. In Proceedings of ISPRS 2008 Congress Beijing, Beijing, China, 3–11 July 2008; pp. 639–649.
  34. Ramsey, P. Mashing up the enterprise. Available online: http://www.geospatialsolutions.com/geospatialsolutions/author/authorDetail.jsp?id=34062 (accessed on 10 March 2008).
  35. Pietroniro, E.; Fichter, D. Map mashups and the rise of amateur cartographers and mapmakers. ACMLA Bull. 2007, 127, 26–30. [Google Scholar]
  36. Eugster, P.; Felber, P.; Guerraoui, R.; Kermarrec, A.-M. The many faces of publish/subscribe. ACM Comput. Surv. 2003, 35, 114–131. [Google Scholar] [CrossRef]
  37. Demers, A.; Gehrke, J.; Hong, M.; Riedewald, M.; White, W. Towards expressive publish/subscribe systems. In Advances in Database Technology—EDBT; Ioannidis, Y., Scholl, M.H., Schmidt, J.W., Matthes, F., Hatzopoulos, M., Boehm, K., Kemper, A., Grust, T., Boehm, C., Eds.; Springer: Heidelberg, Germany, 2006; pp. 627–644. [Google Scholar]
  38. Paikan, A.; Domenichelli, D.; Natale, L. Communication channel prioritization in a publish-subscribe architecture. Available online: http://arxiv.org/abs/1504.02128 (accessed on 19 August 2015).
  39. Long, Y.H.; Wang, K.; Tang, Z.Q. Primary exploration of the approach of geographic data encoding GeoRSS. Sci. Surv. Mapp. 2010, 35, 225–224. [Google Scholar]
  40. Konstantinidis, A.; Carzaniga, A.; Wolf, A. A content-based publish/subscribe matching algorithm for 2D spatial objects. In Proceedings of the 12th International Middleware Conference, Lisboa, Portugal, 12–16 December 2011; pp. 208–227.
  41. Chris, W.; Richard, F. A reusable ontology for fluents in OWL. In Proceedings of the Fourth International Conference on Formal Ontology in Information Systems, Baltimore, MD, USA, 9–11 November 2006; pp. 226–236.
  42. Hu, S.Y.; Wu, C.; Buyukkaya, E.; Chien, C.H.; Lin, T.H.; Abdallah, M. A spatial publish subscribe overlay for massively multiuser virtual environments. In Proceedings of the IEEE International Conference on Electronics & Information Engineering, Kyoto, Japan, 1–3 August 2010; pp. 314–318.
  43. Pallickara, S.; Pierce, M.; Gadgil, H.; Fox, G.; Yan, Y.; Huang, Y. A framework for secure end-to-end delivery of messages in publish/subscribe systems. In Proceedings of the 7th IEEE/ACM International Conference on Grid Computing, Barcelona, Spain, 28–29 September 2006; pp. 215–222.
  44. Dodge, M.; Kitchin, R. Crowdsourced cartography: Mapping experience and knowledge. Environ. Plan. A 2013, 45, 19–36. [Google Scholar] [CrossRef]
  45. Harvey, F. To volunteer or to contribute locational information? Towards truth in labeling for crowdsourced geographic information. In Crowdsourcing Geographic Knowledge; Sui, D., Elwood, S., Goodchild, M., Eds.; Springer: Heidelberg, Germany, 2013; pp. 31–42. [Google Scholar]

