Article

Analyzing the Correlation between Deer Habitat and the Component of the Risk for Lyme Disease in Eastern Ontario, Canada: A GIS-Based Approach

1
Department of Geography, Queen's University, Kingston, ON K7L 3N6, Canada
2
KFL & A Public Health, Kingston, ON K7M 1V5, Canada
3
Leeds, Grenville & Lanark District Health Unit, Brockville, ON K6V 7A3, Canada
*
Author to whom correspondence should be addressed.
ISPRS Int. J. Geo-Inf. 2015, 4(1), 105-123; https://doi.org/10.3390/ijgi4010105
Submission received: 7 August 2014 / Accepted: 7 January 2015 / Published: 15 January 2015
(This article belongs to the Special Issue Remote Sensing and Geospatial Technologies in Public Health)

Abstract

:
Lyme borreliosis, caused by the bacterium, Borrelia burgdorferi, is an emerging vector-borne infectious disease in Canada. According to the Public Health Agency of Canada (PHAC), by the year 2020, 80% of Canadians will live in Lyme endemic areas. An understanding of the association of Ixodes scapularis, the main vector of Lyme disease, with it hosts is a fundamental component in assessing changes in the spatial distribution of human risk for Lyme disease. Through the application of Geographic Information System (GIS) mapping methods and spatial analysis techniques, this study examines the population dynamics of the black-legged Lyme tick and its primary host, the white-tailed deer, in eastern Ontario, Canada. By developing a habitat suitability model through a GIS-based multi-criteria decision making (MCDM) analysis, the relationship of the deer habitat suitability map was generated and the results were compared with deer harvest data. Tick submission data collected from two public health units between 2006 and 2012 were used to explore the relationship between endemic ticks and deer habitat suitability in eastern Ontario. The positive correlation demonstrated between the deer habitat suitability model and deer harvest data allows us to further analyze the association between deer habitat and black-legged ticks in our study area. Our results revealed that the high tick submission number corresponds with the high suitability. These results are useful for developing management strategies that aim to prevent Lyme from becoming a threat to public health in Canada. Further studies are required to investigate how tick survival, behaviour and seasonal activity may change with projected climate change.

1. Introduction

The incidence of Lyme disease-carrying ticks has been increasing across different regions of North America over recent years. Research studies have shown that the distribution and abundance of tick populations has increased and migrated northwards from endemic areas in the United States towards new regions in southern Canada [1]. At present, endemic tick populations are found in various regions across Canada, including Nova Scotia, New Brunswick, Quebec, Ontario and southeastern Manitoba [2,3]. In 1980, the first reported endemic tick population in Ontario occurred at Long Point, Ontario [4]. More recently, populations of ticks infected with Borrelia burgdorferi (B. burgdorferi) were discovered in the eastern Ontario area. The first endemic population was found on Thwartway Island of the Thousand Islands in 2006 [5]. Between 2002 and 2008, there have been a total of 37 human Lyme disease cases identified within the health unit boundaries of Kingston, Frontenac, Lennox and Addington Public Health and the Leeds, Grenville and Lanark Health Unit.
The black-legged tick has three instars, consisting of larvae, nymph and adult stages, which all feed on the animal hosts. The ticks will fall off their host when fully engorged and will then progress into the next developmental stage. Ticks acquire B. burgdorferi when feeding on infected host species and will then infect any subsequent animal upon which they feed [6]. Due to their small size, ixodid ticks have very limited capacity for moving into new territory, and as a result, long-distance dispersal of the tick is typically attributed to a wide range of hosts, including rodents, white-tailed deer and migratory birds [7].
While birds migrating northwards in the spring can carry ticks long distances into Canada [8], research studies have suggested that the primary host of tick populations in Canada is the Odocoileus virginianus, or more commonly known as the white-tailed deer [9]. In Canada, the geographic range of the white-tailed deer is quite extensive, as populations of the deer had been identified in the east coast of British Columbia to the Maritime Provinces in the west and extending from the northern USA border to southeastern Canada [1]. The white-tailed deer play a critical role in the reproduction and life cycle of the tick and is often considered to be an important host to all tick stages. During the fall and early winter season, adult ticks will feed and mate on the white-tailed deer before dropping onto the ground to lay eggs in the following spring [10]. Since transovarial transmission of generalized infection to filial ticks is highly unlikely, larvae that hatch during midsummer are free from B. burgdorferi infection [11]. During the larvae blood meal, ticks will feed on deer and rodent hosts, but studies have found that white-footed mice are primarily responsible for infecting ticks with B. burgdorferi at this stage of the tick life cycle. Larvae will then molt into nymphs and then into adults in the following months, which will then seek a deer host on which to feed. The reproduction cycle begins again as these adult ticks mate on their deer host during the autumn season [10]. Thus, the location of the deer is an important determinate of the location of egg-laying adults during this time of the year and, hence, where larvae occur during their blood meal in the summer.
Recent studies have demonstrated that white-tailed deer population density is positively correlated with tick abundance in several regions across North America [12]. In 2001, a study analyzing Ixodes ticks found that the emergence of Lyme disease has been associated with land use changes that increased the density of the white-tailed deer [13]. Another study that conducted an experimental addition of acorn in eastern U.S. oak forests, a highly preferred habitat of the white-tailed deer, found a series of chain events linking tick populations and tick hosts. By attracting deer into the oak forests through the addition of acorns, their research showed that the amount of time that the deer spent feeding on acorns was longer during the autumn season and that the densities of black-legged ticks were also higher, suggesting greater Lyme disease risk [10]. Furthermore, researchers analyzing the relationship between tick stages and hosts demonstrated that over 95% of adult female ticks feed on the white-tailed deer. While ticks at the larvae and nymphal stage rely primarily on smaller hosts, such as rodents or birds, the study suggested that nymphal ticks will also feed on the deer whenever available [14]. In New England, field studies investigating the ecology of Ixodes scapularis (I. scapularis) quickly revealed the ticks’ dependence on the white-tailed deer, with the deer feeding mostly on ticks at the adult stage [15]. White-tailed deer are considered incompetent reservoirs of B. burgdorferi, as deer serum contains a borreliacidial component, which is an antibody against the manifestations of Lyme disease [16]. Hence, the development of white-tailed deer populations in eastern North America over the past century may be responsible for the maintenance and establishment of tick populations. However, no similar studies have been conducted in Canada.
Global climate change has caused much speculation with the potential of causing serious effects on the future spatial and temporal distribution of vector-borne diseases. Since climate plays an important role in the survival of vectors and pathogens, studies have predicted that climate change may open up previously uninhabitable territory for vectors, increase reproduction rates and shorten pathogen incubation periods [17]. Furthermore, analyses were conducted using statistical models to explain the northern expansion of the tick’s geographic range with climate change [18]. While many previous studies have analyzed the impact of climate change on the northwards expansion of endemic tick populations in the U.S. or Canada [1,19,20,21], few research studies have explored the relationship of the black-legged ticks and its primary host in Canada, as the impact of the white-tailed deer on the spread of B. burgdorferi at the local scale is not entirely understood. The use of passive surveillance to monitor the spatial and temporal occurrence of ticks and their infection with B. burgdorferi tick populations has occurred in Canada as early as the 1990s. Ticks that were found by the public attached to themselves or their pets were submitted either directly or via physicians and veterinarians to provincial and federal health organizations and Canadian universities [22]. To date, there have been a limited number of research studies focusing on the occurrence of tick populations in the eastern Ontario region at the local area level using passive surveillance.
The integration of multi-criteria decision making (MCDM) with Geographic Information Systems (GIS) and spatial analysis had been used in various applications as a practical method to solve complex multi-faceted environmental problems. MCDM is a powerful technique, as it enables decision makers to evaluate relative priorities by developing a framework based on a set of preferences or criteria combined into a single model. Since the 1990s, the use of MCDM and GIS had been applied in various fields and was shown in studies related to urban planning, land use allocation, forest conservation and site determination [23]. A GIS-based MCDM model was proven to be a useful tool in developing habitat suitability models to predict species presence and to support conservation planning [23,24,25]. Since evaluating habitat suitability often requires the use of data from different sources and at different spatial scales, an MCDM approach will allow us to find the best combination of habitat features based on the environmental preferences of the white-tailed deer, which will then be used to predict species spatial distribution across our study area.
The objective of this study is to determine the applicability of a deer habitat suitability model used as a proxy for determining black-legged tick distribution in eastern Ontario. A habitat suitability model of the white-tailed deer using a MCDM- and GIS-weighted sum analysis is developed to explore the relationship between deer habitat suitability and endemic tick populations in eastern Ontario. The results from habitat suitability are compared with deer harvest data. Through the application of GIS methods and spatial analysis, we will strive to gain greater insight for the first time into the spatial distribution of endemic tick populations at the dissemination area (DA) level and the potential role of white-tailed deer in the spatial expansion of Lyme ticks. We also aim to determine the relationship between the tick B. burgdorferi bacterium and deer establishment, while predicting future trends, which can be used to guide local health in developing disease prevention strategies and generating greater public awareness.

2. Materials and Methods
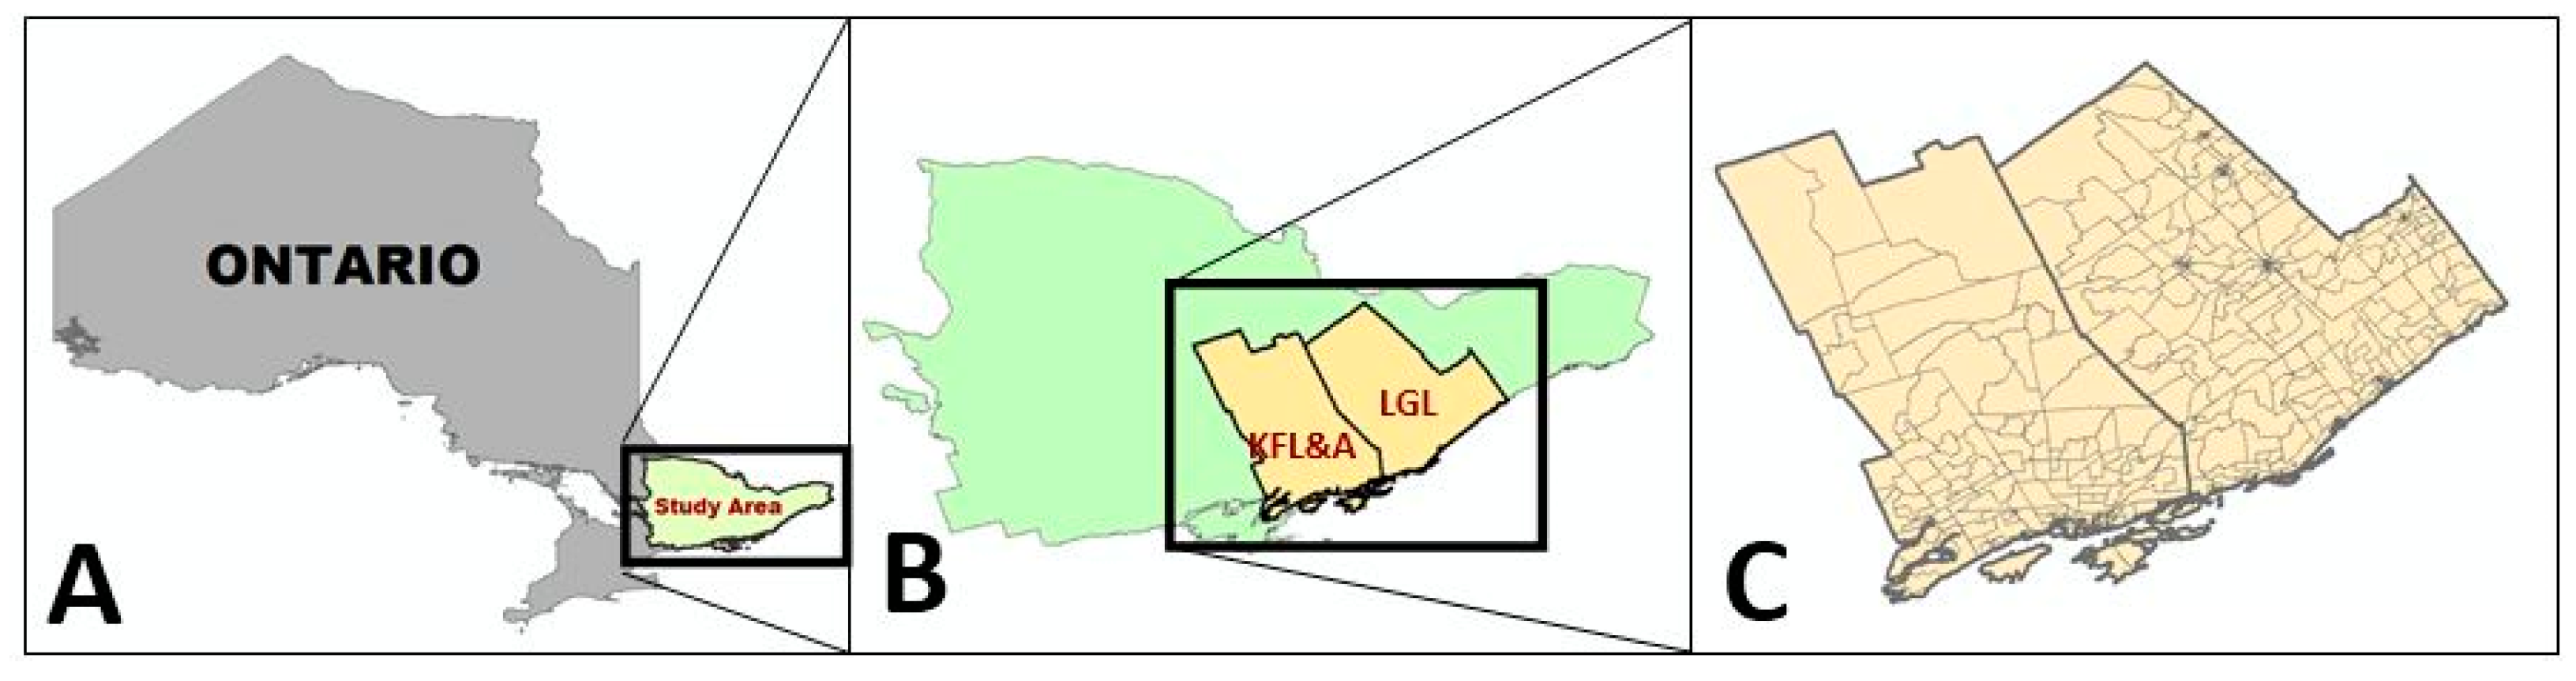
2.1. Study Area

The study of the deer habitat was conducted in the eastern Ontario region at the wildlife management unit (WMU) geographic level, which is an administrative coverage boundary developed by the Ontario Ministry of Natural Resources (MNR) based on a number of environmental requirements of wildlife species. In Ontario, there are a total of 95 WMUs. Of the 95, our study area consisted of 35 units in the southeastern Ontario region and includes the following units: 48, 50, 51, 53A, 54, 55A, 55B, 56, 57, 58, 59, 60, 61, 62, 63A, 63B, 64A, 64B, 65, 66A, 66B, 67, 68A, 68B, 69A, 69B, 70, 71, 72A, 73, 74A, 74B, 75, 76A and 78A. Figure 1 shows the extent of our deer study area, with the label representing each WMU.
Figure 1. Wildlife management units in southeastern Ontario.
Ijgi 04 00105 g001
The tick-validation area is based on the boundaries of two public health units located in eastern Ontario, consisting of the Kingston, Frontenac, Lexington and Addington Public Health (KFL&A) and the Leeds, Grenville and Lanark District Health Unit (LGL). Since the study area of the tick is conducted within the southeastern region of the deer study area (Figure 1), Figure 2 outlines the extent of the tick-validation study area relative to the deer study area. As shown in Figure 2, Image A displays the study area of the deer within the province of Ontario, Image B shows the boundaries of the two public health units with respect to the deer study area and Image C shows the dissemination area (DA) boundaries of the two public health units.
Figure 2. Extent of the tick validation study area. (A) The study area of the deer within the province of Ontario; (B) the boundaries of the two public health units with respect to the deer study area; and (C) the dissemination area (DA) boundaries of the two public health units. KFL&A, Kingston, Frontenac, Lexington and Addington Public Health; LGL, Leeds, Grenville and Lanark District Health Unit.
Ijgi 04 00105 g002

2.2. Data Collection
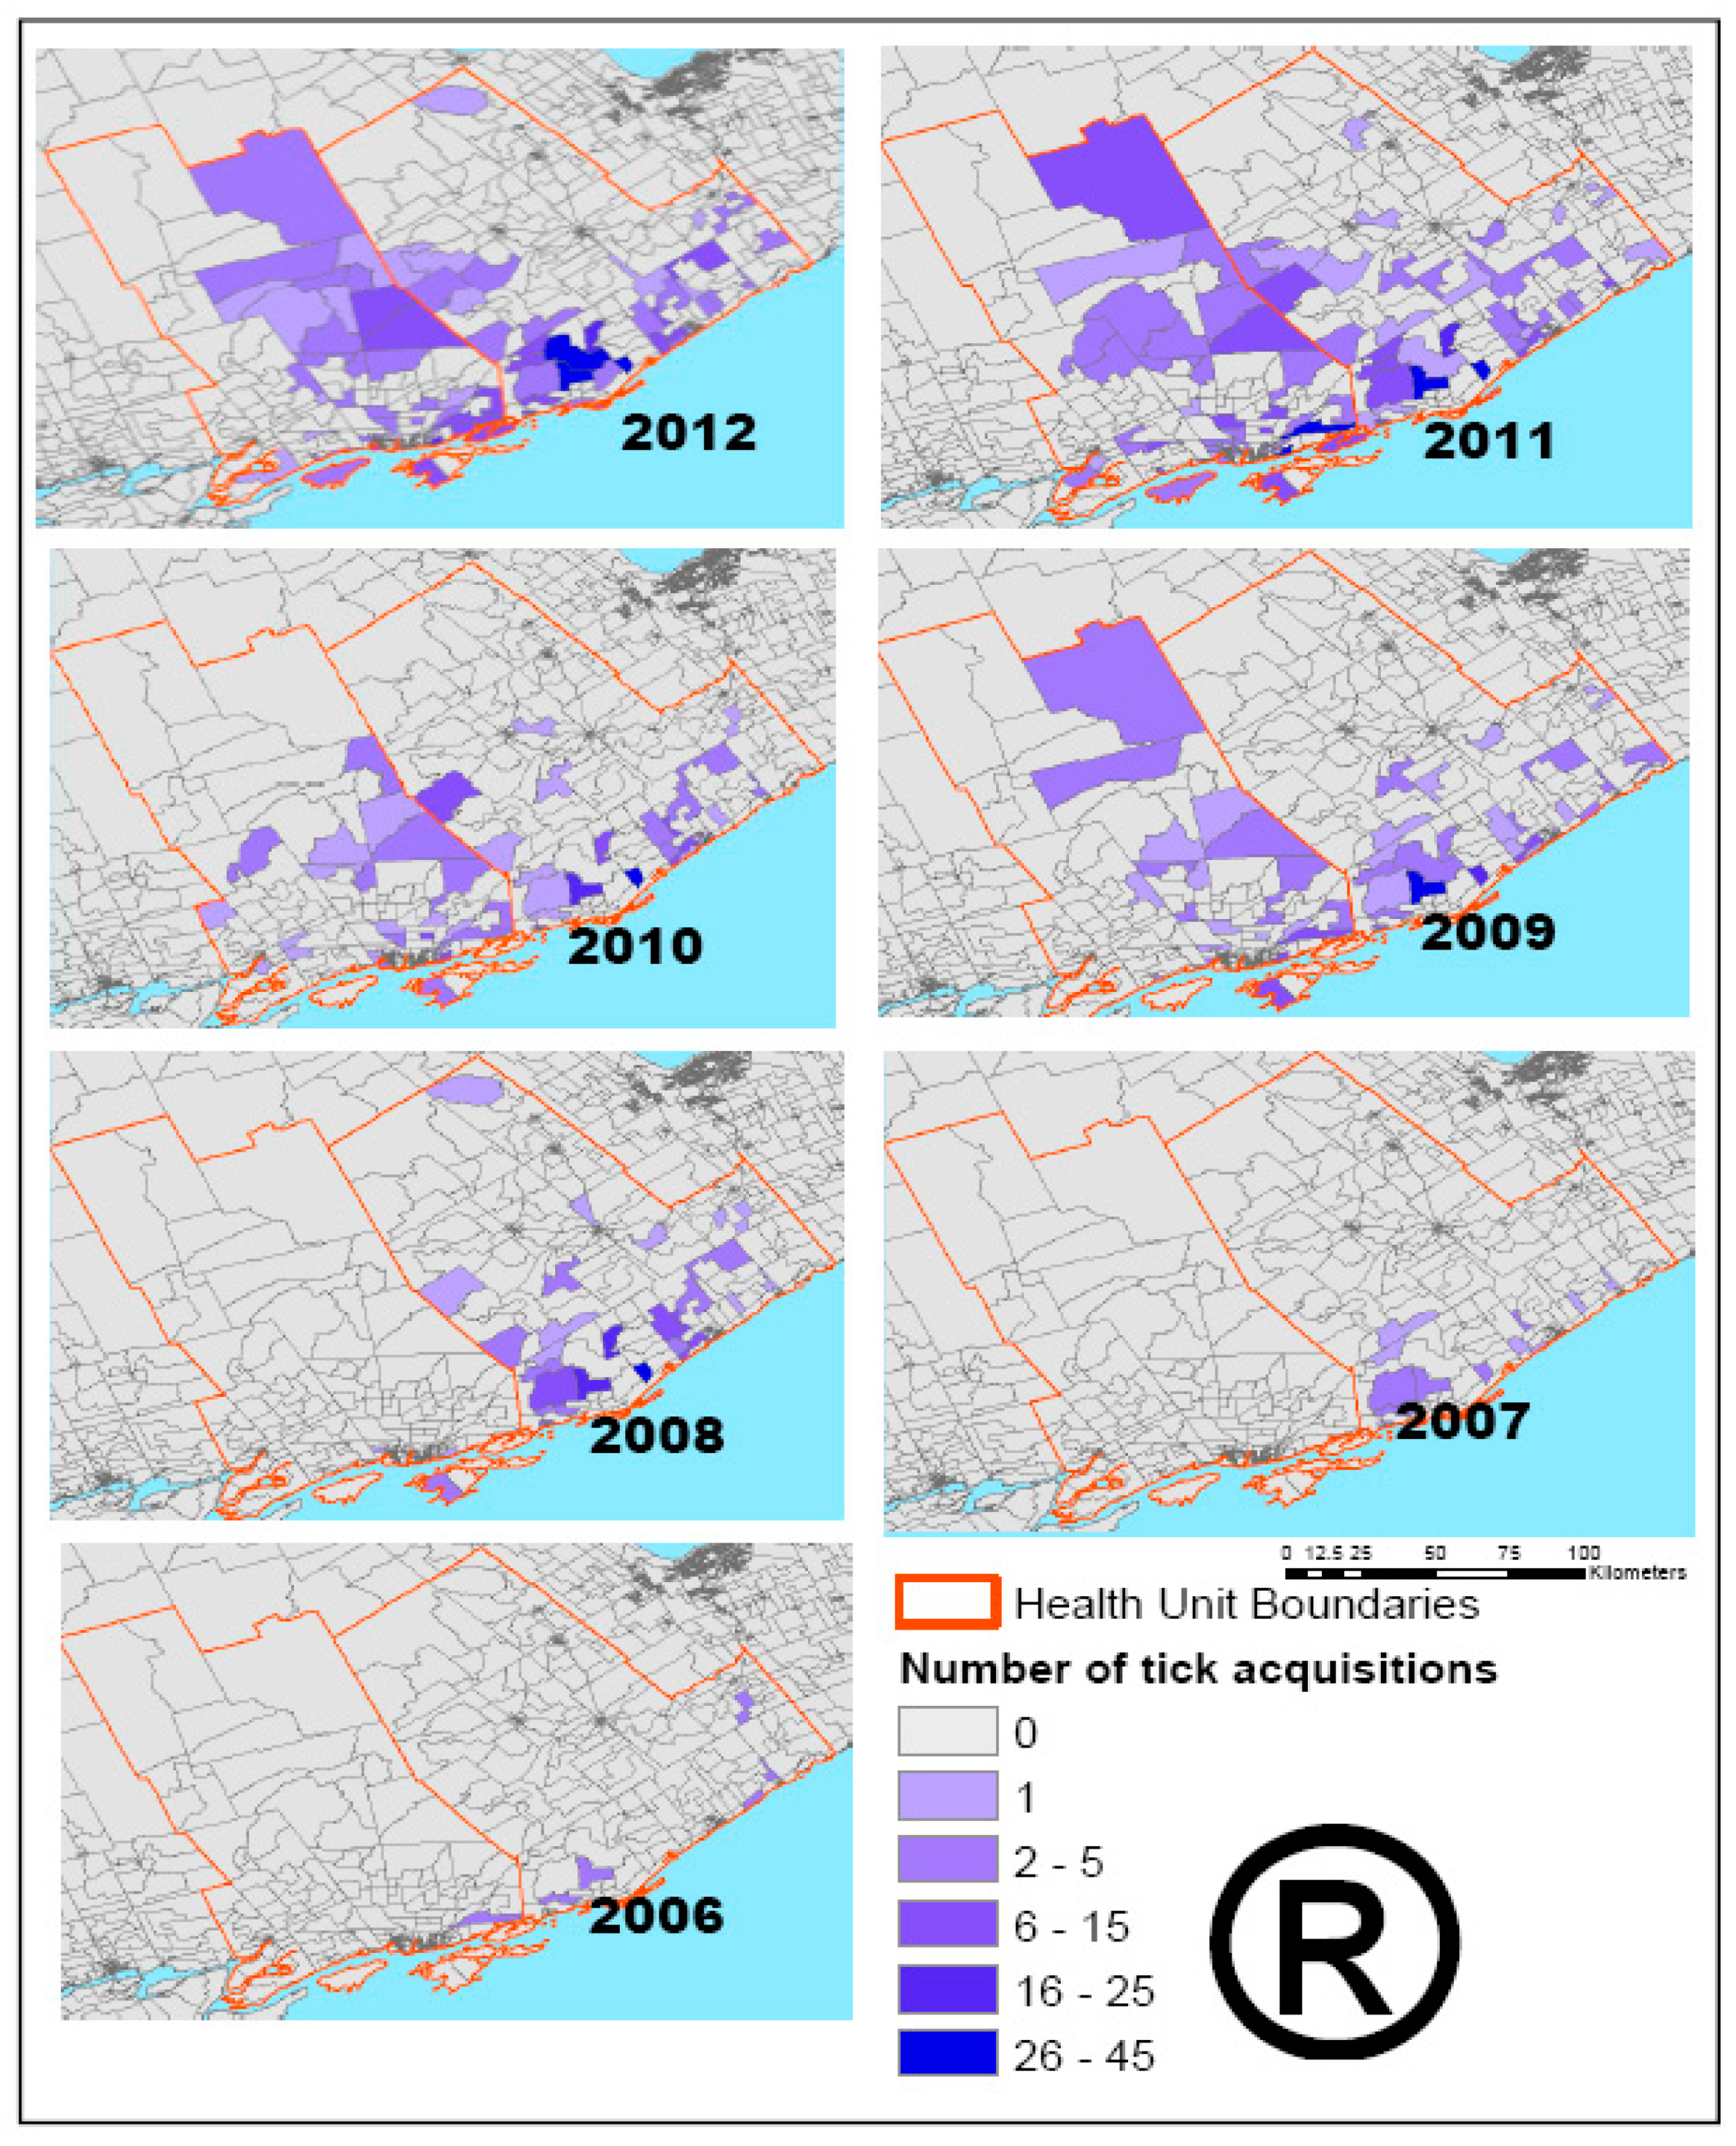
2.2.1. Tick Data

Tick data collected through passive surveillance from KFL&A and LGL range from January 2006, to December 2012. The parasitical specimens attached on humans and found by the public have been submitted to local health units. These tick data were then sent to provincial health laboratories of the Public Health Agency of Canada, where the identification of tick species (I. scapularis, Amblyomma americanum, Dermacentor variabilis, Ixodes cookei, Ixodes marxi, Ixodes muris) and of the bacteria, B. burgdorferi, was conducted. Tick data that were collected and that did not provide an acquisition location at the postal code level were eliminated from the study. Due to the confidentiality of the tick submitters’ identities and personal health information, tick acquisition locations acquired at the six-digital postal code level were geocoded and converted into the DA unit level in our analysis for anonymous participation. There were a total of 3474 tick submissions collected from KFL&A and LGL via passive surveillance from 2006 to 2012, in which 1570 of them were acquired within our study area. The remainder was ticks acquired either outside the study area health unit boundaries or tick acquisitions without the complete 6-digit postal code information provided. Of the 1570 ticks, 1241 within the study area were identified as the I. scapularis species, in which 231 were positive for B. burgdorferi.

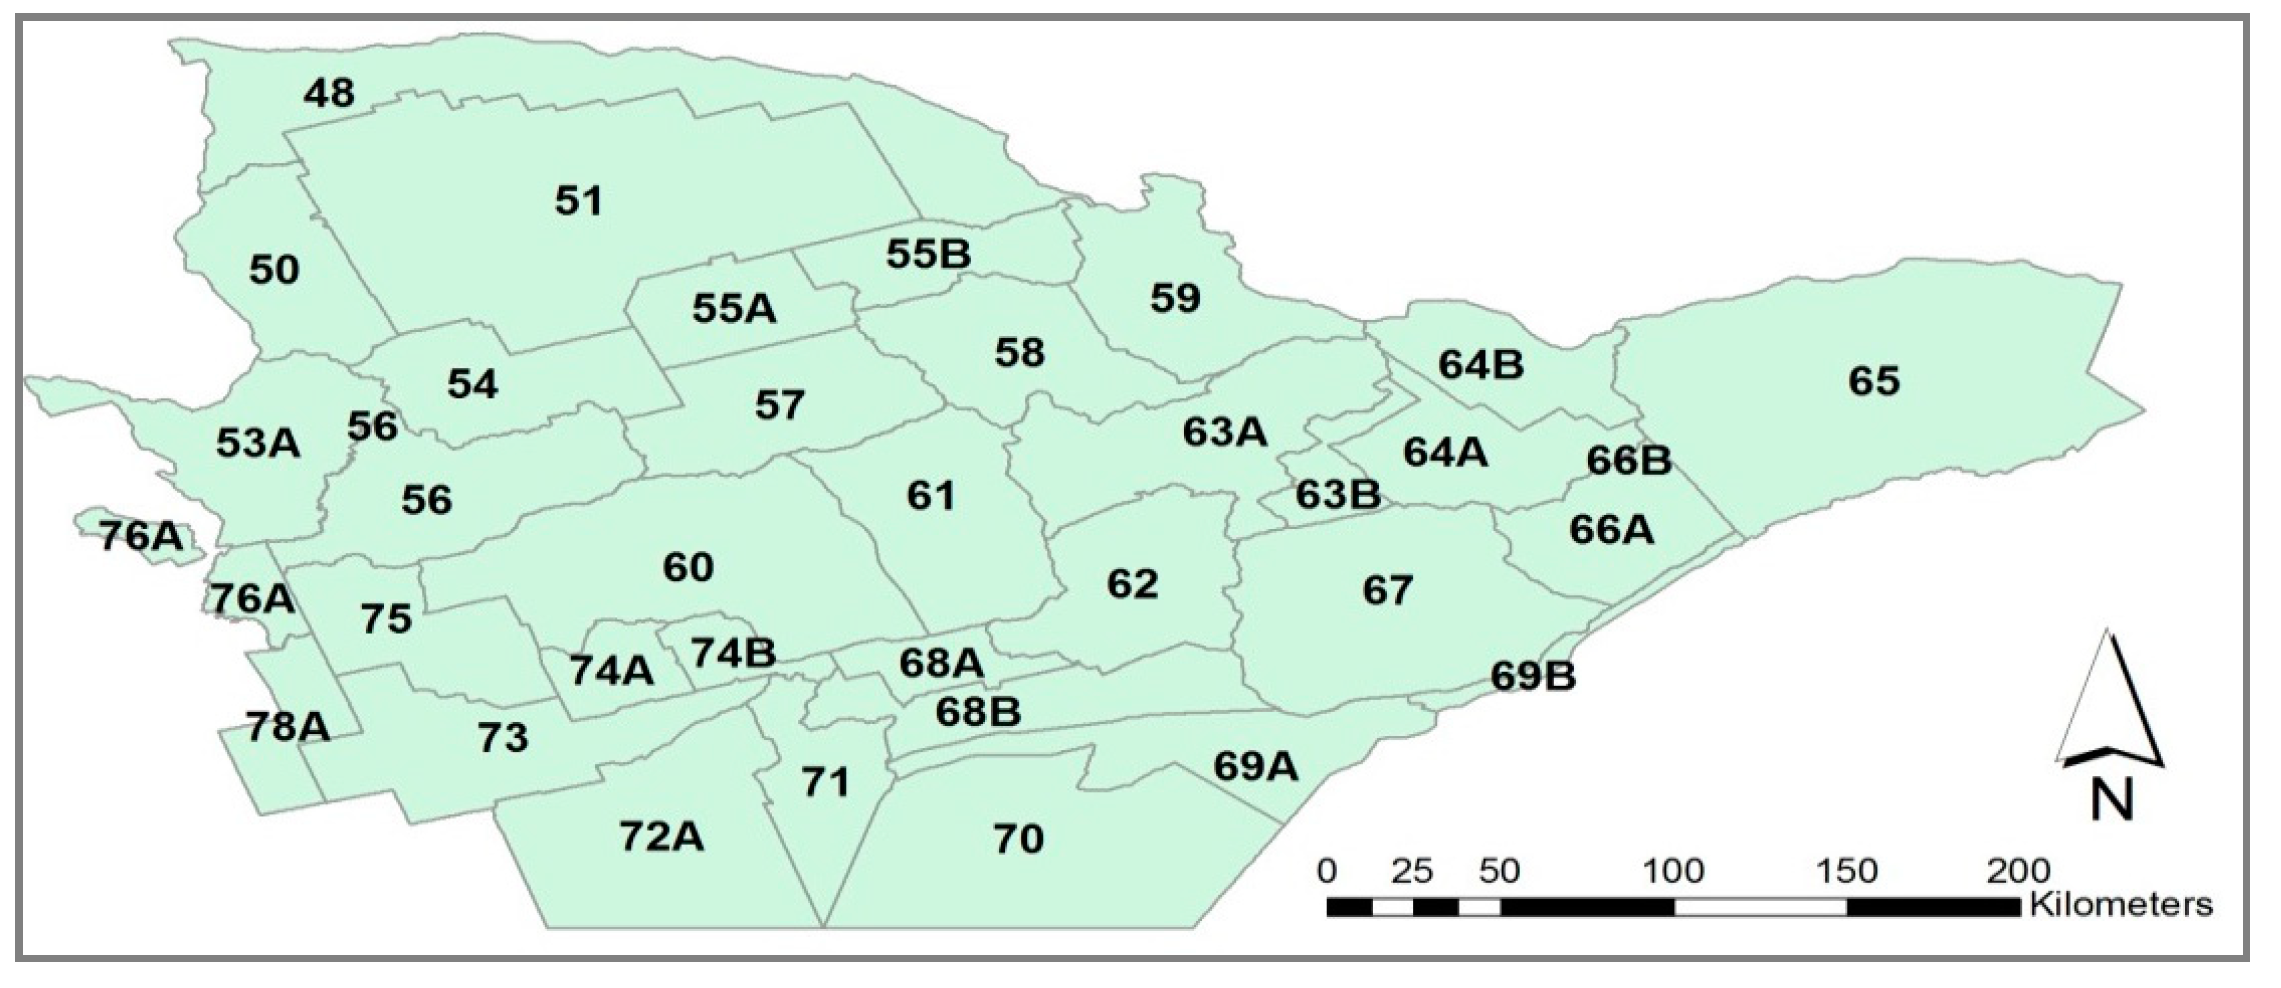
2.2.2. Deer Harvest Data

Deer harvest data for 2008 to 2011 were obtained from the Ontario Ministry of Natural Resources (MNR), which manages Ontario’s ecosystems and biodiversity. Deer harvest numbers were obtained from deer surveys received from hunters following the hunting season. The harvest data used for this study were projected based on raw numbers of deer killed from a sample of hunters to more accurately represent the number of deer harvested. The extrapolation rate used to determine the projected deer harvest number is equal to the total number of hunters in the WMU divided by the total number of valid replies received from the hunter. Under the current management system, the hunting administration prescribes the annual harvest for each hunting unit through a deer validation tag program. MNR’s harvest plan specifies the number of white-tailed deer to be harvested for each sex and outlines the specific time and dates during the year for hunting.

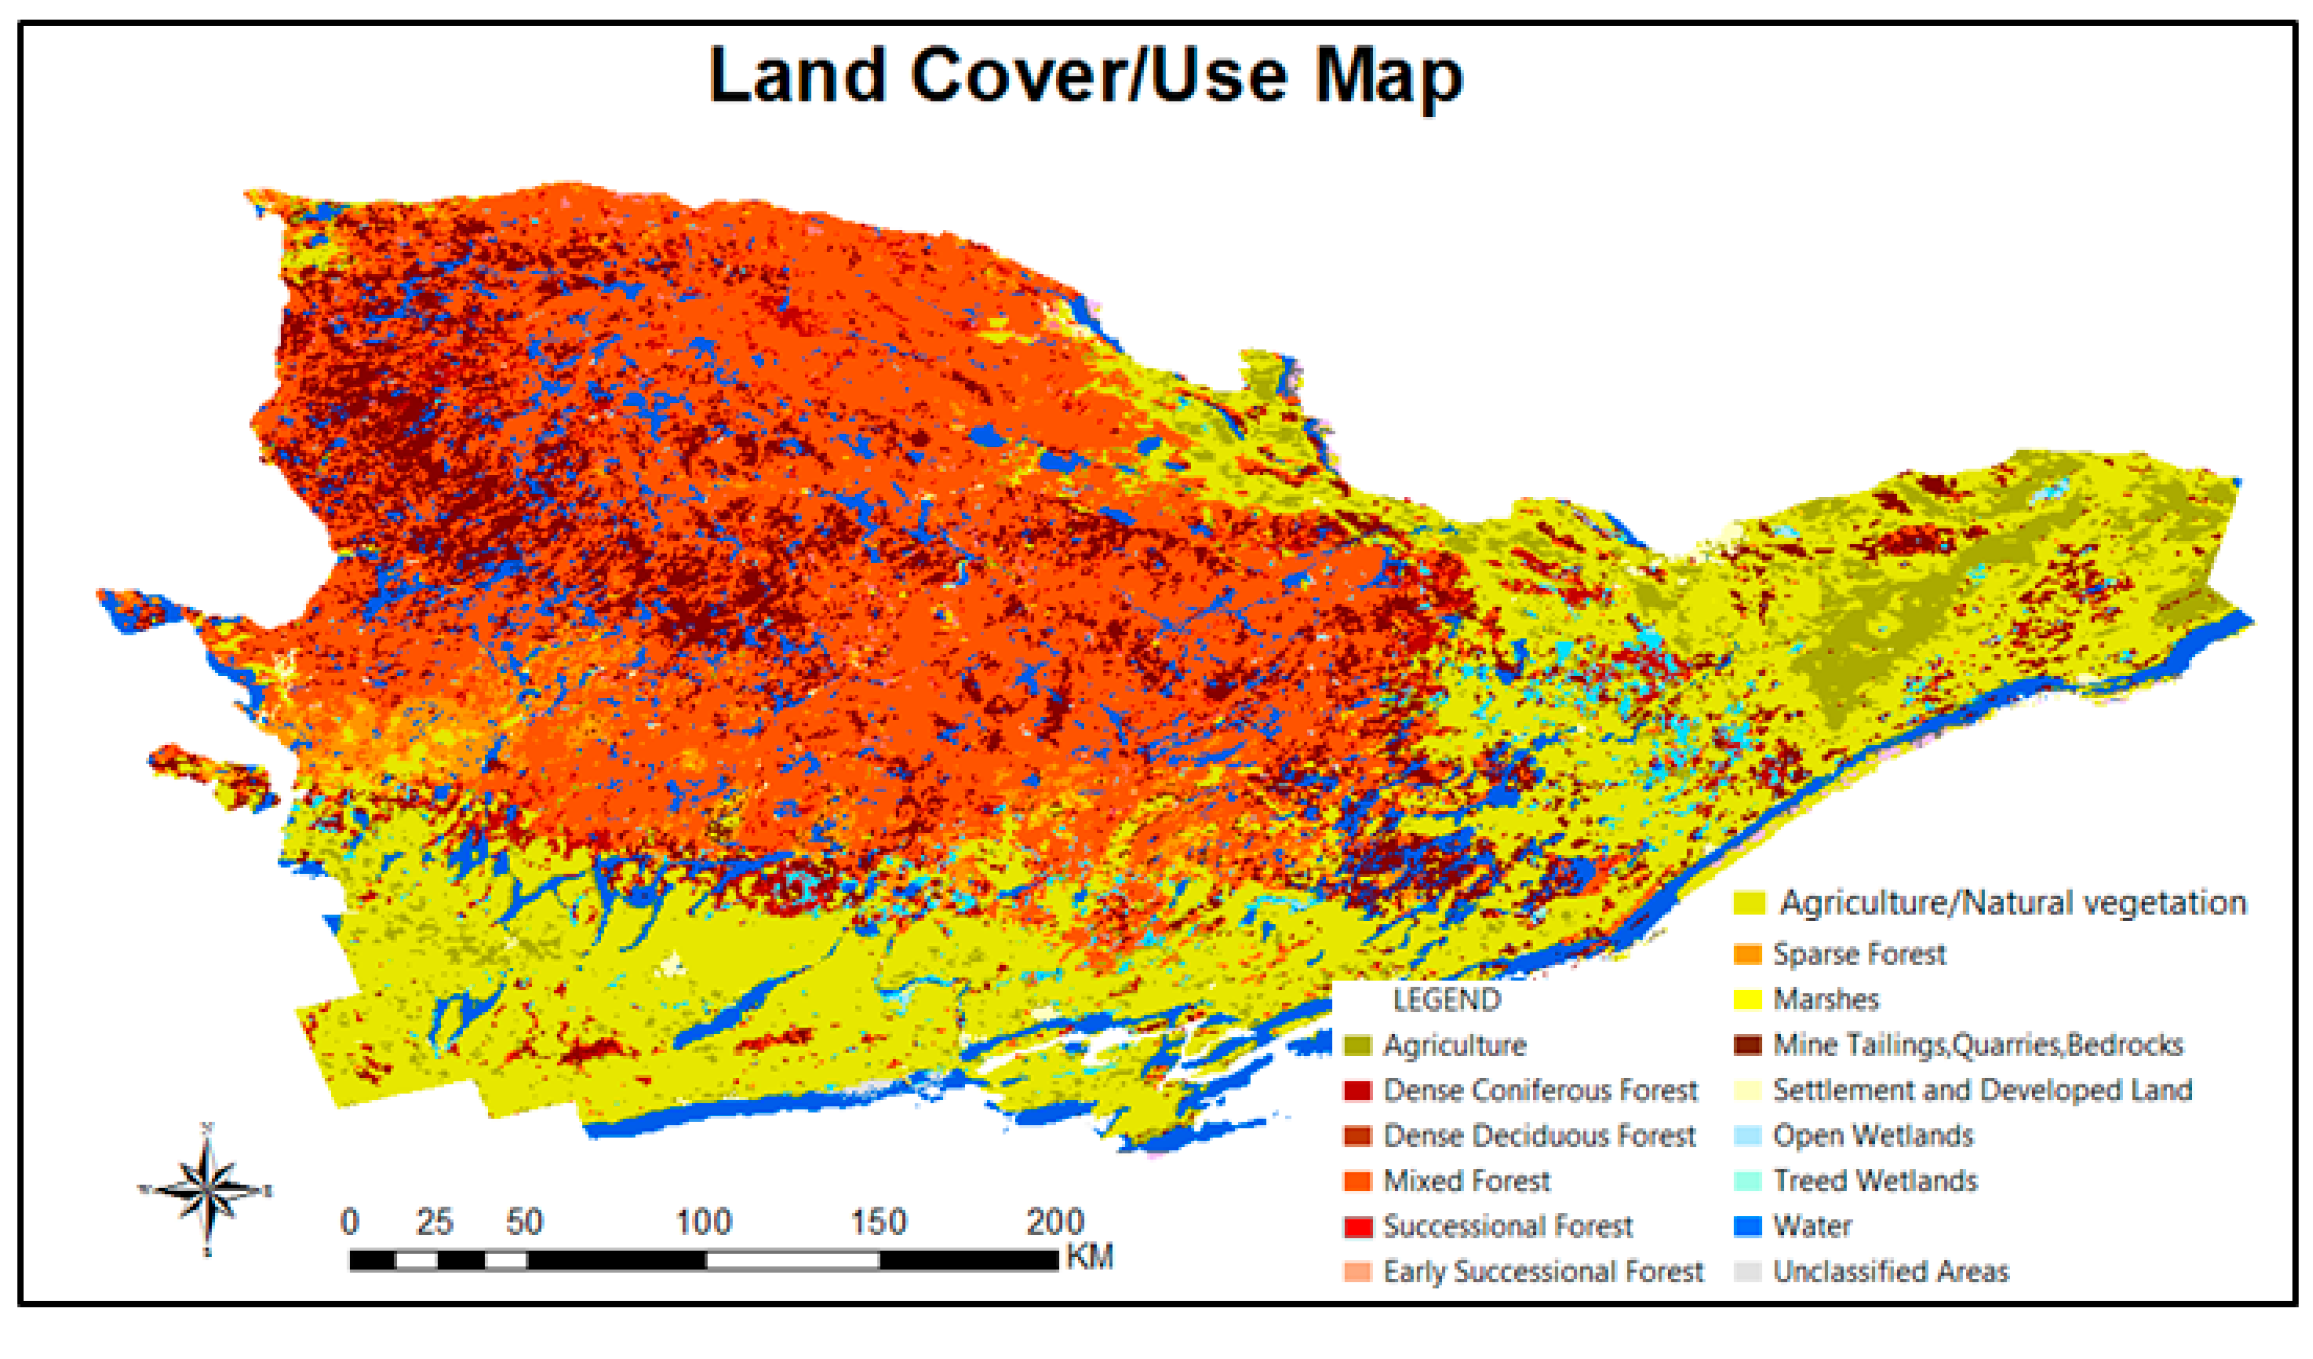
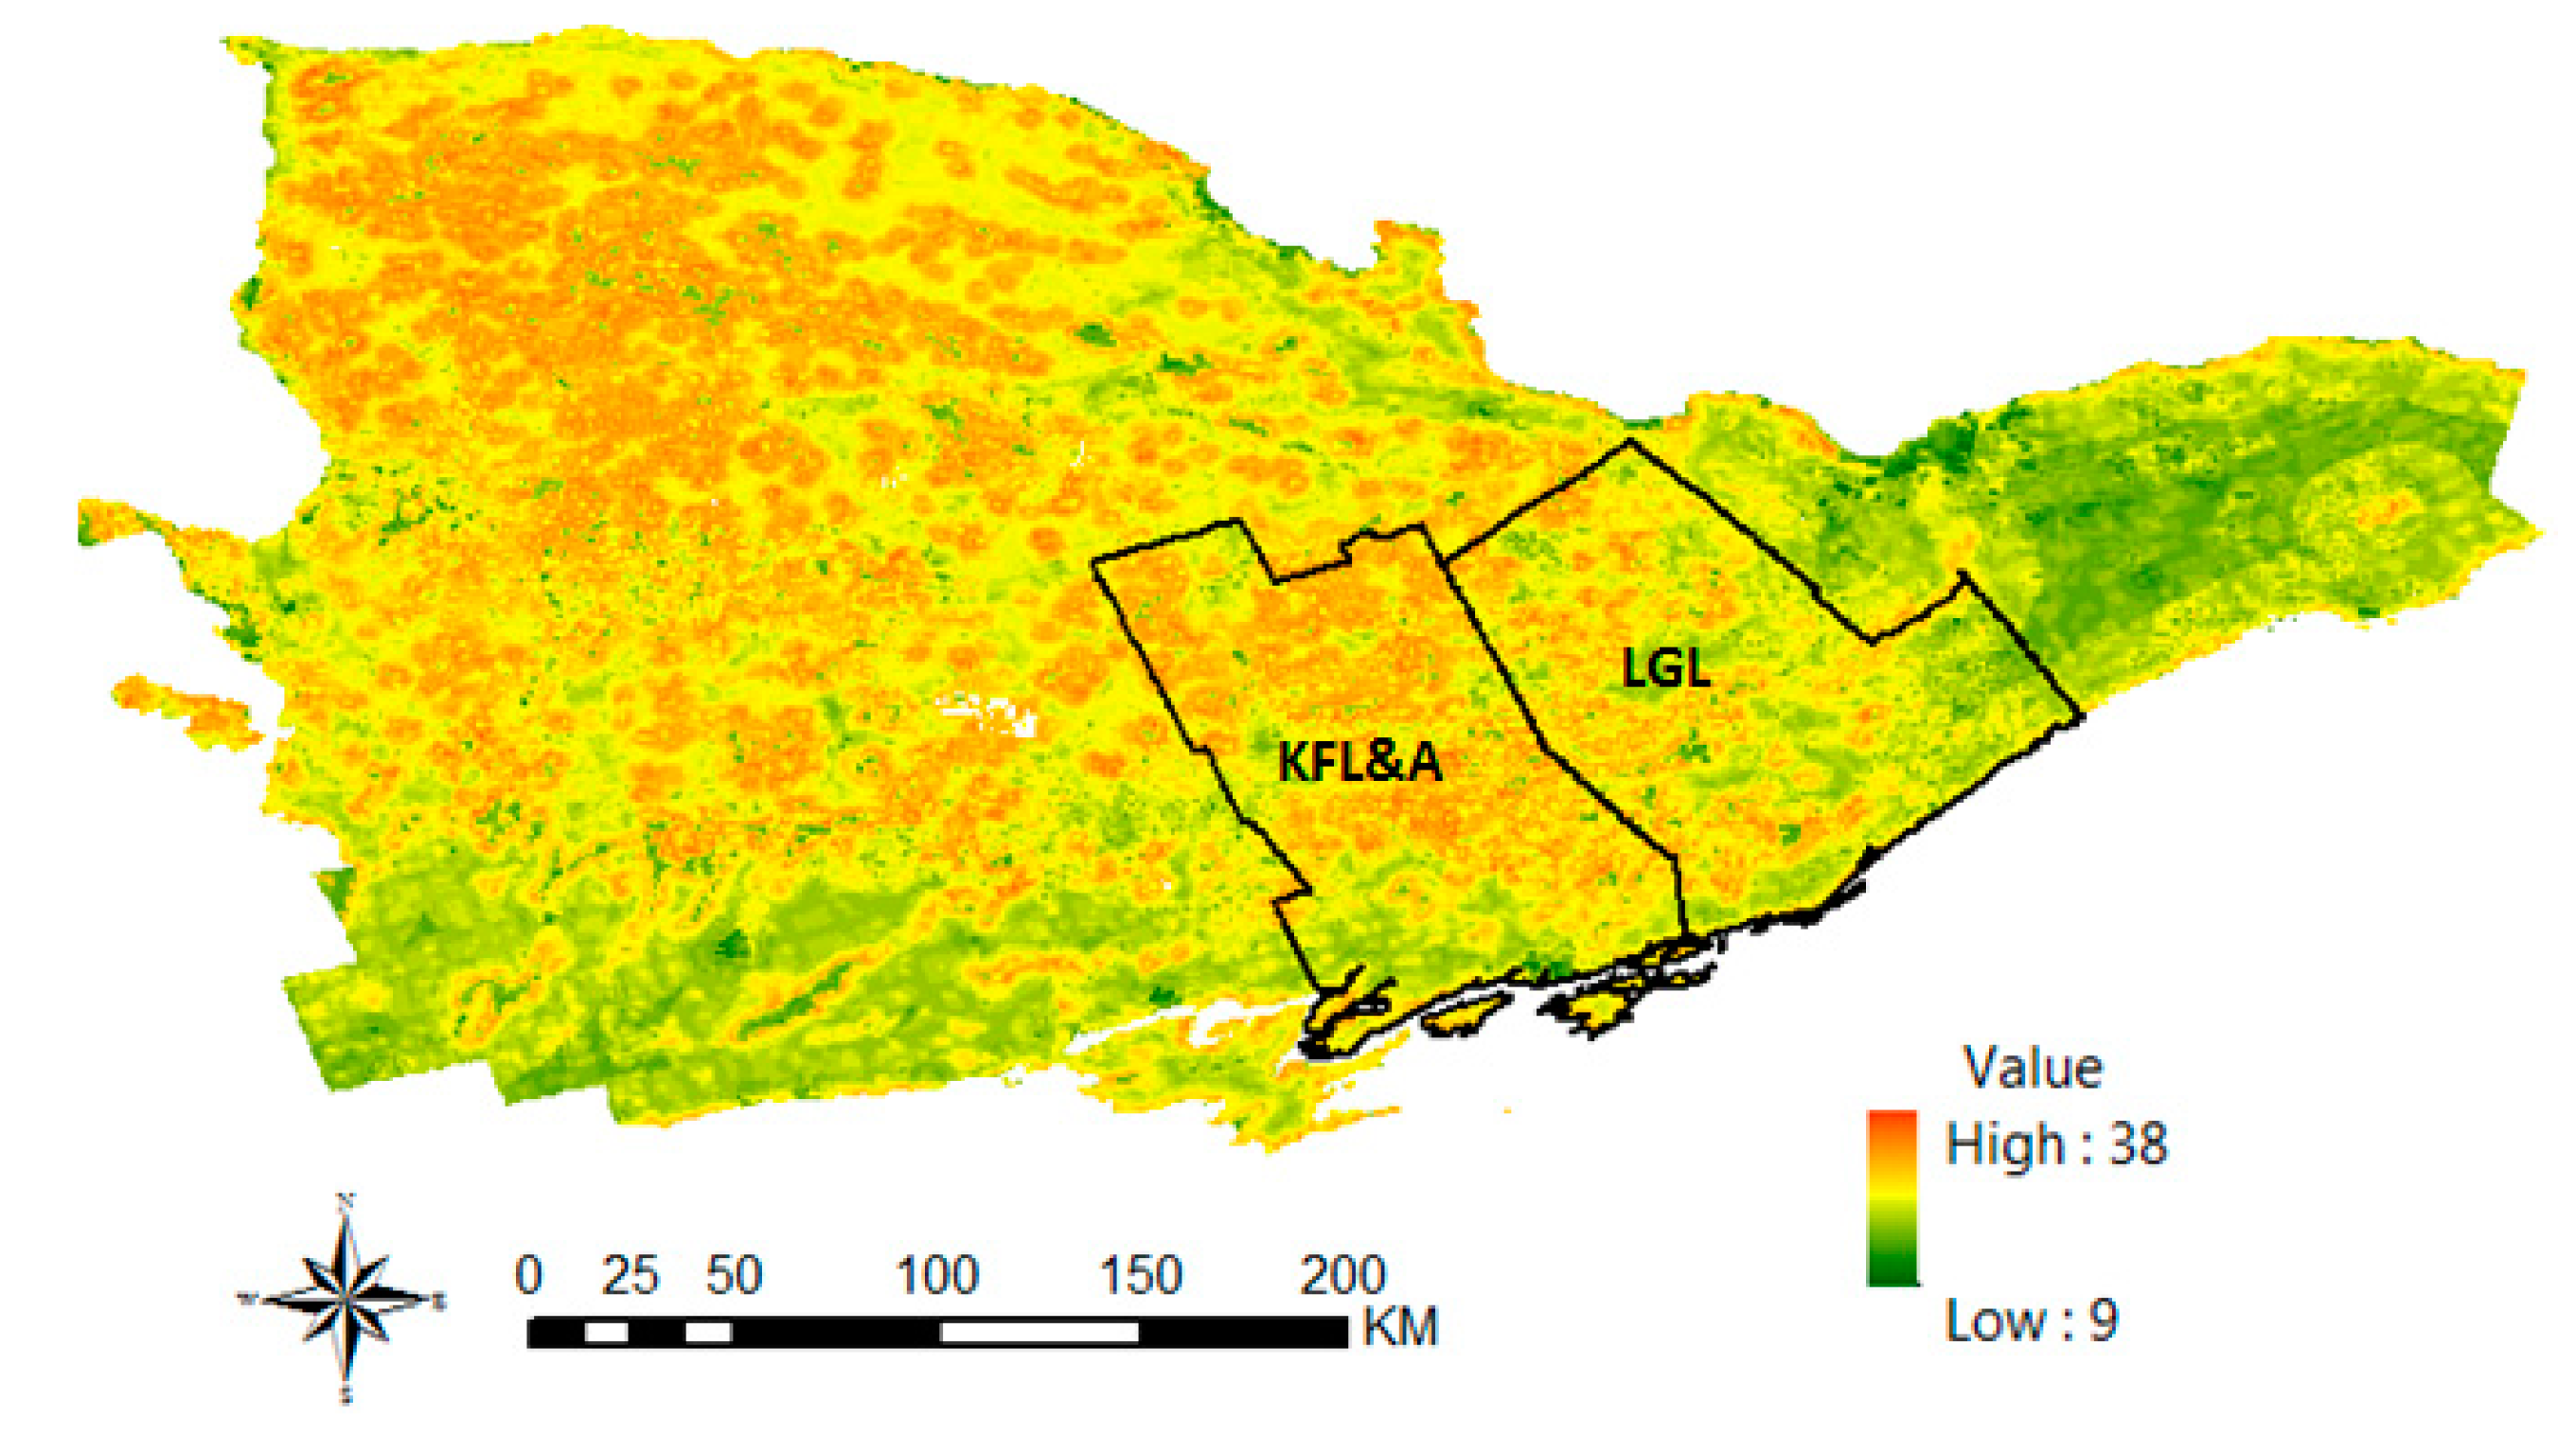
2.2.3. Deer Habitat Data

The data collected for the deer habitat suitability analysis ranged from GIS data files to remote sensing imagery. For deer habitat analysis, factors from two main categories are considered: (1) the need for food, shelter and water; and (2) the disturbances from human activities. The data on food, shelter and water were extracted from land cover, vegetation type, terrain slope and proximity to water bodies. The data on disturbances from human activities were extracted from the distance to the roads and urban areas, as well as landscape segmentation measured by land cover diversity. The regional land use/cover data generated by the Earth Observation for Sustainable Development (EOSD) project was downloaded from the GeoBase Portal [26] and mosaicked for the study area. This EOSD data was generated by classifying the multispectral Landsat 5 and 7 TM ortho-images acquired from 1999 to 2001 with 30-m spatial resolution. Based on a recent change detection analysis, the land use/cover in the study area is quite stable, with a change of less than 5% within the study area from 2001 to 2011. Therefore, we updated the land use/cover layer from the EOSD data in the detected change area. The final land use/cover map used for this study is shown in Figure 3. It can be seen that the main land use types are forest and agriculture, which use about 60% and 39% of the study area, respectively. The 2011 MODIS land cover classification data were also downloaded from NASA’s Earth Observation System, and the Data and Information System was used as an index for food source variables, due to its information on vegetation types. The digital elevation model (DEM) used for the slope variable was obtained from the Government of Canada’s Centre for Topographic Information. Obtained in raster format, the DEM has a spatial resolution of a minimum of 3 arc seconds to a maximum of 12 arc seconds. GIS data files collected for the urban areas, water regions and road network environmental variables were obtained from Statistics Canada based on the year 2011 in vector digital data format. The 2012 Ontario road network was acquired from DMTI Spatial Inc. in vector digital data format and was used for the distance to major roads and secondary road habitat variables.

2.3. Procedures

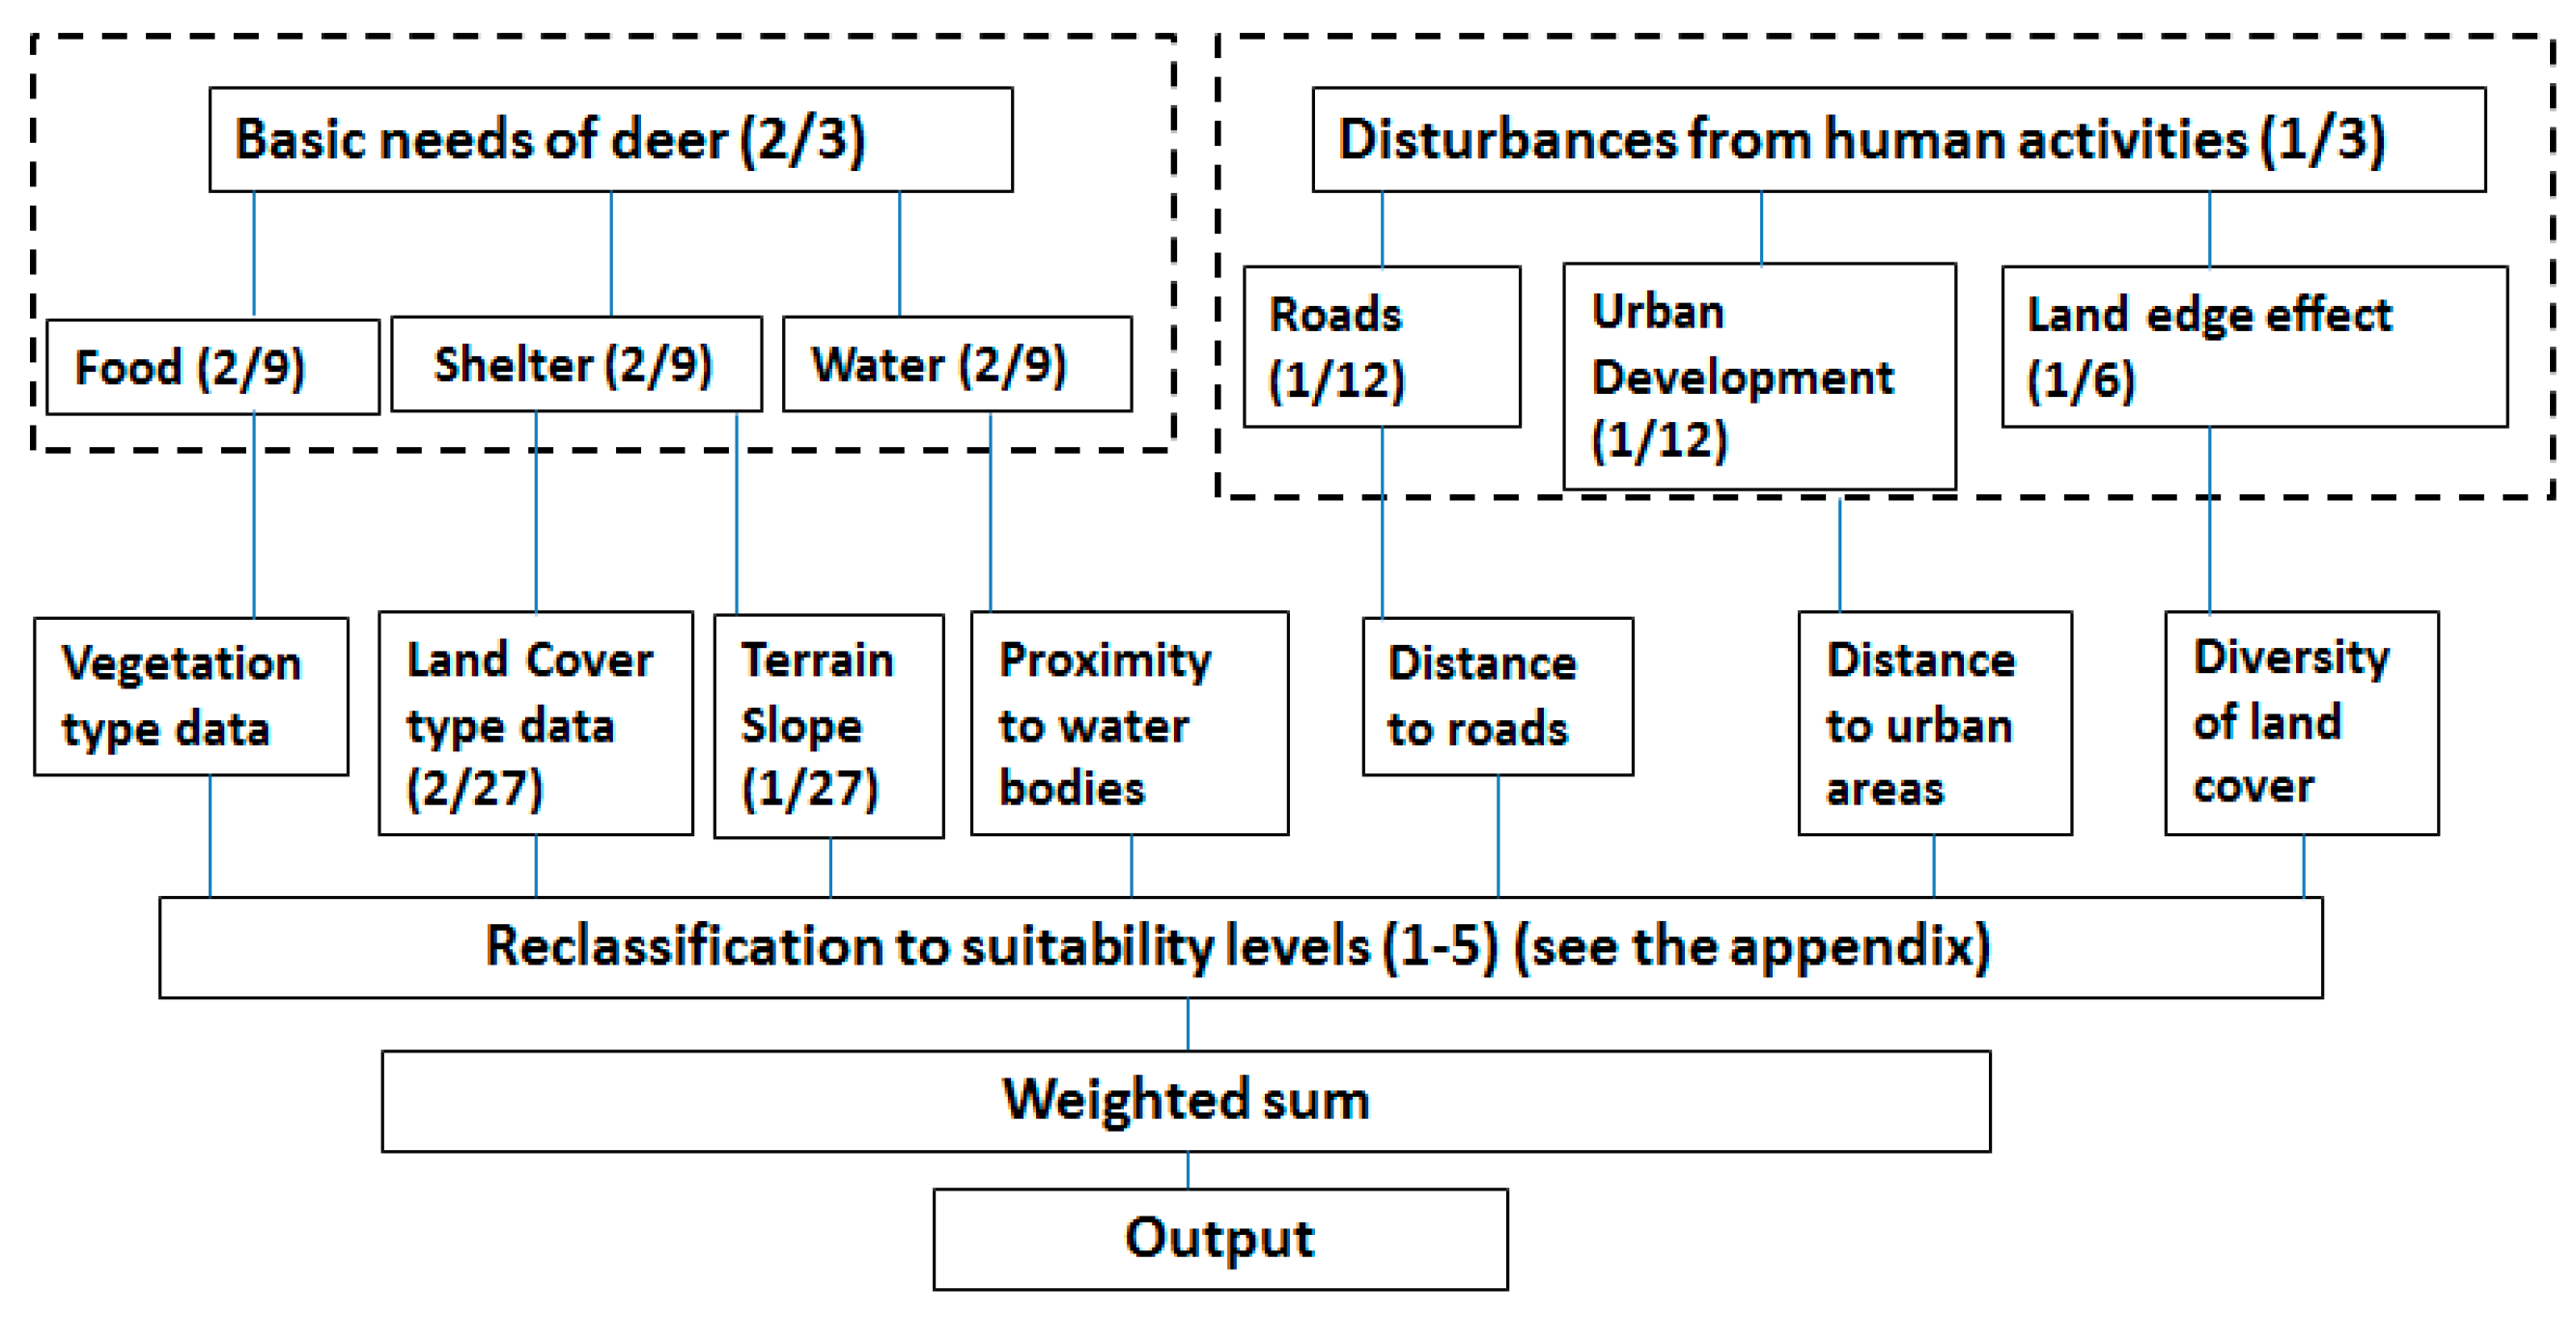
2.3.1. Multi-Criterial Decision Making Model for Deer Habitat

Seven habitat variables generated from the data listed in Section 2.2.3 were imported as individual layers into ArcMap and converted into a raster dataset. Multi-criteria decision making (MCDM) was used to reclassify and assign numeric values to each of the eight factors or criteria, and a weighted sum analysis was applied to produce the final habitat suitability maps. Figure 4 illustrates the variables and steps used in MCDM.
Figure 3. The land use/cover map of this study generated from 30-m TM imagery.
Ijgi 04 00105 g003
Figure 4. The factors, variables and processing steps used in multi-criteria decision making (MCDM) deer habitat suitability analysis (the numbers in () behind the factors are the weights assigned based on the rank sum method).
Ijgi 04 00105 g004
A classification scheme for each of the following 7 variables was developed (see the Appendix). The data within each criterion’s layer was then reclassified by assigning a numeric value within the range of 1 to 5 based on whether it would be favorable or unfavorable for white-tailed deer habitat. A reclass value of 5 represents conditions most suitable, while the lower end of the scale, with a value of 1, represents the least suitable conditions for deer habitat.
The white-tailed deer is a herbivore species that consumes a variety of grasses and plants. Studies have shown that the white-tailed deer generally confine themselves to woody riparian forest vegetation and shrub cover for foraging during the day time [27]. Examples of some of the vegetation species include shrubs, herbs, grass, fruits and fungi. The main diets are dominated by grasses in spring, flowering herbs in early summer, leaves of woody plants in late summer, acorns and other fruit in fall and evergreen woody shrubs and other woody twigs/buds in winter. Agricultural crops are also commonly consumed. As a result, these specific land cover types or “preferred feeding sites” were then assigned relatively high “new values” in our food source reclassification scheme. For instance, grasses/crops and shrubs were assigned “new values” of 5, whereas forested areas (e.g., evergreen and deciduous) were assigned lower values.
With respect to the shelter need, research studies suggest that the white-tailed deer tend to thrive in young forests and often benefit from recent disturbances in the forest, such as wildfire or forestry operations [28]. This species prefers conifer habitats, as these areas provide shelter during the winter when snow deepens and temperatures drop. Tree stands provide cover from falling snow and help moderate extreme temperatures [28]. Studies have also suggested that conifer canopies and flat bottomlands can benefit the deer with more radiation flux, little or no wind and slightly warmer temperatures, even with cold air drainage [29]. Therefore, the small slope terrain receives higher suitability values than the terrain with deep slopes.
Deer need to get access to water every day within their home range. The deer home range is small, although they can travel a long distance. Previous studies in New Jersey showed that 68% of deer had a home range of one mile or less, 27% ranged from 1 to 8 miles and only 5% of deer would move over 10 miles [30]. From a collar tracking study, it was found that deer usually remain within 1 to 1.5 miles of permanent water, and the maximum distance from a permanent water source was 2.4 miles [31]. Based on the distance to the permanent water bodies, distances beyond 8 miles were assigned a low score of 1, and distances within 1 mile were assigned a score of 5.
Human activities impact deer movement and habitat [27,31]. Deer reactions to human disturbances (such as sighting and observing humans) vary from a short run to a movement of 2 to 3.5 miles away. The human hunting activities have an obvious impact on deer movements and activities [31]. Therefore, the distance to the roads and urban areas is used to represent the potential human sighting and hunting impact on deer habitat. Distances farther away from roads and urban areas are considered more preferable to closer proximity. As a result, a suitability score of 5 would be assigned to all distances beyond a 5-km (3.1 miles) (average one-hour walking distance by humans (http://www.princeton.edu/~achaney/tmve/wiki100k/docs/Walking.html)) radius from roads and urban areas. In contrast, distances within a 0- to 1-km radius from major roads were assigned a low value score of 1. This is because closer proximity to roads and urban areas represents an increased probability of mortality and human anthropogenic disturbance.
Landscape edges caused by human activities, such as farming, timber cutting, road and urban construction, change the structure and the connectivity of vegetation patches, thus they can impact the deer habitat. White-tailed deer usually prefer habitats with more than one vegetation type and move between open canopy vegetation and forests [27,31]. Deer usually benefit from the “edge effect”, since their main diet, grass and shrubs, are on the edges of forested areas [32]. An open edge also allows deer to move more easily. An area containing a diversity of plants is usually a better deer habitat than ones with a single vegetation type [33]. The edge length and diversity of land cover were calculated for each cell using a neighborhood of 1 mile (the home range for 68% of deer). The higher the diversity, the better suitability value that is assigned.
After all variables are recoded into a suitability value, a ranking method was used to assign a weighting scheme and to combine all variables together. With the rank comparison weighting, the importance of each factor with regards to one another is considered [34]. The relative importance of pairs of factors in two categories (deer needs and human disturbances) is assessed and ranked first. It is obvious that the food, shelter and water needs are much more important than human disturbances. Based on the rank sum method, the weight assigned to the factors of food, shelter and water is 2/3, and the factors of human disturbances take a total weight of 1/3. For human disturbance factors, studies have suggested that deer prefer habitats with more edges with a diversity of vegetation [32], so the edge/diversity variable was assigned a half weight of the total weight of the human disturbances. The distance to roads and urban areas is related to human sighting/hunting, and each takes half of the remaining weight for the human disturbance factors. For the factors in the category of basic needs of the deer, the needs of food, shelter and water were treated as equally important, due to the challenge of ranking them. For two variables under the shelter need, it is obvious that terrain slope is less important compared with land cover [31]. Therefore, the land cover type takes 2/3 of the weight assigned to shelter factors.
Since different weighting schemes would impact the final results of the suitability analysis, two other weight methods were also tested. One is equal weighting, in which all factors are ranked as equally important. The other one is weight assessment through the expected value method. Instead of assigning a 2/3 weight to the factors of deer needs, a 0.75 weight was assigned. The final weights for the factors from three weighting schemes are listed in Table 1 below.
Table 1. Weightings assigned to each variable in three tested weighting schemes.
VariablesEqual WeightsWeights from Expected Value MethodWeights from Rank Sum Method
Vegetation (food)1/71/42/9
Land cover (shelter)1/73/162/27
Terrain slope (shelter)1/71/161/27
Proximity to water 1/71/42/9
Distance to roads1/71/161/12
Distance to urban areas1/71/161/12
Diversity of land cover1/71/81/6
The suitability values from three different weighting schemes are significantly correlated. The correlation coefficient between the equal weights and the weighting from rank sum methods is 0.91, while the correlation coefficient between the results from weights obtained by the expected value method and rank sum method is 0.96. Therefore, only the results from the rank sum method are used in the following.

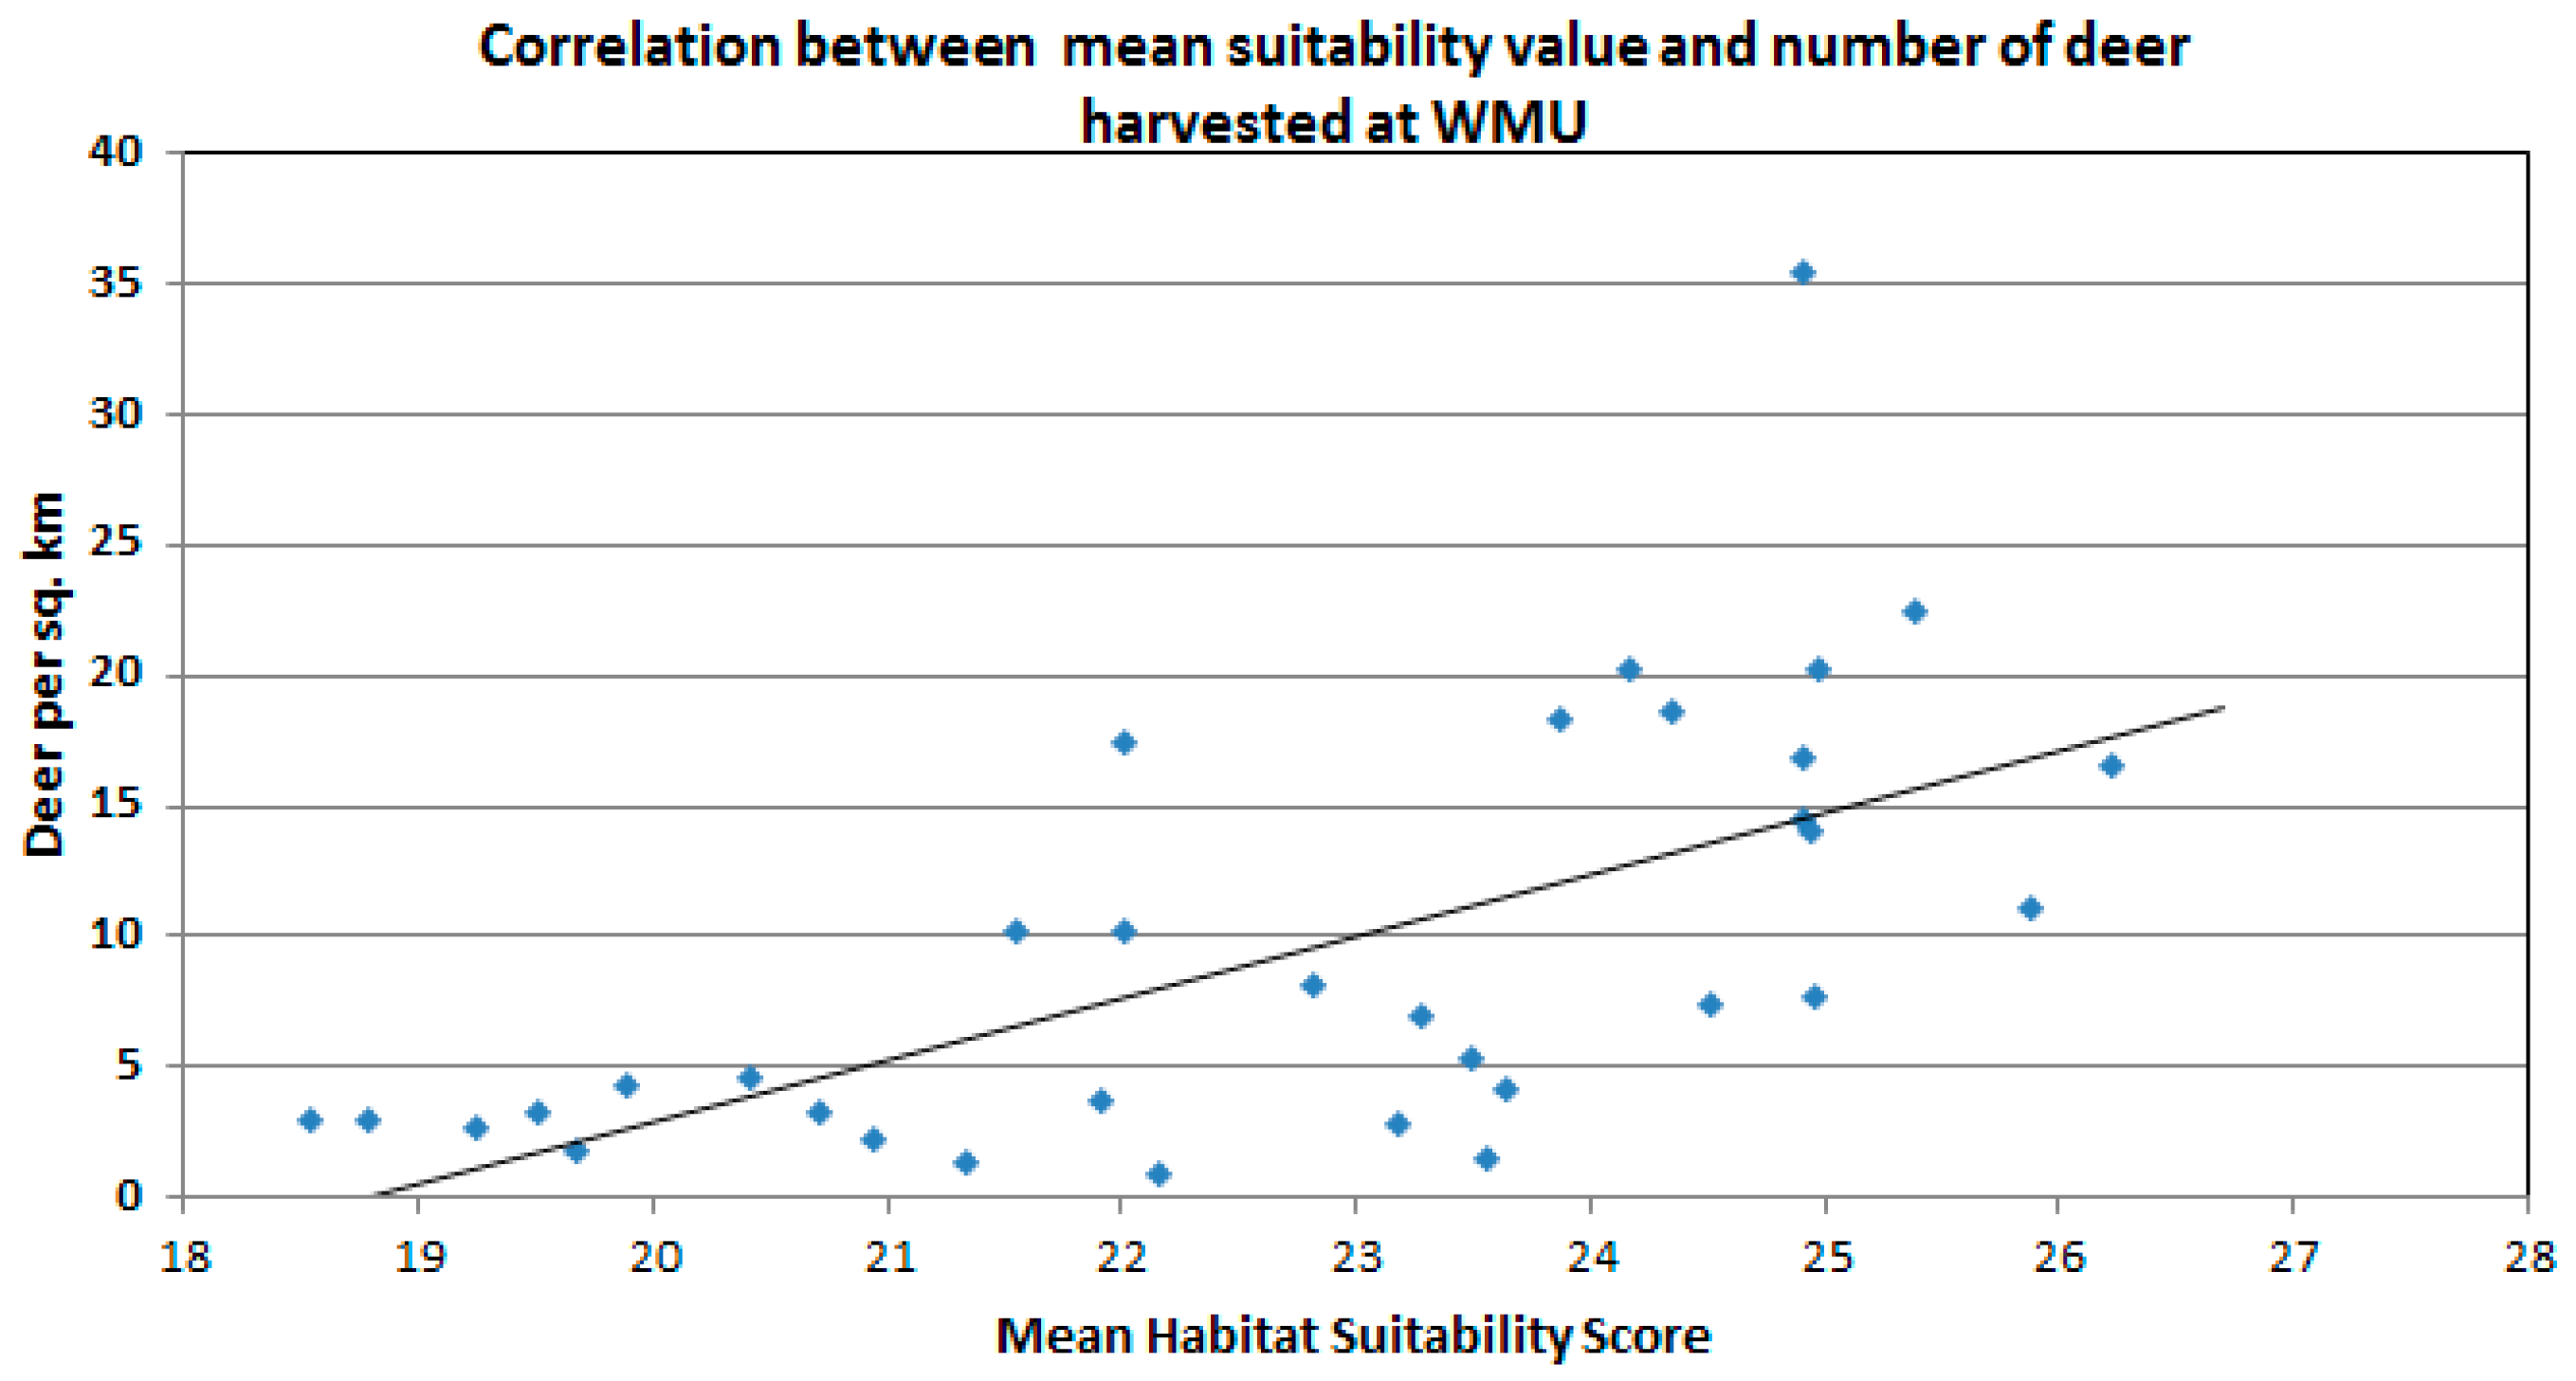
2.3.2. Deer Habitat Suitability and Deer Harvest Data Analysis

Once the deer habitat suitability map was developed, the results were compared with deer harvest data to evaluate whether it is appropriate to use the suitability values from the habitat model to represent the deer abundance for each WMU. By using the zonal statistics tool in ArcMap, a mean suitability value for each of the 35 WMU within the study area was generated. The zonal statistic tool calculates a statistic for each zone, based on the raster values from the habitat suitability map. In this case, the statistic is the average suitability value, and the zones are the WMUs. WMU 55 was eliminated from this analysis, as this WMU represents the Algonquin Provincial Park, an area where hunting is not permitted in Ontario.
Since the number of deer harvested is dependent on the accessibility of hunters within each WMU, the total deer harvest numbers for each WMU were adjusted based on road accessibility. In this study, the total length of major roads was used as the measurement of hunter accessibility. For example, WMU 65 (Ottawa region) had a projected deer harvest of 23,556 and a road length of 2862 km, while WMU 69B had a harvest of 477 and a road length of 171 km. By adjusting the deer harvest data, any biases associated with WMU size or the population of hunters would be eliminated. The correlation between the mean suitability value and the accessibility-adjusted number of deer was analyzed.

2.3.3. Deer Habitat Suitability and Tick Data Analysis

In order to test whether the tick abundance is related to the white deer abundance, a correlation analysis was expected to be conducted to analyze the relationship between the tick and the white-tailed deer abundance. However, we do not have direct information on deer and tick abundance in Ontario. Since the result from deer habitat modeling and adjusted deer harvest data suggests that there is a strong positive correlation between our deer habitat suitability model and the deer harvest data, the suitability values from the deer habitat model were used to predict the preferred location and potential density of white-tailed deer. The zonal statistics tool in ArcMap was used to generate a mean habitat suitability value for each dissemination area, the geographic level at which our ticks were analyzed and compared with the number of tick acquisitions and ticks positive for B. burgdorferi.
Figure 5. Distribution of Tick Acquisition by year from 2006 to 2012.
Ijgi 04 00105 g005

3. Results and Discussions

Figure 5 maps the distribution of the total tick number and the total numbers of positive tick acquisitions each year. As shown in the time series maps, it is clear that there has been an increase from 2006 with an expansion of tick acquisitions and positive ticks carrying the B. burgdorferi bacterium northwards from the U.S.-Canadian border. In 2006, the highest number of tick acquisitions for the year at a DA was two, increasing to 44 per year by 2012. A very similar trend was also identified in the number of positive tick acquisitions across the study area. The total number of tick acquisitions positive for B. burgdorferi per year almost quadrupled between 2010 and 2011 (Figure 5). From these results, we can infer that there has been an overall increase in the spatial distribution of the tick population in eastern Ontario.
In 2010, a passive surveillance study on Lyme disease risk in Quebec suggested that the number of ticks submited has increased each year from 2004 onward, with much of the increase submitted from regions near the U.S. border [35,36]. This is consistent with our findings in that the increase in the number of submitted ticks has occurred geographically coincident to the U.S.-Canadian border and spreading northwards over time in eastern Ontario.
Figure 6 shows the results of the habitat suitability from the weighted scheme, while Table 2 lists the results of the correlation coefficient among deer habitat suitability, adjusted deer harvest data, the number of tick submissions and ticks positive for B. burgdorferi. The deer habitat suitability map suggested that locations associated with high suitability scores were focused towards the central and northern regions of the study area. In contrast, the suitability map revealed that regions with low suitability scores are situated towards the southern border of the study area, where human activity and anthropogenic impacts are the highest.
Figure 6. Map of habitat suitability analysis results from the rank sum weighting method.
Ijgi 04 00105 g006
Table 2. Correlation coefficients between variables tested in this study. WMU, wildlife management unit.
VariablesCorrelation Coefficient *
Mean habitat suitability and adjusted deer harvest for all WMUs0.645
Mean habitat suitability and the number of positive ticks for all DAs in the KFL&A and LGL Health Units0.609
The number of tick acquisition and the number of positive ticks for all Das in KFL&A and LGL Health Units0.892
* Pearson correlation coefficient. All coefficients are over the 0.05 significance level.
Figure 7 suggests that there is a strong positive correlation between our deer habitat suitability model and the deer harvest data, which confirms that in the absence of deer density data, the deer habitat suitability values can be used to represent the deer abundance.
Figure 7. Correlation between the mean habitat suitability value and adjusted number of deer harvested in the WMU. The p-value is less than 0.05.
Ijgi 04 00105 g007
The positive correlation between the deer habitat suitability values and the positive tick number in our study demonstrates that as the primary host of the black-legged tick, the habitat and environmental conditions of the white-tailed deer may also impact the abundance of the tick. In many regions of eastern North America, research has been shown that white-tailed deer population density is positively correlated with black-legged tick abundance [19]. The results from this study seem consistent with this finding. As demonstrated by previous studies in the U.S., the high tick abundance usually corresponds to the high human Lyme cases [37].
With the growth in human population over the last decade, urbanization may have impacted the change of land use within the eastern Ontario region. It has been suggested that the transition of wooded forested regions into residential neighbourhoods may lead to greater interactions between humans and deer [35]. As deer lose their habitat to urban development, there may be a higher risk for endemic ticks to come in contact with humans and transfer the pathogen to newly-established neighbourhoods.
It is important to consider limitations and biases, as they play roles in the results of our study. First, the tick acquisition locations collected incorporated only the areas that the general public is able to access; we do not have data of endemic ticks located in isolated or inaccessible areas. For instance, regions with limited access to humans, such as islands or highly elevated areas, may also be areas that contain positive ticks. Due to the nature of this study, only ticks acquired by humans are included in the analysis. Therefore, our findings may not provide an accurate representation of all locations with endemic tick populations within eastern Ontario.
Our sources of data were derived from only two public health units. Any tick acquisitions submitted to other public health units with ticks acquired within our study area were not included in our analysis. In addition, our tick data do not include ticks that have fed on animals (e.g., dogs and cats), which may contribute to a large proportion of positive ticks. Since our data do not incorporate data on ticks submitted to local hospitals, physicians and veterinarian clinic, our results may not provide a true representation of the severity and extent of the endemic tick population in eastern Ontario. It should also be noticed that not all data used to extract different factors are in the same period that tick data were collected. There is a time lag among the different data used in this study. The tick data were collected between 2006 and 2012, while the deer harvest data were from 2008 to 2011. The time inconsistency may cause a bias in the result. However, considering the land use/cover stability and slow population changes in the study area, the bias caused by time lag may be very small.
Our deer harvest data were analyzed using the WMU scale (the finest scale available from the Ontario Ministry of Natural Resources). However, this may be considered a fairly coarse scale relative to our tick data analysis, which was analyzed at the DA level. Since deer hunting is controlled by the number of tags or permits issued to hunters in Ontario, the change in the number of deer harvested over the years may not truly and accurately reflect deer population change. Rather, the number of deer harvested at each WMU may be associated with the hunting and deer control objectives of the Ministry of Natural Resources. For instance, if the objective of the government were to stabilize deer populations at each WMU ever year, deer harvest numbers would not show a large fluctuation or variation, as a fixed number of tags would be allocated per year. As a result, our deer harvest data may not allow us to accurately estimate deer density within each WMU. Nevertheless, our deer harvest data can be useful in providing some insight into relative deer population numbers.
Previous studies have shown that increasing temperatures as a result of climate change may be one of the most significant factors contributing to the northward dispersal of Lyme endemic areas in the U.S. and Canada [19,37,38]. Researchers have suggested that climate impacts tick survival rates, the densities of tick populations and the threshold number of immigrating ticks required to establish a new population [20,21,38]. Beyond certain ranges of temperature, humidity and rainfall thresholds, ticks will not be able to survive, as these conditions will kill the tick. With the warming of temperatures over recent years, tick populations may spread from the U.S. into Ontario, where temperatures have been historically lower. Optimal survival conditions may allow ticks to become more robust in migrating greater distances in shorter time periods, while arid and hot temperatures may potentially hinder tick activity. The temperature preferences of the deer populations may also play a role in the dispersal of ticks. The role of climate change should be studied in more detail for this region in the future.

4. Conclusions

In this paper, the spatial relation between the black-legged Lyme tick and its primary host, the white-tailed deer, in eastern Ontario was examined. By developing a habitat suitability model through a Geographic Information System (GIS)-based multi-criteria decision making (MCDM) analysis, a deer habitat suitability map was generated, and the results were compared with deer harvest data. Tick submission data collected from two public health units between 2006 and 2012 were used to explore the relationship between endemic ticks and deer habitat suitability in eastern Ontario. A northwards expansion of ticks into eastern Ontario was observed.
While the dynamic relationship between the deer and the tick is not entirely clear, a deer habitat suitability model may provide some insight into the spread and distribution of Lyme disease in eastern Ontario. Since the deer is the primary host of the disease vector, a spatial analysis of the deer is crucial to understanding the spatial movement of the tick and the disease. The results suggest that a positive relationship exists between deer harvest data and deer habitat suitability. It was also found that the high tick population corresponds with the high suitability. The results suggest that locations associated with high suitability scores are focused towards the central and northern regions of the study area. In contrast, the suitability map revealed that regions with low suitability scores are situated towards the southern border of the study area, where human activity and anthropogenic impacts are highest. Nevertheless, the results suggest that a positive relationship could exist between our deer suitability map and endemic ticks in eastern Ontario.
These results are useful for developing management strategies that aim at preventing Lyme from becoming a threat to public health in Canada. A stronger understanding of deer habitat in relation to the distribution of black-legged ticks at a local scale can better equip health units with the prevention and occurrence of Lyme disease infection in eastern Ontario. As demonstrated by previous studies in the U.S., a high tick abundance usually corresponds to high human Lyme cases [33]. The potential to locate high and low risk areas within neighbourhoods may allow public health professionals to proactively formulate Lyme prevention methods, generate infectious disease awareness and develop strategies aimed exclusively at their respective local communities. The higher-scale geographic information, such as at the dissemination area level, provided for public health allows for greater precision in locating endemic tick areas for residents. As a result, public health units now have the ability and confidence to provide residents with site-specific information of black-legged tick risk areas, such as particular parks or neighbourhood areas where tick abundance had previously been noted. Since previous studies have focused on analyzing Lyme disease at a provincial and national level, this study demonstrates the ability for local public health units to formulate site-specific awareness and prevention strategies.
It should be noted that this study did not consider the impact of climate factors and forest management on the deer habitat change and tick expansion. Further studies are required to investigate how tick survival, behaviour and seasonal activity may change with past and projected climate change. A strong understanding of deer population dynamics and habitat suitability is essential to realizing the spatial trends and patterns of black-legged ticks and Lyme disease. The effect (or relationship) of land use edges and landscape fragmentation of the deer habitats and changes in both deer and tick populations should also be further studied in the future. As the number of endemic tick populations continues to expand and colonize new regions in Ontario, Lyme will become an emergent challenge for public health.

Acknowledgements

This research was initially supported by a National Science and Engineering Research Council (NSERC) Undergraduate Student Research Award and a grant from the Geomatics for Information Decision (GEOIDE), National Centre of Excellence, Canada. The authors would like to thank Michael Gatt, the wildlife biologist at Ontario Ministry of Natural Resources (MNR), for helping us access, organize and interpret the deer harvest data. We would also like to thank three anonymous reviewers for their constructive comments and suggestions, which have greatly helped to improve the quality of the paper.

Author Contributions

D. Chen designed the study and wrote detailed methodology on MCDM, as well as run the MCDM procedure and produced the final Figure 3, Figure 4, Figure 6 and Figure 7 and analysis. H. Wang conducted initial literature review and writing, as well as initial data and result analysis and generated maps in Figure 1, Figure 2, and Figure 5. D. P. Belanger, K. Moore, M. Peterson, and J. Cunningham collected original Lyme data from KFL & A and LGL. They also contributed to interpret the Lyme data and provided comments on result analysis.

Conflicts of Interest

The authors declare no conflict of interest.

Appendix

Table A1. The recoding schemes and weights used for different layers in the MCDM analysis.
Layers (Weights)Original ValuesRecoding Values *
Food sources (2/9)Water1
Barren or sparsely vegetated2
Build-up, wetland
Deciduous needleleaf forest3
Deciduous broadleaf forest
Evergreen broadleaf forest4
Evergreen needleleaf forest
Wood savannah
Crops, shrubs, grass, mixed vegetation5
Land cover shelter (2/27)Water1
Settlement and developed land2
Mine tailings, quarries, redrocks
Marshes, open wetlands
Treed wetlands3
Agriculture
Agriculture/natural vegetation
Early successional forest4
Successional forest
Sparse forest
Dense coniferous forest5
Dense deciduous forest
Mixed forest
Terrain slope (1/27)Water0
13.41°–20.89°1
8.44°–13.41°2
5.02°–8.44°3
2.36 °–5.02°4
0°–2.36°5
Proximity to water bodies (2/9)>8 miles1
2.4 to 8 miles2
1.5 to 2.4 miles3
1 to 1.5 miles4
0–1 miles5
Distance to roads (1/12)0–0.8 miles1
0.8 to 1.6 miles2
1.6 to 2.4 miles3
2.4 to 3.1 miles4
>3.1 miles5
Distance to urban areas (1/12)0–0.8 miles1
0.8 to 1.6 miles2
1.6 to 2.4 miles3
2.4 to 3.1 miles4
3.1 miles5
Diversity of land cover (1/6)11
22
33
44
>55
* all suitable values are recoded as 1 to 5, with 1 indicating not suitable at all and 5 as the most suitable.

References

  1. Ogden, N.H.; Maarouf, A.; Barker, I.K.; Poulin, M.B.; Lindsay, L.R.; Morshed, M.G.; O’Callaghan, C.J.; Ramay, F.; Waltner-Toews, D.; Charron, D.F. Climate change and the potential for range expansion of the lyme disease vector Ixodes scapularis in Canada. Int. J. Parasitol. 2005, 36, 63–70. [Google Scholar] [CrossRef] [PubMed]
  2. Public Health Agency of Canada. Lyme Disease Fact Sheet; Government of Canada: Ottawa, ON, Canada, 2012. [Google Scholar]
  3. Ogden, N.H.; Bigras-Poulin, M.; O’Callaghan, C.J.; Barker, I.K.; Lindsay, L.R.; Maarouf, A.; Smoyer-Tomic, K.E.; Waltner-Toews, D.; Charron, D. A dynamic population model to investigate effects of climate on geographic range and seasonality of the tick Ixodes scapularis. Int. J. Parasitol. 2005, 35, 375–389. [Google Scholar] [CrossRef] [PubMed]
  4. Watson, T.G.; Anderson, R.C. Ixodes scapularis say on white-tailed deer (Odocoileus virginianus) from Long Point, Ontario. J. Wildl. Dis. 1976, 12, 66–71. [Google Scholar] [CrossRef] [PubMed]
  5. Warden, L. Factors Affecting the Abundance of Blacklegged Ticks (Ixodes scapularis) and the PREVALENCE of Borrelia burgdorferi in Ticks and Small Mammals in the Thousand Islands Region. Master’s Thesis, The University of Guelph, Guelph, ON, Canada, 2012. [Google Scholar]
  6. Spielman, A. The emergence of lyme disease and human babesiosis in a changing environment. Ann. N. Y. Acad. Sci. 1994, 740, 146–156. [Google Scholar] [CrossRef] [PubMed]
  7. Odgen, N.H.; St-Onge, L.; Barker, I.K.; Brazeau, S.; Bigras-Poulin, M.; Charron, D.F.; Francis, C.M.; Heagy, A.; Lindsay, L.R.; Maarouf, A.; et al. Risk maps for range expansion of the Lyme disease vector, Ixodes scapularis, in Canada now and with climate change. Int. J. Health Geogr. 2008, 7. [Google Scholar] [CrossRef]
  8. Scott, J.D.; Fernado, K.; Durden, L.A.; Morshed, M.G. Lyme disease spirochete, Borrelia burgdorferi, endemic in epicentre at Turkey Point, Ontario. J. Med. Entomol. 2004, 41, 226–230. [Google Scholar] [CrossRef] [PubMed]
  9. Rand, P.W.; Lubelczyk, C.; Lavigne, G.R.; Elias, S.; Holman, M.S.; Lacombe, E.H.; Smith, R.P. Deer density and the abundance of Ixodes scapularis (Acari: Ixodidae). J. Med. Entomol. 2003, 40, 179–184. [Google Scholar] [CrossRef] [PubMed]
  10. Jones, C.G.; Ostfeld, R.S.; Richard, M.P.; Schauber, E.M.; Wolff, J.O. Chain reactions linking acorns to gypsy moth outbreaks and Lyme disease risk. Science 1998, 279, 1023–1026. [Google Scholar] [CrossRef] [PubMed]
  11. Bosler, E.M.; Ormiston, B.G.; Coleman, J.L.; Hanrahan, J.P.; Benach, J.L. Prevalance of the Lyme disease spirochete in populations of white-tailed deer and white-footed mice. Yale J. Biol. Med. 1984, 57, 651–659. [Google Scholar] [PubMed]
  12. Rand, P.W.; Lubelczyk, C.; Holman, M.S.; Lacombe, E.H.; Smith, R.P. Abundance of Ixodes scapularis (Acari: Ixodidae) after complete removal of deer from an isolated offshore island, endemic for Lyme disease. J. Med. Entomol. 2004, 41, 779–784. [Google Scholar] [CrossRef] [PubMed]
  13. Thompson, C.; Spielman, A.; Krause, P.J. Coninfecting deer-associated zoonoses: Lyme disease, babesiosis, and ehrlichiosis. CID 2001, 33, 676–685. [Google Scholar] [CrossRef]
  14. Garnett, J.M.; Connally, N.P.; Stafford, K.C.; Cartter, M.L. Evaluation of deer-targeted interventions on Lyme disease incidence in Connecticut. Public Health Rep. 2011, 126, 446–454. [Google Scholar] [PubMed]
  15. Fish, D.; Childs, J.E. Community-based prevention of Lyme disease and other tick-borne diseases through topical application of acaricide to white-tailed deer: Background and rationale. Vector-Borne Zoonotic Dis. 2009, 9, 357–364. [Google Scholar] [CrossRef] [PubMed]
  16. Piesman, J. Ecology of Borrelia burgdorferi sensu lato in North America. In Lyme Borreliosis: Biology, Epidemiology and Control; Gray, J.S., Kahl, O., Lane, R.S., Stanek, G., Eds.; CABI Publishing: New York, NY, USA, 2002; pp. 223–249. [Google Scholar]
  17. Shope, R. Global climate change and infectious diseases. Environ. Health Perspect. 1991, 96, 171–174. [Google Scholar] [CrossRef] [PubMed]
  18. Bunnell, J.E.; Price, S.D.; Das, A.; Shields, T.; Glass, G.E. Geographic information system and spatial analysis of adult Ixodes scapularis (Acari: Ixodidae) in the Middle Atlantic region of the U.S.A. J. Med. Entomol. 2003, 40, 570–576. [Google Scholar] [CrossRef] [PubMed]
  19. Ogden, N.H.; Lindsay, L.R.; Beauchamp, G.; Charron, D.; Maarout, A.; O’Callaghan, C.J.; Walternet-Toews, D.; Barker, I.K. Investigation of the relationships between temperature and development rates of the tick Ixodes scapularis (Acari: Ixodidae) in the laboratory and field. J. Med. Entomol. 2004, 41, 622–633. [Google Scholar] [CrossRef] [PubMed]
  20. Brownstein, J.S.; Holford, T.R.; Fish, D. A climate-based model predicts the spatial distribution of the Lyme disease vector Ixodes scapularis in the United States. Environ. Health Perspect. 2003, 111, 1152–1157. [Google Scholar] [CrossRef] [PubMed]
  21. Brownstein, J.S.; Holdford, T.R.; Fish, D. Effect of climate change on Lyme disease risk in North America. EcoHealth 2005, 2, 38–46. [Google Scholar] [CrossRef] [PubMed]
  22. Ogden, N.H.; Trudel, L.; Artsob, H.; Barker, I.K.; Beauchamp, G.; Charron, D.F.; Drebot, M.A.; Galloway, T.D.; O’Handley, R.; Thompson, R.A.; et al. Ixodes scapularis ticks collected by passive surveillance in Canada: Analysis of geographic distribution and infection with Lyme borreliosis agent Borrelia burgdorferi. J. Med. Entomol. 2006, 43, 600–609. [Google Scholar] [CrossRef] [PubMed]
  23. Phua, M.H.; Minowa, M. A GIS-based multi-criteria decision making approach to forest conservation planning at a landscape scale: A case study in the Kinabalu Area, Sabah, Malaysia. Landsc. Urban Plan. 2004, 71, 207–222. [Google Scholar] [CrossRef]
  24. Keisler, J.M.; Sundell, R.C. Combining multi-attribute utility and geographic information for boundary decision: An application to park planning. J. Geogr. Inf. Decis. Anal. 1997, 1, 101–118. [Google Scholar]
  25. Eastman, J.R.; Jin, W.; Kyem, P.A.K.; Toledano, J. Raster procedures for multi-criteria/multi-objective decisions. Photogramm. Eng. Remote Sens. 1995, 61, 539–547. [Google Scholar]
  26. Land Cover, Circa 2000—Vector. Available online: http://www.geobase.ca/geobase/en/data/landcover/csc2000v/description.html (accessed on 10 October 2014).
  27. Compton, B.; Mackie, R.; Dusek, G.L. Factors influencing distribution of white-tailed deer in Riparian Habitats. J. Wildl. Manag. 1988, 52, 542–548. [Google Scholar] [CrossRef]
  28. Ministry of Natural Resources. White-Tailed Deer Biology. Ontario Ministry of Natural Resources. 2012. Available online: http://www.mnr.gov.on.ca/en/Business/FW/2ColumnSubPage/STDPROD_097096.html (accessed on 3 April 2014). [Google Scholar]
  29. Moen, A.N. Energy conservation by white-tailed deer in the winter. Ecology 1976, 57, 192–198. [Google Scholar] [CrossRef]
  30. Clef, M.V. Review of the Ecological Effects and Management of White-Tailed Deer in New Jersey. The Nature Conservancy, New Jersey Chapter, Oct. 2004. Avilable online: http://deerinbalance.files.wordpress.com/2010/01/review-of-the-ecological-effects-and-management-of.pdf (accessed on 20 November 2014).
  31. Rodgers, K.J.; Ffolliott, P.F.; Patton, D.R. Home range and movement of five mule deer in a semidesert grass-shrub community. In Rocky Mountain Forest and Range Experiment Station; Forest Service US, Department of Agriculture: Fort Collins, CO, USA, 1978; Volume 355, pp. 1–6. [Google Scholar]
  32. Beier, P.; McCullough, D.R. Factors influencing white-tailed deer activity patterns and habitat use. Wildl. Monogr. 1990, 109, 3–51. [Google Scholar]
  33. Richardson, C.L. Brush Management Effects on Deer Habitat. Texas A & M AgriLife Extension. 1914. E-129. Available online: http://gillespie.agrilife.org/files/2013/02/Brush-Management-Effects-on-Deer-Habitats.pdf (accessed on 20 November 2014).
  34. Janssen, R.; van Herwijnen, M. Multiobjective Decision Support for Environmental Management + DEFINITE DEcisions on an FINITE Set of Alternatives: Demonstration Disks and Instruction; Kluwer Academic Publishers: Dordrecht, The Netherlands, 1994; p. 232. [Google Scholar]
  35. Ogden, N.H.; Bouchard, C.; Kurtenbach, K.; Margos, G.; Lindsay, L.R.; Trudel, L.; Nguon, S.; Milord, F. Active and passive surveillance and phylogenetic analysis of Borrelia burgdorferi elucidate the process of Lyme disease risk emergence in Canada. Environ. Health Perspect. 2010, 118, 909–914. [Google Scholar] [CrossRef] [PubMed]
  36. Estrada-Pena, A. Increasing habitat suitability in the United States for the tick that transmits Lyme disease: A remote sensing approach. Environ. Health Perspect. 2002, 110, 635–640. [Google Scholar] [CrossRef] [PubMed]
  37. Kitron, U.; Kazmierczak, J.J. Spatial analysis of the distribution of Lyme disease in Wisconsin. Am. J. Epidemiol. 1997, 145, 558–566. [Google Scholar] [CrossRef] [PubMed]
  38. Gubler, D.J.; Reiter, P.; Ebi, K.L.; Yap, W.; Nasci, R.; Patz, J.A. Climate variability and change in the United States: Potential impacts on vector and rodent-borne diseases. Environ. Health Perspect. 2001, 109, 223–233. [Google Scholar] [CrossRef] [PubMed]

