Use of the NASA Giovanni Data System for Geospatial Public Health Research: Example of Weather-Influenza Connection

Abstract
:1. Introduction
2. Data Parameters in Giovanni Relevant to Public Health
2.1. Tier 1 Data Parameters
- Precipitation
- Temperature
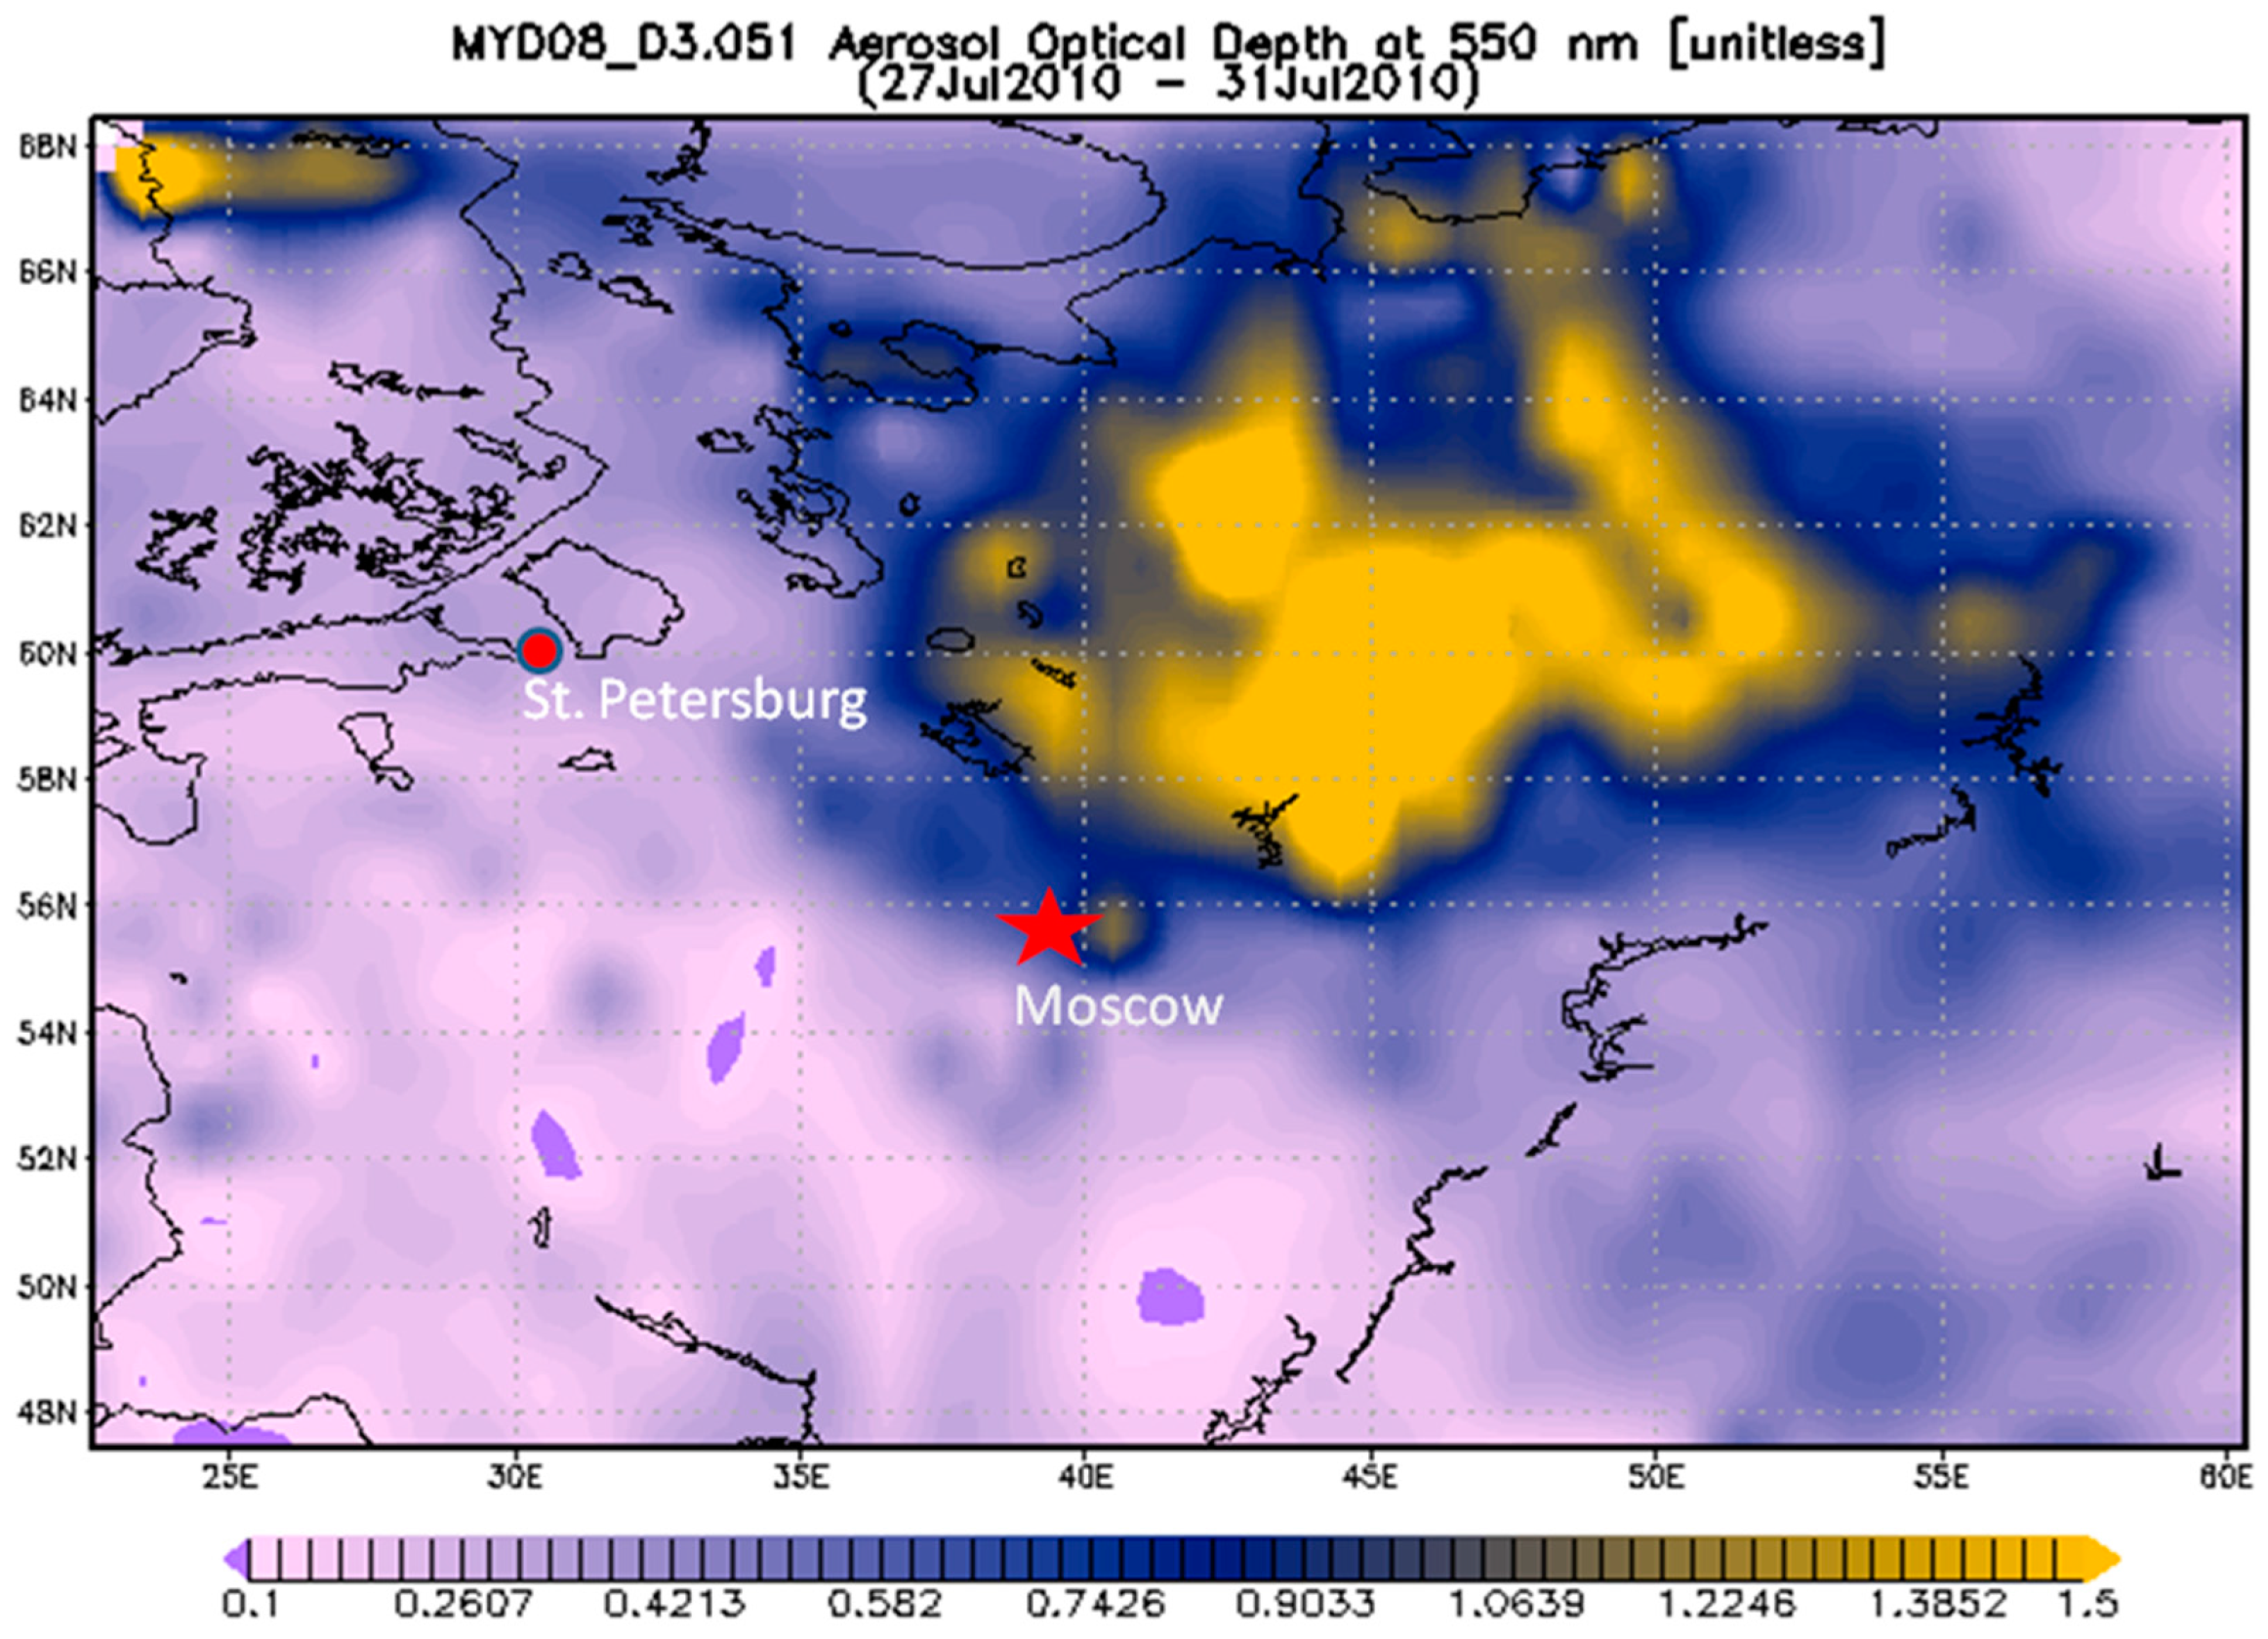
- Aerosol Optical Depth (AOD)
- Nitrogen Dioxide (NO2)
- Carbon Monoxide (CO)
- Relative Humidity
- Cloud Cover
2.1.1. Precipitation Data
2.1.2. Temperature Data
2.1.3. Air Quality Data
2.2. Tier 2 Data Parameters
- Chlorophyll concentration (phytoplankton)
- Euphotic Depth
- Sea Surface Temperature
- Ozone (O3) Erythemal Ultraviolet (UV) Daily Dose
- Normalized Difference and Enhanced Vegetation Indices (NDVI/EVI)
- Soil Moisture
2.2.1. Ocean Data
2.2.2. Ozone Data
2.2.3. Vegetation Indices
2.3. Tier 3 Data Parameters
- Snow Depth
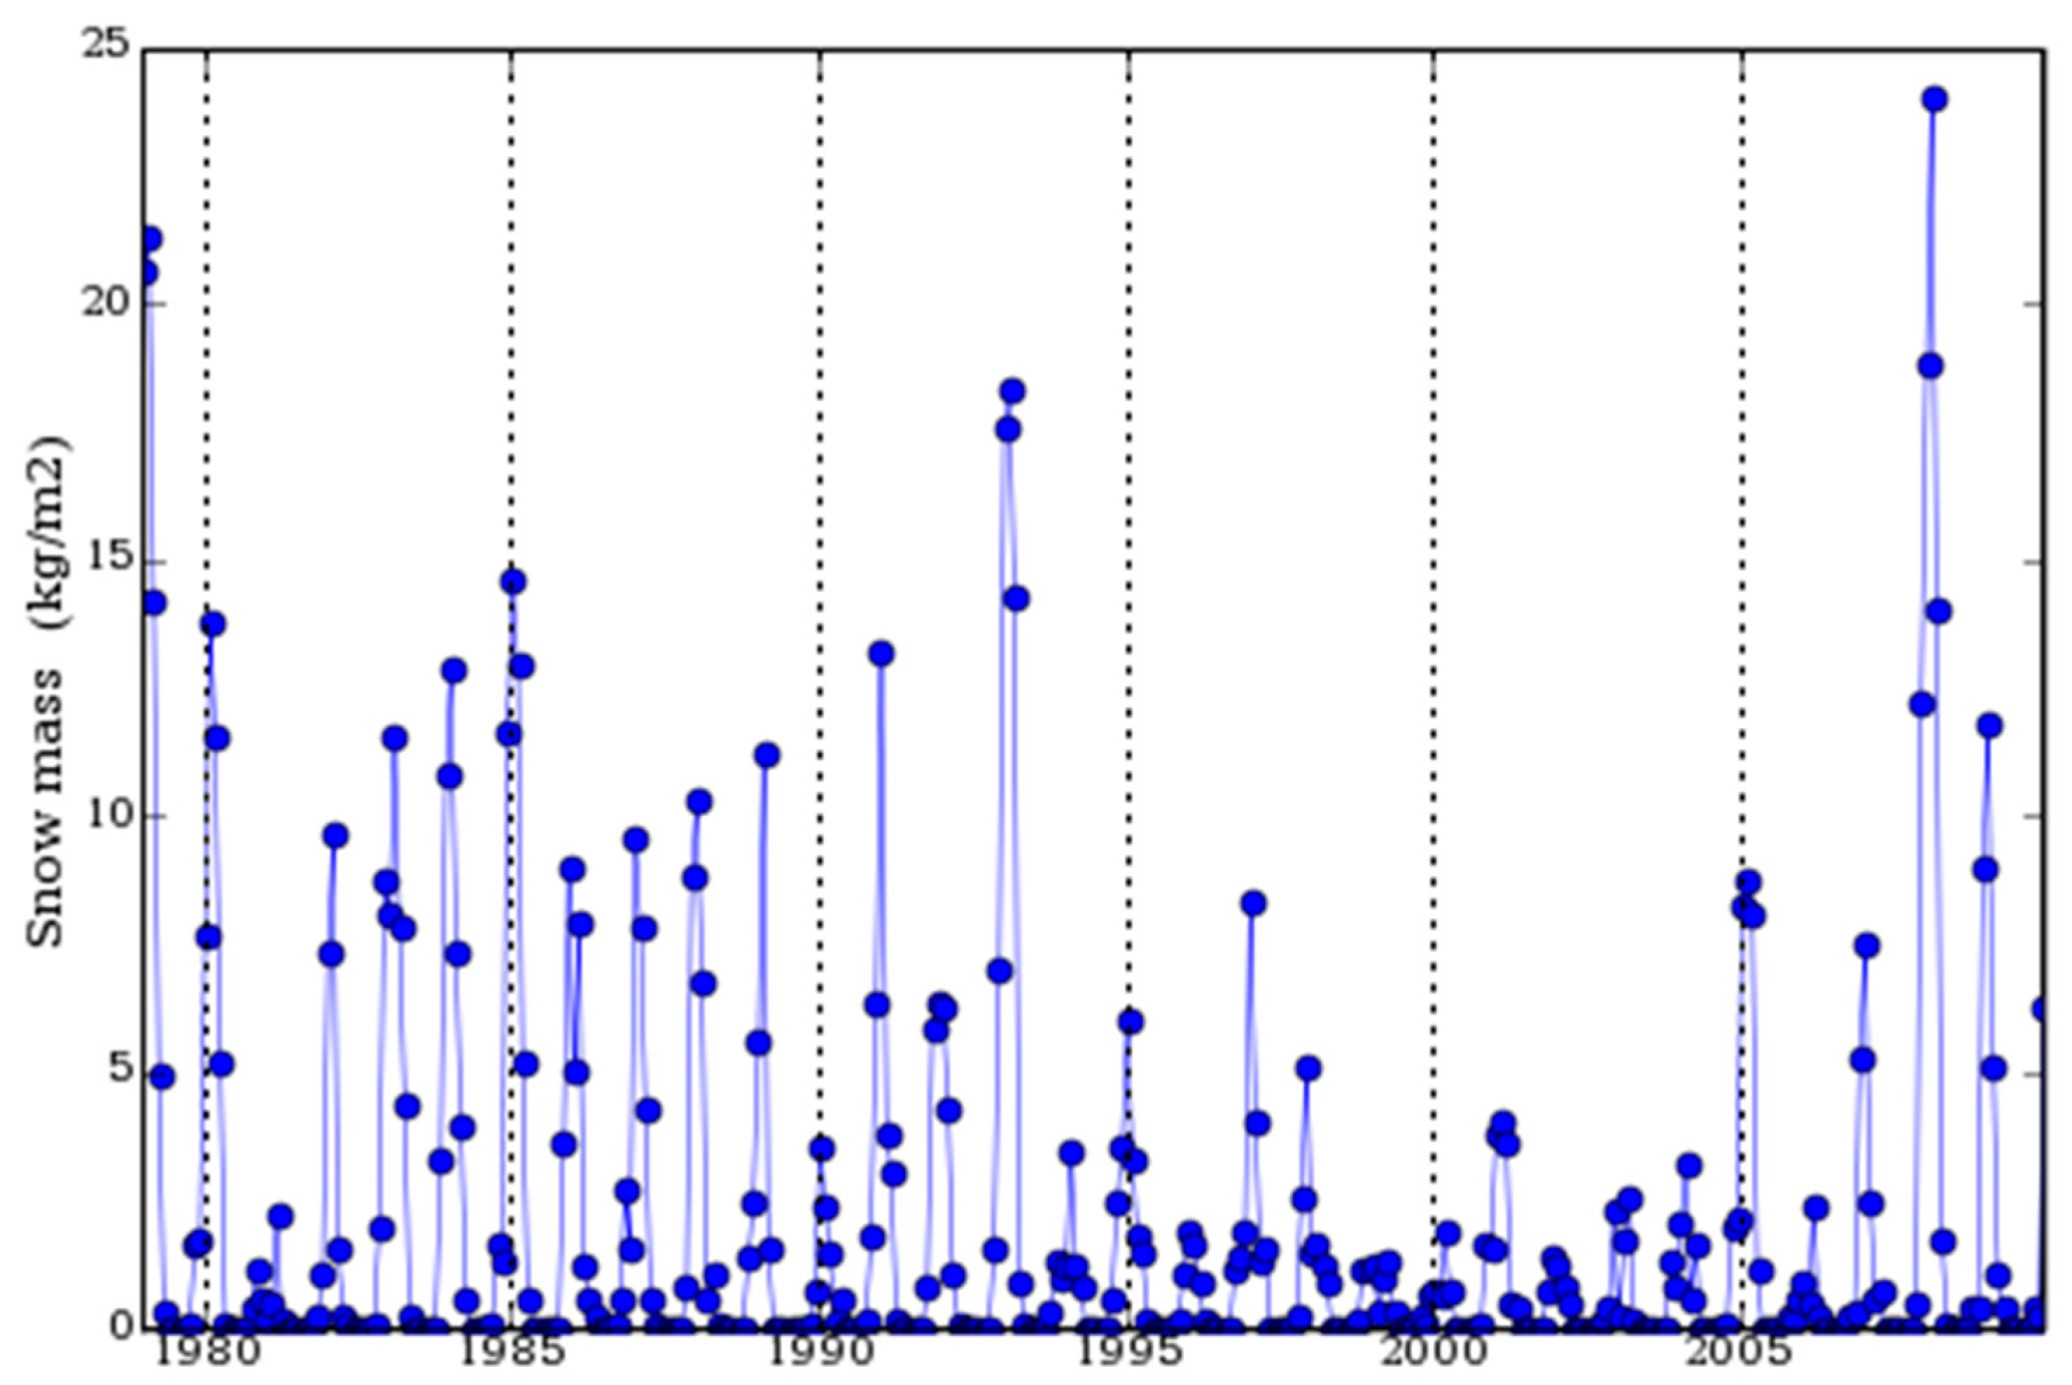
- Snow Mass
- Snowfall Rate
- Snowmelt
- Fractional Snow Cover
- Snow/Ice Frequency
- Wind Speed
- Runoff

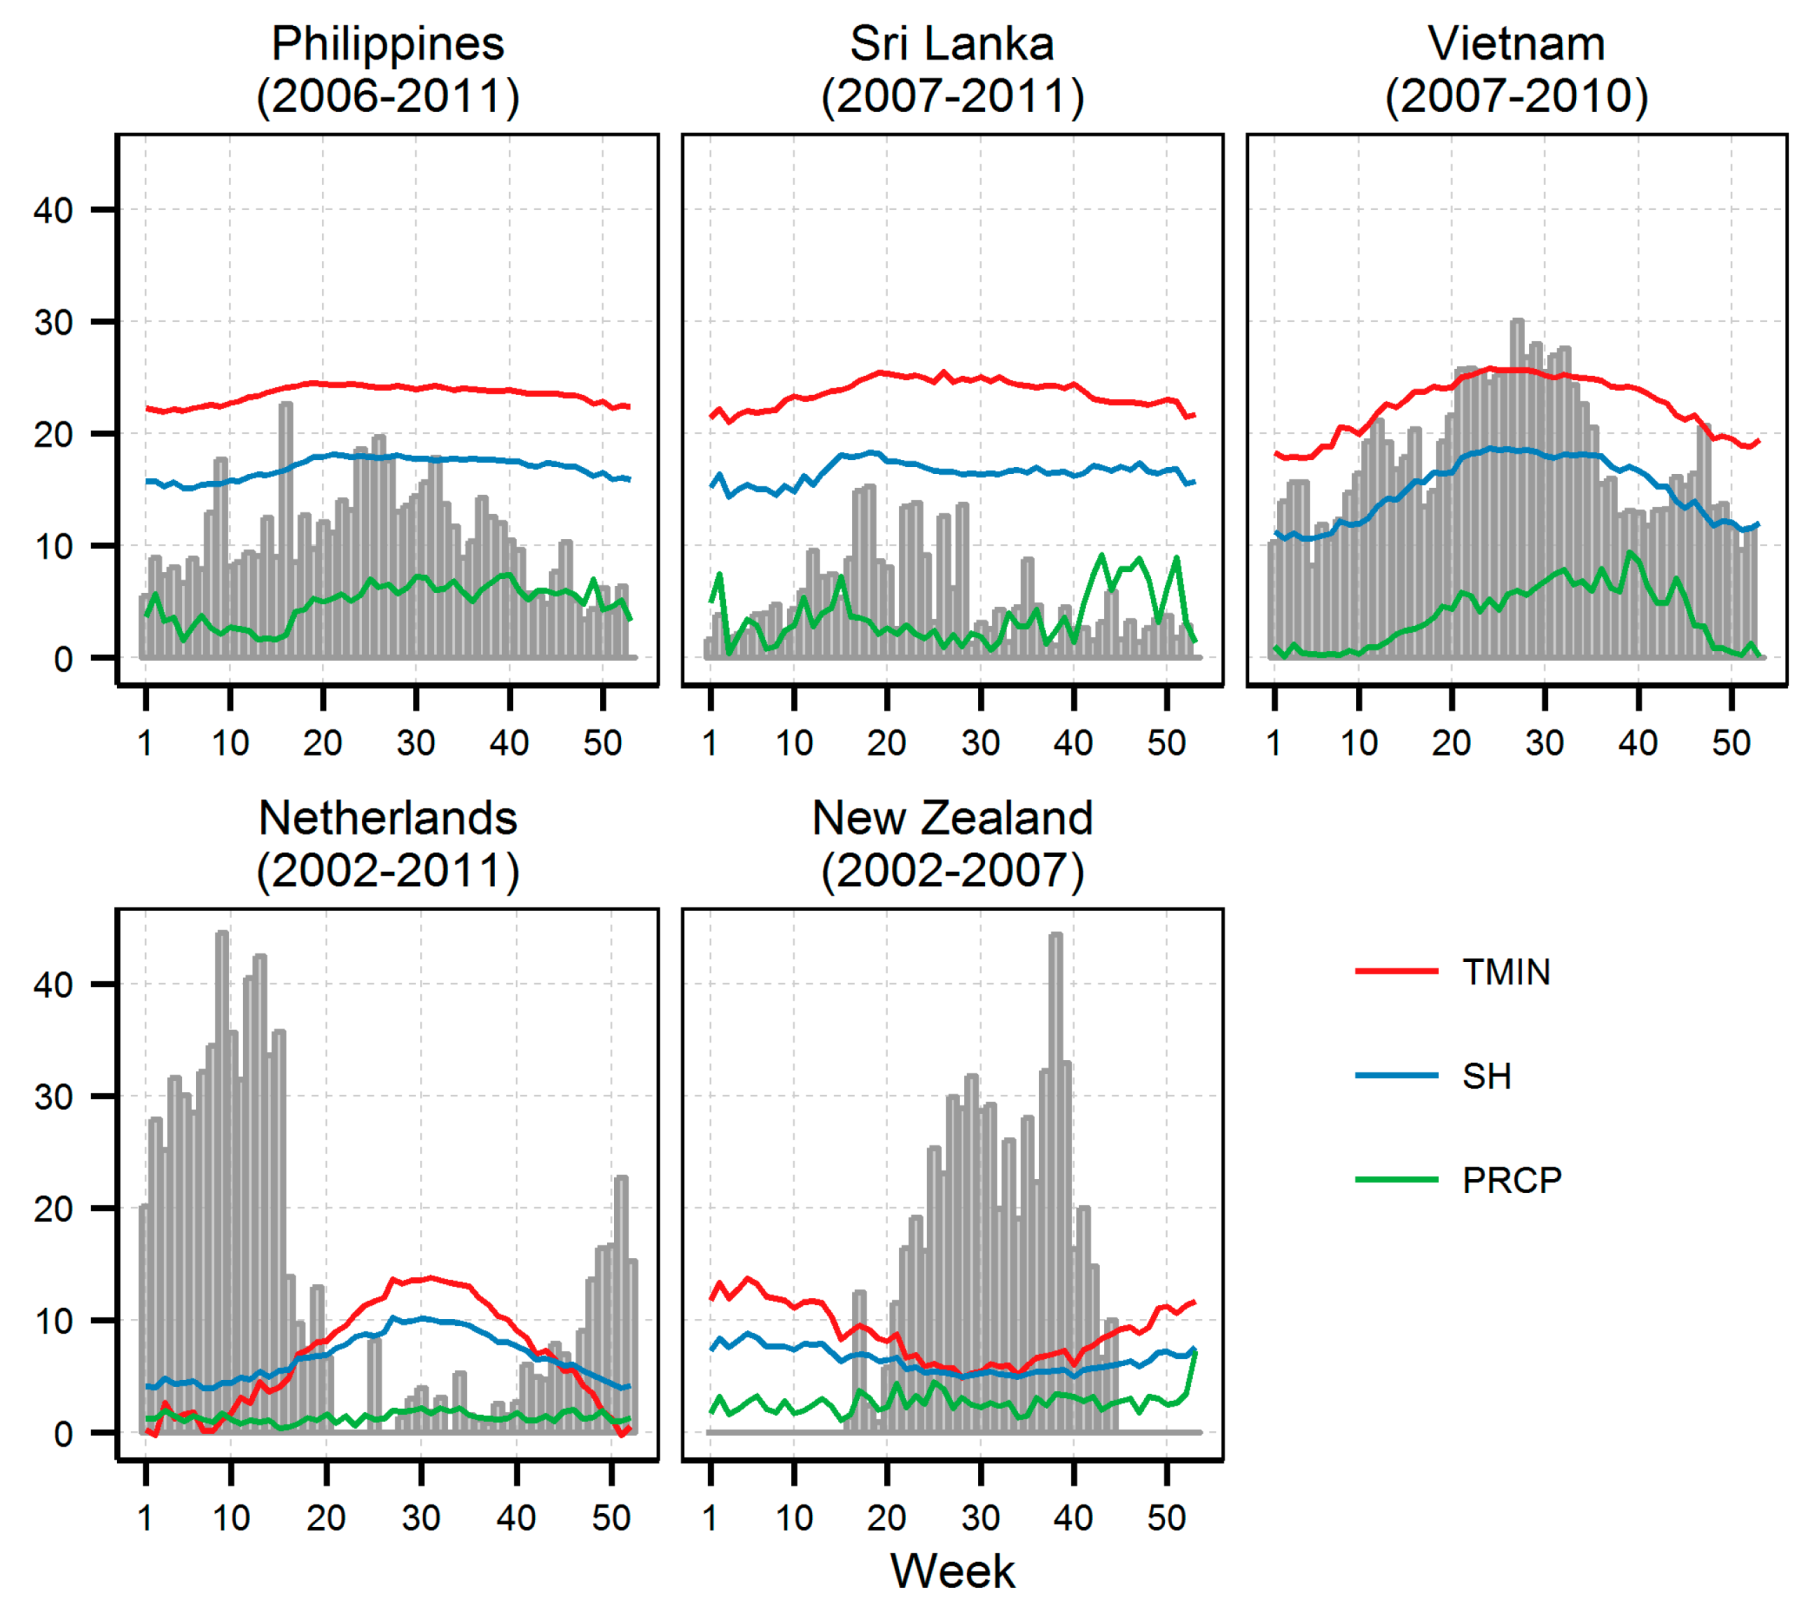
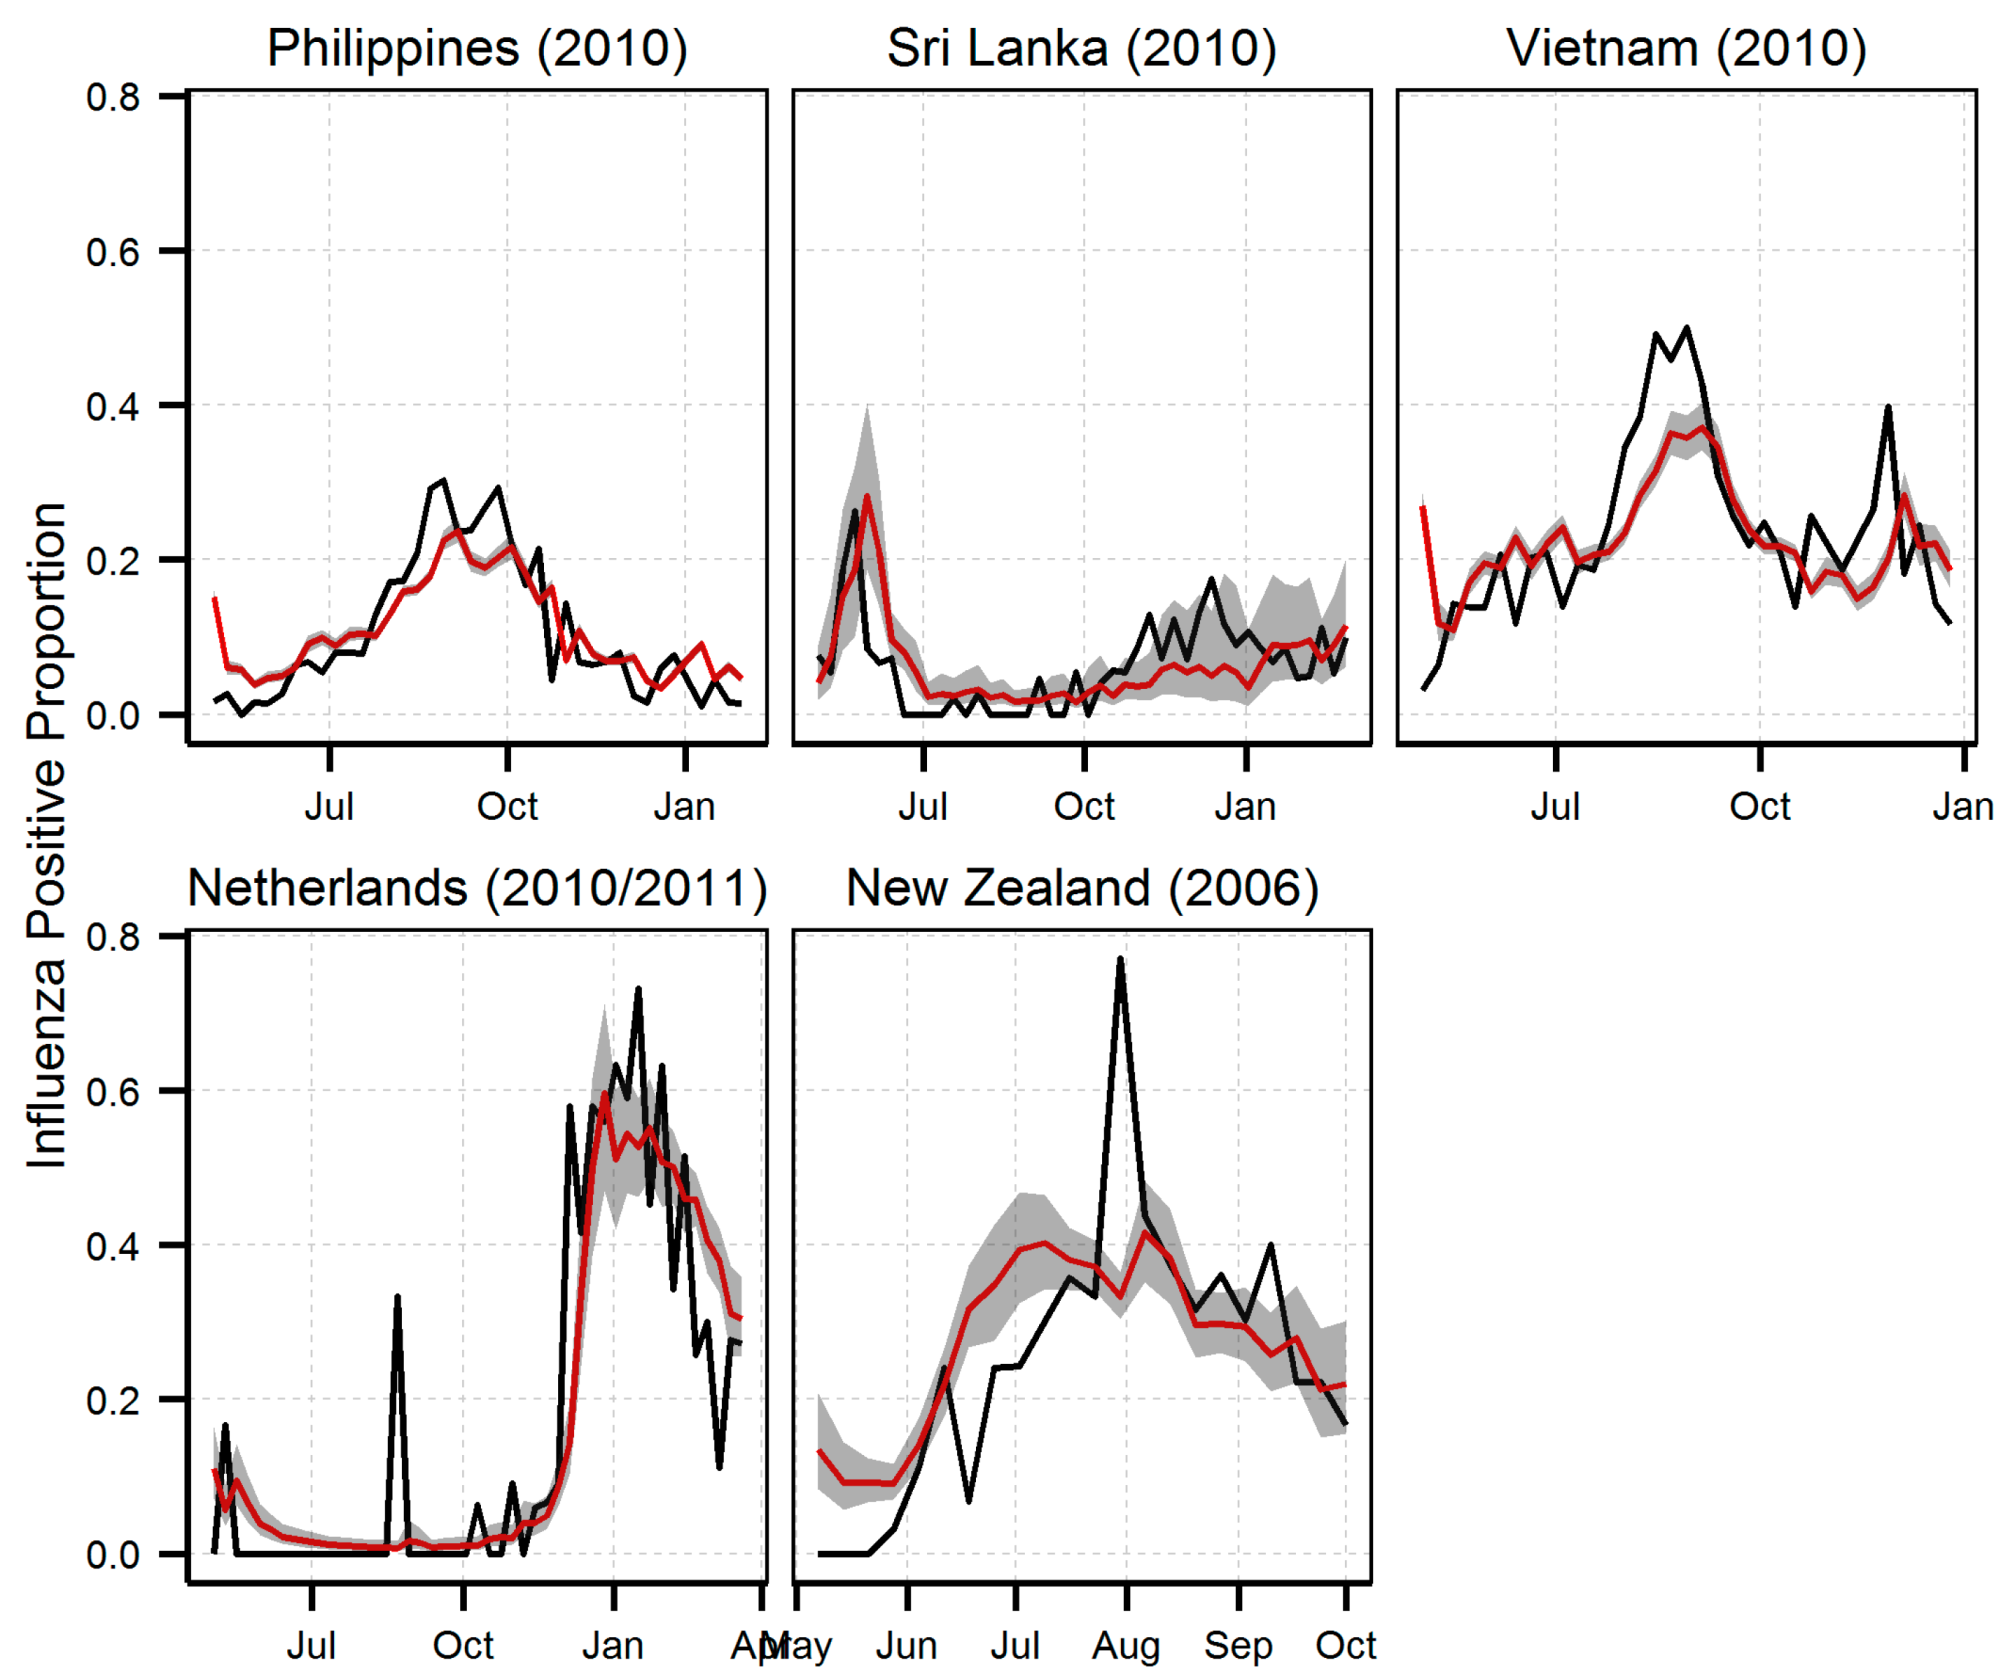
3. Influenza Example

| Odds Ratio (95% Confidence Interval) | Model Performance | |||||
|---|---|---|---|---|---|---|
| Min. Temp. | Precipitation | Specific Humidity | Training | Prediction | ||
| (°C) | (mm) | (g/kg) | RMSE | RMSE | Corr. Coeff | |
| Philippines | 1.13 (1.07, 1.19) | 0.064 | 0.048 | 0.831 | ||
| Sri Lanka | 0.59 (0.39, 0.90) | 1.47 (1.11, 1.97) | 0.048 | 0.055 | 0.503 | |
| Vietnam | 1.15 (1.09, 1.20) | 0.054 | 0.079 | 0.730 | ||
| Netherlands | 0.79 (0.67, 0.95) | 0.139 | 0.136 | 0.803 | ||
| New Zealand | 1.00 (0.99,1.01) | 0.41 (0.29, 0.58) | 0.147 | 0.141 | 0.618 | |
4. Conclusions
Acknowledgments
Author Contributions
Conflicts of Interest
References
- Berrick, S.; Leptoukh, G.; Farley, J.D.; Rui, H. Giovanni: A web service workflow-based data visualization and analysis system. IEEE Trans. Geosci. Remote Sens. 2009, 47, 106–113. [Google Scholar] [CrossRef]
- ARSET Web Site. Available online: http://arset.gsfc.nasa.gov (accessed on 5 September 2014).
- Rebaudet, S.; Gazin, P.; Barrais, R.; Moore, S.; Rossignol, E.; Barthelemy, N.; Gaudart, J.; Boncy, J.; Magloire, R.; Piarroux, R. The dry season in Haiti: A window of opportunity to eliminate cholera. PLoS Curr. 2013. [Google Scholar] [CrossRef]
- Kiang, R.; Adimi, F.; Soika, V.; Nigro, J.; Singhasivanon, P.; Sirichaisinthop, J.; Leemingsawat, S.; Apiwathnasorn, C.; Looareesuwan, S. Meteorological, environmental remote sensing and neural network analysis of the epidemiology of malaria transmission in Thailand. Geospatial Health 2006, 1, 71–84. [Google Scholar] [PubMed]
- Adimi, F.; Soebiyanto, R.P.; Safi, N.; Kiang, R. Towards malaria risk prediction in Afghanistan using remote sensing. Malar. J. 2010, 9. [Google Scholar] [CrossRef] [PubMed]
- Midekisa, A.; Senay, G.; Henebry, G.M.; Semuniguse, P.; Wimberly, M.C. Remote sensing-based time series models for malaria early warning in the highlands of Ethiopia. Malar. J. 2012, 11, 165–181. [Google Scholar] [CrossRef] [PubMed]
- Cools, J.; Vanderkimpen, P.; El Afandi, G.; Abdelkhalek, A.; Fockedey, S.; El Sammany, M.; Abdallah, G.; El Bihery, M.; Bauwens, W.; Huygens, M. An early warning system for flash floods in hyper-arid Egypt. Nat. Hazards Earth Syst. Sci. 2012, 12, 443–457. [Google Scholar] [CrossRef]
- Singh, S.K.; Pandey, A.C.; Nathawat, M.S. Rainfall variability and spatio-temporal dynamics of flood inundation during the 2008 Kosi flood in Bihar State, India. Asian J. Earth Sci. 2011, 4, 9–19. [Google Scholar] [CrossRef]
- Soebiyanto, R.P.; Adimi, F.; Kiang, R.K. Modeling and predicting seasonal influenza transmission in warm regions using climatological parameters. PLoS One 2010. [Google Scholar] [CrossRef]
- Shen, S.; Leptoukh, G.; Loboda, T.; Csiszar, I.; Romanov, P.; Gerasimov, I. The NASA NEESPI data portal to support studies of climate and environmental changes in non-boreal Europe. In Regional Aspects of Climate-Terrestrial-Hydrologic Interactions in Non-boreal Eastern Europe; Pavel, G., Sergiy, I., Eds.; Springer: Berlin, Germany, 2009; pp. 9–16. [Google Scholar]
- Li, W.J.; Shao, L.Y.; Buseck, P.R. Haze types in Beijing and the influence of agricultural biomass burning. Atmos. Chem. Phys. 2010, 10, 8119–8130. [Google Scholar] [CrossRef]
- Lu, Z.; Streets, D.G.; Zhang, Q.; Wang, S.; Carmichael, G.R.; Cheng, Y.F.; Wei, C.; Chin, M.; Diehl, T.; Tan, Q. Sulfur dioxide emissions in China and sulfur trends in East Asia since 2000. Atmos. Chem. Phys. 2010, 10, 6311–6331. [Google Scholar] [CrossRef]
- Prados, A.I.; Leptoukh, G.; Lynnes, C.; Johnson, J.; Rui, H.; Chen, A.; Husar, R.B. Access, visualization, and interoperability of air quality remote sensing data sets via the Giovanni online tool. IEEE J. Sel. Top. Earth Obs. Remote Sens. 2010, 3, 359–370. [Google Scholar] [CrossRef]
- Sitnov, S.A. Weekly cycle of meteorological parameters over Moscow region. Dokl. Earth Sci. 2010, 431, 507–513. [Google Scholar] [CrossRef]
- Lobitz, B.M.; Beck, L.R.; Huq, A.; Wood, B.; Fuchs, G.; Faruque, A.S.G.; Colwell, R.R. Climate and infectious disease: Use of remote sensing for detection of Vibrio cholerae by indirect measurement. Proc. Natl. Acad. Sci. USA 2000, 97, 1438–1443. [Google Scholar] [CrossRef] [PubMed]
- Emch, M.; Feldacker, C.; Yunus, M.; Streatfield, P.K.; Thiem, V.; Canh, D.; Mohammad, A. Local environmental predictors of Cholera in Bangladesh and Vietnam. Am. J. Trop. Med. Hyg. 2008, 78, 823–832. [Google Scholar] [PubMed]
- De Magny, G.; Murtugudde, R.; Sapianob, M.; Nizam, A.; Brown, C.; Busalacchi, A.; Yunus, M.; Nair, G.; Gil, A.; Calkins, J.; et al. Environmental signatures associated with Cholera Epidemics. Proc. Natl. Acad. Sci. USA 2008, 105, 17676–17681. [Google Scholar] [CrossRef] [PubMed]
- Van Holt, T. Fisher success and adaptation to plantation systems in Chile. In In Proceedings of the 2012 Gregory G. Leptoukh Online Giovanni Workshop. Available online: http: //disc.sci.gsfc.nasa.gov/giovanni/additional/newsletters/proceedings_2012_leptoukh_Giovanni_online_workshop (accessed on 10 November 2014).
- Cherrington, E.A.; Hernandez, B.E.; Garcia, B.C.; Clemente, A.H.; Oynela, M.O. Sea Surface Trends in the Caribbean Sea and Eastern Pacific Ocean. Available online: http://issuu.com/cathalac/docs/servir_oceans_eng (accessed on 8 December 2014).
- Serrano, M.A.; Cañada, J.; Moreno, J.C. Erythemal ultraviolet solar radiation doses received by young skiers. Photochem. Photobio. Sci. 2013, 12, 1976–1983. [Google Scholar]
- SRI Inc. Data-Enhanced Investigations for Climate Change Education. Available online: http://dicce.sri.com/ (accessed on 5 September 2014).
- WHO (2009) Influenza (Seasonal)—Fact Sheet No 211. Available online: http://www.who.int/mediacentre/factsheets/fs211/en/ (accessed on 14 June 2013).
- Tamerius, J.D.; Shaman, J.; Alonso, W.J.; Bloom-Feshbach, K.; Uejio, C.K.; Andrew Comrie, A.; Viboud, C. Environmental predictors of seasonal influenza epidemics across temperate and tropical climates. PLoS Pathog. 2013, 9, e1003194. [Google Scholar] [PubMed]
- Shaman, J.; Pitzer, V.E.; Viboud, C.; Grenfell, B.T.; Lipsitch, M. Absolute humidity and the seasonal onset of influenza in the continental United States. PLoS Biol. 2010, 8, e1000316. [Google Scholar] [CrossRef] [PubMed]
- Soebiyanto, R.P.; Clara, W.; Jara, J.; Castillo, L.; Sorto, O.R.; Marinero, S.; De Antinori, M.E.B.; McCracken, J.P.; Widdowson, M. -A.; Kiang, R.K. The role of temperature and humidity on seasonal influenza in tropical areas: Guatemala, El Salvador and Panama, 2008–2013. PLoS One 2014, 9, e100659. [Google Scholar] [CrossRef] [PubMed]
- Chadha, M.S.; Broor, S.; Gunasekaran, P.; Potdar, V.A.; Krishnan, A.; Chawla-Sarkar, M.; Biswas, D.; Abraham, A.M.; Jalgaonkar, S.V.; Kaur, H.; et al. Multisite virological influenza surveillance in India: 2004–2008. Influenza Other Respi Viruses 2012, 6, 196–203. [Google Scholar] [CrossRef]
- Dosseh, A.; Ndiaye, K.; Spiegel, A.; Sagna, M.; Mathiot, C. Epidemiological and virological influenza survey in Dakar, Senegal: 1996–1998. Am. J. Trop. Med. Hyg. 2000, 62, 639–643. [Google Scholar] [PubMed]
- Lowen, A.C.; Mubareka, S.; Steel, J.; Palese, P. Influenza virus transmission is dependent on relative humidity and temperature. PLoS Pathog. 2007, 3, 1470–1476. [Google Scholar] [CrossRef] [PubMed]
- Polozov, I.V.; Bezrukov, L.; Gawrisch, K.; Zimmerberg, J. Progressive ordering with decreasing temperature of the phospholipids of influenza virus. Nat. Chem. Biol. 2008, 4, 248–255. [Google Scholar] [CrossRef] [PubMed]
- Lofgren, E.; Fefferman, N.H.; Naumov, Y.N.; Gorski, J.; Naumova, E.N. Influenza seasonality: Underlying causes and modeling theories. J. Virol. 2007, 81, 5429–5436. [Google Scholar] [CrossRef] [PubMed]
- World Health Organization FluNet. Available online: http://www.who.int/influenza/gisrs_laboratory/flunet/en/ (accessed on 14 June 2013).
- Huffman, G.; Adler, R.F.; Bolvin, D.T.; Gu, G.; Nelkin, E.J.; Bowman, K.P.; Hong, Y.; Stocker, E.F.; Wolff, D.B. The TRMM multisatellite precipitation analysis (TMPA): Quasi-global, multiyear, combined-sensor precipitation estimates at fine scales. J. Hydrometeorol. 2007, 8, 38–55. [Google Scholar] [CrossRef]
- National Climatic Data Center Global Surface Summary of Day. Available online: http://www.ncdc.noaa.gov/oa/ncdc.html (accessed on 14 June 2013).
© 2014 by the authors; licensee MDPI, Basel, Switzerland. This article is an open access article distributed under the terms and conditions of the Creative Commons Attribution license (http://creativecommons.org/licenses/by/4.0/).
Share and Cite
Acker, J.; Soebiyanto, R.; Kiang, R.; Kempler, S. Use of the NASA Giovanni Data System for Geospatial Public Health Research: Example of Weather-Influenza Connection. ISPRS Int. J. Geo-Inf. 2014, 3, 1372-1386. https://doi.org/10.3390/ijgi3041372
Acker J, Soebiyanto R, Kiang R, Kempler S. Use of the NASA Giovanni Data System for Geospatial Public Health Research: Example of Weather-Influenza Connection. ISPRS International Journal of Geo-Information. 2014; 3(4):1372-1386. https://doi.org/10.3390/ijgi3041372
Chicago/Turabian StyleAcker, James, Radina Soebiyanto, Richard Kiang, and Steve Kempler. 2014. "Use of the NASA Giovanni Data System for Geospatial Public Health Research: Example of Weather-Influenza Connection" ISPRS International Journal of Geo-Information 3, no. 4: 1372-1386. https://doi.org/10.3390/ijgi3041372
APA StyleAcker, J., Soebiyanto, R., Kiang, R., & Kempler, S. (2014). Use of the NASA Giovanni Data System for Geospatial Public Health Research: Example of Weather-Influenza Connection. ISPRS International Journal of Geo-Information, 3(4), 1372-1386. https://doi.org/10.3390/ijgi3041372