Model for Determining Geographical Distribution of Heat Saving Potentials in Danish Building Stock


Abstract
:1. Introduction
 and 18 of hot water demand provide an indication of how far it is possible to go with new buildings. Due to the high share of district heating in Denmark, which covers around 60% of Danish heating needs, an important aspect of any system-changing measure is its ability to work alongside district heating. Several studies [5,6,7] have concluded that heat savings in the building stock will work well with district heating, today, as well as in a future renewable energy system, when the share of district heating increases even more. A lower heat demand in buildings will enable the introduction of fourth generation district heating technologies with lower supply and return temperatures, thus reducing the major disadvantage of district heating transmission losses.
- Decrease the emission of greenhouse gasses by 20% in comparison to 1990 levels by 2020.
- By 2020, 20% of the EU’s final energy demand should be covered by renewable energy, such as wind, solar, wave and biomass. Denmark went even further with its renewable energy targets, setting the 2020 goal for the share of renewable energy of final energy demand to 30%.
- Decrease total energy consumption by 20% by improving energy efficiency in the whole chain of production-transmission-distribution-end-use compared to the business-as-usual scenario [8].
- To identify potentials and associated costs of heat savings within the Danish building stock and to assess its effects on the energy system and environment.
- To put the effects of heat savings on the economy and the energy system into a spatial context.
2. Methodology and Tools
The Danish Heat Atlas
3. The Heat Savings Model
3.1. Grouping of Buildings

| Construction Year | Before 1850 | 1850–1930 | 1931–1950 | 1951–1962 | 1962–1973 | 1973–1978 | 1979–1998 | 1998–2006 | After 2007 |
|---|---|---|---|---|---|---|---|---|---|
| Year group | 1 | 2 | 3 | 4 | 5 | 6 | 7 | 8 | 9 |
| Building Code | Use of buildings | Use group |
|---|---|---|
| 110 | Farmhouses | Farmhouses |
| 120 | Detached houses | Detached houses |
| 130 | Terrace houses | Non-detached houses |
| 140, 150, 160, 190 | Blocks of flats, hostels, residential institutions, other dwellings | Multistory buildings |
| 320, 330, 390, 420, 430, 440, 490, 530 | Trade and commerce, hotel and service, other trade, cultural buildings, schools, hospitals, kindergartens, other public buildings, sports buildings | Office/public buildings |

3.2. Heat Demand in Buildings

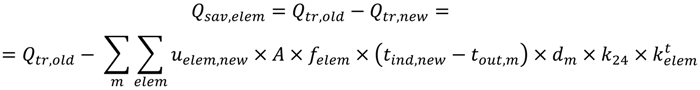
 of a specific element of the building envelope (wall, floor, roof, window).
 : The reduction factor due to the possibility that the temperature on the external side of a building envelope’s element is different from the outdoor temperature. A value of 0.7 is taken for floors and one for walls, roofs and windows. The numerical values are based on [16].
| Month in Heating Season | Number of Days with Heating |
|---|---|
| January | 31 |
| February | 28 |
| March | 31 |
| April | 30 |
| May | 18 |
| September | 6 |
| October | 31 |
| November | 30 |
| December | 31 |
 : The density of indoor air.
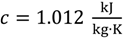 : The thermal capacity of indoor air.
 : The air flow rate.
 : The heat gain from human body and waste heat from electrical appliances. The same value is assumed for residential and office/public buildings. The values are taken from [14].
- for office/public buildings:
![Ijgi 03 00143 i004]()
- for residential buildings:
![Ijgi 03 00143 i005]()

 and Q
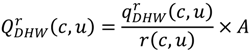
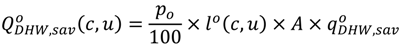
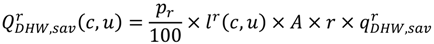
and Q  denote the energy demand for hot water in office/public and residential buildings, respectively q . is heat consumption for hot water per unit of heated area in office/public buildings, while q represents heat consumption for domestic hot water per apartment in residential buildings. r(c,u) represents the average area of households in usage group u, constructed in time period c. It is calculated as a ratio between the total number of households of a specific type and the total heated area of buildings of the same type. The total number of households of a specific usage group and construction period is obtained from Danish Statistics, while the total heated area of buildings of a specific type is taken from [19]. As before, A represents the heated area of a building. and Q in Equations (5a) and (5b) is that q (c) is calculated in per year, while q (c, u) is calculated in
  per year, and the intention was to present both in per year. Both q (c, u) and q (c) are based on actual measurements published in [20,21].
| Use Group | Qheat (TWh) | Qheat atlas (TWh) | Ratio (%) |
|---|---|---|---|
| Detached houses | 16.64 | 17.62 | 94.4 |
| Farmhouses | 2.6 | 2.49 | 104.4 |
| Multi-story buildings | 12.54 | 10.79 | 116.2 |
| Non-detached houses | 2.32 | 3.06 | 75.8 |
| Office/public buildings | 9.69 | 9.91 | 97.8 |
| SUM | 43.79 | 43.87 | 99.8 |
3.3. Heat Savings
| Element | Level | Additional Insulation Thickness 1 (mm) |
|---|---|---|
| wall | Level 1 | 100 |
| wall | Level 2 | 150 |
| wall | Level 3 | 200 |
| roof | Level 1 | 50 |
| roof | Level 2 | 100 |
| roof | Level 3 | 150 |
| window | Level 1 | 1.5 |
| window | Level 2 | 0.8 |
| window | Level 3 2 | 1.3 |
| floor | Level 1 | 100 |
| ventilation systems | Level 1 | 0.9 |
| domestic hot water | Level 1 | 40 |
| domestic hot water | Level 2 | 50 |
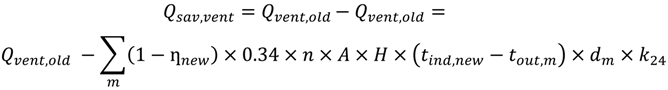
 represents energy savings per length of pipe being insulated, depending on the insulation thickness. Assumptions from [17] have been applied.
3.4. Costs of Heat Savings
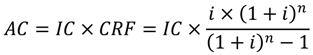
| Element | Marginal Costs  1 1 | Full Costs |
|---|---|---|
| wall | 7 × ∆d 2 | 1,500 + 7 × ∆d |
| roof | 50 + ∆d | 100 + ∆d |
| floor | 350 | 350 |
| window, level 1 | 0 | 2,500 |
| window, level 2 | 1,500 | 4,000 |
| window, level 3 | 2,000 | 3,000 |
| ventilation system with heat recovery | 300 | 300 |
| hot water pipes 3, level 1 | 100 | 100 |
| hot water pipes, level 2 | 120 | 120 |
4. Results of Analysis
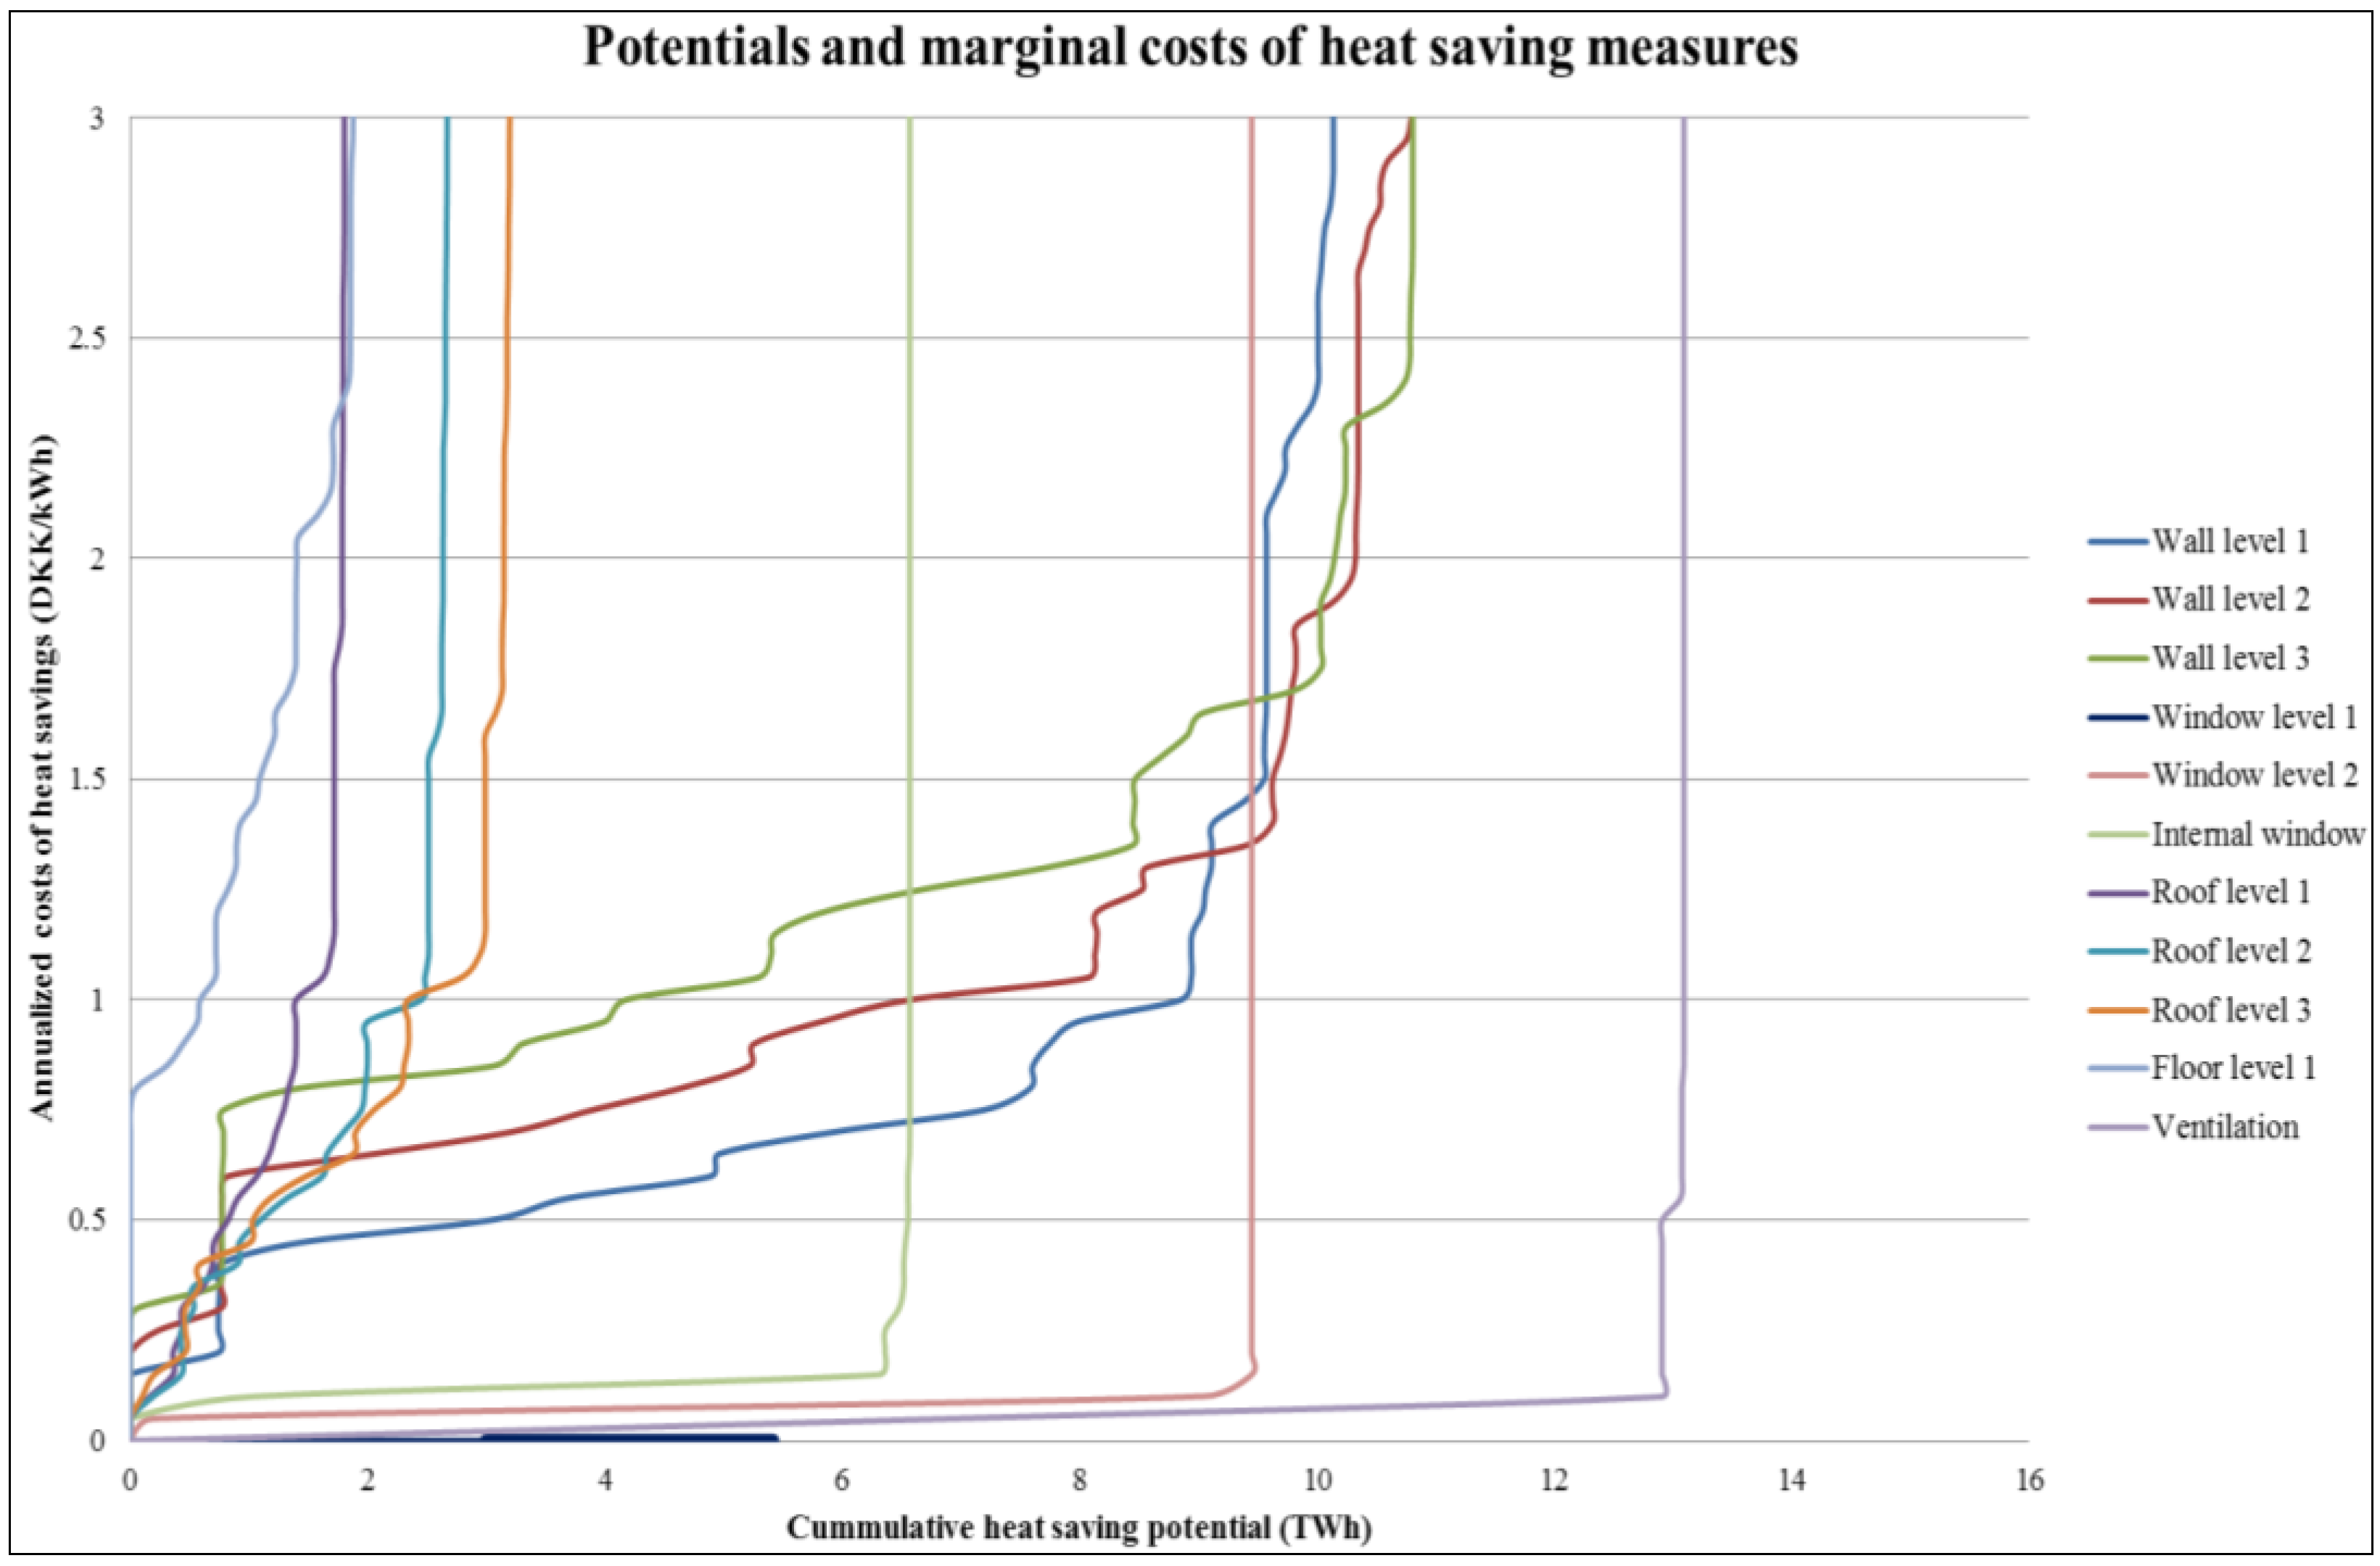
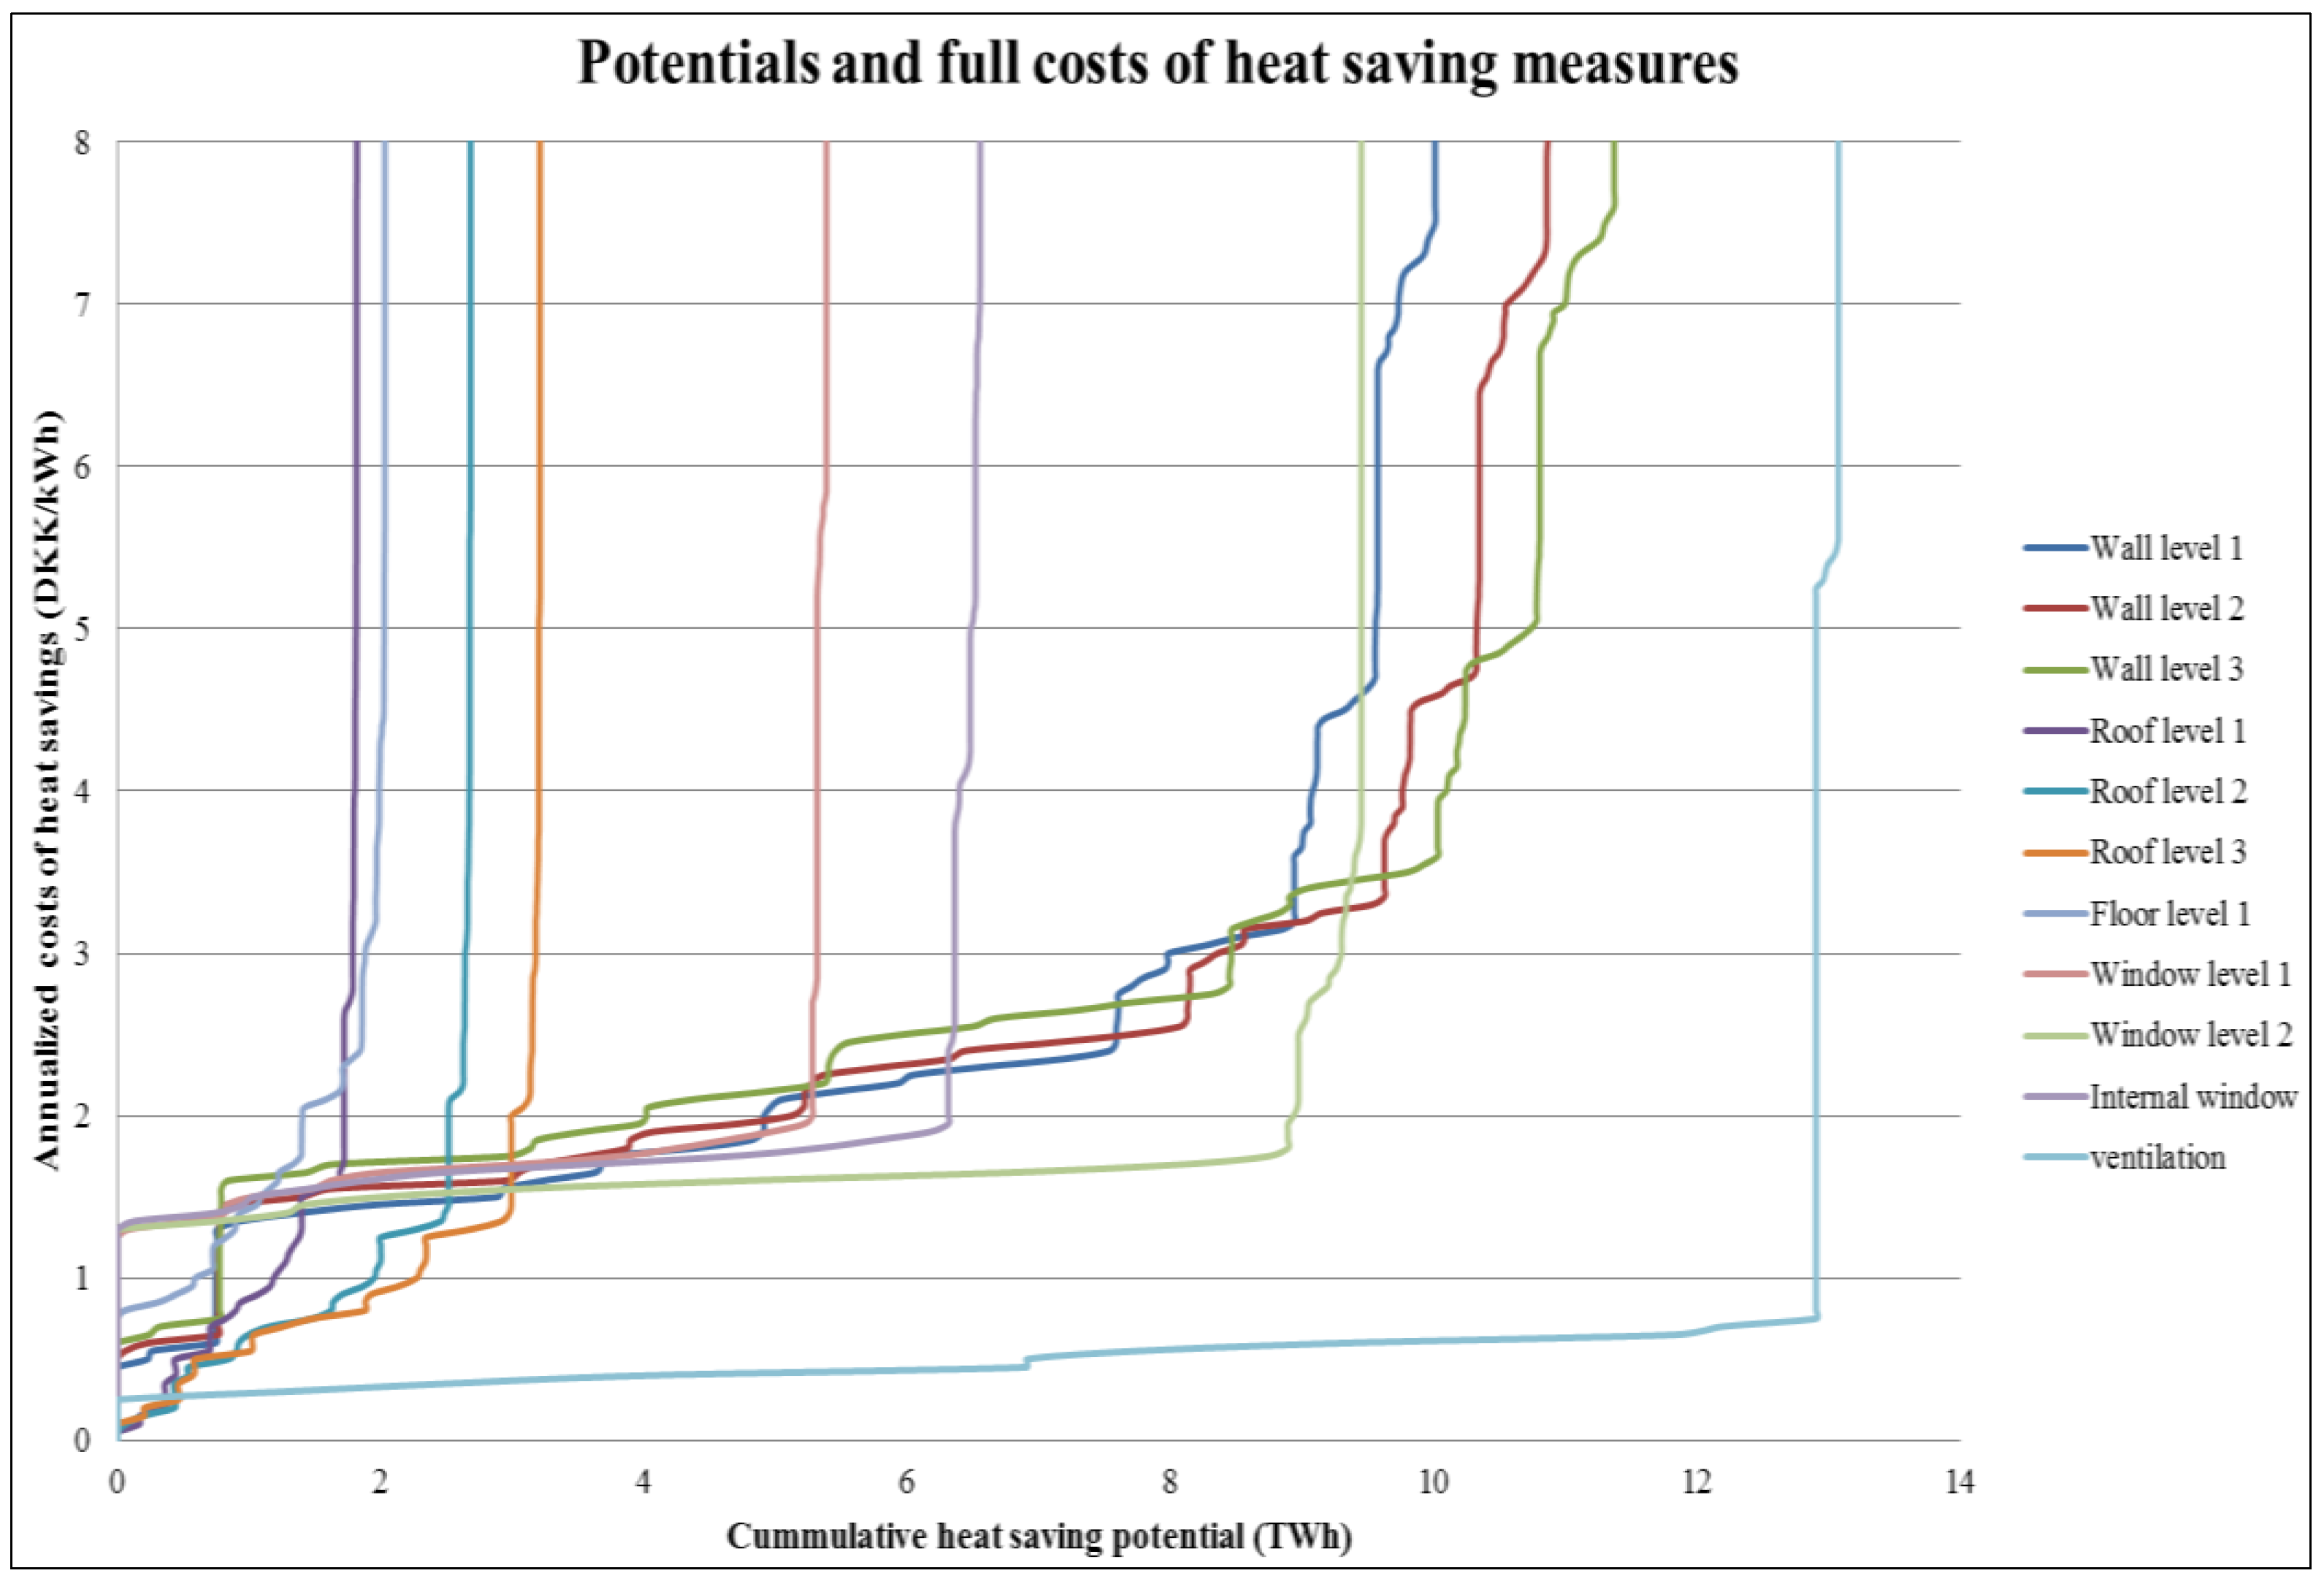
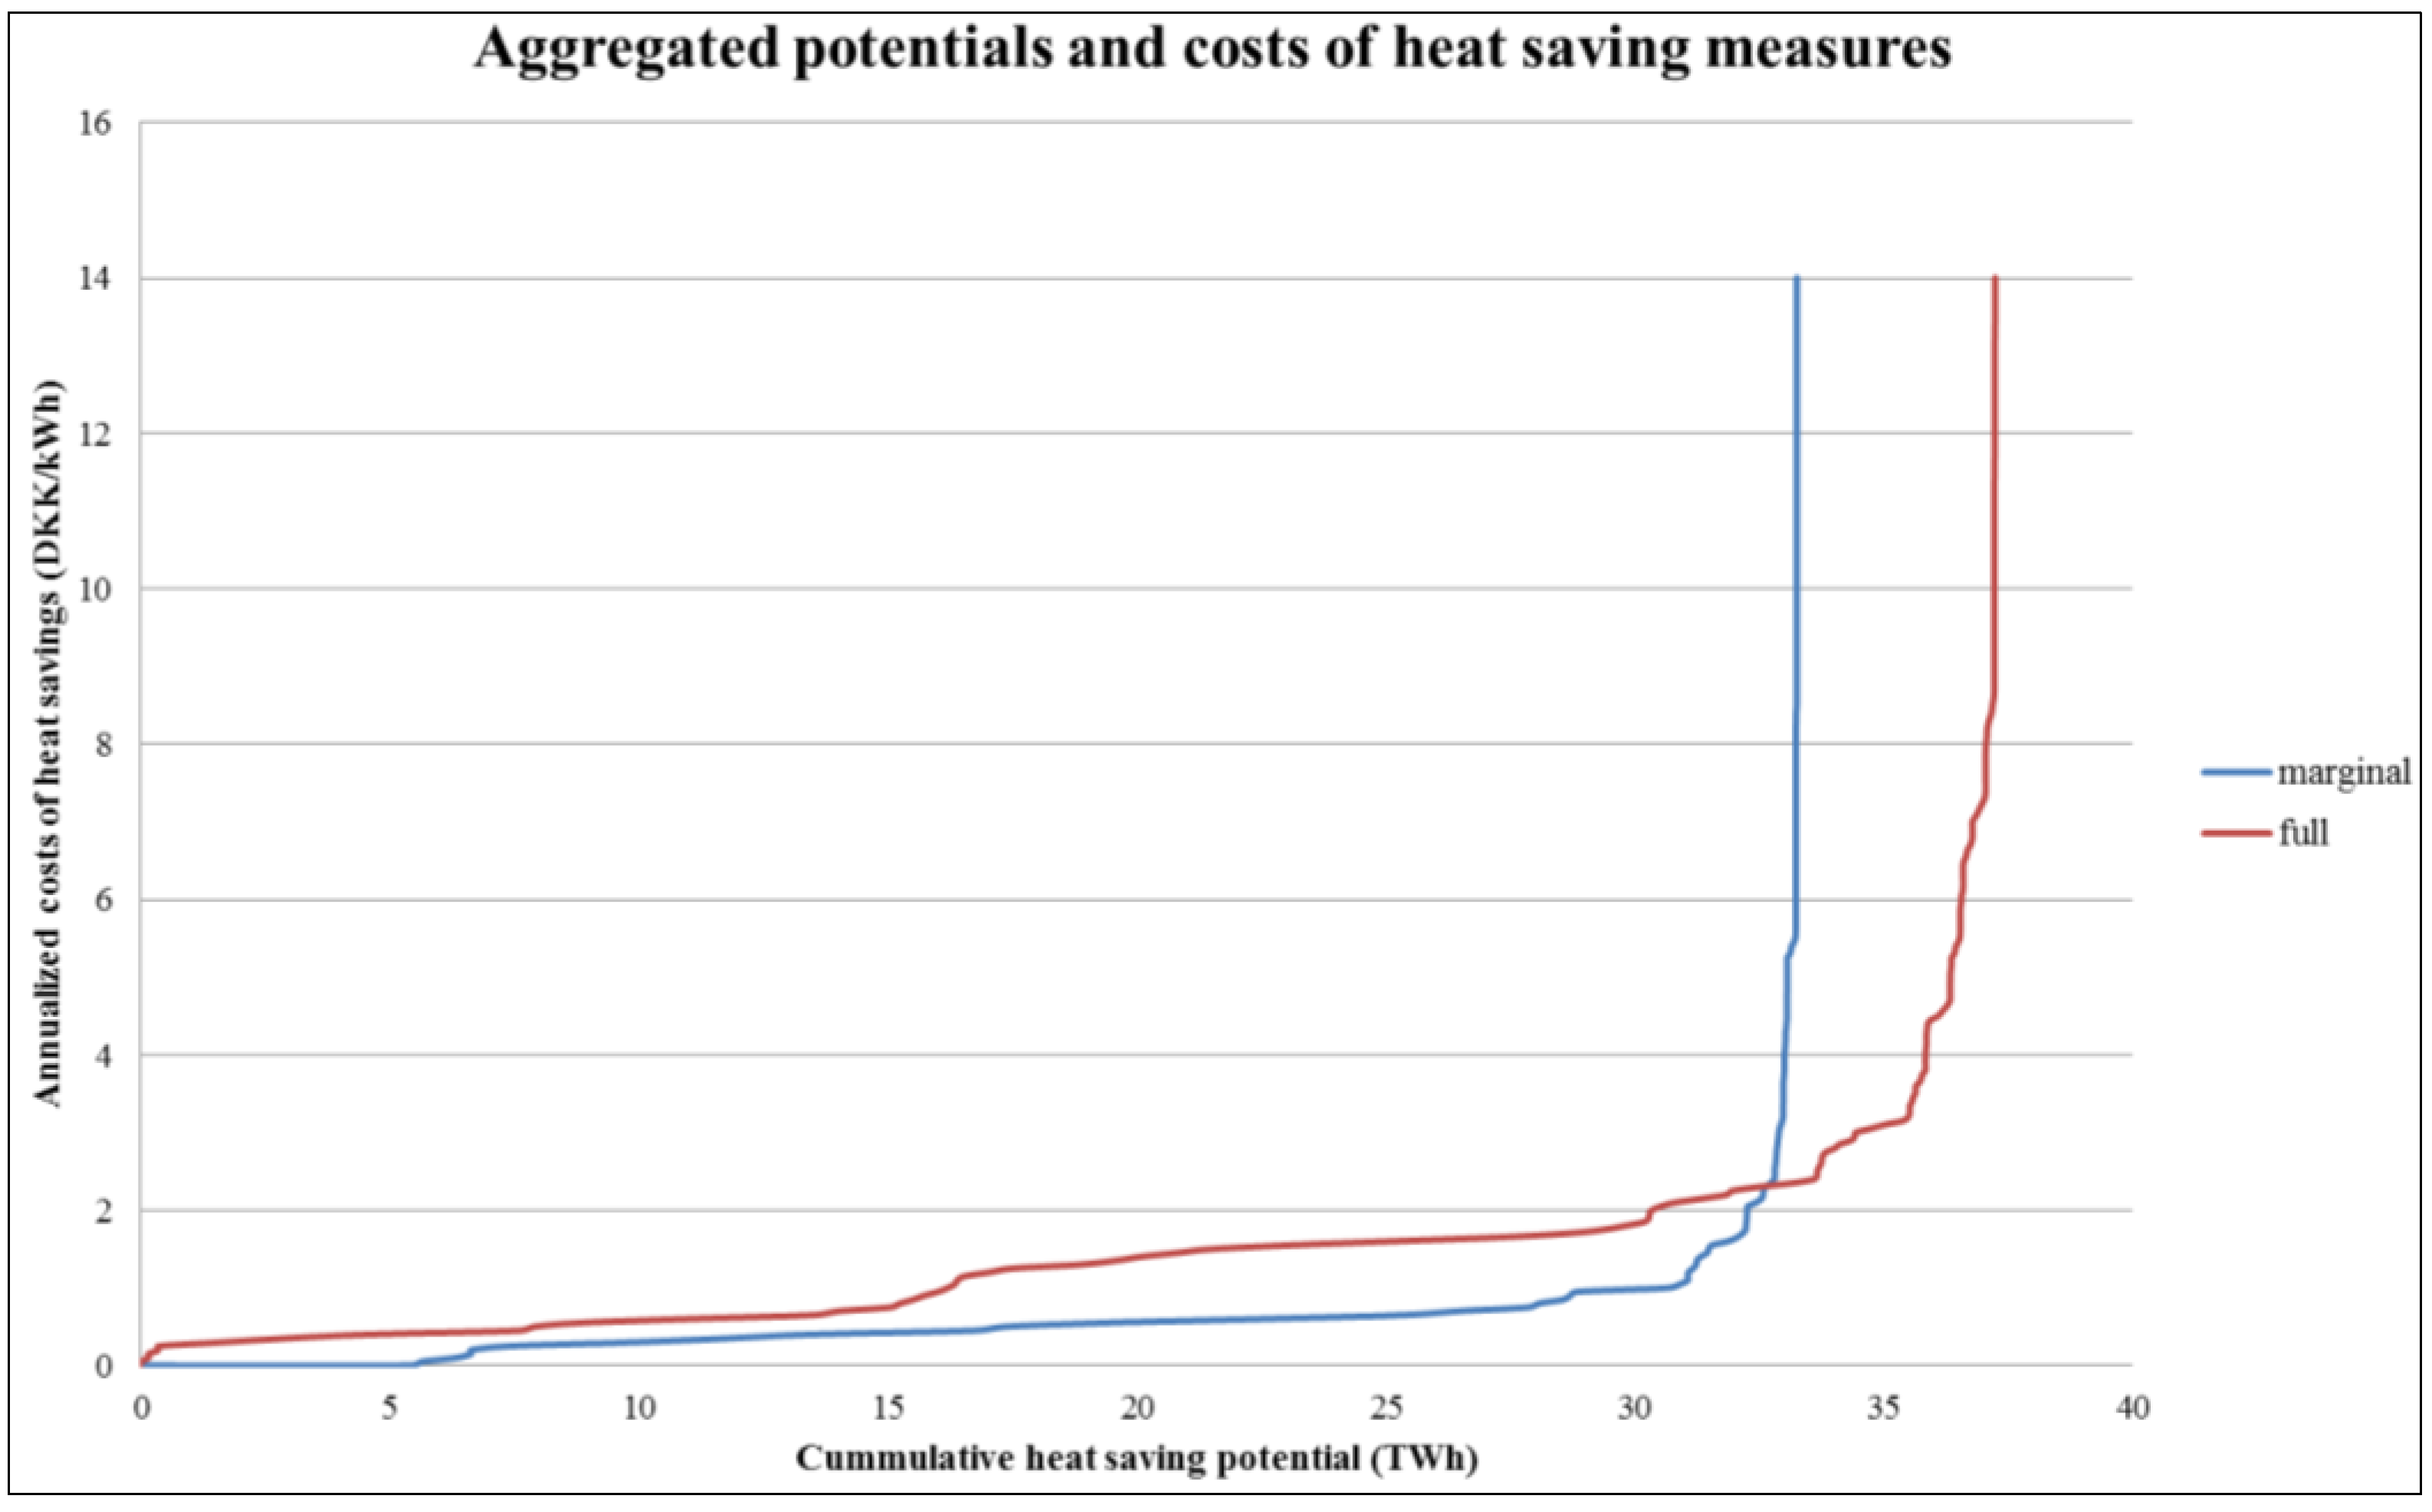
 ) for all buildings, the next step in the analysis is to answer the question “How big is the potential for heat savings?”. In order to provide an answer to this question, marginal cost curves have been created (It is important to make a clear distinction between marginal cost curves and marginal costs. Marginal cost curves show the costs of savings next to the unit of energy, while marginal costs denote the costs of heat saving measures when a scheduled renovation is taking place). For each heat saving level of each element on all buildings included in the analysis, costs have been sorted from the least to the most expensive one. These curves are presented in Figure 2 and Figure 3. Curves showing potentials and costs for energy savings in domestic hot water are not presented in Figure 2 and Figure 3, due to the small potential (0.1 TWh), even though they show moderate costs (around 1 DKK per saved kWh). After picking only the most profitable (the smallest amount of money that is needed to save 1 kWh of heat) heat saving measure for each element on all buildings, the curves in Figure 4 are obtained. This analysis allows for the possibility that on the same element in the same building, one level of savings appears more profitable when a scheduled renovation is undertaken, while some other level appears more profitable when renovation is undertaken solely for the purpose of saving energy. For example, it is possible that adding 100 mm of insulation on walls (level 1) appears as the optimal solution if marginal costs are calculated and 300 mm if full costs are considered. As a result of that, the total potential when renovation for energy saving purposes is considered is 12% higher than in the case of a scheduled renovation, as presented in Figure 4.
5. Analysis of Results

6. Conclusions
Nomenclature
Indices
| c | construction year group |
| u | usage group |
| t | temperature region group |
| m | month in heating season |
| elem | element of building envelope |
| new | property of building after renovation |
| old | property of building before renovation |
Inputs
| uelem | u-value for a specific element of the building envelope |
| 𝐴 | heated floor area of a specific building |
| felem | ratio between the area of a specific building element and the heated area of the building |
| tind | indoor temperature |
| tout | average monthly outdoor |
| | temperature heat loss reduction factor |
| dm | number of days with heating in months m |
| ƞ | efficiency of heat recovery |
| n | air exchange rate (h−1) |
| H | average room height |
| pi | internal heat gain per unit of area |
| ƞh | utilization factor of heat gains |
| q | heat consumption for domestic hot water per heated area of office/public buildings |
| q | heat consumption for domestic hot water per apartment in residential buildings |
| r | average area of household |
| 𝐹s | shadowing reduction factor |
| 𝐹a | glass area reduction factor |
| 𝐹g | solar transmittance reduction factor |
| psol | average solar radiation per unit of window area |
Outputs
| Qheat | annual net heat demand for space heating and domestic hot water |
| Qtr | annual transmission losses through the building envelope |
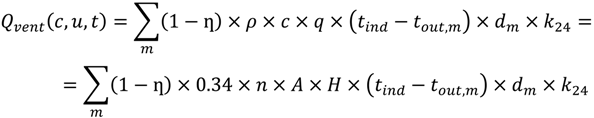
| Qvent | annual ventilation losses |
| Qadd | annual heat gains |
| QDHW | annual demand for the preparation of domestic hot water |
| Qint | internal heat gain from electrical appliances and human body heat |
| Qsol | heat gain from solar radiation |
| Q | annual demand for the preparation of domestic hot water in office/public buildings |
| Q | annual demand for the preparation of domestic hot water in residential buildings |
Constants
| k24 | W to kWh conversion coefficient |
| c | thermal capacity of indoor air |
| ρ | density of indoor air |
Acknowledgments
Author Contributions
Conflicts of Interest
References
- Danish Energy Agency (DEA). Energy Statistics 2011; Danish Energy Agency (DEA): Copenhagen, Denmark, 2012.
- Lund, H. Introduction. In Renewable Energy Systems: The Choice and Modeling of 100% Renewable Solutions; Academic Press (Elsevier): Burlington, VT, USA, 2010; pp. 1–12. [Google Scholar]
- Svendsen, S.; Tommerup, H. Energy savings in Danish residential building stock. Energy Build. 2006, 38, 618–626. [Google Scholar] [CrossRef]
- Nielsen, S.; Möller, B. Excess heat production of future net zero energy buildings within district heating areas in Denmark. Energy 2012, 48, 23–31. [Google Scholar] [CrossRef]
- Munster, M.; Morthorst, P.E.; Larsen, H.V.; Bregnbaek, L.; Werling, J.; Lindboe, H.H.; Ravn, H. The role of district heating in the future Danish energy system. Energy 2012, 48, 47–55. [Google Scholar] [CrossRef]
- Moller, B.; Lund, H. Conversion of individual natural gas to district heating: Geographical studies of supply costs and consequences for the Danish energy system. Appl. Energy 2010, 87, 1846–1857. [Google Scholar] [CrossRef]
- Lund, H.; Moller, B.; Mathiesen, B.V.; Dyrelund, A. The role of district heating in future renewable energy systems. Energy 2010, 35, 1381–1390. [Google Scholar] [CrossRef]
- European Commission. Directive 2009/28/EC of the European Parliament and of the Council of 23 April 2009 on the promotion of the use of energy from renewable sources and amending and subsequently repealing directives 2001/77/EC and 2003/30/EC. Off. J. Eur. Union 2009, L140, 16–62. [Google Scholar]
- Möller, B. A heat atlas for demand and supply management in Denmark. Manag. Environ. Qual.: Int. J. 2008, 19, 467–479. [Google Scholar]
- Sperling, K.; Moller, B. End-use energy savings and district heating expansion in a local renewable energy system—A short-term perspective. Appl. Energy 2012, 92, 831–842. [Google Scholar] [CrossRef]
- Wittchen, K.B. Energy Calculations. In Assessment of the Potential for Heat Savings in Existing Dwellings; Danish Building Research Institute: Hørsholm, Denmark, 2004; pp. 40–42. (In Danish) [Google Scholar]
- Næraa, R.; Karlsson, K. Appendix; Heat Loss from Buildings—Computation of k-Values for SESAM-Computations; Department of Civil Engineering, Technical University of Denmark: Lyngby, Denmark, 1998; pp. 17–37. (In Danish) [Google Scholar]
- Wang, P.W. Reference Values. In Technical Report 12-22-Reference Values: Hourly, Monthly and Yearly Values for Temperature, Relative Humidity, Wind Speed, Global Radiation and Precipitation for Regions and the Whole Country Denmark, in Period 2001–2010; Danish Meteorological Institute (DMI): Copenhagen, Denmark, 2013; pp. 6–8. (In Danish) [Google Scholar]
- Christensen, K. Calculation of Heat Demand. In Calculation of Gross Energy. Simplified Calculation. Teaching Notes; Department of Civil Engineering, Technical University of Denmark: Lyngby, Denmark, 2004; pp. 4–11. (In Danish) [Google Scholar]
- Kragh, J.; Wittchen, K.B. Calculation Assumptions. In Energy Demand of Danish Buildings in 2050. SBi 2010:56; Danish Building Research Institute: Copenhagen, Denmark, 2010; pp. 9–10. (In Danish) [Google Scholar]
- Tommerup, H.; Laustsen, J.B. Energy Saving Measures in Public Buildings. In Energy Savings in Buildings of Public Sector; Department of Civil Engineering, Technical University of Denmark: Lyngby, Denmark, 2008; pp. 10–39. (In Danish) [Google Scholar]
- Wittchen, K.B.; Kragh, J. Annex II—Display Sheets. In Danish Building Typologies. Participation in the TABULA Project. SBi 2012:01; Danish Building Research Institute: Copenhagen, Denmark, 2010; pp. 38–91. [Google Scholar]
- Wittchen, K.B.; Aggerholm, S. Calculation of building heating demand in EPIQR. Energy Build. 2000, 31, 137–141. [Google Scholar] [CrossRef]
- Wittchen, K.B.; Mortensen, L.; Holøs, S.B.; Björk, N.F.; Vares, S.; Malmqvist, T. Available Information in the Nordic Countries. Annex 1—Denmark. In Building Typologies in the Nordic Countries. Identification of Potential Energy Saving Measures. SBi 2012:04; Danish Building Research Institute: Copenhagen, Denmark, 2012; pp. 8–40. [Google Scholar]
- Bøhm, B.; Schrøder, F.; Bergsøe, N.C. Appendix; Domestic Hot Water. Measuring Consumption and Heat Losses from the Circulation Pipes. SBi 2009:10; Danish Building Research Institute: Copenhagen, Denmark, 2009; pp. 11–210. [Google Scholar]
- Bøhm, B. Production and distribution of domestic hot water in selected Danish apartment buildings and institutions. Analysis of consumption, energy efficiency and the significance for energy design requirements of buildings. Energy Convers. Manag. 2013, 67, 152–159. [Google Scholar] [CrossRef]
- Dyrelund, A.; Fafner, K.; Ulbjerg, F.; Rambøll Danmark; Aalborg University. Statistics and Prognosis. In Heat Plan for Denmark. Appendix Report; Rambøll and Aalborg University: Copenhagen, Denmark, 2010; pp. 173–186. (In Danish) [Google Scholar]
- Tommerup, H.M. Energy Saving Mesures in the Existing Buildings. In Energy Savings in Existing and New Buildings; Department of Civil Engineering, Technical University of Denmark: Lyngby, Denmark, 2004; pp. 17–43. (In Danish) [Google Scholar]
- Wittchen, K.B. Scenarios for Energy Savings. In Potentials for Energy Savings in Existing Buildings. SBi 2009:05; Danish Building Research Institute: Copenhagen, Denmark, 2009; pp. 17–34. (In Danish) [Google Scholar]
- Tommerup, H.M. Isolation of Building Envelope. Windows. In Energy Renovation Measures. Catalogue; Department of Civil Engineering, Technical University of Denmark: Lyngby, Denmark, 2010; pp. 10–15. (In Danish) [Google Scholar]
- Danish Energy Agency. Updated Sheet on Discount Rates, Lifetime and Reference for Guidelines for Socio-Economic Analyzes of Energy from April 2005 (Calculation Examples Revised July 2007). (In Danish)Available online: http://www.ens.dk/sites/ens.dk/files/info/tal-kort/fremskrivninger-analyser-modeller/samfundsoekonomiske-analysemetoder/notat_om_kalkulationsrenten_juni_2013.pdf (accessed on 27 October 2013).
- Ostergaard, P.A.; Mathiesen, B.V.; Moller, B.; Lund, H. A renewable energy scenario for Aalborg Municipality based on low-temperature geothermal heat, wind power and biomass. Energy 2010, 35, 4892–4901. [Google Scholar]
- Lund, H.; Mathiesen, B.V. Energy system analysis of 100% renewable energy systems—The case of Denmark in years 2030 and 2050. Energy Oxf. 2009, 34, 524–531. [Google Scholar] [CrossRef]
- Mathiesen, B.V.; Lund, H.; Norgaard, P. Integrated transport and renewable energy systems. Util. Policy 2008, 16, 107–116. [Google Scholar] [CrossRef]
- Gram-Hanssen, K. Existing buildings—Users, renovations and energy policy. Renew. Energy 2013, 61, 136–140. [Google Scholar] [CrossRef]
- Loulou, R.; Labriet, M. ETSAP-TIAM: The TIMES integrated assessment model Part I: Model structure. Comput. Manag. Sci. 2008, 5, 7–40. [Google Scholar] [CrossRef]
- Loulou, R. ETSAP-TTAM: The TIMES integrated assessment model Part II: Mathematical formulation. Comput. Manag. Sci. 2008, 5, 41–66. [Google Scholar] [CrossRef]
- Balyk, O.; Hedegaard, K. Energy system investment model incorporating heat pumps with thermal storage in buildings and buffer tanks. Energy 2013, 63, 356–365. [Google Scholar] [CrossRef]
- Zvingilaite, E. Modelling energy savings in the Danish building sector combined with internalisation of health related externalities in a heat and power system optimisation model. Energy Policy 2013, 55, 57–72. [Google Scholar] [CrossRef]
© 2014 by the authors; licensee MDPI, Basel, Switzerland. This article is an open access article distributed under the terms and conditions of the Creative Commons Attribution license (http://creativecommons.org/licenses/by/3.0/).
Share and Cite
Petrovic, S.; Karlsson, K. Model for Determining Geographical Distribution of Heat Saving Potentials in Danish Building Stock. ISPRS Int. J. Geo-Inf. 2014, 3, 143-165. https://doi.org/10.3390/ijgi3010143
Petrovic S, Karlsson K. Model for Determining Geographical Distribution of Heat Saving Potentials in Danish Building Stock. ISPRS International Journal of Geo-Information. 2014; 3(1):143-165. https://doi.org/10.3390/ijgi3010143
Chicago/Turabian StylePetrovic, Stefan, and Kenneth Karlsson. 2014. "Model for Determining Geographical Distribution of Heat Saving Potentials in Danish Building Stock" ISPRS International Journal of Geo-Information 3, no. 1: 143-165. https://doi.org/10.3390/ijgi3010143
APA StylePetrovic, S., & Karlsson, K. (2014). Model for Determining Geographical Distribution of Heat Saving Potentials in Danish Building Stock. ISPRS International Journal of Geo-Information, 3(1), 143-165. https://doi.org/10.3390/ijgi3010143