Article

Nonlinearity and Scale Effects: How the Built Environment Modulates Urban Vitality in Multi-Scale Community Life Circles Across Weekdays and Weekends

Jangho Architecture College, Northeastern University, Shenyang 110169, China
*
Author to whom correspondence should be addressed.
ISPRS Int. J. Geo-Inf. 2026, 15(5), 190; https://doi.org/10.3390/ijgi15050190
Submission received: 4 March 2026 / Revised: 18 April 2026 / Accepted: 29 April 2026 / Published: 30 April 2026

Abstract

Boosting urban vitality (UV) in residential living spaces has become a core component of advancing the people-centered urbanization strategy. However, previous research has mainly focused on exploring UV at the scales of streets, blocks, and grids, with few nonlinear explorations conducted across different temporal dimensions at the scale of residents’ daily life. Therefore, this article adopts the XGBoost-SHAP model to explore the nonlinear and interaction effects of a built environment (BE) on UV across multi-scale community life circles (CLC), distinguishing between daytime and nighttime on weekdays and weekends. The results indicate that UV on weekends is higher than on weekdays, except for 5 min CLC (5MCLC). UV is highest in 10 min CLC (10MCLC) and lowest in 5MCLC. The mean building height (MBH) and Normalized Difference Vegetation Index (NDVI) have always been the most important indicators affecting UV. Unlike previous studies, the green view index (GVI) and sky view factor (SVF) are negatively associated with UV. The nonlinear relationship between BE and UV on weekdays exhibits greater regularity. The effects of other BE indicators on UV exhibits spatiotemporal heterogeneity, with the relative influence changes in commercial accessibility (CA), distance to metro (DSM) and distance to bus (DSB) being the most significant. The nonlinear and threshold effects of BE on UV show significant changes, except for GVI, SVF, and NDVI, at different times and scales. The threshold for cultural and leisure accessibility (CLA) is higher on weekdays than on weekends, whereas that for DSM is higher on weekends than on weekdays. The interaction effects between the building density (BD) and MBH, park and square accessibility (PSA), and DSM is significant at different scales. This study will provide a scientific basis for optimizing BE and differentiated planning of CLC, which further contributes to enhancing UV and promoting urban sustainable development.

1. Introduction

Amidst accelerating urbanization and rising urban population densities, the “people-oriented” urban development strategy is garnering increasing emphasis. Enhancing urban vitality (UV) and optimizing the built environment (BE) constitute effective approaches to implementing the principle of “people-oriented”, and have become core objectives of modern urban governance [1]. The improvement of the BE level in the process of urbanization has long been considered to have a positive effect on social development [2,3]. As a material carrier of spatial activities, a reasonable level of BE (e.g., an appropriate building density, green view index, and public service facilities) can effectively enhance UV [4,5]. The enhancement of UV will further fully unlock the spatial service value of the BE. Therefore, an in-depth investigation into how the BE effects UV is highly significant for enhancing urban livability and promoting the sustainable development of cities.
Jacobs was the first to propose from a behavioral perspective that UV originates from the interweaving of human activities and activity spaces [6]. Kevin Lynch defined UV from a morphological perspective as “the degree of support for the functions of life, ecological requirements, and human capabilities” [7]. Gehl et al. argued from the perspective of urban sociology that UV refers to “people’s activities in urban spaces” [8]. Montgomery pointed out that vibrant areas are essentially spaces that are capable of attracting crowds and hosting a rich array of social activities through diverse facilities [9]. Despite the diverse perspectives of these classical theories, they all elucidate the essence of UV, which derives from the interaction between people and the BE.
In early research, scholars employed traditional empirical assessment methods such as questionnaire surveys and case studies to quantify UV. However, such data suffer from inherent limitations, including narrow spatial coverage, low update frequency, and inadequate assessment accuracy [10,11]. In recent years, the emergence of big data has offered a viable opportunity to mitigate this research gap. For example, some scholars construct a multi-category vitality classification atlas, collect time-series video data across multiple urban areas, and apply such video data to deep learning tasks for quantitative data acquisition [12]. Some scholars have constructed a dynamic vitality assessment model based on multi-source location service data and nighttime light data, effectively capturing the temporal variation characteristics of UV across different time periods [13,14]. Among them, location-based service data are widely adopted, as they directly reflect the spatial distribution of human activities, including mobile phone signaling data [15], Wi-Fi hotspot access data [16], social media check-in data [17], and other such data. This study adopts Baidu heat map data, which is capable of characterizing the dynamic spatial distribution of an urban population. It involves tracking user accounts of Baidu’s applications via multi-source positioning technology, achieving a positioning accuracy down to the coordinate point level. These data are suitable for fine-grained spatial research at the microscale [18].
Past research on UV and BE has primarily focused on scales such as streets, blocks, and grids, exploring the effects of BE on UV by analyzing factors including the spatial morphology and the overall functional layout [5,19]. However, in recent years, the urbanization process has shifted from rapid growth to high-quality development [20]. Urban planning has gradually shifted from a “location-oriented” approach to a “people-oriented” development philosophy [21]. More and more studies are shifting their focus to the shaping of residents’ daily living spaces at the microscale [1,22]. The “Neighborhood Unit” theory proposed by American planning scholar Perry in 1929 first clarified the people-oriented planning concept. This theory addressed issues such as chaotic living environments and traffic congestion arising during rapid urban expansion by constructing independent and complete “micro-communities” [23]. Building on the theoretical underpinnings of the “Neighborhood Unit”, Moreno was the first to advance the “15 min city” concept [24]. It calls for the development of a safe, inclusive and sustainable urban environment. Thus, exploring the correlation between BE and UV at the scale of residents’ daily activities provides crucial support for the people-centered development philosophy.
Community Life Circle (CLC) is an emerging urban planning concept that has developed in recent years, and its core essence is closely aligned with the “15 min city” concept. It aims to establish self-sufficient communities within walking distance, integrating essential functions including living, employment, commerce, healthcare, education, and entertainment [25,26,27]. At the end of 2018, China issued the National Standard for Community Life Circle, which categorizes urban space into three pedestrian-scale tiers based on walking duration: 5 min, 10 min and 15 min [28]. CLC planning was first rolled out in Shanghai and has been explicitly designated as a key objective of urban development in the “Shanghai 2035” Master Plan. Subsequently, the planning was further promoted across multiple cities, including Guangzhou, Shenzhen and Tianjin [29]. Exploring the facilitative and constraining effects of micro-scale BE on residents’ daily activities from a bottom-up perspective has emerged as a key trend in contemporary research. However, scholarship that is closely linked to residents’ daily lives remains limited at the CLC scale. This study investigates the spatiotemporal heterogeneity in the effects of BE on UV at the CLC scale [30,31].
A substantial body of research has confirmed that the BE exerts a significant influence on UV [2,32,33]. Early research on the BE employed the “3D” framework (Density, Diversity, and Design) for its evaluation [34]. Ewing et al. expanded this framework and proposed the “5D” BE framework (density, design, diversity, destination accessibility, and traffic accessibility) for indicator selection [35,36]. However, these BE indicators focus solely on the physical dimension. With the advent of street view technology, it has become feasible to quantify variations in pedestrian spatial perception using eye-level 360° street view imagery [37]. For instance, perceptual indicators including the green view index and sky visibility have enriched the assessment dimensions of the BE. This perception of the environment from a human perspective is closely related [38] to walking activities within the CLC [39]. It directly reflects the effects of the BE on residents’ daily lives at the micro-scale.
In past studies, models such as Ordinary Least Squares (OLS) [40], Geographically Weighted Regression (GWR) [30], and Multiscale Geographically Weighted Regression (MGWR) [41] have often been employed to investigate the relationship between the BE and UV. Such models struggle to depict the intricate nonlinear relationships between the two and the interactions among various indicators [42]. The growing recognition of urban systems’ complexity has propelled machine learning into a major research focus in this field, due to its strength in modeling nonlinear relationships and uncovering complex interactions [43]. The XGBoost machine learning model is particularly adept at examining both the nonlinear relationships and the threshold effects of BE indicators. It can mitigate the overfitting risk via regularization term optimization, and is thus better suited for exploring the complex relationships between the BE and UV [44,45].
To address the existing gaps in scale, temporal dynamics, and model applicability, this study focuses on central Tianjin. We employ Baidu heatmap data to assess UV at the CLC scale and integrate street view imagery to construct a five-dimensional BE indicator system. This study applies the XGBoost-SHAP model to examine the nonlinear correlations and interactive effects between the built environment (BE) and UV across distinct CLC scales (5 min, 10 min, 15 min) and various time periods (weekdays/weekends, daytime/nighttime). The objectives are as follows: (1) to uncover the spatiotemporal distribution patterns of multi-scale UV; (2) to identify and compare the relative influence of core BE indicators influencing UV across different spatiotemporal dimensions; (3) to contrast the nonlinear effects and threshold effects of BE on UV across various spatiotemporal scenarios; and (4) to analyze the interactions among BE indicators across different scales. Due to the insufficient exploration of the temporal dimension in the existing research, this study focuses on comparing outcomes across multi-scale CLC and time periods, thereby providing new insights for BE optimization and CLC planning.

2. Materials and Methods

2.1. Study Area

Tianjin, a national municipality directly under the Central Government and a pivotal city in advancing the integrated development of the Beijing–Tianjin–Hebei region, recorded a permanent resident population of 13.64 million in 2024, accompanied by an urbanization rate of 86.01%. Having stepped into a mature stage of high-quality urbanization development, the city is now reorienting its urban development focus from extensive scale expansion to intensive quality enhancement. In early 2025, Tianjin issued relevant documents on further developing the CLC. Local governments are committed to advancing the high-quality development of residents’ daily living spaces from the perspective of CLC construction.
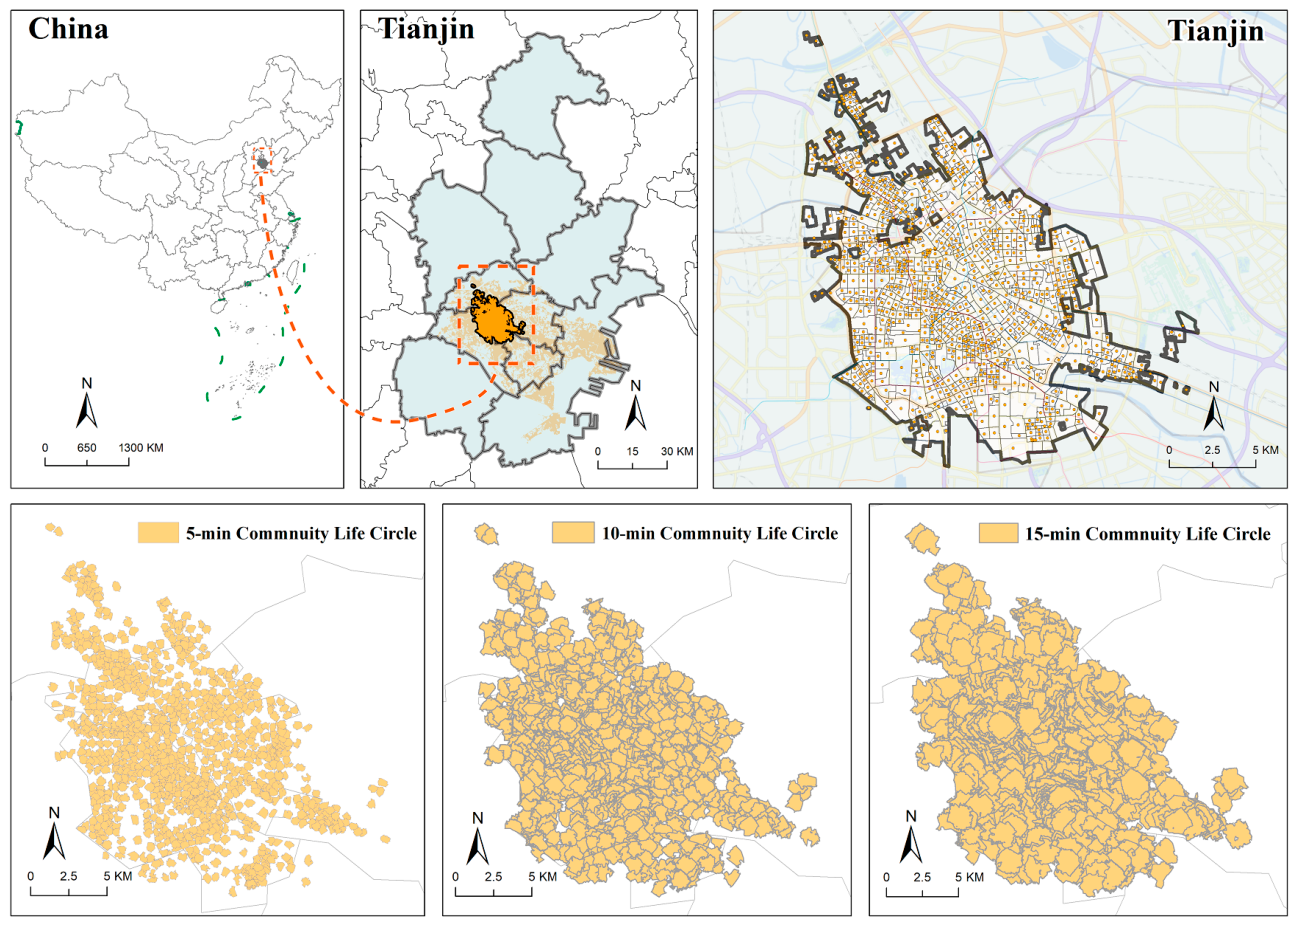
The built-up area of Tianjin is divided into the traditional urban core and the Binhai New Area. As a strategic leading area for the city’s economic development, the Tianjin Binhai New Area is still in the process of construction. In contrast, Tianjin’s traditional urban core encapsulates the city’s centuries-long historical and cultural traditions, acting as a pivotal zone characterized by a high population density and concentrated public service resources. Thus, the old urban area is selected as the study area for this study (Figure 1). This study utilizes geospatial big data and geospatial technology to select 990 communities in the old urban area of Tianjin, and delineate 5 min CLC (5MCLC), 10 min CLC (10MCLC) and 15 min CLC (15MCLC).

2.2. Classification of CLC and Research Framework

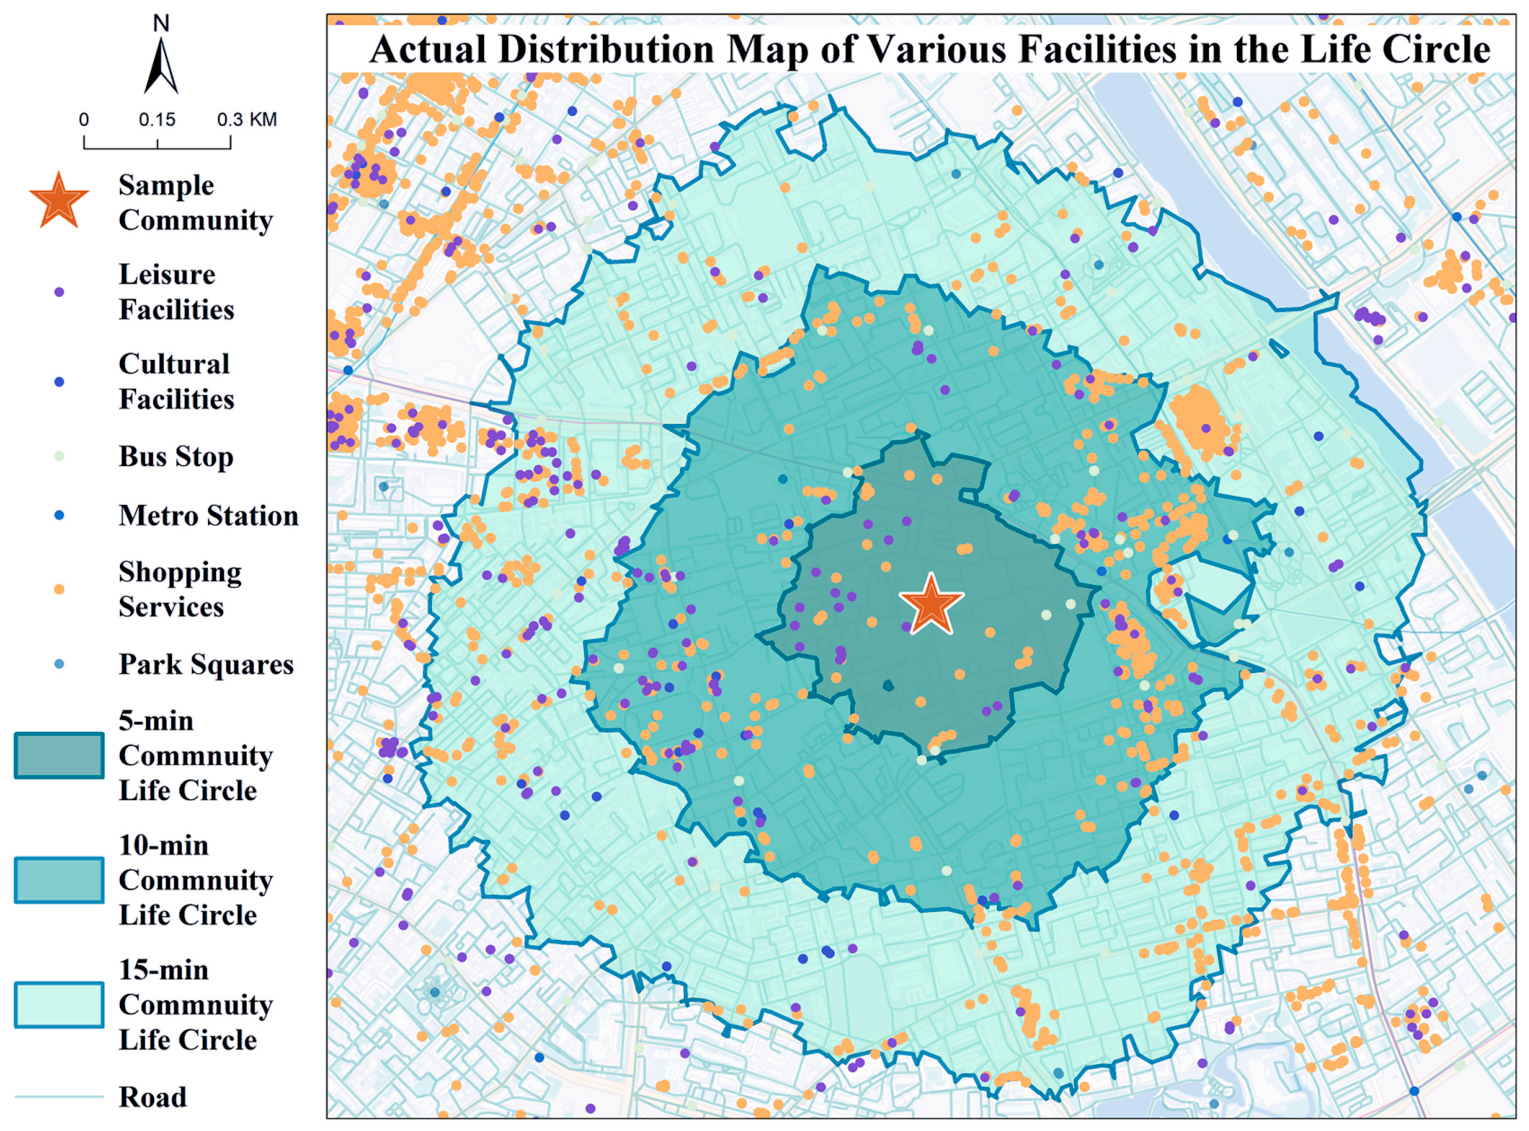
In urban planning, differentiated planning is typically implemented for community living circles of varying scales, based on the needs of residents at different tiers [46]. This study utilizes ArcGIS 10.8, in conjunction with the existing road network, to radiate outward the walking distances of residents under different time thresholds from the centroid of each community. It adopts distance thresholds of 400 m, 800 m, and 1200 m, with reference to the average walking speed of residents of 4.8 km/h [47]. We establish a network service area based on these thresholds and calculate the reachable areas. Finally, the 5MCLC, 10MCLC, and 15MCLC are determined (Figure 2). Compared to traditional buffer analysis, network service area analysis provides a more accurate representation of the spatial extent of residents’ social activities in microscale urban settings [30].
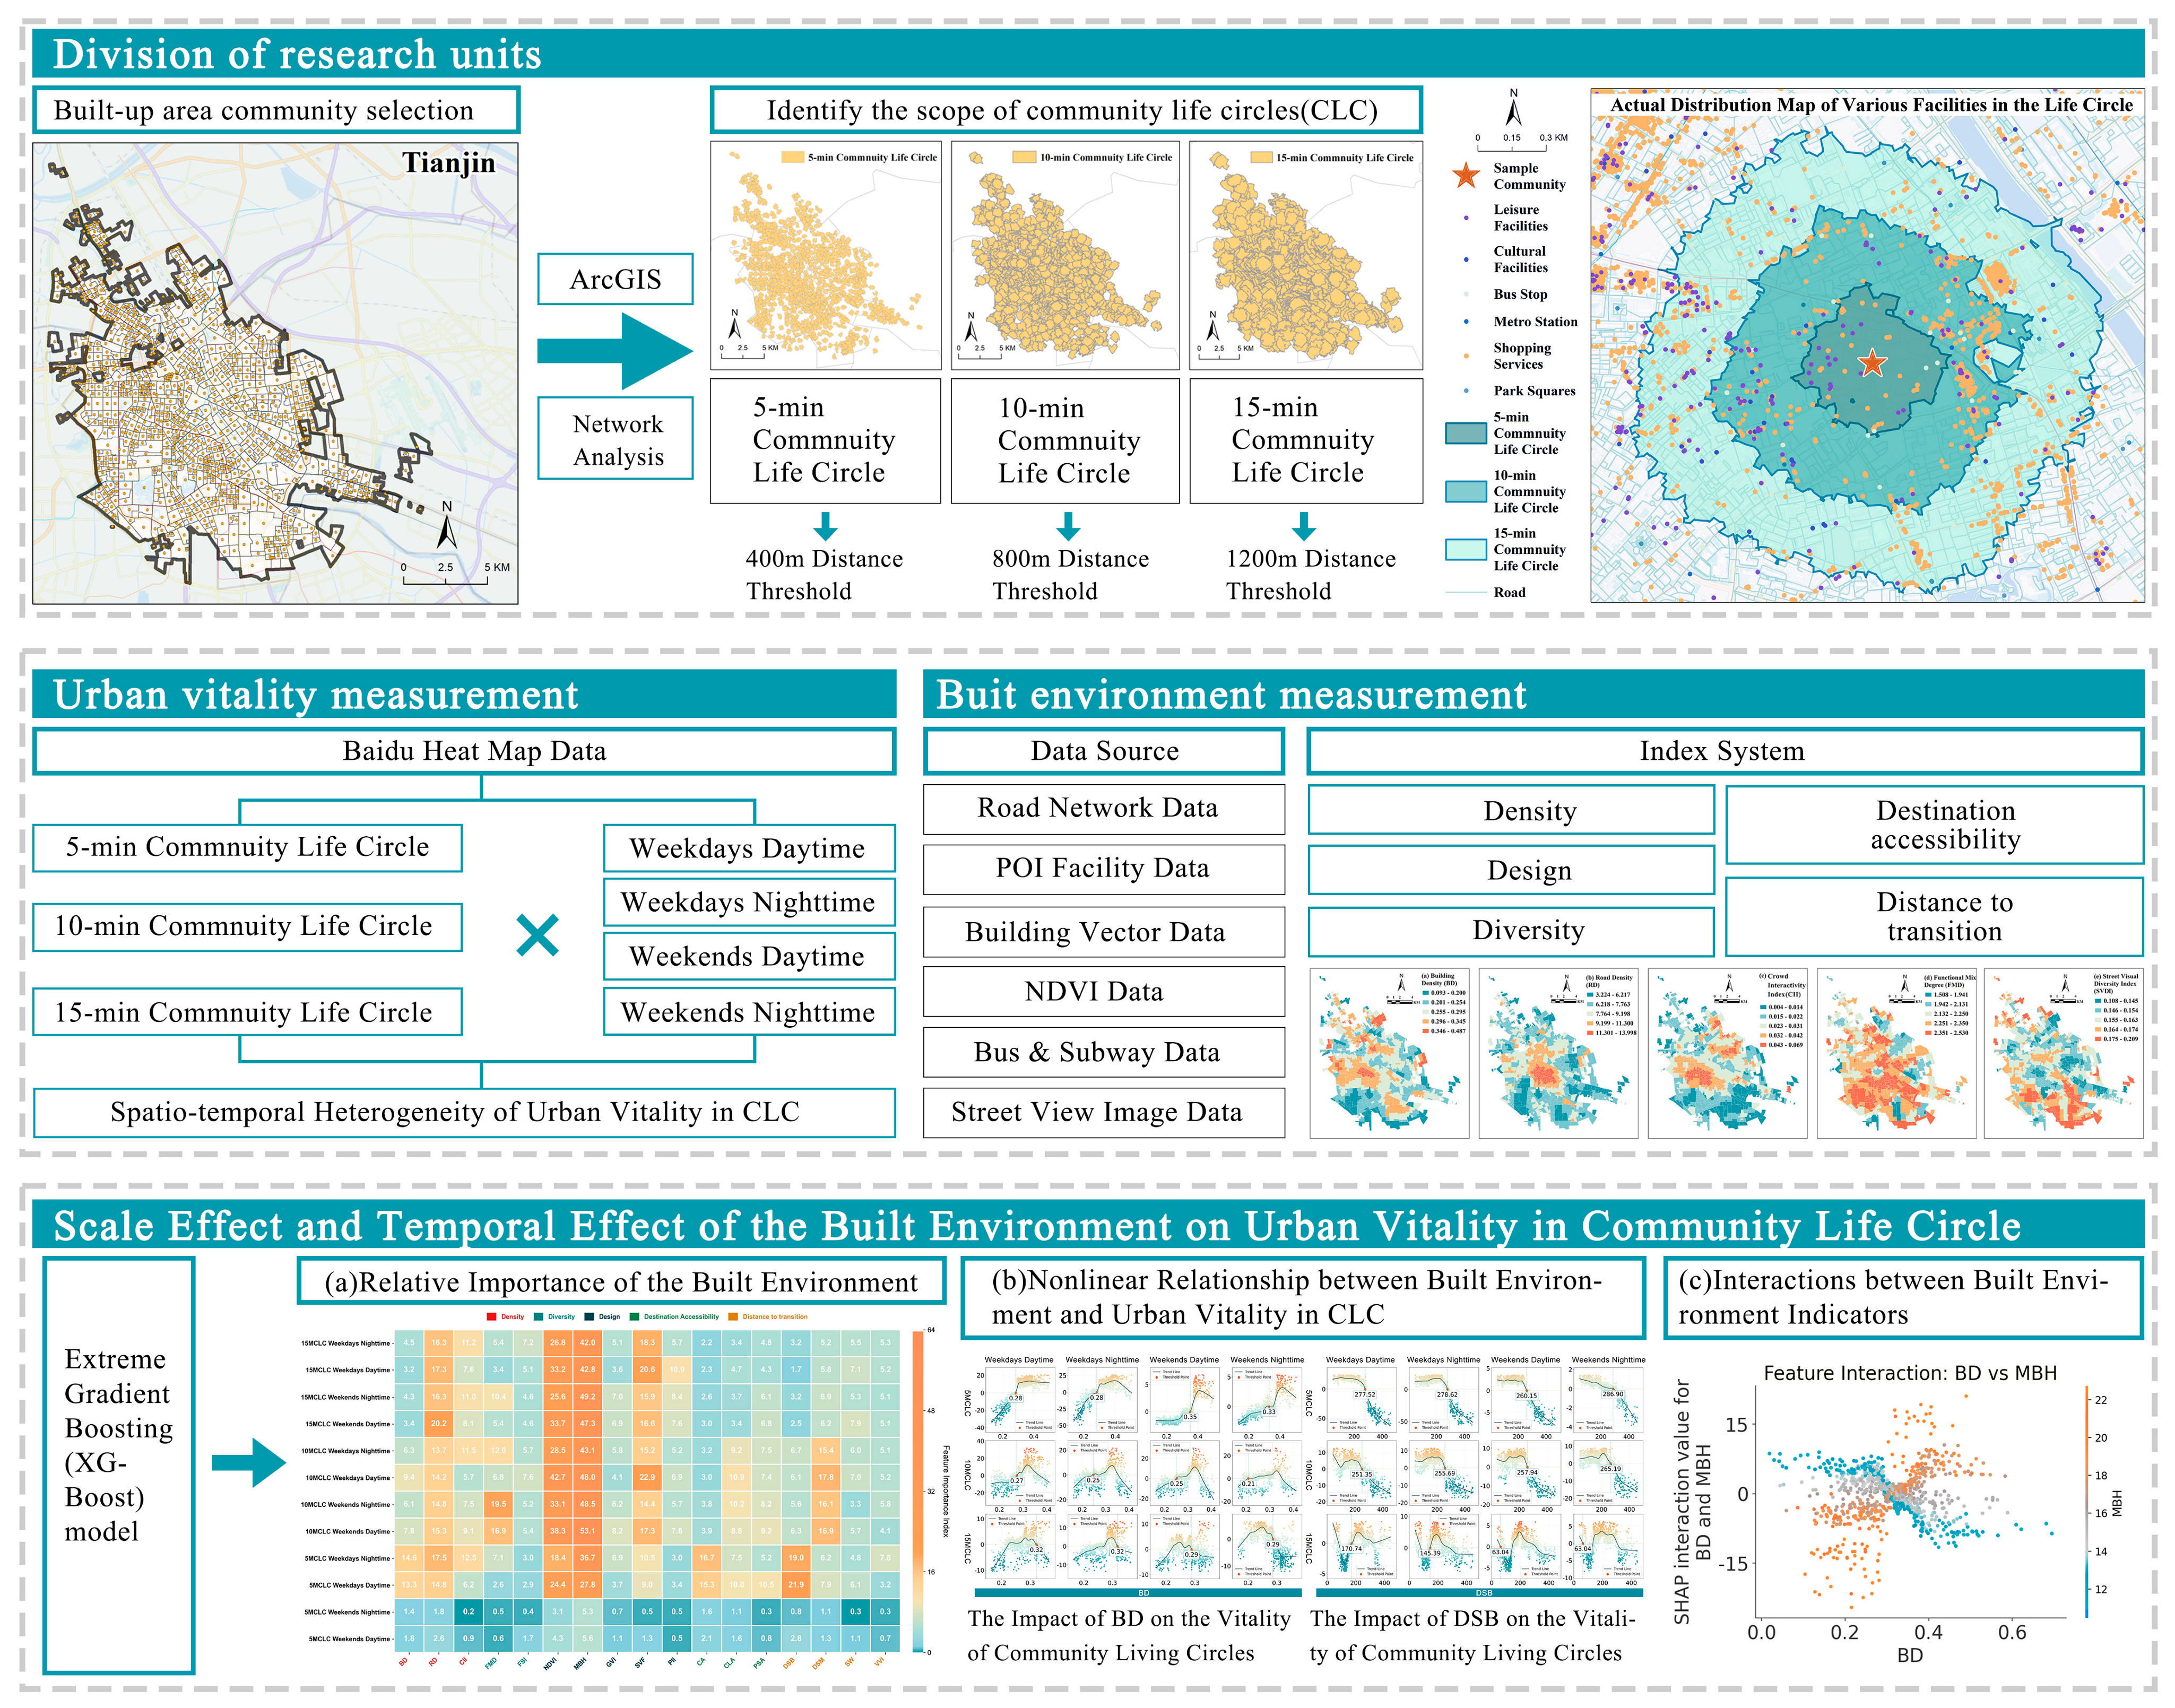
This study utilizes Baidu heatmap data to measure the UV of CLC at different scales across four distinct time periods. Drawing on the 5D BE framework and integrating street view imagery, we select 18 BE indicators to calculate the BE levels of CLC at different scales. The study conducts a comparative analysis on the spatial distribution characteristics of UV across different spatiotemporal dimensions. Secondly, it employs the XGBoost model to fit the nonlinear relationship between UV and BE, and utilizes the SHAP method to interpret the results of the XGBoost model. All model calculations are implemented using Python 3.9 (64-bit) and PyCharm 2024.1.7. Finally, it analyzes the interactive effects of BE indicators on UV across different CLC scales. Figure 3 illustrates the research framework of this paper.

2.3. Date Source

2.3.1. Urban Vitality

Urban population mobility directly determines the prosperity of a region, while population distribution and movement patterns constitute the core driving factors of UV [48]. This study quantifies UV by integrating Baidu Map heatmap data with multi-source positioning to map the dynamic spatial distribution of crowds. It utilizes heatmap data from the Baidu Map Open Platform (https://lbs.baidu.com/) and employs multi-source positioning technology to generate the dynamic spatial distribution of crowds, thereby measuring UV [30,49]. Specifically, we accessed the Baidu Heatmap API under the platform’s Web Services, which provide real-time, high-precision spatial distribution data of human activities in a structured format (CSV).
The raw data represent a set of discrete spatial point records, where each point corresponds to a specific geographic coordinate associated with a population intensity value. To aggregate these point-level observations into the polygon-based CLC units, we performed a spatial join operation within the ArcGIS 10.8. The UV Index ( V ) for each CLC was then calculated using the population density formula:
V = P A
where P denotes the total population intensity (sum of all points) within the CLC boundary, and A represents the area of the spatial unit. This method ensures that the vitality metric reflects the actual population intensity per unit area.
Unlike traditional demographic data, which suffers from inaccuracy, rigid boundaries, and infrequent updates, this method offers high spatiotemporal resolution, effectively capturing the spatial distribution, density, and dynamics of crowd activity [50]. Specifically, the analysis utilizes Baidu heatmap data from 40 representative days (21 weekdays and 19 weekend days) spanning December 2023 to November 2024, with one hourly record per day (24 records total per day) provided by the Baidu Heatmap API. The daily data are further segmented into daytime (8:00–12:00 on weekdays; 9:00–12:00 on weekends) and nighttime (13:00–21:00) periods. The 40 representative days cover all four seasons, and the overall average UV for each spatiotemporal scenario is computed to minimize the impact of seasonal variations on the results. Subsequently, the data are processed in ArcGIS 10.8 to calculate the average UV for 990 CLC within Tianjin’s traditional urban core.

2.3.2. Built Environment

Drawing on the “5D” framework (density, diversity, design, destination accessibility, and transportation accessibility), this study assesses the BE of CLC in Tianjin’s central city across all five dimensions, with indicators tailored to local conditions. Table 1 presents the BE indicators selected for this study.
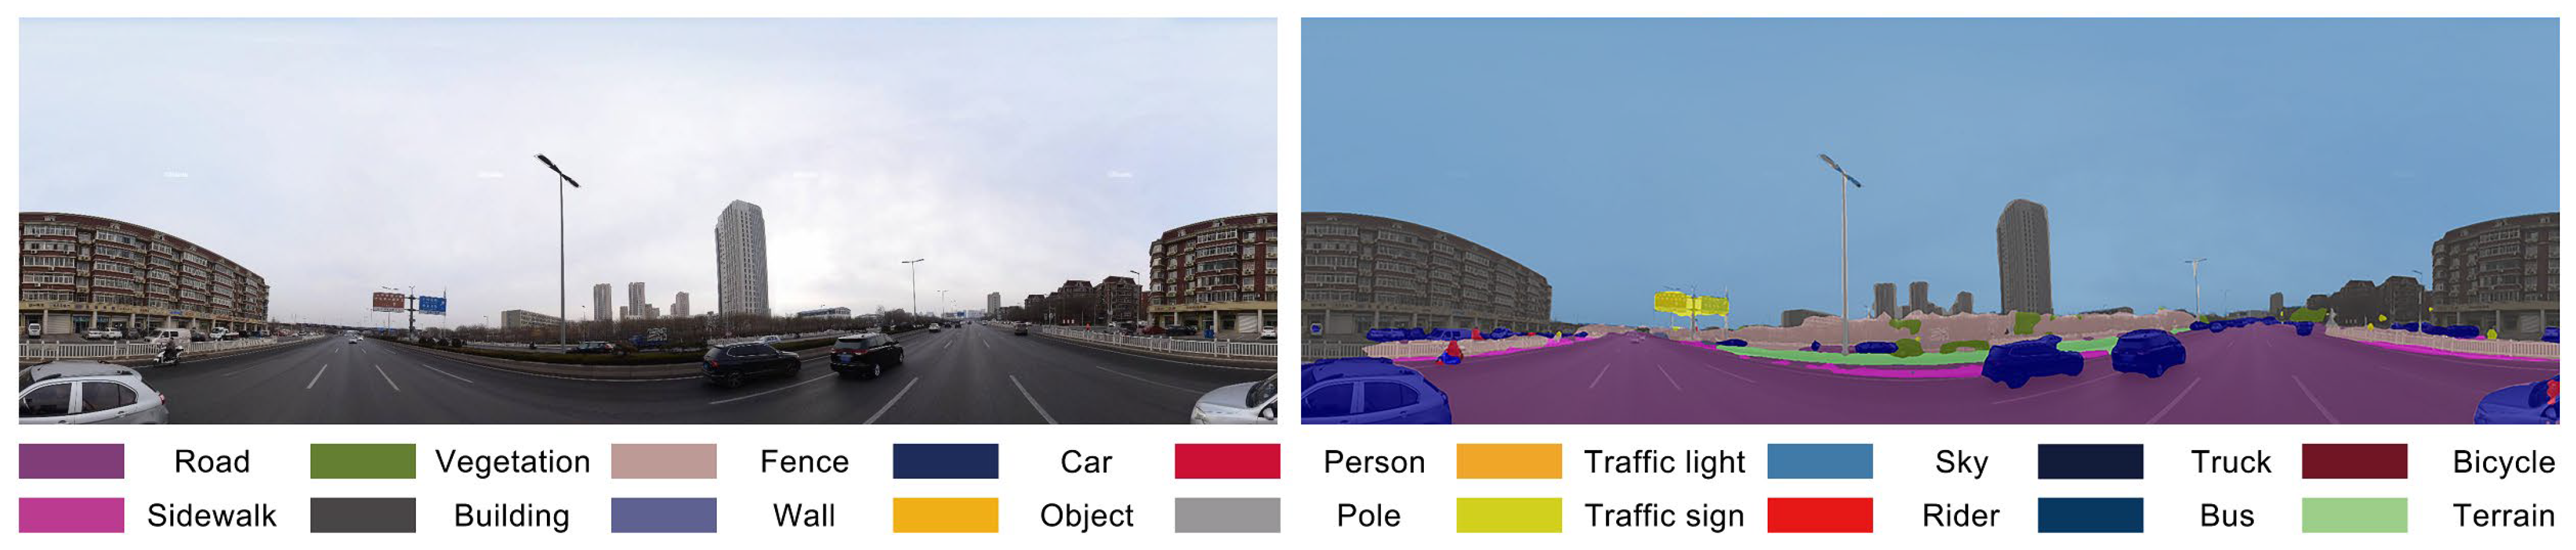
The BE data utilized in this study encompass street view image data, road network data, POI data, and Normalized Difference Vegetation Index (NDVI) data. Street view images are obtained by setting sampling points at 100 m intervals along the urban road network and capturing 360° panoramas through the Baidu Map Open Platform, with the latest timestamp of the images being February 2020. Compared with top-down imagery and four-directional street view images, this approach more accurately reflects pedestrians’ perceptual experience of the urban space. Notably, the study area is a mature urban zone with stable spatial morphology, and no large-scale urban renewal or construction activities occurred between February 2020 and the UV data collection period (December 2023–November 2024). From the captured panoramic images, street scene semantic data are generated by processing them with the PSPNet model, which is pre-trained on the Cityscapes dataset (Figure 4) [31,37,51,52,53,54].
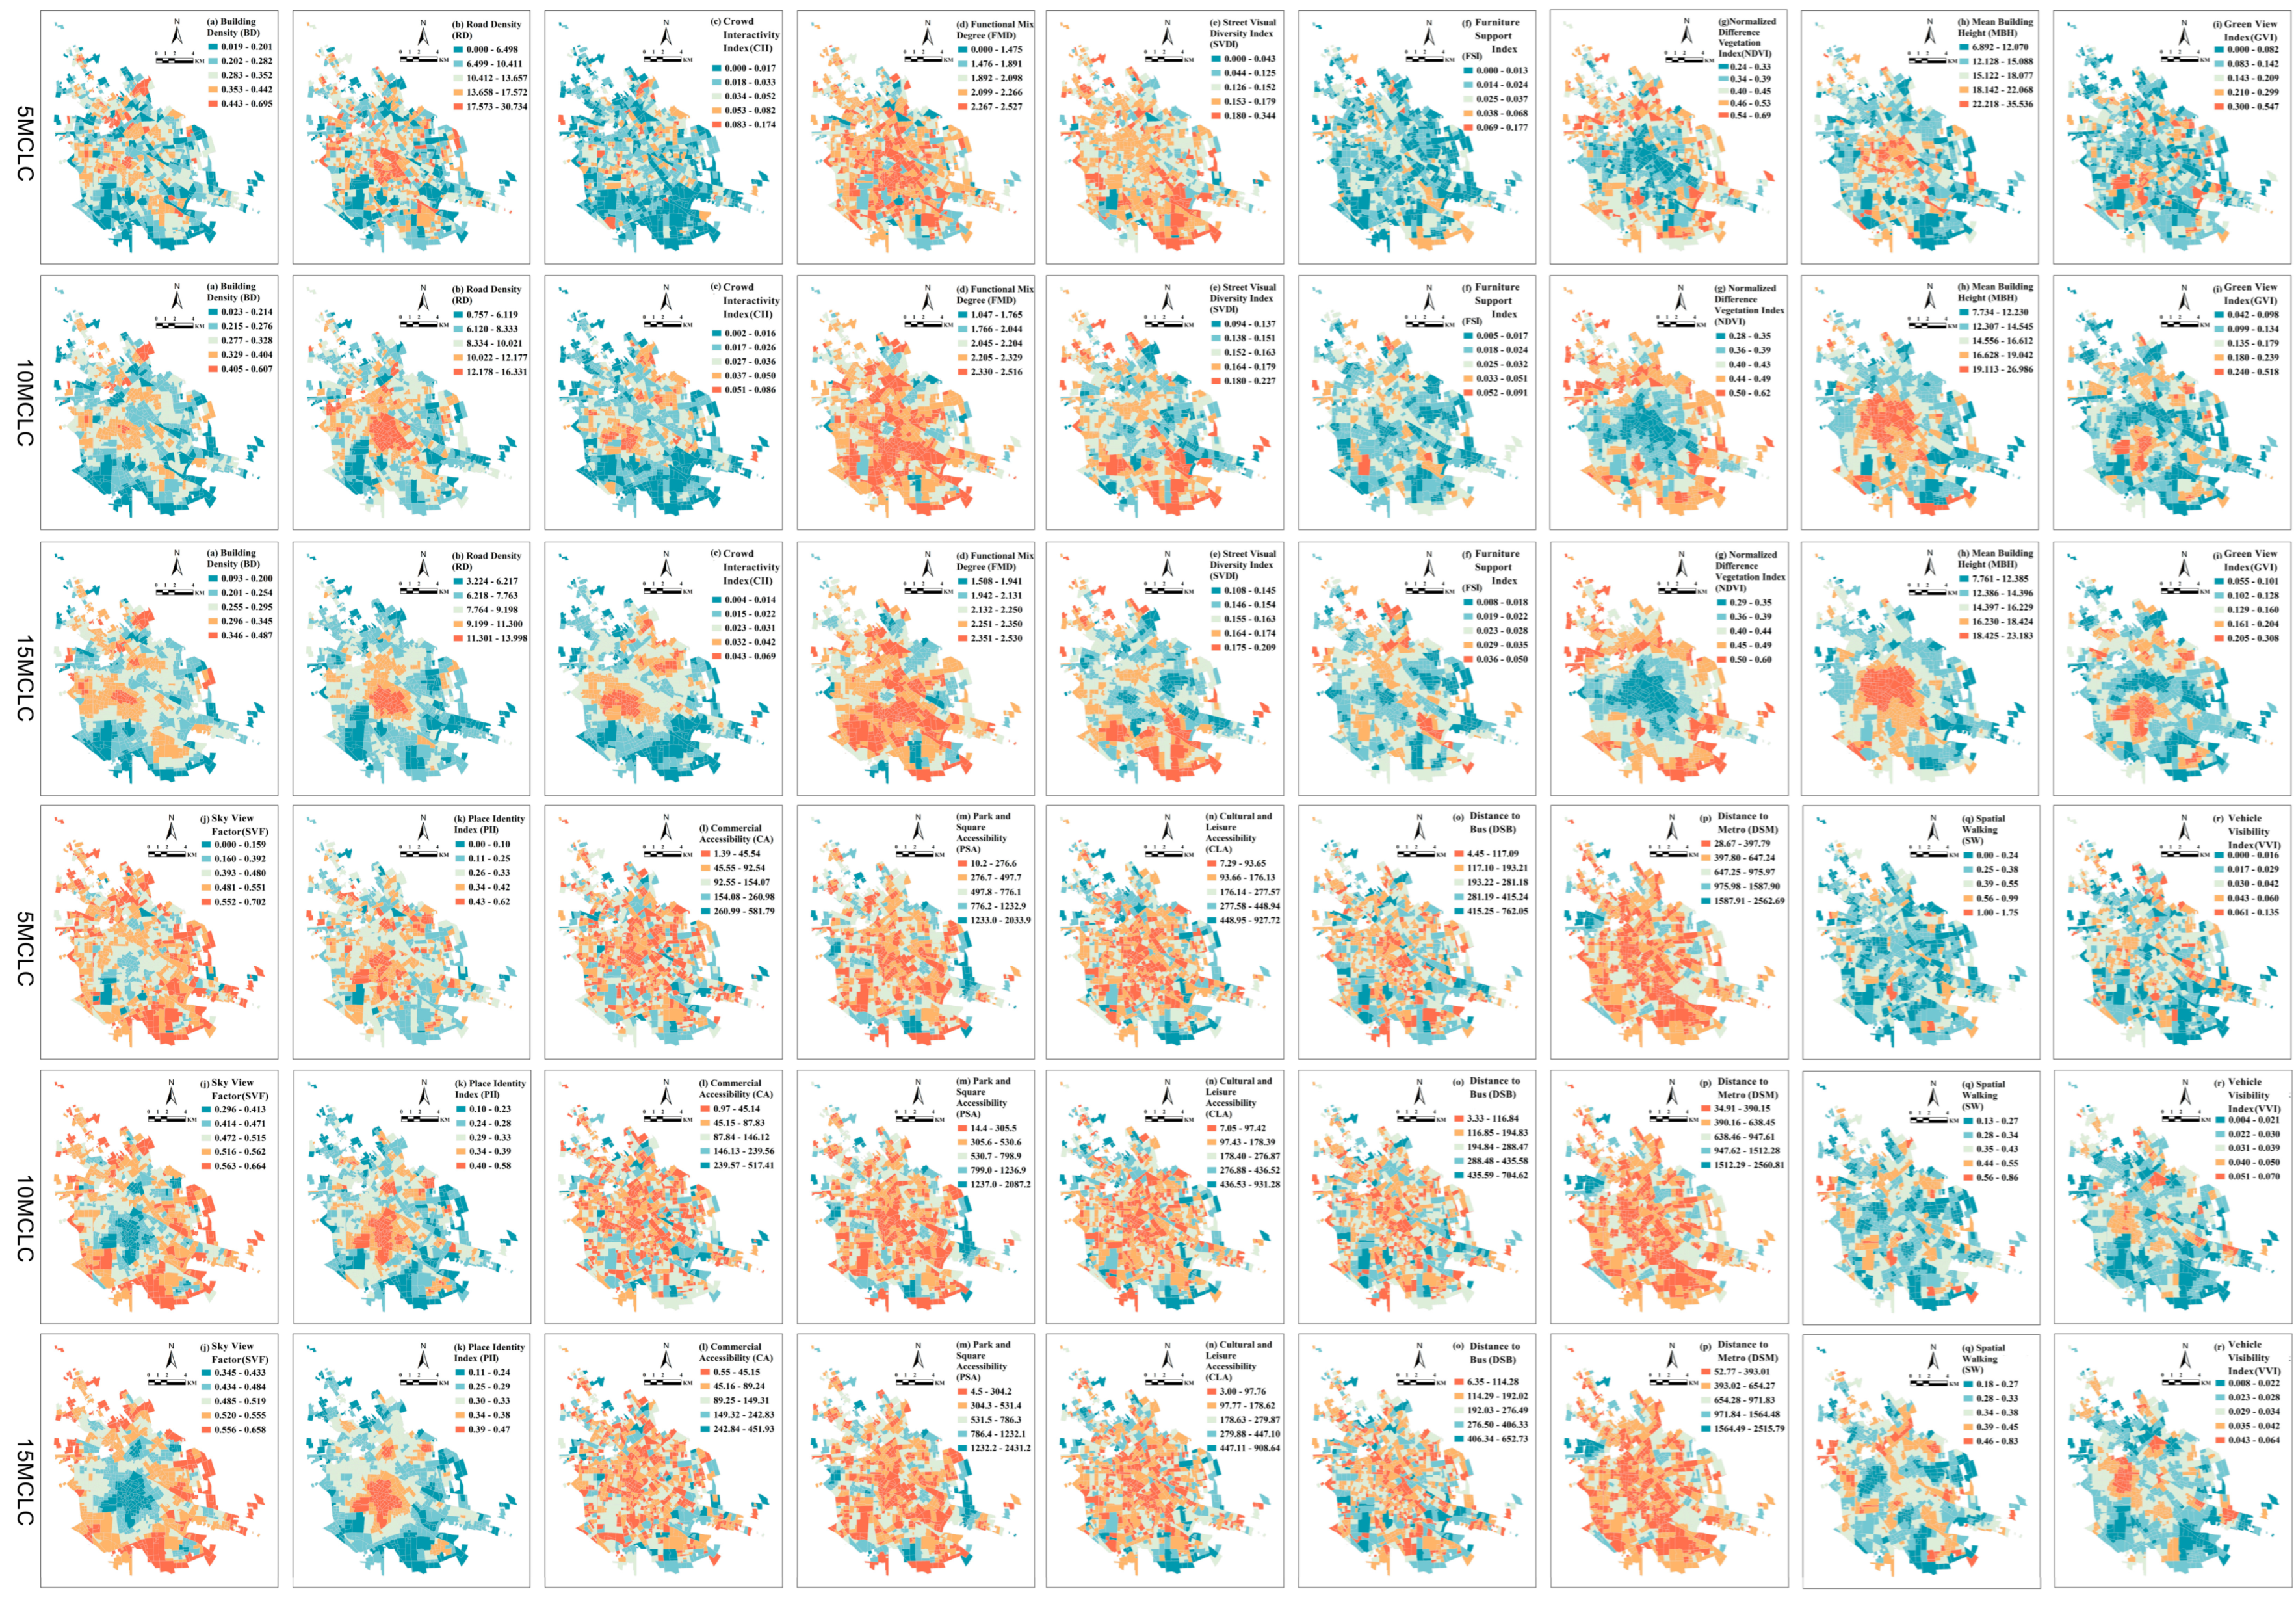
The road network data are sourced from OpenStreetMap (https://www.openstreetmap.org). The road network data undergo a topological check and are then manually corrected with reference to satellite imagery to ensure accuracy for the study area. The POI facility data come from the open platform of AutoNavi (https://ditu.amap.com/). The NDVI data are sourced from the cloud computing platform based on Google Earth Engine. Using all available Landsat imagery from 2022, valid observations are selected after cloud and shadow removal. The NDVI is then computed from these processed images at a spatial resolution of 30 m [55]. Using the aforementioned data, the BE index was calculated, and its spatial distribution at the CLC scale is presented in Figure 5.
Although network distance is adopted in defining CLC boundaries to ensure the authenticity of pedestrian accessibility, Euclidean distance is used for calculating nearest-facility distance indicators, including CA, CLA, PSA, DSB, and DSM. Euclidean distance serves as a statistically robust proxy for measuring the spatial distribution patterns of dispersed facilities in urban environments. While Euclidean distance does not represent actual travel paths, it provides a computationally efficient and stable measure of relative proximity, which is sufficient to characterize the BE in this study.

2.4. Method

This study employs the Extreme Gradient Boosting (XGBoost) model to investigate the nonlinear relationships between the BE and UV across multiple scales and time periods. XGBoost is an efficient optimization algorithm within the Gradient Boosting Decision Tree (GBDT) framework, and its primary advantage is its capacity to capture complex nonlinear relationships with greater accuracy. This model incorporates a regularization term to control its complexity, which effectively mitigates overfitting and enhances the model robustness [56,57]. Additionally, by employing a second-order Taylor expansion in its loss function optimization, XGBoost achieves more precise gradient estimates, thereby enhancing the predictive accuracy [58]. This model excels with large-scale datasets and effectively captures intricate nonlinear relationships, thus rendering it ideal for investigating the complex associations between the BE and UV. We optimized the hyperparameters of the XGBoost model for each scenario individually via a combination of 3-fold cross-validation and grid search, with the optimal hyperparameters for the model across distinct spatiotemporal contexts being presented in Table 2.
In addition, this study adopts anti-collinearity weighted sampling for the selection of training and testing sets. Given the spatial heterogeneity in the numerical distribution of urban geospatial data for BE indicators, both traditional random and stratified sampling methods yield a relatively low R2 for the model test set; accordingly, a weighted sampling strategy is adopted in this study. This strategy assigns adaptive weights to samples across three dimensions—feature diversity, indicator importance, and numerical distribution—with higher weights assigned to highly representative samples to mitigate model overfitting on relevant features and enhance its generalization performance.
To compensate for the inherent limitations of the XGBoost model in terms of interpretability, this study employs the SHAP method to dissect the complex influences of the BE on UV [59]. SHAP is a game-theory-based technique that quantifies each feature’s contribution by measuring how much it shifts the model’s prediction from a baseline average [60,61]. This study employs SHAP to determine the independent contributions of BE to UV across spatiotemporal scales, by quantifying each factor’s marginal effects and making the XGBoost model interpretable. Furthermore, this study employs SHAP to analyze the interactive effects of different BE indicator combinations on UV [62]. Table 3 reports the R2, RMSE, and MAE values across distinct spatiotemporal contexts.

3. Results

3.1. The Spatiotemporal Distribution of Urban Vitality in Multi-Scale CLC

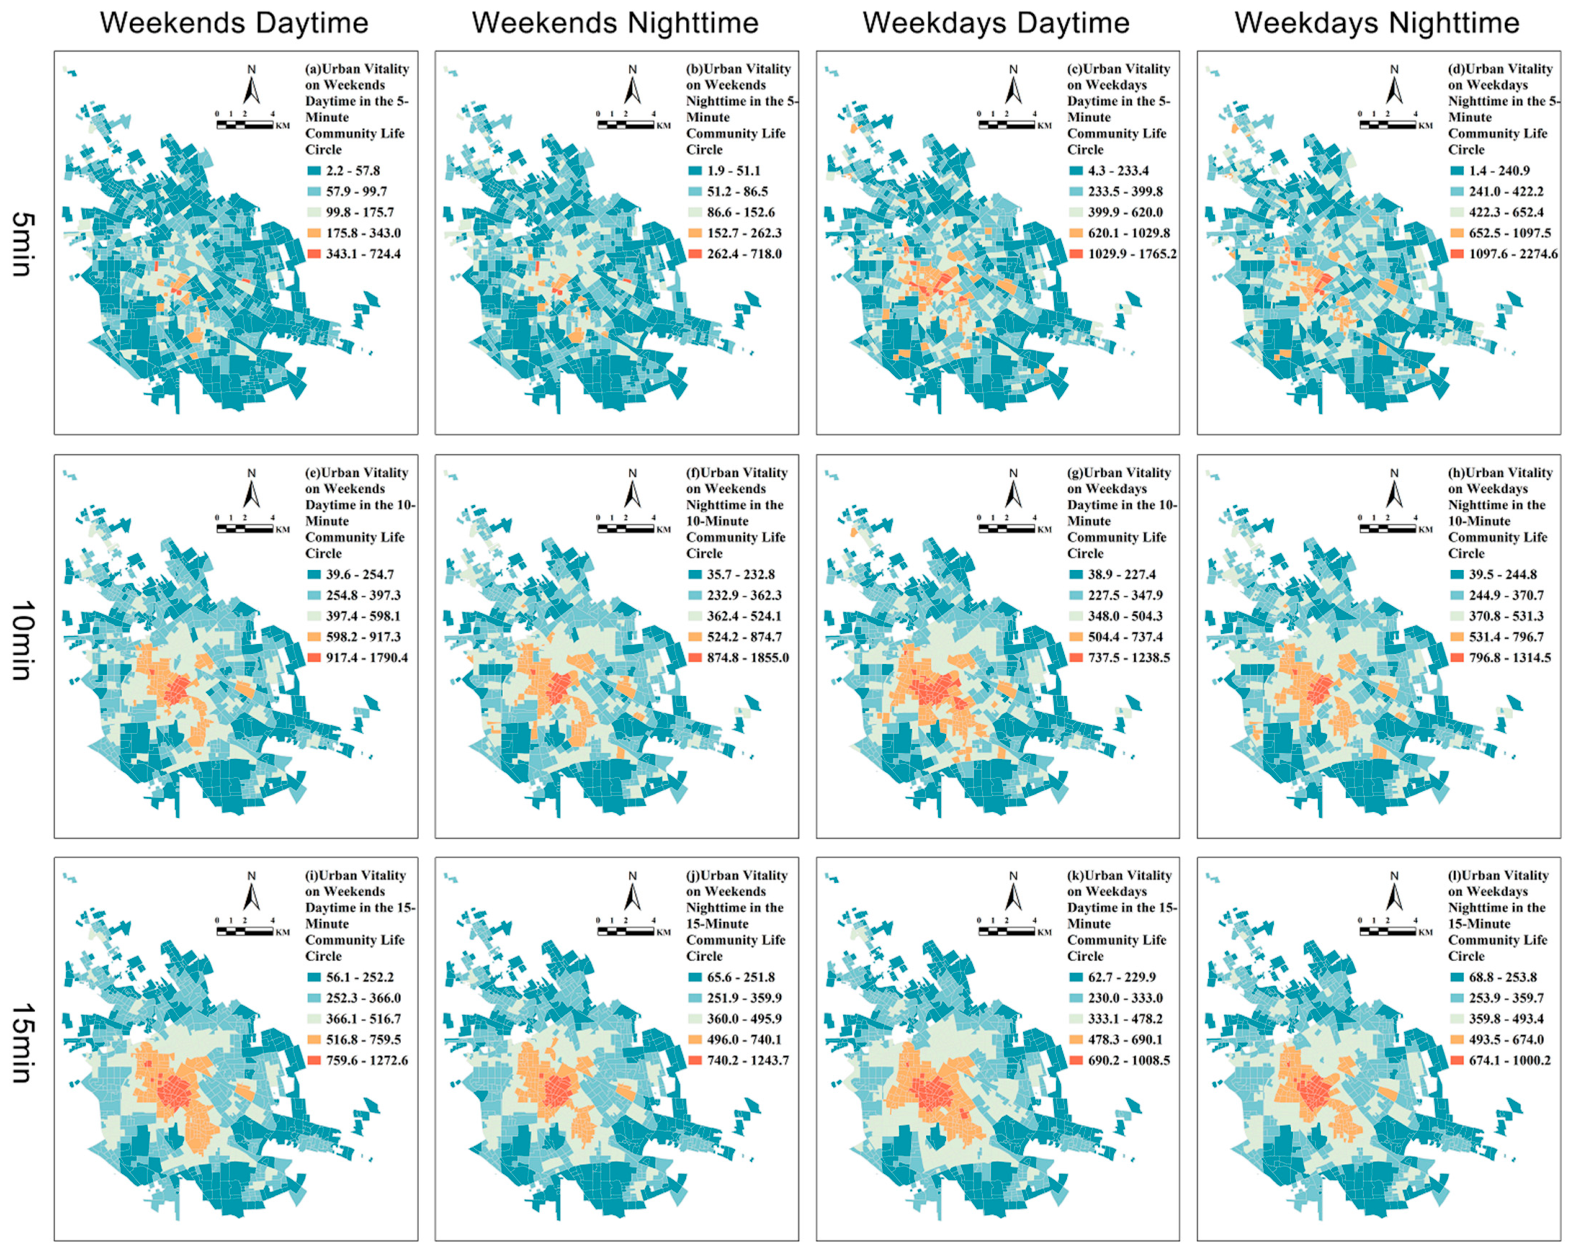
Table 4 presents the average UV values across different time periods on weekdays and weekends within 5MCLC, 10MCLC, and 15MCLC. Figure 6 shows their spatial distribution within multi-scale CLC. The UV of the 10MCLC is the highest, with an average value of 373.7 people/km2, making it the “optimal scale” for urban living. The UV of the 15MCLC is close to that of the 10MCLC, with an average value of 359.7 people/km2. The UV of the 5MCLC is the lowest, with an average value of 222.33 people/km2.
Across different scales, the UV of the 5MCLC is the lowest, and such UV is mainly derived from residents’ essential daily activities. The corresponding activity spaces primarily include convenience stores, small eateries, and community parks. When residents’ activity ranges expand to the 10MCLC, UV increases most significantly. This scale not only retains the daily convenience of the 5MCLC but also integrates larger-scale commercial facilities and public spaces. Within 15MCLC, UV is primarily driven by large-scale agglomerations such as shopping malls, city-level parks, and transport hubs. Consequently, its spatial distribution exhibits a strong centripetal pattern, clustering around these nodal spaces. However, the peripheral regions lack such agglomerations, and their UV is lower than that within 10MCLC.
Across different time periods, daytime UV is lower than nighttime UV on weekdays. Daytime UV is higher than nighttime UV on weekends. Whether on weekdays or weekends, the spatial distribution of nighttime UV is more dispersed than that of daytime UV. This is because the population concentrates in employment centers in the daytime and disperses back to residential neighborhoods during the nighttime.
From a comprehensive temporal and scale perspective, within a 5MCLC microscale, a unique phenomenon emerges where weekday UV is higher than weekend UV. This reveals that its functional attributes are dominated primarily by regular functional daily activities, such as commuting, nearby employment, and community support services. These high-frequency essential activities form the foundation of UV on weekdays. Residents tend to travel to destinations that are further away for leisure and entertainment on weekends, and the activity intensity within the nearest 5 min area actually decreases. Therefore, UV within 10MCLC and 15MCLC is higher on weekends.
The significant disparity in the UV of the 5MCLC between weekdays and weekends may represent a distinctive anomaly arising from the unique geographical and spatial context of Tianjin’s old urban areas. (1) 5MCLC in Tianjin’s old urban area is characterized by a compact spatial layout, outdated facilities, and a serious shortage of leisure-oriented functional spaces. Most neighborhoods in Tianjin’s old urban area are dominated by residential and basic service functions, with a shortage of spaces such as pocket parks and small entertainment venues that can attract weekend activities. (2) The traditional urban core of Tianjin has long been dominated by residential and daily service functions. Historically, leisure-oriented functions have been concentrated in specialized commercial areas such as Binjiang Road, rather than being provided at the community level. This has fostered a habitual weekend travel pattern among residents. (3) The old urban area also has a large proportion of elderly residents and families with school-age children. On weekdays, the area features intensive elderly care, childcare, and educational activities. On weekends, residents often choose to visit suburban scenic spots with their grandchildren or travel to new towns to visit their adult children. This further reduces the activity intensity within the 5MCLC.

3.2. Relative Influence of Built Environment

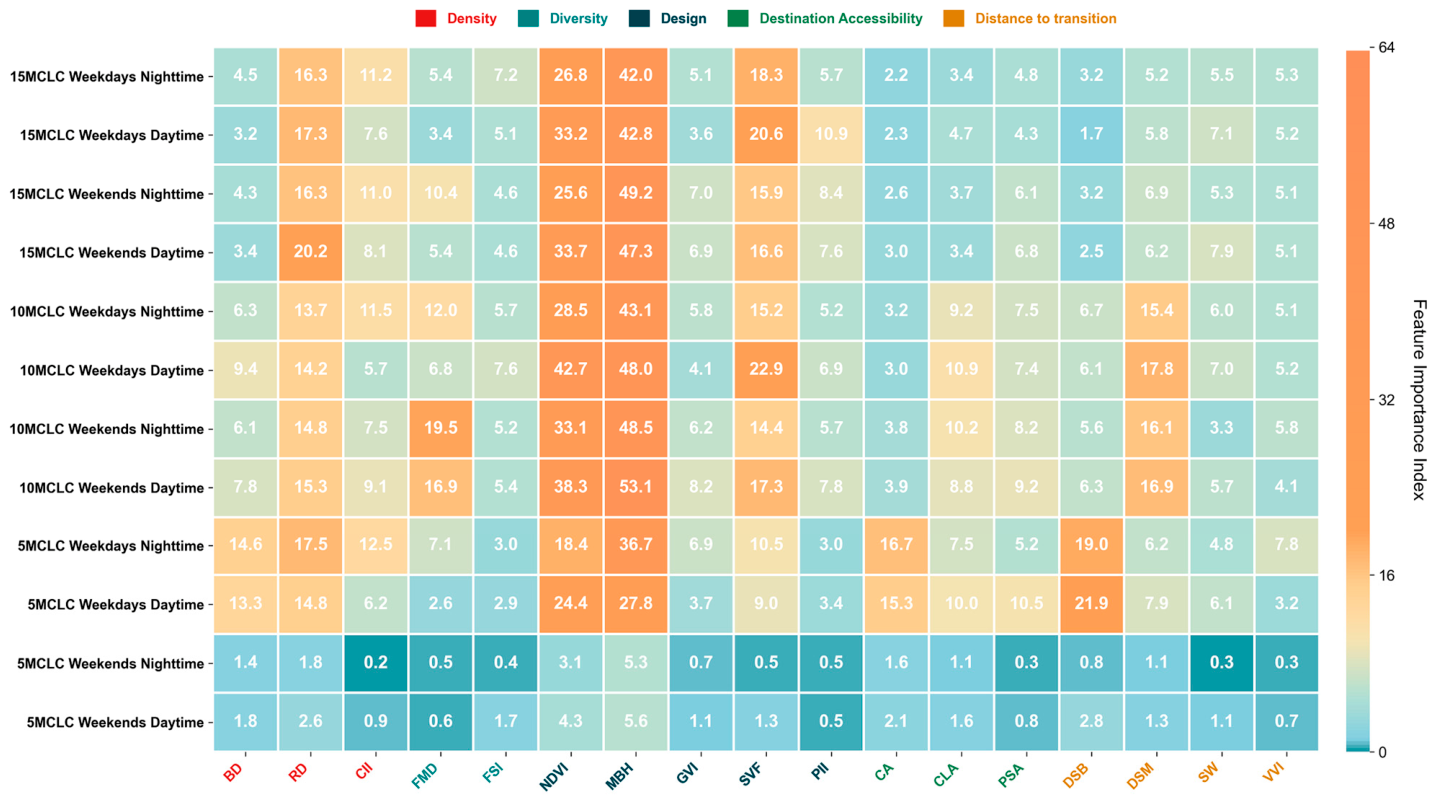
To reveal the differential effects of the BE within multi-scale CLC across different temporal scenarios, this study employs an approach based on the XGBoost model and SHAP analysis. The relative influence of the 18 BE indicators is systematically quantified, with a heatmap of the relative influence for each indicator being generated as the final output (Figure 7). The higher the relative influence, the greater the effects of the BE on UV.
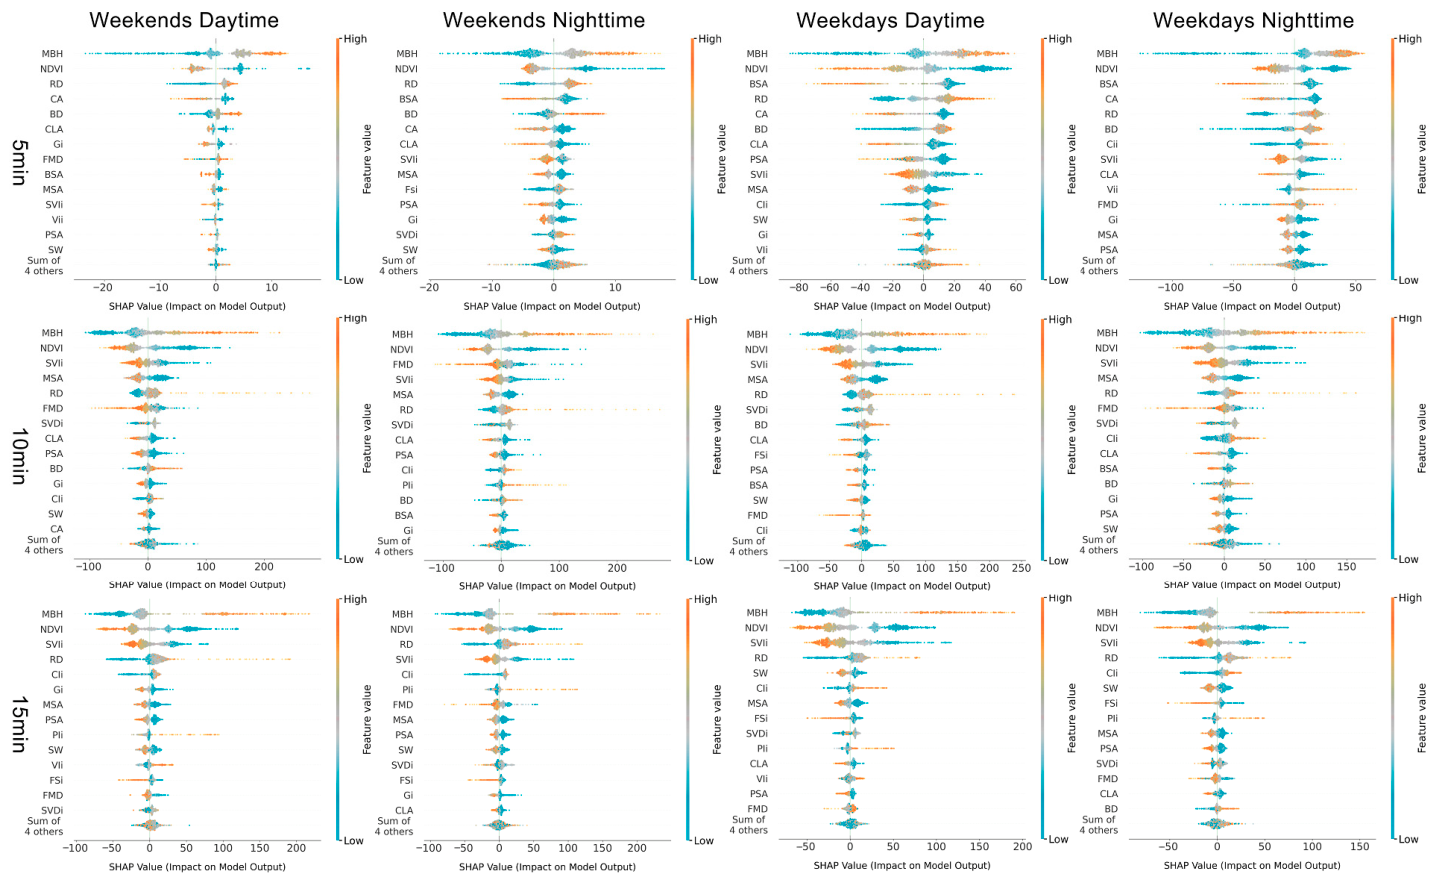
The bee swarm plot (Figure 8) illustrates the overall effects trend of BE on UV. Values to the left of zero indicate a negative effect, while those to the right indicate a positive effect. The significance of BE indicators is not a static attribute, but rather exhibits significant spatiotemporal heterogeneity, with the influence of each indicator evolving dynamically across different spatiotemporal scenarios.
Across all twelve spatiotemporal scenarios, the mean building height (MBH) and the Normalized Difference Vegetation Index (NDVI) emerge as the two most influential factors, consistently occupying the top ranks in the relative influence analysis for UV.
At the small 5MCLC scale, residents’ needs prioritize immediacy and convenience. Compared to other scales, distance to bus (DSB), commercial accessibility (CA), and building density (BD) exhibit a higher relative influence. This result clearly demonstrates the reliance of high-frequency, short-distance activities on nearby service facilities within the smallest life unit.
As the scale expands from the 5MCLC to the 10MCLC and 15MCLC, the relative influence of destination accessibility, CA, BD, and cultural and leisure accessibility (CLA) declines. Conversely, the functional mix degree (FMD) and place imageability index (PII) rise in the rankings. A marked increase in the relative influence of the sky view factor (SVF) and a gradual rise in that of the green view index (GVI) are observed with expanding CLC scales. This reflects that residents, with longer travel time, are no longer merely satisfied with reaching destinations but also begin to value the walking experience throughout the entire travel process. The relative influence of the road density (RD) remains relatively stable, with its ranking consistently being in the top six. The street visual diversity index (SVDI) and distance to metro (DSM) exhibit increased relative influence in 10MCLC, yet their rankings decline again in 15MCLC. This indicates that urban residents’ travel routes tend to shift from urban branch roads between neighborhoods to urban arterial roads.
With the temporal dimension incorporated, the relative influence of spatial walkability (SW) is higher during the daytime than during the nighttime across all scales. At the small 5MCLC scale, the relative influence of DSB ranks significantly higher than that at other scales. Furthermore, its relative influence during the daytime (on both weekdays and weekends) far exceeds that during the weekend nighttime. The value of having a nearby bus stop is greatly magnified due to commuting needs during the daytime and weekdays. However, during the nighttime, as commuting needs diminish, its relative influence drops significantly. As the scale expands, the relative influence of the park and square accessibility (PSA) increases, especially on rest days, driven by a shift in resident activities toward leisure. At the medium and large 10MCLC and 15MCLC scales, the relative influence of the crowd interactivity index (CII) is relatively high. With the exception of weekdays in the 15MCLC (where its relative influence is equal), CII is consistently more important during the nighttime than during the daytime.
Apart from the aforementioned indicators, the remaining ones exhibit a relatively low relative influence across different spatiotemporal scenarios.
Across all twelve spatiotemporal scenarios, MBH and RD are positively associated with UV. In contrast, CLA, SVF, PSA, GVI, NDVI, CII, and DSM are negatively associated with UV. At the 5MCLC, BD is positively associated with UV, whereas CA is negatively associated with UV. For both the 10MCLC and the 15MCLC, FMD suppresses UV on weekday nighttimes and throughout weekends. The remaining indicators and aforementioned indicators in other spatiotemporal scenarios exert a relatively weak influence.

3.3. Nonlinear Effects of BE on UV in Multi-Scale CLC

3.3.1. Nonlinear Effects of Density and Diversity on UV in CLC

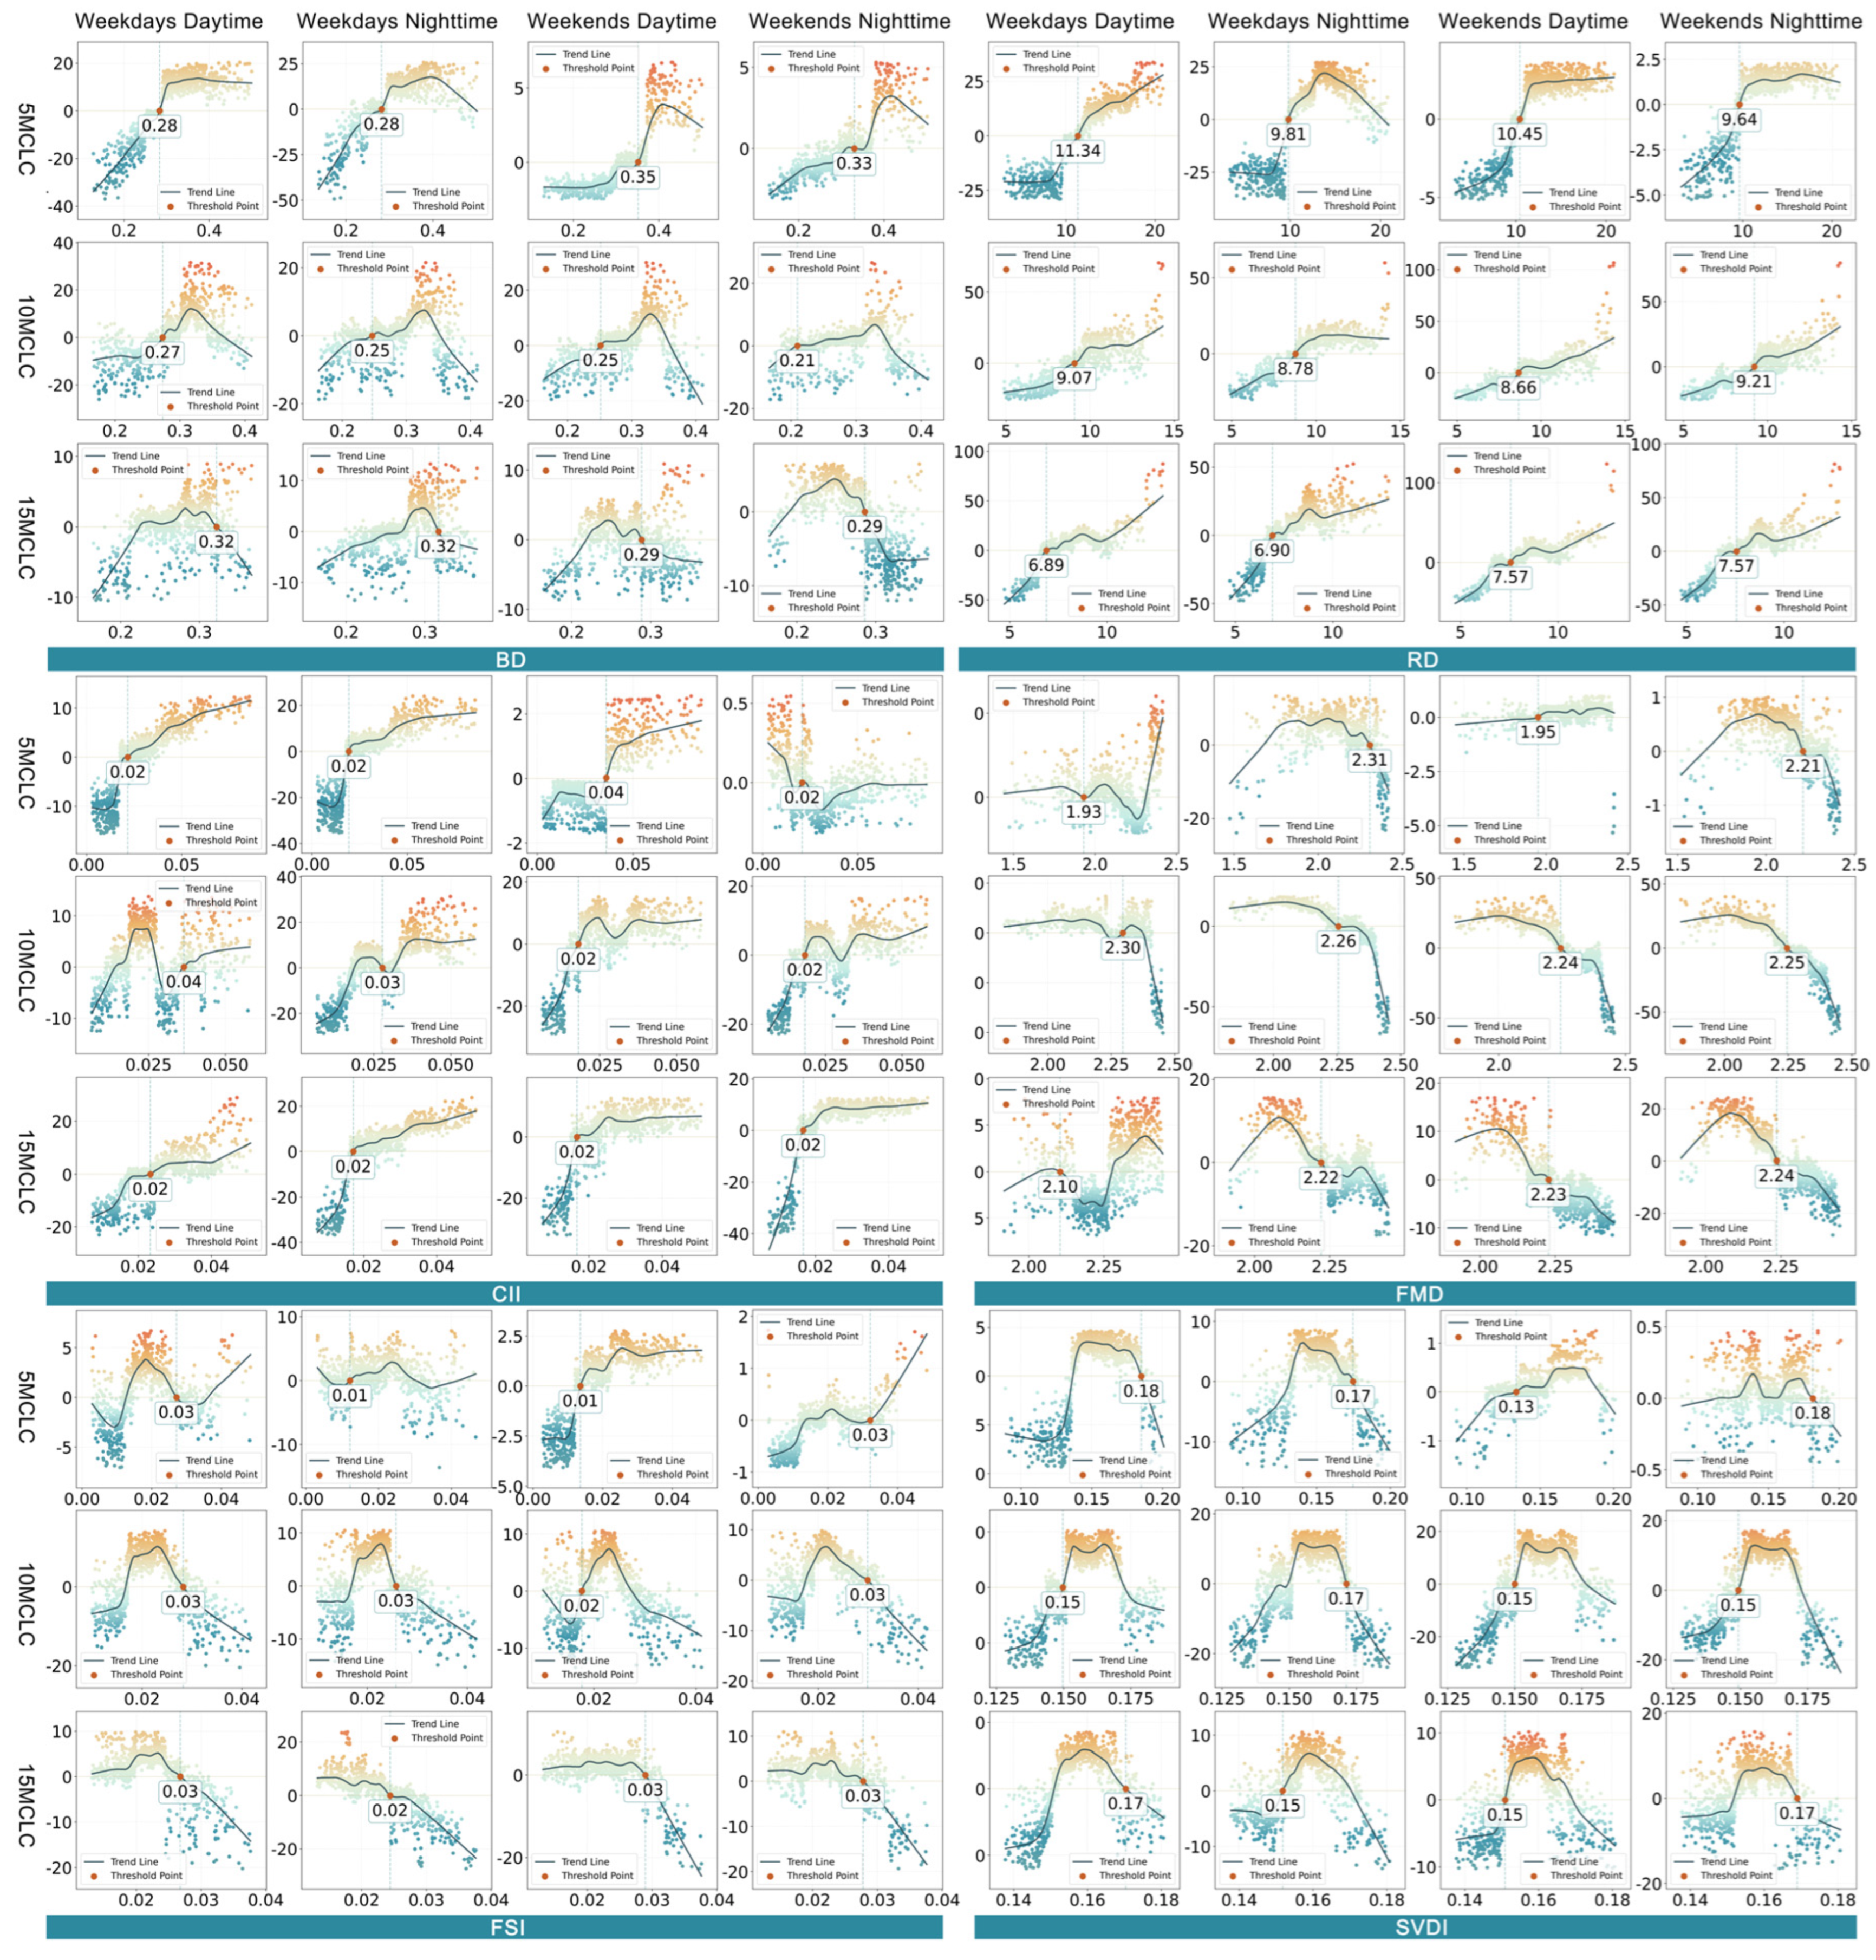
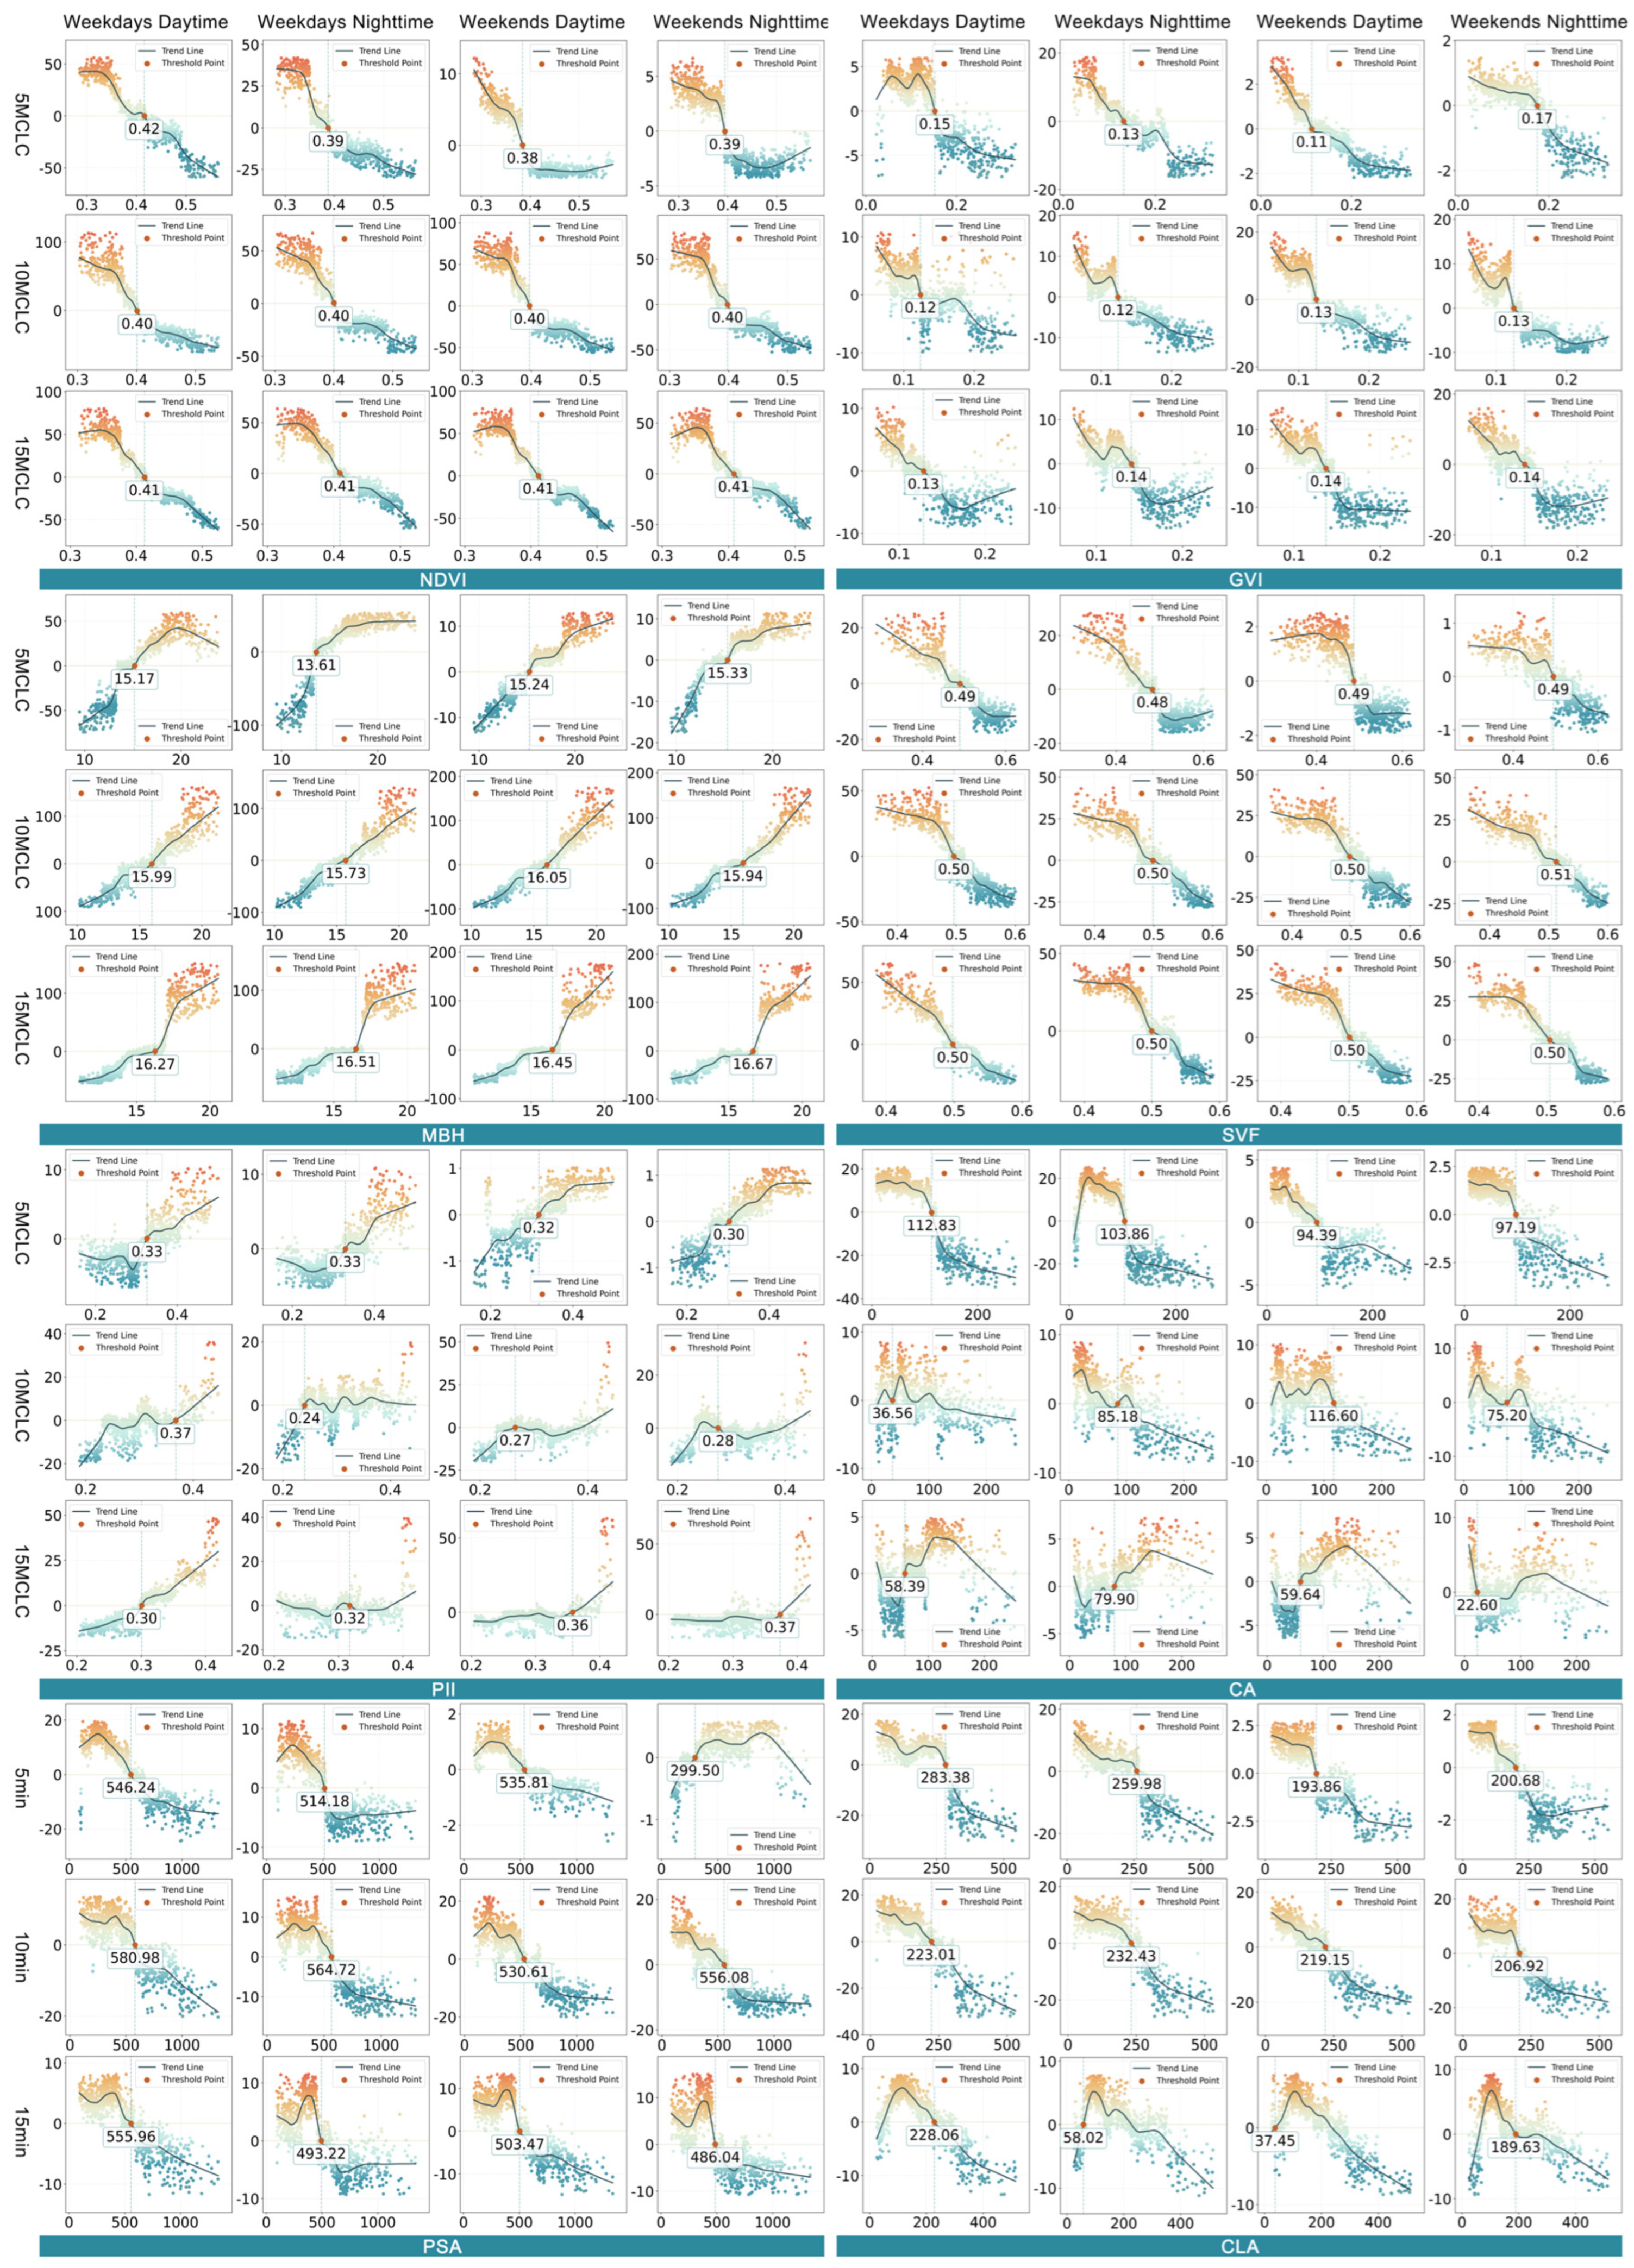
Figure 9 illustrates the nonlinear effects of density and diversity on UV at different scales over different time periods in CLC.
Within the density dimension in 5MCLC, BD exceeding 0.28 is positively associated with UV on weekdays, while this threshold rises to 0.33–0.35 on weekends. It indicates that UV at the small scale requires a higher development intensity as support at weekends. When expanded to 10MCLC and 15MCLC, the effect of BD on UV within the range of 0.27–0.29 follows an inverted U-shaped pattern. When BD is greater than 0.35, it is negatively associated with UV.
As the CLC scale expands, the threshold at which RD is positively associated with UV gradually decreases from 9.64 to 11.34 km/km2 to 6.89–7.57 km/km2. This indicates that at the small scale, a high-density road network is necessary to maintain the continuity of urban residents’ walking. At the larger scale, a moderate road network framework is sufficient to sustain vibrant urban activities. Across different time dimensions, the effect of RD on UV is relatively similar and is less disturbed by fluctuations in residents’ daily routines.
In both 5MCLC and 15MCLC, CII greater than 0.02 is positively associated with UV, with the effect gradually intensifying. This pattern excludes weekend nights in 5MCLC, where the effect of CII on UV is almost inversely related to that in other spatiotemporal scenarios. When CII is below the threshold of 0.02, it is positively associated with UV. This result suggests that residents tend to move beyond the immediate five-minute walking distance and gravitate toward public activity nodes within a range of 10 to 15 min. Therefore, street crowds in 5MCLC are more likely to be passing through, rather than staying during weekday nighttimes. In 10MCLC, when CII reaches 0.02, it is positively associated with UV with a fluctuating increase. As a transitional scale between 5MCLC and 15MCLC, this result can be attributed to the fact that some 10MCLC contain numerous core public nodes that attract large crowds.
Within the diversity dimension, FMD above the maximum threshold negatively effects UV in most spatiotemporal scenarios. However, FMD is positively associated with UV only during the daytime in 5MCLC and weekday daytime in 15MCLC. A high FMD shortens residents’ travel time during the daytime in 5MCLC, while an extremely high FMD indicates a good job-housing balance and complete business facilities during weekday daytimes in 15MCLC. Higher FMD sustains more vibrant social activities for working residents.
SVDI exerts a similar effect on UV across all spatiotemporal scenarios. When SVDI exceeds 0.15, it is positively associated with UV that follows an inverted U-shaped relationship. When SVDI exceeds 0.18, it is negatively associated with UV.
In 5MCLC, when FSI exceeds 0.01, it is positively associated with UV. FSI exerts a gradually decreasing effect on UV as its level rises on weekdays, while its effect on UV fluctuates with a continuous upward trend on weekends. In 10MCLC, FSI exerts an effect on UV that peaks rapidly and then declines when the FSI ranges from 0.02 to 0.03. In 15MCLC, FSI exerts a continuously increasing negative effect on UV when it exceeds 0.03.

3.3.2. Nonlinear Effects of Design and Destination Accessibility on UV in CLC

Figure 10 illustrates the nonlinear effects of design and destination accessibility on UV at different scales over different time periods in CLC.
Within the design dimension, the threshold of the nonlinear effect of GVI on UV remains stable from 0.11 to 0.17 across all spatiotemporal scenarios. GVI has a positive effect on UV when below its threshold, whereas it is negatively associated with UV when the threshold is exceeded. Similar to GVI, the threshold of NDVI remains stable at approximately 0.38–0.42. When NDVI exceeds the threshold, it is negatively associated with UV. High NDVI is characteristic of low-density suburbs or pure green spaces. In contrast, vibrant agglomerations typically maintain moderate greening to strike a balance between the landscape and functional density.
When MBH exceeds 16.67, it is positively associated with UV. The threshold increases with the rise in the CLC scale, rising from 13.61 m–15.33 m in 5MCLC to 16.27 m–16.67 m in 15MCLC. It indicates that on a larger scale, areas with dense high-rise buildings exhibit stronger vitality than those with low-rise buildings.
The nonlinear effect of SVF on UV remains essentially consistent across all spatiotemporal scenarios. When SVF exceeds 0.5, it is negatively associated with UV. This indicates that a moderate sense of street enclosure can provide residents with a better urban activity experience. In 5MCLC, when PII exceeds 0.33, it is positively associated with UV. However, in 10MCLC and 15MCLC, the threshold increases significantly on weekends.
Within the density dimension, the nonlinear effect of CA on UV exhibits a strong scale effect. In 5MCLC and 10MCLC, when CA exceeds 116.6 m, it is negatively associated with UV. However, in 15MCLC, except for nighttime on weekends (when CA is less than 22.6 m, it is positively associated with UV), CA is negatively associated with UV when it is less than 79.9 m. When CA exceeds its threshold and is less than 200 m, it is positively associated with UV. This indicates that on a large scale, certain commercial centers exert a stronger effect and can accommodate a broader range of activity needs.
When PSA exceeds 580.98 m, it is negatively associated with UV, except for nighttime on weekends in 5MCLC. At nighttime on weekends in 5MCLC, when PSA is less than 299.5 m, it is negatively associated with UV. When PSA exceeds 299.5 m, it is positively associated with UV.
In 5MCLC and 10MCLC, when CLA exceeds 283.38 m, it is negatively associated with UV, and the negative effect threshold on weekdays is higher than that on weekends. In 15MCLC, when CLA is less than 58.02 m, it is negatively associated with UV. This indicates that residents engaging in small- and medium-scale CLC activities are willing to travel a longer distance to cultural and leisure facilities than those engaging in large-scale CLC activities on weekends.

3.3.3. Nonlinear Effects of Distance to Transportation on UV in CLC

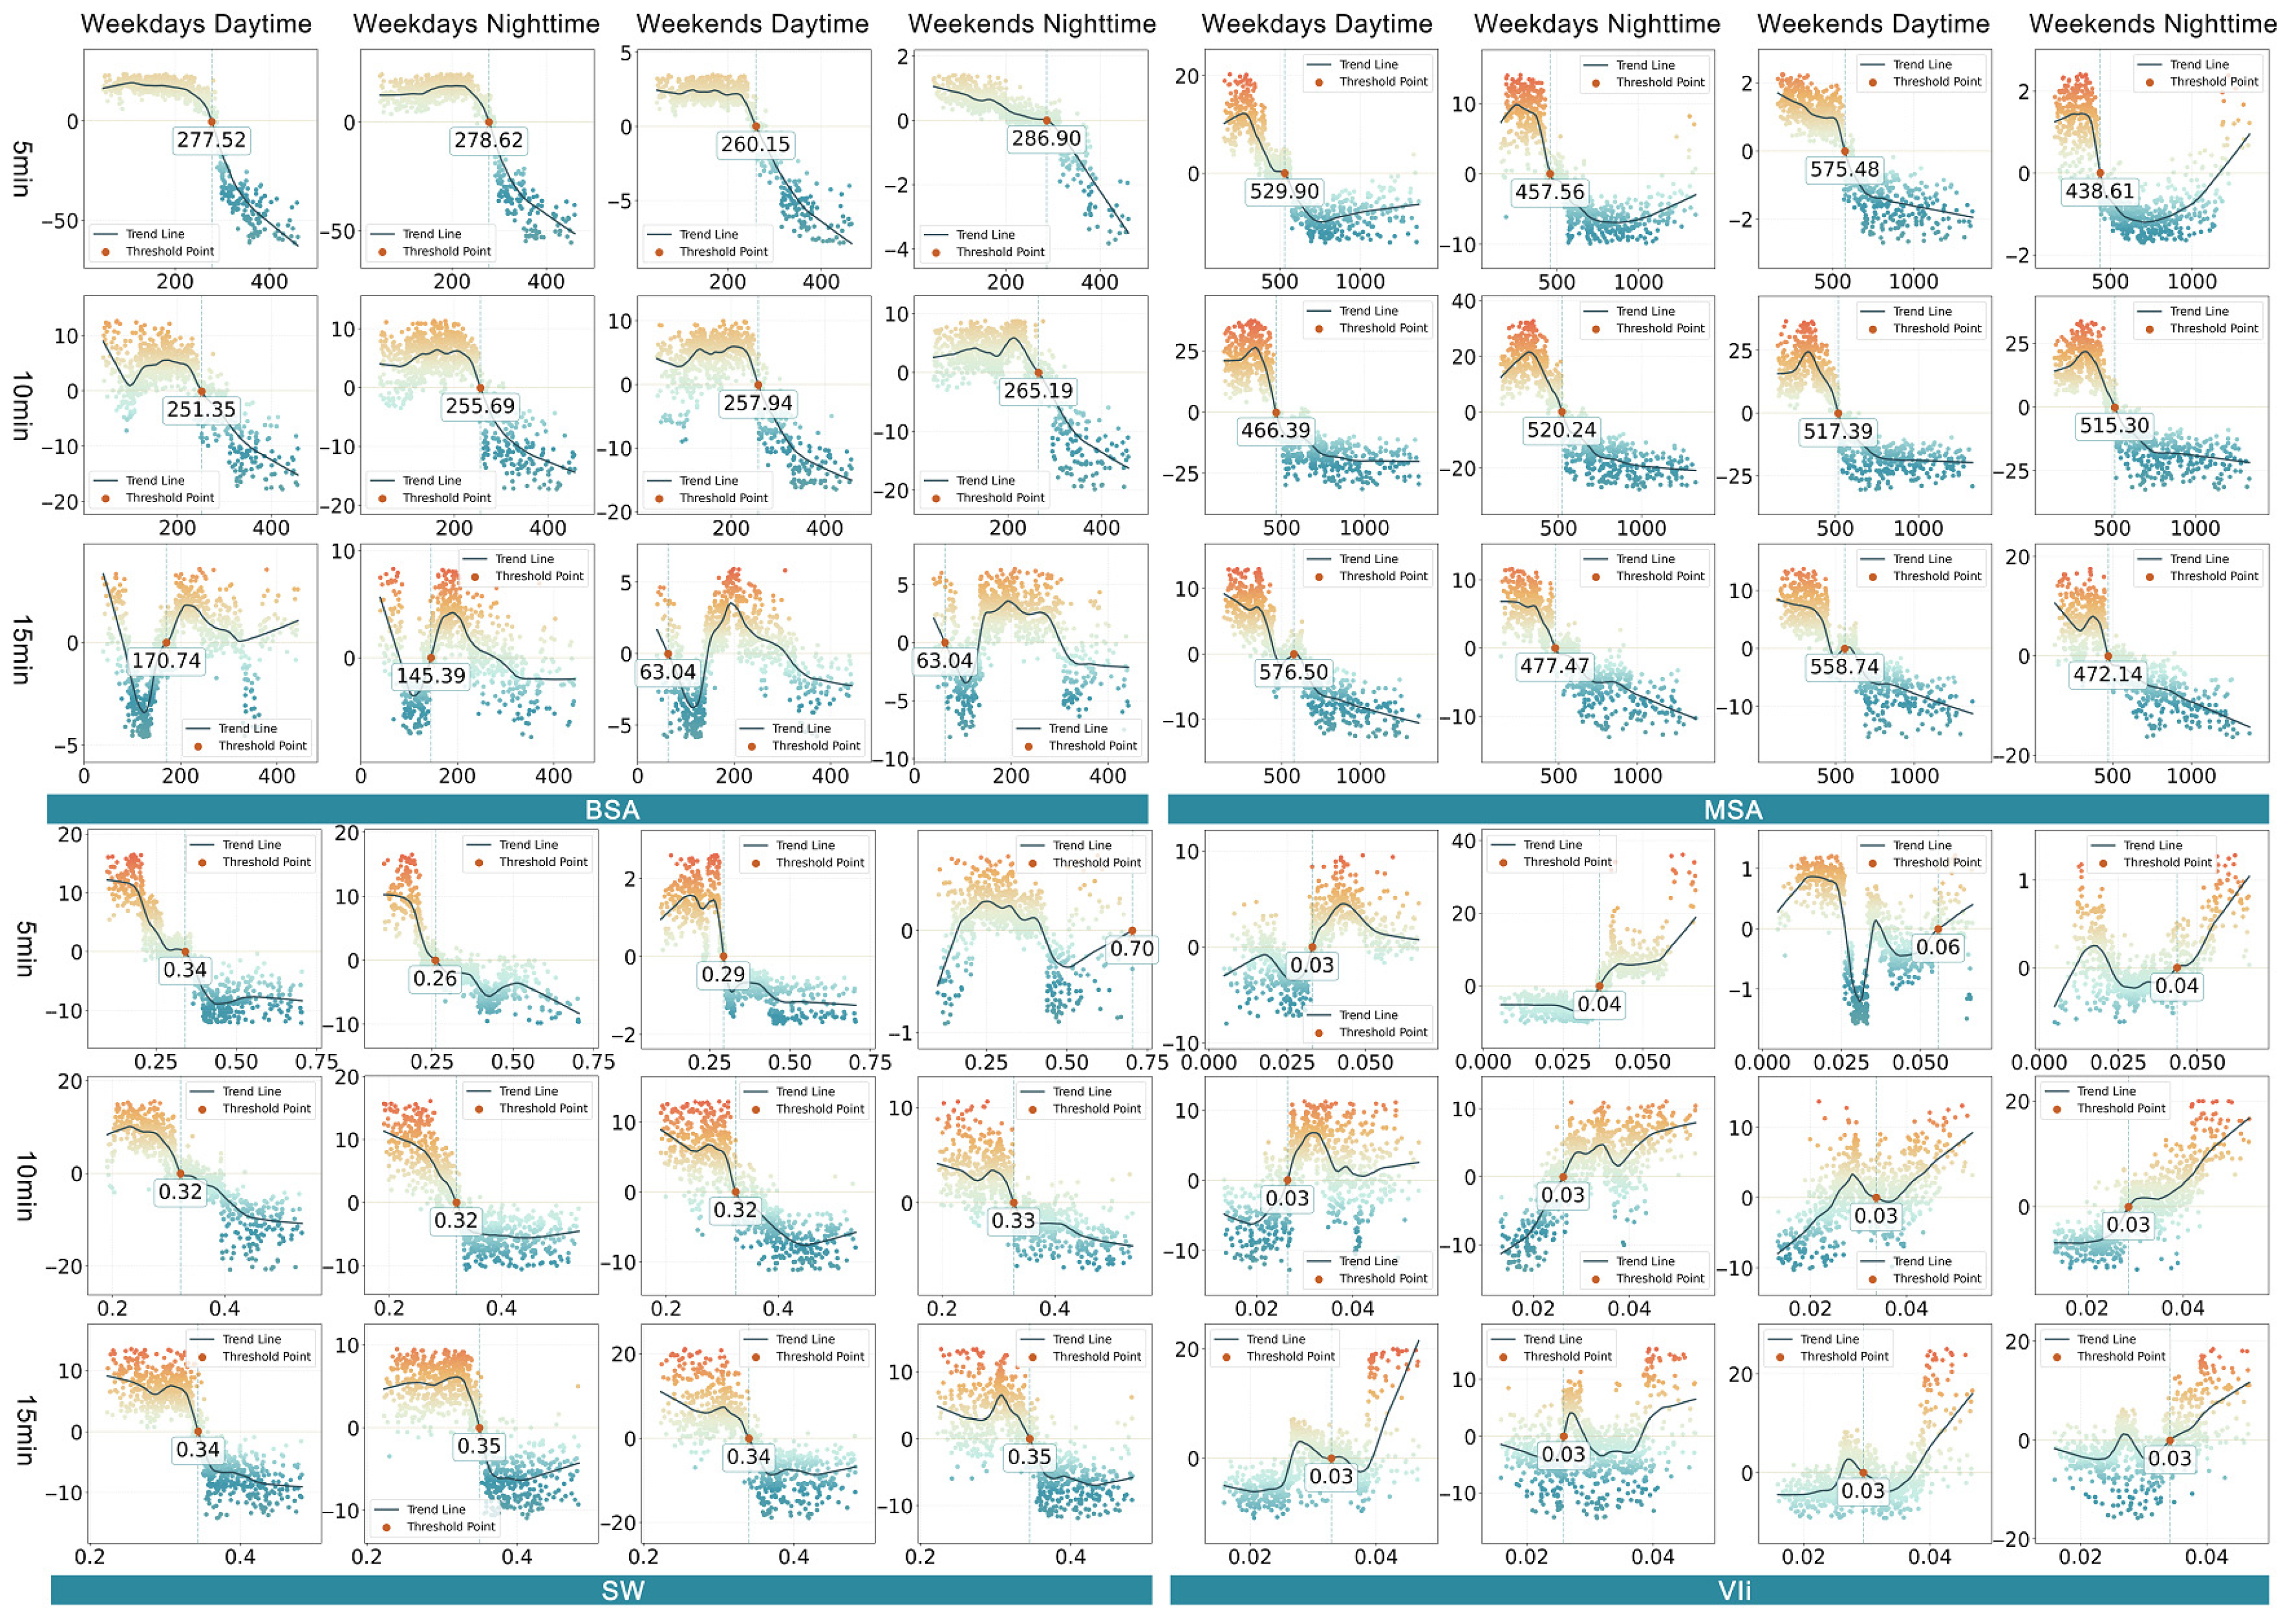
Figure 11 illustrates the nonlinear effects of distance to transit on UV at different scales over different time periods in CLC.
In 5MCLC and 10MCLC, DSB negatively effects UV when it exceeds 286.9 m. This negative threshold decreases gradually with increasing scale. Furthermore, it is consistently higher at night than during the day. However, when the scale is expanded to 15MCLC, DSB is negatively associated with UV from 63.04 to 170.74 m, and this effect is significantly scale-dependent. In contrast, the effect of DSM is more consistent across various spatiotemporal scenarios, with the negative effect threshold consistently being maintained between 438.61 m and 575.48 m. Moreover, in both 5MCLC and 10MCLC, the negative effect threshold of DSM in the daytime on weekends is higher than that in the daytime on weekdays. This indicates that residents have a higher tolerance for subway travel distances during weekend leisure time, and the radiation radius of subway stations on UV is expanded due to the increased leisure demand on weekends.
SW is negatively associated with UV when it exceeds 0.35, except for nighttime in closed 5MCLC. As the CLC scale increases, the threshold for the negative effect of SW on UV slightly increases from 0.26 to 0.34 in 5MCLC to 0.34–0.35 in 15MCLC. During weekend nighttimes, extremely low SW is negatively associated with UV in 5MCLC. This indicates that during weekend evenings, residents avoid poorly traversable roads to ensure safety in 5MCLC.
As the vehicle visibility index (VVI) increases, its effect on UV shifts from negative to positive, except in 5MCLC on weekends. In 5MCLC, VVI is positively associated with UV at low levels on weekends.

3.4. Interactive Effects of BE on UV in CLC

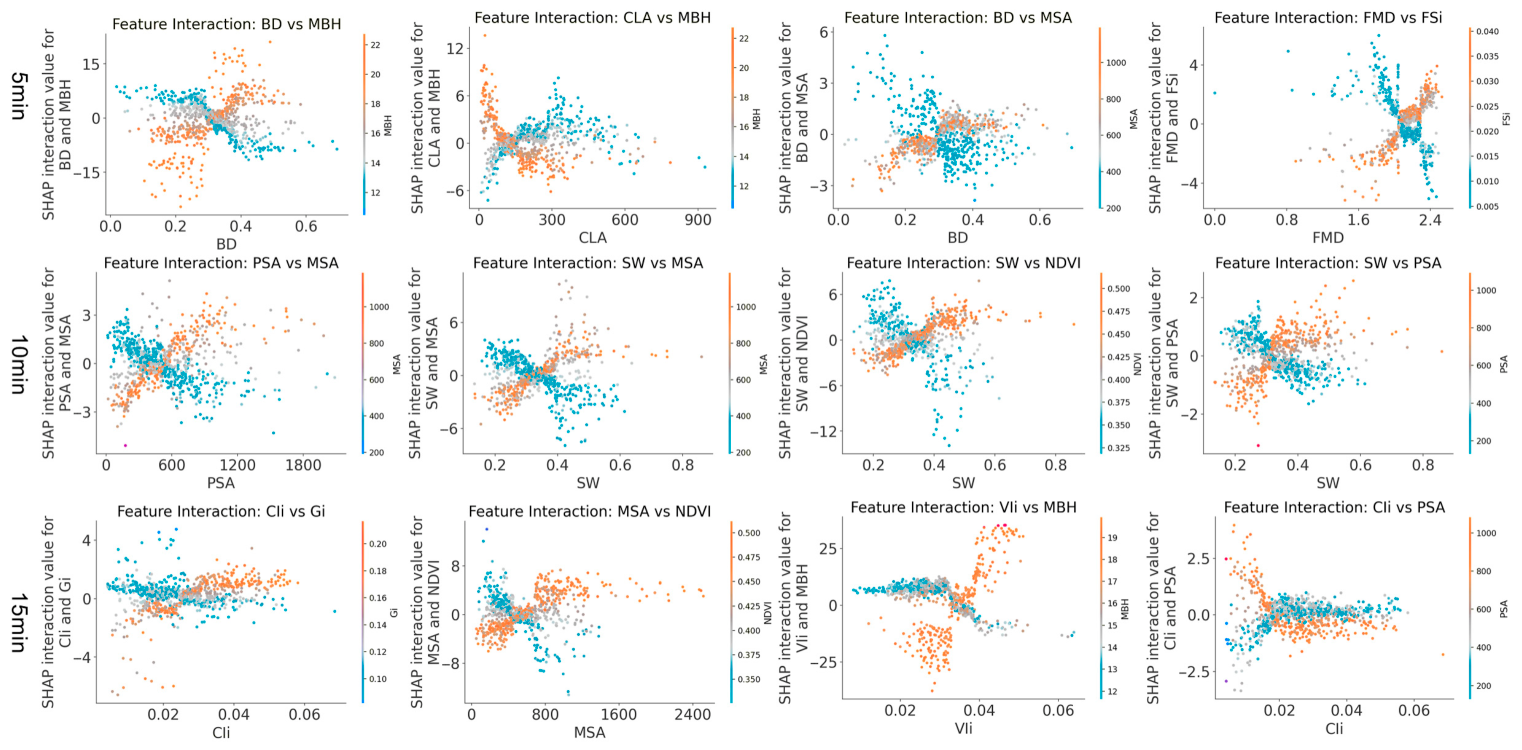
To further investigate the interactive effects of BE indicators on UV, this study calculated the average vitality of 5MCLC, 10MCLC and 15MCLC. We explore the interactive effects between BE indicators across different scales, and nine significant interaction pairs are ultimately selected for analysis (Figure 12). The x-axis represents the built-up index, the color axis represents another indicator, and the y-axis represents the SHAP interaction value between the two indicators. A SHAP value greater than 0 indicates a positive interaction effect, while a value less than 0 indicates a negative one. The larger the SHAP value, the stronger the interaction effect and its corresponding effect on UV.
In 5MCLC, when both BD and MBH are high, they exhibit a positive interaction effect on UV, whereas when BD is high and MBH is low, this combination exhibits a negative interaction effect. Especially when BD is below 0.3, an increase in MBH diminishes the positive interaction effect on UV and can even render this effect negative. The interaction between CLA and MBH reveals that in high MBH areas, increasing the distance to cultural leisure facilities weakens the positive effect on UV, with a negative interaction emerging beyond the critical threshold of 150 m. In the BD-DSM interaction, high density areas exhibit a negative effect on UV with short subway distances, while the interaction turns positive as the distance increases. In the FMD-FSI interaction, high values of both foster a synergistic boost to UV, while high FMD with low FSI yields a detrimental effect.
In 10MCLC, the positive interaction between PSA and DSM on UV is markedly enhanced in locations with proximity to both park squares and subway stations. As the distance to park squares increases beyond 500 m, the interaction effect shifts into negative territory. If the distance to subway stations is also long at this point, the interaction effect reverts to being positive. A synergy between high SW and high DSM boosts UV, whereas a negative interplay occurs when high SW is combined with low DSM. When both SW and NDVI are high, they have a positive interaction effect on UV. However, when SW is high and NDVI is low, there is a negative interaction effect. In areas that are close to a park or square, a high SW yields a negative interaction effect on UV. A low SW, by contrast, results in a positive interaction effect in these areas.
In 15MCLC, in areas with low GVI, the interaction effect on UV diminishes as CII rises and shifts into negative territory when CII reaches 0.025. In the interaction between DSM and NDVI, in areas with low NDVI, the interaction effect on UV diminishes as the distance to subway stations increases and turns negative when DSM exceeds 500 m. In low-MBH areas, the positive VVI-MBH interaction on UV weakens with increasing VVI, until turning negative at a VVI of 0.035. In areas that are close to a park or square, a high CII yields a positive interaction effect on UV, whereas a low CII results in a negative interaction effect. In areas that are far from a park or square, a high CII leads to a negative interaction effect on UV, while a low CII produces a positive interaction effect.

4. Discussion

The existing research has made significant progress in exploring the nonlinear relationship between BE and UV [63], yet most studies focus on the street, block, and grid scales. In recent years, with the growing pursuit of high-quality living among residents, this study explores the nonlinear relationship between BE and UV from a resident perspective [1] and at the CLC scale. This study superimposes distinct temporal dimensions (weekdays/weekends, daytime/nighttime) on the basis of multi-scale CLC. It compares the effects of BE on UV across diverse spatiotemporal scenarios, and thus addresses the research gap in the temporal dimension within the existing literature [30]. Furthermore, this study explores the interactive effects of BE on UV across different scales of CLC. It aims to provide new insights for the optimization of the BE and differentiated planning of CLC. The subsequent discussions center on the core research findings.

4.1. Nonlinear Effects of BE on UV Across Multi-Scale CLC at Different Times

The existing research has confirmed that BE exerts significant effects on UV [30]. This study explores the variations in the effects of BE on UV across different spatiotemporal scenarios.
Within the density dimension, BD exhibits differentiated threshold effects across different spatiotemporal scenarios. In the 5MCLC, the higher daytime BD threshold can be attributed to greater daytime activity and the corresponding demand for space to accommodate social interactions [64]. At the large 10MCLC and 15MCLC scales, an excessively high BD can lead to spatial congestion and a decline in the quality of the spatial environment, thereby inhibiting UV [65]. Appropriate spatial compactness can boost UV, and blind high-density development should be avoided in urban planning practices.
The threshold of RD tends to decrease as the CLC scale increases. In 5MCLC, where roads are primarily dedicated to daily essential activities, a high RD is crucial for ensuring the continuity of pedestrian activity. In 15MCLC, roads gradually shift from serving residential needs to facilitating transportation for long-distance travel. For sustaining social activities, only the road network skeleton is sufficient. This reflects a shift in residents’ travel patterns from short-distance recreational walking to long-distance purposeful walking as their activity scope expands. The effect of RD on UV remains stable over time and is less affected by fluctuations in residents’ daily routines.
Within the diversity dimension, FMD is negatively associated with UV when exceeding 2.3 across most spatiotemporal scenarios. This is because when FMD is too high, urban functions become overly fragmented. However, there is a positive effect during the daytime in 5MCLC and during the daytime on weekdays in 15MCLC. This is because high FMD shortens the travel distance for residents’ daily activities in small-scale CLC during the daytime on weekdays. In large-scale CLC, a high FMD signifies a balance between jobs and housing alongside enhanced commerce, which facilitates more efficient and vibrant urban activity for weekday workers [66,67]. This reveals that the effect of FMD on UV is constrained by both the spatial scale and temporal dimension.
SVDI and FSI exhibit different nonlinear characteristics. As SVDI increases, its positive effect on UV strengthens, suggesting that adequate street facilities enhance the usability and safety, which in turn promotes greater street activity [64]. When SVDI exceeds 0.18, visual clutter caused by an overabundance of street elements reduces pedestrian comfort. For SVDI, its effect on UV at small scales is similar to that of FSI, except in 5MCLC during daytime on rest days, where a higher FSI yields a stronger positive effect on UV. This may be because residents tend to prioritize neighborhood interactions in small-scale CLC during the daytime on rest days, and most of these activities are unplanned street-based activities. However, at the large 15MCLC scale, an excessively high SVDI is often associated with fragmented street interfaces and a complex traffic environment, leading to a reduction in UV. This indicates that the configuration of street furniture should not blindly pursue diversity.
Within the design and accessibility dimension, GVI and NDVI maintain stable thresholds across all spatiotemporal scenarios. When SVF exceeds 0.5, it is negatively associated with UV. Unlike most studies [68], this finding may reflect Tianjin’s specific urban form. To further clarify why GVI and SVF suppress urban vitality, we use two representative block typologies in Tianjin’s historic urban core to explain this counterintuitive result. The first typology is the enclosed historic residential precinct, represented by the Five Great Avenues Modern Architectural Complex. This area features high GVI driven by mature street trees and private villa gardens. However, these green spaces are largely isolated from public pedestrian paths by walls and gated boundaries, making them visually lush but functionally inaccessible for daily street activities. Shaped by the historical concession culture, high green view indices in Tianjin’s urban core often coincide with enclosed historical precincts, government compounds, and low-density upscale residential communities. While such spaces have dense vegetation, their public accessibility is poor; in this context, high greenery marks spatial exclusivity, physically obstructing continuous street-level social interaction. In terms of spatial scale and functional layout, Tianjin’s urban planning is characterized by a clear separation of green spaces and gray spaces. High-GVI areas are predominantly located in country parks that are distant from commercial centers or along large ecological corridors. Despite their high ecological value, these areas present a spatial mismatch of “more green space, less vitality,” due to insufficient mixed-use development and limited proximity to populated areas. Therefore, within Tianjin’s urban context, a high greening index alone does not necessarily translate to improved UV. First, its high-density core is dominated by tower apartments, which typically feature low vegetation and high enclosure [69], limiting NDVI’s role. Furthermore, even where greening exists, improper placement can obstruct commercial facades and signage, impairing business, while effective greening in core commercial areas is often scarce [12,30]. Meanwhile, excessively high vegetation coverage occurs predominantly in low-density suburbs or pure green spaces without the population and facility density that are necessary for vibrant agglomeration [22]. The second typology consists of highly open and exposed urban spaces, typified by the Haihe River waterfront and large transportation plazas. These areas exhibit very high SVF with minimal building enclosure and weak wind protection. Such excessive openness directly weakens outdoor comfort and discourages pedestrian stay. Climatic factors exert a critical regulatory effect. Tianjin is characterized by cold and windy winters, while the high sky openness implies a lack of building obstruction. This significantly exacerbates the “wind chill effect” in outdoor spaces, thereby reducing pedestrians’ willingness to engage in urban activities and resulting in a negative correlation between high SVF and vitality across all scales. This aligns with findings by [70], who note that excessively high sky visibility can result in streetscapes that are overly wide, empty, and uninteresting, failing to attract pedestrian activity. Furthermore, such open spaces are detrimental to the pedestrian experience, as they fail to provide the psychological security and spatial definition that are needed to foster activity and the boundary effect [12]. These two typical typologies jointly explain why high GVI and high SVF correlate negatively with urban vitality in Tianjin, which differs from many existing studies conducted in cities with warmer climates and more open public green space systems. The threshold of MBH increases with the scale of CLC, and its effect on UV is relatively small at small scales. This suggests that for short trips, the human-scale building design improves UV by enhancing pedestrian safety [71]. High-rise buildings in large-scale CLC, which contain commercial offices, cultural entertainment and other functions, are more likely to become the core of social activities. The effect of PII on UV increases significantly as the scale expands, with a notable increase in the threshold. This may imply that average-quality venues are ineffective in large-scale CLC. However, urban centers or landmark-level spaces can attract people from a broader distance range on weekends. The appeal of such venues to the public far outweighs that of other venues.
Within the destination accessibility dimension, CA exhibits a significant scale effect. In 5MCLC and 10MCLC, commercial facilities within the range of 120 m can sustain social activities [31]. In 15MCLC, overly close commercial facilities may cause noise disturbances, traffic congestion and other issues, which are negatively associated with UV. This reflects that the function of commercial facilities expands with scale, transitioning from serving the neighborhood to the entire region. CLA and PSA exhibit similar characteristics. In resident behavior on weekends, individuals within large-scale CLC demonstrate a greater willingness to travel longer distances to access high-quality facilities such as downtown parks, which hold greater appeal during this period [72].
Within the distance to transition dimension, the threshold of DSB decreases as the CLC scale expands, with the nighttime threshold being higher than the daytime one. This is because daytime bus use is driven by commuting, demanding high stop accessibility, whereas nighttime travel is oriented toward leisure, allowing for greater distance tolerance. This is similar to the research conducted by [50]. Moreover, in 15MCLC, DSB exerts a phased negative effect on UV at lower values. This means that during prolonged walking activities, individuals’ transportation choices become more diverse [73]. DSM maintains a stable negative effect threshold across all spatiotemporal scenarios, reflecting that subway transportation can drive UV across all scales [72]. In addition, the high DSM threshold on weekends during the daytime indicates that residents’ leisure demands have expanded, and subway stations have grown in attractiveness for residents’ activities. The SW threshold in 5MCLC is generally low, indicating that walking convenience and connectivity are crucial for sustaining small-scale UV [74]. A negative effect on UV is observed at low VVI, while a positive effect occurs at high VVI, indicating that vehicle presence is closely associated with a vibrant spatial environment [74]. However, a significant fluctuation is observed in the effect of 5MCLC, indicating residents’ preference for car-free, high-quality walking when undertaking short-distance travel on weekends.
Among all indicators, its effect on UV on weekdays is more regular than on weekends, with individual activities being more random on the latter. This indicates that individuals’ daily routines are more regular and predictable on weekdays [72].

4.2. Interactive Effects of BE on UV Across Multi-Scale CLC

In addition to the individual effects of BE indicators, the interactive effects among various indicators also exert a significant influence on UV. Through SHAP interaction analysis, this study identifies several key variable combinations of CLC across different scales, thereby revealing the interactive effects among these indicators.
In 5MCLC, in the interaction between BD and MBH, high density coupled with vertical development significantly enhances UV, whereas low-quality high-density-induced crowded environments tend to weaken UV. This finding indicates that the combination of high density and vertical development can effectively boost UV by agglomerating populations and facilities, whereas low-rise high density exerts an antagonistic effect due to spatial compression, thereby inhibiting UV generation [75].This further implies that urban planning should prioritize the construction of vertically integrated spatial forms, rather than engaging in the blind agglomeration of buildings, which can otherwise lead to street congestion. The interaction between CLA and MBH suggests that high-rise residential areas should be equipped with cultural and leisure facilities within short walking distances to meet the daily demands of residents. In addition, the interaction between BD and DSM reveals that the combination of high density and accessible subway transit may give rise to overcrowding and traffic congestion, thus necessitating a balanced planning approach through rational spatial layout optimization [50]. When high FMD and high FSI coexist, FMD attracts crowds by providing diverse public activity spaces, while FSI supports these crowds with a varied street environment, thereby enhancing their willingness to remain.
In the 10MCLC, the interaction between PSA and DSM can be attributed to the retention of local activity vitality by prominent park and square hotspots and self-sufficient clusters on the fringe of built-up areas [69]. The interactions between SW and DSM, and between SW and NDVI, reveal that a high-quality street environment requires adequate greening and separation from subway-related disturbances to more effectively boost UV. The negative interaction when both SW and PSA are at high values indicates that excessive street openness and close proximity to parks and squares may impede the conduct of social activities, and overly exposed spaces can lead to a decline in pedestrian flow [64].
High-quality streets provide ample leisure and social spaces, rendering adjacent parks redundant and even exerting a suppressive effect on UV through crowd diversion. Conversely, in walk-impermeable areas, nearby parks can significantly boost UV.
In the 15MCLC, the CII-GVI interaction reveals that excessive cultural and leisure facility concentration in greenery-lacking gray spaces induces environmental oppression and spatial fatigue, inhibiting residents’ outdoor activities. The interaction between DSM and NDVI reveals that areas that are remote from subway stations and lacking sufficient vegetation coverage suffer from a dual deficit in accessibility and environmental quality, making it difficult to form vibrant agglomerations. The interaction between VVI and MBH implies that low-rise residential areas should minimize vehicular interference, prioritize pedestrian flow, and protect residential streets from pedestrian vehicle conflicts. When an area is in close proximity to a park or square, a high CII value can effectively boost UV, reflecting the agglomeration effect of parks and squares as core public spaces for social interaction.

4.3. Policy Implications

Based on the identified nonlinear relationship between BE and UV and the interactions among indicators in this study, targeted policy recommendations are proposed to support urban planning optimization and urban residents’ quality of life improvement.
For the 5MCLC, where RD is critical for commuting and community services, a density of 9.64–11.34 km/km2 is recommended to ensure continuous pedestrian activity. Within a 120 m radius, convenience stores, small eateries, and community parks should be allocated to meet residents’ immediate daily needs. Meanwhile, the layout of bus stops should be optimized to ensure that the distance to the nearest bus stop is no more than 286.9 m, thus meeting the high commuting demand on weekdays. The 10MCLC should be designed to balance daily living convenience with the transitional function of connecting to broader urban scales. Priority should be given to subway station coverage, the radius of residents’ activities should be expanded, and bus and subway station layouts should be coordinated to form a complementary transit system. We should increase the frequency of public transit linking commercial districts and urban parks and extend the opening hours of cultural and leisure facilities including museums and theaters, thereby offsetting the vitality deficits arising from distance-related issues on weekends. In 15MCLC, BD should be controlled at 0.29 to avoid environmental quality degradation caused by overdevelopment. In this scale, UV on weekends is more robust, a feature that can be leveraged to optimize urban park landscape design and enhance their attractiveness for weekend gatherings. Measures should be taken to adjust the layout of commercial facilities and add 24 h convenience stores in areas with high UV.

4.4. Limitations and Future Research

Although this study presents an in-depth analysis of the spatiotemporal effects of BE on UV, several limitations remain that warrant further investigation in future research. This study takes Tianjin as a single case study, yet variations may exist in both BE characteristics and residents’ activity patterns across cities with disparate development levels, geographical locations, and cultural backgrounds. Thus, the generalizability of the research conclusions requires verification across a broader range of regions. This study focuses on physical BE indicators and does not incorporate socioeconomic factors (such as residents’ income levels, age structure, and consumption capacity) as well as policy factors, including urban renewal policies and facility operation mechanisms, which may regulate the relationship between BE and UV. Second, this study uses Baidu heatmap-based population density as the proxy for urban vitality. Although this indicator is widely used and can effectively reflect the spatial agglomeration intensity, it cannot fully capture the diversity and quality of urban activities. Future studies can integrate multi-source data to construct a more comprehensive vitality evaluation system under the premise of ensuring data consistency and comparability.
Future research can conduct a more comprehensive analysis of UV within CLC from multi-dimensional perspectives, including spatiotemporal, functional, and perceptual dimensions, via approaches such as functional zone comparison. Based on the dominant functions of CLC, subsequent research can classify CLC by their functional attributes and compare the heterogeneous effects of BE on UV across distinct CLC types, aiming to propose more targeted optimization strategies for urban planning and community renewal.
The methodology proposed in this study exhibits considerable potential for cross-scenario adaptability. This method incorporates multi-source data, multi-scale community life circle delineation, and the XGBoost-SHAP model, demonstrating coherent core logic and high practical value. However, targeted adjustments remain necessary when applying this framework to different urban contexts.
For large cities characterized by high-density BE, similar to Tianjin’s traditional urban core, the delineation logic for 5MCLC, 10MCLC, and 15MCLC remains applicable. It can better correspond to the activity patterns of residents and the spatial distribution characteristics of public service facilities in such urban contexts.
For small and medium-sized cities and suburban areas, more targeted and context-specific adjustments are required. Firstly, certain indicators may require simplification. For instance, the distance to subway station (DSM) indicator could be removed, while indicators related to bus accessibility may be incorporated, to better reflect the actual travel patterns in which residents of small and medium-sized cities depend on a variety of public transport modes. Secondly, the scope of community life circles needs to be adjusted accordingly. Given the sparse distribution of public service facilities in suburban areas, residents in such regions typically have a larger activity radius. Accordingly, the 15MCLC may be expanded to 20–30 MCLC to fully cover their daily activity space.

5. Conclusions

This study incorporates the temporal dimension (weekdays/weekends, daytime/nighttime) to explore the nonlinear threshold effects and interactive effects of the BE on UV in multi-scale CLC. The principal conclusions are as follows:
(1)
UV demonstrates pronounced variations across different spatial scales in Tianjin. The 10MCLC exhibits the highest UV, retaining the convenience of the 5MCLC while providing more comprehensive commercial facilities and public spaces, and achieving a balance between convenience and comfort. The 15MCLC exhibits a UV level close to that of the 10MCLC, yet vitality in its marginal areas is insufficient. The 5MCLC exhibits the lowest UV, which is primarily driven by neighborhood-oriented and walkable facilities. The 5MCLC is dominated by regular daily activities, with higher UV on weekdays. The 10MCLC and 15MCLC are more strongly influenced by leisure activities, with more vigorous UV on weekends.
(2)
In the ranking of the relative influence of BE on UV, MBH and NDVI consistently rank at the top. The relative influence rankings of indicators including DSM, DSB, CA, BD, GVI, and SVF vary significantly across different spatiotemporal scenarios. The relative influence of GVI, SVF, and PII increases with the increasing scale. Conversely, the relative influence of CA, DSB, BD, and CLA decreases with the increasing scale. The relative influence of PSA on weekends increases significantly with scale. The relative influence of CII during nighttime is greater than that during daytime. Unlike previous studies, GVI and SVF are negatively associated with UV.
(3)
The effects of BE on UV exhibits nonlinear characteristics, featuring a distinct threshold range that dynamically changes with scale expansion and temporal progression. The nonlinear relationship between BE and UV on weekdays exhibits greater regularity. MBH and NDVI are core indicators that exert effects on UV across all spatiotemporal scenarios. The effects of indicators including BD, RD, MBH, NDVI, CLA, and DSM exhibit strong scale effects and temporal heterogeneity. In terms of scale, as the scale increases, the threshold of RD decreases, while the thresholds of MBH and NDVI increase. Higher BD will exert greater negative effects on UV. In terms of time, the threshold of CLA is higher on weekdays than on weekends, while the threshold of DSM is higher on weekends than on weekdays.
(4)
The interactions between BD and MBH and DSM, between PSA and SW, CII and DSM, and between DSM and SW, NDVI, and other BE indicators are significant. A balance between these BE indicators needs to be achieved through the rational spatial layout and systematic regulation of different BE, in order to effectively enhance UV.
The innovation of this study lies in revealing the nonlinear effects of BE on UV and the interaction mechanism among various indicators from the dual perspective of multi-scale and multi-temporal dimensions. It addresses the deficiencies in the existing research regarding comparisons across scales and time dimensions, providing a scientific basis for urban renewal and CLC construction. CLC planning should adhere to three core principles: development tailored to scale-specific characteristics, management aligned with temporal rhythms, and design accounting for interactive effects among BE indicators. These findings integrate spatial scale characteristics with residents’ activity temporal rhythms, providing theoretical references for CLC planning and targeted policy formulation.

Author Contributions

Conceptualization, Enxu Wang; methodology, Enxu Wang and Runya Fu; software, Runya Fu; validation, Enxu Wang and Runya Fu; formal analysis, Enxu Wang; resources, Enxu Wang and Runya Fu; data curation, Runya Fu; writing—original draft preparation, Enxu Wang and Runya Fu; writing—review and editing, Enxu Wang and Runya Fu; visualization, Runya Fu; supervision, Enxu Wang; funding acquisition, Enxu Wang; investigation, Enxu Wang and Runya Fu. All authors have read and agreed to the published version of the manuscript.

Funding

This research was funded by the Key Project of Liaoning Provincial Social Science Planning Foundation (L25AGL007) and the 20th Batch of Innovative Training Program for Undergraduates at Northeastern University (261571).

Data Availability Statement

Data will be made available upon request.

Conflicts of Interest

The authors declare no conflicts of interest.

Abbreviations

The following abbreviations are used in this manuscript:
BDBuilding Density
RDRoad Density (km/km2)
CIICrowd Interactivity Index
FMDFunctional Mix Degree
SVDIStreet Visual Diversity Index
FSIFurniture Support Index
NDVINormalized Difference Vegetation Index
MBHMean Building Height (m)
GVIGreen View Index
SVFSky View Factor
PIIPlace Imageability Index
CACommercial Accessibility (m)
CLACultural and Leisure Accessibility (m)
PSAPark and Square Accessibility (m)
DSBDistance to Bus
DSMDistance to Metro
SWSpatial Walkability
VVIVehicle Visibility Index

References

  1. Wang, X.; Zhang, Y.; Li, C.; Yin, C.; Shao, C. Investigating nonlinear and spatially heterogeneous impacts of the built environment on urban vitality. Sustain. Cities Soc. 2025, 135, 107033. [Google Scholar] [CrossRef] [Scilit]
  2. Li, X.; Li, Y.; Jia, T.; Zhou, L.; Hijazi, I.H. The six dimensions of built environment on urban vitality: Fusion evidence from multi-source data. Cities 2022, 121, 103482. [Google Scholar] [CrossRef] [Scilit]
  3. Li, J.; Chen, Y.; Zhao, D.; Zhai, J. The Impact of Built Environment on Mixed Land Use: Evidence from Xi’an. Land 2024, 13, 2214. [Google Scholar] [CrossRef] [Scilit]
  4. Kohl, H.W.; Craig, C.L.; Lambert, E.V.; Inoue, S.; Alkandari, J.R.; Leetongin, G.; Kahlmeier, S. The pandemic of physical inactivity: Global action for public health. Lancet 2012, 380, 294–305. [Google Scholar] [CrossRef] [Scilit]
  5. Xia, C.; Yeh, A.G.-O.; Zhang, A. Analyzing spatial relationships between urban land use intensity and urban vitality at street block level: A case study of five Chinese megacities. Landsc. Urban Plan. 2020, 193, 103669. [Google Scholar] [CrossRef] [Scilit]
  6. Jacobs, J. The Death and Life of Great American Cities; Random House: New York, NY, USA, 1961. [Google Scholar]
  7. Lynch, K. Good City Form; MIT Press: Cambridge, MA, USA, 1984. [Google Scholar]
  8. Gehl, J. Life Between Buildings; Island Press: Washington, DC, USA, 2011. [Google Scholar]
  9. Montgomery, J. Making a city: Urbanity, vitality and urban design. J. Urban Des. 1998, 3, 93–116. [Google Scholar] [CrossRef] [Scilit]
  10. Sheng, J.; He, Y.; Lu, T.; Wang, F.; Huang, Y.; Leng, B.; Zhang, X.; Chen, Y. Unveiling urban vitality and its interactions in mountainous cities: A human behaviour perspective on community-level dynamics. Cities 2025, 159, 105780. [Google Scholar] [CrossRef] [Scilit]
  11. Balram, S.; Dragićević, S. Attitudes toward urban green spaces: Integrating questionnaire survey and collaborative GIS techniques to improve attitude measurements. Landsc. Urban Plan. 2005, 71, 147–162. [Google Scholar] [CrossRef]
  12. Li, Y.; Yabuki, N.; Fukuda, T. Exploring the association between street built environment and street vitality using deep learning methods. Sustain. Cities Soc. 2022, 79, 103656. [Google Scholar] [CrossRef] [Scilit]
  13. Xie, Q.; Cai, C.; Jiang, Y.; Zhang, H.; Wu, Z.; Xu, J. Investigating the performance of SDGSAT-1/GIU and NPP/VIIRS nighttime light data in representing nighttime vitality and its relationship with the built environment: A comparative study in Shanghai, China. Ecol. Indic. 2024, 160, 111945. [Google Scholar] [CrossRef] [Scilit]
  14. Pan, H.; Yang, C.; Quan, L.; Liao, L. A New Insight into Understanding Urban Vitality: A Case Study in the Chengdu-Chongqing Area Twin-City Economic Circle, China. Sustainability 2021, 13, 10068. [Google Scholar] [CrossRef] [Scilit]
  15. Tu, W.; Cao, J.Z.; Yue, Y.; Shaw, S.L.; Zhou, M.; Wang, Z.S.; Chang, X.M.; Xu, Y.; Li, Q.Q. Coupling mobile phone and social media data: A new approach to understanding urban functions and diurnal patterns. Int. J. Geogr. Inf. Sci. 2017, 31, 2331–2358. [Google Scholar] [CrossRef] [Scilit]
  16. Kim, Y.L. Seoul’s Wi-Fi hotspots: Wi-Fi access points as an indicator of urban vitality. Comput. Environ. Urban Syst. 2018, 72, 13–24. [Google Scholar] [CrossRef] [Scilit]
  17. Huang, X.; Jiang, P.; Li, M.; Zhao, X. Applicable Framework for Evaluating Urban Vitality with Multiple-Source Data: Empirical Research of the Pearl River Delta Urban Agglomeration Using BPNN. Land 2022, 11, 1901. [Google Scholar] [CrossRef] [Scilit]
  18. Rui, J.; Li, X. Decoding vibrant neighborhoods: Disparities between formal neighborhoods and urban villages in eye-level perceptions and physical environment. Sustain. Cities Soc. 2024, 101, 105122. [Google Scholar] [CrossRef] [Scilit]
  19. Jiang, Y.; Sun, Z.; Wei, D.; Zhao, P.; Yang, L.; Lu, Y. Revealing the spatiotemporal pattern of urban vibrancy at the urban agglomeration scale: Evidence from the Pearl River Delta, China. Appl. Geogr. 2025, 181, 103694. [Google Scholar] [CrossRef] [Scilit]
  20. Cheng, Z.; Li, X.; Zhang, Q. Can new-type urbanization promote the green intensive use of land? J. Environ. Manag. 2023, 342, 118150. [Google Scholar] [CrossRef] [Scilit]
  21. Liu, P.; Zhu, B. Temporal-spatial evolution of green total factor productivity in China’s coastal cities under carbon emission constraints. Sustain. Cities Soc. 2022, 87, 104231. [Google Scholar] [CrossRef] [Scilit]
  22. Mouratidis, K.; Poortinga, W. Built environment, urban vitality and social cohesion: Do vibrant neighborhoods foster strong communities? Landsc. Urban Plan. 2020, 204, 103951. [Google Scholar] [CrossRef] [Scilit]
  23. Asfour, O.S.; Zourob, N. The neighbourhood unit adequacy: An analysis of the case of Gaza, Palestine. Cities 2017, 69, 1–11. [Google Scholar] [CrossRef] [Scilit]
  24. Moreno, C.; Allam, Z.; Chabaud, D.; Gall, C.; Pratlong, F. Introducing the “15-Minute City”: Sustainability, Resilience and Place Identity in Future Post-Pandemic Cities. Smart Cities 2021, 4, 93–111. [Google Scholar] [CrossRef] [Scilit]
  25. Teixeira, J.F.; Silva, C.; Seisenberger, S.; Büttner, B.; McCormick, B.; Papa, E.; Cao, M. Classifying 15-minute Cities: A review of worldwide practices. Transp. Res. Part A Policy Pract. 2024, 189, 104234. [Google Scholar] [CrossRef] [Scilit]
  26. Khavarian-Garmsir, A.R.; Sharifi, A.; Sadeghi, A. The 15-minute city: Urban planning and design efforts toward creating sustainable neighborhoods. Cities 2023, 132, 104101. [Google Scholar] [CrossRef] [Scilit]
  27. Nica, I.; Delcea, C.; Ionescu, Ș. Urban accessibility and digital transformation: A bibliometric study of the 15-Minute City and smart city technologies. Cities 2026, 171, 106797. [Google Scholar] [CrossRef] [Scilit]
  28. Liu, W.; Zheng, S.; Hu, X.; Wu, Z.; Chen, S.; Huang, Z.; Zhang, W. Effects of spatial scale on the built environments of community life circles providing health functions and services. Build. Environ. 2022, 223, 109492. [Google Scholar] [CrossRef] [Scilit]
  29. Song, L.; Kong, X.; Cheng, P. Supply-demand matching assessment of the public service facilities in 15-minute community life circle based on residents’ behaviors. Cities 2024, 144, 104637. [Google Scholar] [CrossRef] [Scilit]
  30. He, S.; Zhang, Z.; Yu, S.; Xia, C.; Tung, C.-L. Investigating the effects of urban morphology on vitality of community life circles using machine learning and geospatial approaches. Appl. Geogr. 2024, 167, 103287. [Google Scholar] [CrossRef] [Scilit]
  31. Liu, K.; Zhou, D.; Qi, Y.; Zhang, M.; Ren, Y.; Wei, Y.; Wang, J. Exploring the Complex Effects and Their Spatial Associations of the Built Environment on the Vitality of Community Life Circles Using an eXtreme Gradient Boosting–SHapley Additive exPlanations Approach: A Case Study of Xi’an. Buildings 2025, 15, 1372. [Google Scholar] [CrossRef] [Scilit]
  32. Liu, D.; Shi, Y. The Influence Mechanism of Urban Spatial Structure on Urban Vitality Based on Geographic Big Data: A Case Study in Downtown Shanghai. Buildings 2022, 12, 569. [Google Scholar] [CrossRef] [Scilit]
  33. Zhang, A.; Li, W.; Wu, J.; Lin, J.; Chu, J.; Xia, C. How can the urban landscape affect urban vitality at the street block level? A case study of 15 metropolises in China. Environ. Plan. B Urban Anal. City Sci. 2021, 48, 1245–1262. [Google Scholar] [CrossRef] [Scilit]
  34. Cervero, R.; Kockelman, K. Travel demand and the 3Ds: Density, diversity, and design. Transp. Res. Part D Transp. Environ. 1997, 2, 199–219. [Google Scholar] [CrossRef] [Scilit]
  35. Chen, J.; Tian, W.; Xu, K.; Pellegrini, P. Testing Small-Scale Vitality Measurement Based on 5D Model Assessment with Multi-Source Data: A Resettlement Community Case in Suzhou. ISPRS Int. J. Geo-Inf. 2022, 11, 626. [Google Scholar] [CrossRef] [Scilit]
  36. Lai, G.; Shang, Y.; He, B.; Zhao, G.; Yang, M. Revealing Taxi Interaction Network of Urban Functional Area Units in Shenzhen, China. ISPRS Int. J. Geo-Inf. 2022, 11, 377. [Google Scholar] [CrossRef] [Scilit]
  37. Badrinarayanan, V.; Kendall, A.; Cipolla, R. SegNet: A Deep Convolutional Encoder-Decoder Architecture for Image Segmentation. IEEE Trans. Pattern Anal. Mach. Intell. 2017, 39, 2481–2495. [Google Scholar] [CrossRef] [Scilit]
  38. Shen, Q.; Zeng, W.; Ye, Y.; Arisona, S.M.; Schubiger, S.; Burkhard, R.; Qu, H. StreetVizor: Visual Exploration of Human-Scale Urban Forms Based on Street Views. IEEE Trans. Vis. Comput. Graph. 2018, 24, 1004–1013. [Google Scholar] [CrossRef] [Scilit]
  39. Wang, H.; Yang, Y. Neighbourhood walkability: A review and bibliometric analysis. Cities 2019, 93, 43–61. [Google Scholar] [CrossRef] [Scilit]
  40. Lu, S.; Shi, C.; Yang, X. Impacts of Built Environment on Urban Vitality: Regression Analyses of Beijing and Chengdu, China. Int. J. Environ. Res. Public Health 2019, 16, 4592. [Google Scholar] [CrossRef] [Scilit]
  41. Fotheringham, A.S.; Yang, W.; Kang, W. Multiscale Geographically Weighted Regression (MGWR). Ann. Am. Assoc. Geogr. 2017, 107, 1247–1265. [Google Scholar] [CrossRef] [Scilit]
  42. Zhang, W.; Zhao, Y.; Cao, X.; Lu, D.; Chai, Y. Nonlinear effect of accessibility on car ownership in Beijing: Pedestrian-scale neighborhood planning. Transp. Res. Part D Transp. Environ. 2020, 86, 102445. [Google Scholar] [CrossRef] [Scilit]
  43. Xiao, L.; Lo, S.; Liu, J.; Zhou, J.; Li, Q. Nonlinear and synergistic effects of TOD on urban vibrancy: Applying local explanations for gradient boosting decision tree. Sustain. Cities Soc. 2021, 72, 103063. [Google Scholar] [CrossRef] [Scilit]
  44. Yang, L.; Ao, Y.; Ke, J.; Lu, Y.; Liang, Y. To walk or not to walk? Examining non-linear effects of streetscape greenery on walking propensity of older adults. J. Transp. Geogr. 2021, 94, 103099. [Google Scholar] [CrossRef] [Scilit]
  45. Sun, F.; Wang, E. Unveiling the Spatial Heterogeneity of Urban Vitality Using Machine Learning Methods: A Case Study of Tianjin, China. Land 2025, 14, 1316. [Google Scholar] [CrossRef] [Scilit]
  46. Tian, Y.; Kong, X.; Liu, Y. Combining weighted daily life circles and land suitability for rural settlement reconstruction. Habitat Int. 2018, 76, 1–9. [Google Scholar] [CrossRef] [Scilit]
  47. Millward, H.; Spinney, J.; Scott, D. Active-transport walking behavior: Destinations, durations, distances. J. Transp. Geogr. 2013, 28, 101–110. [Google Scholar] [CrossRef] [Scilit]
  48. Fang, L.; Huang, J.L.; Zhang, Z.Y.; Nitivattananon, V. Data-driven framework for delineating urban population dynamic patterns: Case study on Xiamen Island, China. Sustain. Cities Soc. 2020, 62, 102365. [Google Scholar] [CrossRef] [Scilit] [PubMed]
  49. Lyu, G.; Angkawisittpan, N.; Fu, X.; Sonasang, S. Enhancing urban vitality through big data: A case study of Yinchuan City using GWR and GBDT models. Sci. Rep. 2023. [Google Scholar] [CrossRef] [Scilit]
  50. Yang, J.; Cao, J.; Zhou, Y. Elaborating non-linear associations and synergies of subway access and land uses with urban vitality in Shenzhen. Transp. Res. Part A Policy Pract. 2021, 144, 74–88. [Google Scholar] [CrossRef] [Scilit]
  51. Gong, F.-Y.; Yang, Z.; Deng, S. Fine-scale assessment of diurnal heat health risk based on satellite and street view images. Cities 2025, 162, 105963. [Google Scholar] [CrossRef] [Scilit]
  52. Wu, W.; Tan, W.; Wang, R.; Chen, W.Y. From quantity to quality: Effects of urban greenness on life satisfaction and social inequality. Landsc. Urban Plan. 2023, 238, 104843. [Google Scholar] [CrossRef] [Scilit]
  53. Lu, Y. The Association of Urban Greenness and Walking Behavior: Using Google Street View and Deep Learning Techniques to Estimate Residents’ Exposure to Urban Greenness. Int. J. Environ. Res. Public Health 2018, 15, 1576. [Google Scholar] [CrossRef] [Scilit]
  54. Yu, Y.; Jiang, Y.; Qiu, N.; Guo, H.; Han, X.; Guo, Y. Exploring built environment factors on e-bike travel behavior in urban China: A case study of Jinan. Front. Public Health 2022, 10, 1013421. [Google Scholar] [CrossRef] [Scilit]
  55. Yang, J.; Dong, J.; Xiao, X.; Dai, J.; Wu, C.; Xia, J.; Zhao, G.; Zhao, M.; Li, Z.; Zhang, Y.; et al. Divergent shifts in peak photosynthesis timing of temperate and alpine grasslands in China. Remote Sens. Environ. 2019, 233, 111395. [Google Scholar] [CrossRef] [Scilit]
  56. Tan, W.; Wei, C.; Lu, Y.; Xue, D. Reconstruction of All-Weather Daytime and Nighttime MODIS Aqua-Terra Land Surface Temperature Products Using an XGBoost Approach. Remote Sens. 2021, 13, 4723. [Google Scholar] [CrossRef] [Scilit]
  57. Zhang, X.; Yan, C.; Gao, C.; Malin, B.A.; Chen, Y. Predicting Missing Values in Medical Data Via XGBoost Regression. J. Healthc. Inform. Res. 2020, 4, 383–394. [Google Scholar] [CrossRef] [Scilit]
  58. Ester, M.; Kriegel, H.P.; Xu, X. XGBoost: A scalable tree boosting system. In Proceedings of the 22Nd ACM SIGKDD International Conference on Knowledge Discovery and Data Mining, San Francisco, CA, USA, 13–17 August 2016; Geographical Analysis 2022. p. 785. [Google Scholar]
  59. Lundberg, S.M.; Lee, S.-I. A unified approach to interpreting model predictions. arXiv 2017, arXiv:1705.07874. [Google Scholar] [CrossRef] [Scilit]
  60. Lundberg, S.M.; Erion, G.; Chen, H.; DeGrave, A.; Prutkin, J.M.; Nair, B.; Katz, R.; Himmelfarb, J.; Bansal, N.; Lee, S.-I. From local explanations to global understanding with explainable AI for trees. Nat. Mach. Intell. 2020, 2, 56–67. [Google Scholar] [CrossRef] [Scilit] [PubMed]
  61. Tamim Kashifi, M.; Jamal, A.; Samim Kashefi, M.; Almoshaogeh, M.; Masiur Rahman, S. Predicting the travel mode choice with interpretable machine learning techniques: A comparative study. Travel Behav. Soc. 2022, 29, 279–296. [Google Scholar] [CrossRef] [Scilit]
  62. Yang, J.; Wang, E. Exploring the Nonlinear Impacts of Built Environment on Urban Vitality from a Spatiotemporal Perspective at the Block Scale in Chongqing. ISPRS Int. J. Geo-Inf. 2025, 14, 225. [Google Scholar] [CrossRef] [Scilit]
  63. Chen, L.; Zhao, L.Y.; Xiao, Y.; Lu, Y. Investigating the spatiotemporal pattern between the built environment and urban vibrancy using big data in Shenzhen, China. Comput. Environ. Urban Syst. 2022, 95, 101827. [Google Scholar] [CrossRef] [Scilit]
  64. Lee, S.; Cho, N. Nonlinear and interaction effects of multi-dimensional street-level built environment features on urban vitality in Seoul. Cities 2025, 165, 106145. [Google Scholar] [CrossRef] [Scilit]
  65. Zhang, Y.; Wang, X.; Ye, Y.; Wang, L.; Zhang, Y.; Qin, W.; Chi, Y.; Liu, G.; Yao, S. Nonlinear relationships and interaction effects of urban built environment on urban vitality based on explainable machine learning. City Environ. Interact. 2025, 28, 100244. [Google Scholar] [CrossRef] [Scilit]
  66. Yue, Y.; Zhuang, Y.; Yeh, A.G.O.; Xie, J.Y.; Ma, C.L.; Li, Q.Q. Measurements of POI-based mixed use and their relationships with neighbourhood vibrancy. Int. J. Geogr. Inf. Sci. 2017, 31, 658–675. [Google Scholar] [CrossRef] [Scilit]
  67. Jiang, Y.; Han, Y.; Liu, M.; Ye, Y. Street vitality and built environment features: A data-informed approach from fourteen Chinese cities. Sustain. Cities Soc. 2022, 79, 103724. [Google Scholar] [CrossRef] [Scilit]
  68. Zhou, H.; Gu, J.; Liu, Y.; Wang, X. The impact of the “skeleton” and “skin” for the streetscape on the walking behavior in 3D vertical cities. Landsc. Urban Plan. 2022, 227, 104543. [Google Scholar] [CrossRef] [Scilit]
  69. Ming, Y.; Liu, Y.; Li, Y.; Yue, W. Core-periphery disparity in community vitality in Chongqing, China: Nonlinear explanation based on mobile phone data and multi-scale factors. Appl. Geogr. 2024, 164, 103222. [Google Scholar] [CrossRef] [Scilit]
  70. Qiao, W.; Zheng, H. Predicting urban vitality and pedestrian road safety in urban areas based on machine learning. Cities 2025, 166, 106193. [Google Scholar] [CrossRef] [Scilit]
  71. Lian, A.; Zhang, Y.; Cai, Y.; Wang, Z.; Sun, X.; Jiao, Y.; Dong, R. Exploring the nonlinear relationship and interaction effects between the built environment and street vitality using machine learning methods. Ecol. Front. 2026, 46, 932–946. [Google Scholar] [CrossRef] [Scilit]
  72. Chen, Y.; Yu, B.; Shu, B.; Yang, L.; Wang, R. Exploring the spatiotemporal patterns and correlates of urban vitality: Temporal and spatial heterogeneity. Sustain. Cities Soc. 2023, 91, 104440. [Google Scholar] [CrossRef] [Scilit]
  73. Sung, H.; Lee, S. Residential built environment and walking activity: Empirical evidence of Jane Jacobs’ urban vitality. Transp. Res. Part D Transp. Environ. 2015, 41, 318–329. [Google Scholar] [CrossRef] [Scilit]
  74. Doan, Q.C.; Ma, J.; Chen, S.; Zhang, X. Nonlinear and threshold effects of the built environment, road vehicles and air pollution on urban vitality. Landsc. Urban Plan. 2025, 253, 105204. [Google Scholar] [CrossRef] [Scilit]
  75. Lin, J.Y.; Zhuang, Y.Y.; Zhao, Y.; Li, H.; He, X.Y.; Lu, S.Y. Measuring the Non-Linear Relationship between Three-Dimensional Built Environment and Urban Vitality Based on a Random Forest Model. Int. J. Environ. Res. Public Health 2023, 20, 734. [Google Scholar] [CrossRef] [Scilit] [PubMed]
Figure 1. Location of the study area.
Ijgi 15 00190 g001
Figure 2. The 5MCLC, 10MCLC and 15MCLC of a community in Tianjin.
Ijgi 15 00190 g002
Figure 3. Research framework.
Ijgi 15 00190 g003
Figure 4. Extract various elements from street view images via semantic segmentation.
Ijgi 15 00190 g004
Figure 5. Spatial distribution of BE indicators (based on community boundaries due to overlaps between CLC).
Ijgi 15 00190 g005
Figure 6. Spatial distribution of UV across different spatiotemporal scenarios (based on community boundaries due to overlaps between CLC).
Ijgi 15 00190 g006
Figure 7. Relative influence of BE indicators across different spatiotemporal scenarios.
Ijgi 15 00190 g007
Figure 8. Bee swarm plot of various BE indicators across different spatiotemporal scenarios.
Ijgi 15 00190 g008
Figure 9. Nonlinear effects of density and diversity on UV at the CLC scale.
Ijgi 15 00190 g009
Figure 10. Nonlinear effects of design and destination accessibility on UV at the CLC scale.
Ijgi 15 00190 g010
Figure 11. Nonlinear effects of distance to transit on UV at the CLC scale.
Ijgi 15 00190 g011
Figure 12. The interaction between BE and UV in multi-scale CLC.
Ijgi 15 00190 g012
Table 1. Based on the “5D” dimension BE indicator system.
DimensionIndicatorAbbr.DescriptionData Source
DensityBuilding DensityBDBuilding footprint area/CLC areaAmap
Road Density (km/km2)RDTotal road length inside the CLC (outward-facing roads)/CLC areaOSM data
Crowd Interactivity IndexCIIThe density of pedestrians, cyclists and non-motor vehicles on roads
CII = VIperson + VIrider + VIbicycle/VIsidewalk + VIroad
Baidu Map
DiversityFunctional Mix DegreeFMDDiversity index of various POIs within the CLC (calculated using Shannon’s diversity index)Amap
Street Visual Diversity IndexSVDIThe area proportion of roads, sidewalks, fences, poles, street lamps and traffic signs
SVDI = VIroad + VIsidewalk + VIfence + VIpole + VIstrlgt + VIstrsig
Baidu Map
Furniture Support IndexFSIThe area proportion of fences, street lamps and traffic signs
FSI = VIfence + VIstrlgt + VIstrsig
Baidu Map
DesignNormalized Difference Vegetation IndexNDVIAverage fractional vegetation cover within the CLCGoogle Earth Engine
Mean Building Height (m)MBHAverage building height within the CLCAmap
Green View IndexGVIVegetation coverage percentage
GVI = VIvegetation
Baidu Map
Sky View FactorSVFSky visibility percentage
SVF = VIsky
Baidu Map
Place Imageability IndexPIIThe proportion of buildings, vegetation and streets
PII = VIbuilding + VIvegetation + VIstrsig
Baidu Map
Destination AccessibilityCommercial Accessibility (m)CADistance from CLC centroid to nearest commercial POIAmap
Cultural and Leisure Accessibility (m)CLADistance from CLC centroid to nearest cultural and leisure POIAmap
Park and Square Accessibility (m)PSADistance from CLC centroid to nearest park or squareAmap
Distance to TransitionDistance to BusDSBDistance from CLC centroid to nearest bus stopsAmap
Distance to MetroDSMDistance from CLC centroid to nearest metro stationAmap
Spatial WalkabilitySWThe ratio of pedestrian traffic facilities (sidewalks, fences) to roads
SW = VIsidewalk + VIfence/VIroad
Baidu Map
Vehicle Visibility IndexVVIThe proportion of vehicle (cars, trucks, trains, buses and motorcycles) pixels in the image
VII = VIcar + VItruck + VIbus + VItrain + VImotorcycle
Baidu Map
Table 2. Optimal hyperparameters of the XGBoost model across distinct spatiotemporal contexts.
Learning_RateMax_DepthN_Estimators
5MCLC Weekdays Daytime, 5MCLC Weekdays Nighttime0.054100
10MCLC Weekdays Nighttime, 10MCLC Weekends Daytime, 10MCLC Weekends Nighttime, 15MCLC Weekdays Daytime, 15MCLC Weekends Daytime0.14100
10MCLC Weekdays Daytime, 15MCLC Weekdays Nighttime, 15MCLC Weekends Nighttime0.154100
5MCLC Weekends Daytime0.1350
5MCLC Weekends Nighttime0.05450
Table 3. R2, RMSE, and MAE across distinct spatiotemporal contexts.
Training Set R2Test Set R2Training Set RMSETest Set RMSETraining Set MAETest Set MAE
5MCLC Weekdays Daytime0.7419 0.4486 83.8733 120.6674 62.4318 95.7779
5MCLC Weekdays Nighttime0.7384 0.3461 90.9493 127.9279 69.5706 101.8469
5MCLC Weekends Daytime0.5392 0.3780 19.7715 24.2794 14.6887 19.1400
5MCLC Weekends Nighttime0.4688 0.3193 20.7130 23.0605 16.1982 18.6505
10MCLC Weekdays Daytime0.9655 0.7015 33.9461 90.1331 24.7699 69.3337
10MCLC Weekdays Nighttime0.9256 0.6741 45.6437 86.0709 33.0154 67.6469
10MCLC Weekends Daytime0.9336 0.6875 52.5466 100.8412 36.7550 77.2685
10MCLC Weekends Nighttime0.9302 0.6713 50.1545 97.9899 34.5309 73.2271
15MCLC Weekdays Daytime0.9766 0.8931 25.2570 50.4237 19.6079 40.4872
15MCLC Weekdays Nighttime0.9846 0.8527 17.9878 52.6425 13.4789 41.2760
15MCLC Weekends Daytime0.9733 0.8695 28.9087 60.1870 21.5886 47.3241
15MCLC Weekends Nighttime0.9835 0.8477 20.6979 59.7020 15.2735 46.6706
Table 4. Average UV across different spatiotemporal scenarios.
ScaleCommunity Life Circle Vitality
Weekends DaytimeWeekends NighttimeWeekdays DaytimeWeekdays Nighttime
5MCLC71.0368.89361.84387.58
10MCLC388.06372.42358.86375.43
15MCLC374.38356.34348.28359.8
Disclaimer/Publisher’s Note: The statements, opinions and data contained in all publications are solely those of the individual author(s) and contributor(s) and not of MDPI and/or the editor(s). MDPI and/or the editor(s) disclaim responsibility for any injury to people or property resulting from any ideas, methods, instructions or products referred to in the content.