1. Introduction
Freshwater scarcity represents an increasingly urgent challenge in Europe and globally, driven by population growth, agricultural expansion, industrial demand, and climate variability [
1,
2]. Groundwater constitutes 30–40% of global freshwater supply and plays an essential role in ensuring water security, particularly in regions where surface water availability is limited or seasonally variable [
3]. In Central and Eastern Europe, groundwater resources support approximately 75% of public water supply; however, many municipalities operate with limited hydrogeological baseline data and face ageing water infrastructure, creating an urgent need for systematic re-evaluation of abstraction capacity and optimal site selection [
4].
Currently, the Polish economy is experiencing significant water stress, with renewable water resources per capita in 1999–2018 at 1566 m
3/year [
5], below the UN threshold indicating water scarcity at 1700 m
3/year. The Voivodeship of Podkarpackie in SE Poland represents a representative case study: it encompasses both the city of Rzeszów (385,000 inhabitants) and nine surrounding municipalities with a combined population of 650,000. The current water supply is dependent on a network of existing wells that were drilled opportunistically over decades, often without comprehensive hydrogeological evaluation. Ageing infrastructure, localised water quality issues (related to industrial contamination, agricultural diffuse pollution and legacy mining activities), and population redistribution toward suburban areas have created mismatches between abstraction capacity and demand, particularly in smaller municipalities [
6].
1.1. Motivation and Scientific Context
Traditional groundwater potential assessment relies on expert judgement combined with limited boreholes and geological surveys—an approach that is data intensive, timeconsuming—and difficult to standardise across administrative boundaries [
7]. During the past two decades, geographic information systems (GIS) have become standard tools for spatial hydrogeological analysis; however, the integration of GIS with multicriteria decision analysis (MCDA) remains unevenly applied in Central and Eastern European hydrogeology [
8]. Beyond hydrogeology, contemporary geoinformation research shows that reliable conclusions can be drawn even with heterogeneous data availability, as long as GIS layers are consistently combined with modern observation sources and verification procedures [
9]. Furthermore, field measurements indicate that the available data sources, even historical ones, can deviate significantly from reality [
10], as exemplified by the GNSS station networks [
11]. Furthermore, quantitative analyses conducted under conditions of severe external disruption (e.g., pandemic restrictions) demonstrate the importance of transparent, comparable indicators for decision-making when standard operating conditions change [
12]. Most published MCDA groundwater studies focus on either:
Vulnerability of groundwater to contamination (e.g., DRASTIC, SINTACS), which addresses the risk of water quality but not the potential of resources [
13],
Evaluation of groundwater resources in data-rich regions (e.g., northern Europe, North America, India), where comprehensive aquifer databases exist [
14,
15],
Retrospective validation against existing wells, without integration of population demand or planning-relevant exclusion constraints [
16].
Few studies in Central and Eastern Europe systematically combine hydrogeological suitability (aquifer parameters), contamination risk (exclusion zones), and human demand patterns (population density, infrastructure conflicts) into a single decision framework applicable on a municipal scale [
17]. This gap is particularly acute for regions with:
Fragmented and Limited detailed hydrogeological surveys in smaller municipalities [
18],
Weak integration between water infrastructure planning and spatial development plans [
19,
20].
1.2. Research Objectives
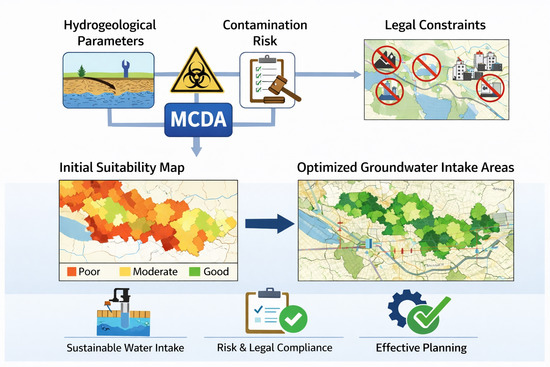
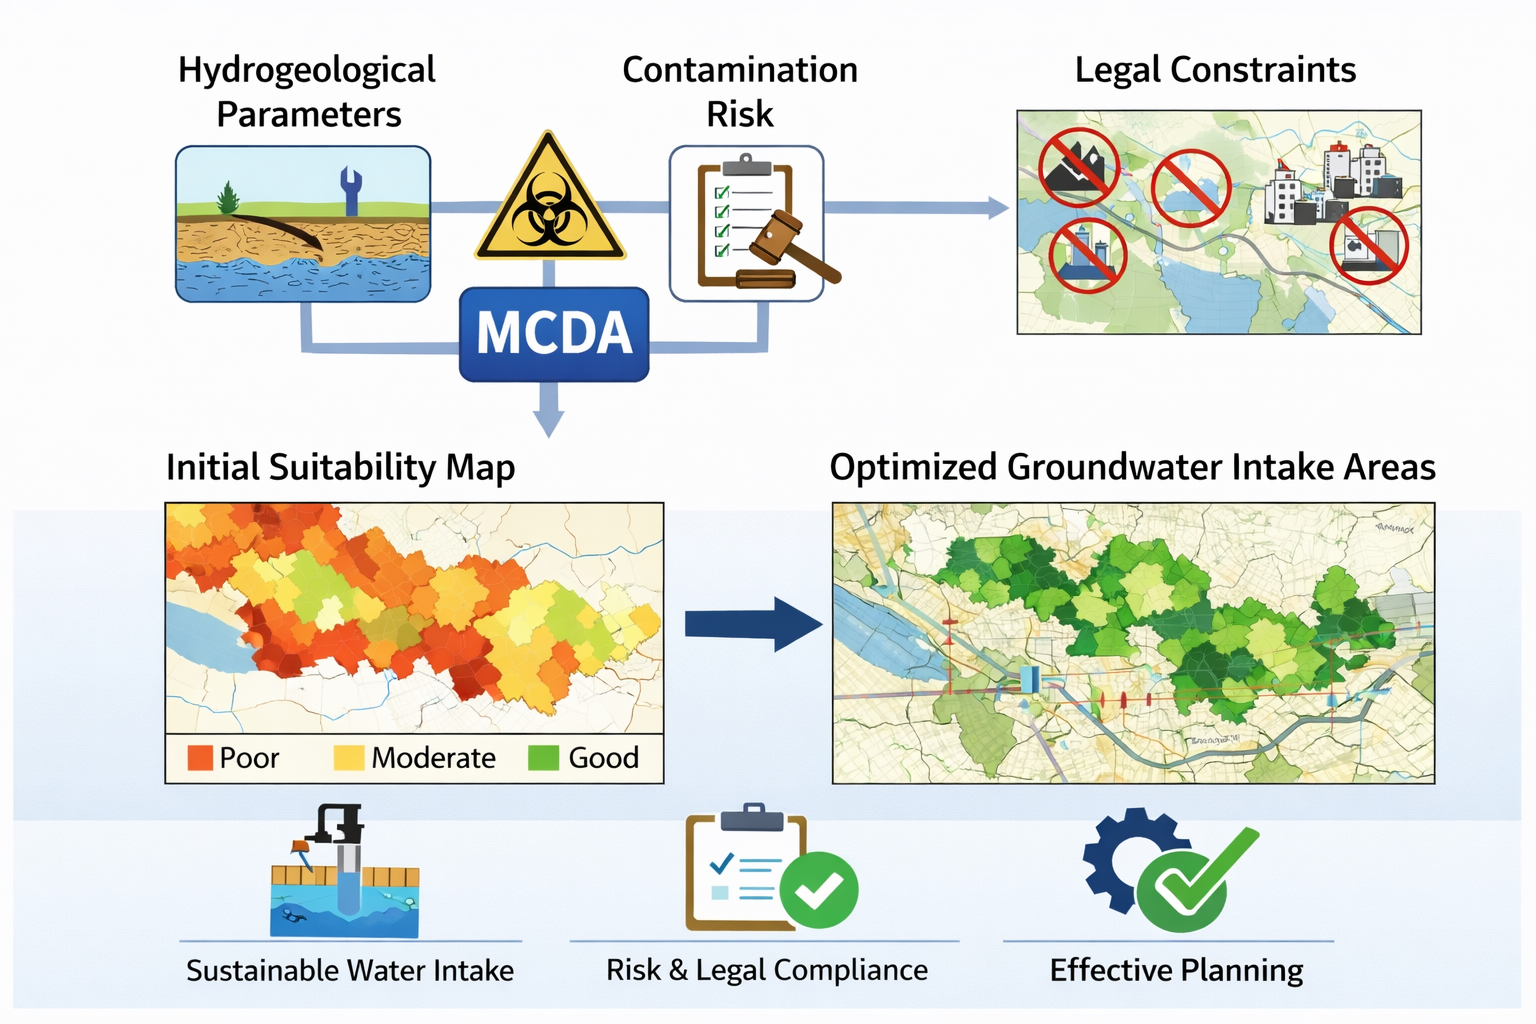
This study addresses these gaps by developing and validating a GIS-MCDA framework specifically designed for the assessment of municipal—groundwater potential at the municipal scale under conditions of limited hydrogeological data. Our objectives are to:
Create a coherent spatial assessment framework by synthesising dispersed hydrogeological data, e.g., aquifer thickness, potential well yield, and water quality from multiple sources (e.g., hydrogeological authority records and borehole logs).
Integrate contamination risk and planning constraints (industrial sites, landfills, wastewater treatment plants, high-traffic roads, existing protection zones) as explicit exclusion criteria, moving beyond the evaluation of water quality to suit the new abstraction.
Incorporate human demand through population density mapping to identify priority zones for water supply—areas where the potential for groundwater intersects with the actual demand.
The definition of a validation framework for a reference data set comprising 142 existing abstraction points (boreholes) is planned to be carried out in future work using spatial overlap indices and Cohen’s Kappa.
Demonstrate the applicability of the framework to municipal water planning, providing decision makers—with spatially explicit actionable recommendations for new abstraction sites.
The study is motivated by the practical need to support sustainable groundwater management in regions where data constraints and administrative fragmentation currently limit evidence-based planning. Our contribution is to demonstrate how MCDA can be applied in conditions of limited data availability, which is highly relevant for Central and Eastern Europe and could potentially be transferred to other regions with similar data and institutional constraints.
In terms of methodological contribution, this study does not introduce a novel MCDA algorithm; rather, it advances a planning-orientated GIS-MCDA workflow explicitly tailored for municipal-scale decision-making under conditions of limited data coverage and heterogeneous hydrogeological information. The contribution lies in the structured integration of (i) hydrogeological suitability criteria, (ii) contamination- and regulation-driven exclusion zones treated as hard spatial constraints, and (iii) population-demand overlay to prioritise locations where groundwater potential coincides with actual supply needs. This combined, vector-based, municipal-scale workflow is designed to be operational in regions where spatial development plans and environmental policies must be formulated despite incomplete datasets and limited capacity for extensive field investigations.
2. Materials and Methods
2.1. Study Area and Data Sources
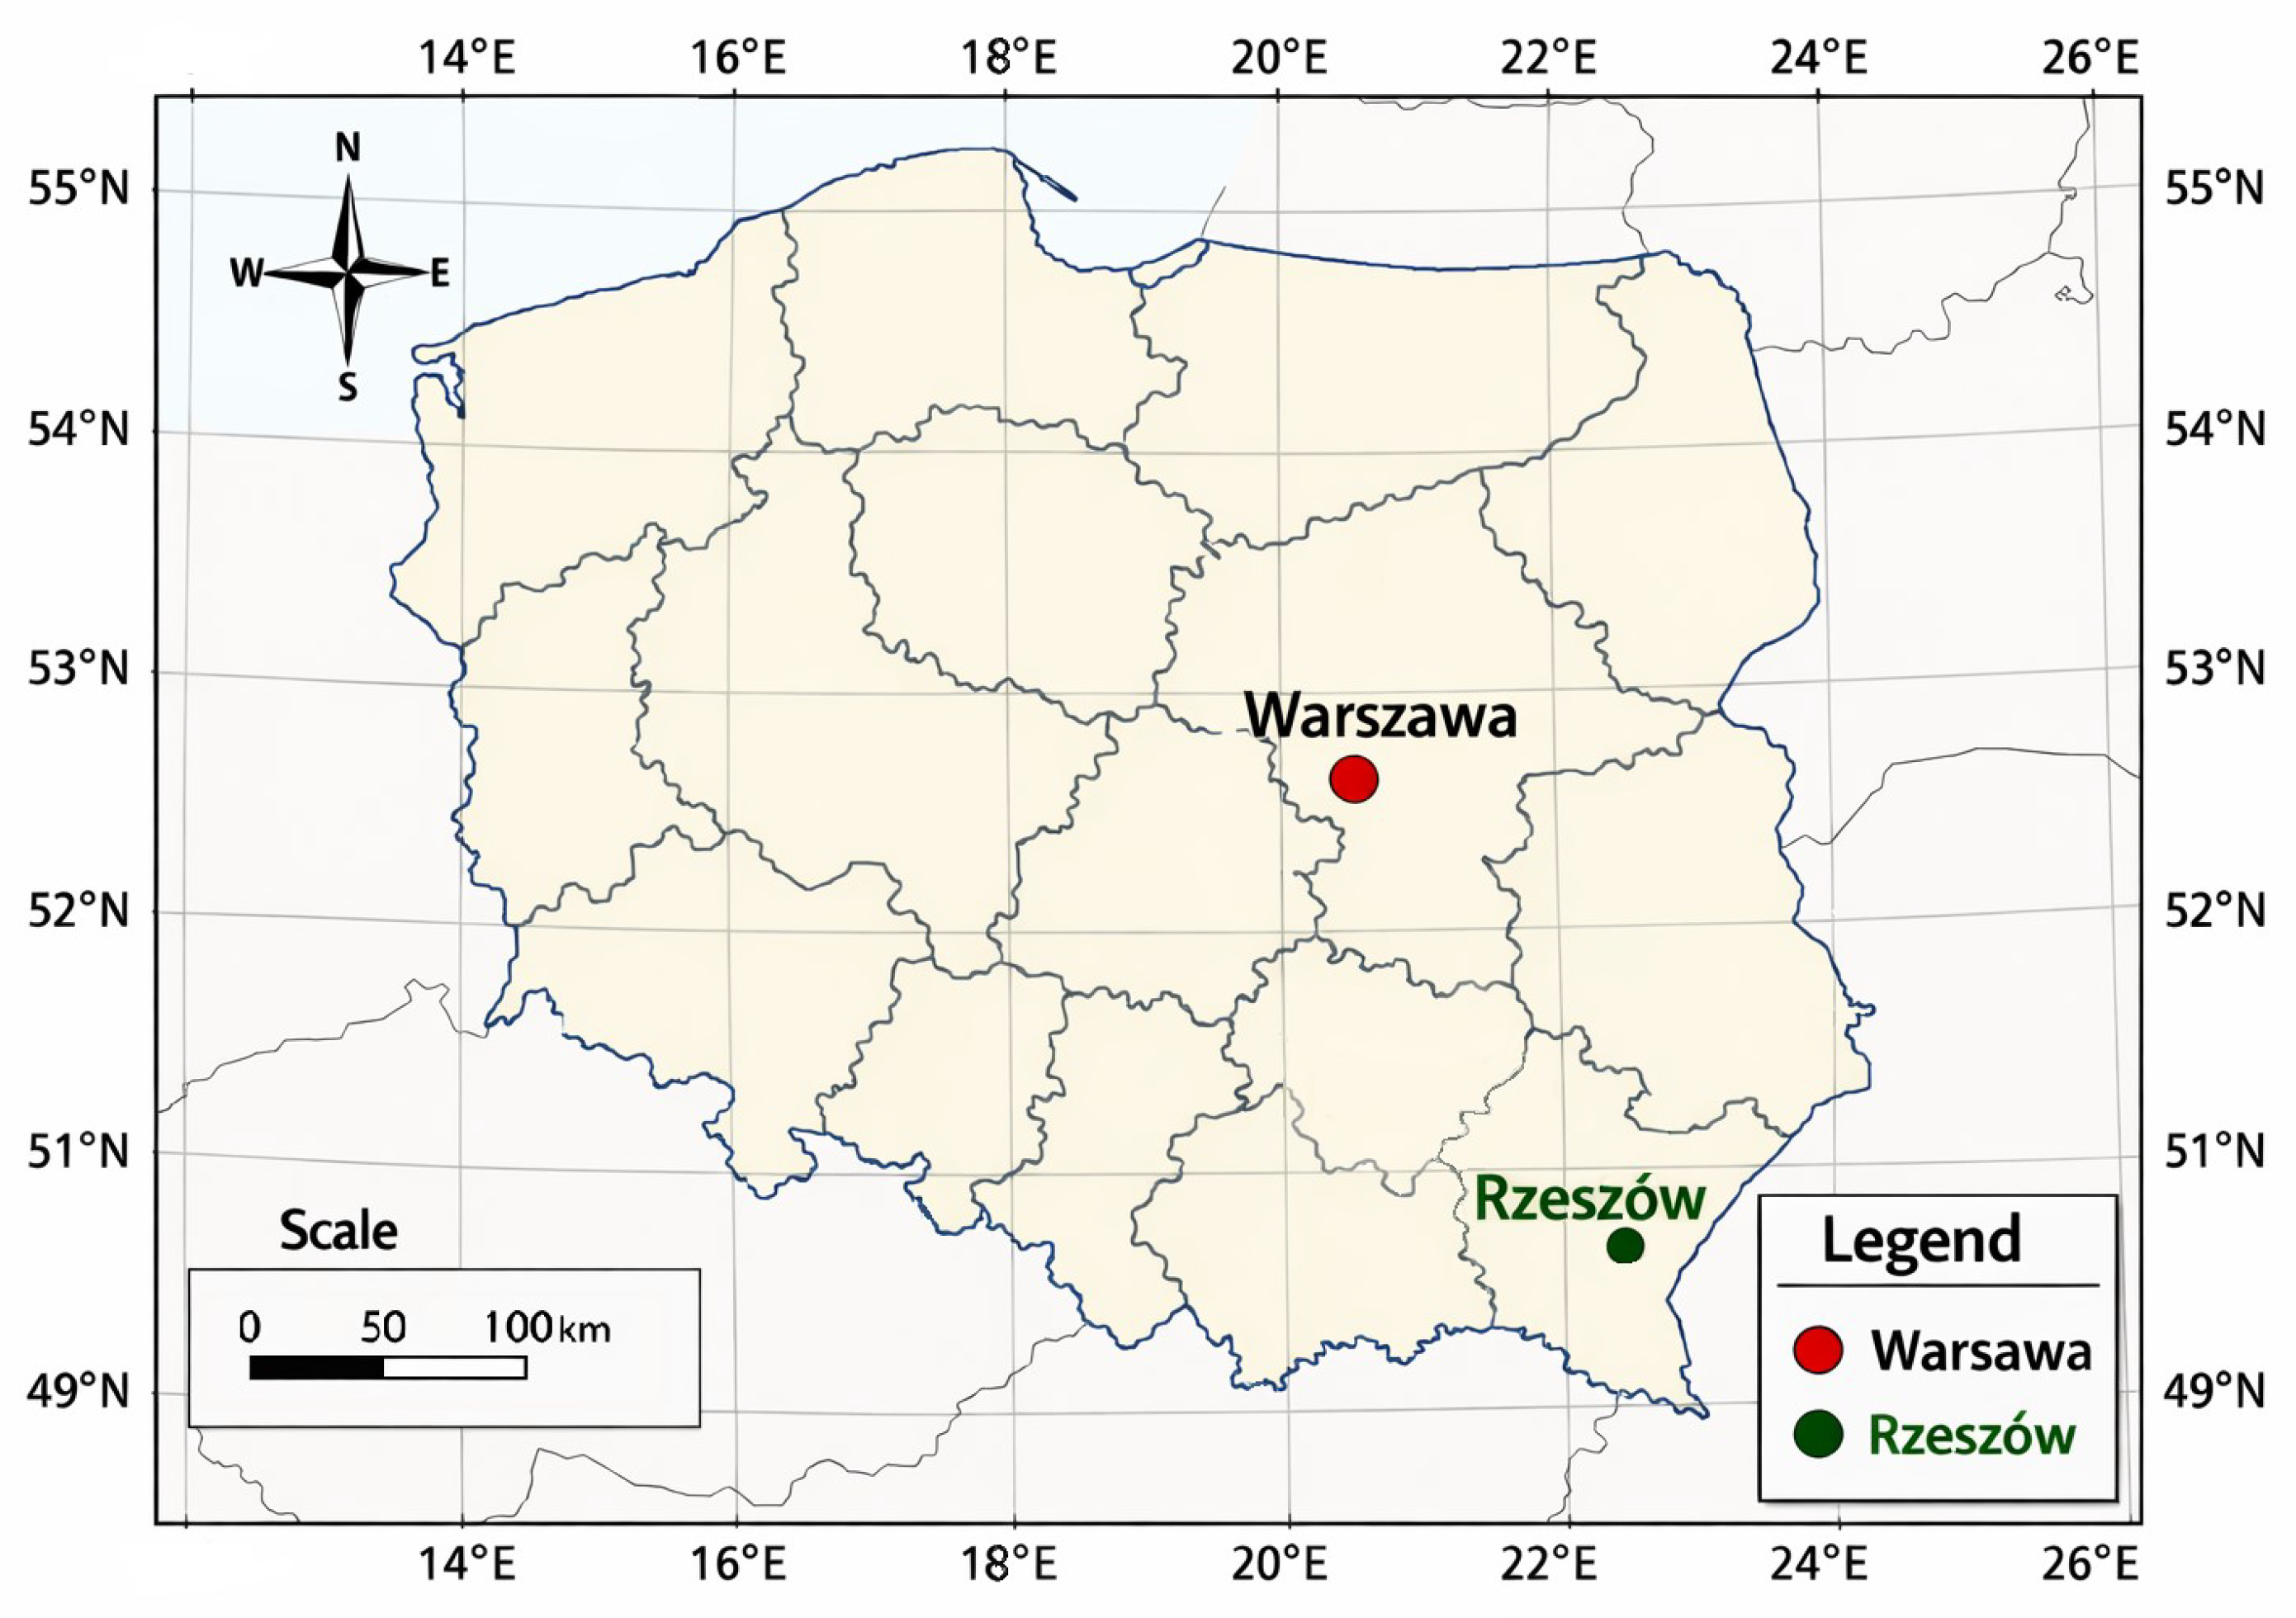
The study covers the administrative area of the city of Rzeszów and nine surrounding municipalities in the Voivodeship of Podkarpackie, SE Poland (
Figure 1), with a total area of around 830 km
2.
The region straddles the boundary between two major geological units:
Northern zone: Carpathian Foredeep (Miocene sands and silts; good aquifer potential),
Southern zone: Outer Carpathian Flysch (fractured bedrock; lower aquifer potential, but recharge zones in upland areas).
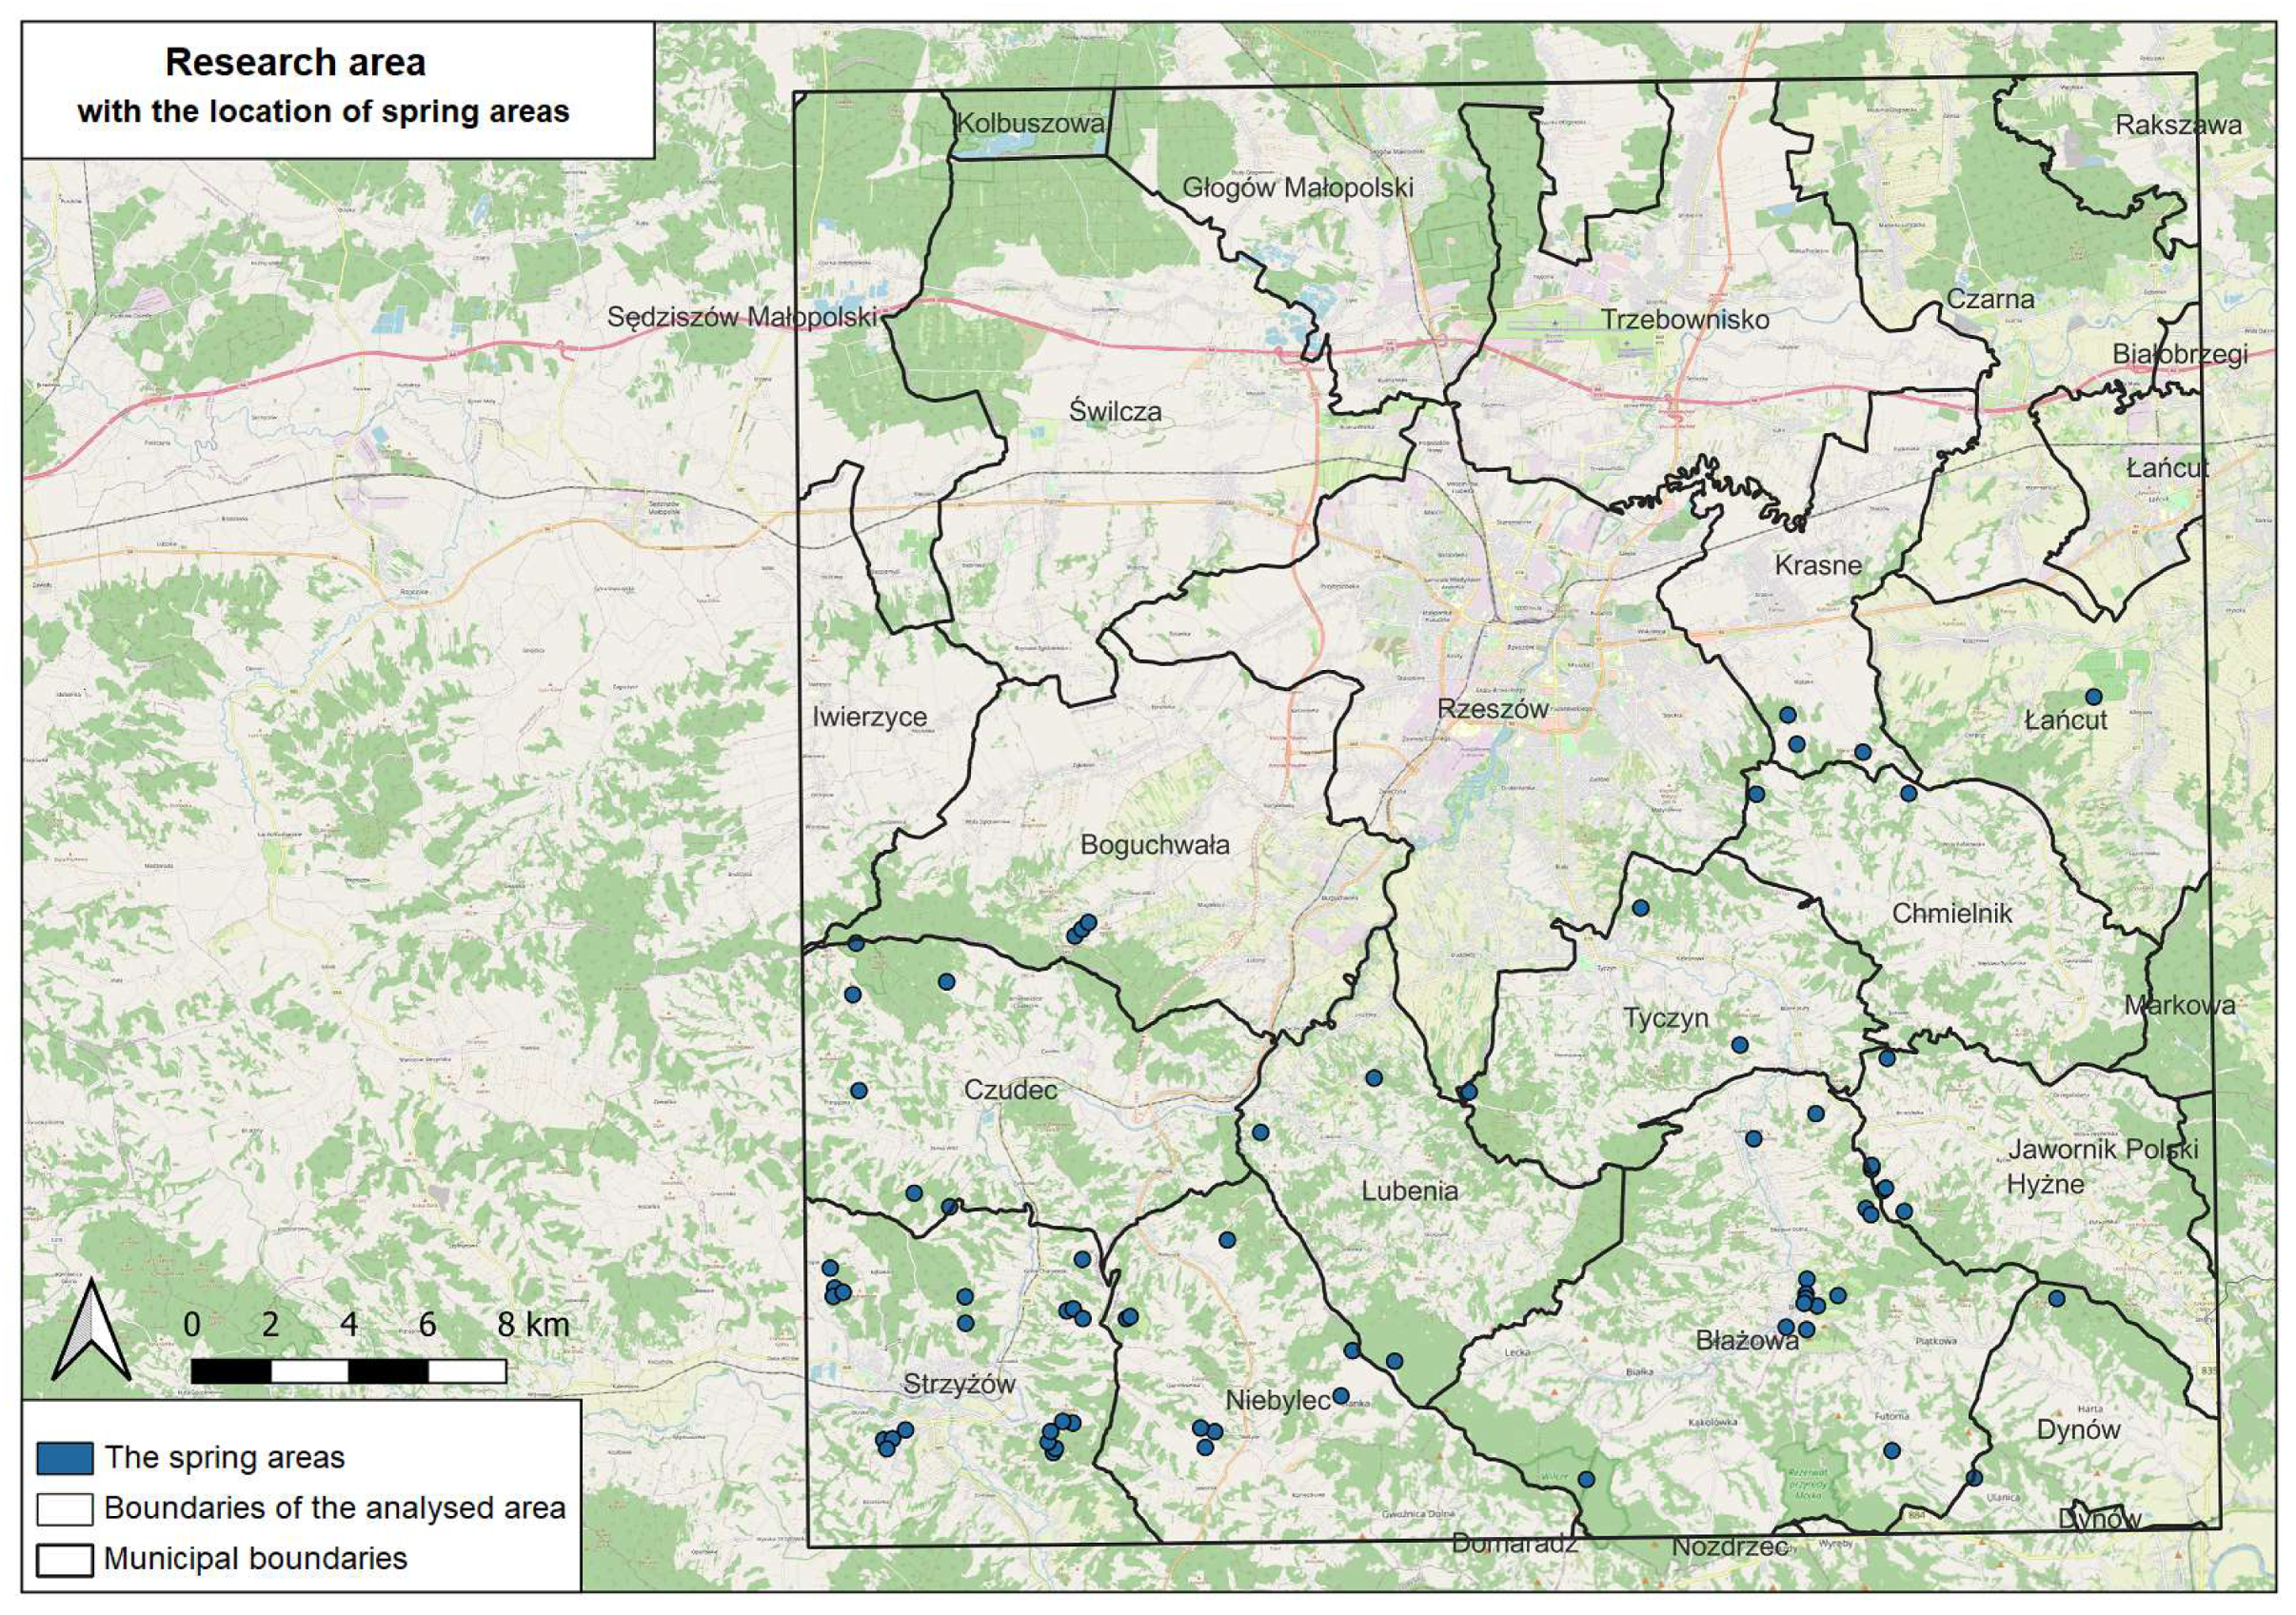
Figure 2 shows the boundaries of the study area and the municipalities in which the analyses were carried out. The map also shows the springs as buffered points. There are more springs in the mountainous terrain in the south than in the north. This indicates a division of the study area into zones. The base map used in this and all subsequent figures is derived from OpenStreetMap (OSM) geodata server.
Data for the study were sourced from multiple national and regional databases. The Polish Geological Institute—National Research Institute (PIG-PIB), the national geological service, provides geological and hydrogeological maps on a scale of 1:50,000 as part of the INSPIRE service, as well as data from the Central Geological Database (CBDG). This includes 142 existing water abstraction wells with data on depth, yield, and water quality. The regional water supply company of the city of Rzeszów (Przedsiębiorstwo Wodociągowe w Rzeszowie) provided data on the wells and estimated aquifer parameters used for local analysis. OpenStreetMap provides complimentary data on the road network and fundamental infrastructure, while the Central Statistical Office (GUS) provided data from the 2021 census, which has been aggregated at the municipal level. More data is sourced from the national registry of potentially hazardous facilities, which includes industrial plants, waste disposal sites, and sewage treatment plants. In addition, data are drawn from the hydrological monitoring network, which includes river flow measurements and groundwater level observations [
21]. A summary of the data repository sources is presented in a compact
Table 1. All spatial data have been converted to the EPSG 2180 reference system and processed in ArcGIS 10.8.
All the spatial datasets used in this study were vector-based (points, polygons and polylines). The hydrogeological parameters were obtained from vector maps prepared at a scale of 1:50,000 and provided by PIG-PIB in shapefile format. Therefore, the effective detail (spatial resolution) of the hydrogeological interpretation corresponds to cartographic generalisation at a scale of 1:50,000, meaning a minimum distinguishable mapping unit of approximately 2–3 hectares. The hydrogeological datasets were collected between 2005 and 2022. The hazard and infrastructure data reflect the situation in 2023. All spatial data were transformed into the EPSG 2180 coordinate reference system and processed in ArcGIS 10.8.
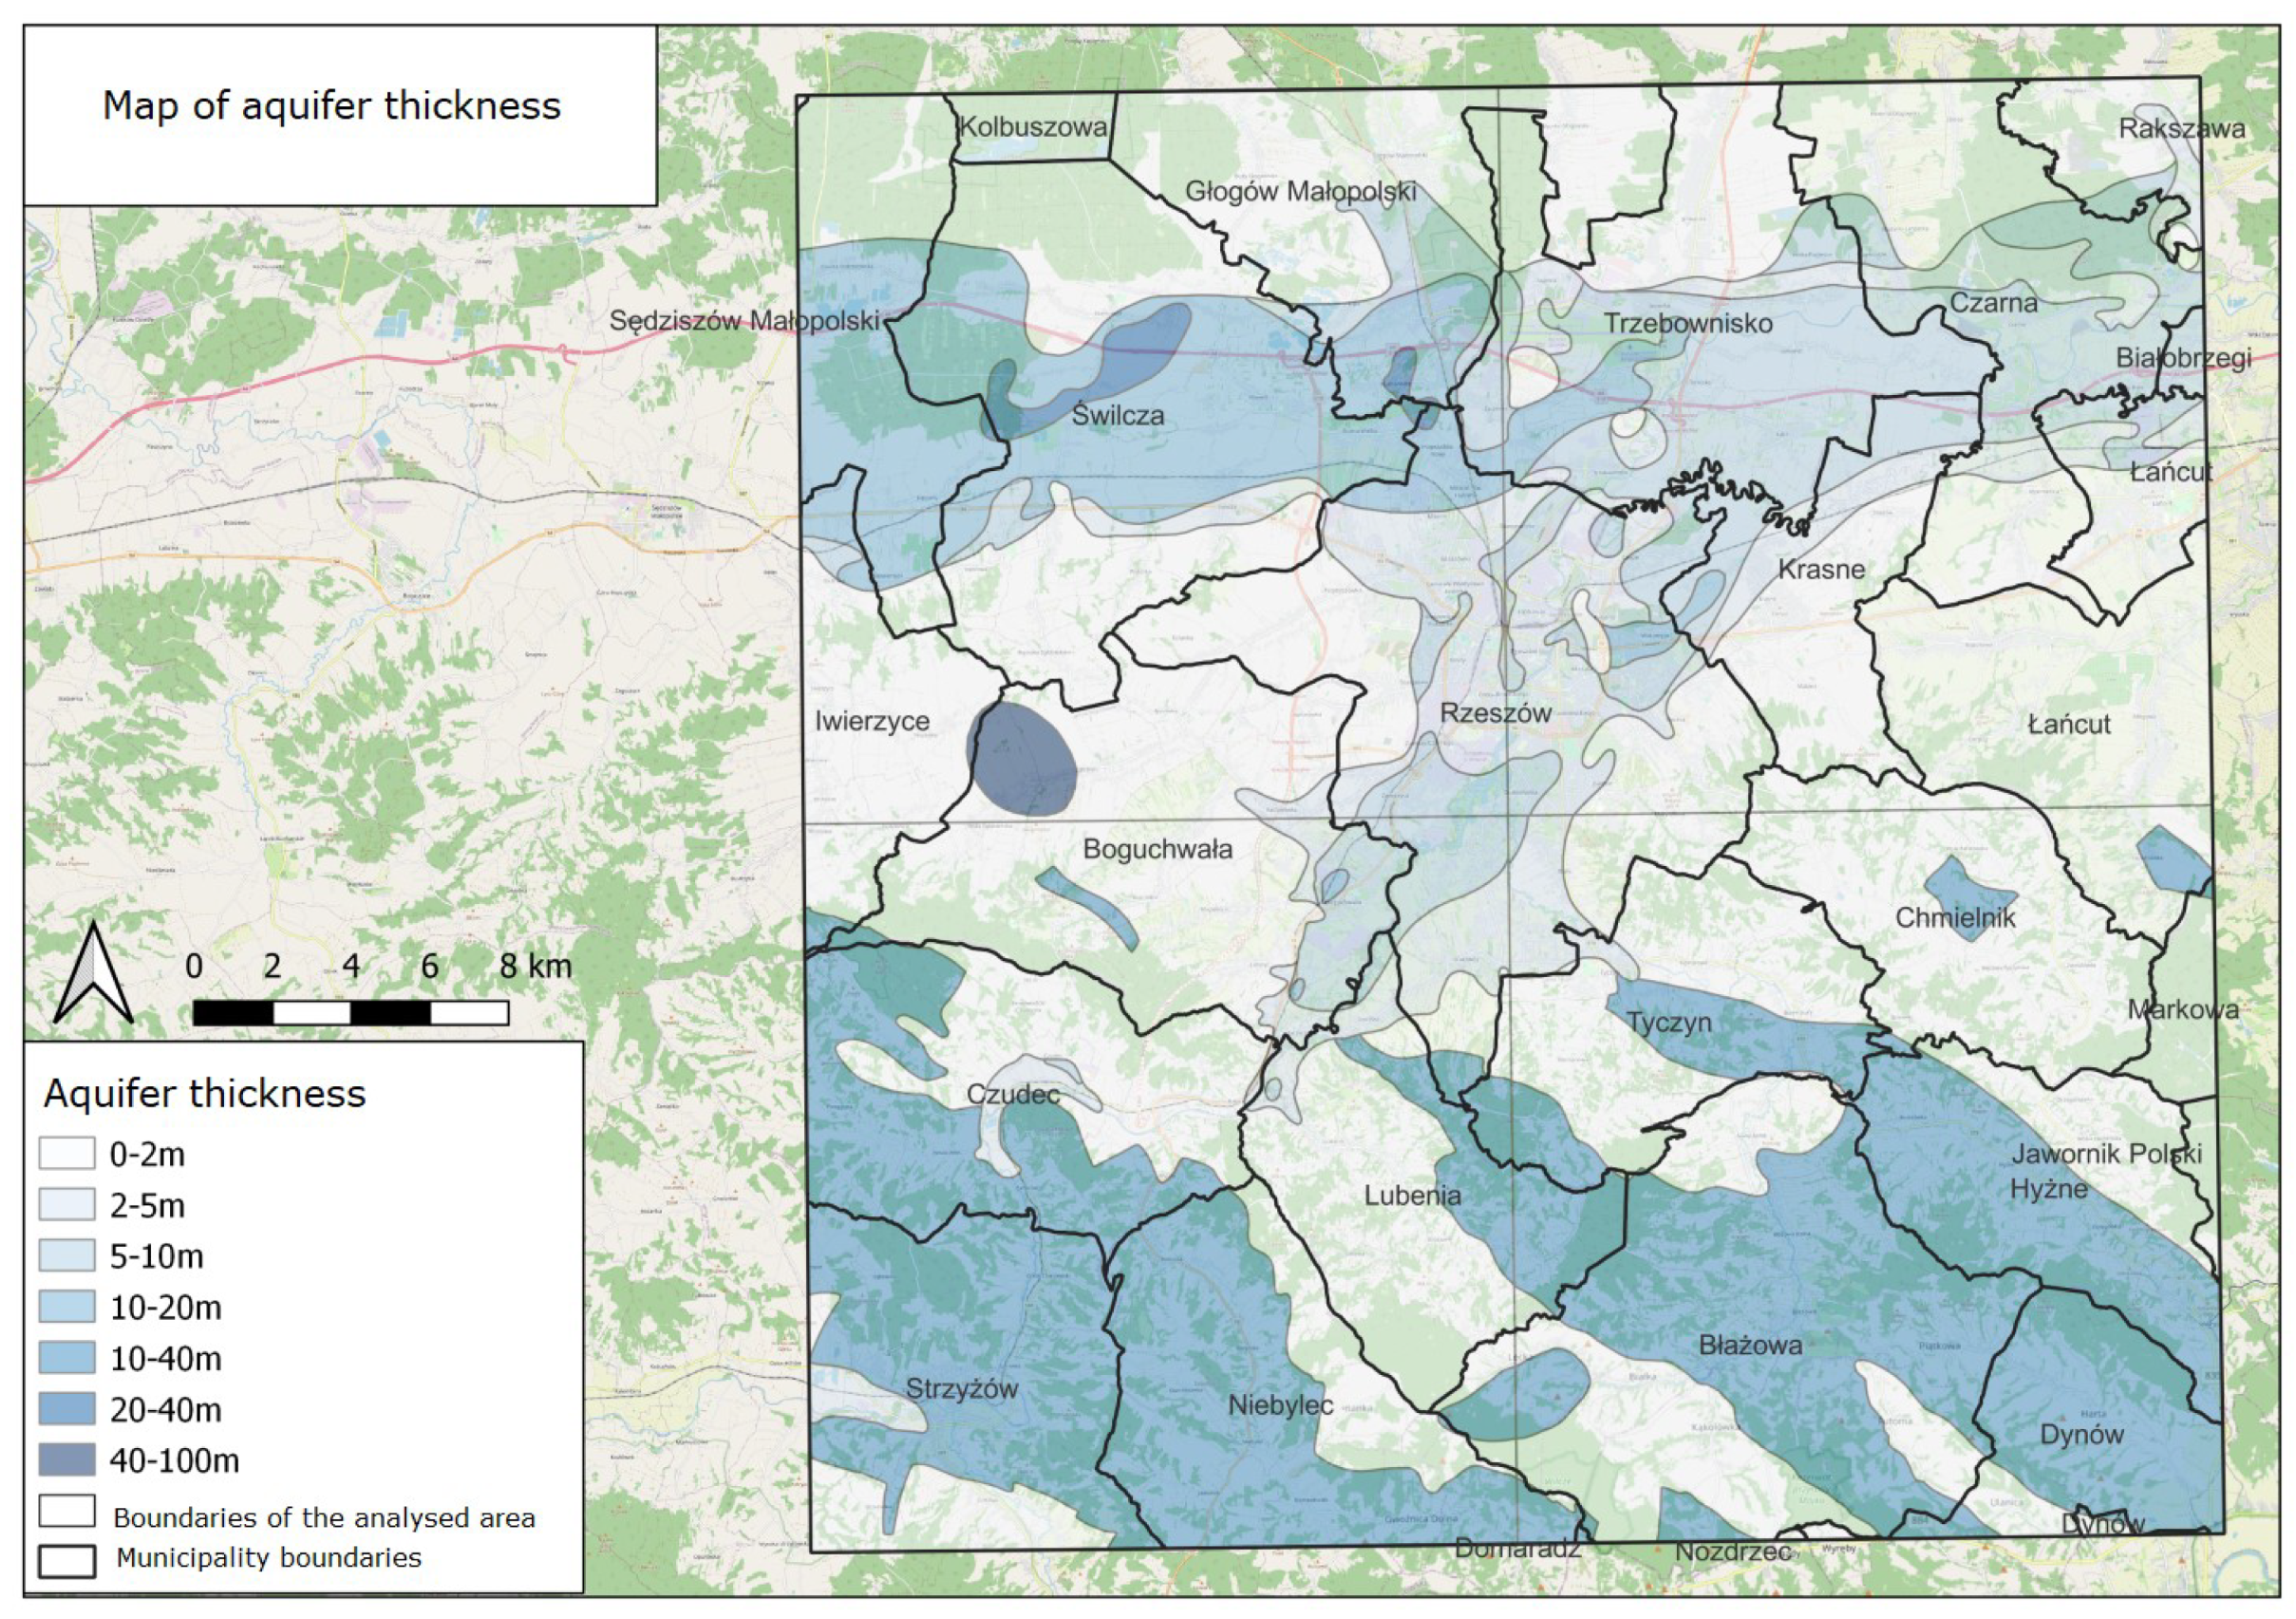
The selected hydrogeological layers were then extracted and trimmed to the boundaries that defined the scope of the study to determine the area covered by the data. The first layer of information was a map showing the average thickness of the aquifers in the Quaternary, Tertiary, and Cretaceous levels, combined into one layer—
Figure 3.
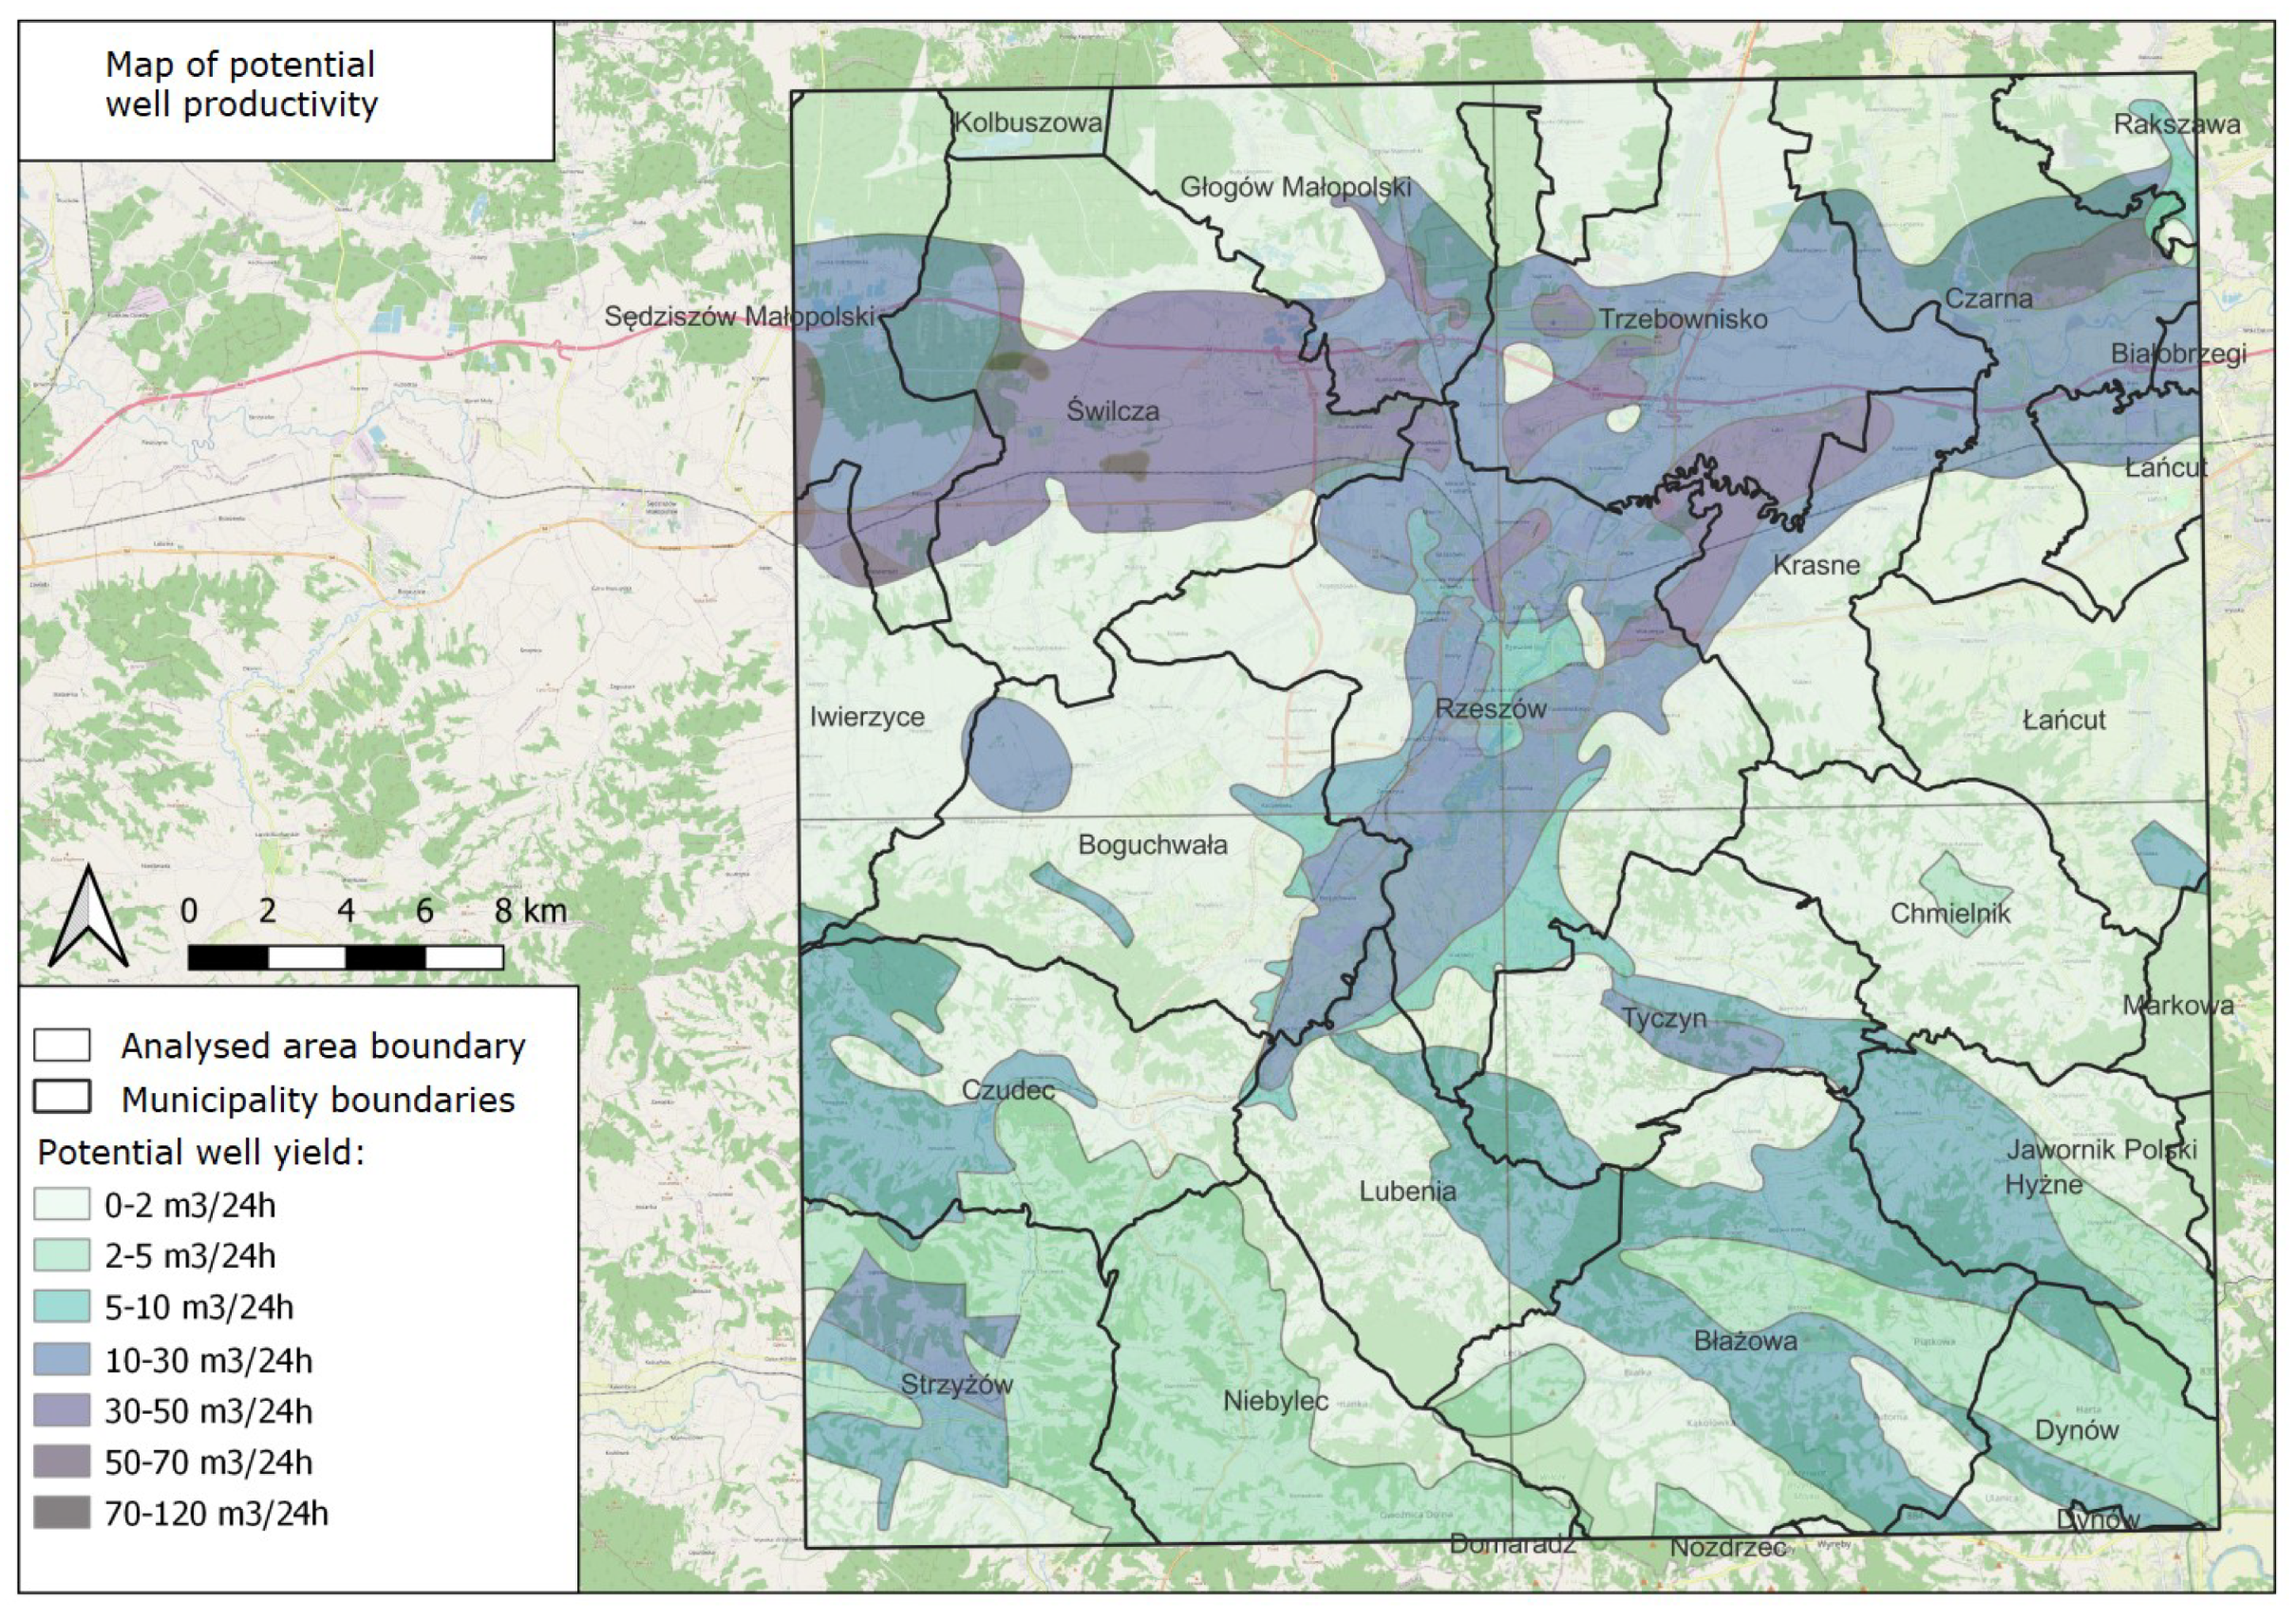
The vector map of the potential well yield
Figure 4 shows the amount of water that can be expected to be extracted using the intake. This amount is determined by test pumping and stationary observation of natural sources intended for the intake. It also includes an assessment of the renewability of groundwater resources in the aquifer at the intake level within the balance unit. Finally, hydrogeological calculations are required to determine the well or source yield while ensuring the high quality of the water extracted from the intake.
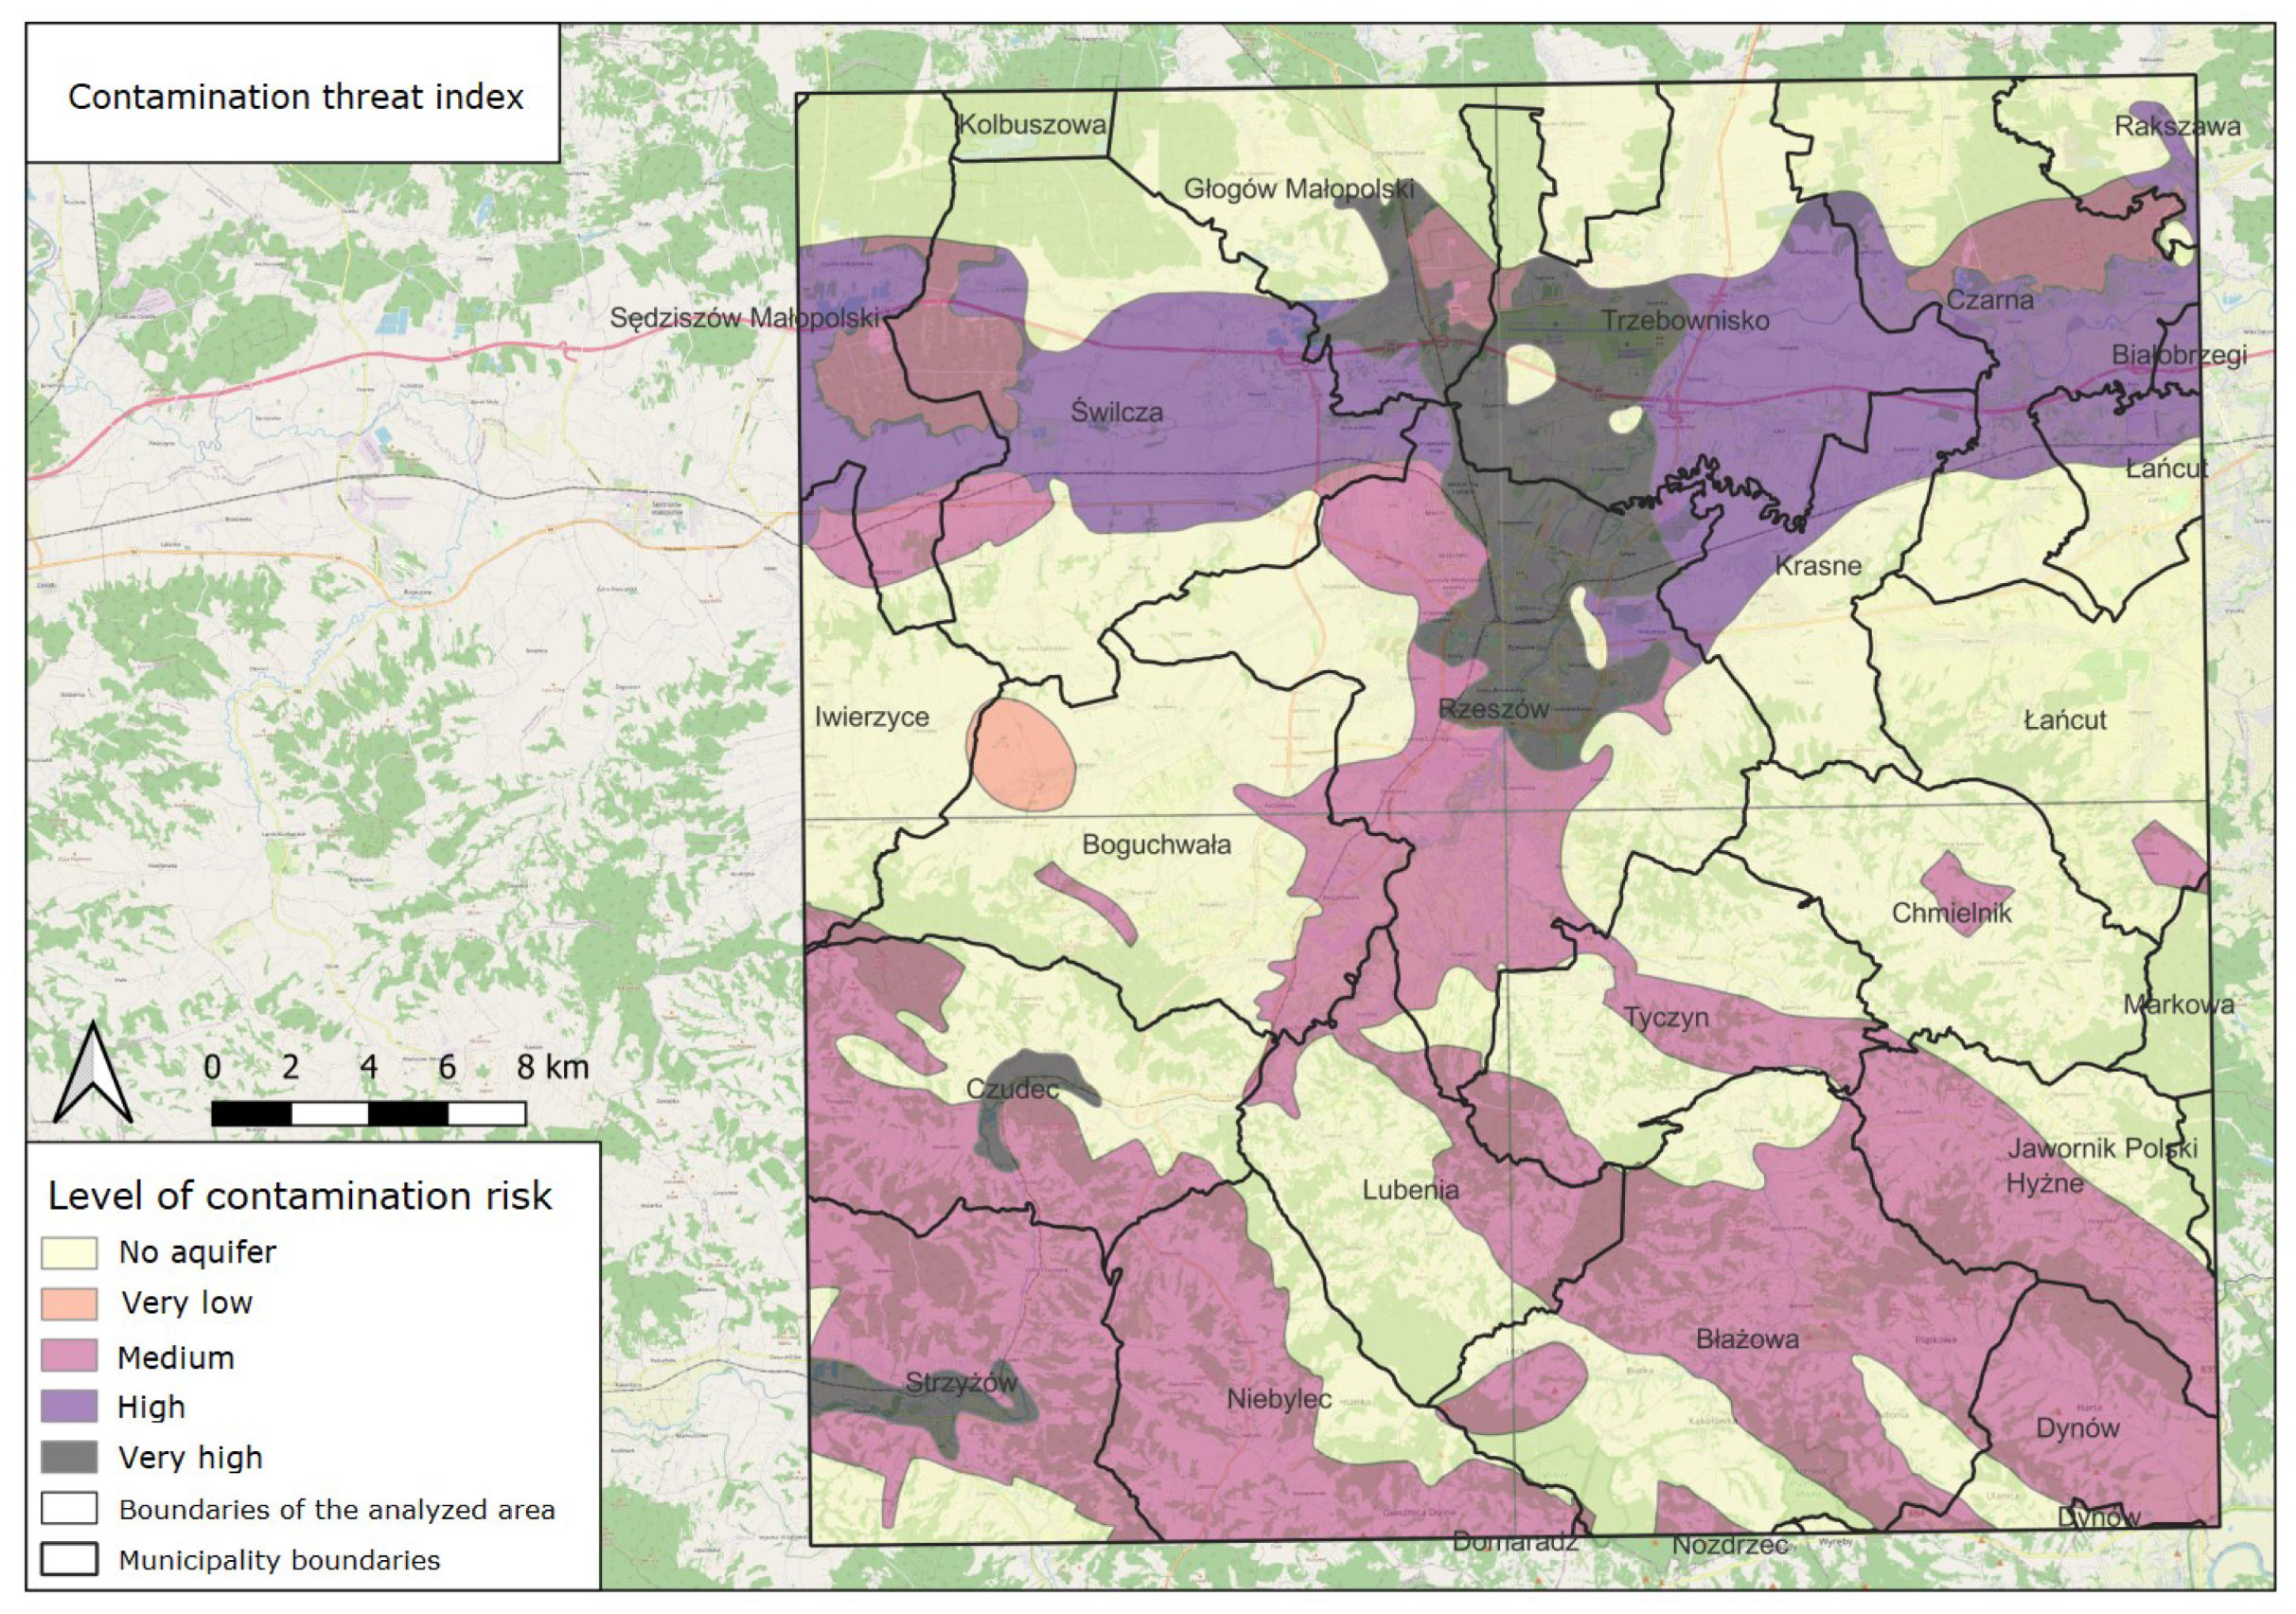
The data set in the form of the map showing the levels of contamination risk (see
Figure 5) illustrates the spatial variation in the susceptibility of the first aquifer to contamination. This map is used for spatial planning, environmental impact assessments, and risk analyses of potential sources of contamination.
2.2. MCDA Framework and Criteria Selection
Our MCDA model follows the standard framework of Saaty’s Analytic Hierarchy Process (AHP) [
22] adapted for groundwater assessment with GIS technology [
23]. Unlike many multi-criteria decision analysis (MCDA) studies on groundwater, which rely on weighted overlay techniques based on raster data, this analysis was conducted entirely in a vector-based geographic information system (GIS) environment. Hydrogeological polygons, vector well point datasets, infrastructure layers, and exclusion zones were processed using vector overlay, intersection, and geostatistical interpolation methods. This approach preserves the original geometric precision of the hydrogeological boundaries and administrative units, allowing direct aggregation of results at the municipal level [
24]. We define the groundwater potential as a composite index reflecting:
Hydrogeological suitability of the aquifer (capacity to produce water of acceptable quality),
Contamination risk (inverse of water protection degree),
Accessibility (practical feasibility of abstraction).
In many groundwater MCDA applications, the weights of the criterion are determined based on pairwise comparisons conducted by experts using the full AHP procedure. In this study, all criteria from A to F were treated as equal in multiplicative aggregation, reflecting the team’s decision to assign comparable importance to aquifer capacity, water quality, protection, depth, and recharge. As a next step, a formal weighting system based on AHP and sensitivity analysis is recommended to assess the robustness of the assumption of equal weights. The potential index is computed as:
where:
A = Aquifer thickness (m)—normalised on scales 1 to 5; thicker aquifers produce higher scores,
B = Potential well yield [m3/24 h]—aquifer productivity index; rating from 1 to 5. Criterion B refers to the potential well yield, determined based on well yield classes based on pumping tests documented in hydrogeological archives (PIG-PIB), and not to the permeability of the aquifer expressed in m2/day. These values reflect the empirically observed hydraulic performance of aquifer systems under local conditions and take into account the combined effects of hydraulic conductivity, aquifer geometry, and water drawdown behaviour. These results were then interpolated and averaged to present them in the form of a vector map.
C = Water quality index—aggregated from 12 hydrochemical parameters (TDS, major ions, nitrate, heavy metals); scored 1 to 5 (5 = best quality),
D = Contamination threat index—inverse of degree of protection; scored 1 to 5 (1 = high threat, 5 = well-protected),
E = depth of the water table (m)—scored 1 to 5 (deeper = more stable, less prone to seasonal fluctuations); normalised,
F = Recharge index—presence of recharge zones (spring areas, high-permeability outcrops); scored 1 to 5, Spring areas are hydrogeologically interpreted as indicators of active groundwater circulation systems. Although springs typically represent discharge zones on a local scale, their presence reflects upstream recharge areas and permeable hydrogeological structures within the same groundwater flow system. In this study, the occurrence of spring was therefore treated as an indirect indicator of dynamically active aquifer systems rather than as a literal recharge point.
G = Fixed bonus for areas with documented recharge (250 points).
Criteria A–F were normalised to 1–5 scales based on the regional hydrogeological literature and the judgement of experts from water authorities (n = 3 hydrogeologists consulted). Three hydrogeological experts participated in the consultation process: two senior hydrogeologists from regional water management authorities (each with more than 15 years of professional experience in aquifer assessment) and one academic hydrogeologist specialising in groundwater modelling. Their role was advisory in defining normalisation thresholds and verifying the hydrogeological plausibility of the coefficient ranges assigned to individual criteria. No complete pairwise AHP comparison matrix and consistency ratio calculation was implemented. Given the heterogeneous origin and varying completeness of the underlying datasets, a conservative equal-weight configuration was adopted as a transparent baseline scenario. The current model should therefore be interpreted as a reference-weight framework rather than a fully optimised AHP solution.
Multiplicative aggregation (
A ×
B ×
C ×
D ×
E ×
F) reflects the assumption that the potential of the aquifer depends on all criteria being simultaneously favourable; a single poor criterion (e.g., poor water quality) severely limits suitability. The additive component
G explicitly recognises recharge areas as strategically important for long-term sustainable abstraction. Theoretical maximum potential:
Although the theoretical maximum of the multiplicative index equals 15,875 points, the actual observed values are substantially lower because the simultaneous occurrence of maximum scores in all six criteria is extremely rare under real hydrogeological conditions. Therefore, the values of the empirical index in the study area range between 50 and 500 points, reflecting realistic combinations of partially favourable criteria rather than idealised maxima.
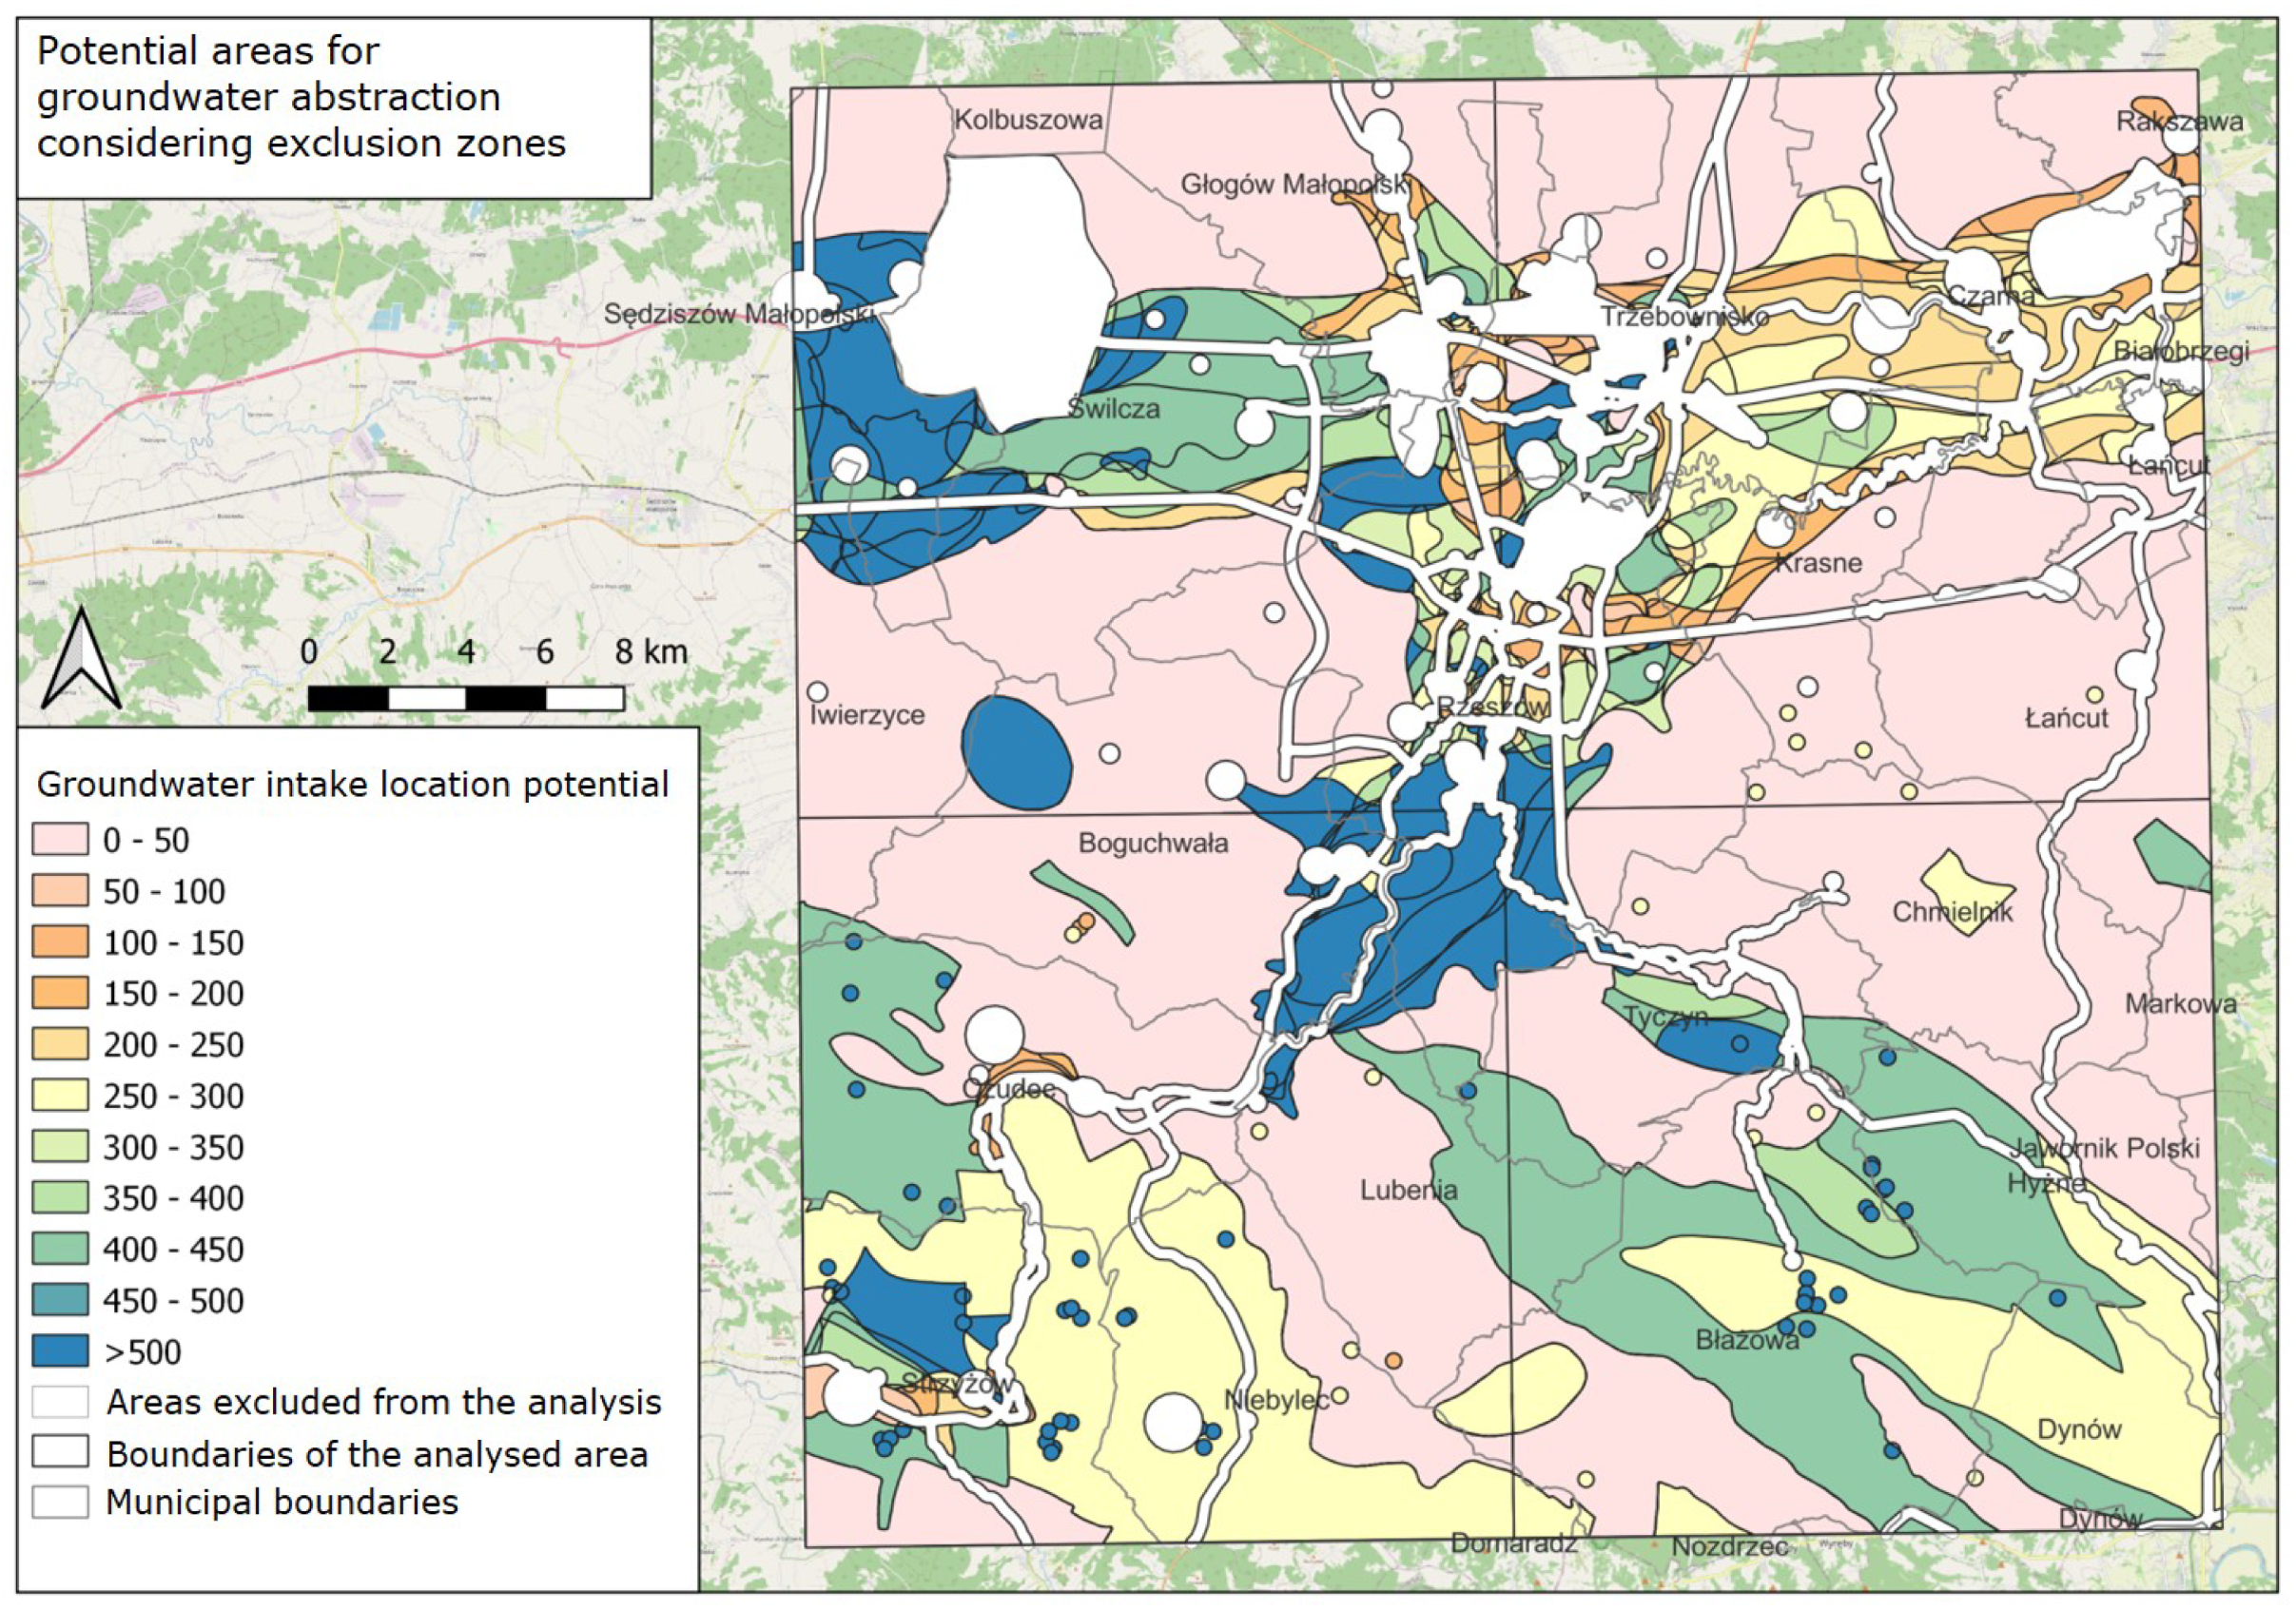
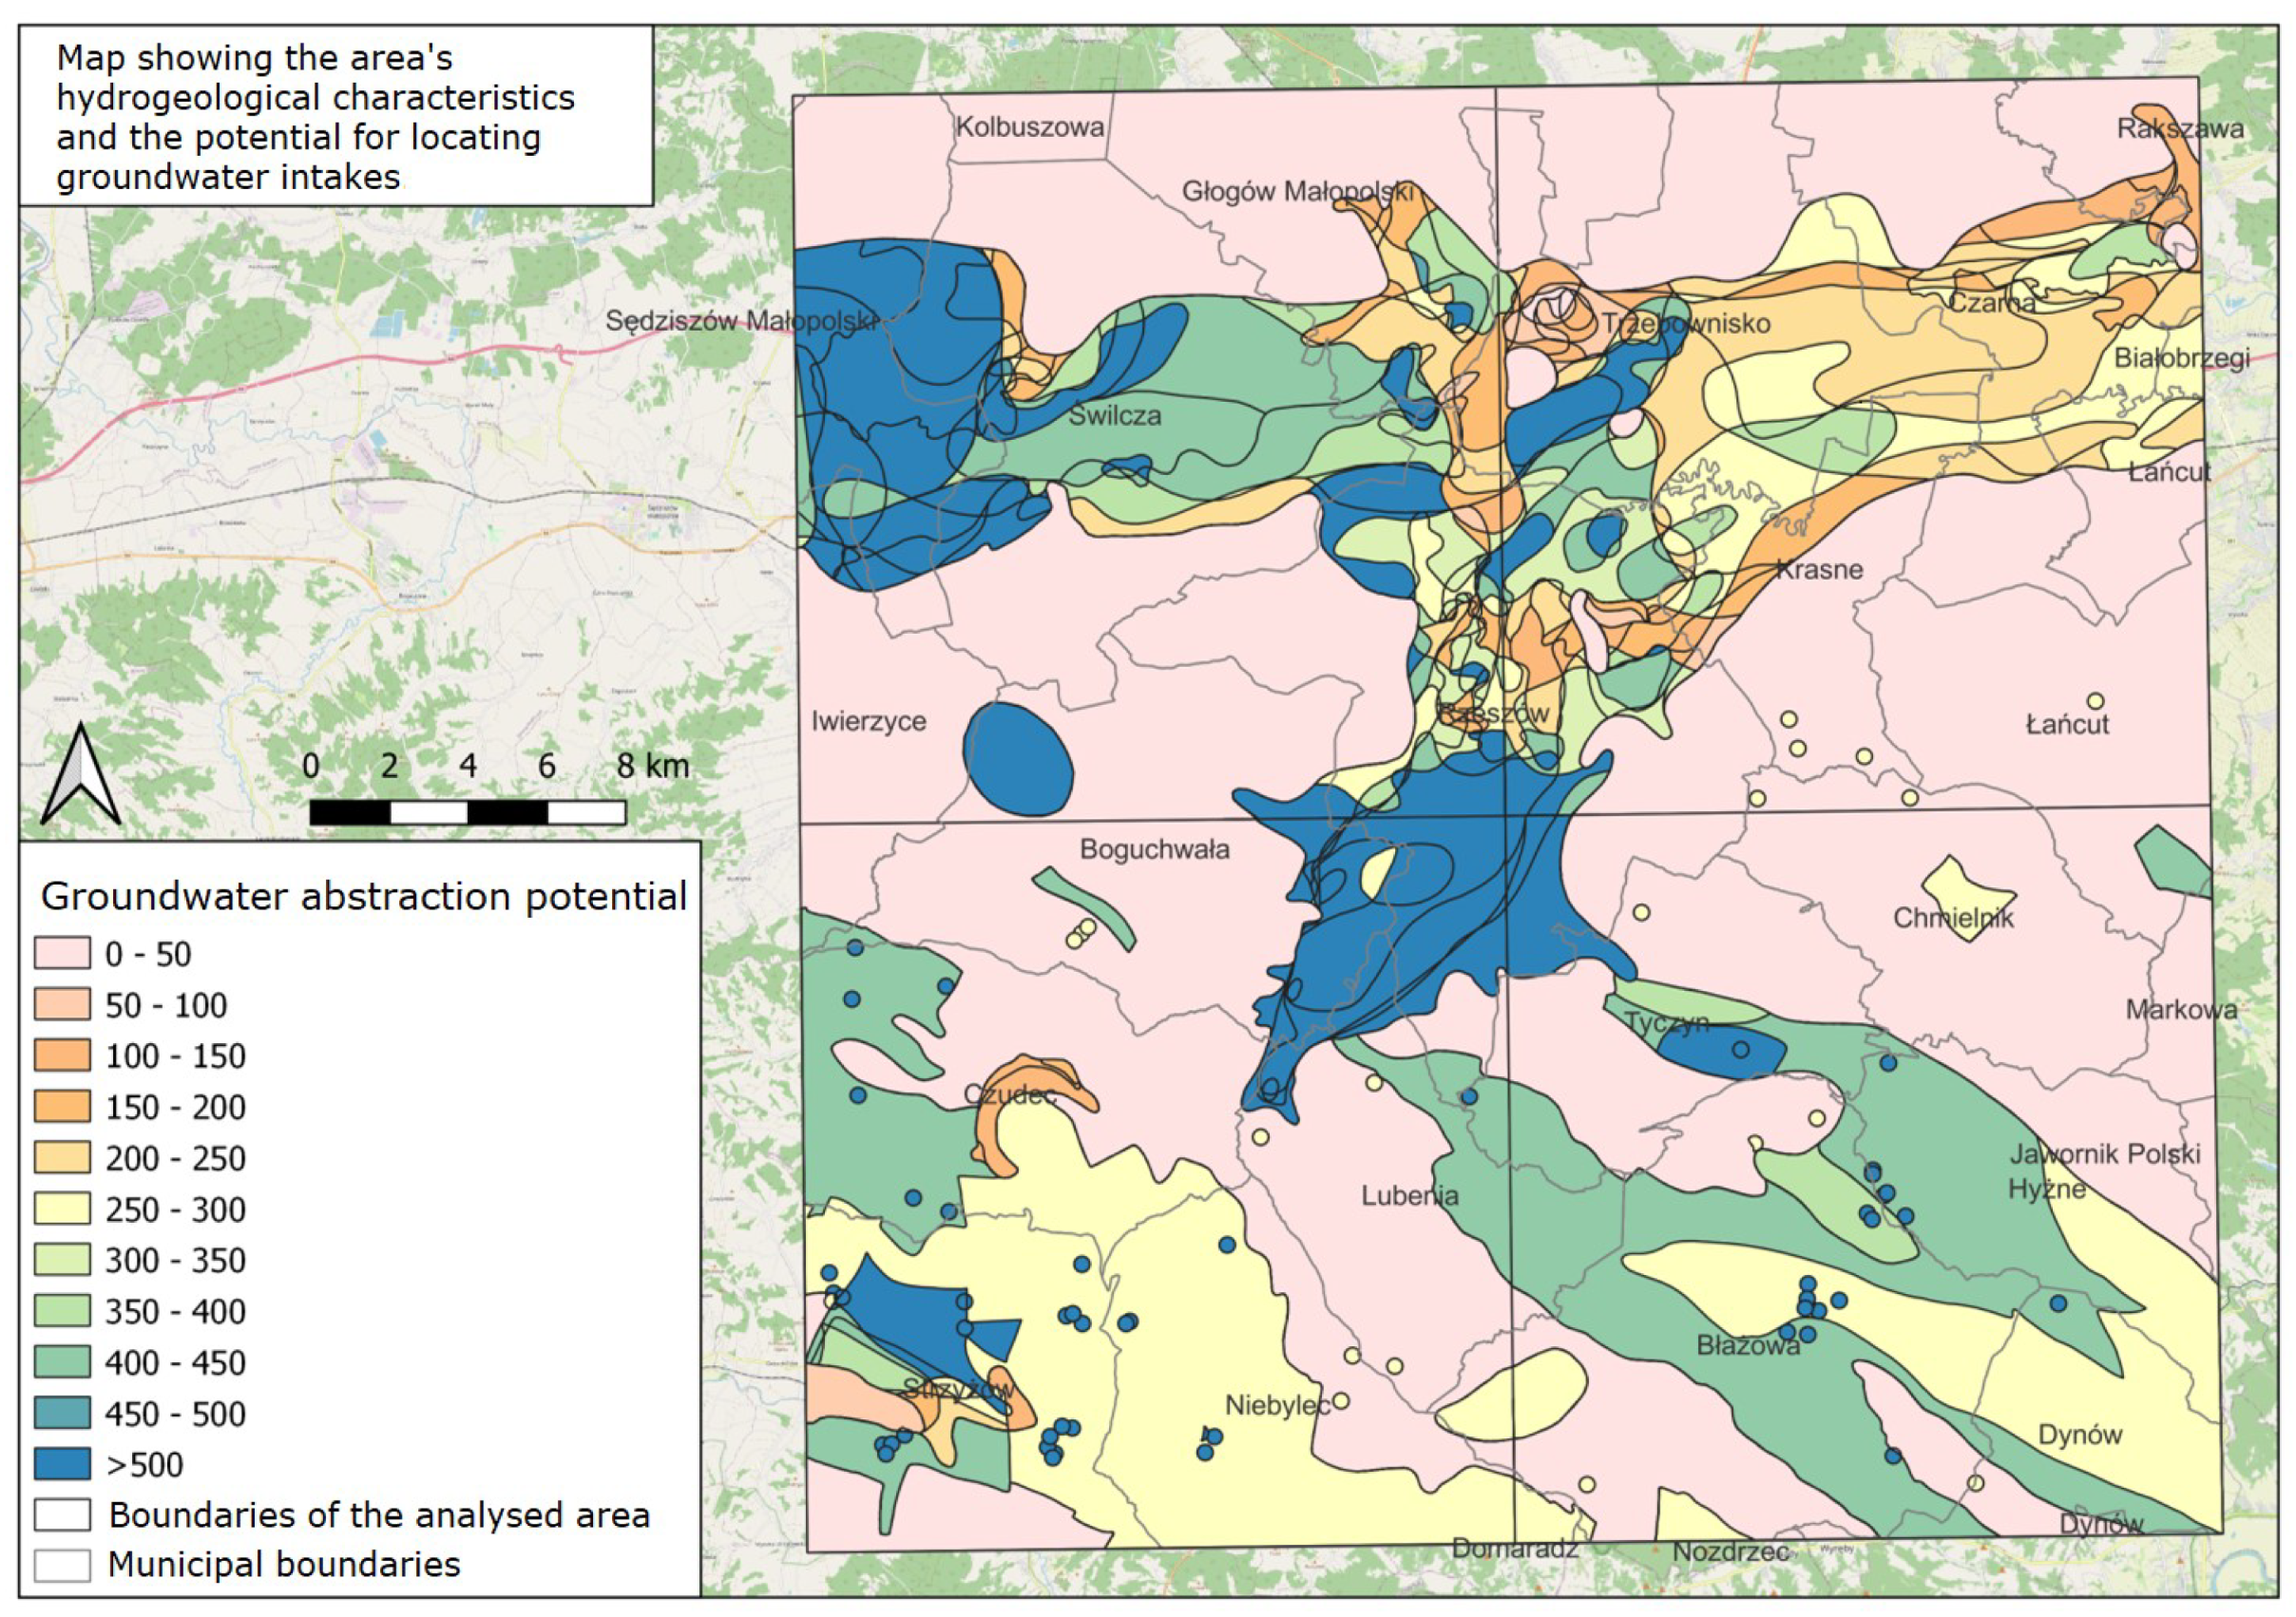
Figure 6 shows the calculated
P potential map for the area studied. This illustrates that in the entire research area, where the values of the index
P were calculated for all areas, they range from 50 to 500 points.
2.3. Exclusion Criteria and Spatial Constraints
The following seven spatial exclusion zones were delineated and removed from consideration as potential locations for new abstraction sites; their full definitions and thresholds are summarised in
Table 2.
In
Table 2, the column “Count” refers to the number of individual spatial objects (e.g., facilities, landfills, wastewater treatment plants, abstraction protection zones) used to generate the respective exclusion buffers. These counts represent discrete source features, not wells drilled within each buffer zone.
The excluded zones were computed using ArcGIS buffer and dissolve tools. The overlaid buffers were merged into a single exclusion layer. The applied buffer distances are not intended to represent hydro-dynamically calibrated capture zones or contaminant plume extents derived from groundwater flow modelling. Instead, they constitute precautionary, planning-oriented exclusion thresholds based on regulatory practice, hydrogeological literature on typical contaminant migration ranges, and expert consultation. Their function is to provide conservative risk screening at the municipal planning stage under data constraints. Site-specific hydrogeological modelling (including piezometric mapping or residence-time estimation) would be required prior to final drilling or investment decisions. The final “suitable” analysis domain decreased after subtraction of exclusion zones and finally reached a value of approximately 620 km2.
Figure 7 shows a map with excluded zones marked for areas where groundwater intakes should not be located, even if resources allow it.
2.4. Population Density Integration
Population data (2021 census, Polish GUS) were aggregated into 1 km2 grid cells. Zones with population density > 400 inhabitants/km2 were identified as priority demand areas. For each municipality, we calculated a population-weighted priority distance (maximum 500 m from population centres) to identify areas where groundwater potential intersects with actual demand for water supply.
3. Results
3.1. Hydrogeological Conditions and Exclusion Zones
The analysis identified approximately 620 km2 of land (75% of study area) as potentially suitable for groundwater abstraction after applying exclusion criteria. Exclusion zones, dominated by contamination risk buffers around industrial sites (24 facilities), landfills (8) and treatment plants (22), account for around 210 km2 (25% of the total area). High-traffic routes and wastewater discharge points contribute an additional approximately 80 km2 when overlapped with hydrogeological constraints.
3.2. Groundwater Potential Distribution
The spatially explicit potential index
P showed marked variability in the region (
Figure 3). Mean potential: 185 units (±95 SD); median: 165 units; 5th percentile: 45 units; 95th percentile: 480 units. The areas of highest potential (
P > 500 units) occupied 85 km
2 (14% of the suitable domain) and were concentrated in:
Central and southern Rzeszów city,
Eastern Boguchwała,
Central Błażowa (Miocene sands; thick aquifers),
Southwestern Chmielnik (recharge zones in the Carpathian foothills).
3.3. Municipal-Scale Potential Rankings
The aggregated potential indices for each municipality, computed as (
potential × area)/municipality area, are presented in
Table 3:
The table presents the area-weighted groundwater potential index between municipalities in the study area. The highest mean values are observed in Błażowa (240) and Rzeszów (223), indicating favourable hydrogeological conditions for groundwater abstraction. Municipalities such as Czudec and Boguchwała also exhibit moderate potential (above 170), while Chmielnik displays the lowest index (20), confirming its limited suitability for new abstraction sites. In particular, high-potential zones tend to correlate with elevated terrain and fractured bedrock formations, whereas low-potential areas (e.g., Trzebownisko, Krasne, Chmielnik) are primarily characterised by low-permeability sediments or contamination constraints. This ranking may serve as a preliminary prioritisation for further hydrogeological investigation and investment planning.
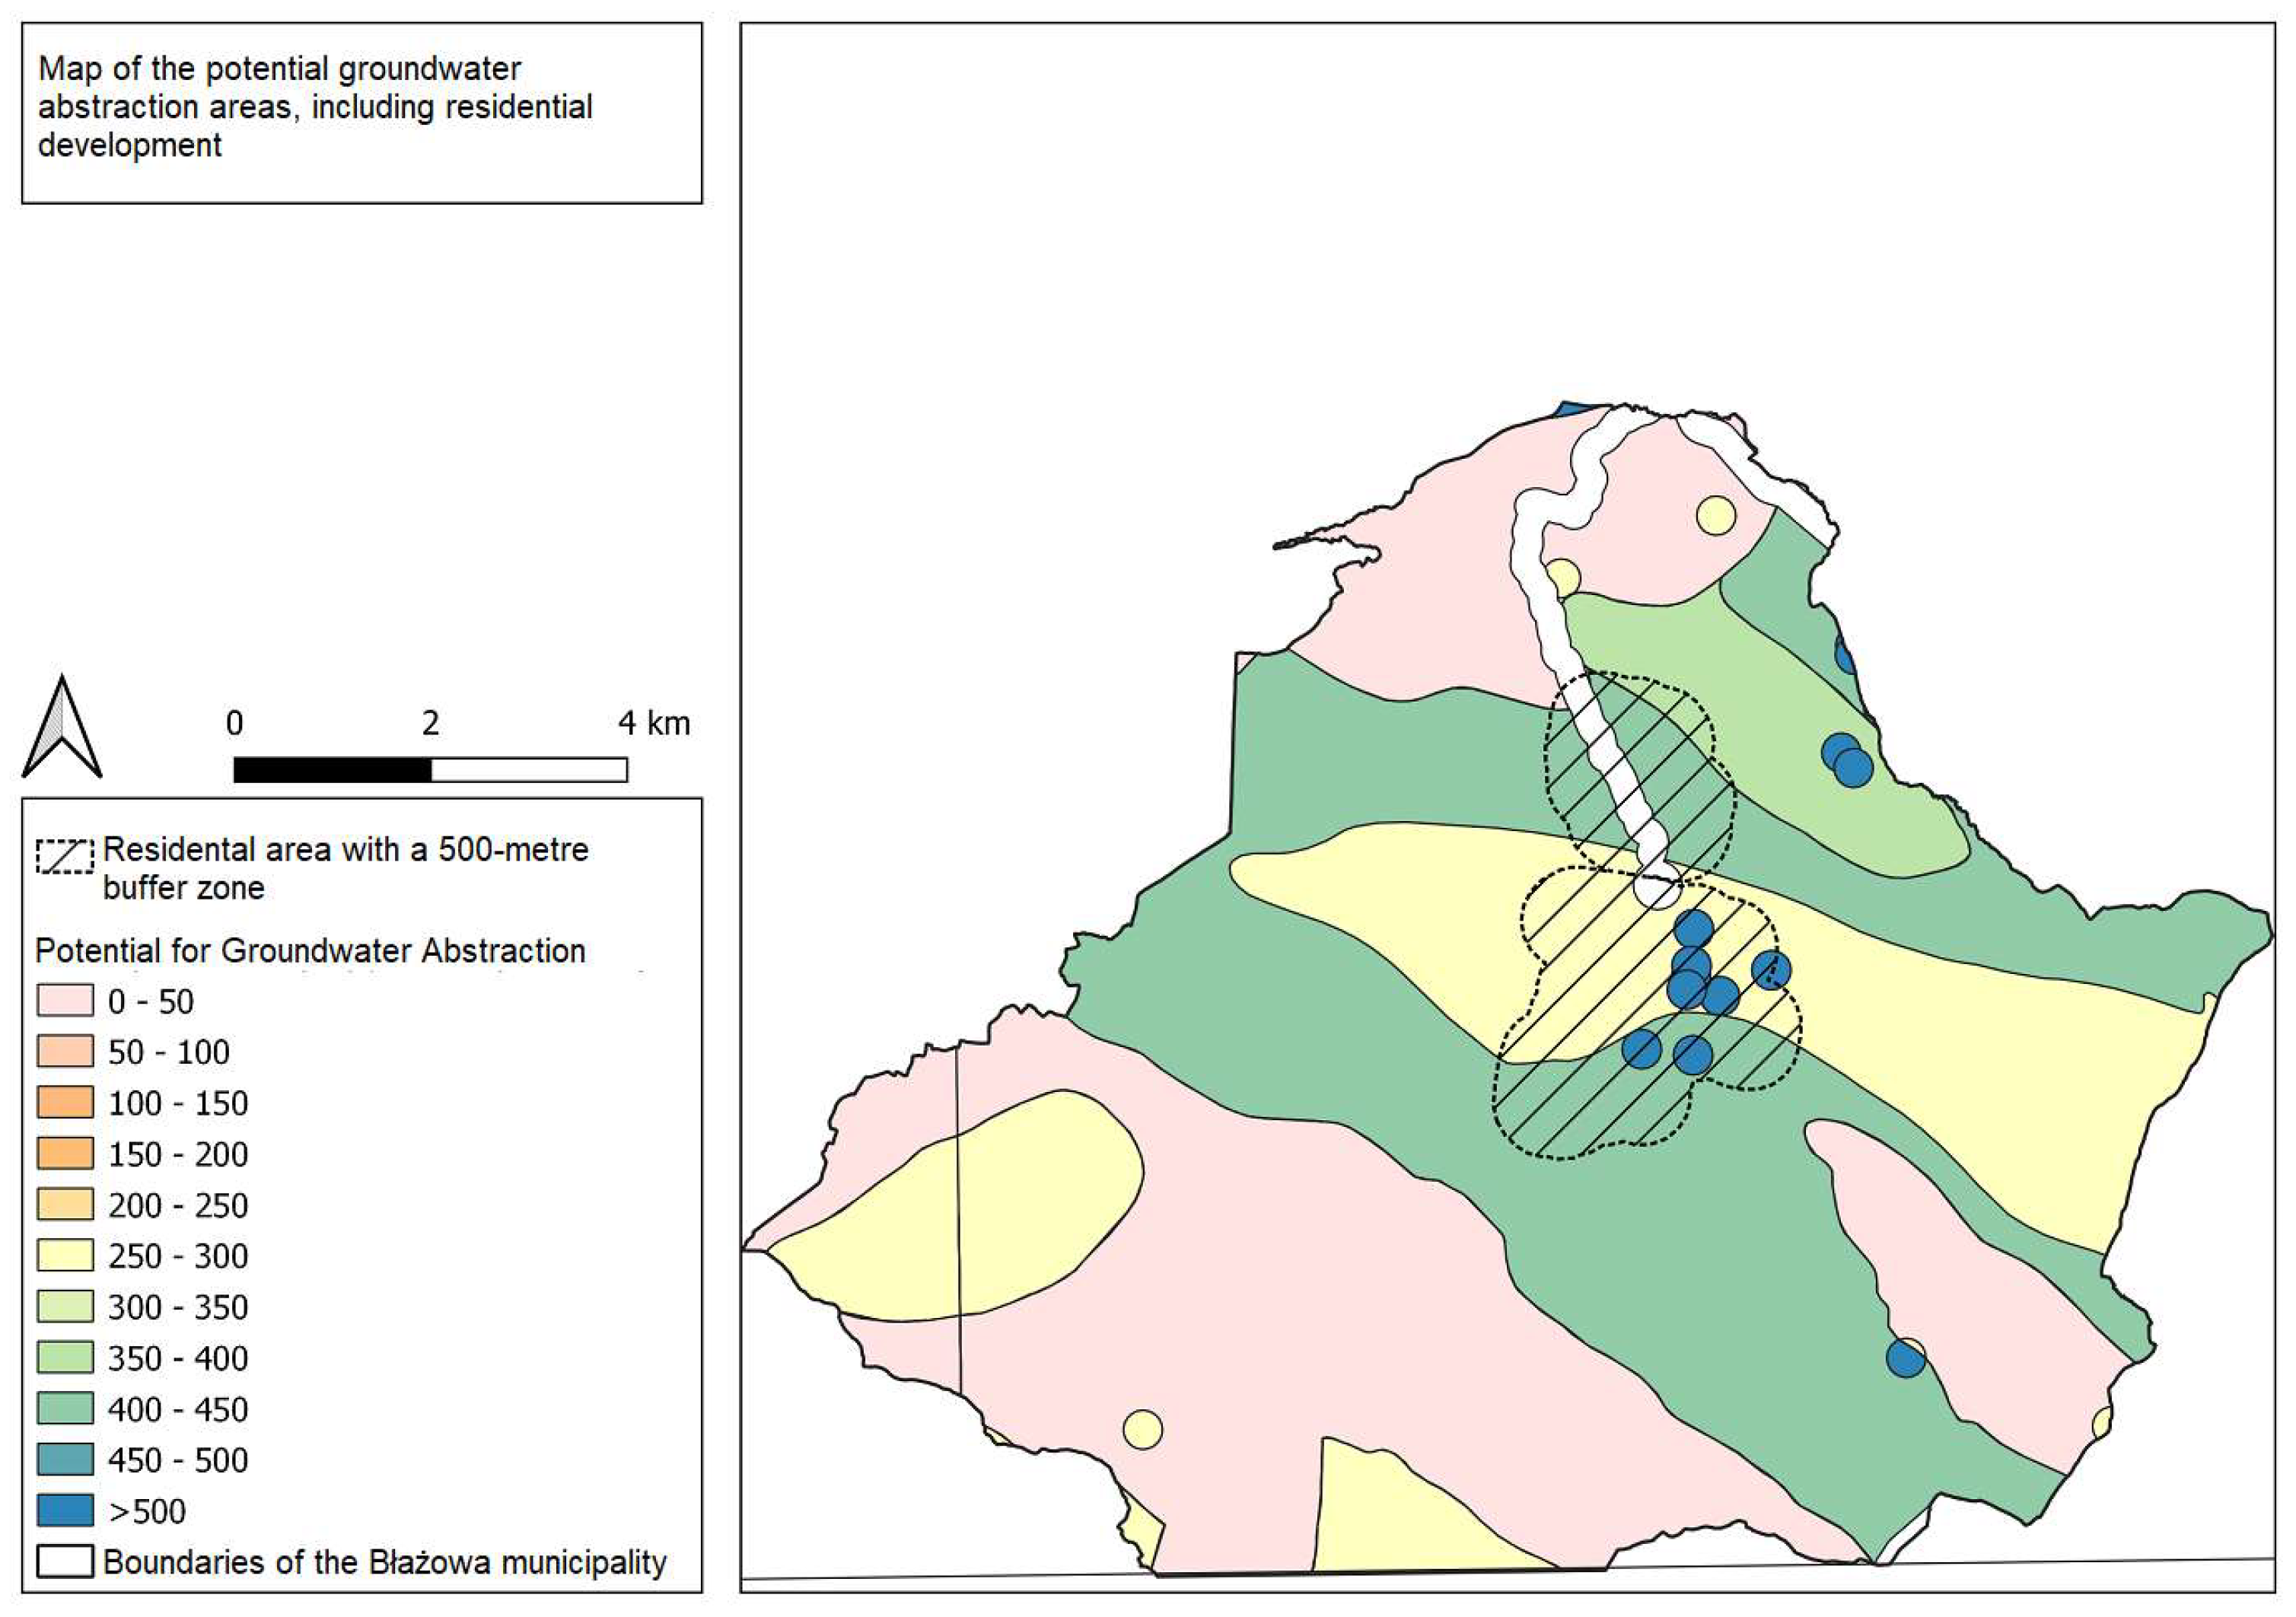
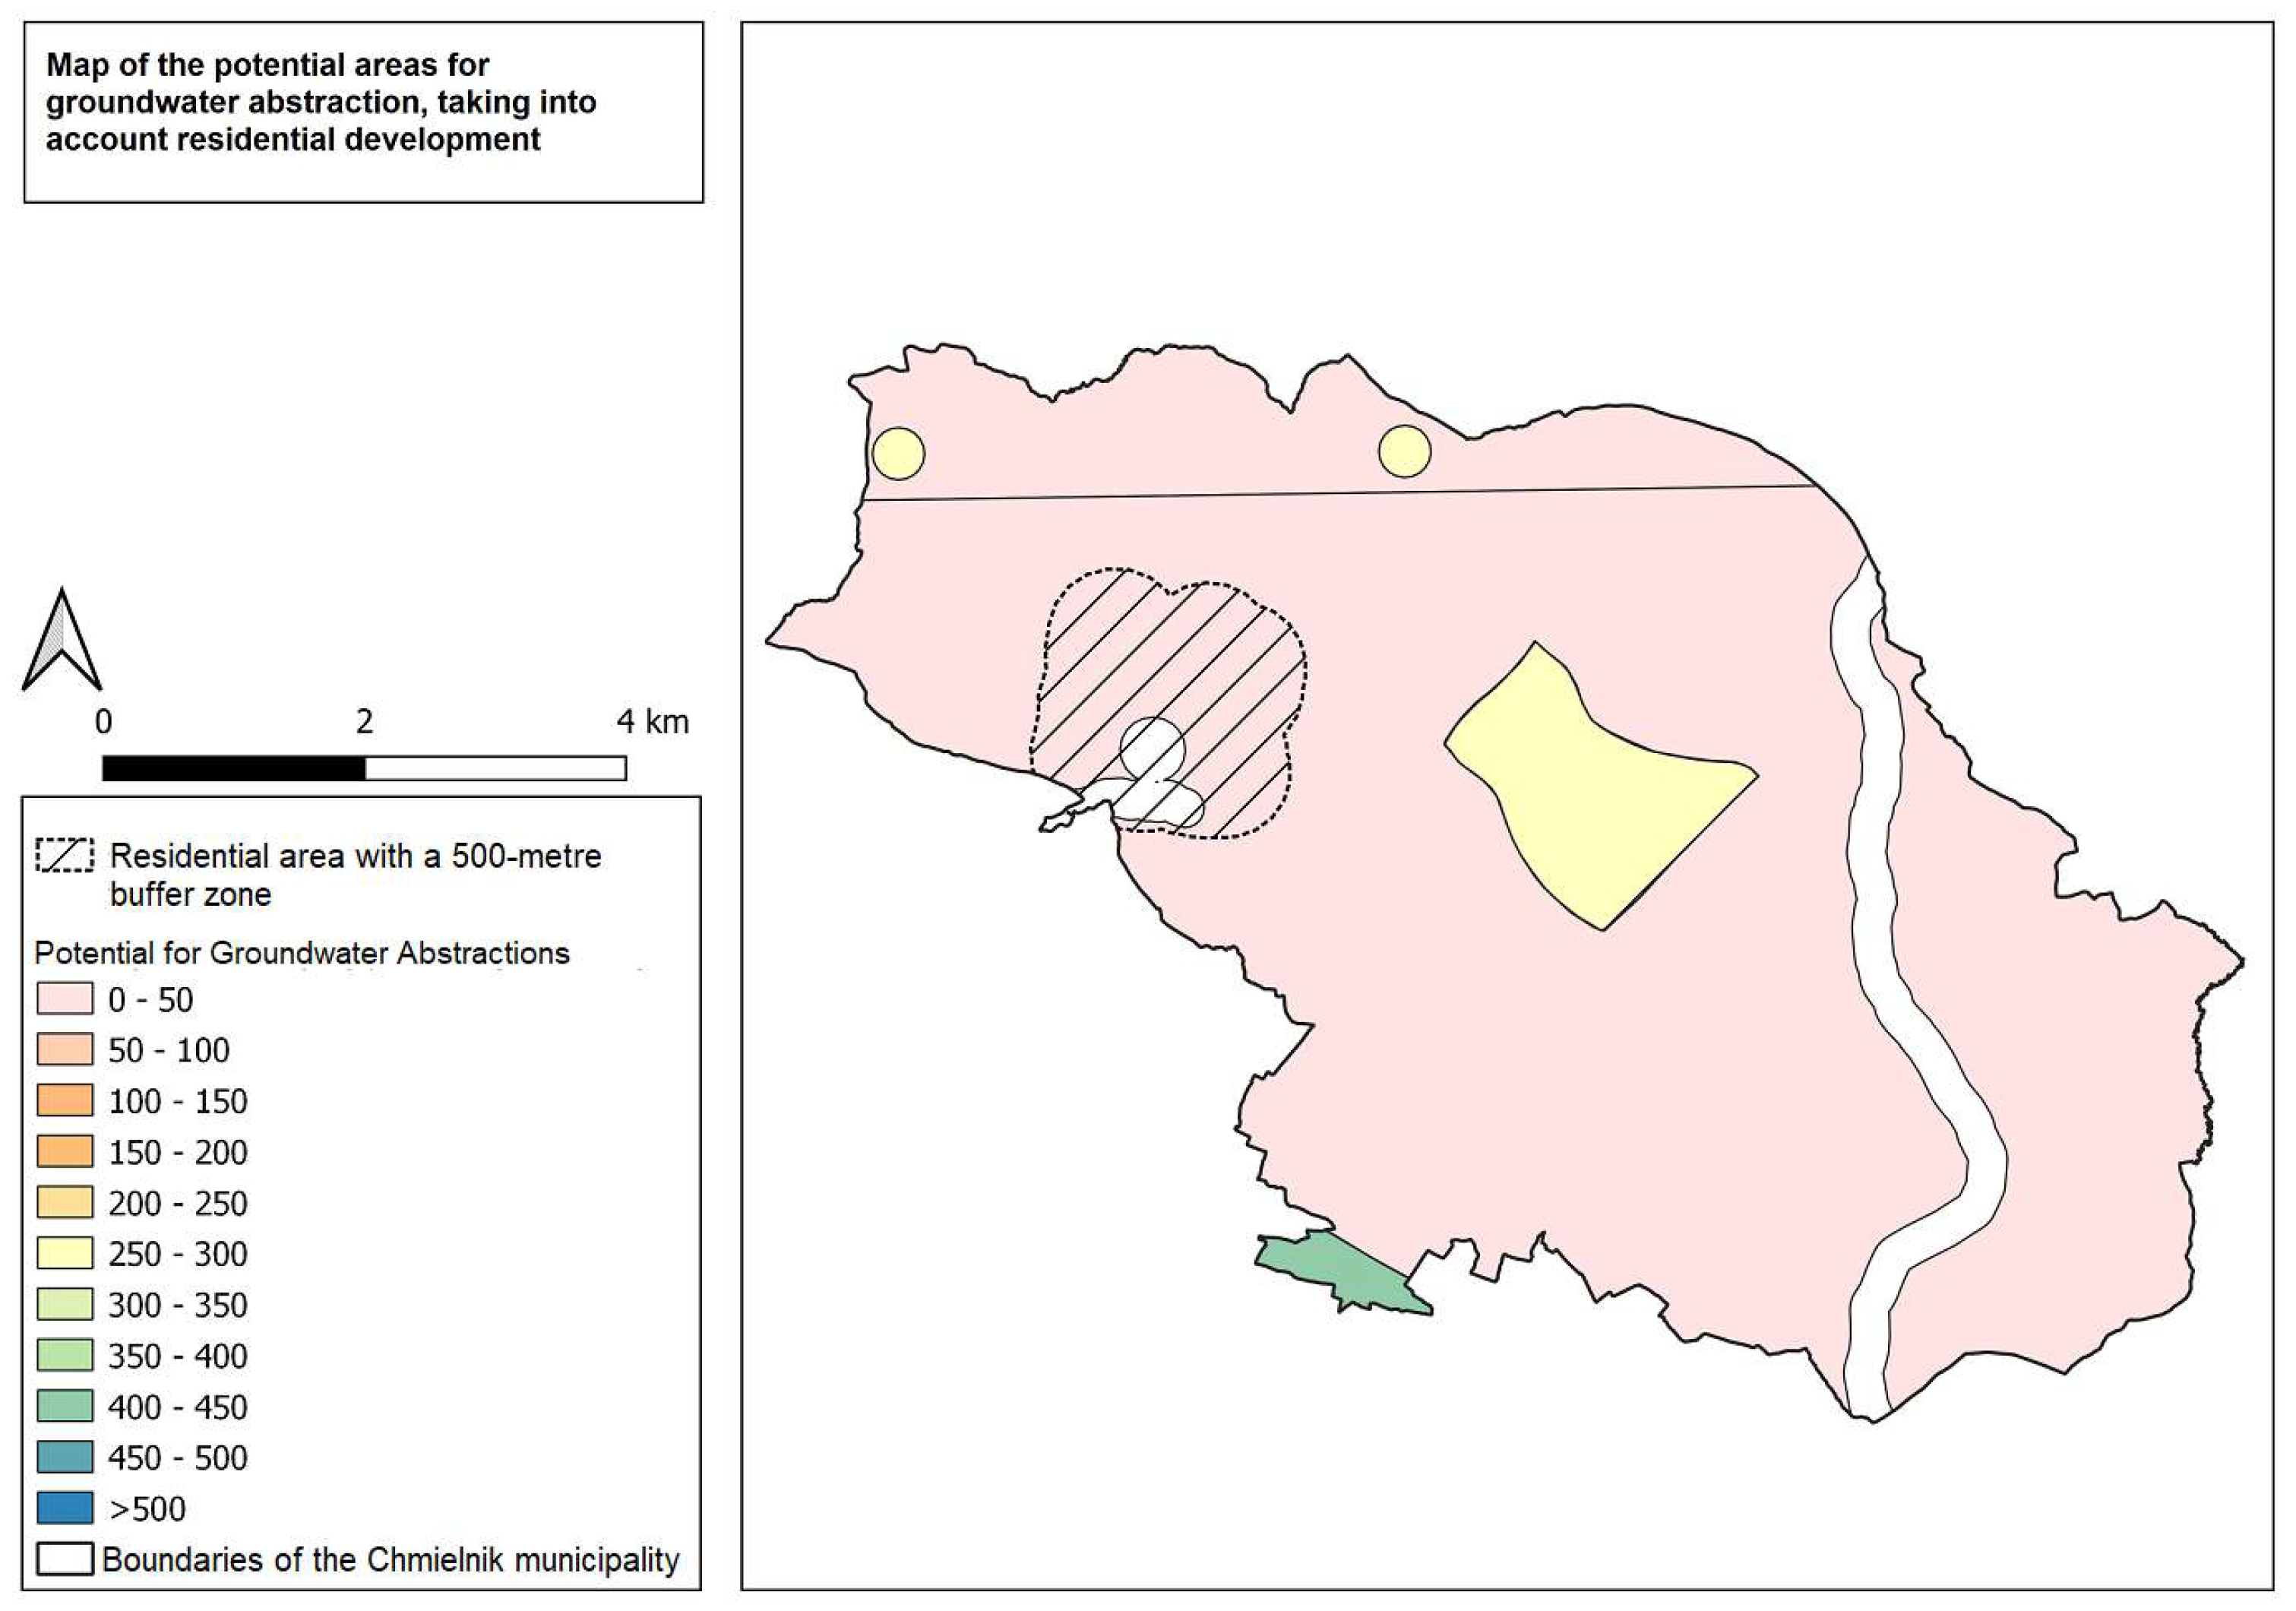
Specific conditions were considered for two municipalities, taking into account the demand generated from their built-up areas—one with the highest and one with the lowest groundwater resource potential. The relationship between ‘population demand’ and ‘potential overlay’ was examined. Integration of population density (>400 inh./km2) with potential zones revealed:
Błażowa: more than 80% of the population groups within high-potential zones; favourable conditions for distributed municipal supply.
Chmielnik: Main population centre isolated from high-potential zones; water supply must rely on longer-distance transmission, inter-municipal agreements, or surface water.
Rzeszów city: 60% of high-density residential areas (>1000 inh./km2) located within zones of medium to very high groundwater potential (P > 300); deficit zones in western districts (Staromieście, Słocina).
In the case of the Błażowa municipality, the main population centres are located in the central part of the area. These areas are very promising locations for the construction of groundwater intakes. In general, there are many areas within the municipality with high potential for groundwater intake sites. In addition, numerous spring areas within the municipality further increase the potential for groundwater intake locations. There is a large area in the municipality with a potential of 400–450 points (
Figure 8). The municipality has good prospects for a reliable water supply in the near future.
The municipality of Chmielnik has only one significant settlement cluster with a high population density and compact residential development. The area generally lacks zones with very high potential for groundwater abstraction. However, two locations within the municipality have been identified as prospective sites for further consideration. The first is a centrally located area with an estimated abstraction potential of 250 to 300 units (
Figure 9). The second comprises spring-related areas in the north of the municipality and should also be evaluated for feasibility. In particular, both potential sites are located within a radius of 2 km of the main population cluster, which could facilitate infrastructure planning and reduce distribution costs.
3.4. Validation Against Existing Abstraction Sites
At this stage, no comprehensive statistical validation was performed using overlap indices and Cohen’s Kappa coefficient. Nevertheless, a qualitative comparison of high potential zones modelled (P > 500) with mapped locations of existing wells indicates that most production wells are located in or near areas classified as medium or very high potential. This pattern confirms the reliability of the MCDA analysis results and, at the same time, highlights the need for full quantitative validation once complete and accessible reference data sets are available.
In order to provide an empirical plausibility check despite the lack of full quantitative validation, the spatial pattern of modelled potential zones was visually and descriptively compared with the mapped distribution of existing abstraction points (CBDG) and with the hydrogeological context described in the regional 1:50,000 mapping products. This cross-check indicates that many existing abstractions are located within areas classified by the model as medium to high potential, particularly within the Miocene sedimentary units of the Carpathian Foredeep.
However, because consistent, publicly accessible well-performance attributes (e.g., harmonised yield classes, pump-test results, and long-term water-quality time series) were not available for the entire set of abstraction points, standard accuracy metrics (e.g., overlap indices, confusion matrices, Cohen’s ) could not be computed in a defensible manner. Therefore, the present validation is limited to qualitative plausibility assessment, and a full quantitative validation is explicitly identified as priority future work once suitable reference datasets become accessible. The purpose of the current validation step is to assess spatial plausibility rather than predictive accuracy in a strict statistical sense. The MCDA framework is designed as a planning-support screening tool, and therefore its effectiveness should ultimately be evaluated through subsequent field verification and drilling campaigns rather than solely through retrospective statistical fitting.
4. Discussion
4.1. Interpretation of Results
The spatial distribution of high-potential zones (Błażowa, central Rzeszów, eastern Boguchwała) corresponds to areas with thicker Miocene sand/silt sequences and higher documented well-yield classes and thicker Miocene sand/silt sequences; conversely, low-potential zones (Chmielnik, Krasne, southern Czudec) coincide with thin-bedded Carpathian flysch geology.
During the study, factors influencing the uncertainty of the results obtained and certain limitations of the MCDA methodology were identified:
Sparse borehole density: The study region contains 142 boreholes on 830 km2 (approximately 0.17 boreholes/km2). Thus, interpolation of aquifer thickness, potential well yield, and water quality of the aquifer is based on kriging with high variance in areas far from the wells.
Weighting and normalisation: Criteria A–F were normalised to 1–5 scales based on the regional literature and expert consultation (n = 3 hydrogeologists). The multiplicative aggregation (A × B × C × D × E × F) assumes that all criteria are equally important and act synergistically; the sensitivity analysis (varying weights) would quantify the robustness to these assumptions (not presented here but recommended for further work).
Exclusion buffer radius: Distance thresholds (e.g., 250 m from fuel storage, 750 m from landfills) are based on the contaminant migration literature, but actual contaminant plumes depend on site-specific hydrogeology, management practices, and regulatory compliance. Some sources of contamination may pose a lower risk than is assumed; others (legacy dumps with poor monitoring) may be underestimated.
The present framework does not explicitly model groundwater flow pathways, hydraulic gradients, or preferential alluvial transport routes. These processes are acknowledged as important for detailed hydro-dynamic risk assessment, but they require site-specific geological modelling and piezometric data beyond the spatial resolution and data availability of this municipal-scale screening study. Consequently, the exclusion zones should be interpreted as conservative regulatory safety margins rather than physically simulated flow-dependent protection zones.
Population density proxy: Census data (2021) reflect historical patterns; rapid suburban expansion or industrial development post-2021 is not captured. Demand projections (2025–2050) would require demographic forecasts beyond the scope of this study.
Recharge index (F) and bonus (G): The 250-unit bonus for recharge zones is somewhat arbitrary and reflects a management preference for spring-fed or high-permeability outcrops as preferred abstraction points. This choice is defensible (recharge areas are hydraulically important) but not uniquely determined by the data.
Sensitivity and uncertainty considerations: The adopted equal-weight configuration represents a baseline modelling assumption rather than a fully optimised AHP solution. Given the recognised subjectivity of MCDA weighting schemes, alternative weighting scenarios may produce variations in absolute index values and local spatial rankings. Although a formal quantitative sensitivity experiment was beyond the scope of the present study, the structure of the multiplicative model ensures that no single criterion can dominate the final outcome independently. Future work should include systematic weight variation and scenario testing to evaluate robustness of municipal rankings and delineation of high-potential zones.
4.2. Comparison with Previous GIS–MCDA Groundwater Studies
Unlike many AHP-based GWPZ studies, which only consider geo-environmental factors such as geology, geomorphology, slope, drainage density, lineaments, precipitation, and soils to determine potential, without modelling demand explicitly or using hard exclusion zones [
25]. Our vector GIS-MCDA approach combines hydrogeological suitability with regulatory and pollution exclusion criteria, as well as a population density overlay. This allows us to prioritise intake locations where the potential of the resource coincides with the actual water supply needs of municipalities.
Although the MCDA model based on GIS—developed for Lodwar Municipality focuses on water demand by integrating criteria such as population density, distance from existing water infrastructure, and service facilities, it does not explicitly resolve groundwater potential or hydrogeological constraints, treating water supply largely from the side perspective of demand [
26]. Our study complements this line of research by jointly evaluating groundwater potential, contamination and regulatory exclusions, and population-driven demand within a single vector-based framework, thus linking resource availability with infrastructure-oriented prioritisation at the municipal scale.
In contrast to our municipal-scale GIS-MCDA, which combines hydrogeological suitability with contamination-driven exclusion zones and population-demand overlay, Herbich et al. [
20] delineate groundwater protection and potential zones primarily from hydrogeological mapping and intrinsic aquifer characteristics, without explicitly modelling spatial patterns of water demand. As a result, their maps support the planning of resource and protection on a regional scale, while our workflow is tailored to prioritise specific abstraction areas where favourable conditions coincide with current and projected municipal water needs.
4.3. Implications for Water Supply Planning
The main objective of this research was to identify areas considered suitable for groundwater extraction in the context of spatial planning for individual municipalities. The results of this research constitute recommendations prepared for each municipality. The following discussion will focus on three of these municipalities:
Błażowa (Potential Index 240): Highest overall groundwater potential; planning for new or expanded municipal supply is hydrogeologically favorable. The priority zones identified in the central municipality (within 500 m of the population centres) overlap with high-potential areas; a feasibility study was recommended for 1–2 candidate sites.
Rzeszów city (Potential Index 223): Despite the size and historical dominance of groundwater supply, significant portions of residential areas (especially western districts) fall outside high-potential zones. The current dependence on 40+ city-owned wells is reasonable given the distributed geology; diversification toward Błażowa or eastern Boguchwała as supplementary sources could reduce the stress on local aquifers and provide redundancy during contamination events or droughts.
Chmielnik (Potential Index 20): Represents a critical planning challenge. Low groundwater potential, combined with legacy contamination (industrial site within 500 m of main population center), makes new local abstraction inadvisable. Recommended strategies:
Inter-municipal cooperation: Purchase treated water from the Rzeszów or Boguchwała systems via the pipeline.
Demand management: Water conservation, leak reduction, recycling.
Surface water: Evaluate feasibility of small reservoirs or stream abstractions in tributaries (requiring separate hydrogeological and ecological evaluation).
Remediation: If legacy industrial site can be remediated, re-assessment of contamination risk might expand suitable zones.
4.4. Methodological Contributions and Best Practices
This study demonstrates several methodological contributions applicable to other Central and Eastern European regions:
Integration of transparent criteria: By explicitly listing criteria A–F and their normalisation (scales, sources of literature, expert judgement), the MCDA framework is reproducible and defensible to stakeholders. Non-experts can understand why a location is ranked as suitable or unsuitable.
Integration of contamination risk: Traditional hydrogeological potential assessments ignore non-intrinsic factors (land use, regulations, contamination hazards). Our approach bridges this gap by treating exclusion zones as hard constraints in the suitability domain, explicitly acknowledging that potential is only relevant in areas where abstraction is legally and environmentally permissible.
Population demand coupling: Most MCDA hydrogeology studies optimise for hydrogeological potential alone. By overlaying the density of the population and calculating the distance to the demand centres, we identify the zones where the high potential aligns with the actual supply need—a critical distinction for infrastructure planning.
This is particularly relevant for municipalities operating under persistent data constraints, where decisions on new groundwater abstraction sites must be made despite incomplete hydrogeological information.
4.5. Transferability and Future Work
Applicability to other regions: The MCDA framework is transferable to other parts of Central and Eastern Europe (Czech Republic, Slovakia, Hungary, Romania) and beyond, depending on:
Availability of geological maps and estimates of aquifer parameters (regional studies, borehole databases),
Identification of sources of hazards relevant to the local context (industrial legacy, agricultural practices, etc.),
Population data and census records.
Regions with more comprehensive hydrogeological data (e.g., Germany, France, northern Europe) may benefit less from the data-synthesis capability of the MCDA’s, but the framework remains useful for integrating the hazard and demand factors. Recommended follow-up studies:
Sensitivity analysis: Vary weights on criteria A–F and re-compute potential indices; identify which criteria most strongly drive spatial patterns and robustness of priority rankings to uncertainty.
Climate change scenario analysis: Apply projected changes in precipitation and water table (from regional climate models) to assess how groundwater potential zones may shift over the 2050 to 2100 timescale.
Groundwater quality time-series: Integrate historical water quality monitoring (TDS, nitrate, heavy metals) to identify contamination trends and refine C (water quality index) spatially. However, access to consistent historical datasets (e.g., 10+ year nitrate or heavy metal trends) was limited in this region, precluding robust temporal analysis.
Drilling recommendations: Conduct test drilling (boreholes with pump tests) at 3–5 sites ranked as high-potential but currently unsampled, to empirically validate predicted well-yield classes and upgrade the model.
Stakeholder involvement: Organise workshops with municipal water authorities, regional environmental agencies, and civil society to present results, receive feedback on criteria weights and priorities, and co-develop implementation roadmaps.
4.6. Climate Considerations
Climate change is expected to affect groundwater recharge patterns in southeastern Poland. According to EURO-CORDEX regional climate models, annual precipitation can decrease by 5–10% by 2050, with more intense summer droughts and reduced snow accumulation. This will particularly affect shallow aquifers in highland areas, while deeper Miocene aquifers in the Carpathian Foredeep may remain more stable [
5].
The current MCDA framework can be expanded by integrating projected changes in recharge conditions and seasonality. Future work should consider adding climate-adjusted recharge indices to improve the long-term relevance of site selection. This is especially important for municipalities where water stress is expected to intensify and inter-municipal cooperation becomes critical.
5. Conclusions
This study presents a practical GIS–MCDA framework to identify prospective groundwater abstraction sites in South-East Poland, applicable to municipalities facing data constraints and urgent planning needs. The key findings are as follows.
The groundwater potential varies substantially throughout the 10-municipality study region, with about a five-fold difference between the highest potential indices (Błażowa, 240) and the lowest (Chmielnik, 20), reflecting the underlying geological contrast between Miocene sediments and Carpathian flysch.
Qualitative comparison of predicted high-potential zones with the spatial distribution of 142 existing wells suggests that the MCDA model consistently highlights hydrogeologically favourable areas, even under limited baseline data conditions;
The combination of groundwater potential with population density reveals that the highest-potential zones (Błażowa, central Rzeszów) also contain significant population centres, facilitating the development of cost-effective supply, while Chmielnik’s low potential and more isolated demand patterns indicate the need for inter-municipal cooperation or alternative water sources.
The framework delivers actionable spatially explicit results for municipal authorities, including indicative priority zones for test drilling, areas to avoid due to elevated contamination risk, and locations where inter-municipal coordination is advisable.
By explicitly incorporating contamination risk, legal constraints, and demand patterns alongside hydrogeological parameters, the MCDA approach provides more defensible and implementable planning guidance than hydrogeological-only assessments.
As groundwater stress increases in Central and Eastern Europe—driven by population growth, economic development, agricultural intensification, and projected climate change—municipalities increasingly require decision-support tools that integrate hydrogeological science with planning realities (data scarcity, regulatory constraints, competing demands). Furthermore, climate-related factors, such as reduced water supply in projected precipitation scenarios (e.g., EURO-CORDEX models), should be included in future versions of the MCDA framework, which should be used in the context of planning activities that take into account projections of changes over time.
This study indicates that a carefully specified GIS–MCDA framework can provide such support, while highlighting the need for improved data sharing to enable full statistical validation. Future work should extend the framework to other regions, incorporate climate change projections, and involve stakeholders in the iterative refinement of criteria and priorities.
Author Contributions
Conceptualization, Wojciech Wałachowski and Artur Krawczyk; methodology, Wojciech Wałachowski; software, Wojciech Wałachowski; formal analysis, Wojciech Wałachowski; investigation, Wojciech Wałachowski; resources, Wojciech Wałachowski; data curation, Wojciech Wałachowski; writing—original draft preparation, Artur Krawczyk and Wojciech Wałachowski; writing—review and editing, Artur Krawczyk, Ugo Falchi and Kamil Maciuk; visualization, Wojciech Wałachowski and Artur Krawczyk; supervision, Ugo Falchi; language control Ugo Falchi; project administration, Artur Krawczyk and Kamil Maciuk. All authors have read and agreed to the published version of the manuscript.
Funding
This research received no external funding.
Institutional Review Board Statement
Not applicable.
Informed Consent Statement
Not applicable.
Data Availability Statement
Data used in this study are available upon request from the corresponding author.
Acknowledgments
During the preparation of this article, the authors used DeepL to translate the text from Polish into English and ChatGPT (OpenAI, GPT-5.3) to improve the structure of the text. The authors have carefully reviewed and edited all outputs and take full responsibility for the final content of the manuscript.
Conflicts of Interest
Author Wojciech Wałachowski was employed by the company Mostostal Warszawa S.A. The remaining authors declare that the research was conducted in the absence of any commercial or financial relationships that could be construed as a potential conflict of interest. The funders had no role in the design of the study; in the collection, analyses, or interpretation of data; in the writing of the manuscript; or in the decision to publish the results.
References
- Wada, Y.; Wisser, D.; Bierkens, M.F.P. Global modeling of withdrawal, allocation and consumptive use of surface water and groundwater resources. Earth Syst. Dyn. 2014, 5, 15–40. [Google Scholar] [CrossRef]
- Gleeson, T.; Wada, Y.; Bierkens, M.F.P.; van Beek, L.P.H. Water balance of global aquifers revealed by groundwater footprint. Nature 2012, 488, 197–200. [Google Scholar] [CrossRef]
- Foster, S.S.D.; Chilton, P.J. Groundwater: The processes and global significance of aquifer degradation. Philos. Trans. R. Soc. Lond. Ser. B Biol. Sci. 2003, 358, 1957–1972. [Google Scholar] [CrossRef]
- Zabłocki, S.; Sawicka, K.; Porowska, D.; Krogulec, E. Identifying Zones of Threat to Groundwater Resources Under Combined Climate and Land-Use Dynamics in a Major Groundwater Reservoir (MGR 406, Poland). Land 2025, 14, 1659. [Google Scholar] [CrossRef]
- Kubiak-Wójcicka, K.; Machula, S. Influence of Climate Changes on the State of Water Resources in Poland and Their Usage. Geosciences 2020, 10, 312. [Google Scholar] [CrossRef]
- Ziemska, J.; Solecka, J.; Mazańska, M.; Szynal, T. Natural groundwaters in Poland—Occurrence, properties and chemical types. Rocz. Państw. Zakł. Hig. 2020, 71, 363–370. [Google Scholar] [CrossRef] [PubMed]
- Bradbury, K.R. Groundwater Potential Mapping: A Misused and Dubious Concept. Groundwater 2025, 63, 664–665. [Google Scholar] [CrossRef] [PubMed]
- Machiwal, D.; Jha, M.K.; Mal, B.C. Assessment of Groundwater Potential in a Semi-Arid Region of India Using Remote Sensing, GIS and MCDM Techniques. Water Resour. Manag. 2010, 25, 1359–1386. [Google Scholar] [CrossRef]
- Apollo, M.; Mostowska, J.; Maciuk, K.; Wengel, Y.; Jones, T.E.; Cheer, J.M. Peak-bagging and cartographic misrepresentations: A call to correction. Curr. Issues Tour. 2020, 24, 1970–1975. [Google Scholar] [CrossRef]
- Maciuk, K.; Mostowska, J.; Sylaiou, S.; Falk, J. Museums and the pandemic—How COVID-19 impacted museums as seen through the lens of the world’s most visited art museums. Int. J. Conserv. Sci. 2022, 13, 609–618. [Google Scholar]
- Tretyak, K.; Brusak, I.; Savchuk, N.; Kozak, A.; Babchenko, V. Geodynamic features of territories around Ukraine’s Hydroelectric Power Plants based on GNSS CORS data. Geodynamics 2025, 2, 70–82. [Google Scholar] [CrossRef]
- Cvetkov, V. Entropy, observations and some standard deviations. Dtsch. Int. Z. Zeitgenössische Wiss. 2024, 94, 13–18. [Google Scholar] [CrossRef]
- Machiwal, D.; Jha, M.K.; Singh, V.P.; Mohan, C. Assessment and mapping of groundwater vulnerability to pollution: Current status and challenges. Earth-Sci. Rev. 2018, 185, 901–927. [Google Scholar] [CrossRef]
- Khosravi, K.; Panahi, M.; Tien Bui, D. Spatial prediction of groundwater spring potential mapping based on an adaptive neuro-fuzzy inference system and metaheuristic optimization. Hydrol. Earth Syst. Sci. 2018, 22, 4771–4792. [Google Scholar] [CrossRef]
- Dar, I.A.; Sankar, K.; Dar, M.A. Remote sensing technology and geographic information system modeling: An integrated approach towards the mapping of groundwater potential zones in Hardrock terrain, Mamundiyar basin. J. Hydrol. 2010, 394, 285–295. [Google Scholar] [CrossRef]
- Magesh, N.; Chandrasekar, N.; Soundranayagam, J.P. Delineation of groundwater potential zones in Theni district, Tamil Nadu, using remote sensing, GIS and MIF techniques. Geosci. Front. 2012, 3, 189–196. [Google Scholar] [CrossRef]
- Kausher, R.; Kumar Sinha, A.; Singh, R. Delineation of Groundwater Potential Zones for Sustainable Development and Planning using AHP and GIS Techniques in the Coal Mining Province of Mahan River Catchment Area. Arch. Min. Sci. 2024, 69, 77–88. [Google Scholar] [CrossRef]
- Borzì, I. Modeling Groundwater Resources in Data-Scarce Regions for Sustainable Management: Methodologies and Limits. Hydrology 2025, 12, 11. [Google Scholar] [CrossRef]
- Lerner, D.N.; Harris, B. The relationship between land use and groundwater resources and quality. Land Use Policy 2009, 26, S265–S273. [Google Scholar] [CrossRef]
- Herbich, P.; Woźnicka, M.; Witczak, S. Hydrogeological cartography as a tool supporting water management, spatial planning and environmental protection. Przegl. Geol. 2010, 58, 746–753. [Google Scholar]
- Fan, Y.; Li, H.; Miguez-Macho, G. Global Patterns of Groundwater Table Depth. Science 2013, 339, 940–943. [Google Scholar] [CrossRef] [PubMed]
- Saaty, T.L. The Analytic Hierarchy Process: Planning, Priority Setting, Resource Allocation; McGraw-Hill: New York, NY, USA, 1980. [Google Scholar]
- Arulbalaji, P.; Padmalal, D.; Sreelash, K. GIS and AHP Techniques Based Delineation of Groundwater Potential Zones: A case study from Southern Western Ghats, India. Sci. Rep. 2019, 9, 2082. [Google Scholar] [CrossRef] [PubMed]
- Malczewski, J. GIS-based multicriteria decision analysis: A survey of the literature. Int. J. Geogr. Inf. Sci. 2006, 20, 703–726. [Google Scholar] [CrossRef]
- Melese, T.; Belay, T. Groundwater Potential Zone Mapping Using Analytical Hierarchy Process and GIS in Muga Watershed, Abay Basin, Ethiopia. Glob. Chall. 2021, 6, 2100068. [Google Scholar] [CrossRef]
- Wanguba, B.; Siriba, D.N.; Okumu, B.O. GIS-based multi-criteria decision analysis model for utility water demand: The case of Lodwar Municipality, Turkana County, Kenya. Heliyon 2024, 10, e36518. [Google Scholar] [CrossRef]
| Disclaimer/Publisher’s Note: The statements, opinions and data contained in all publications are solely those of the individual author(s) and contributor(s) and not of MDPI and/or the editor(s). MDPI and/or the editor(s) disclaim responsibility for any injury to people or property resulting from any ideas, methods, instructions or products referred to in the content. |
© 2026 by the authors. Published by MDPI on behalf of the International Society for Photogrammetry and Remote Sensing. Licensee MDPI, Basel, Switzerland. This article is an open access article distributed under the terms and conditions of the Creative Commons Attribution (CC BY) license.