Article

Industrial Heritage in China: Spatial Patterns, Driving Mechanisms, and Implications for Sustainable Reuse

1
Faculty of Humanities and Social Sciences, Macao Polytechnic University, Macao 999078, China
2
School of Applied Science and Civil Engineering, Beijing Institute of Technology, Zhuhai 519088, China
3
Department of Management, Henan Institute of Technology, Xinxiang 453000, China
*
Author to whom correspondence should be addressed.
ISPRS Int. J. Geo-Inf. 2026, 15(1), 17; https://doi.org/10.3390/ijgi15010017
Submission received: 9 November 2025 / Revised: 18 December 2025 / Accepted: 22 December 2025 / Published: 31 December 2025

Abstract

This study investigates the spatial patterns and driving mechanisms of China’s industrial heritage using nationwide provincial-level geospatial data. It combines multiple spatial analysis techniques to identify distribution characteristics and applies a multi-model framework integrating Multi-Scale Geographically Weighted Regression and machine learning to assess the impacts of demographic, economic, climatic, and topographic factors. Results reveal a pronounced clustered pattern and marked spatial differentiation, with core concentrations in the southeastern coastal and central regions. Industrial layouts across historical periods show a shift from coastal to inland areas, reflecting security-oriented spatial strategies. Economic development has a significant positive influence, whereas temperature and the number of industrial enterprises exert negative effects. Natural environmental conditions—such as slope, vegetation coverage, and water systems—serve as both spatial supports and constraints. At the macro level, the spatial configuration of industrial heritage emerges from the structured interplay of historical path dependence, national strategic regulation, and geographic environmental constraints, rather than short-term interactions among isolated variables. The study elucidates the evolutionary logic of industrial civilization and highlights the synergistic mechanisms linking economic, social, and environmental dimensions. It concludes by advocating a hierarchical and multi-factor balanced framework for spatial governance.

1. Introduction

According to the Nizhny Tagil Charter adopted by the International Committee for the Conservation of the Industrial Heritage (TICCIH) and the Wuxi Recommendations proposed by the Chinese government, industrial heritage is defined as encompassing diverse elements such as production processes, machinery, and industrial technologies, recording the evolution of techniques and technologies as well as the cumulative experience of production activities across historical periods [1]. Industrial heritage not only contains historical information on technological development and labor organization but also profoundly reflects transformations in urban space and socio-productive relations. As a key witness to the evolution of the previous generation’s industrial civilization, industrial heritage holds considerable significance for intergenerational shifts in regional identity, especially amid the widening gap between the lifestyles and production modes of new and older generations. The technological, scientific, and economic value it carries far exceeds that of general cultural heritage, offering great potential to be transformed into strategic resources for fostering urban cultural identity, ecological restoration, and sustainable development [2]. However, in the context of deindustrialization and accelerated urban renewal, industrial heritage—often regarded as obsolete regional production facilities—faces the urgent risk of marginalization and erasure from the urban landscape, becoming a pressing concern for contemporary urban governance and heritage management [3].
Heritage research, as a multidisciplinary field, is undergoing a profound transformation from the mere protection of tangible entities to the integration of intangible dimensions and the promotion of sustainable urban development. Overall, it exhibits multi-layered, cross-disciplinary characteristics, with theoretical understanding and practical application becoming increasingly intertwined [4,5,6]. Existing studies have primarily focused on several core themes. First, definition and value assessment—this encompasses not only the historical, technological, and aesthetic value of industrial heritage but also its economic, social, educational, and symbolic significance [7,8,9,10]. Second, conservation and adaptive reuse strategies—emphasizing the dialogue between global experience and local adaptation in the context of rapid urbanization [11,12], activating heritage to achieve both cultural transmission and economic synergy, while responding to challenges such as deindustrialization, functional replacement, and policy shifts [13,14]. Third, urban regeneration and sustainable development—positioning industrial heritage as a catalyst for urban spatial revitalization and exploring balanced pathways between economic vitality, cultural continuity, and environmental sustainability [15,16,17]. Fourth, methodological advancement—expanding from traditional industrial archaeology to integrative perspectives from geography, sociology, economics, and other disciplines [3,18].
The spatial and geographical environment constitutes the material foundation and prerequisite for human survival, development, and all forms of social production. The human–land relationship across regions is continuously shaped by dynamic interactions among multiple elements. Although spatial analyses of heritage distribution have increased in recent years, research specifically focused on the spatial characteristics of industrial heritage remains limited [19,20]. The siting of industrial heritage facilities depends on natural conditions such as water availability, slope, and elevation, as well as social factors including proximity to raw materials and labor resources [21]. These dependencies endow industrial heritage with a pronounced tendency toward spatial agglomeration and regional coupling. Reliance solely on traditional descriptive statistics or localized case studies is insufficient to capture its systemic patterns. Compared with general cultural heritage, industrial heritage exhibits stronger spatial dependence and a more prominent techno–social–spatial composite character [22,23,24]. Against the backdrop of rapid urbanization and industrial transformation, and in the face of regional disparities, heterogeneous policies, and resource constraints, achieving harmonious integration between heritage conservation and local environmental factors has become increasingly urgent [11]. China encompasses both resource-exhausted cities such as the old industrial bases in the northeast and dynamic economic zones such as the Guangdong–Hong Kong–Macao Greater Bay Area. With its century-long industrial development history, coupled with rapid urban renewal and industrial restructuring, the spatial patterns of its industrial heritage are inevitably complex, diverse, and of broad representativeness [11]. As the product of long-term interaction between natural and socio-ecological environments, heritage formation and development reflect the geographic paradigm of human–environment coordination. Therefore, research on industrial heritage should not remain confined to the conceptual level of heritage nor uncritically adopt the analytical frameworks of general cultural heritage. Instead, it must account for the distinct characteristics of industrial heritage and provide a systematic and rigorous empirical analysis of its spatial patterns [25].
Industrial heritage does not exist in isolation; it is situated within a complex interactive framework that integrates geographical environment, social development, and cultural narratives [26]. Thus, examining heritage development patterns from a spatial perspective can reveal not only the pathways of industrialization but also the structural disparities that persist in urban renewal and heritage governance [27].
Regional differences in natural environment (e.g., topography, hydrology), economic development level, industrial structure, and policy orientation significantly influence the density and preservation status of industrial heritage. Analyses based solely on average effects obscure these differences, resulting in “one-size-fits-all” protection measures that hinder precise policymaking [28]. Revealing spatial distribution patterns and driving mechanisms in depth can provide a basis for differentiated, type-specific conservation and utilization plans, ensuring that limited financial and policy resources are directed to the most valuable and urgent areas. This can help establish tiered and zoned conservation frameworks, optimize the allocation of heritage resources, and balance reuse with industrial upgrading [29], thereby laying the groundwork for incorporating industrial heritage into national cultural, urban–rural, and regional development strategies [30]. Without such understanding, conservation and reuse practices may suffer from resource allocation imbalances, overlook regional differences in policy design, and even lead to continued heritage loss in certain areas, directly affecting conservation priorities, reuse models, and policy effectiveness [31].
Industrial heritage conservation is a complex system shaped by the interplay of multiple factors whose relationships are seldom simple linear additions; rather, they are influenced by the combined and interacting effects of natural and social contexts, regional development, industrial structure, policy, and historical factors [32]. Traditional analytical methods for heritage studies can suffer from subjectivity. Geographic Information System (GIS) technologies capable of handling large-scale, multi-scale data have been widely applied to the conservation and spatio-temporal evolution of various heritage types [33,34,35], but applications specifically targeting industrial heritage remain limited. Furthermore, when exploring multifactor driving mechanisms, the precision of causal interpretation and the reliability of results are critical challenges [36]. Compared with commonly used methods such as the geographical detector, ordinary least squares (OLS), and geographically weighted regression (GWR), the combined use of multiscale geographically weighted regression (MGWR) and XGBoost with SHAP values overcomes the assumptions of scale homogeneity and linear interaction inherent in traditional methods, making it more suitable for China’s complex environmental characteristics [37].
In short, although existing research demonstrates a clear trend toward interdisciplinarity and has accumulated extensive experience and cases in conservation strategies and adaptive reuse, the “industrial” dimension remains frequently absent in heritage research, while the “spatial” dimension is severely underrepresented [3,38]. At the macro-spatial scale, analyses focused on developing countries are still lacking, and comprehensive quantitative approaches that integrate development characteristics, scale-sensitivity detection, and variable contribution analysis remain scarce [28,39,40].
Based on these gaps and needs, this study focuses on two core questions:
  • At the macro-spatial scale, what are the development patterns of industrial heritage in China, and do different regions exhibit distinct characteristics and differentiated clustering modes?
  • Which factors are closely related to these spatial distribution patterns, and do their effects exhibit region-specific variations?
To systematically reveal the spatial pattern and formation mechanisms of China’s industrial heritage, this study first employs Geographic Information System (GIS)–based spatial analysis techniques, including kernel density analysis, spatial autocorrelation, and hotspot analysis, to identify overall distribution characteristics and clustering patterns, thereby delineating the fundamental spatial structure of industrial heritage. Second, the study applies a machine learning framework—eXtreme Gradient Boosting (XGBoost) combined with Shapley Additive Explanations (SHAP)—to quantify the contribution and direction (positive or negative) of various factors in predicting the dependent variable, providing global-scale evidence for understanding the formation mechanisms of industrial heritage distribution. Finally, Multi-scale Geographically Weighted Regression (MGWR) is introduced to further examine the spatial heterogeneity and stability of influencing factors across different geographic units.
These three methodological components are logically interconnected and progressively structured: GIS analysis addresses “where the distribution occurs,” XGBoost + SHAP explains “what drives the distribution,” and MGWR supplements by identifying “whether spatially weighted relationships differ across regions.” This design enables a comprehensive analytical framework that advances from description to interpretation and from global to local perspectives, offering a robust methodological foundation for a systematic understanding of the spatial mechanisms underlying industrial heritage in China.

2. Materials and Methods

2.1. Methodological Framework

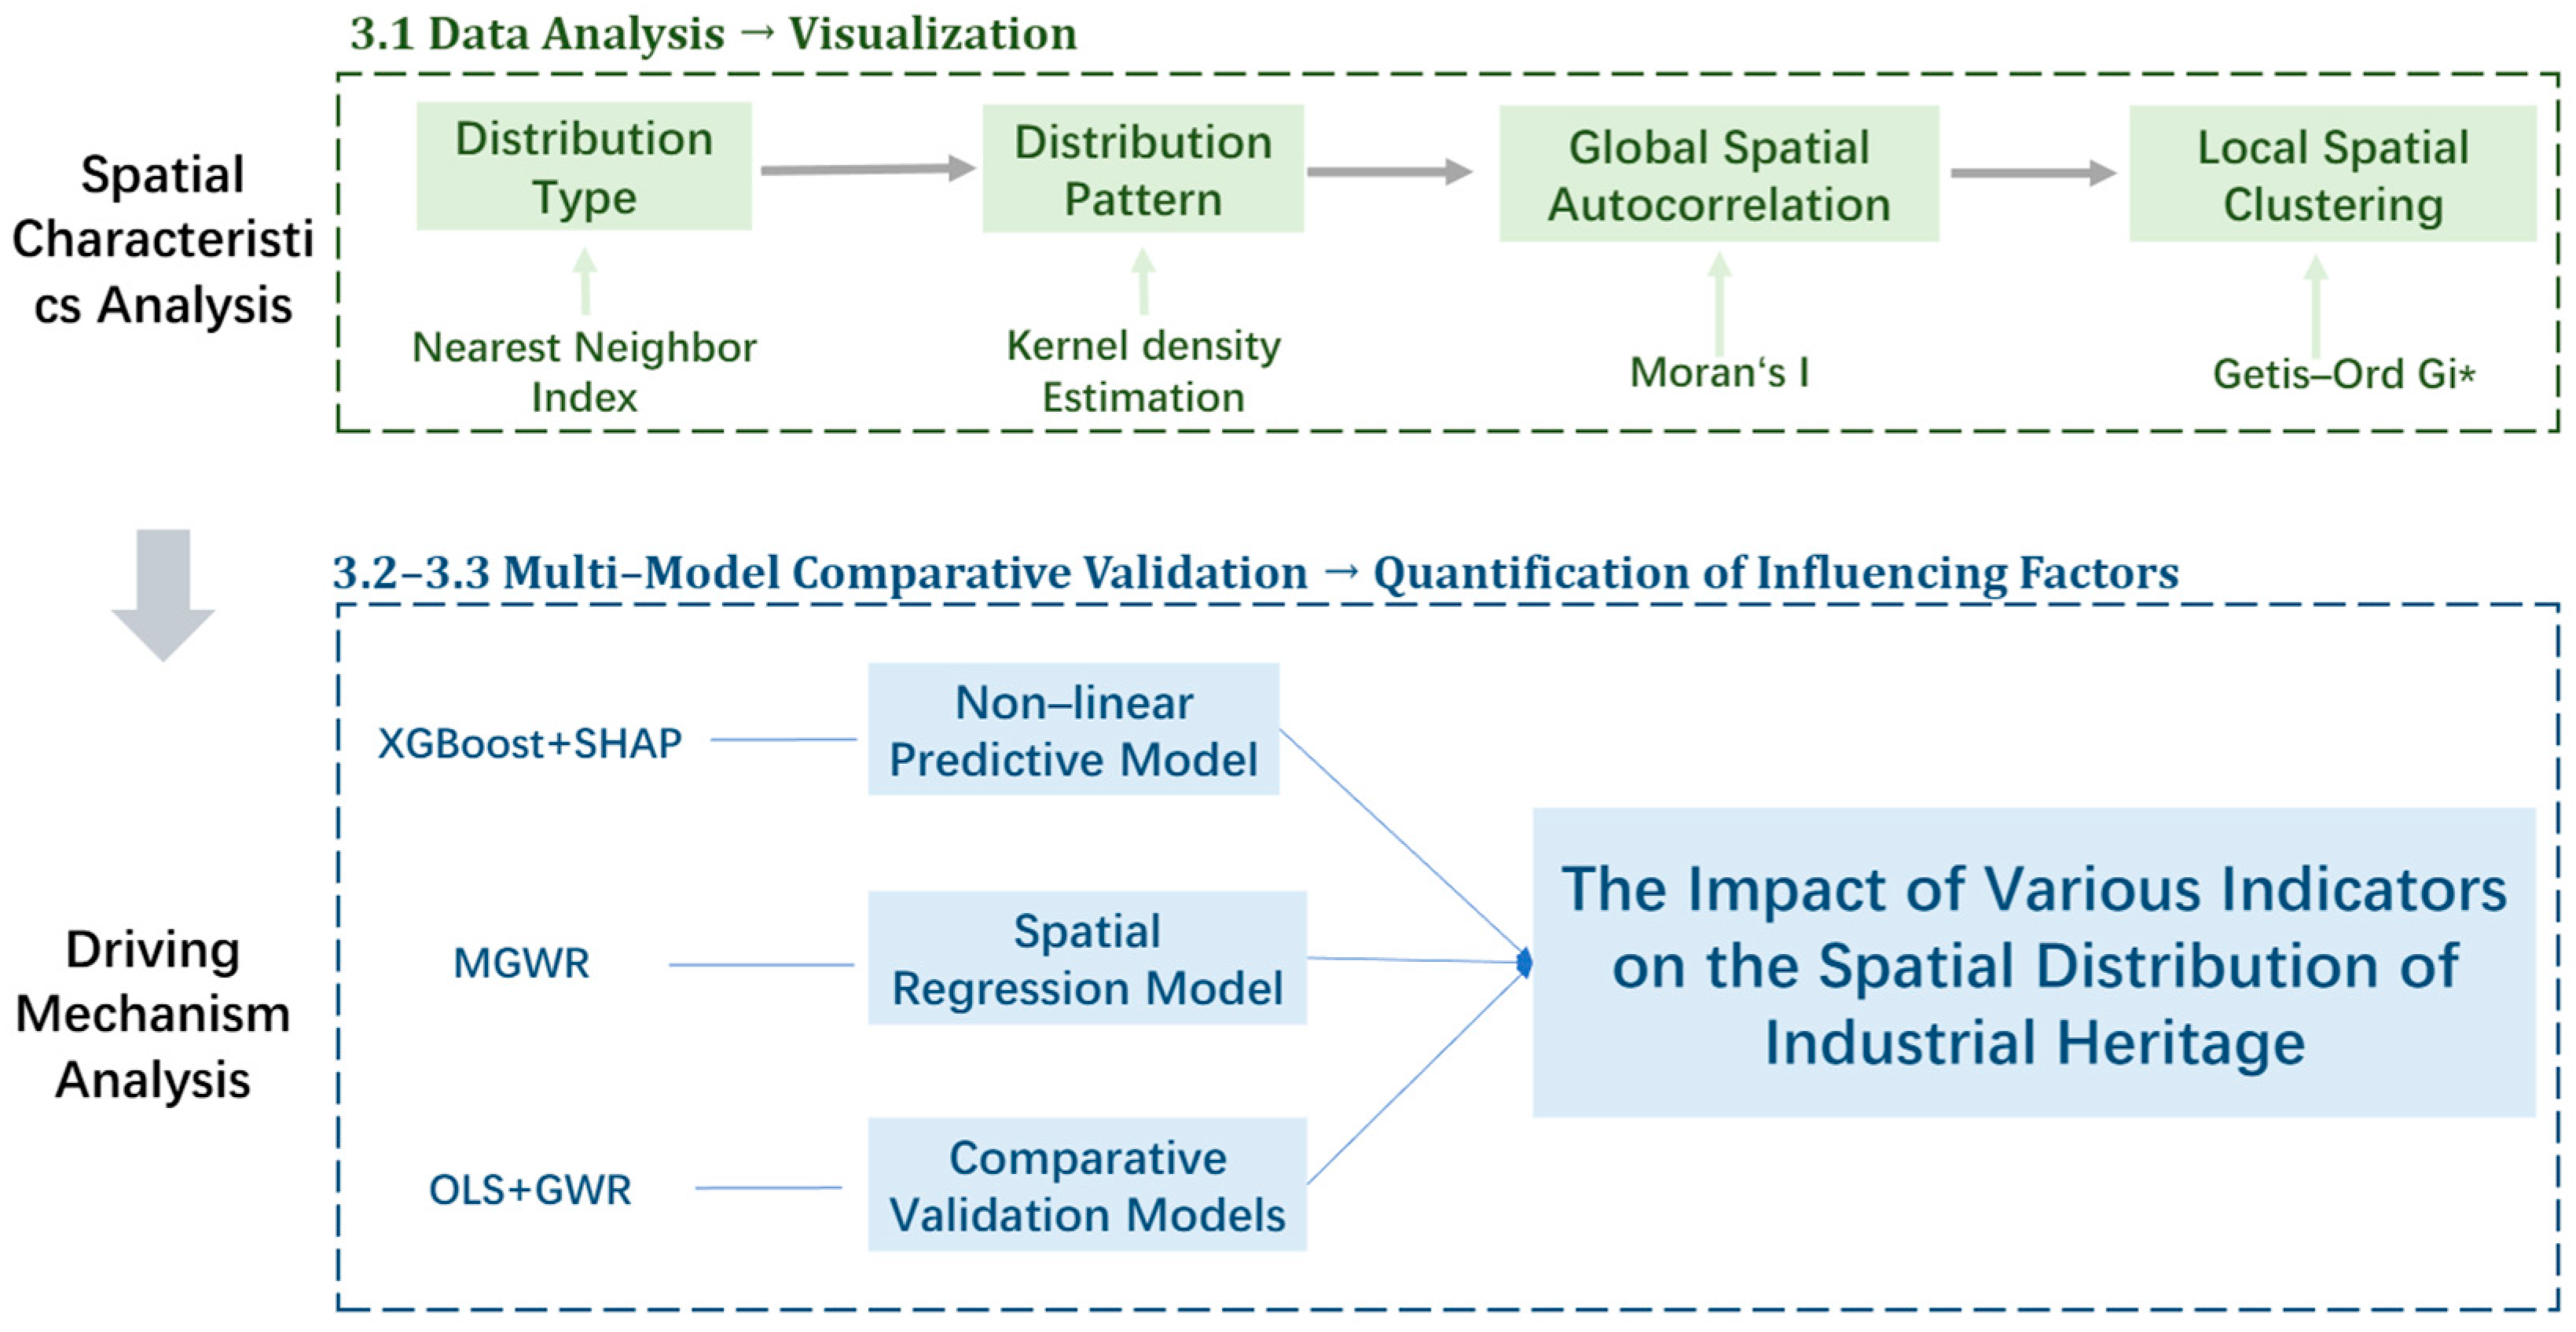
This study aims to reveal the spatial patterns and driving mechanisms of China’s industrial heritage by employing three sequential analytical approaches—spatial analysis techniques, regression models, and machine learning models. Together, these form a progressive three-stage analytical framework encompassing spatial pattern identification, driving factor extraction, and spatial effect validation. Specifically, spatial analysis techniques identify the geographical distribution characteristics of industrial heritage, addressing the question of “where it is distributed”; the machine learning model quantifies nonlinear interactions among variables, answering “to what extent each factor influences the distribution”; and the geographic regression model characterizes the spatial effects of influencing factors, supplementing the explanation of “how spatially weighted mechanisms operate.” Collectively, these components constitute a hierarchical methodological system that progresses from phenomenon to mechanism, from description to interpretation, and from the macro to the micro level—thus providing a robust methodological foundation for systematically understanding the spatial configuration and driving mechanisms of China’s industrial heritage (Figure 1).
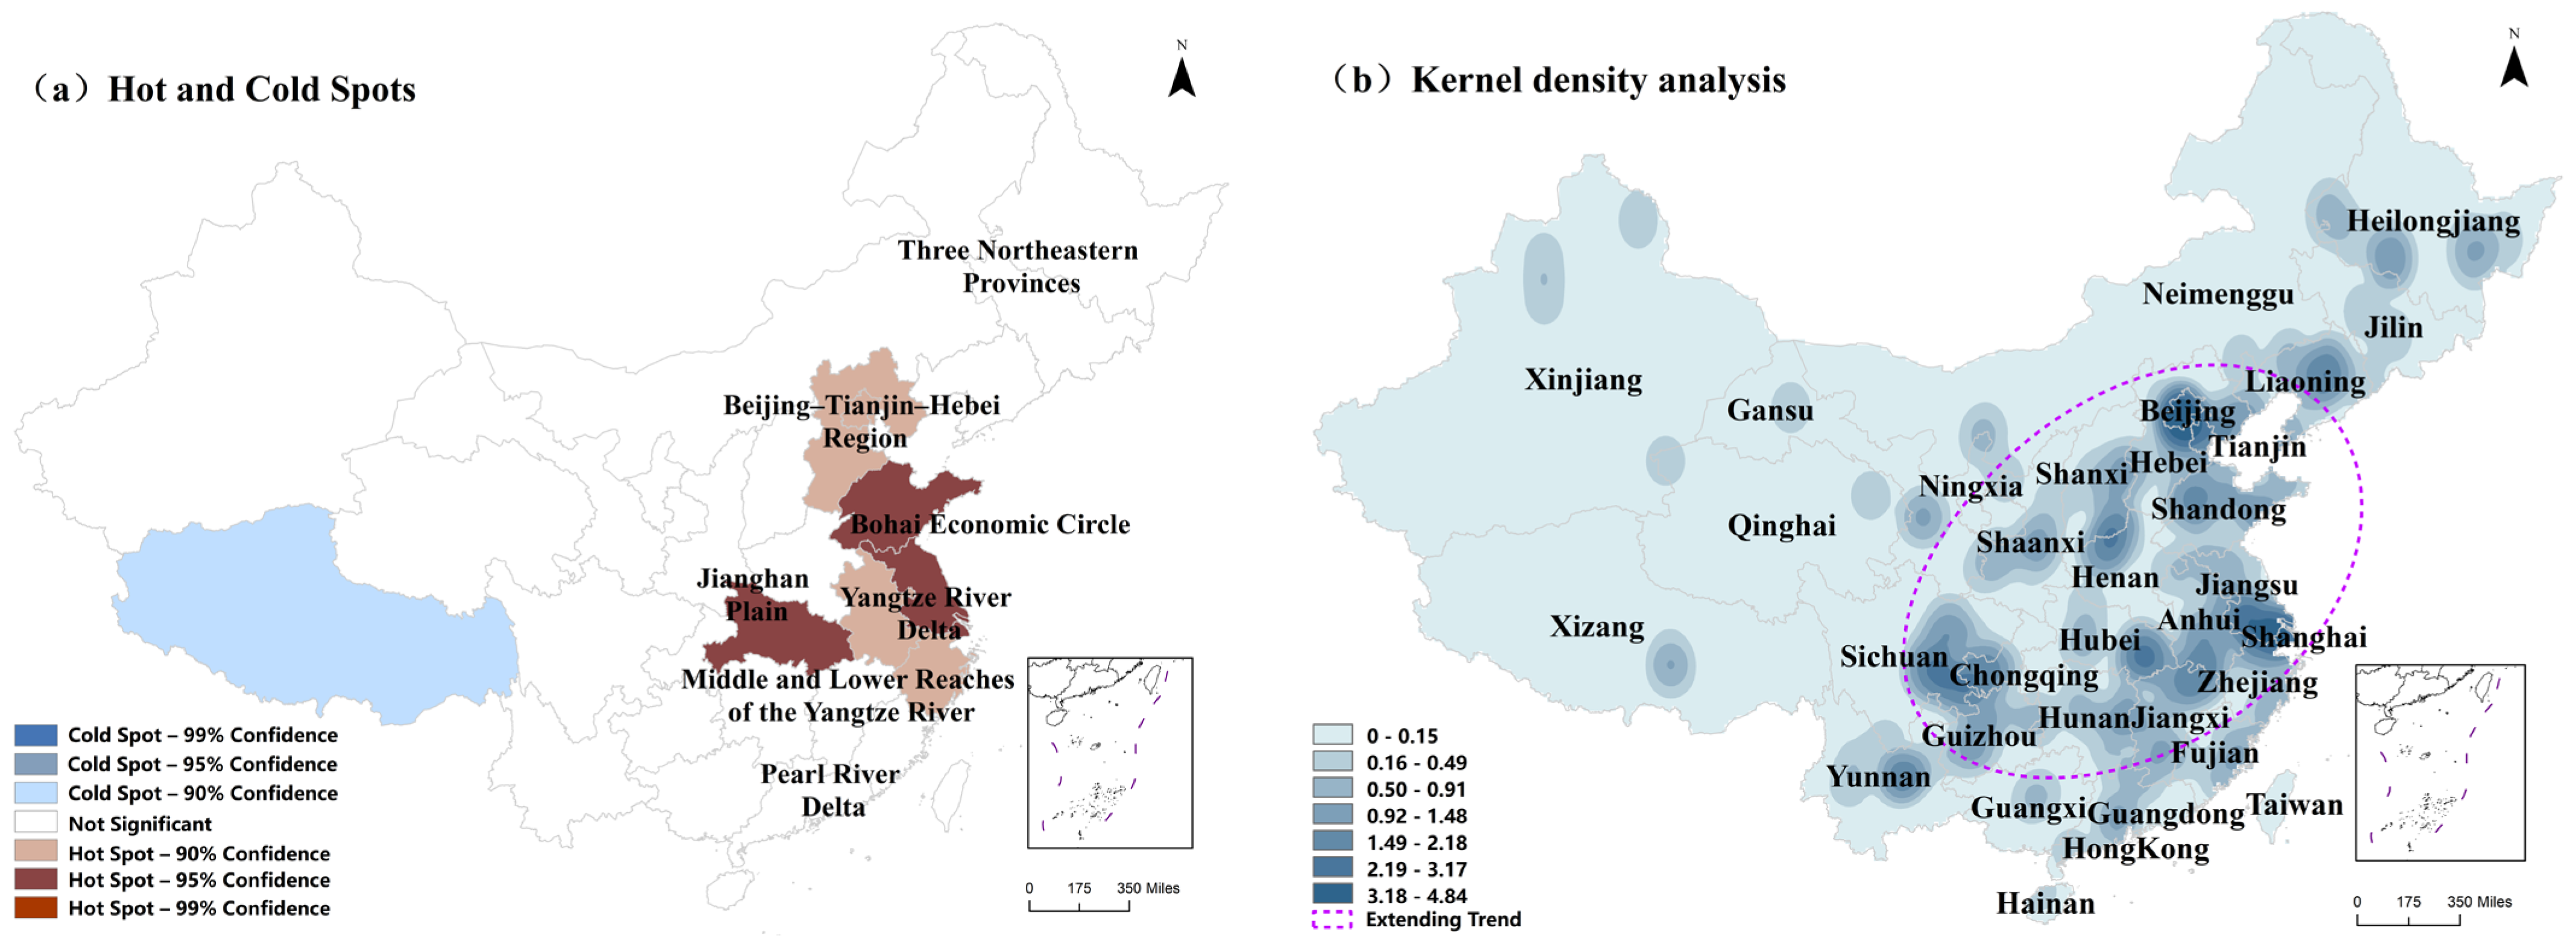
The spatial analysis component focuses on addressing the research question “Where is industrial heritage distributed, and what spatial patterns does it exhibit?” and represents a descriptive phase of the analysis. First, the Nearest Neighbor Index was applied to preliminarily examine the spatial distribution type of China’s industrial heritage, revealing that its distribution is not random. Next, Kernel Density Analysis was employed to visualize the overall distribution pattern and clustering characteristics of industrial heritage (Figure 2a), thereby revealing spatial gradients and regional disparities. Furthermore, Moran’s I was used to test whether the distribution of industrial heritage conforms to Tobler’s First Law of Geography, confirming a significant global spatial autocorrelation. To identify specific clustered regions (Figure 2b), the study further applied the Getis-Ord Gi* hotspot analysis, shifting the analytical perspective from the global to the local scale. This approach distinguishes high-value clusters (hotspots) and low-value clusters (cold spots), thereby elucidating regional variations and internal structures within the spatial associations of industrial heritage. The combination of Moran’s I and Getis-Ord Gi* constructs a global-to-local analytical pathway that not only empirically validates Tobler’s First Law but also lays a theoretical and methodological foundation for comprehensively understanding the spatial distribution patterns and subsequent analysis of driving mechanisms.
Building on this, a machine learning framework (XGBoost + SHAP) was introduced to identify and quantify the key driving factors influencing the distribution of industrial heritage. XGBoost is capable of capturing nonlinear and interaction effects from complex multidimensional data without assuming linear relationships among variables, thereby revealing the overall importance and directional influence of each factor. This component primarily addresses the question “Which factors best explain the spatial distribution and formation mechanisms of industrial heritage at the global scale?” However, while XGBoost effectively identifies variable importance, it lacks spatial interpretability. Therefore, the study further employs the Multi-Scale Geographically Weighted Regression (MGWR) model to examine the spatial heterogeneity and stability of factor effects from a spatial econometric perspective, answering the question of how each factor’s influence varies geographically in direction and magnitude.
To ensure the robustness and reliability of the model selection and results, the MGWR model is compared with two classical models—Ordinary Least Squares (OLS) and Geographically Weighted Regression (GWR)—providing complementary evidence to validate the analytical findings.

2.2. Data Sources

Data on industrial heritage were obtained from the National List of Industrial Heritage released by the Ministry of Industry and Information Technology of China. Using the Baidu Coordinate Picker, spatial coordinates were collected for a total of 242 industrial heritage sites.
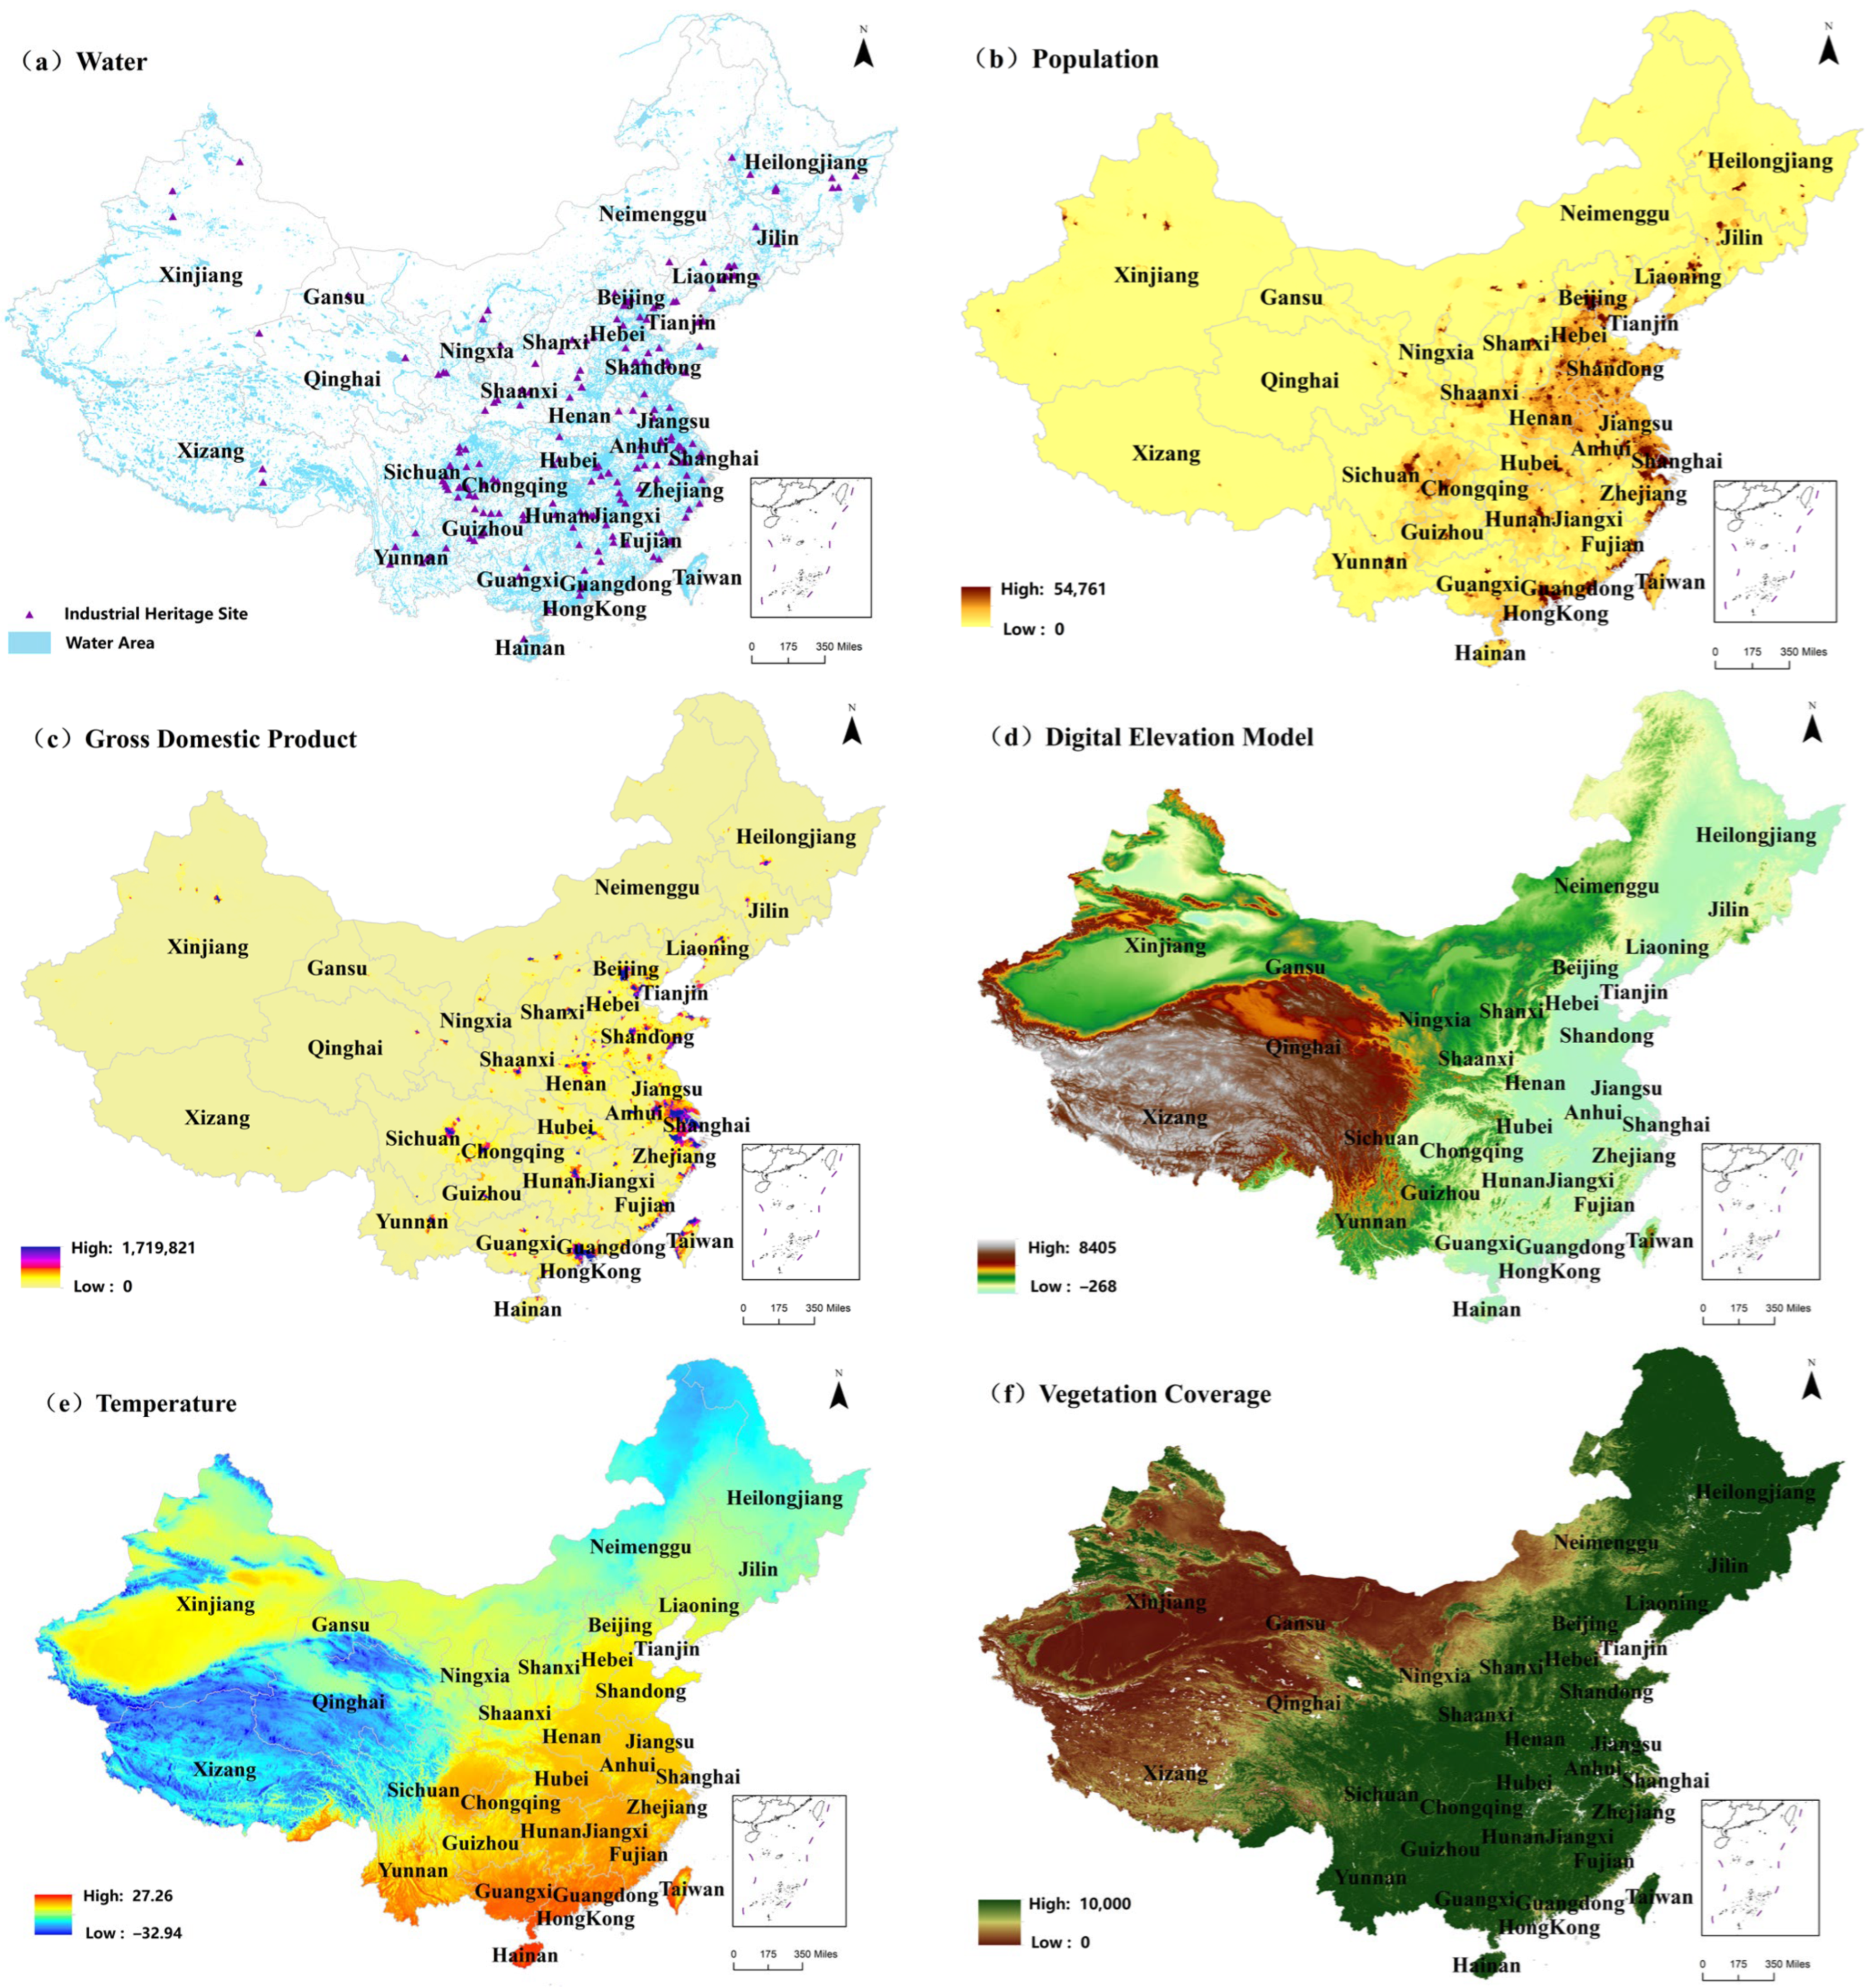
During the formation and development of heritage sites, both natural and socio-cultural factors may significantly influence the regional suitability for the preservation and continuation of industrial heritage [41]. The study assumes that socio-economic conditions represent a region’s capacity for heritage conservation investment, while natural factors such as slope and temperature embody the geographical constraints influencing the initial siting of industrial facilities. The selection of indicators is grounded in the theoretical frameworks of location theory and geographical determinism, and further informed by empirical findings widely validated in previous heritage studies [42,43]. The level of industrial development serves as a fundamental basis for the formation of industrial heritage [44,45,46,47]. According to location theory in economic geography, the initial layout and subsequent evolution of industry are jointly shaped by factors such as labor supply, market size, and industrial agglomeration effects [48]. Population size reflects labor availability, which constitutes a prerequisite for industrial development, while economic output and the number of industrial enterprises determine the degree of industrial clustering [49,50]. Hence, regions with higher levels of economic and industrial development are more likely to develop, retain, and maintain industrial heritage. Geographical determinism posits that the physical and climatic environment in which humans reside determines the conditions of human life and thus shapes the trajectory of social development. Variables such as elevation, slope, and temperature may influence the lifespan of industrial facilities, thereby affecting industrial site selection and construction [51,52]. Low-altitude, flat, and thermally moderate areas are generally more conducive to industrial construction and long-term preservation. Vegetation coverage reflects land use intensity and ecological conditions; regions with higher coverage tend to face restrictions on industrial development [53,54,55]. Given that industrial activities require substantial water input and discharge, proximity to water systems also plays a critical role in shaping industrial layouts—areas adjacent to river networks are more likely to foster industrial agglomeration [41,56,57,58].
In this study, eight indicators were selected as explanatory variables: population (POP), economic output (GDP), number of industrial enterprises (COM), elevation (ELE), slope (SLO), temperature (TEM), fractional vegetation cover (FVC), and hydrography (WAT). All data were standardized to the year 2022 to ensure temporal consistency. These indicators are available nationwide with comparable data coverage, ensuring analytical completeness and robustness. Tabular data on POP, GDP, and COM were obtained from the National Bureau of Statistics and municipal statistical yearbooks. DEM data for ELE and SLO were sourced from the OpenTopography [59]. TEM and FVC were obtained from the National Tibetan Plateau Data Center [60]. Hydrographic data (WAT) were collected from the open-source platform OpenStreetMap. Raster data for POP and GDP were retrieved from the Resource and Environmental Science Data Center. Vector data for administrative boundaries were obtained from the National Geoinformation Public Service Platform. All datasets were derived from authoritative geographic data sources and are publicly accessible to Chinese citizens.
To enhance the spatial comparability of multi-source datasets and ensure the reliability of analytical results, all variables were harmonized in terms of spatial resolution and coordinate reference system. Balancing computational efficiency and spatial detail, a spatial resolution of 1 km was adopted for the provincial-level analysis. Raster datasets were resampled and aggregated using mean values to derive provincial-level statistical characteristics (i.e., provincial averages), thereby ensuring consistency across datasets in spatial resolution, projection, and grid alignment. Furthermore, to ensure variable independence, the study conducted a multicollinearity diagnosis, including the calculation of Pearson correlation coefficients and Variance Inflation Factors (VIF). A VIF threshold of <7.5 was used, which is generally regarded as indicative of acceptable collinearity levels. The results show that, except for vegetation coverage (FVC) with a VIF ≈ 6.81 (slightly above 5), all other variables exhibit VIF values below 5, confirming that the selected indicators are statistically sound and free from problematic multicollinearity.

2.3. Methods

2.3.1. Spatial Analysis Techniques

To reveal the spatial distribution characteristics of China’s industrial heritage, multiple spatial analysis techniques within GIS were applied to 31 provinces (excluding Hong Kong, Macao, and Taiwan). These included kernel density estimation, spatial autocorrelation analysis, and hot spot analysis.
The Nearest Neighbor Index (NNI) measures the proximity of point features in geographic space to determine whether the distribution pattern is clustered, random, or dispersed [61]:
R 0 = 1 n A 2 = 1 D 2 R = R 0 / R e
where Re represents the theoretical nearest-neighbor distance, R0 is the observed mean nearest-neighbor distance, A denotes the area of the study region, and n is the number of industrial heritage sites within the study units. When R = 1, the distribution is random; when R > 1, it indicates a uniform (regular) distribution; and when R < 1, it suggests a clustered spatial pattern—the smaller the value, the higher the degree of clustering.
The Moran’s I index quantifies the strength of spatial autocorrelation among areal units. When Moran’s I > 0, it indicates positive spatial correlation, and vice versa. A Z-score greater than the critical value of 1.96 suggests statistically significant spatial clustering [62]:
Moran s   I = n i j W i j X i X ¯ X j X ¯ i j W i j X j X ¯ 2
where n denotes the number of spatial units in the study area; Xi and Xj represent the number of industrial heritage sites in regions i and j , respectively; Wij is the spatial weight matrix, with values ranging between [−1, 1]. When I > 0, it indicates positive spatial autocorrelation, and the larger the value, the stronger the autocorrelation; when I < 0, it indicates negative spatial autocorrelation.
The Getis–Ord Gi* statistic extends spatial autocorrelation analysis by identifying statistically significant high-value and low-value clusters (hot spots and cold spots) [63]:
G i * = j = 1 n W i j X j X ¯ j = 1 n W i j S n j = 1 n W i j 2 j = 1 n W i j 2 n 1
where Wij denotes the spatial weight matrix; Xj represents the number of industrial heritage sites in region j; X ¯ is the mean value of all observations; S is the standard deviation; and n is the total number of spatial units.
Kernel density estimation visualizes the variation in point density across space by calculating the density of features within a defined neighborhood and generating a smoothed surface to reveal clustering patterns [64]:
f n x = 1 n h i = 1 n k x X i h
where n is the number of samples; h denotes the bandwidth; k is the kernel function; and (XXi) represents the distance between the estimation point x and the observation point Xi.

2.3.2. Analytical Framework for Driving Mechanisms

Traditional spatial statistical models can effectively characterize spatial variation but are limited in identifying complex nonlinearities and high-order interactions. Conversely, machine learning models excel in predictive accuracy but often overlook spatial non-stationarity. When a variable exhibits both local spatial heterogeneity and a more complex nonlinear mechanism, a single analytical method often fails to capture both aspects effectively. Therefore, this study adopts a combined methodological approach integrating regression models and machine learning models to provide a more complementary and robust analysis, aiming to clearly elucidate the underlying influencing mechanisms [65,66,67].
MGWR provides spatially explicit estimates of variable effects, enabling robust statistical inference and the detection of region-specific patterns [68]. XGBoost identifies nonlinear marginal effects and complex interactions that MGWR cannot model, while SHAP values quantify the contribution of each predictor [69,70,71].
MGWR improves upon traditional regression models (e.g., OLS, GWR) by estimating variable-specific bandwidths, thus allowing each explanatory variable to operate at its own spatial scale. This capability distinguishes between globally stable effects and spatially heterogeneous ones [68,72]:
y i = b w 0 ( β 0 i ) + b w 1 ( β 1 i x 1 i ) + b w 2 ( β 2 i x 2 i ) + + b w k ( β k i x k i ) + ε i
where b w 0 , …, bwk represent the specific optimized bandwidths for each variable; β0i is the local intercept term at location i; βki is the estimated coefficient for the k-th explanatory variable at location i; xki denotes the observed value of the k-th explanatory variable at location i; and εi is the random error term at location i.
XGBoost, a gradient boosting decision tree algorithm, optimizes predictive performance, while SHAP values interpret feature contributions by computing their marginal impact on model predictions, revealing nonlinear thresholds and interactions [69]:
y ^ i = k = 1 K f k ( x i ) , f k F
XGBoost optimizes the model by minimizing a regularized loss function, where K denotes the number of weak learners; f k represents the k-th weak learner; x i is the feature vector of the i-th sample; and F denotes the functional space.
Furthermore, this study acknowledges the complexity of factor analysis and the limitations inherent in employing a single analytical method—an issue prevalent in much of the existing literature. To enhance result reliability, this study introduces two commonly used influencing factor analysis models: Ordinary Least Squares (OLS) and Geographically Weighted Regression (GWR) These models are then compared against the MGWR model to validate the findings [71,73].

3. Results

3.1. Spatial Distribution Characteristics of Industrial Heritage

Using kernel density estimation, spatial autocorrelation, and hot spot analysis in GIS, the spatial distribution characteristics of industrial heritage were visualized. In these visual representations, variations in color depth and brightness indicate changes in the intensity of the respective attributes.
The Nearest Neighbor Index (R = 0.42 < 1, p < 0.01) indicated that the average observed distance between industrial heritage sites was smaller than the theoretical expectation, suggesting a statistically significant deviation from a random spatial pattern and a pronounced tendency toward clustering. Moran’s I analysis further confirmed a significant positive spatial autocorrelation in the distribution of industrial heritage across China (Moran’s I = 0.276, Z = 2.33, p = 0.01). Local Indicators of Spatial Association (LISA) revealed that high-value clusters were predominantly concentrated in the Beijing–Tianjin–Hebei region, the Yangtze River Delta, and the Sichuan Basin (Z = 1.98, p = 0.04). Hot spot analysis (Figure 2a) showed that Tibet constitutes a cold spot, indicating an industrial heritage density significantly lower than its surrounding areas, whereas Hubei, Anhui, Zhejiang, Shanghai, Jiangsu, Shandong, Hebei, Beijing, and Tianjin are identified as hot spots. These hot spot clusters predominantly form a continuous belt along the middle and lower reaches of the Yangtze River and around the Bohai Rim region.
Kernel density estimation (Figure 2b) revealed an overall spatial gradient characterized by high density in the southeast and low density in the northwest. The central and coastal provinces constitute the primary concentration zones, with density decreasing progressively from east to west and, in the north–south direction, from the central belt toward both ends. Among all provinces, Sichuan ranks first, accounting for 8.75% of the national total, underscoring its prominent role in China’s industrialization process. Jiangxi and Shandong follow, each contributing 6.67%, while Liaoning (6.25%) and Jiangsu (5.83%) closely trail behind. Together, these provinces form the primary belt of industrial heritage concentration in China. Hubei (5.00%), along with Beijing, Hebei, and Heilongjiang (each 4.58%), represent secondary clusters of concentration. In contrast, western and peripheral provinces such as Gansu, Xinjiang, Tibet, Qinghai, Ningxia, Hainan, and Jilin all exhibit industrial heritage shares below 2%, reflecting overall low or very low density levels. Specifically, China’s six batches of nationally recognized industrial heritage form three prominent high-density core areas: (1) the Beijing–Tianjin–Hebei core (extending from Beijing and Tianjin toward Henan), (2) the Yangtze River Delta core (radiating from Shanghai into Jiangsu, Zhejiang, and Anhui), and (3) the Sichuan Basin core (centered on Chengdu and Chongqing, extending toward Guizhou, Yunnan, and the Yangtze River Delta).
At the macro-spatial scale, these high-density zones align with two major industrial development axes: (a) the eastern coastal development axis running from north to south along the coastline—“Liaoning–Beijing–Tianjin–Hebei–Yangtze River Delta–Pearl River Delta,” and (b) the inland expansion axis along the Yangtze River, stretching from the upper reaches in the Sichuan Basin, through the middle reaches in the Jianghan Plain, to the lower reaches in the Yangtze River Delta. These spatial patterns correspond closely to the “T-shaped” national spatial development model proposed by Dadao [74]. The standard deviation ellipse in Figure 2b, which is used to assess distribution trends and directional orientation, further corroborates the present northeastward extension from the central region.
Overall, the spatial configuration of industrial heritage exhibits a distinct “core–periphery” structure. Around the core areas, concentric expansion patterns are evident: the Yangtze River Delta extending toward Hubei, Hunan, and Jiangxi; the Beijing–Tianjin–Hebei region radiating toward Shandong, Shanxi, and Liaoning; and the Chengdu–Chongqing area extending toward Yunnan and Guizhou. These patterns reflect the industrial linkages and diffusion pathways between regions.

3.2. XGBoost + SHAP Analysis

After Bayesian optimization of hyperparameters, the XGBoost model achieved a root mean square error (RMSE) of 2.904 and a coefficient of determination (R2) of 0.16 on the test set, indicating that approximately 16% of the variance in the target variable could be explained by the model.
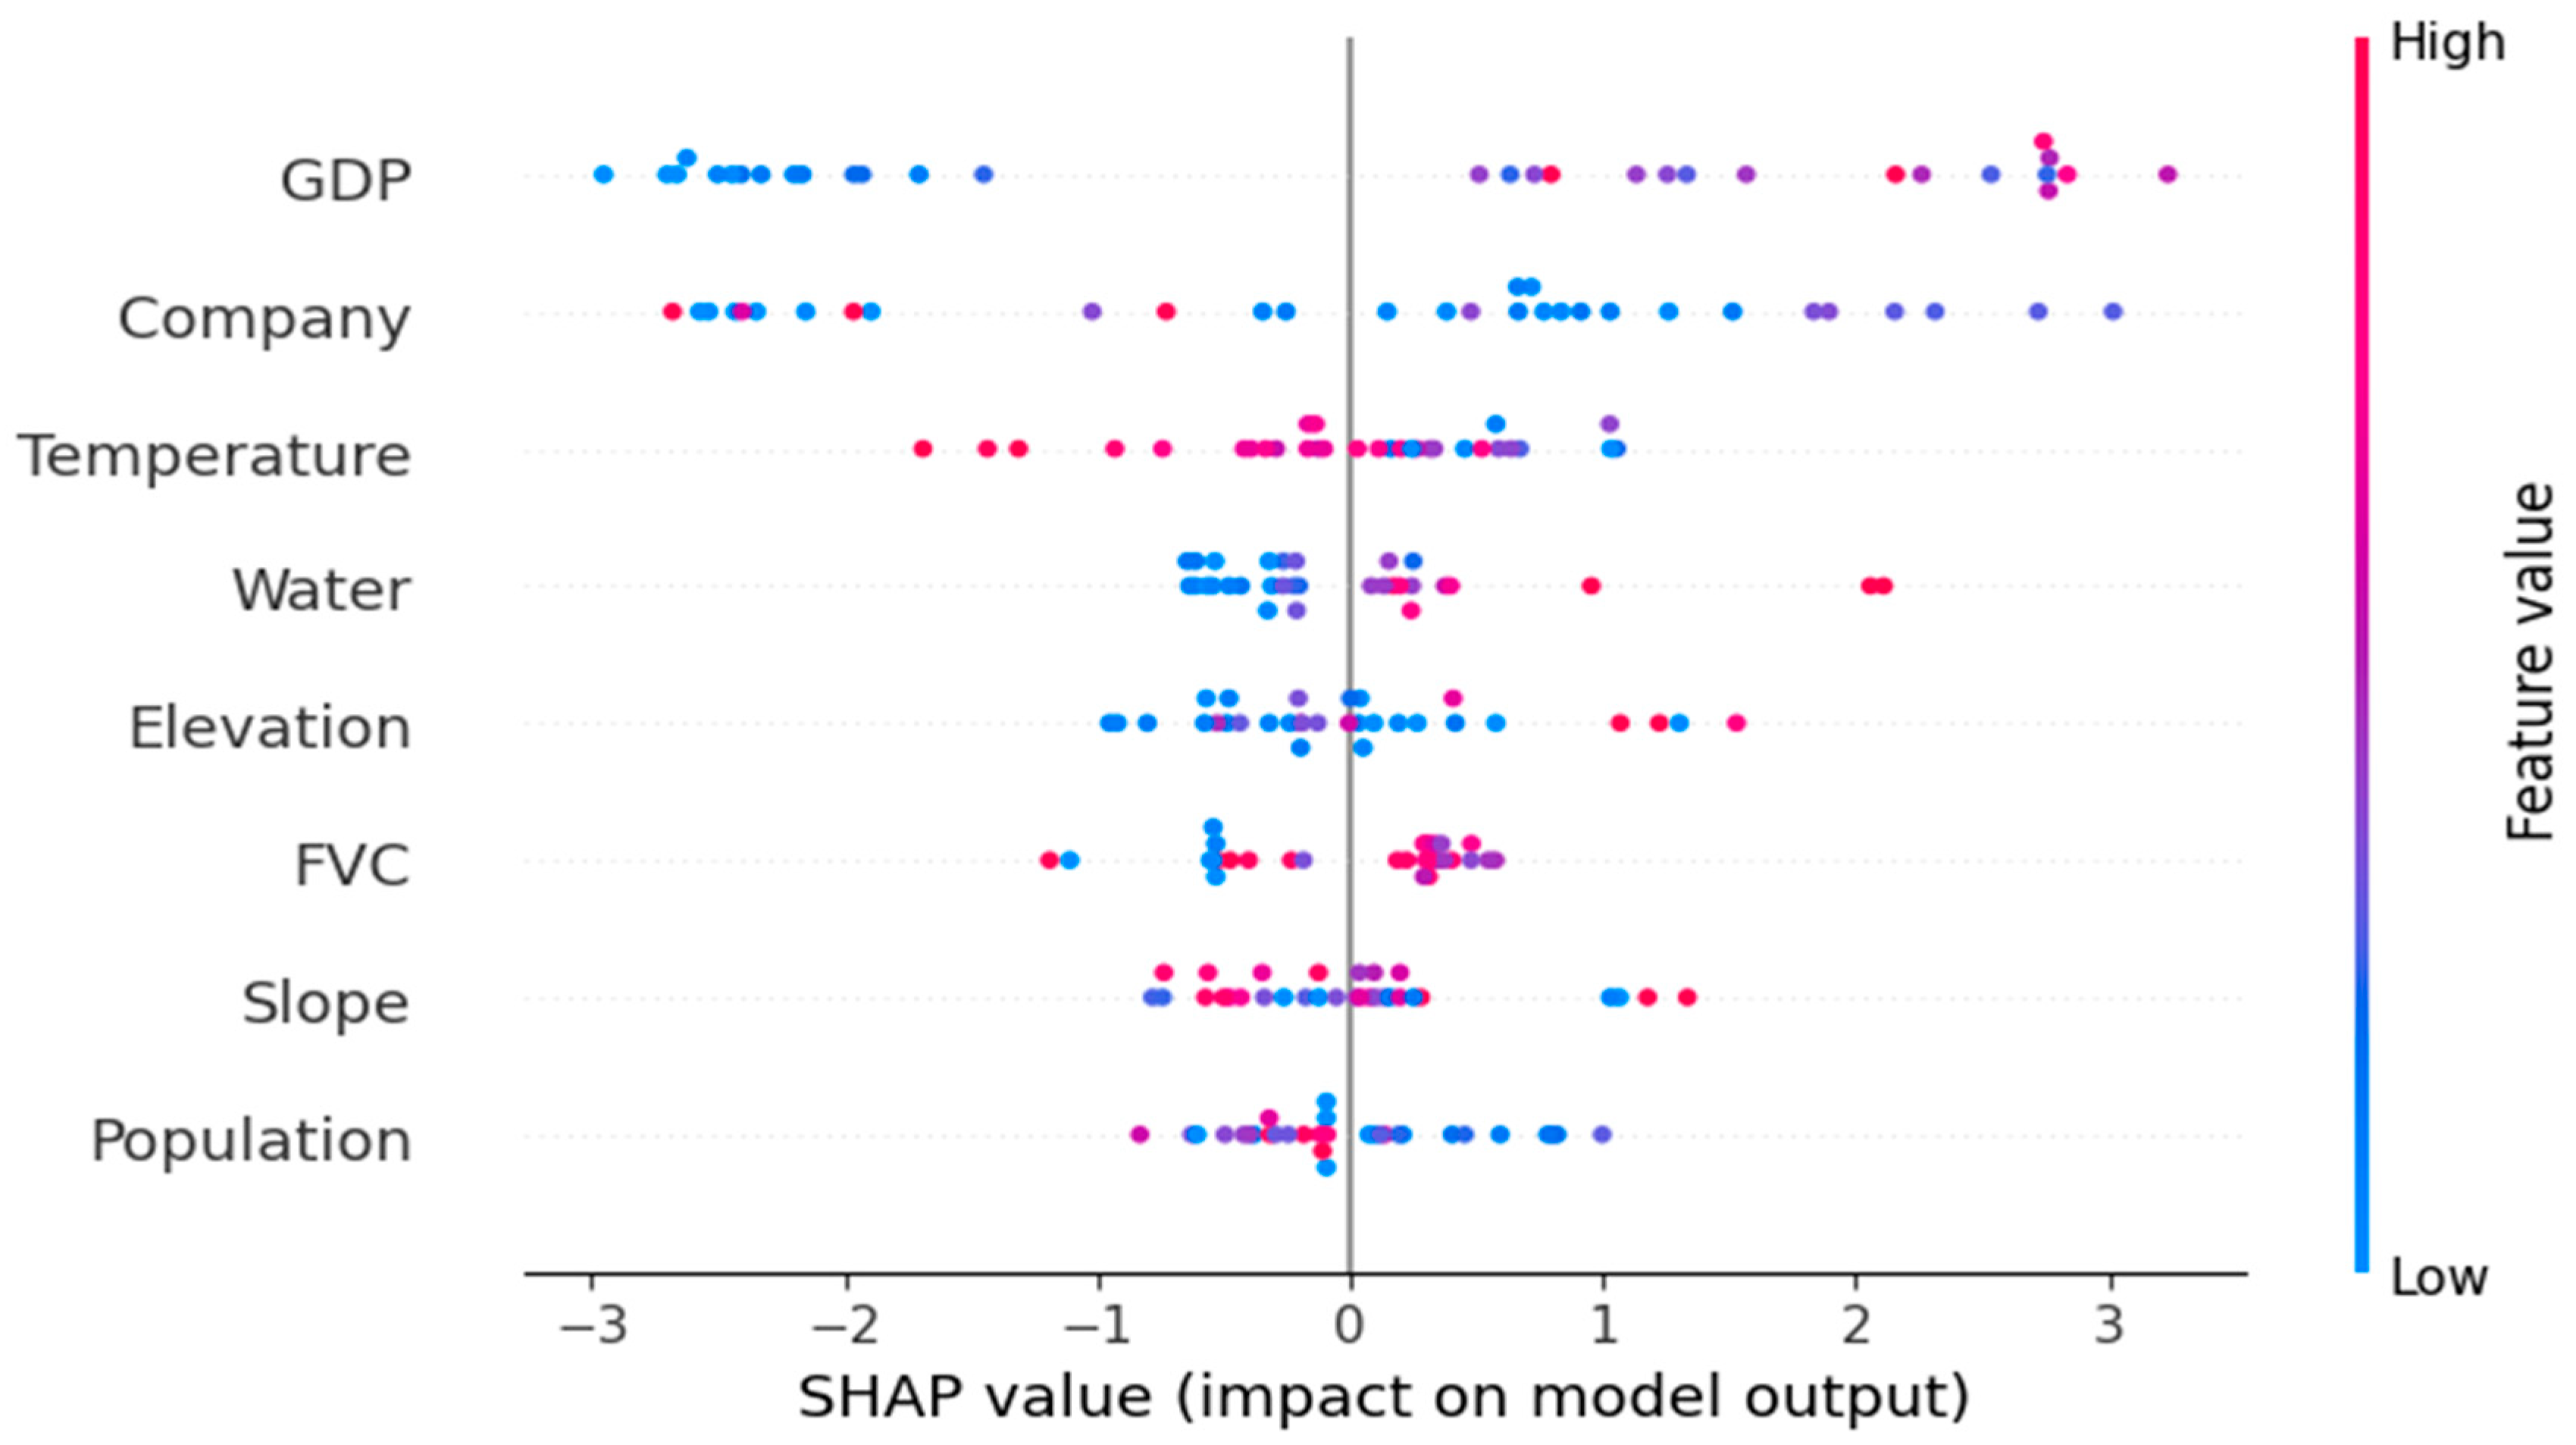
SHAP value analysis (Figure 3) revealed that GDP contributed most prominently to the model. High GDP values (red points) corresponded predominantly to positive SHAP values, indicating that economically developed regions tend to increase the predicted spatial distribution of industrial heritage. Conversely, low GDP values (blue points) were associated with negative SHAP values, corresponding to lower predicted values.
Industrial enterprise count and temperature exhibited high values (red points) in regions associated with negative SHAP values, suggesting that areas with higher industrial activity or elevated temperatures were predicted to have lower industrial heritage density. Areas with abundant water resources (red points) generally displayed positive SHAP values, indicating that water availability positively influences the model’s prediction of industrial heritage distribution.
SHAP value distributions for vegetation coverage and elevation were balanced, with both positive and negative contributions, reflecting the heterogeneous and spatially context-dependent effects of these variables within the model. Slope values showed SHAP values close to zero and a relatively uniform distribution, suggesting a minor, neutral contribution to the predictions. Population density also exhibited SHAP values clustered near zero, indicating a generally weak effect on model predictions; however, regions with low population density (blue points) were often associated with negative contributions, implying lower predicted industrial heritage presence in sparsely populated areas.
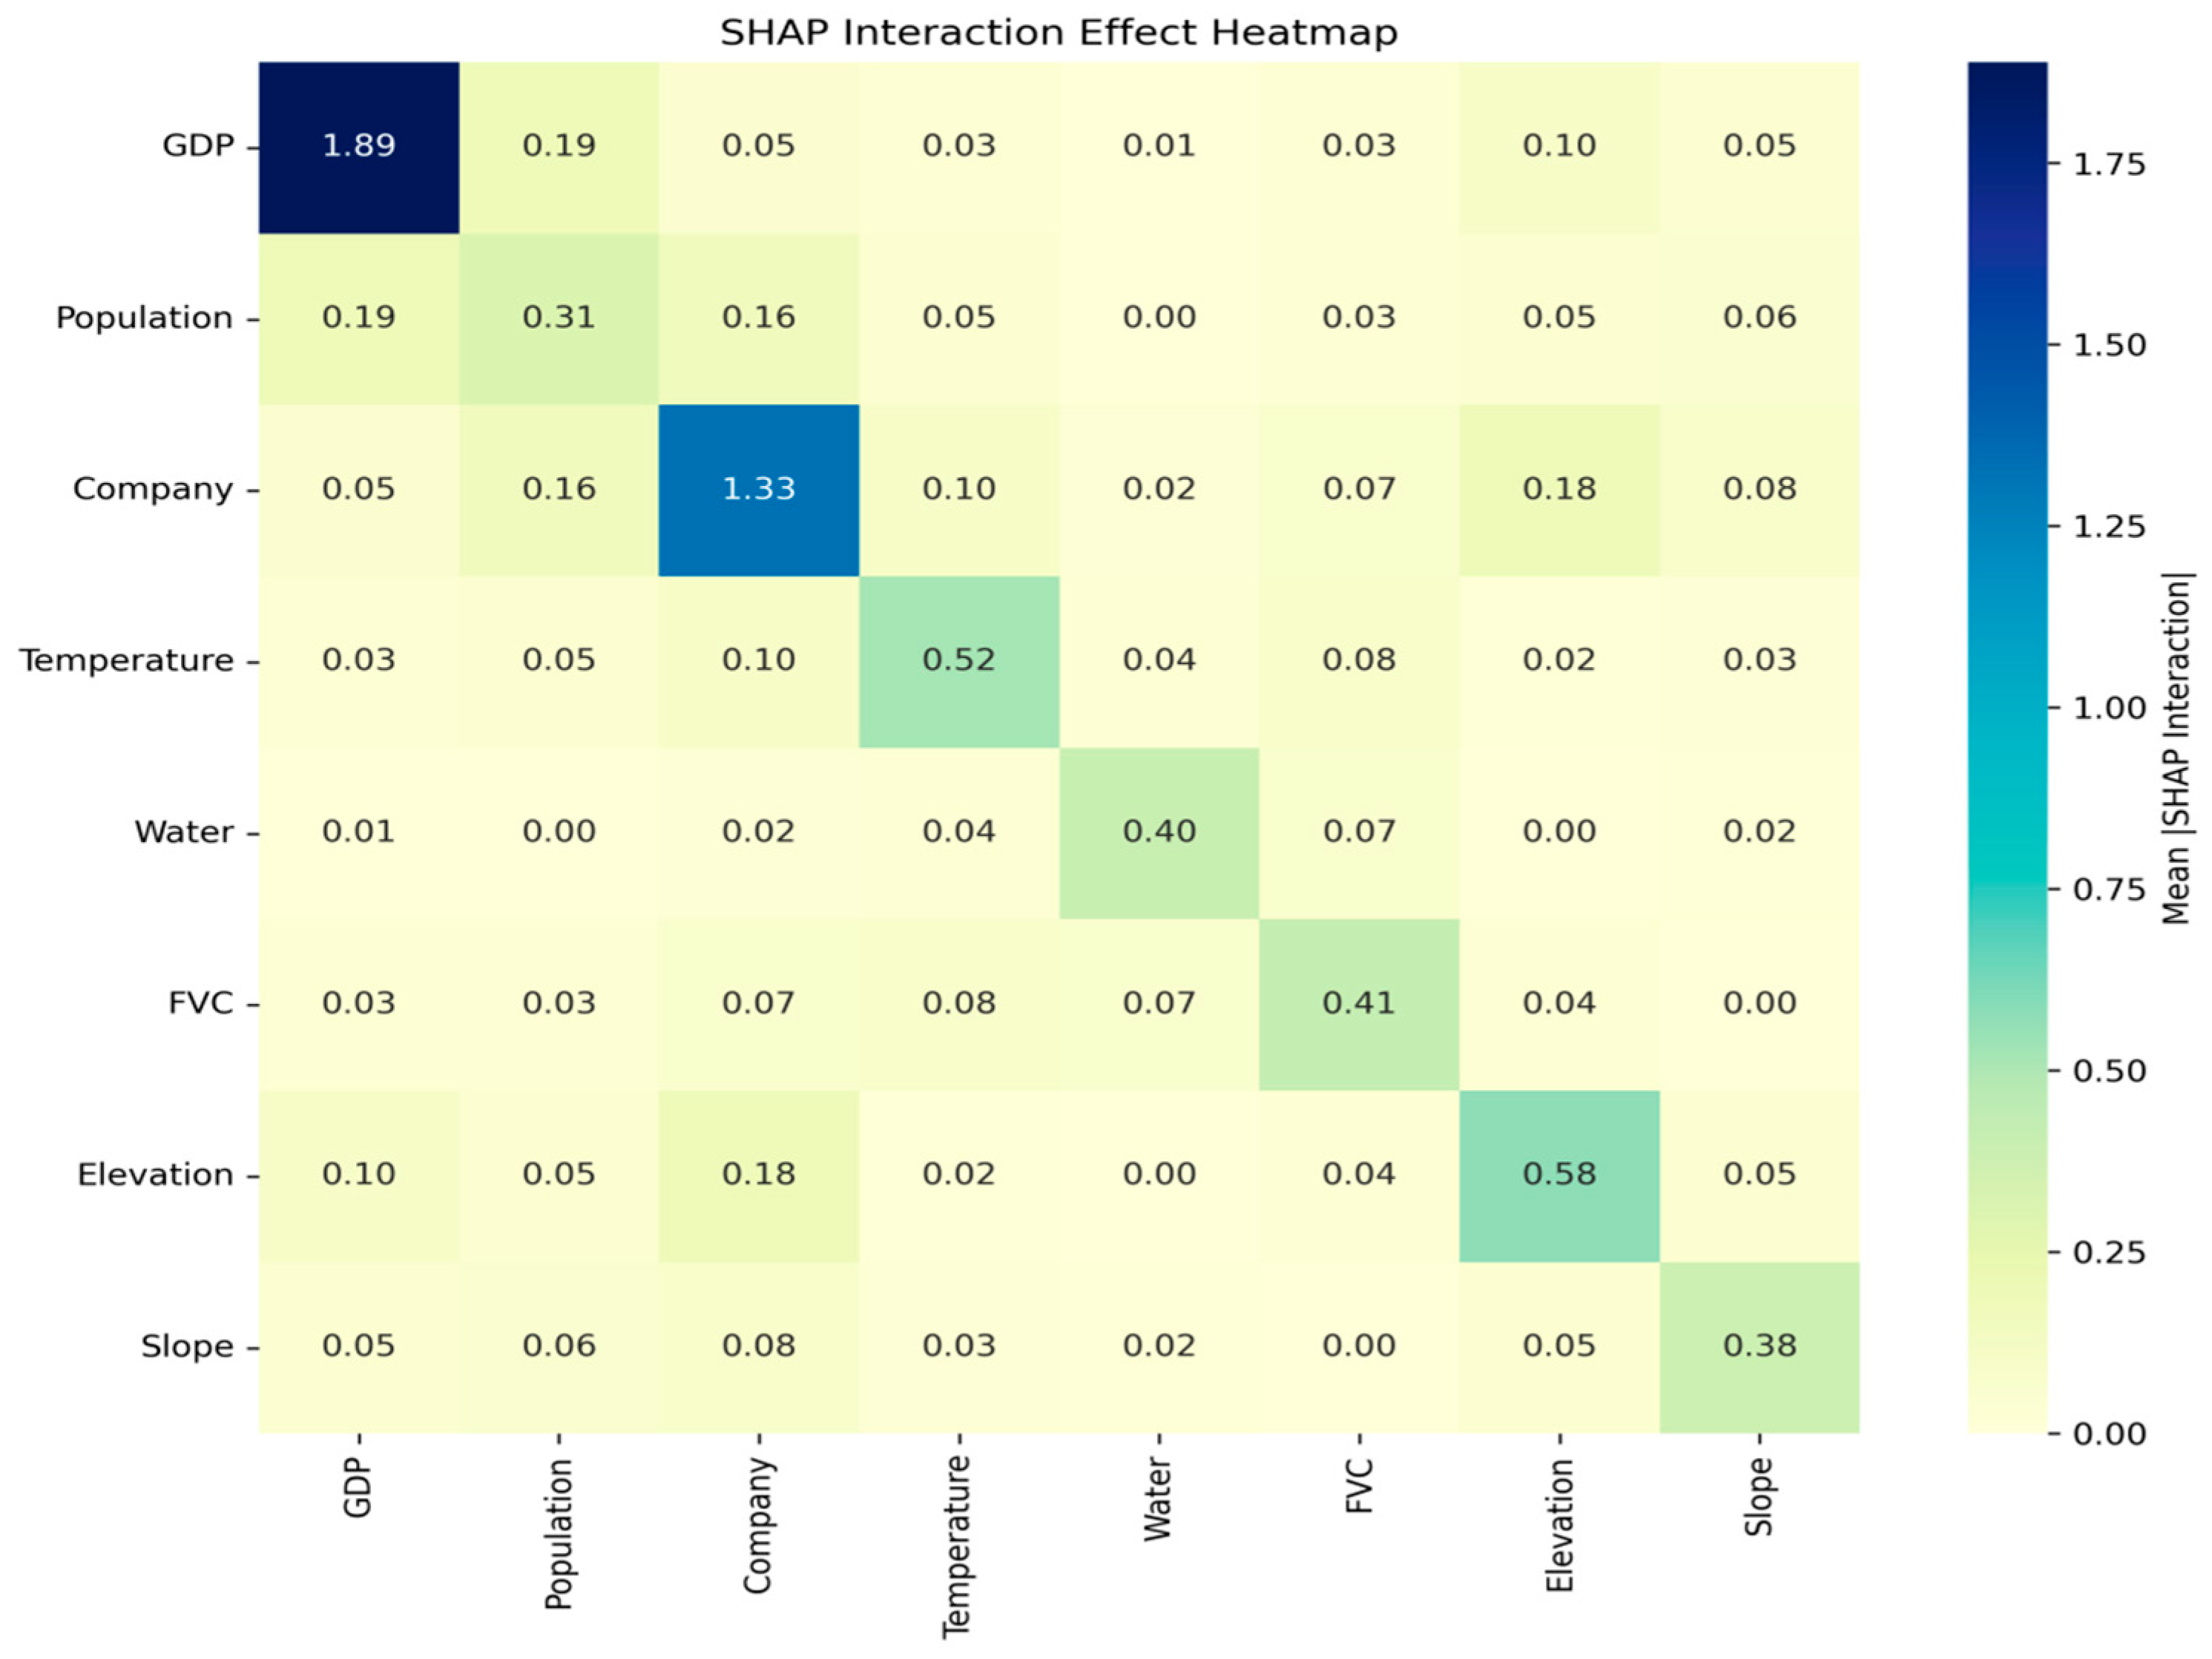
SHAP interaction analysis (Figure 4) indicated some interaction effects between GDP and both industrial enterprise count. Nevertheless, the overall interaction effects were weak, demonstrating that the model predictions were primarily driven by the main effects of individual variables.

3.3. MGWR Analysis

Multiscale Geographically Weighted Regression (MGWR) assumes that the relationships between independent variables and the dependent variable vary across space, allowing each variable to be modeled at different spatial scales (multiscale). This approach highlights spatial processes and the moderating effects of geographic context [75]. Although MGWR does not capture nonlinear interactions between variables, it provides direct interpretation of the direction and magnitude of each variable’s effect (Table 1).
The MGWR model yielded an overall R2 of 0.53 and an adjusted R2 of 0.36, indicating that the model maintains robust explanatory power after accounting for model degrees of freedom. The effective number of parameters was approximately 9, with degrees of freedom around 22, suggesting reasonable parameter estimation without severe overfitting. The Degree of Dependency (DoD) was 0.998, indicating a tightly connected spatial weight matrix conducive to capturing spatial correlation. The log-likelihood was −32.396, consistent with acceptable overall model fit. Residual sum of squares was 14.676; the AIC was 82.792, and the small-sample corrected AIC (AICc) was 95.792, reflecting an integrated assessment of model complexity and goodness-of-fit. The model converged after 11 iterations, with a stable convergence process [76].
Results indicate that all variable bandwidths were close to the global scale (~9976), DoD approached 1, and spatial standard deviations of the coefficients were generally below 0.003, with minimal differences between maximum and minimum values. This demonstrates a high degree of spatial stationarity for all predictors. In contrast to the strong spatial heterogeneity of the dependent variable, the independent variables exhibited little local variation, implying that their effects are consistent across regions and that a global GWR model could approximate the relationships between these variables and Y accurately [77].
Examining individual variables, GDP had a regression coefficient of 0.775, a standard error of 0.210, a t-value of 3.685, and a highly significant p-value (<0.001), indicating a robust positive effect of economic scale on industrial heritage, spatially uniform (bandwidth close to global, coefficient standard deviation 0.002). Population had a coefficient of 0.116, t = 0.645, p = 0.519, showing an insignificant effect on industrial heritage. Industrial enterprise count had a coefficient of −0.499, t = −2.770, p = 0.006, revealing a significant negative effect, suggesting that increased industrial activity may inhibit the preservation of industrial heritage, with spatially stable influence. Temperature had a significantly negative impact, with a coefficient of −0.915, t = −3.104, p = 0.002, indicating that elevated temperatures suppress industrial heritage distribution. Water availability, elevation, and slope exhibited relatively weak effects. Vegetation coverage showed a significant positive effect (coefficient = 0.759, t = 1.982, p = 0.047), suggesting that areas with better ecological conditions are more likely to retain industrial heritage, with strong spatial stability. Small standard deviations across all variable coefficients further confirm that spatial effects are largely consistent.
To further verify the robustness of the research results and evaluate the applicability of the model, this study tested the MGWR under different search ranges and kernel functions (such as Gaussian and bi-square kernels). The results showed minimal variation in bandwidth. In addition, both a global regression model (OLS) and a local single-scale regression model (GWR) were conducted for comparative validation [75,78].
The GWR results indicated an optimal bandwidth of 28—close to the total sample size of 31—which was consistent with the MGWR results, similarly reflecting a tendency toward global regression. The explanatory power of GWR (R2 = 0.71) was slightly higher than that of OLS (R2 = 0.52) and MGWR (R2 = 0.53). However, the Akaike Information Criterion of GWR (AICc = 221.788) was substantially higher than that of the other two models (AICc ≈ 96), suggesting a certain degree of overfitting in GWR [76].
Bandwidth selection is constrained by both sample size and spatial variability of the variables. Under conditions of a small sample size (31 observations) and large-area analytical units, choosing a bandwidth close to the “global” scale represents a statistically reasonable stabilization outcome that mitigates local overfitting while maintaining model robustness. Overall, MGWR demonstrated superior model balance and explanatory performance compared with the alternatives.

4. Discussion

4.1. Historical Evolution of the Spatial Pattern of Industrial Heritage

Building on the preceding analytical methods, this study quantitatively examined the spatial characteristics of China’s industrial heritage and the degree to which various factors influenced them. However, the spatial configuration of industrial heritage has not only been constrained by environmental and resource conditions such as temperature and topography but has also been deeply rooted in the historical trajectory of China’s modern industrial development. Therefore, based on the above findings and supplemented by historical contextual information, this section further discusses the underlying mechanisms shaping spatial patterns and the differentiated characteristics of industrial heritage development, thereby presenting a systematic account of its evolutionary process.
From a historical perspective, prior to modern times, China’s industries were dominated by light manufacturing sectors such as handicrafts, brewing, and ceramics. These industries were primarily concentrated in the middle and lower reaches of the Yangtze River Plain, where natural conditions were favorable, water resources abundant, and land fertile. During this period, industrial activities remained embedded within the agrarian system, serving the cycles of production, livelihood, and consumption under the traditional agricultural civilization. While demonstrating certain regional continuity, these industries did not exhibit large-scale spatial agglomeration [79]. Following the Opium War, however, the influx of foreign capital, the Self-Strengthening Movement, and the rise of national capitalism collectively propelled the early modernization of China’s industrial system. Port cities such as Shanghai, Tianjin, Qingdao, and Fuzhou, supported by foreign investment, maritime trade, and tariff privileges, emerged as core clusters of modern manufacturing and transportation industries. Meanwhile, inland regions such as Hunan and Shanxi began to develop early forms of heavy industry through the exploitation of coal, iron, and tin resources [22]. During the outbreak of the Anti-Japanese War, coastal areas suffered severe destruction, prompting the westward relocation of many enterprises to cities such as Chongqing, Guiyang, and Kunming [80].
After the founding of the People’s Republic of China, in response to the demands of a new phase of industrialization, the government formulated a series of national development plans. China’s industrial development entered a period of state-led strategic expansion. During the First and Second Five-Year Plan periods (1953–1962), the old industrial bases in Northeast China (Shenyang, Anshan, Changchun) and the central industrial corridor (Wuhan, Luoyang, Changsha) became the primary zones for constructing national systems of heavy industries, including energy, metallurgy, machinery, and chemicals. The spatial pattern of industrial heritage from this period was characterized by a concentrated, corridor-like distribution along railway lines, forming a typical “corridor–node” structure anchored by coal-iron transport and river-port hubs.
In 1964, during the Third Front Construction, China underwent a strategic reorganization of industrial spatial layout in response to the Sino-Soviet split and heightened border tensions. The vulnerabilities of an excessively coastal and port-centered industrial distribution—efficient but exposed to potential foreign military strikes—became apparent. Consequently, the Chinese government initiated a large-scale inland relocation of defense, scientific, industrial, and transportation resources, advancing toward the “Third Front regions” (including Sichuan, Guizhou, Qinghai, Shaanxi, Yunnan, and parts of Gansu, Shanxi, Ningxia, northern Guangxi, and northern Guangdong). The spatial logic of this period reflected a “mountain-based, dispersed, and concealed” geographical strategy: industrial sites were commonly located along mountain valleys, leveraging terrain barriers and transportation corridors to form relatively enclosed and secure systems. Site selection was guided primarily by considerations of topographic security and defense capacity rather than economic accessibility or regional diffusion potential [81,82].
Following the Third Front Construction period (after 1964), industrial cities such as Panzhihua, Liupanshui, Lanzhou, and Zunyi emerged across China’s central and western regions, becoming key nodes supporting national defense, energy, machinery, and chemical industries. During this time, China established an “inland industrial arc” spanning the Southwest (Sichuan, Guizhou, Yunnan) and Northwest (Shaanxi, Gansu, Ningxia, Qinghai) regions. This “invisible expansion” of industrial space not only created a strategically secure hinterland during the Cold War but also structurally rebalanced China’s industrial geography in the long term: central transportation hubs and manufacturing corridors facilitated the east–west extension of technology and capital. Meanwhile, the eastern coastal region underwent a major transformation and upgrading during the reform and opening-up period, shifting from heavy industries to light manufacturing and service-oriented sectors [83,84].
Energy-centered industries—such as the Anyuan coal mine, Xiangtan manganese mine, and Liuzhi mining area—were distributed in a clustered pattern within inland mountains and basins, constrained by geological and geomorphological conditions. These formed small-scale spatial aggregations that appeared as localized, resource-driven hotspots on maps rather than continuous industrial corridors. In contrast, the spatial organization of military and strategic manufacturing industries was shaped by concealment and dispersal strategies. Their locations were determined primarily by considerations of national security and topographical constraints, resulting in dispersed yet functionally complementary clusters across inland regions such as Chengdu–Chongqing and Hubei [85,86].
In summary, the spatial heterogeneity of China’s industrial heritage is not a superficial reflection of differences in quantity or density but a geographical manifestation of layered historical processes. It embodies the spatial reconfiguration and functional transformation of industrial types across different historical periods and strategic objectives. The spatial heterogeneity of industrial heritage at each stage reflects not only the evolution of production modes but also the interplay among market demands, state policies, and geographical constraints.
By retracing the evolution of China’s industrial spatial structure across historical phases, this study supplements and refines the quantitative indicator analysis with a qualitative historical perspective. Unlike previous studies that merely depicted spatial patterns, this research not only identifies where industrial heritage clusters occur but also explains why such configurations emerged in specific periods and regions. Through integrating historical narrative with spatial analysis, the study establishes a comprehensive explanatory framework that combines temporal and spatial, as well as quantitative and qualitative, dimensions—offering critical insights for understanding the zoning, value assessment, and adaptive reuse of China’s industrial heritage.

4.2. Multi-Model Analysis of Influencing Factors

Through the combined application of XGBoost and MGWR, this study jointly identified the key factors and mechanisms shaping the spatial distribution of industrial heritage in China. Compared with conventional analyses of influencing factors, this research not only verified the significant effects of individual variables but also clarified their multi-scale spatial heterogeneity and nonlinear interactive effects.
A comparison of the XGBoost + SHAP and MGWR results revealed notable discrepancies for certain variables, particularly vegetation coverage (FVC). The XGBoost model indicated that FVC had a relatively low importance in explaining industrial heritage distribution, whereas the MGWR model detected a significant local influence. XGBoost + SHAP, based on a nonlinear tree ensemble, captures the overall average trends and the direction of influence (positive or negative), while MGWR identifies localized spatial patterns—such as the preference of large-scale mining or factory-type heritage sites for areas with low vegetation coverage. This divergence underscores the methodological complementarity between machine learning and spatial regression models: the former emphasizes global importance, whereas the latter reveals geographically contingent sensitivities. The integration of both models thus provides a dual perspective of “trend interpretation” and “spatial diagnosis,” aligning with the comprehensive explanatory needs of complex geographical phenomena [87,88]. Importantly, both models yielded consistent conclusions regarding the main variables.
The positive contribution of GDP in the XGBoost model aligns with the significant positive coefficient in MGWR, while the negative contributions of temperature and the number of industrial enterprises are consistent with the significant negative coefficients in MGWR. This confirms the key roles of economic scale, industrial scale, and climate factors under both spatial regression (causal inference) and machine learning (predictive inference) paradigms, consistent with the conclusions drawn by Zhang et al. (2023) using geographic detectors, thus demonstrating the robustness and reliability of these findings [89].
Distinct from the conventional view that “development promotes preservation,” this study identified a negative relationship between the number of industrial enterprises and the presence of industrial heritage. Traditional perspectives suggest that continued industrial growth supports heritage preservation through economic and technological linkages. However, our findings, consistent with recent urban renewal research, highlight the replacement pressure exerted by new forms of industry—characterized by high profitability and low land intensity—on traditional industrial heritage [90,91,92]. This reveals a structural contradiction between development and preservation in the context of China’s rapid urban transformation, providing important supplementary evidence to the main driving factors identified by Zhang et al. using the Geodetector method [79].
It is noteworthy that, in contrast to the strong spatial heterogeneity of the dependent variable, MGWR results showed high spatial stationarity for most independent variables, with no pronounced local variations. This indicates that each variable exerts a relatively uniform influence across regions. Given that MGWR bandwidth selection is constrained by both sample size and spatial variability, the model’s near-global bandwidth under the conditions of a small sample size (31 units) and large spatial units represents a statistically sound stabilization measure, balancing model robustness and avoiding local overfitting [73].
The nonlinear interaction analysis (Figure 4) revealed that interactions among influencing factors did not substantially enhance explanatory power. Only combinations such as GDP–Population (0.19), Company–Population (0.16), and Company–Elevation (0.18) exhibited noticeably higher interaction values than others. This suggests a synergistic and mutually reinforcing relationship among economic development, industrial structure, and population concentration, consistent with a well-established principle in economic geography: industrial agglomeration and economic scale expansion depend on market demand and labor supply generated by population clustering [93,94].
However, the overall weak interactive effects likely result from the shared spatial gradients between influencing variables and the outcome variable (Figure 5). As a greedy algorithm optimized for the best split, XGBoost tends to prioritize variables providing independent explanatory strength when joint effects add little new information. In contexts with strong spatial autocorrelation and collinearity, joint high values of two variables (e.g., “A high + B high”) rarely yield more explanatory insight than their independent main effects combined. The model thus optimizes overall fitting efficiency by assigning weights to additive, dominant effects rather than compound interactions [75].
These findings imply that the spatial configuration of China’s industrial heritage is shaped less by short-term variable interactions and more by long-term structural mechanisms. When economic, industrial, and demographic factors exhibit coherent spatial gradients, they reflect a persistent evolutionary logic—one rooted in enduring environmental endowments, policy orientations, and strategic objectives [57,58,95]. This reinforces the historical explanations discussed earlier and highlights the need to move beyond a reliance on single or linear interaction relationships. Methodologically, it offers guidance for future research that integrates multi-scale and multi-temporal analytical perspectives to more comprehensively explain the formation and evolution of industrial heritage spatial patterns.

4.3. Practical Implications

Compared with previous studies, this research explicitly reveals that the pronounced negative impact of temperature highlights potential risks associated with industrial heritage deterioration under high-temperature environments and may limit the survival and development of certain industrial types [96]. This finding underscores the necessity of integrating climate considerations into heritage conservation practices, including adaptive protection strategies such as improved preservation materials and enhanced environmental monitoring and response mechanisms. Positive effects of vegetation coverage and slope orientation emphasize the supportive role of natural environmental conditions for industrial heritage distribution, indicating that heritage conservation should be incorporated into broader ecological governance frameworks, promoting green protection concepts [97,98,99,100].
Contrary to the intuitive expectation that industrial development facilitates heritage preservation, the negative influence of the number of industrial enterprises suggests that rapid industrial expansion may exert pressure on heritage survival. Under urban renewal and technological upgrading, existing heritage spaces are prone to replacement by new industrial or urban functions, diminishing the visibility and perceived value of traditional industrial forms. This finding suggests that the protection and regeneration of industrial heritage should not rely solely on the logic of economic growth. Instead, its cultural and social value should be explicitly integrated into spatial planning and industrial policies to achieve institutional coordination between heritage preservation and industrial transformation. Consequently, regions with rapid industrial expansion and insufficient governance should prioritize heritage early-warning systems and protective zoning to prevent irreversible loss, while regions with strong governance could explore co-existence models between heritage and modern industries to achieve a win-win outcome for conservation and economic development [101].
Overall, as a dual entity that embodies both historical memory and an asset for urban innovation, industrial heritage development must first respect the spatial heterogeneity of its material and social attributes, taking into account the distinct core characteristics of different regions [11]. For instance, the “industrial-decline type” regions in Northeast China were shaped by national strategic initiatives that promoted the formation of large-scale heavy industrial clusters. These regions are characterized by strong materiality, large factory complexes with complete technological systems, and a pronounced sense of production memory and local identity. At the same time, they exhibit social attributes such as population aging, fragile employment structures, and low market absorption capacity. In contrast, the industrial development of the Guangdong–Hong Kong–Macao Greater Bay Area was largely driven by market liberalization and foreign investment, forming a high-density, urban-embedded network of smaller, flexible factory structures. These are more adaptable for rapid functional reconstruction and integration into creative industries and high-tech service ecosystems. The strategic approaches required for these two regional types therefore differ significantly.
For newly developing industrial regions (e.g., the Greater Bay Area), where population inflows, capital dynamism, and innovation resources are concentrated, a “form-preserving adaptive reuse” strategy is more suitable—retaining external spatial textures and representative components while allowing for high internal functional restructuring to promote industrial innovation and urban renewal. In contrast, for old industrial regions with limited economic vitality (e.g., Northeast China), priority should be given to preserving authenticity, documenting technical systems, and restoring archival records, alongside initiating community regeneration and skill transfer programs. In the short term, employment can be revitalized through industrial museums and cultural tourism, while in the long term, industrial upgrading can be achieved through the introduction of compatible industries such as new energy, circular economy, and industrial internet technologies [102,103].
At the same time, this calls for relevant administrative authorities to develop refined diagnostic tools, differentiated policies, and quantifiable monitoring systems tailored to regional contexts. These mechanisms would provide institutionalized pathways and evaluative foundations for achieving functional reconstruction and sustainable balance in the role of industrial heritage within regional development. Based on the preceding analyses, this study recommends the establishment of quantifiable classification systems grounded in operational criteria—such as urban renewal intensity, heritage scale, industrial iteration intensity, maintenance difficulty, heritage attractiveness, cultural memory strength, and policy support level—to guide differentiated policy instruments [104,105].
For “industrial-decline type” regions, priority should be given to allocating restoration funds, establishing non-substitutable protection lists, and implementing community-centered employment regeneration and skill certification programs. For “emergent-development type” regions, tax and land-use incentives should be provided, along with the guidance of industrial funds and academic resources toward participation, and the formulation of adaptive reuse standards to prevent the erosion of cultural symbols [106].
In terms of governance, an indicator-based, multi-stakeholder monitoring and evaluation platform should be established to balance heritage integrity, social benefits, and economic absorption capacity. Central funding, local planning, academia, and enterprises should be incorporated into an integrated assessment and decision-making framework, with phased pilot mechanisms employed to test the effectiveness of proposed pathways. Monitoring indicators should encompass short-term (restoration level, spatial coverage, visitor satisfaction), medium-term (heritage utilization conversion rate, related industrial growth rate), and long-term (cultural identity, maintenance, and development) dimensions to ensure a dynamic balance between heritage preservation and revitalization [107].

5. Conclusions

5.1. Core Findings

At the macro-spatial scale, this study systematically revealed the spatial patterns and driving mechanisms of industrial heritage in China. Overall, industrial heritage exhibits a southeast-dense and northwest-sparse gradient. The central and coastal regions constitute core concentration zones, with density decreasing from east to west and attenuating toward northern and southern margins. Along the coastline, these areas form a “Liaoning–Beijing–Tianjin–Yangtze River Delta–Chengdu–Chongqing” development axis.
The influence analysis indicates that economic development and population density are the primary positive driving factors, suggesting that market size and labor base remain fundamental to the formation of industrial heritage. Temperature and the number of industrial enterprises exhibit significant negative effects, implying that high temperatures and the expansion of modern industries may exert pressure on the preservation of industrial heritage. Natural conditions such as slope and vegetation coverage play an auxiliary but positive role in maintaining ecological suitability and supporting heritage conservation. The MGWR results show a high degree of spatial stationarity for most variables, while the XGBoost + SHAP model reveals nonlinear factor contributions. Together, these findings suggest that the industrial heritage pattern is mainly driven by long-term structural mechanisms rather than short-term interactions.
The temporal analysis reveals a clear east–west migration trajectory of China’s industrial heritage, evolving from coastal to central and then western regions. The “Third Front Construction” decisively shaped China’s “inland industrial arc,” the spatial structure of which continues to influence contemporary patterns. This persistence reflects a long-term path dependence rooted in policy orientation and environmental constraints.
In terms of practical implications, this study advocates establishing a quantitative monitoring and hierarchical management system to balance conservation and revitalization. It emphasizes differentiated regional strategies: in old industrial areas, the priority should be to preserve authenticity and record technological systems, supplemented by community regeneration and adaptive industries; in emerging industrial areas, functional restructuring should be pursued under the premise of preserving spatial morphology to support industrial innovation.

5.2. Research Contributions

Using GIS-based analytical tools such as kernel density estimation and Moran’s I index, the results demonstrate a strong spatial correspondence between the distribution of industrial heritage and the Hu Line demarcation. The eastern and central regions remain the industrial core zones of China. This finding aligns with the observation by Zhang, Cenci, Becue, and Koutra, who described the “strong east–weak west” pattern of China’s industrialization [89]. However, Zhang et al.’s use of the Geodetector approach only measured the strength of influence of each variable, without uncovering deeper issues such as nonlinear contributions or spatial heterogeneity [89]. In contrast, this study’s analytical framework, integrating regression and machine learning models, examines key factors from two paradigmatic perspectives—predictive inference (XGBoost) and spatial regression (MGWR). It thus proposes a generalizable fusion framework of spatial stationarity and nonlinear heterogeneity, comprehensively revealing both global trends and local variations. The multi-model analytical design aims to overcome the limitations of single-method approaches, offering a more comprehensive and fine-grained interpretation of driving mechanisms than traditional spatial statistical models such as GWR or Geodetector.
Beyond methodological advancement, this research enriches spatial quantitative analysis with temporal contextualization, supplementing aspects that purely statistical models cannot capture. It provides an integrated spatio-temporal and qualitative–quantitative interpretive framework for understanding the spatial zoning, value assessment, and adaptive reuse of industrial heritage in China, while offering methodological insight applicable to other complex spatial problems.
Furthermore, the study transcends the superficial description of “east–west disparities” by revealing the underlying spatial mechanisms shaping these patterns. Based on multi-model analytical results and a review of the historical evolution of China’s industrial structure, the study argues that spatial heterogeneity in industrial heritage is not merely a quantitative regional difference but a geographically embedded expression of layered historical processes. Fundamentally, it reflects the compound interaction among developmental stages, strategic intentions, resource–environment constraints, and persistent industrial legacies. This perspective advances beyond the traditional environmental determinism that dominates prior research and proposes a more integrative mechanism model: at the local level, the evolution of industrial heritage is nonlinearly modulated by topography, vegetation coverage, and urbanization processes; at the macro level, it is co-shaped by the resonance of environmental endowments and historical development trajectories. This framework provides a new systematic explanation for understanding the spatial configuration of industrial heritage.
This study fills a gap in the systematic spatial quantitative analysis and mechanism interpretation of China’s industrial heritage by establishing a national-scale analytical chain that links spatial pattern identification with multi-factor influence quantification. It provides a replicable analytical pathway for exploring “heritage–space–environment” interactions in future research. By translating these spatial regularities and driving mechanisms into quantitative evidence, the study directly informs conservation planning, supports the development of differentiated and operational strategies for heritage protection and adaptive reuse, and enhances the policy relevance and decision-making utility of industrial heritage research.

5.3. Limitations

Despite the insights provided, this study has several limitations. The XGBoost model achieved a relatively low R2 of 0.16 on the test set, indicating that a substantial portion of spatial variability in industrial heritage remains unexplained by the current variables and models. This reflects both the scope for improvement in model explanatory power and the complexity of the formation and distribution mechanisms of industrial cultural heritage. The relatively small sample size may limit the generalizability of findings at micro scales, such as cities or counties, and may reduce the advantage of XGBoost for large-sample predictive modeling. The study primarily focuses on national-level analysis, lacking fine-scale exploration at provincial or municipal levels. Local policies and planning exert profound influence on heritage formation and preservation, which macro-level studies may not fully capture.
Future research should expand the set of variables to include socio-cultural identity, policy environment, and land-use change, enhancing the model’s ability to capture complex non-linear relationships and spatial heterogeneity. This study was unable to quantitatively assess implicit factors such as historical evolution, socio-cultural identity, policy environment, and land-use change at finer spatial and temporal scales, primarily due to constraints related to the current progress of industrial heritage designation and the limited availability of relevant indicators. Future research could address these limitations through indirect quantification and the use of proxy indicators. For example, the level of policy support and institutional responsiveness could be reflected by measures such as the intensity of local government financial investment, the number of cultural heritage protection policy documents, and the year of industrial heritage designation. Similarly, historical variables related to the process of industrialization—such as the long-term growth rate of industrial value added, the temporal distribution of industrial enterprise establishment, and the spatial extent of officially recognized old industrial bases—could serve as proxies to represent the cumulative historical development of regional industrialization. Increasing sample size, spatial coverage, and temporal resolution, particularly at county or even street levels, would improve model generalizability and explanatory depth. Employing spatiotemporal models based on longitudinal data holds promise for better understanding the dynamic mechanisms of industrial heritage, providing a stronger empirical foundation for scientifically informed preservation and revitalization strategies.

Author Contributions

Conceptualization, B.C. and H.Z.; methodology, B.C., L.D. and X.C.; software, L.D. and X.C.; validation, H.Z. and X.W.; formal analysis, B.C. investigation, H.Z.; resources, H.Z.; data curation, H.Z. and B.C.; writing—original draft preparation, B.C.; writing—review & editing, B.C. and H.Z.; visualization, B.C. and X.W.; supervision, H.Z. and X.W.; project administration, X.W., L.D. and X.C.; funding acquisition, H.Z. All authors have read and agreed to the published version of the manuscript.

Funding

The research was supported by Macao Polytechnic University (Grant number: RP/FCHS-02/2025).

Data Availability Statement

Due to the Chinese government’s confidentiality requirements for certain geospatial data, it cannot be disclosed on public platforms. However, under reasonable circumstances, it can be requested from the corresponding author.

Acknowledgments

The authors gratefully acknowledge the support of Macao Polytechnic University (RP/FCHS-02/2025).

Conflicts of Interest

The authors declare no conflicts of interest.

References

  1. Park, J.-M.; Sung, J.-S. A Study on the Definition Changing of Industrial Heritage. J. Arch. Hist. 2012, 21, 65–81. [Google Scholar] [CrossRef] [Scilit]
  2. Balen, K.; Vandesande, A. The value of heritage in sustainable development and spatial planning. Res. Agenda Herit. Plan. 2021, 45, 39–52. [Google Scholar] [CrossRef] [Scilit]
  3. Han, S.H.; Zhang, H. Progress and Prospects in Industrial Heritage Reconstruction and Reuse Research during the Past Five Years: Review and Outlook. Land 2022, 11, 2119. [Google Scholar] [CrossRef] [Scilit]
  4. Hain, V.; Löffler, R.; Zajíček, V. Interdisciplinary Cooperation in the Virtual Presentation of Industrial Heritage Development. Procedia Eng. 2016, 161, 2030–2035. [Google Scholar] [CrossRef] [Scilit]
  5. Mieg, H.; Oevermann, H.; Noll, H.-P. Conserve and Innovate Simultaneously? disP—Plan. Rev. 2020, 56, 20–33. [Google Scholar] [CrossRef] [Scilit]
  6. II, M.A.R.; Hannum, K.L. UNESCO, mining heritage and the scalar sustainability of tourism geographies at industrial World Heritage Sites. J. Tour. Futures 2024, 379–559. [Google Scholar] [CrossRef] [Scilit]
  7. Zuev, D.; Hannam, K.; Zhao, J. Industrial heritage tourism in Macau: Reinventing the Iec Long firecracker factory. Tour. Geogr. 2025, 27, 1–27. [Google Scholar] [CrossRef] [Scilit]
  8. Oevermann, H. Good practice for industrial heritage sites: Systematization, indicators, and case. J. Cult. Herit. Manag. Sustain. Dev. 2019, 10, 157–171. [Google Scholar] [CrossRef] [Scilit]
  9. Loures, L.; Panagopoulos, T. Sustainable reclamation of industrial areas in urban landscapes. Sustain. Dev. 2007, 20, 791–800. [Google Scholar] [CrossRef] [Scilit]
  10. Zhang, Y.; Shi, P.; Liang, Y.; Wang, L. Negative emotions of industrial heritage tourists. Int. J. Tour. Res. 2024, 26, e2702. [Google Scholar] [CrossRef] [Scilit]
  11. Zhang, J.; Cenci, J.; Becue, V.; Koutra, S.; Liao, C. Stewardship of Industrial Heritage Protection in Typical Western European and Chinese Regions: Values and Dilemmas. Land 2022, 11, 772. [Google Scholar] [CrossRef] [Scilit]
  12. Chen, J.; Judd, B. Relationality and territoriality: Rethinking policy circulation of industrial heritage reuse in Chongqing, China. Int. J. Herit. Stud. 2021, 27, 16–38. [Google Scholar] [CrossRef] [Scilit]
  13. Li, Z.; Gai, Q.; Qin, L. Superimposed Renewal of Industrial Heritage under the Guidance of Low Maintenance and Sustainability—Renewal of Refinery Site in Jinan Tianhong Community. Sustainability 2022, 14, 7486. [Google Scholar] [CrossRef] [Scilit]
  14. Chen, J.; Judd, B.; Hawken, S. Adaptive reuse of industrial heritage for cultural purposes in Beijing, Shanghai and Chongqing. Struct. Surv. 2016, 34, 331–350. [Google Scholar] [CrossRef] [Scilit]
  15. Fan, X.; Dai, S. Spatial–temporal distribution characteristics of industrial heritage protection and the influencing factors in a Chinese city: A case study of the Tiexi old industrial district in Shenyang. J. Herit. Tour. 2017, 12, 281–295. [Google Scholar] [CrossRef] [Scilit]
  16. Siyu, Y.; Saengchan, S. Research on Spatial Renewal Strategy of Industrial Heritage: A Case Study of Guangzhou T.I.T. Creative Industry Zone. Int. J. Relig. 2024, 5, 4295–4303. [Google Scholar] [CrossRef] [Scilit]
  17. Kim, G.; Newman, G.; Jiang, B. Urban regeneration: Community engagement process for vacant land in declining cities. Cities 2020, 102, 102730. [Google Scholar] [CrossRef] [Scilit]
  18. Presenza, A.; Perfetto, M. Industrial Heritage Management (IHM). Inquadramento di un campo di studio emergente attraverso la revisione della letteratura/Industrial Heritage Management (IHM). An overview of an emerging field of study through the literature review. Capit. Cult. 2015, 1, 313–336. [Google Scholar] [CrossRef] [Scilit]
  19. Yan, M.; Li, Q.; Zhang, J. Rethinking Industrial Heritage Tourism Resources in the EU: A Spatial Perspective. Land 2023, 12, 1510. [Google Scholar] [CrossRef] [Scilit]
  20. Xu, S. Cultural Heritage Modeling Based on Spatial Information Technology. Int. Conf. Robot. Intell. Syst. (ICRIS) 2018, 126, 334–337. [Google Scholar] [CrossRef] [Scilit]
  21. Tan, L.; Qiu, X.; Wang, C.; Sun, Z.; Hou, X.; Qiao, J.; Yang, C.; Xin, J. A comprehensive model for assessing water engineering facilities heritage in grand canal’s huitong river during the ming and qing dynasties. Sci. Rep. 2025, 15, 19838. [Google Scholar] [CrossRef] [Scilit]
  22. Zhang, J.; Zhuo, L.; Sun, H.; Wang, Y.; Wei, H.; Xu, S.; Aoki, N. Construction of the Chinese Route of Industrial Heritage Based on Spatial and Temporal Distribution Analysis. Buildings 2024, 13, 1065. [Google Scholar] [CrossRef] [Scilit]
  23. Couch, C.; Sykes, O.; Börstinghaus, W. Thirty years of urban regeneration in Britain, Germany and France: The importance of context and path dependency. Prog. Plan. 2011, 75, 1–52. [Google Scholar] [CrossRef] [Scilit]
  24. Grimshaw, D.J. Geographical information systems: A tool for business and industry? Int. J. Inf. Manag. 1989, 9, 119–126. [Google Scholar] [CrossRef] [Scilit]
  25. Chen, X.; Jiang, L.; Cheng, B.; Zhang, Y.; Shi, X.; Zheng, Y.D.; Fu, Y. Evaluating Urban Industrial Heritage Value using Industrial Heritage Matrix Analytic Hierarchy Process Models. Acc. Chem. Res. 2024, 12, 99–118. [Google Scholar] [CrossRef] [Scilit]
  26. Nowakowska, A.; Sokołowicz, M.; Zasina, J. Asset or stigma? Industrial heritage in the lens of territorial capital. Cities 2025, 167, 106354. [Google Scholar] [CrossRef] [Scilit]
  27. Ma, Y.; Roosli, R.; Cao, Z.; Zhang, X.; Gai, Y.; Ma, Z. From isolation to integration: A methodological review of adaptive reuse in industrial heritage buildings. Energy Build. 2025, 348, 116474. [Google Scholar] [CrossRef] [Scilit]
  28. Amin, S.M.; Refai, H.; Kamal, R. Mapping Industrial Heritage Sites in Egypt: Identification & Management. Int. J. Herit. Mus. Stud. 2020, 2, 79–92. [Google Scholar] [CrossRef] [Scilit]
  29. Qian, Z. Heritage conservation as a territorialised urban strategy: Conservative reuse of socialist industrial heritage in China. Int. J. Herit. Stud. 2023, 20, 63–80. [Google Scholar] [CrossRef] [Scilit]
  30. Bertacchini, E.; Frontuto, V. Economic valuation of industrial heritage: A choice experiment on Shanghai Baosteel industrial site. J. Cult. Herit. 2023, 66, 215–228. [Google Scholar] [CrossRef] [Scilit]
  31. Fredriksson, M. Dilemmas of protection: Decolonising the regulation of genetic resources as cultural heritage. Int. J. Herit. Stud. 2020, 1, 720–733. [Google Scholar] [CrossRef] [Scilit]
  32. Leonard, L.; Duma, S. Investigating the Co-Management of Natural Resources: Lessons Learned from the iSimangaliso World Heritage Site, KwaZulu-Natal, South Africa. Acc. Chem. Res. 2024, 60, 3781–3798. [Google Scholar] [CrossRef] [Scilit]
  33. Samimi, S.A.B.; Maraschin, C. Built heritage and urban spatial configuration: The case of Herat, Afghanistan. GeoJournal 2022, 88, 2101–2120. [Google Scholar] [CrossRef] [Scilit]
  34. Liao, Y.D.; Cenci, J.; Zhang, J.Z. Chinese Modern Architectural Heritage Resources: Perspectives of Spatial Distribution and Influencing Factors. ISPRS Int. J. Geo-Inf. 2023, 12, 358. [Google Scholar] [CrossRef] [Scilit]
  35. Ma, X.; Zhang, Y.; Li, Y.; Li, Y.; Lin, F. Spatial–temporal distribution and evolution of the socialist built heritage in China, 1949–1978. Herit. Sci. 2023, 11, 214. [Google Scholar] [CrossRef] [Scilit]
  36. Campiani, A.; Lingle, A.; Lercari, N. Spatial analysis and heritage conservation: Leveraging 3-D data and GIS for monitoring earthen architecture. J. Cult. Herit. 2019, 39, 166–176. [Google Scholar] [CrossRef] [Scilit]
  37. Aydın, E.Ö.; Tepe, E.; Balcan, C. Identification of determinants during the registration process of industrial heritage using a regression analysis. J. Cult. Herit. 2022, 58, 23–32. [Google Scholar] [CrossRef] [Scilit]
  38. Zhang, J.; Cenci, J.; Becue, V.; Koutra, S.; Ioakimidis, C. Recent Evolution of Research on Industrial Heritage in Western Europe and China Based on Bibliometric Analysis. Sustainability 2020, 12, 5348. [Google Scholar] [CrossRef] [Scilit]
  39. Zhao, W.K.; Zhou, B. Out of the Dilemma: Industrial Heritage Value Evaluation and Renewal Suitability Research in Chengdu, China. J. Urban Plan. Dev. 2022, 148, 04022004. [Google Scholar] [CrossRef] [Scilit]
  40. Chen, J. Industrial heritage reuse ideas on the move: Comparative case studies in Shanghai and Chongqing, China. Int. J. Cult. Policy 2022, 29, 844–861. [Google Scholar] [CrossRef] [Scilit]
  41. Mo, C.; Wang, L.; Rao, F. Typology, Preservation, and Regeneration of The Post-1949 Industrial Heritage in China: A Case Study of Shanghai. Land 2022, 11, 1527. [Google Scholar] [CrossRef] [Scilit]
  42. Wei, G.; Han, G.-S.; Lang, X. Cultural heritage site selection characteristics and the impact of the natural environment in Jinan city, China. Sci. Rep. 2024, 14, 31038. [Google Scholar] [CrossRef] [Scilit]
  43. Oleg, D.; Olexander, D. Geographical determinism: Classical and post-classical concepts. Zenodo (CERN Eur. Organ. Nucl. Res.) 2023, 14, 1–18. [Google Scholar] [CrossRef] [Scilit]
  44. Bunt, W.D.; Smith, W. Geography and the Location of Industry. Econ. Geogr. 1953, 29, 94. [Google Scholar] [CrossRef] [Scilit]
  45. Hanink, D. Industrial Location Theory. In International Encyclopedia of Geography: People, the Earth, Environment and Technology; John Wiley & Sons: Hoboken, NJ, USA, 2017; Volume 1, pp. 1–12. [Google Scholar] [CrossRef] [Scilit]
  46. Martin, R. Economic Theory and Human Geography. In Human Geography: Society, Space and Social Science; Palgrave Macmillan: London, UK, 1994. [Google Scholar] [CrossRef] [Scilit]
  47. Nikolic, S. Determinants of industrial location: Kingdom of Yugoslavia in the interwar period. Eur. Rev. Econ. Hist. 2018, 22, 101–133. [Google Scholar] [CrossRef] [Scilit]
  48. Ovdiyenko, I.K. The new Geography of Industry of China. Sov. Geogr. 1960, 1, 63–78. [Google Scholar] [CrossRef] [Scilit]
  49. Beerli, A.; Weiss, F.J.; Zilibotti, F.; Zweimüller, J. Demand forces of technical change evidence from the Chinese manufacturing industry. China Econ. Rev. 2020, 60, 101157. [Google Scholar] [CrossRef] [Scilit]
  50. Deng, P.; Wen, L.; Wang, D. Assessing the environmental impact of digital and manufacturing industry co-agglomeration: Dual perspectives of geographical and virtual agglomeration. J. Environ. Manag. 2025, 375, 124369. [Google Scholar] [CrossRef] [Scilit] [PubMed]
  51. Bertinelli, L.; Decrop, J. Geographical agglomeration: Ellison and Glaeser’s index applied to the case of Belgian manufacturing industry. Reg. Stud. 2005, 39, 567–583. [Google Scholar] [CrossRef] [Scilit]
  52. Zhang, H.; Lang, C.; Zhang, R. Life cycle carbon footprint analysis of suitcase production: Impact of material variations, size differences, and geographical factors. J. Clean. Prod. 2025, 496, 145081. [Google Scholar] [CrossRef] [Scilit]
  53. Nam, S.; Shin, J.; Ryu, J.; Ryu, H. Climate impacts on geographical changes in the energy industry. Bus. Strategy Environ. 2020, 30, 478–488. [Google Scholar] [CrossRef] [Scilit]
  54. Aaen, S.B.; Hansen, A.M.; Kladis, A. Social no-go factors in mine site selection. Extr. Ind. Soc. 2021, 8, 100896. [Google Scholar] [CrossRef] [Scilit]
  55. Bejari, H.; Daya, A.; Roudini, A. Selection of chromite processing plant site using fuzzy analytic hierarchy process (FAHP). J. Min. Environ. 2017, 8, 155–162. [Google Scholar] [CrossRef] [Scilit]
  56. Mansoureh, H.; Afshin, D.; Majid, A. The application of Analytical Network Process to environmental prioritizing criteria for coastal oil jetties site selection in Persian Gulf coasts (Iran). Ocean Coast. Manag. 2013, 73, 136–144. [Google Scholar] [CrossRef] [Scilit]
  57. Fu, J.; Mao, H. Study on the spatiotemporal distribution patterns and influencing factors of cultural heritage: A case study of Fujian Province. Herit. Sci. 2024, 51, 1. [Google Scholar] [CrossRef] [Scilit]
  58. Chu, D.; Huang, C.; Lin, F. Spatio-temporal evolution characteristics of cultural heritage sites and their relationship with natural and cultural environment in the northern Fujian, China. Herit. Sci. 2024, 12, 1–19. [Google Scholar] [CrossRef] [Scilit]
  59. Copernicus Global Digital Elevation Model. 2024. Available online: https://portal.opentopography.org/datasetMetadata?otCollectionID=OT.032021.4326.1 (accessed on 21 July 2025).
  60. Gao, J.; Shi, Y.; Zhang, C.; Wang, S.; Wang, X. China regional 250 m fractional vegetation cover data set (2000–2024). National Tibetan Plateau/Third Pole Environment Data Center: Beijing, China, 2025. Available online: https://data.tpdc.ac.cn/zh-hans/data/f3bae344-9d4b-4df6-82a0-81499c0f90f7 (accessed on 17 July 2025).
  61. Wang, J.; Chen, M.; Zhang, H.; Ye, F. Intangible Cultural Heritage in the Yangtze River Basin: Its Spatial Distribution Characteristics and Influencing Factors. Sustainability 2023, 15, 7960. [Google Scholar] [CrossRef] [Scilit]
  62. Xie, W.; Li, J.; Peng, K.; Zhang, K.; Ullah, Z. The Application of Local Moran’s I and Getis–Ord Gi* to Identify Spatial Patterns and Critical Source Areas of Agricultural Nonpoint Source Pollution. Acc. Chem. Res. 2024, 150, 04024011. [Google Scholar] [CrossRef] [Scilit]
  63. Li, W.; Jiao, J.; Qi, J.; Ma, Y. The spatial and temporal differentiation characteristics of cultural heritage in the Yellow River Basin. PLoS ONE 2022, 17, e0268921. [Google Scholar] [CrossRef] [Scilit] [PubMed]
  64. Chiu, S.-T. Bandwidth selection for kernel density estimation. Ann. Stat. 1991, 19, 1883–1905. [Google Scholar] [CrossRef] [Scilit]
  65. Wang, F.; Zhang, T.; Zhang, S. MGWR reveals scale heterogeneity shaping intangible cultural heritage distribution in China. npj Herit. Sci. 2025, 13, 367. [Google Scholar] [CrossRef] [Scilit]
  66. Li, Y.; Hong, T.; Gu, Y.; Li, Z.; Huang, T.; Lee, H.F.; Heo, Y.; Yim, S.H. Assessing the Spatiotemporal Characteristics, Factor Importance, and Health Impacts of Air Pollution in Seoul by Integrating Machine Learning into Land-Use Regression Modeling at High Spatiotemporal Resolutions. Environ. Sci. Technol. 2023, 57, 1225–1236. [Google Scholar] [CrossRef] [Scilit]
  67. Jawarneh, R.; Abulibdeh, A. Geospatial modelling of seasonal water and electricity consumption in Doha’s residential buildings using multiscale geographically weighted regression (MGWR) and Bootstrap analysis. Sustain. Cities Soc. 2024, 113, 105654. [Google Scholar] [CrossRef] [Scilit]
  68. Fotheringham, A.S.; Yang, W.; Kang, W. Multiscale Geographically Weighted Regression (MGWR). Ann. Am. Assoc. Geogr. 2017, 107, 1247–1265. [Google Scholar] [CrossRef] [Scilit]
  69. Lai, Y.; Wan, G.; Qin, X. Decoding China’s new-type industrialization: Insights from an XGBoost-SHAP analysis. J. Clean. Prod. 2024, 478, 143927. [Google Scholar] [CrossRef] [Scilit]
  70. Lei, Y.; Shen, Z.; Tian, F.; Yang, X.; Wang, F.; Pan, R.; Wang, H.; Jiao, S.; Kou, W. Fire risk level prediction of timber heritage buildings based on entropy and XGBoost. J. Cult. Herit. 2023, 63, 11–22. [Google Scholar] [CrossRef] [Scilit]
  71. Li, Z. Extracting spatial effects from machine learning model using local interpretation method: An example of SHAP and XGBoost. Comput. Environ. Urban Syst. 2022, 96, 101845. [Google Scholar] [CrossRef] [Scilit]
  72. Xu, B.; Xu, L.; Xu, R.; Luo, L. Geographical analysis of CO2 emissions in China’s manufacturing industry: A geographically weighted regression model. J. Clean. Prod. 2017, 166, 628–640. [Google Scholar] [CrossRef] [Scilit]
  73. Li, Z.; Fotheringham, A. Computational improvements to multi-scale geographically weighted regression. Int. J. Geogr. Inf. Sci. 2020, 34, 1378–1397. [Google Scholar] [CrossRef] [Scilit]
  74. Dadao, L.U. Analysis on the formation mechanism of “point-axis” spatial structure system. Sci. Geogr. Sin. 2002, 22, 1–6. [Google Scholar] [CrossRef]
  75. Sachdeva, M.; Fotheringham, A.; Li, Z.; Yu, H. On the local modeling of count data: Multiscale geographically weighted Poisson regression. Int. J. Geogr. Inf. Sci. 2023, 37, 2238–2261. [Google Scholar] [CrossRef] [Scilit]
  76. Akaike information criterion statistics. Math. Comput. Simul. 1987, 29, 452. [CrossRef] [Scilit]
  77. Liang, L.; Chen, Y.; Gong, A.; Sun, H. A modified geographical weighted regression model for better flood risk assessment and management of immovable cultural heritage sites at large spatial scales. J. Cult. Herit. 2024, 68, 276–286. [Google Scholar] [CrossRef] [Scilit]
  78. Zhao, J.; Guo, F.; Zhang, H.; Dong, J. Mechanisms of non-stationary influence of urban form on the diurnal thermal environment based on machine learning and MGWR analysis. Sustain. Cities Soc. 2024, 101, 105194. [Google Scholar] [CrossRef] [Scilit]
  79. Tan, G.; Gao, Y.; Xue, C.Q.; Xu, L. ‘Third Front’ construction in China: Planning the industrial towns during the Cold War (1964–1980). Plan. Perspect. 2021, 36, 1149–1171. [Google Scholar] [CrossRef] [Scilit]
  80. Child, J.; Lu, Y. Industrial Decision-making under China’s Reform, 1985–1988. Organ. Stud. 1990, 11, 321–351. [Google Scholar] [CrossRef] [Scilit]
  81. Cheng, Z.; Li, L.; Liu, J. Industrial structure, technical progress and carbon intensity in China’s provinces. Renew. Sustain. Energy Rev. 2018, 81, 2935–2946. [Google Scholar] [CrossRef] [Scilit]
  82. Lu, D. Industrial policy and resource allocation: Implications on China’s participation in globalization. China Econ. Rev. 2001, 11, 342–360. [Google Scholar] [CrossRef] [Scilit]
  83. Ferdinand, P. China’s industrial reform and Chen Jiyuan and Management reforms in China. Int. Aff. 1988, 64, 318–319. [Google Scholar] [CrossRef] [Scilit]
  84. Cai, Y.; Hu, Z. Industrial agglomeration and industrial SO2 emissions in China’s 285 cities: Evidence from multiple agglomeration types. J. Clean. Prod. 2022, 353, 131675. [Google Scholar] [CrossRef] [Scilit]
  85. Han, Q.; Deng, C. Evaluating the development of China’s modern industrial system. Finance Res. Lett. 2024, 74, 106676. [Google Scholar] [CrossRef] [Scilit]
  86. Gao, Y.; Tan, G.; Zhu, J.; Chen, Z. Spatial distribution and determinants of Third Front built heritage: Insights from West Hubei Province, China. npj Herit. Sci. 2025, 13, 304. [Google Scholar] [CrossRef] [Scilit]
  87. Dehghan, F.; Amores, C.P.; Khanmohammadi, L.; Labib, R. Evaluating Machine Learning Models for Sustainable Building Design: Energy, Emissions, and Comfort Metrics. Build. Environ. 2025, 285, 113582. [Google Scholar] [CrossRef] [Scilit]
  88. Lei, H.; Zhao, H.; Ao, T. A two-step merging strategy for incorporating multi-source precipitation products and gauge observations using machine learning classification and regression over China. Hydrol. Earth Syst. Sci. 2022, 26, 2969–2995. [Google Scholar] [CrossRef] [Scilit]
  89. Zhang, Y.; Yang, M.; Li, Z.; Li, W.; Lu, C.; Li, Z.; Li, H.; Zhai, F. Study on the Spatial Distribution Characteristics and Influencing Factors in the Reuse of National Industrial Heritage Sites in China. Sustainability 2023, 15, 16685. [Google Scholar] [CrossRef] [Scilit]
  90. Kefford, A. Disruption, destruction and the creation of ‘the inner cities’: The impact of urban renewal on industry, 1945–1980. Urban Hist. 2016, 44, 492–515. [Google Scholar] [CrossRef] [Scilit]
  91. Liu, J.; Zhu, J. Contested rent-based urban governance: Land rent dissipation and redistribution under scalar politics in China. Land Use Policy 2025, 157, 107692. [Google Scholar] [CrossRef] [Scilit]
  92. Lin, C.; Liu, Y.; Yuan, Z.; Wang, H.; Li, G.; Zhou, Z.; Wang, H.; An, X. Harmonizing stakeholder interests in urban renewal: A novel planning approach using explainable machine learning and spatial optimization. Land Use Policy 2025, 155, 107588. [Google Scholar] [CrossRef] [Scilit]
  93. Yu, C.; Jin, H. Labor agglomeration, industrial structure upgrading and low-carbon economic development. Finance Res. Lett. 2024, 74, 106703. [Google Scholar] [CrossRef] [Scilit]
  94. Guo, K.; Guo, X. Industrial agglomeration and corporate labor investment efficiency: A study based on the industry heterogeneity perspective. Manag. Decis. Econ. 2024, 45, 3127–3151. [Google Scholar] [CrossRef] [Scilit]
  95. Zhao, M.; Xu, Q.; Lan, H.; Wan, J.; Perry, D.M.; Li, P. The spatiotemporal distribution and influencing mechanism of China’s hydraulic heritage sites. Habitat Int. 2025, 166, 103604. [Google Scholar] [CrossRef] [Scilit]
  96. Zhang, J.; Cenci, J.; Becue, V.; Koutra, S. Analysis of spatial structure and influencing factors of the distribution of national industrial heritage sites in China based on mathematical calculations. Environ. Sci. Pollut. Res. 2022, 29, 27124–27139. [Google Scholar] [CrossRef] [Scilit] [PubMed]
  97. Valdez, B.; Schorr, M.; Quintero, M.; García, R.; Rosas, N. Effect of climate change on durability of engineering materials in hydraulic infrastructure: An overview. Corros. Eng. Sci. Technol. 2010, 45, 34–41. [Google Scholar] [CrossRef] [Scilit]
  98. Yang, C.; Yan, Z.; Zhang, Z.; Ni, P.; Bi, W.; Feng, C.; Zhang, D.; Yue, Y.; Lei, F. Differential degradation characteristics of complex-shaped earthen heritage sites under wind erosion. Constr. Build. Mater. 2025, 481, 141469. [Google Scholar] [CrossRef] [Scilit]
  99. Zeng, J.; Qian, Y.; Yin, F.; Zhu, L.; Xu, D. A multi-value cellular automata model for multi-lane traffic flow under lagrange coordinate. Comput. Math. Organ. Theory 2022, 28, 178–192. [Google Scholar] [CrossRef] [Scilit]
  100. Pilia, E. The Italian Industrial Heritage of Arms Factories. Perspectives for Sustainable Conservation and Reuse. In Networks, Markets & People; Springer: Cham, Switzerland, 2024; pp. 85–94. [Google Scholar]
  101. Popjaková, D.; Tkocz, M.; Vančura, M. New Industrial Spaces in Old Industrial Centres: Selected Examples of Sosnowiec (Poland) and České Budějovice (Czech Republic). Stud. Ind. Geogr. Comm. Pol. Geogr. Soc. 2014, 25, 212–229. [Google Scholar] [CrossRef] [Scilit]
  102. Zhong, D.; Huang, P.; Xiong, G.; Li, H. Renewal strategies of industrial heritage based on placeness theory: The case of Guangzhou, China. Cities 2024, 155, 105407. [Google Scholar] [CrossRef] [Scilit]
  103. Zhang, J.; Cenci, J.; Becue, V. A Preliminary Study on Industrial Landscape Planning and Spatial Layout in Belgium. Heritage 2021, 4, 1375–1387. [Google Scholar] [CrossRef] [Scilit]
  104. Jones, C.; Munday, M. Blaenavon and United Nations World Heritage Site Status: Is Conservation of Industrial Heritage a Road to Local Economic Development? Reg. Stud. 2001, 35, 585–590. [Google Scholar] [CrossRef] [Scilit]
  105. Xie, P.F. A life cycle model of industrial heritage development. Ann. Tour. Res. 2015, 55, 141–154. [Google Scholar] [CrossRef] [Scilit]
  106. Dorado, M.I.A. The Industrial Heritage of the City of Malaga: Analysis of Its Current Situation and Support for Its Activation as a Resource for Urban Development. Heritage 2022, 6, 132–163. [Google Scholar] [CrossRef] [Scilit]
  107. Lu, N.; Liu, M.; Wang, R. Reproducing the discourse on industrial heritage in China: Reflections on the evolution of values, policies and practices. Int. J. Herit. Stud. 2020, 9, 498–518. [Google Scholar] [CrossRef] [Scilit]
Figure 1. Technology Roadmap.
Ijgi 15 00017 g001
Figure 2. Spatial distribution of industrial heritage in China ((a). Hot and cold spot analysis (b). Kernel density analysis).
Ijgi 15 00017 g002
Figure 3. SHAP analysis of global feature scatter plot.
Ijgi 15 00017 g003
Figure 4. SHAP analysis interaction heat map.
Ijgi 15 00017 g004
Figure 5. Overlay analysis of various variables and the spatial distribution of industrial heritage.
Ijgi 15 00017 g005
Table 1. Summary of Regression Model Results.
IndicatorValueDescription
R2(MGWR)0.53Indicates good explanatory power and robust model fit
R2(OLS)0.52
R2(GWR)0.71
Effective number of parameters9Parameter estimates are reasonable, with no severe overfitting
Degrees of freedom22Moderate model complexity
Degree of Dependency (DoD)0.998Tightly connected spatial weight matrix, conducive to capturing spatial correlation
Log-likelihood−32.396Consistent with overall model fit
Residual sum of squares14.676Magnitude of prediction error
AICc(MGWR)95.792Information criteria for comparing the goodness-of-fit between models
AICc(OLS)96
AICc(GWR)221.788
Number of iterations to convergence11Stable convergence process
Variable bandwidth9976Close to global scale, indicating consistent spatial effects across variables
Disclaimer/Publisher’s Note: The statements, opinions and data contained in all publications are solely those of the individual author(s) and contributor(s) and not of MDPI and/or the editor(s). MDPI and/or the editor(s) disclaim responsibility for any injury to people or property resulting from any ideas, methods, instructions or products referred to in the content.