Article

Geospatial Impacts of Land Allotment at the Standing Rock Reservation, USA: Patterns of Gain and Loss

by
Stephen L. Egbert
1,* and
Joshua J. Meisel
2
1
Department of Geography and Atmospheric Science, University of Kansas, Lawrence, KS 66045, USA
2
Independent Researcher, Lawrence, KS 66044, USA
*
Author to whom correspondence should be addressed.
ISPRS Int. J. Geo-Inf. 2025, 14(9), 363; https://doi.org/10.3390/ijgi14090363
Submission received: 14 July 2025 / Revised: 12 September 2025 / Accepted: 16 September 2025 / Published: 19 September 2025

Abstract

Allotment—the division of Native American reservations into individually-owned plots of land—has been extensively studied; yet there exists a paucity of reservation-level studies at granular geospatial scales, i.e., at the level of examining the impacts of allotment on individuals, families, and clan or tribal groups. In previous research, we described a new semi-automated method for creating detailed GIS allotment databases and discussed the policies and processes that that lay behind allotment at the Standing Rock Reservation. In this study, we employed our Standing Rock database to map and explore allotment patterns in detail. We primarily focused on patterns of clustering versus dispersion of allotment parcels for individuals, families, and tribal groups by calculating median distance (and other descriptive statistics) and standard distance in GIS. Throughout, we used mapped representations of allotment patterns as visualization tools, both for confirming hypotheses and raising new questions. As anticipated, we discovered patterns of both gain and loss. On the one hand, as we had found earlier, the people at Standing Rock gained land through their insistence on allotments for married women and for children born after the beginning date of allotment (“later-born children”), land they otherwise would not have received. We also confirmed that married women only received half the land that their husbands received and that the early sale of “surplus” reservation lands deprived a future generation of children of the opportunity to receive their own land. Perhaps most importantly, however, we discovered that the belated timing of allotments to married women and later-born children caused their allotments to be located at some distance from those of their husbands or fathers, creating disjunct and dispersed patterns of family land holdings that would have significantly hampered the creation of viable farming and ranching operations.

1. Introduction

This is the third in a series of papers that examines and seeks to understand the processes, patterns, and impacts of land allotment on the Standing Rock Reservation in North and South Dakota in the early 1900s. The first paper presented a semi-automated method for mapping allotments at the individual owner and parcel level, using geographic information systems (GIS) to combine digital cadastral and land ownership databases with historical archival sources [1]. Our second paper focused on the historical and geographical processes of land allotment at Standing Rock as implemented by the Special Allotting Agent, emphasizing how some of those processes were significantly modified by the Indian Office and Congress at the insistence of the inhabitants of the reservation [2]. In this third paper, our attention turns to mapping, exploring, and understanding the geographical patterns that resulted from allotment on the Standing Rock reservation, both as it was originally conceived by US government policy and as it was subsequently modified and implemented. Our specific emphasis is on the unique geospatial patterns of allotments at Standing Rock that resulted from the preferences of individuals as modified by allotment policies put in place by the U.S. government, not only prior to allotment but during the actual process of allotment itself.
Throughout this study, our emphasis is on the spatial patterns created by the processes of allotment. We adopted the common geographical definition of pattern as the spatial arrangement or distribution of phenomena across a given area, the phenomena in this case being allotments. We were primarily interested in the related pair of questions as to whether allotments were clustered or dispersed. Our interest in spatial patterns of clustering and dispersal arose from the government’s stated intent that the purpose of allotment was to create farmers and ranchers from its Native wards. Inherent in this goal was the idea that if the farmer or rancher was to be successful, the land holdings of an allotment recipient, just as with the land holdings of a white farmer of the horse-drawn era, would need to be either contiguous or very near to each other. Therefore, we wanted to know, for example, if persons who chose multiple parcels to comprise their allotments chose parcels that were contiguous or at least close to each other (clustered) versus spread over a wider area (dispersed). We asked similar questions about allotments to members of families and to larger tribal groups. And, as noted, we focused on how changes in government policies impacted the patterns of clustering or dispersion.
In this paper, we first provide a historical overview of land allotment in the U.S. and at the Standing Rock Reservation, followed by a section that states our goals and the research questions that guided our research, which are organized according to subsections on overall patterns of allotments, patterns of allotments to tribes, individual patterns of allotment, and patterns of allotment to families. In Section 4, Methodology, we provide a review of relevant literature (the “research context”), give a brief description of the study area, and discuss our data sources and research methods. Section 5, Results and Discussion, the most substantial part of the paper, is organized according to the same categories as our research questions. The subsection on family allotment patterns is particularly detailed because of the substantial impact that changing government policies had on allotments to family members. The final section summarizes our major findings and emphasizes the unique contributions of our research. In addition, we outline an ambitious research agenda for harnessing detailed spatial databases of allotment with the visualization and analytical capabilities of GIS to more fully explore and understand the patterns and impacts of allotment.

2. Historical Overview

2.1. The Indian Problem and Land Allotment

The history of land allotment in the USA—the division of reservation lands into individual land holdings in the late 1800s and early 1900s—has been thoroughly covered in numerous book-length treatises and research articles at a range of geographical scales, from national [3,4,5,6,7,8,9,10], to state and regional [11,12], and down to individual reservations [13,14]. In brief, land allotment was a key part of the proposed solution to the “Indian Problem” in the latter part of the 1800s, the crux of which was that the US government had driven numerous Native tribes onto reservations, primarily west of the Mississippi River, where people lived in impoverished conditions, leading to starvation and despair on one hand and sporadic outbursts of violence on the other. Assimilation was the solution settled upon by the government—the absorption of Native people into mainstream white culture, primarily through two major components: education and land allotment. (It should be noted, at least in passing, that colonial powers dispossessed Indigenous people of their lands wherever they went, and studies associated with Indigenous land issues have been conducted in Canada [15], Central and South America [16,17], Australia [18], and New Zealand [19], and elsewhere).
The General Allotment Act of 1887, also known as the Dawes Act [20], named for Massachusetts Senator Henry Dawes, was the culmination of sporadic earlier attempts to implement land allotment. At the core of the Act was the dissolution of tribally owned reservation lands and the creation of individual land allotments owned privately by tribal members. However, this act was much broader than the simple rearrangement of Indian landholding systems, as it also specified who would or would not be eligible for allotment, how much land each eligible person would be allotted, and how much would be opened to white settlement. It also had implications for whether existing treaties would be honored or ignored, the determination of legal jurisdiction over each reservation and its allotted lands, and even the US citizenship status for tribal members. The Dawes Act gave broad power to the President to authorize allotment on virtually all reservations.
“… the President of the United States … hereby is, authorized, whenever in his opinion any reservation or any part thereof of such Indians is advantageous for agricultural and grazing purposes, to cause said reservation, or any part thereof, to be surveyed, or resurveyed if necessary, and to allot the lands in said reservation in severalty to any Indian located thereon”.
[20] (Section 1)
Provisions in the Act were written so as to essentially establish homesteads for each tribal member, in similar quantities to those of the Homestead Act of 1862 [21] that was passed to encourage settlement on public lands in the western United States. Section 1 of the Dawes Act prescribed the amount of land to be allotted to various categories of individuals: 160 acres (64.7 ha) to each head of a family, 80 acres (32.4 ha) to each single adult and each minor orphan, and 40 acres (16.2 ha) to all minor children. Furthermore, Section 1 ended with the stipulation that land quantities were to be doubled if the allotted lands were only suitable for grazing and not cultivated agriculture. Under the Dawes Act, married women did not receive allotments, although widows and divorced women were treated as heads of household and received full allotments. Subsurface mineral rights [22], timber holdings [23], and water rights [24] were sometimes granted with allotments, but these instances were the exception to the rule. Agriculture and stock-raising were the stated goals, regardless of land quality, location, or traditional customs regarding land use. (Note: The term allotment, as used in the USA and throughout this article, refers both to the process of dividing the land on reservations and to the parcels of land themselves that were given to an individual).

2.2. Allotment at Standing Rock

The foundation for the establishment of the Standing Rock Reservation was laid in the Treaty of Fort Laramie [25] that established the Great Sioux Reservation, a vast area encompassing the majority of the western part of what later became South Dakota, including the sacred Black Hills (Paha Sapa), plus a small portion of northern Nebraska. Various agencies were established to serve the geographically scattered tribes; among these was the Grand River Agency located on its namesake river, later relocated to Fort Yates on the Missouri River and renamed the Standing Rock Agency. In 1889, the Great Sioux Reservation was broken into five smaller reservations: Standing Rock, Cheyenne River, Lower Brule, Rosebud, and Pine Ridge [26] (Figure 1).
The Act that broke up the Great Sioux Reservation also set the terms of future allotment for the five new reservations. These generally followed the pattern of the Dawes Act that had been passed only two years before, varying mainly in the amounts of land allotted to individuals. Since the lands of the new reservations were located in a semi-arid grassland environment, allotments were doubled for all categories of allottees. However, the Act also stipulated that if the land to be allotted was “mainly valuable for grazing purposes”, the acreages allotted would be doubled again: heads of household would receive 640 acres (259.0 ha), single persons over the age of 18 and orphans under 18 were to receive 320 acres (129.5 ha), and children under 18 were to receive 160 acres (64.7 ha).
The process of allotment at Standing Rock formally began on 26 September 1905 when President Theodore Roosevelt directed that allotment take place there. Carl Gunderson, a native of South Dakota with previous experience with land allotment, was appointed as Special Allotting Agent on 4 October 1905 [27]. At Standing Rock, as elsewhere, the conditions and terms of allotment were set forth in a detailed letter of instruction from the Office of Indian Affairs dated 10 October 1905 [27]. (The full text of the instruction letter can be seen in Appendix B of [2]).
Of note for this study, the following provisions of the letter are most relevant. The allotting agent, as far as possible, was to honor the land selections of the allottees, especially where structures and other improvements had been built on land where they already resided. Males and females were to receive equal quantities of land, except that married women were not entitled to allotments at all, on the theory that they would enjoy the benefits of the land allotted to their husbands, even though they had no legal ownership interest, reflecting the view of women’s rights in that era [28,29]. Furthermore, allotments were not to be made to children born after the date of the President’s authorizing letter: 26 September 1905.
Although he was forced to make a late start to the allotment work in 1906 because of the need to resolve a few allotment issues at the Cheyenne River Reservation, Gunderson and his crew began making allotments in the southeast corner of the Standing Rock reservation and continued until cold weather forced a halt for the year. He wintered at his home in Vermillion, South Dakota, where he made records of his work and carried out a steady correspondence. He repeated this pattern in 1907, 1908, and 1909, finally wrapping up his work in early 1910.
One of the most noteworthy aspects of allotment at Standing Rock, and a major focus of this paper, is that the inhabitants of the reservation were able to successfully petition the government for allotments to the two groups initially excluded: married women and “later-born children”, i.e., children born after 26 September 1905, the date of the authorizing letter. These modifications, including a provision to equitably allot timber, were approved by an Act of Congress in 1907 [23], when the allotment process was already well underway.
For reasons that are not entirely clear, Gunderson began making allotments to later-born children sometime in 1907, soon after the passage of the Act of Congress, but delayed making allotments to married women until 1908. In any case, since he had completed the great majority of the regular allotments by the end of 1907, most of the allotments to married women and even most later-born children were not made simultaneously with those of their husbands or fathers. The timing of these “belated” allotments had a strong impact on the geospatial patterns of allotments for families, as will be seen.
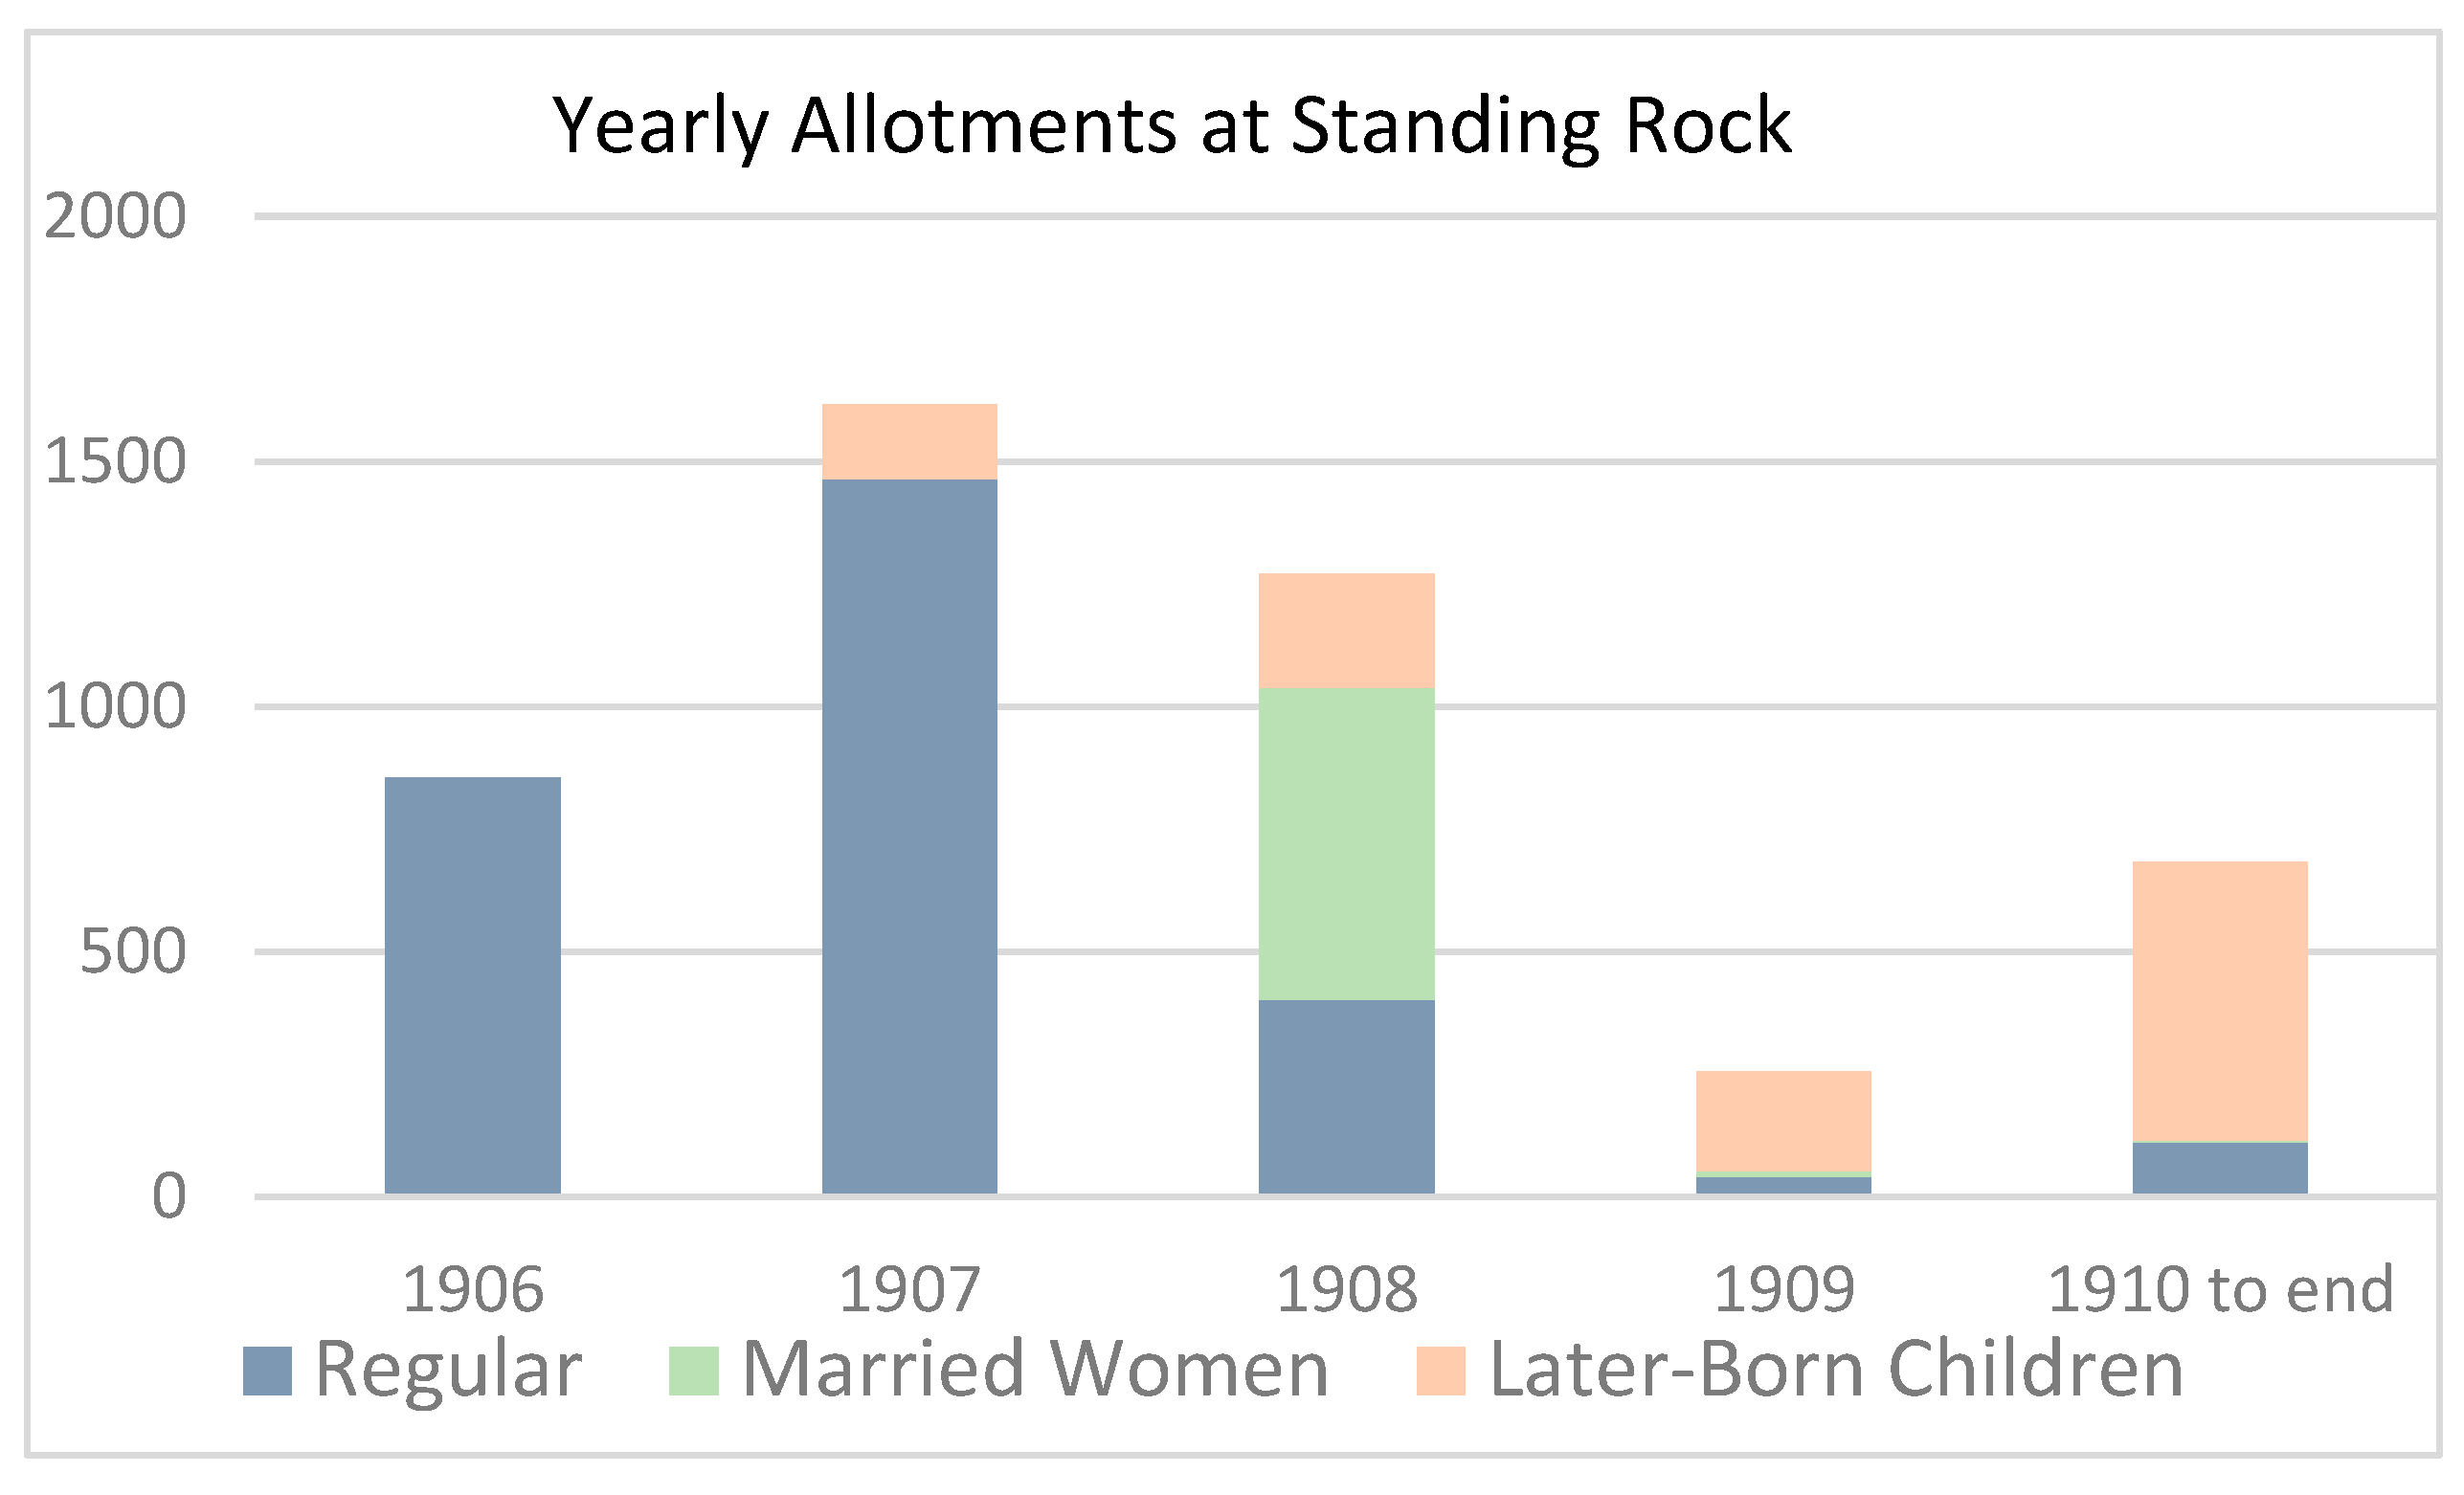
Figure 2 presents a histogram of allotment progress by year and by category of allottee. Column height shows the number of allotments made per time period, while the colors indicate the three categories of allottees: allotments to those authorized under the initial letter of instruction (blue), allotments to married women (green), and allotments to later-born children (beige). Two other patterns can be seen: the beginning year of allotment to each category of recipients and the period of time over which the allotments to those recipients occurred.
After Gunderson completed his work in early 1910 and went on to other assignments with the Indian Office, allotments at Standing Rock continued to be made, primarily to children born after he left, only concluding when remaining reservation lands were sold as “surplus” to outside settlers. In total, Gunderson and his successors allotted nearly 1,345,000 acres (544,302 ha) of land at Standing Rock.

3. Goals and Research Questions

At the conclusion of our earlier paper focused on the processes of allotment at the Standing Rock Reservation, we noted:
We view our findings here as setting the stage for further study into understanding the complex spatio-temporal patterns of land holding that took form at Standing Rock because of allotment. We envision that the next stage of research will combine our allotment databases with the powerful mapping and analytical capabilities of geographic information systems (GIS) to visualize and dynamically explore the impacts of allotment.
[2] (p. 433)
This paper represents a major step toward realizing that goal: to map, analyze, and explore the patterns of allotment at Standing Rock created by the unique set of circumstances, people, and policies at play during the allotment process in the early 1900s. In short, our goal here was discovery. What would the mapped allotment patterns tell us about the impacts of the policies and practices as implemented? To accomplish this, we structured our research around four major topics: (1) Overall patterns of allotment, (2) tribal allotment patterns, (3) individual allotment patterns, and (4) family allotment patterns. In the brief discussion below, we outline research questions that informed our research.

3.1. Overall Patterns of Allotment

Based on previous research by our research group and others, we assumed that the established settlement patterns at Standing Rock at the time of allotment would tend to be concentrated near critical natural resources, especially water and timber. We further assumed that allotments generally would reflect those settlement patterns—that is, when individuals selected allotment parcels, they would tend to select the land where they already lived. Some of our research questions included: What was the spatio-temporal pattern of allotment making? Did allotments tend to cluster near water and timber? How many allotments, and how many acres of land, were allotted to individuals by gender, by age group, and by marital status, i.e., by allotment “class”?
A final question focused on the impact of the “Diminished Reserve”, an area designated in the eastern part of the Standing Rock reservation near the end of making allotments but prior to selling off a portion of the reservation as surplus land. Effective 1 January 1909, remaining eligible allotment recipients were not permitted to select land outside the diminished reserve [30] (Chap 218). What impact did the closing of the area outside the diminished reserve have on allotment patterns?

3.2. Tribal Patterns

Previous research on the Pawnee [31] and the Cheyenne and Arapaho tribes in Oklahoma [32,33] had shown that tribes and tribal sub-groups (“clans” or “bands”) tended to settle together. From the historical record we knew that four tribal groups were settled on the Standing Rock reservation. What would the historical records show and, more importantly, what would the mapped patterns of the four tribes at Standing Rock reveal about settlement and allotment-taking by tribal affiliation?

3.3. Individual Patterns of Allotment

In addition to examining the amount of land and the number of parcels allotted to each eligible individual by age and sex, we especially wanted to understand the geospatial pattern of those parcels, including how compact or dispersed their selections were. At Standing Rock, individuals were permitted to select their allotted acreage as a single parcel of land or several separate parcels, the latter of which may or may not have been adjacent, or even near, to each other. Several factors went into the strategy employed by each allottee in selecting their land, not least of which was the government’s express desire that allotees would become successful farmers and ranchers, a goal that usually would best be served by taking their allotments in a single parcel or, at the very least, in adjacent or nearby parcels within easy traveling distance by horse and wagon. At Standing Rock, Gunderson had approvingly stated that the majority of allottees there were taking their allotments in a “compact body” [34] (Letter of 19 June 1906). From the individual’s point of view, there were two other key factors: (1) which parcels of land did he or she desire to take, and (2) which parcels of land were available?

3.4. Family Patterns of Allotment

Because of the information on family relationships recorded in Gunderson’s allotment register, we were able to map the allotments of all the members of each nuclear family, primarily consisting of husbands and wives and their minor (17 and younger) sons and daughters, although a few others were included, such as nephews or nieces living with the family. We therefore sought to examine the patterns of concentration versus dispersal for the Standing Rock families collectively and individually. Our initial assumption was that in most cases the allotment selections of related family members would be clustered together in a compact pattern.
However, as we had described in an earlier paper [2], the people at Standing Rock had successfully petitioned for allotments to two groups that were initially ineligible: married women and later-born children. As noted above, the timing of this decision disrupted Gunderson’s orderly process of making land allotments, meaning that most of those in these two groups were allotted later than their husband and fathers, ranging in time from a few months to a year or more. The potential implication of these belated, non-simultaneous allotments to married women and later-born children was that they were less likely to be adjacent to the fathers’ allotments. Gunderson himself noted that some women and children were compelled to take allotments at some distance from their husband or father [2] (p. 425). We therefore sought to map and quantify this claim.

4. Methodology

4.1. Research Context

Making maps of allotments was always a key part of the allotment process. The duties of Special Allotting Agents included submitting large-format plat maps of the allotments they had made, in addition to registers of allotments that included the legal description of the parcel(s) selected by each allottee. As noted below, these resources, most of which are held in the U.S. National Archives and its branches, comprised a major source of information for our research.
In addition to the large-scale plat maps and allotment registers, the U.S. government also created detailed small-scale allotment maps for many reservations—these often included the name of the allottee for each parcel. Additionally, land speculators often created their own maps of allotted versus non-allotted reservation lands to be offered for sale to potential purchasers of surplus lands. Many of these allotment maps are held in the collections of the U.S. Library of Congress [35].
Beyond the creation of simple reference maps, there have been a number of efforts to map and analyze patterns of land allotment, beginning with traditional cartographic ink-on-paper methods or later by manually digitizing paper maps or photographic images using GIS software. Hoffmeister was one of the earliest to map and analyze land tenure patterns on a reservation, examining disparities in land tenure on the Consolidated Southern Ute Reservation in Colorado and Utah [36]. Later, in the 1980s, as noted above, Moore performed an early spatial analysis of allotments among the Cheyenne and Arapaho in Oklahoma [32,33]. He utilized allotment records to manually map allotments of the Cheyenne and used that dataset to analyze social connections within tribal groups using census information. Middleton [37] analyzed historical allotments of former Maidu reservation lands in northern California utilizing National Archives and local county records to trace land ownership for the Mountain Maidu in Plumas County, California. She manually constructed spatial features of allotments using GIS to follow the historical lineage of land ownership of original Maidu allotted lands. Greenwald [38,39], in her comparative studies of the experiences of the Nez Perce, Jicarilla Apache, and Cheyenne River Sioux tribes, analyzed allotment era land maps and employed a manual digitizing technique to generate spatial data of allotment patterns. However, she noted the difficulties and limitations of manually digitizing allotments, as well as obstacles presented by a lack of data for some reservations of interest [40].
Palmer [41] later employed a mixture of manual digitization of historical maps as well as modern land ownership data for the Kiowa tribe of Oklahoma to examine the loss of Kiowa allotted lands. Kretzler and the Grand Ronde Land Tenure Project developed GIS data for allotments at the Grand Ronde reservation in Oregon [42,43]. Working with the Grand Ronde tribal Historical Preservation Organization, the team was able to retrieve and digitize maps and other archival documents of historical land tenure on the Grand Ronde reservation to create a digital database of land allotments for visualizing allotment patterns and understanding the loss of allotment lands.
All of these previous allotment studies utilized manual methods to generate maps or, in the more recent studies, to create GIS spatial data of Indian lands. However, within the past few years, several studies have made advancements in combining archival information with digital data to map allotments. Egbert and Smith [44] used a commercial software extension for ArcGIS to map and explore Kickapoo allotments in Kansas. Allen [45] used the same method to map and analyze allotments on the Omaha Reservation in Nebraska, as did Sun Eagle [33] on the Pawnee Reservation in Oklahoma. Dippel and Frye [46] and Dippel et al. [47] utilized a different technique and data source to map Indian lands, using land records obtained from the Bureau of Land Management (BLM) General Land Office (GLO) online database and matching the allotment information to Public Land Survey System (PLSS) quarter-section 160-acre units. More recently, we described a new mapping technique that largely automates the process of generating GIS data down to the smallest parcel level for Indian allotments by using PLSS survey data and BLM land ownership records, supplemented by information from archival records of allotments [1]. The Pine Ridge Land Information System [48], developed by Village Earth in partnership with the Oglala Sioux Tribe, includes original allotment maps and allows users to search for land parcels using Tract ID.

4.2. Study Area

The Standing Rock Reservation lies in North and South Dakota and comprises approximately 2.3 million acres (0.93 million ha). The topography is primarily characterized by rolling hills, with areas of eroded outcrops known as badlands and significant river valleys formed by the Missouri, Grand, and Cannonball Rivers. As we noted on p. 415 of [2]: “The continental semi-arid climate experiences an average of 16 to 17 inches (40.6 to 43.2 cm) of precipitation annually and has wide diurnal and annual temperature swings. Natural vegetation consists almost entirely of shortgrass prairie, with meager stands of timber along rivers and streams” (see, e.g., [49,50]). Four tribal groups were settled on the Standing Rock Reservation, two each from the Dakota and Lakota Nations; these will be discussed further below.

4.3. Data and Methods

The data and methods used to develop the underlying spatial database of allotments are fully described in [1]. We summarize them briefly here but recommend that the interested reader consult that article for full details. In short, two primary types of data sources were combined in a novel method to create a cadastral database of allotments: (1) a digital GIS database of the U.S. Public Land Survey System (PLSS) for the Standing Rock Reservation and (2) archival (pen and paper) and digital records of land allotments made to individuals at Standing Rock. We developed a semi-automated method to refine and subdivide the digital PLSS survey database to include as many of the allotment parcels as possible, including the smallest parcels and those of irregular sizes. For the attribute database, the archival register of allotments kept by Carl Gunderson at Standing Rock [34] was transcribed and combined with the digital land ownership database of the U.S. Bureau of Land Management [51], each having its unique qualities. The allotment number of each allottee and the legal description of each land parcel were used to join the survey and attribute databases. Finally, the tribal affiliation of each allottee was added to the attribute data by referring to censuses conducted at Standing Rock [52] in the 1880s and early 1890s, using an individual’s name, age, gender, and any other identifying information from the allotment register as lookup references.
With the allotment database in place, we were now able to query and map patterns of allotments at a granular (i.e., down to individual parcels) scale, including for individuals and families, as well as tribal groups. Since allotment numbers were assigned in order of allotment, we were able to map spatio-temporal patterns of allotment-making, including creating animations over time, as well as annual patterns of progress. And, since Gunderson had recorded the age, sex, and relationship category—e.g., husband, wife, widow, son, daughter—of every allottee, we could map the patterns of those categories of people in detail as well. Furthermore, we were able to map and visualize the compact or dispersed nature of allotment parcels selected by individuals and families, especially focusing on the impact created by the making of belated allotments to wives and later-born children.
To prepare our data for analysis, we calculated centroids for several categories of allotment recipients. We began by calculating the centroid of each allotment parcel comprising a person’s allotment. We then calculated the overall centroid of each person’s allotment (a centroid of centroids). Once that was complete, we used matching relationship numbers in our allotment database to calculate distances between the centroids of allotments of various categories of interest, i.e., husbands to wives, fathers to pre-cutoff children, and fathers to later-born children. We calculated descriptive statistics (mean, median, standard deviation, interquartile range, and others) of the distances between allotment centroids. Next, we created frequency distribution charts of distances between the categories of allotment recipients (e.g., husbands to wives) to complement maps of the same categories.
One way to measure the degree of clustering or dispersal of related features in a landscape is to calculate the standard distance [53]; this can be done, for example, with fire stations, grocery stores, or banks in a city to obtain a relative measure of how compact or dispersed the features in those categories are. Standard distance is calculated using the distance from the centroid of each land parcel for a given category to the mean center of those parcels. The formula for standard distance is shown in Figure 3.
The result is an output feature class consisting of a circle centered at the mean center, where the circle’s radius is the standard distance. For this study, we calculated standard distance in km for all individuals and for all nuclear families (husband, wife, and children) and created frequency distribution graphs for each.
In addition to graphs of distance and standard distance metrics, we created numerous maps to serve as visualization tools. The maps provided visual confirmation of the statistical results. All GIS processing for this study was conducted using ArcGIS Pro 3.4.0. (the earlier development of our semi-automated allotment mapping methodology used ArcGIS Desktop 10.4). We used the USA Contiguous Albers Equal Area Conic map projection (WKID 102003) based on the North American Datum of 1983. To facilitate tabular analysis, we exported tables from ArGIS Pro to Microsoft Excel for calculating distance and descriptive statistics.

5. Results and Discussion

5.1. Overall Patterns of Allotment

A summary of annual allotments made by Gunderson and his crew is shown in Table 1 (see also Figure 2). Because of Gunderson’s late start in 1906, he was only able to make 871 allotments that year, but in the following year he nearly doubled that number to 1623, and completed most of his remaining work in 1908, with 1274 allotments. Gunderson finished up his work by making only 258 allotments 1909 and very early 1910. In addition, 673 further allotments were made in the next several years by Gunderson’s successors until they were discontinued when sales of surplus lands began.
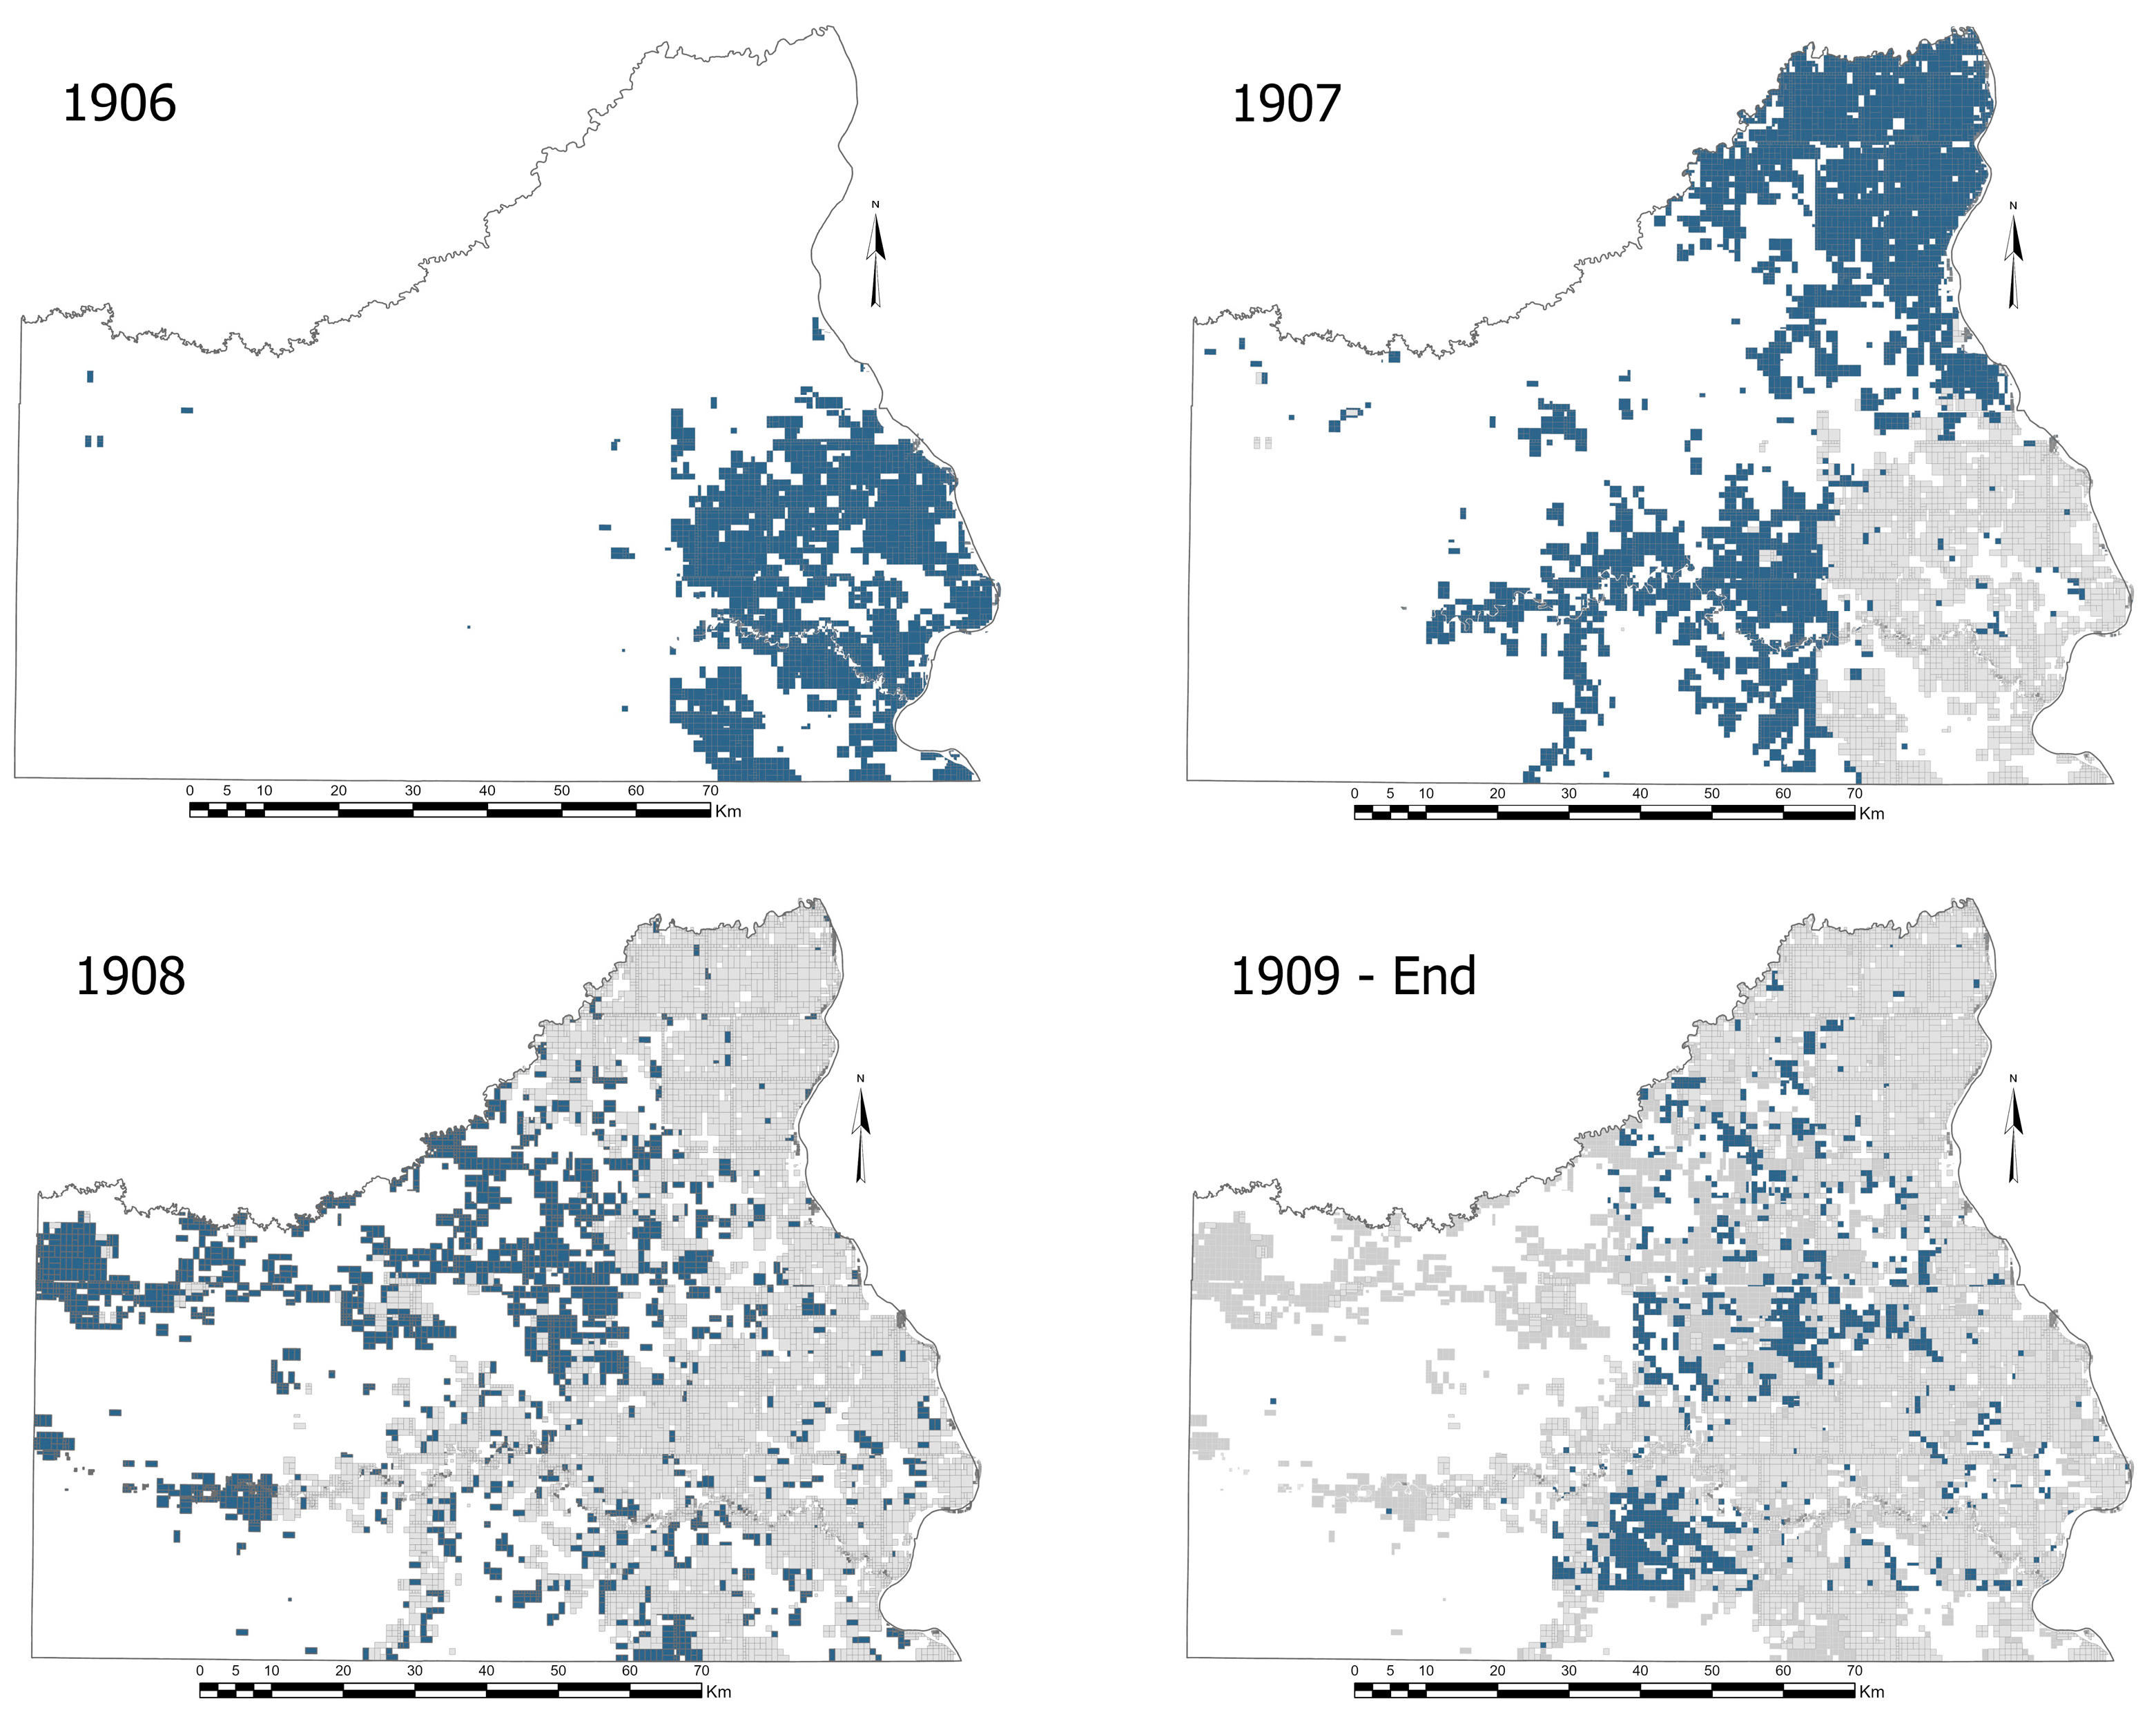
All told, records available to us showed that allotments were made to 4699 individuals at Standing Rock, consisting of 10,996 separate parcels totaling 1,342,751 acres (543,392 ha). The broad spatio-temporal pattern of allotment making by Gunderson and his crew can be seen in Figure 4. As noted earlier, he proceeded in an orderly pattern, beginning in the southeast corner of the reservation in 1906. In 1907, he continued moving westward in the South Dakota part of the reservation, moving to a certain point along the Grand River until he and his crew shifted to the northeast region of the reservation in North Dakota. He and his crew continued moving westward in the northern and then the southern reaches of Standing Rock in 1908 until they reached the western boundary of the reservation. There was also some infilling of allotments in the east in 1908, where the land had earlier been surveyed and allotments made. A significant change in patterns can be seen in 1909 and later, where allotments entirely consisted of infilling of the previously allotted eastern part of the reservation; almost no allotments at all were made in the vast empty areas in the west and in a swath along the south during that final period. The cause of this was the creation of a “Diminished Reserve” in the eastern part of the reservation on 1 January 1909, discussed further, below.
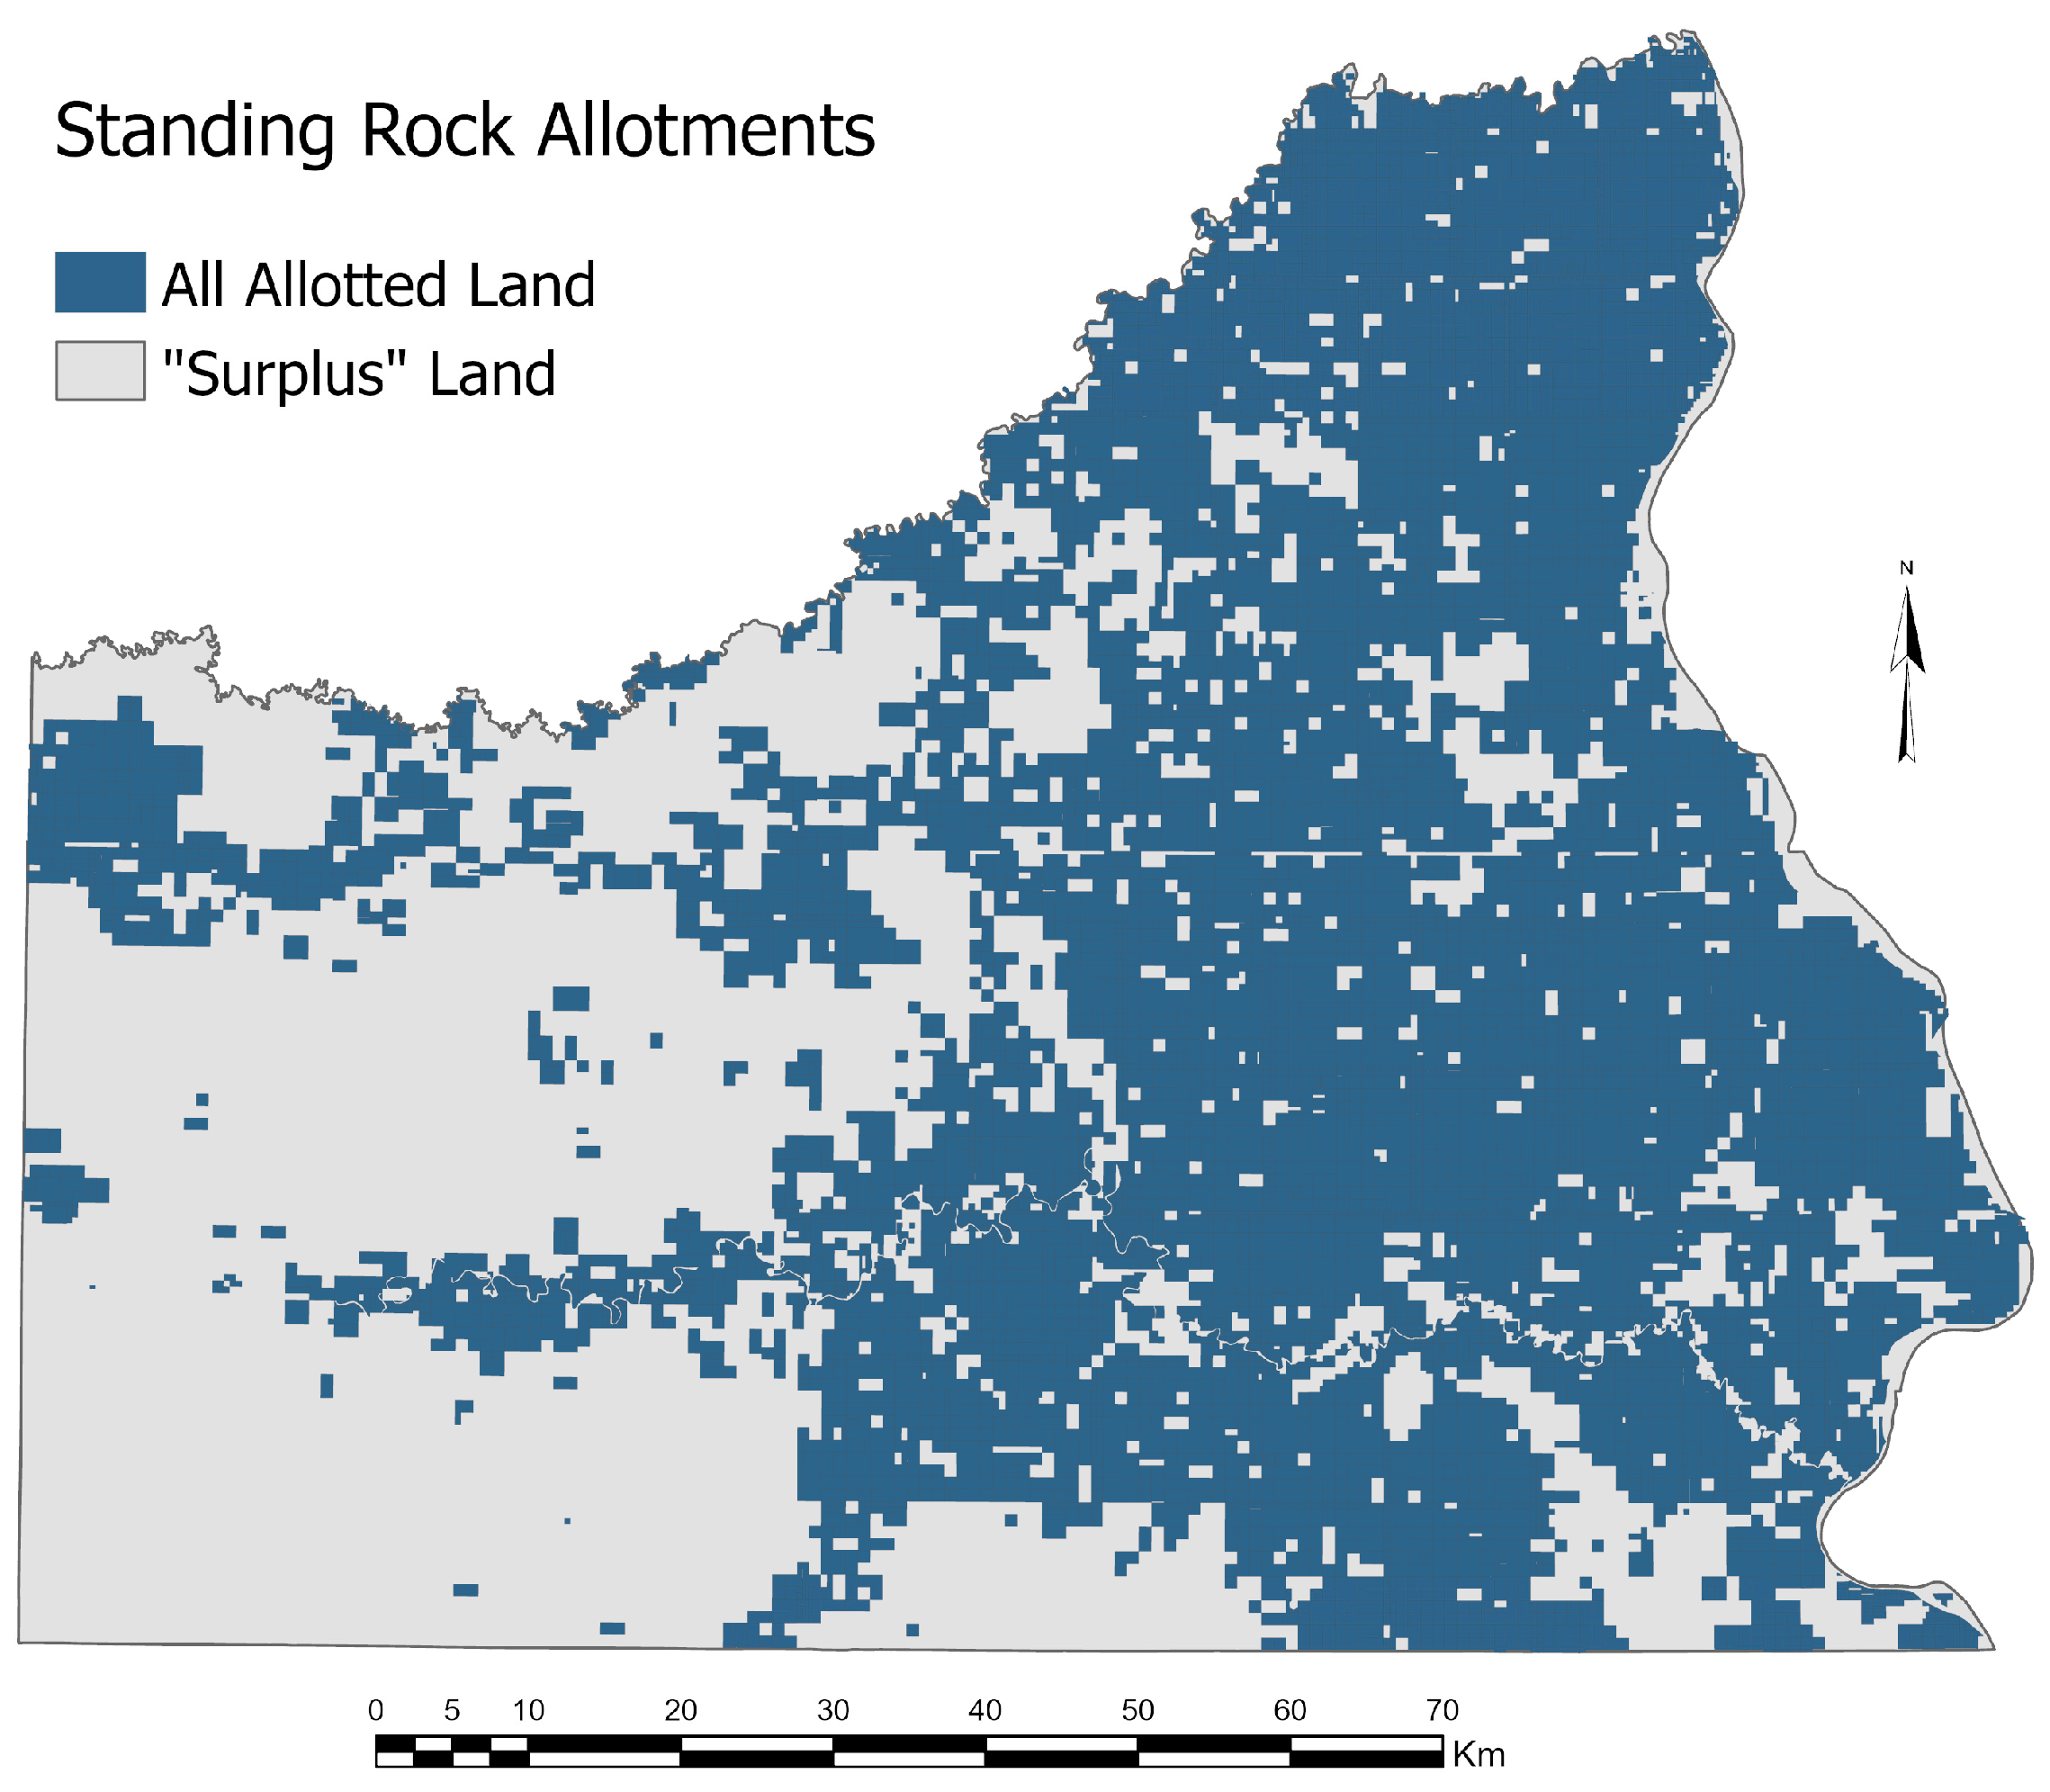
The final overall pattern of all allotments at Standing Rock is revealed in Figure 5. As noted earlier, by the time allotment came to be implemented, the people at Standing Rock had lived on the reservation for several decades and were well established in their patterns of settlement and livelihood. Since the allotment instructions to Gunderson specified that each person “should be allowed to select his land so as to retain improvements already made” [27] (p. 3), it can reasonably be assumed that the allotment map represents, in large part, the existing settlement patterns on the reservation. In turn, factors that impacted their original settlement preferences likely can be viewed as reflecting attitudes concerning both the physical and cultural environment. Those relating to the physical geography would have included such factors as access to timber and water, the quality of vegetation for grazing, or the quality of soil for raising gardens and crops, climate conditions, and natural shelter from the elements. Cultural factors no doubt would have focused on the proximity of family and fellow tribal members, access to agency offices for provision of resources, the availability of trails and roads, and many others.
As might be expected, however, the overall pattern of allotments themselves was a reflection not only of the existing settlement patterns and preferences of the people but of the conditions and terms of allotment imposed by the U.S. government. One of those conditions was the rectangular Public Land Survey System (PLSS) that was employed to survey not only Dakota Territory, but virtually all of the western U.S. [54]. Except in rare cases, such as along significant rivers or water bodies, every parcel of land in the PLSS had rectangular boundaries that ran in north–south and east–west directions regardless of terrain, hydrography, roads, or other existing physical or cultural features. Thus, the allotment map of Standing Rock is almost entirely a large agglomeration of rectangular blocks of land varying in size from 10 acres (4.0 ha) up to 640 acres (259 ha), a pattern easily visible in Figure 6. A second aspect of conditions and terms dictated by the government were the specific allotment policies applied at each reservation. Those rules, covered more fully in [2], primarily related to who was eligible to receive an allotment based on age, sex, and marital status as of a given date, and how much land each person was entitled to receive depending on the category to which they belonged.
A third, and critically important, factor at Standing Rock, as noted above, focused on significant concessions and modifications that the tribe, in concert with the Special Allotting Agent and officials at the Office of Indian Affairs, were able to obtain through an act of Congress. These included the equitable allotting of timber separately from regular allotments and the awarding of allotments to married women and to later-born children, i.e., children born after the President’s authorizing letter dated 26 September 1905.
Thus, the overall pattern of allotment seen in Figure 5 represents the preferences of the allotment recipients as constrained by the government’s terms and conditions. It partially reflects the established settlement pattern, but it also represents the secondary choices that people were forced to make when the land they might have preferred was not available for selection. We discuss this in greater detail in following sections.
Perhaps a comment about land or perceived land quality in the following discussion of results would be appropriate here. In his correspondence, Gunderson frequently commented on the quality of land that a person selected for his or her allotment, e.g., that a person had selected land that was “good” quality or “bad” quality. Since he supported the assimilation concept of Native people becoming farmers and ranchers, it can be assumed that his concept of good quality land included such factors as nearness to resources like water and timber and the quality of the soil or vegetation as indicators of a parcel’s potential quality for raising crops or grazing cattle. Nevertheless, we do not know exactly what he might have meant or what factors people themselves considered when taking their allotments. Since performing an analysis of factors that might have influenced land selections is outside the scope of this paper, we accept Gunderson’s perceptions of land quality, acknowledging that there is a large degree of uncertainty involved.

5.2. Allotment Concentrations by Tribe

As noted above, earlier research on a few reservations has shown that allotment patterns reflected clustered settlement patterns of tribal or band groupings within the people living on the reservation. Moore [32,33] wrote extensively about the Cheyenne and Arapahoe Tribes of Oklahoma, creating hand-drawn maps and performing analyses of demographics, which included a spatial analysis of kinship. Moore utilized the “Indian Schedules” of the U.S. decennial census to map tribal band settlement patterns within the Cheyenne and Arapahoe reservation, revealing that the distribution of personal allotments strongly suggested that members of families, lineages, and bands took their land in patterns that symbolized relationships to one another.
Also as noted above, Kretzler [42,43] studied the use of GIS by the Tribal Historical Preservation Office of the Grande Ronde reservation in Oregon for their Land Tenure Project. Among other things, he found that “the first post-removal map of Grand Ronde [in 1856] indicates that the founding reservation population established band- and tribe-specific encampments” [42] (p. 53). Our colleague, Cheyenne Sun Eagle [31], analyzed allotment patterns on the Pawnee Reservation in Oklahoma using GIS allotment mapping tools and methods described in [1]. In examining the archival allotment register, she discovered that special allotments had been set aside for four cemeteries, one for each of the four Pawnee bands (Skidi, Chowee, Pet-a-how-er-at, and Kit-Ka-Hock) that had been settled there after their move from their homeland in central Nebraska in 1874–1875 [55]. Since the cemeteries were at some distance from each other, she hypothesized that the cemeteries might be an indication that the Pawnee bands had settled in clustered patterns, similar to what Moore had found with the Cheyenne and Arapahoe. Her GIS analysis confirmed the relationship, as she noted: “Band affiliation was a part of the Pawnee identity and lifestyle, a structure they maintained through their removal and allotment selections, as noted earlier. In terms of allotment selection, it would seem that the influence of the bands determined the general area of the reservation a family or clan would have selected” [31] (p. 41).

5.2.1. Clues from the Historical Record at Standing Rock

As noted elsewhere, permanent or semi-permanent settlement had existed at Standing Rock for some time, even prior to reservation formation, and well ahead of the implementation of allotment in 1906. It is well documented in Indian Agent reports that by the time of allotment the people at Standing Rock had permanent residency on family-owned parcels where extended families lived either together or nearby and utilized shared resources. The reports also noted the settlement patterns of the four tribes on the reservation: two Dakota tribes (the Upper Yanktonai (Ihanktonwana) and Lower Yanktonai (Hunkpatina)), and two Lakota tribes (the Hunkpapa and the Sihasapa or Blackfeet Sioux).
For example, in 1871, the Indian Agent noted:
“[T]he Lower Yanktonai Indians have cultivated nearly 200 acres on the eastern side of the Missouri River, about 40 miles above the agency. The Blackfeet Sioux also cultivated one hundred acres of land near the Moreau River, about 25 miles south of the Agency. The Upper Yanktonai wish to farm at a spot fifty miles above the agency on the west side of the river”.
[56]
This statement by the local Indian Agent, coming half a decade before the Battle of Little Bighorn (1876), nearly twenty years before statehood (1889), and 35 years before allotment (1906), clearly states that the various tribes in the area were establishing permanent or semi-permanent areas of occupation and settlement in distinct and separate geographic regions of the reservation.
The next year, in 1872, the Agent mentioned the Hunkpapa had “planted [settled] in the vicinity of the agency near the Grand River, which they claim as their home” [57]. Over a decade later, in 1883, Standing Rock Agent James McLaughlin noted that “every family of this agency has been cultivating small fields this year” [58], implying that farming coincided with permanent homesteads for tribal members. The report from 1885 notes that the original settlement pattern for the four tribal groups still persisted, with the two Yanktonai tribes living in the northern part of the reservation, and the Sihasapa and Hunkpapa in the southern portion [59].
These settlement patterns may be attributed to several spatial and cultural factors. First and most important was the establishment and breakup of the Great Sioux Reservation. The Great Sioux Nation had been a contiguous area of land held in common by the various tribes of Lakota and Dakota people that occupied it. These different tribal groups settled within this larger reservation according to their needs, customs, alliances, and homelands. When the Great Sioux Nation was split into several smaller reservation areas and as various tribes were relocated onto the new reservations, it was sometimes the case that several different tribes would end up sharing one of the new reservations. The Yanktonai tribes at Standing Rock were relocated from the east and from the north, originally settling along the Missouri River as an agrarian community. On the other hand, the Lakota speaking tribes were relocated from the south. These patterns are reflected in the descriptions of the Indian Agents in their annual reports. It should be noted that there were also members of several other tribes living on the reservation, and a fairly large number for whom no tribal affiliation was provided in the census records.

5.2.2. Mapped Patterns of Allotments by Tribe

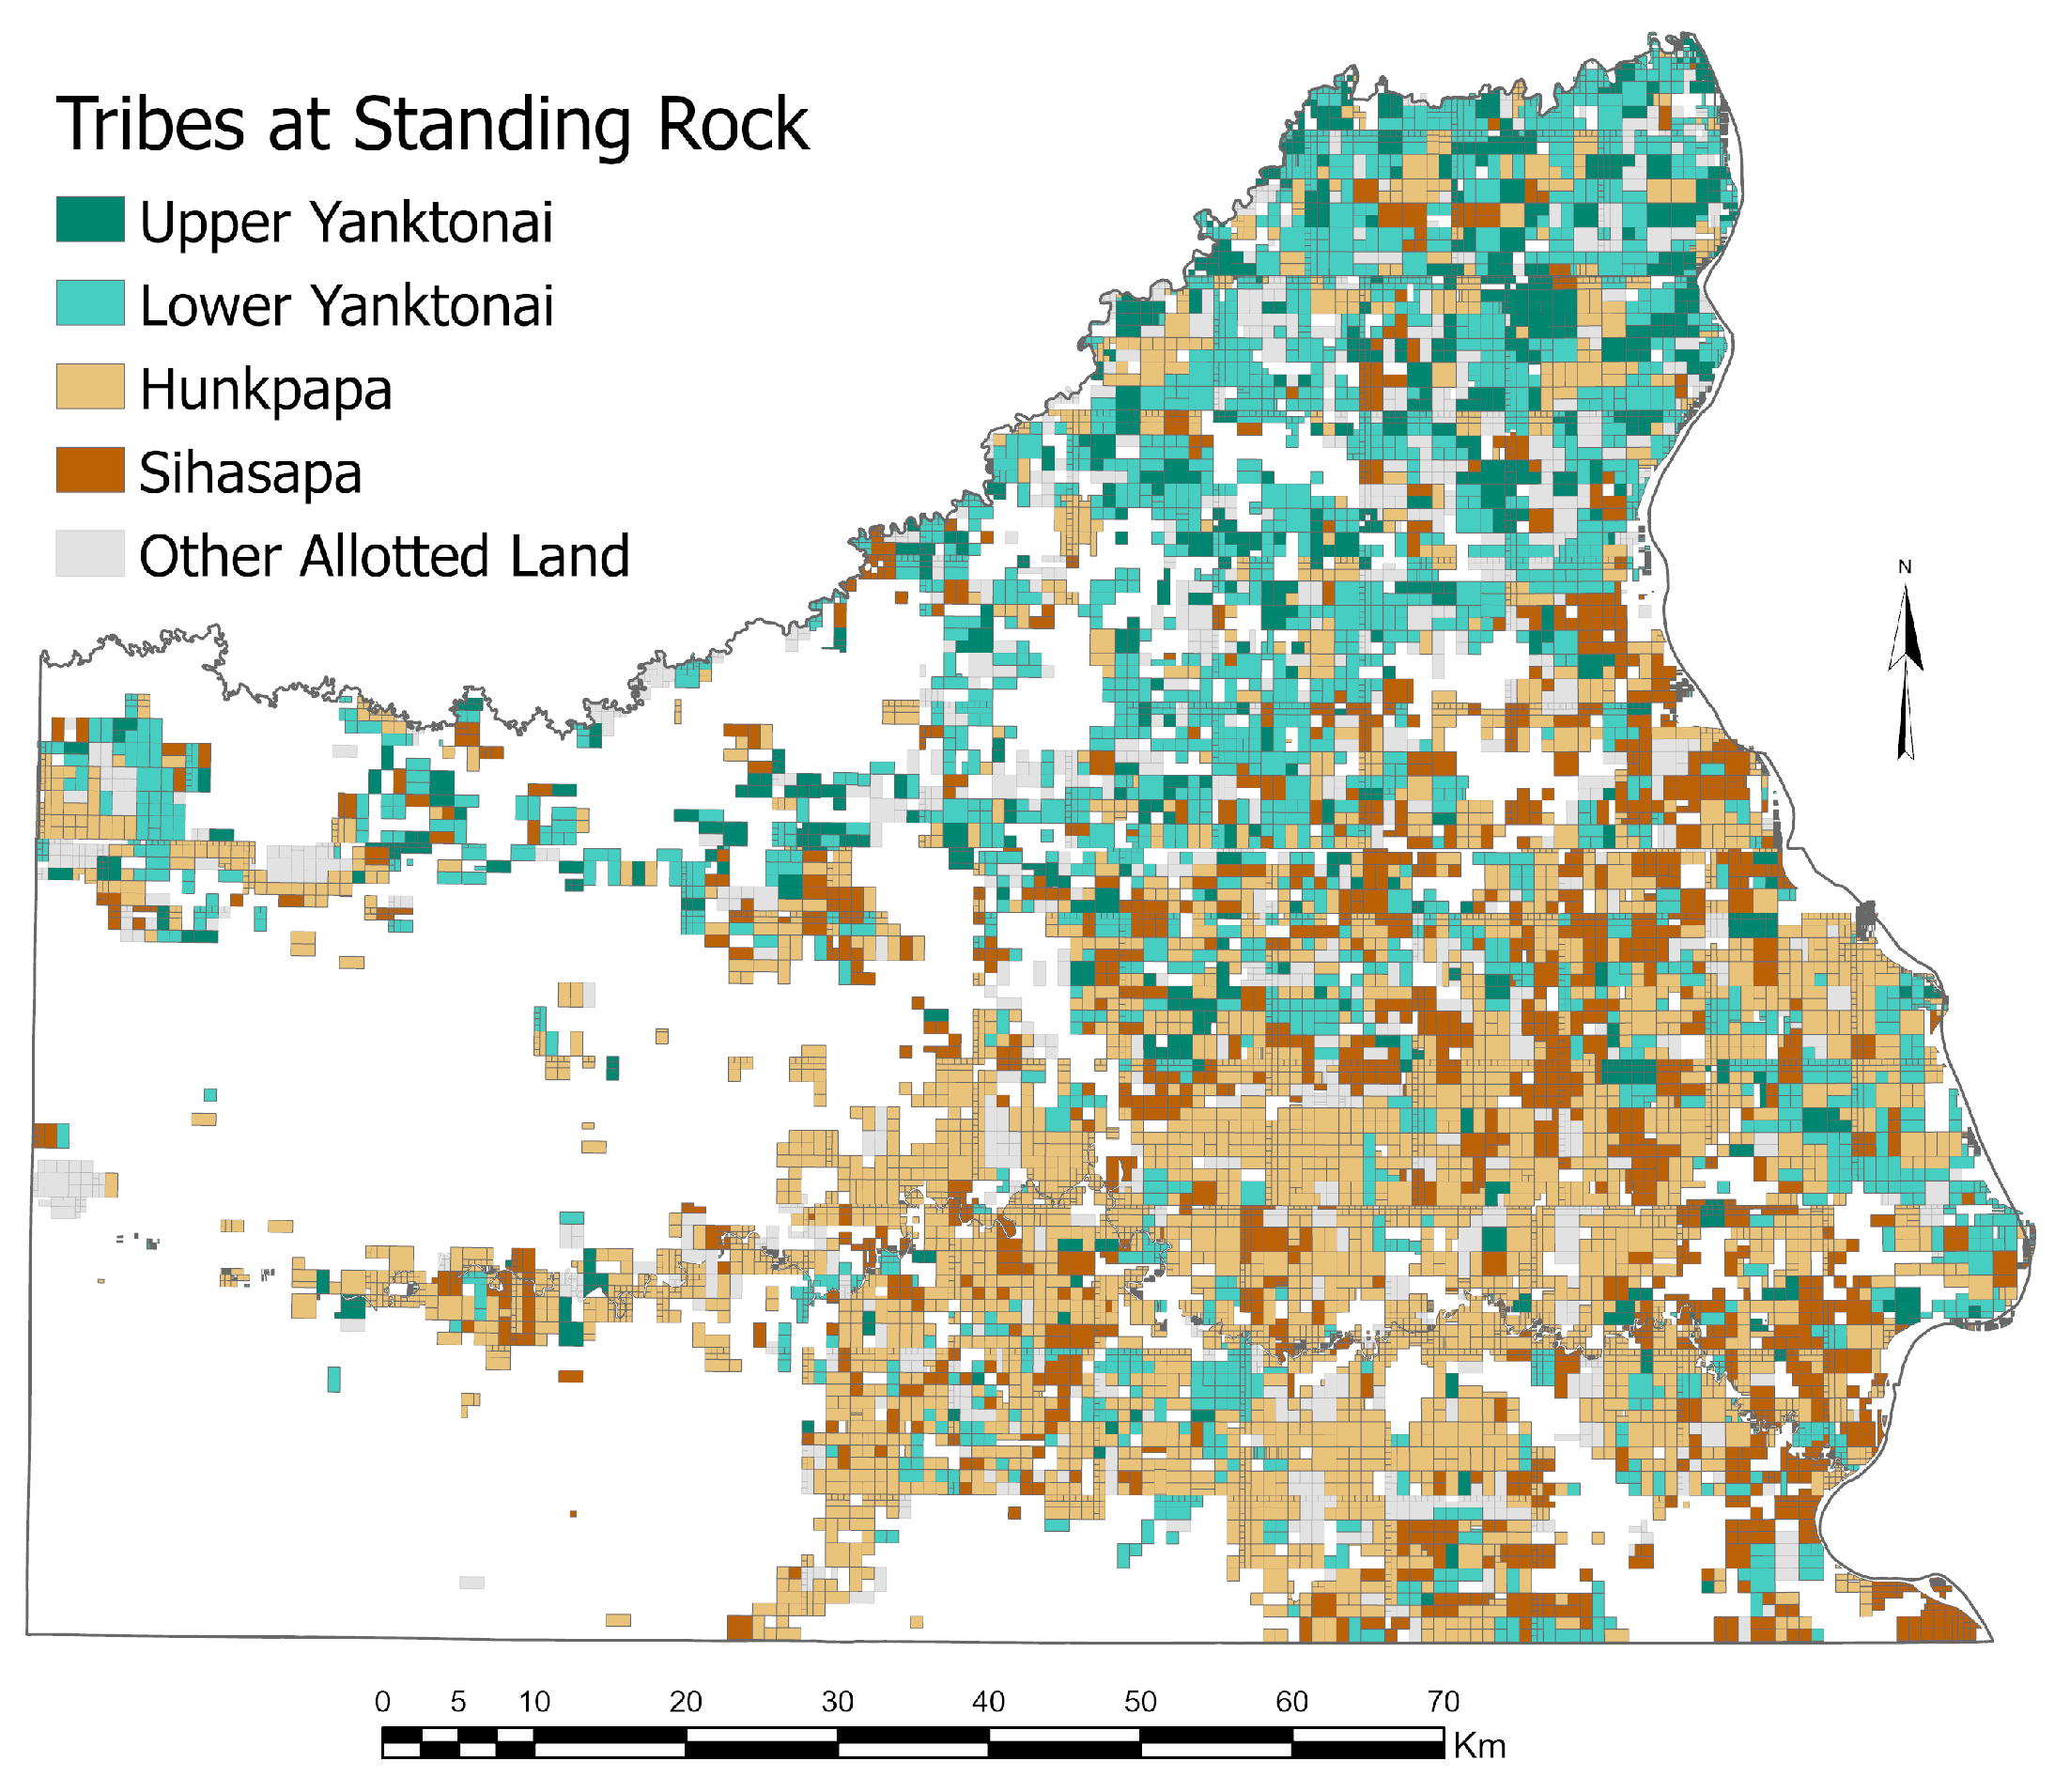
Given the comments by the Standing Rock Indian Agents about the pre-allotment settlement areas of the four tribal groups, we hypothesized that allotment selection patterns would reflect these tribal concentrations. In our analysis we first totaled the number of allottees and the amount of land allotted for members of each of the four tribes, as well as for those belonging to other tribes or whose affiliation could not be determined, and normalized them as percentages (Table 2). The Hunkpapa (36%) and their fellow Lakota speakers, the Sihasapa (17%), comprised 53% of allottees, while the Lower Yanktonai (25%) and fellow Dakota speakers, the Upper Yanktonai (9%), made up 34%. Fourteen percent of the land was allotted to members of other tribes or to persons whose tribe could not be determined. As can be seen in the table, the land allotted to each group was in direct proportion to its percent of the total population of the reservation.
With tribal affiliation added to the GIS attribute table, we were able to map the locations of the allotments for each of the four major tribal groups (Figure 7). This made it easy to visualize whether, and to what extent, their spatial concentrations matched the descriptions given by the Indian agents in their earlier reports, i.e., the Lower Yanktonai and Upper Yanktonai in the north and the Hunkpapa and Sihasapa generally in the south. These results are important because they confirm that that the people generally remained concentrated in their original settlement locations on the reservation, albeit with substantial intermingling. It also adds to the evidence that allottees on the whole were able to select land that corresponded to their preferred locations.

5.3. Allotment Patterns of Individuals

Individual patterns of allotment may be viewed in a variety of ways: for example, in terms of the amount of land allotted to individuals and to categories of allottees, the number of parcels an individual selected, and how contiguous or dispersed those parcels were.

5.3.1. Land Allotted to Individuals by Sex and Age

Table 3 shows the allotments made to individuals by age and sex category: adult men (18 and older), boys (17 and younger), adult women (18 and older), and girls (17 and younger). As expected, the mean amount of land awarded to boys and girls was virtually identical: 168 acres (68.0 ha) for boys vs. 166 acres (67.2 ha) for girls. On the other hand, adult men averaged 521 acres (210.8 ha) per allotment while adult women averaged only 343 acres (138.8 ha). Nearly all adult men, with the exception of single men, received 640 acres (259.0 ha) each as specified in the allotment instruction letter, while the majority of women, notably both married and single adult women, received only 320 acres (129.5 ha). Thus, while married women did benefit by the Act of Congress that granted them 320 acres, they still only received half as much as their husbands, and the long-term consequences were suffered by individuals, families, and the tribes at Standing Rock.
Further examination of the age, sex, and relationship categories of allottees tells a much more detailed and complete story about allotments to females at Standing Rock (Appendix B). In the girl category (17 and younger), we discovered that there were wives, mothers, and even widows under the age of 18 (though very few in number). On the other hand, nearly all adult women belonged to categories that gave them 320 acres. The only adult women who appear to have generally received 640 acres (the amount awarded to male heads of household) included those designated as heads, presumably meaning adult women, divorced or widowed, who had children at home with no father present, and the two women who were wives of white men.

5.3.2. Number of Parcels per Allottee

As noted earlier, 10,996 parcels in total were allotted to 4699 individuals, meaning that each individual’s allotment, on average, consisted of 2.3 parcels. Averages rarely tell the whole story, of course. As the Indian Office had hoped, and as Gunderson was happy to report, the majority of individuals at Standing Rock (64.8%) took their allotments as a single parcel [34] (Letter of 19 June 1906). Another 28.8% selected between two and six parcels, and the remaining 6.8% selected seven parcels or more (Table 4). In fact, six people had over 20 parcels, with 29 being the highest recorded number.
The selection of multiple parcels by an individual rather than a single parcel may have been a reflection of one or more factors. The first was simply that an individual desired land in more than one location. For example, a person may have wanted land near his extended family’s area of residence but another parcel or group of parcels farther away with better soil or access to water. Another reason for multi-parcel allotments was that in some cases there were overlapping or conflicting claims or requests for the same parcel(s) of land. Unsurprisingly, Gunderson’s correspondence reveals that conflicting requests for land were not uncommon and a significant part of his labor consisted of trying to reconcile those conflicts (e.g., [34] (Letter of 1 September 1906)). The resulting compromises often required the contending parties to select multiple land parcels to make up the total acreage of their allotments.
One final factor had to do with the nature of the Public Land Survey System (PLSS), which plots a flat rectilinear grid onto the non-flat surface of the earth, an oblate ellipsoid. The grid consists of 6-mile by 6-mile squares called townships, with each township containing 36 one-mile by one-mile squares (1.6 km by 1.6 km) called sections (see Appendix A in [1] for a full description). However, since the PLSS grid must be adapted to baselines and central meridians in geographic (latitude and longitude) coordinates, there is inevitably a mismatch between the two systems, frequently creating leftover fractions of land at margins of each township. These fractional areas are divided into rectangular parcels called government lots which vary in size and deviate from standard subdivision sizes (e.g., 40 acres (16.2 ha)). Furthermore, irregularly shaped government lots can also be found along the boundaries of rivers or water bodies. Therefore, it was sometimes the case that a person’s preferred land was located in an area divided into small government lots, which would require the selection of multiple (sometimes a large number of) contiguous parcels to make up the total authorized allotment acreage (an example of government lots can be seen in Appendix A).

5.3.3. Patterns of Individual Allotments

As noted, one of the desires of the Indian Office and of allotment advocates in general was that individuals would, wherever possible, take their allotted land in a single parcel, or at least in adjacent parcels. In fact, the letter of instruction to Gunderson specifically stated that, “The tracts given to each allottee should ordinarily be contiguous, but he may to allowed to select detached tracts in order to give him a proper proportion of Wood land, or water privileges” [27] (Letter of 10 October 1905). This arrangement had two advantages from the government’s point of view. First, it made all the land for each allottee accessible and more easily managed for purposes of farming or ranching. After all, the stated goal of allotment was to encourage Native Americans to become successful farmers and ranchers as a means of becoming assimilated into the dominant culture. A second, and more practical factor, was that it made the allotment process significantly easier and more efficient for the Special Allotting Agent.
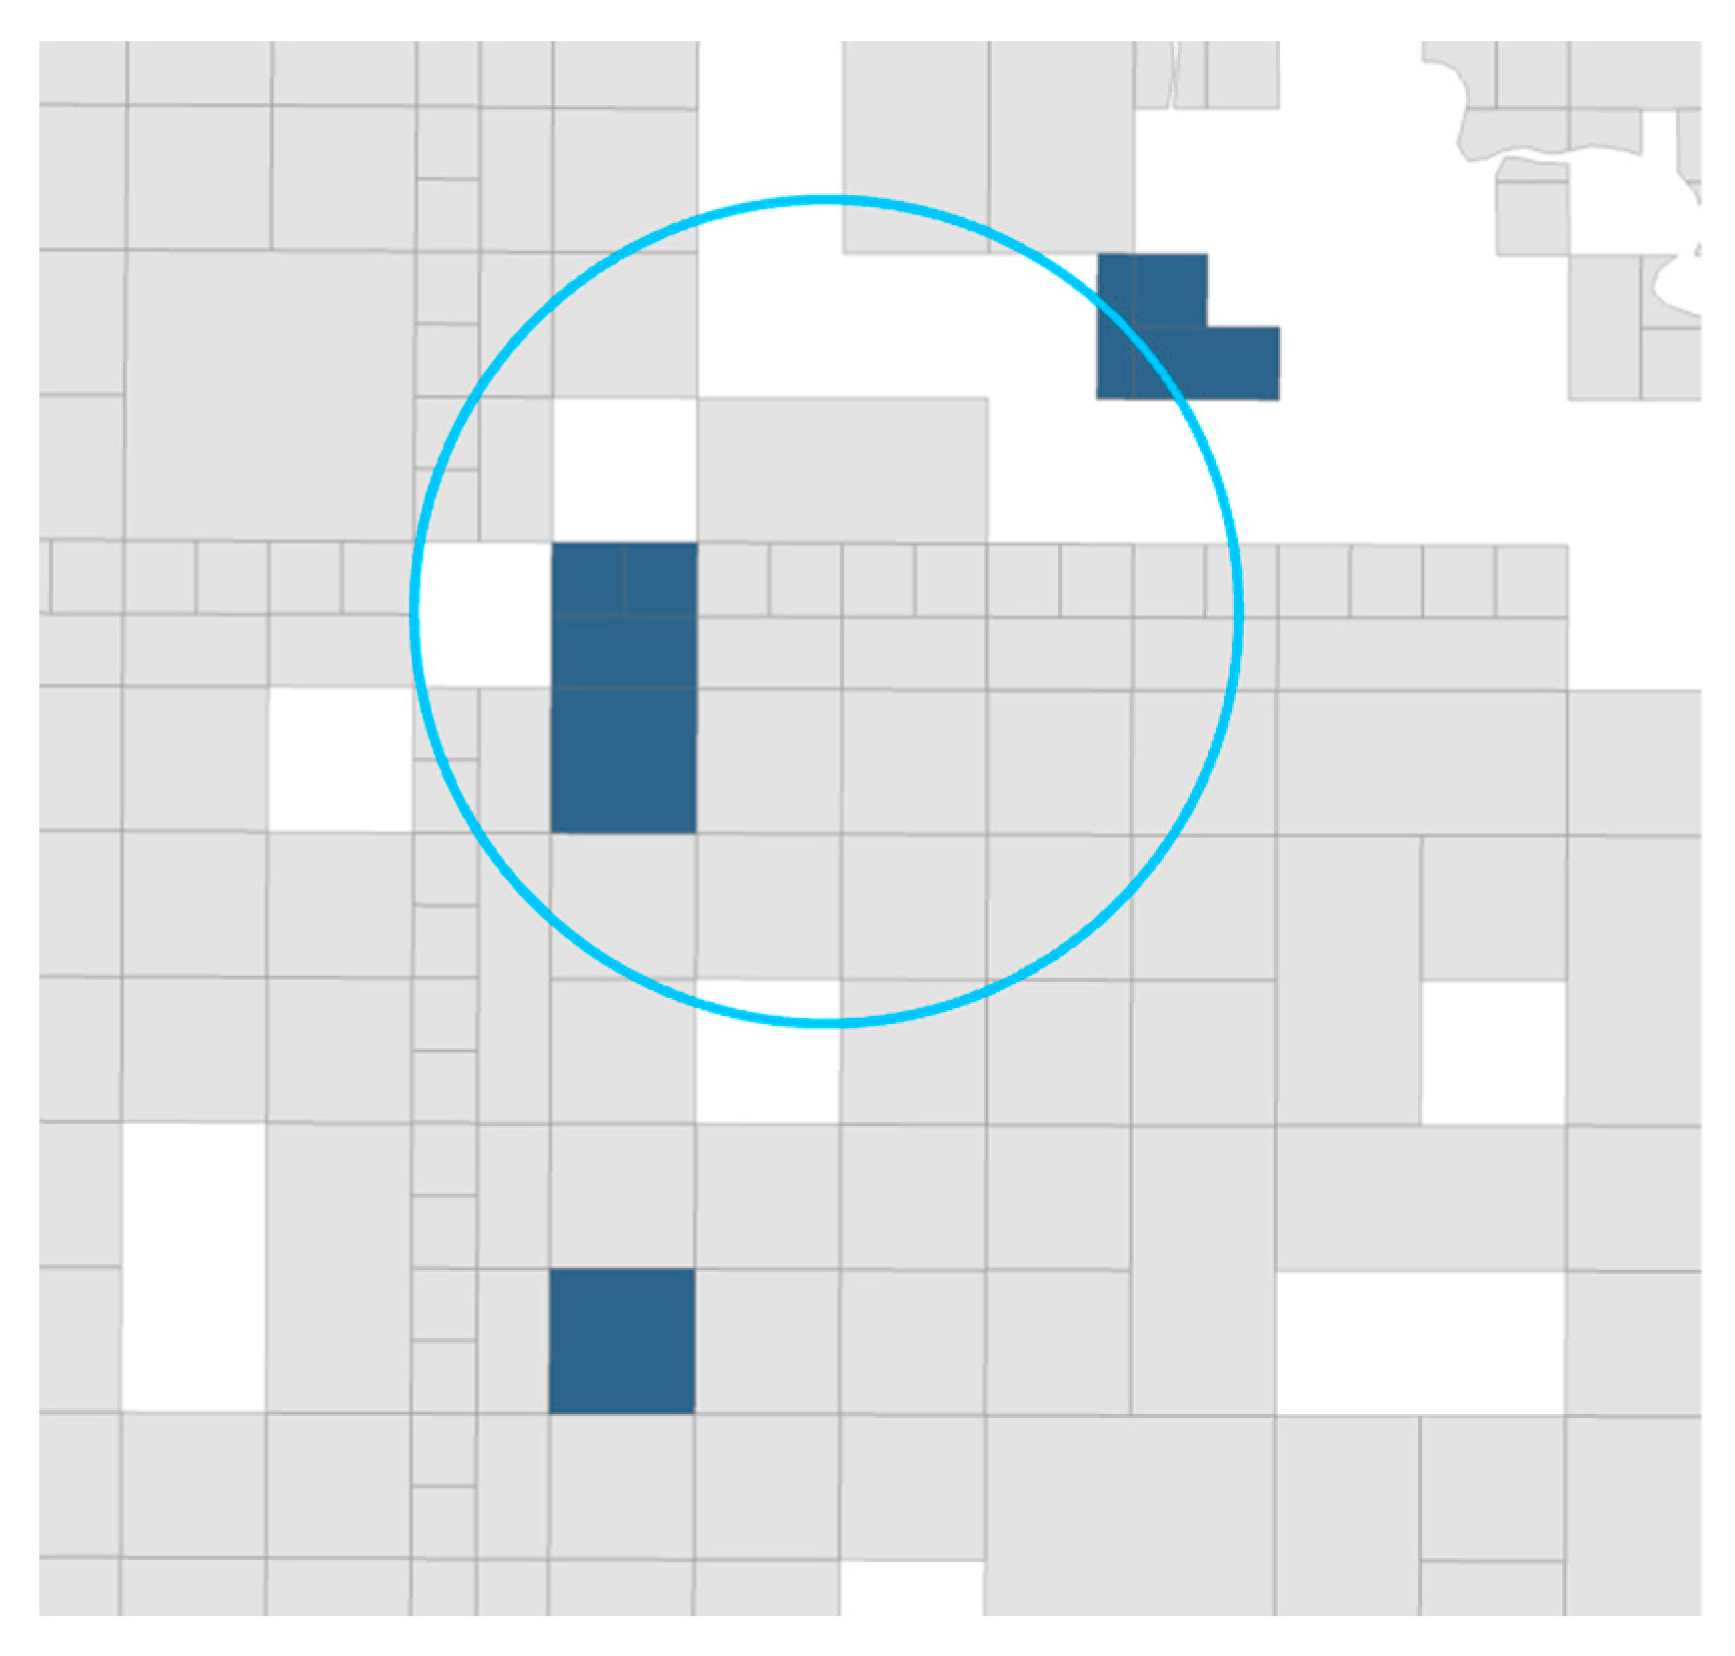
One of our working hypotheses was that mapping the parcels selected by individual allottees would confirm Gunderson’s claim that people were selecting their allotments in a “compact body” [34] (Letter of 19 June 1906). As noted above, standard distance provides a useful measure of clustering versus dispersal. For each individual, we calculated the standard distance for the parcels comprising that person’s allotment. In this case, we calculated the standard distance between land parcels for each individual allottee who selected three or more parcels (standard distance cannot be calculated for the cases of only one or two parcels). As an example, Figure 8 shows the allotment parcels (dark blue) selected by Brave Crow, with the 1 standard deviation standard distance circle superposed (light blue).
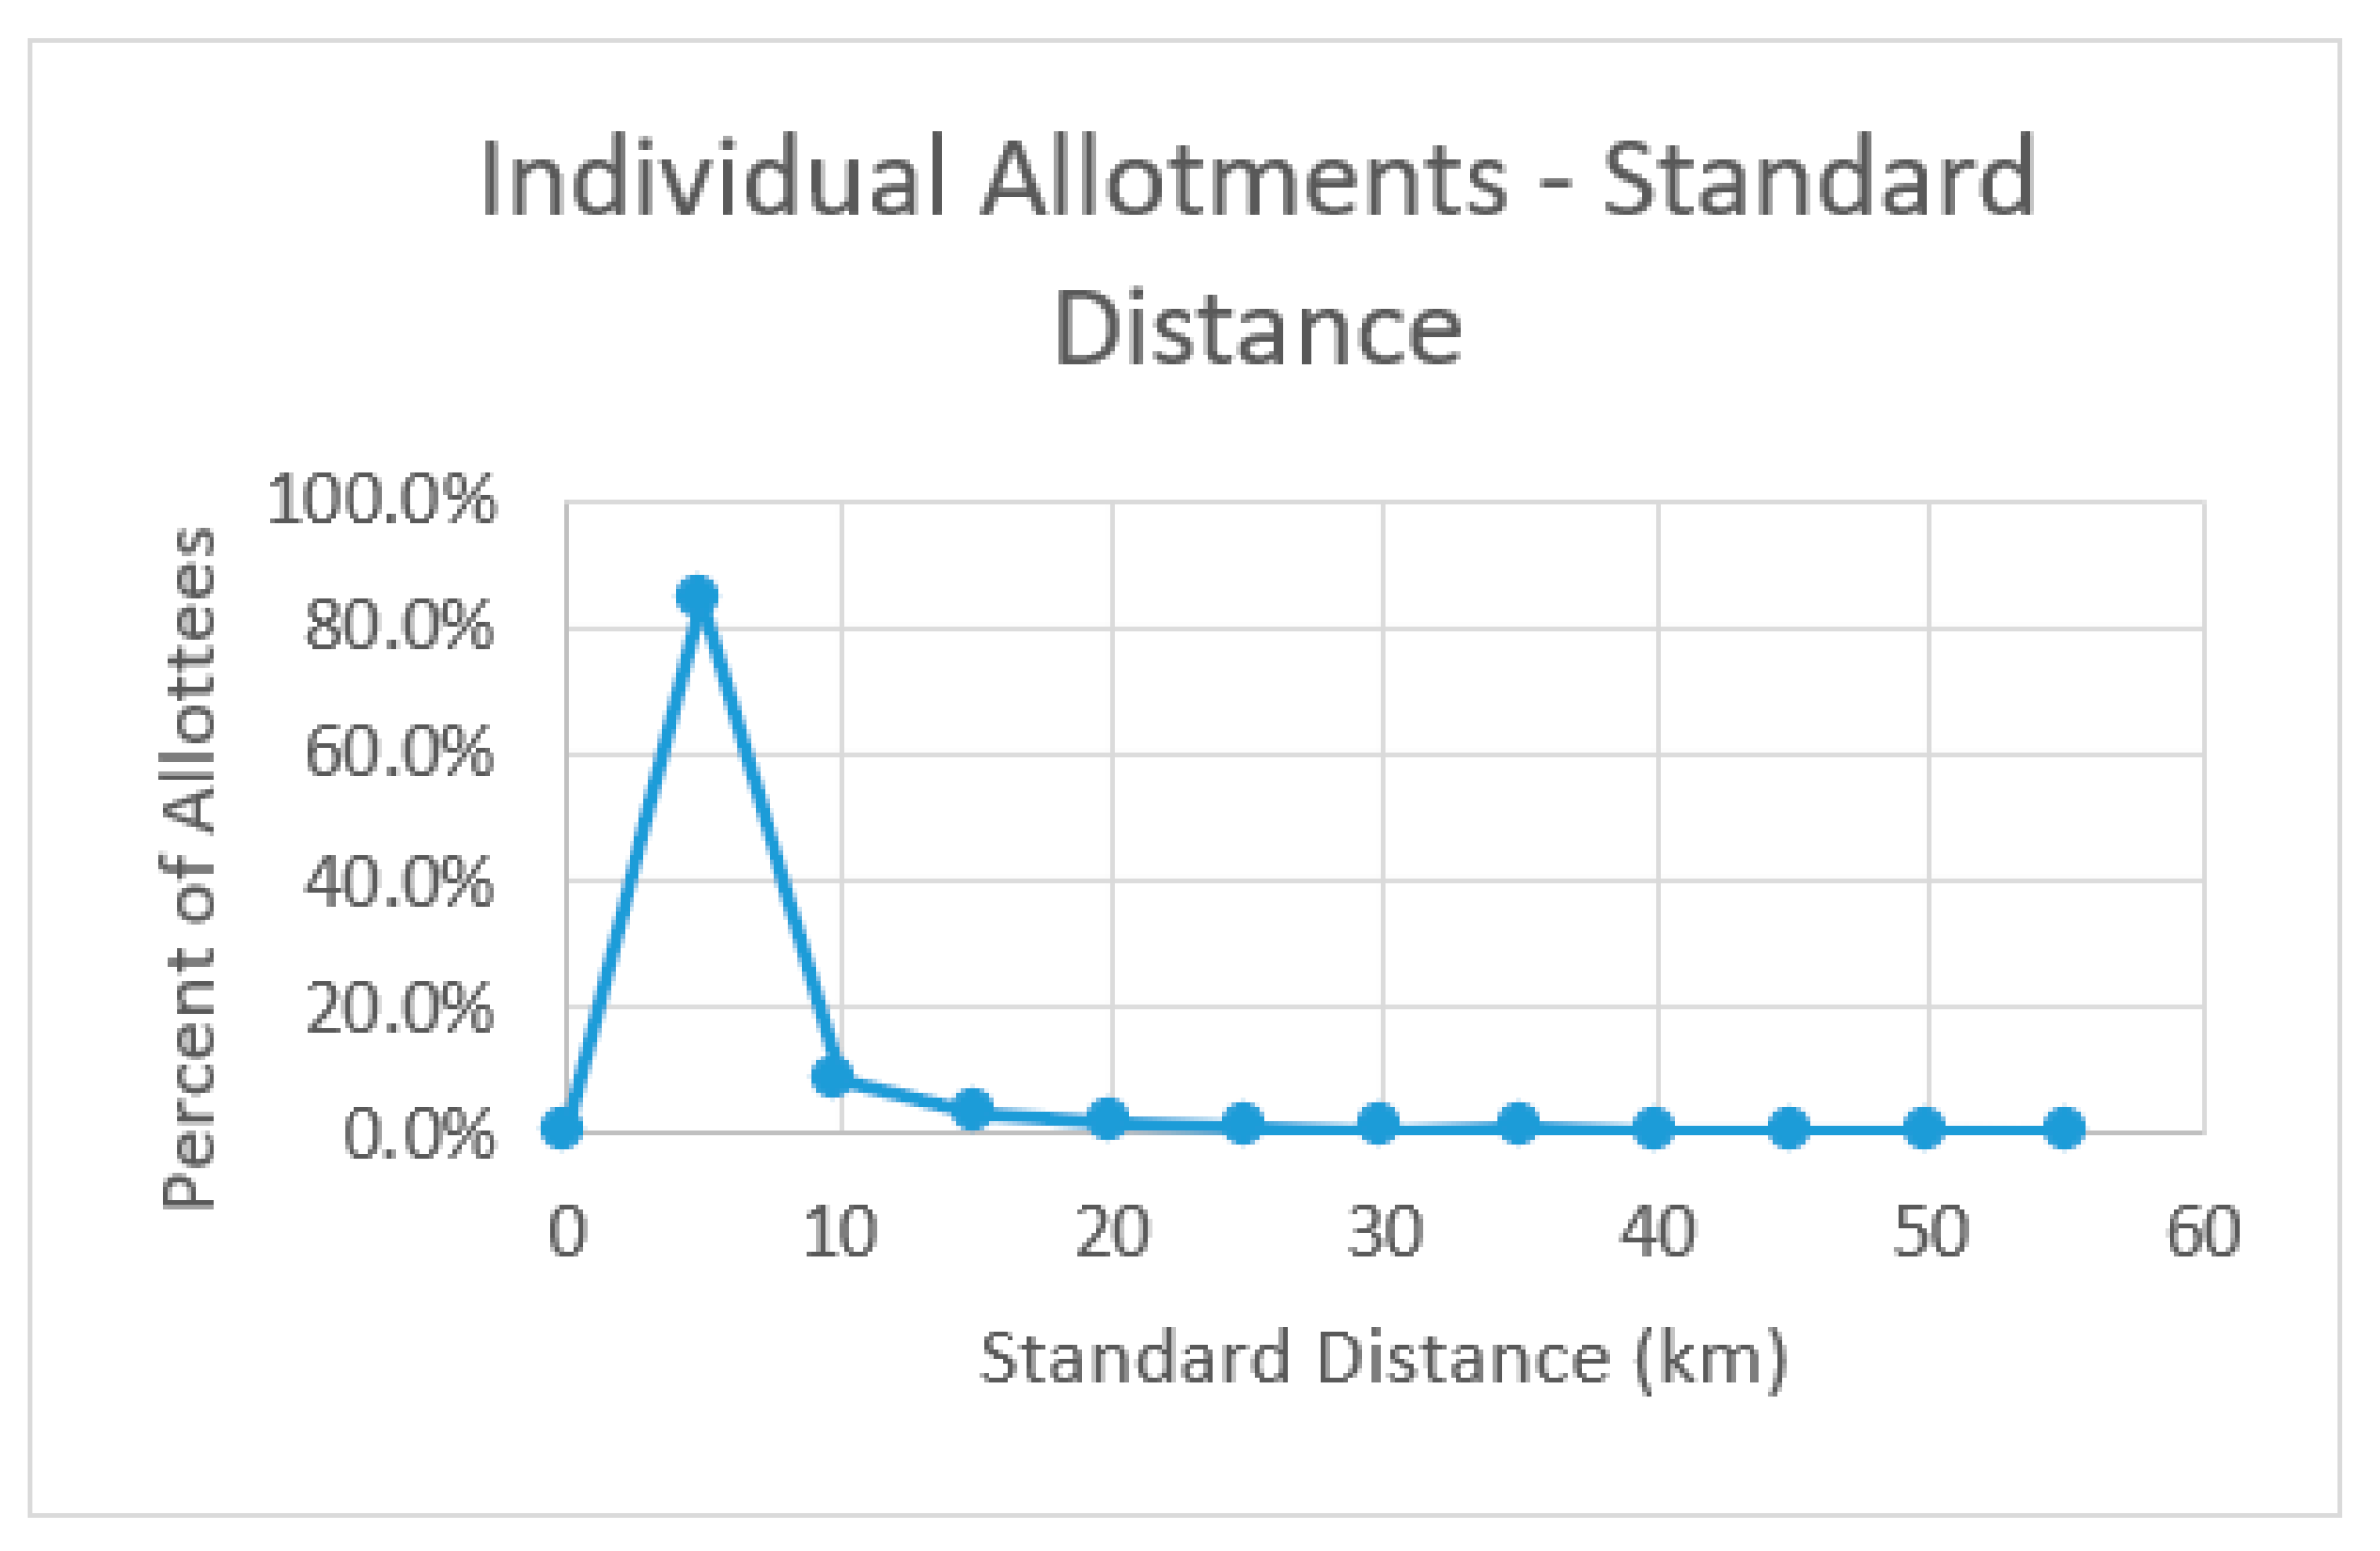
The frequency distribution curve of the standard distance between parcels for all allottees with three or more allotment parcels (1344 allottees out of a total of 4699, or 28.6% of allottees) can be seen in Figure 9. Even a quick glance at the chart confirms what Gunderson had claimed, that the great majority of allottees were selecting their parcels in a “compact body,” i.e., in close proximity to each other. Although the range of distances (45.5 km) and the standard deviation (5.91 km) were quite large, the median standard distance was only 0.52 km.

5.4. Family Patterns

Throughout our study of allotment at Standing Rock, we have come to understand two significant truths regarding patterns of individual and family allotments. The first was that allotments would reflect the established patterns of residence that had existed on the reservation for several decades. The second was that the allotment selections of individuals and families would be impacted by the availability of their desired land parcels when their turn to make allotment selections came up.
Sometimes people were able to select all of their allotment land in their preferred locations, sometimes only a portion of it, and sometimes none at all. For individuals, the result, as seen above, was that most of them were able to take their allotted land as a single parcel or as several adjacent parcels, often in the locations they desired, while others took their allotments in more dispersed patterns, possibly because their preferred lands were no longer available. In the case of families, however, the patterns were more dispersed than otherwise might have been expected; this came primarily as a result of revised allotment policies regarded married women and later-born children that were enacted in the midst of Gunderson’s allotment making. Although the revised policies awarded much more total land to the tribe, they also were the primary cause of the more highly dispersed patterns of families.

5.4.1. Overall Family Patterns

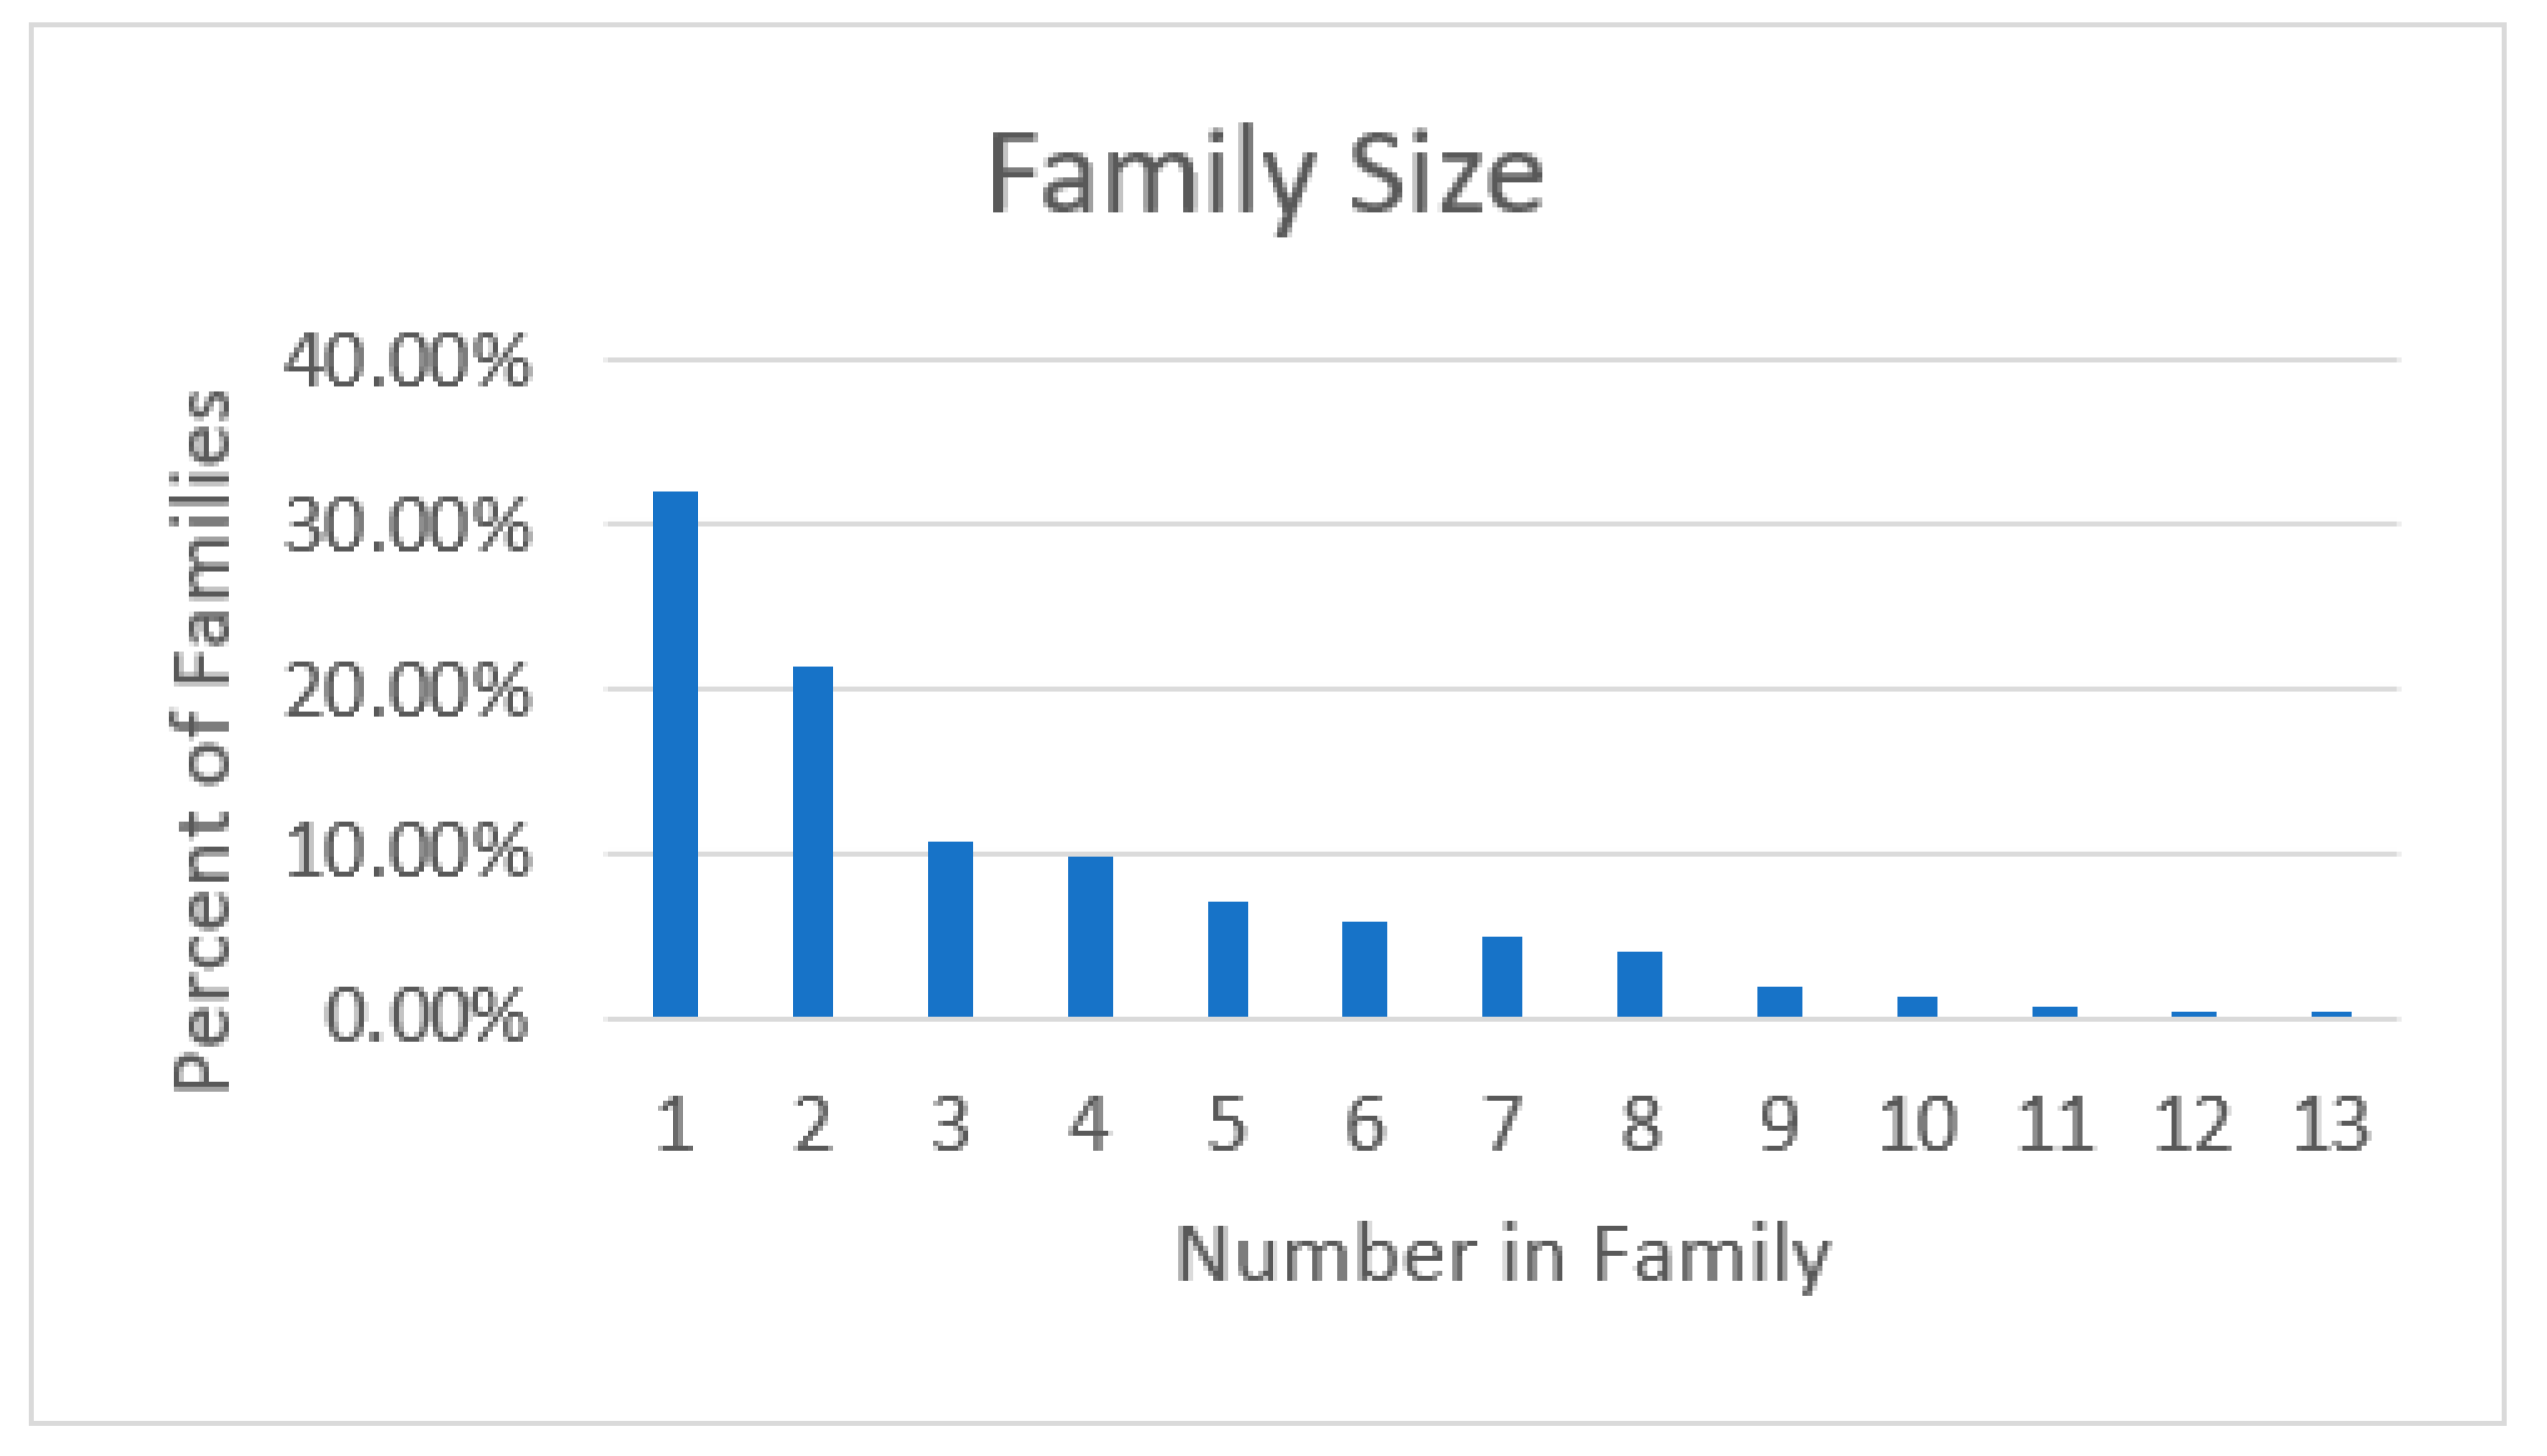
Our study of families at Standing Rock was limited to nuclear families, since extended family relations were rarely noted in the allotment register or Gunderson’s correspondence. As seen in Figure 10, family sizes ranged from two persons all the way to 13 (“families” consisting of only one person were disregarded). The mean family size for families of two persons or greater was 4.3. Since allotments were ultimately given to all individuals at Standing Rock, families with larger numbers of children clearly benefited in comparison to families with few (or no) children.
At the beginning of our research, we had a fundamental assumption that family members would tend to “stick together” in selecting their allotments, based on previous research by us and others. This meant that we assumed that related family members would generally select their allotments adjacent to each other, or at least as nearly adjacent as possible, with the caveat that there would certainly be exceptions.
However, a second factor worked in opposition to this “clustered family allotments” assumption; this factor was the timing of allotments (1) to married women in relation to those of their husbands and (2) to later-born children in relation to those of their fathers. With this in mind, we formulated three additional hypotheses: first, that the allotments to husbands and their “pre-cutoff” children (those born on or before 26 September 1905, the cutoff date for eligibility for allotments) would tend to be clustered together, since these children and their fathers almost always received their allotments simultaneously (especially since the fathers selected allotments for their minor children); second, that the allotments of wives would be separated at some distance and to the west from those of their husbands (and therefore, their pre-cutoff children) since most of the desirable lands near their husbands (largely in the east) likely would already have been allotted; and third, that the allotment lands of later-born children also would be offset some distance to the west from those of their fathers (and their pre-cutoff siblings) for the same reason as for the wives’ allotments.
Before examining the specific working hypotheses, we sought to gain a broad overview of family allotments by calculating the standard distance for all related members of a family using a person’s relationship number as the master ID number for each family. The allotment ledger books recorded how, and to whom, individuals were related to each other. This piece of demographic data was recorded in the allotment ledgers as “Relation Number”, which allowed us to group nuclear family members together and then map them for further spatial analysis. For example, a child might be recorded as “Son of 434”, meaning that allottee #434 was the father of this child, or a woman might be recorded as the “Wife of 434”, and so on for each family member. Thus, the head of household’s allotment number was used as a basis for identifying family units.
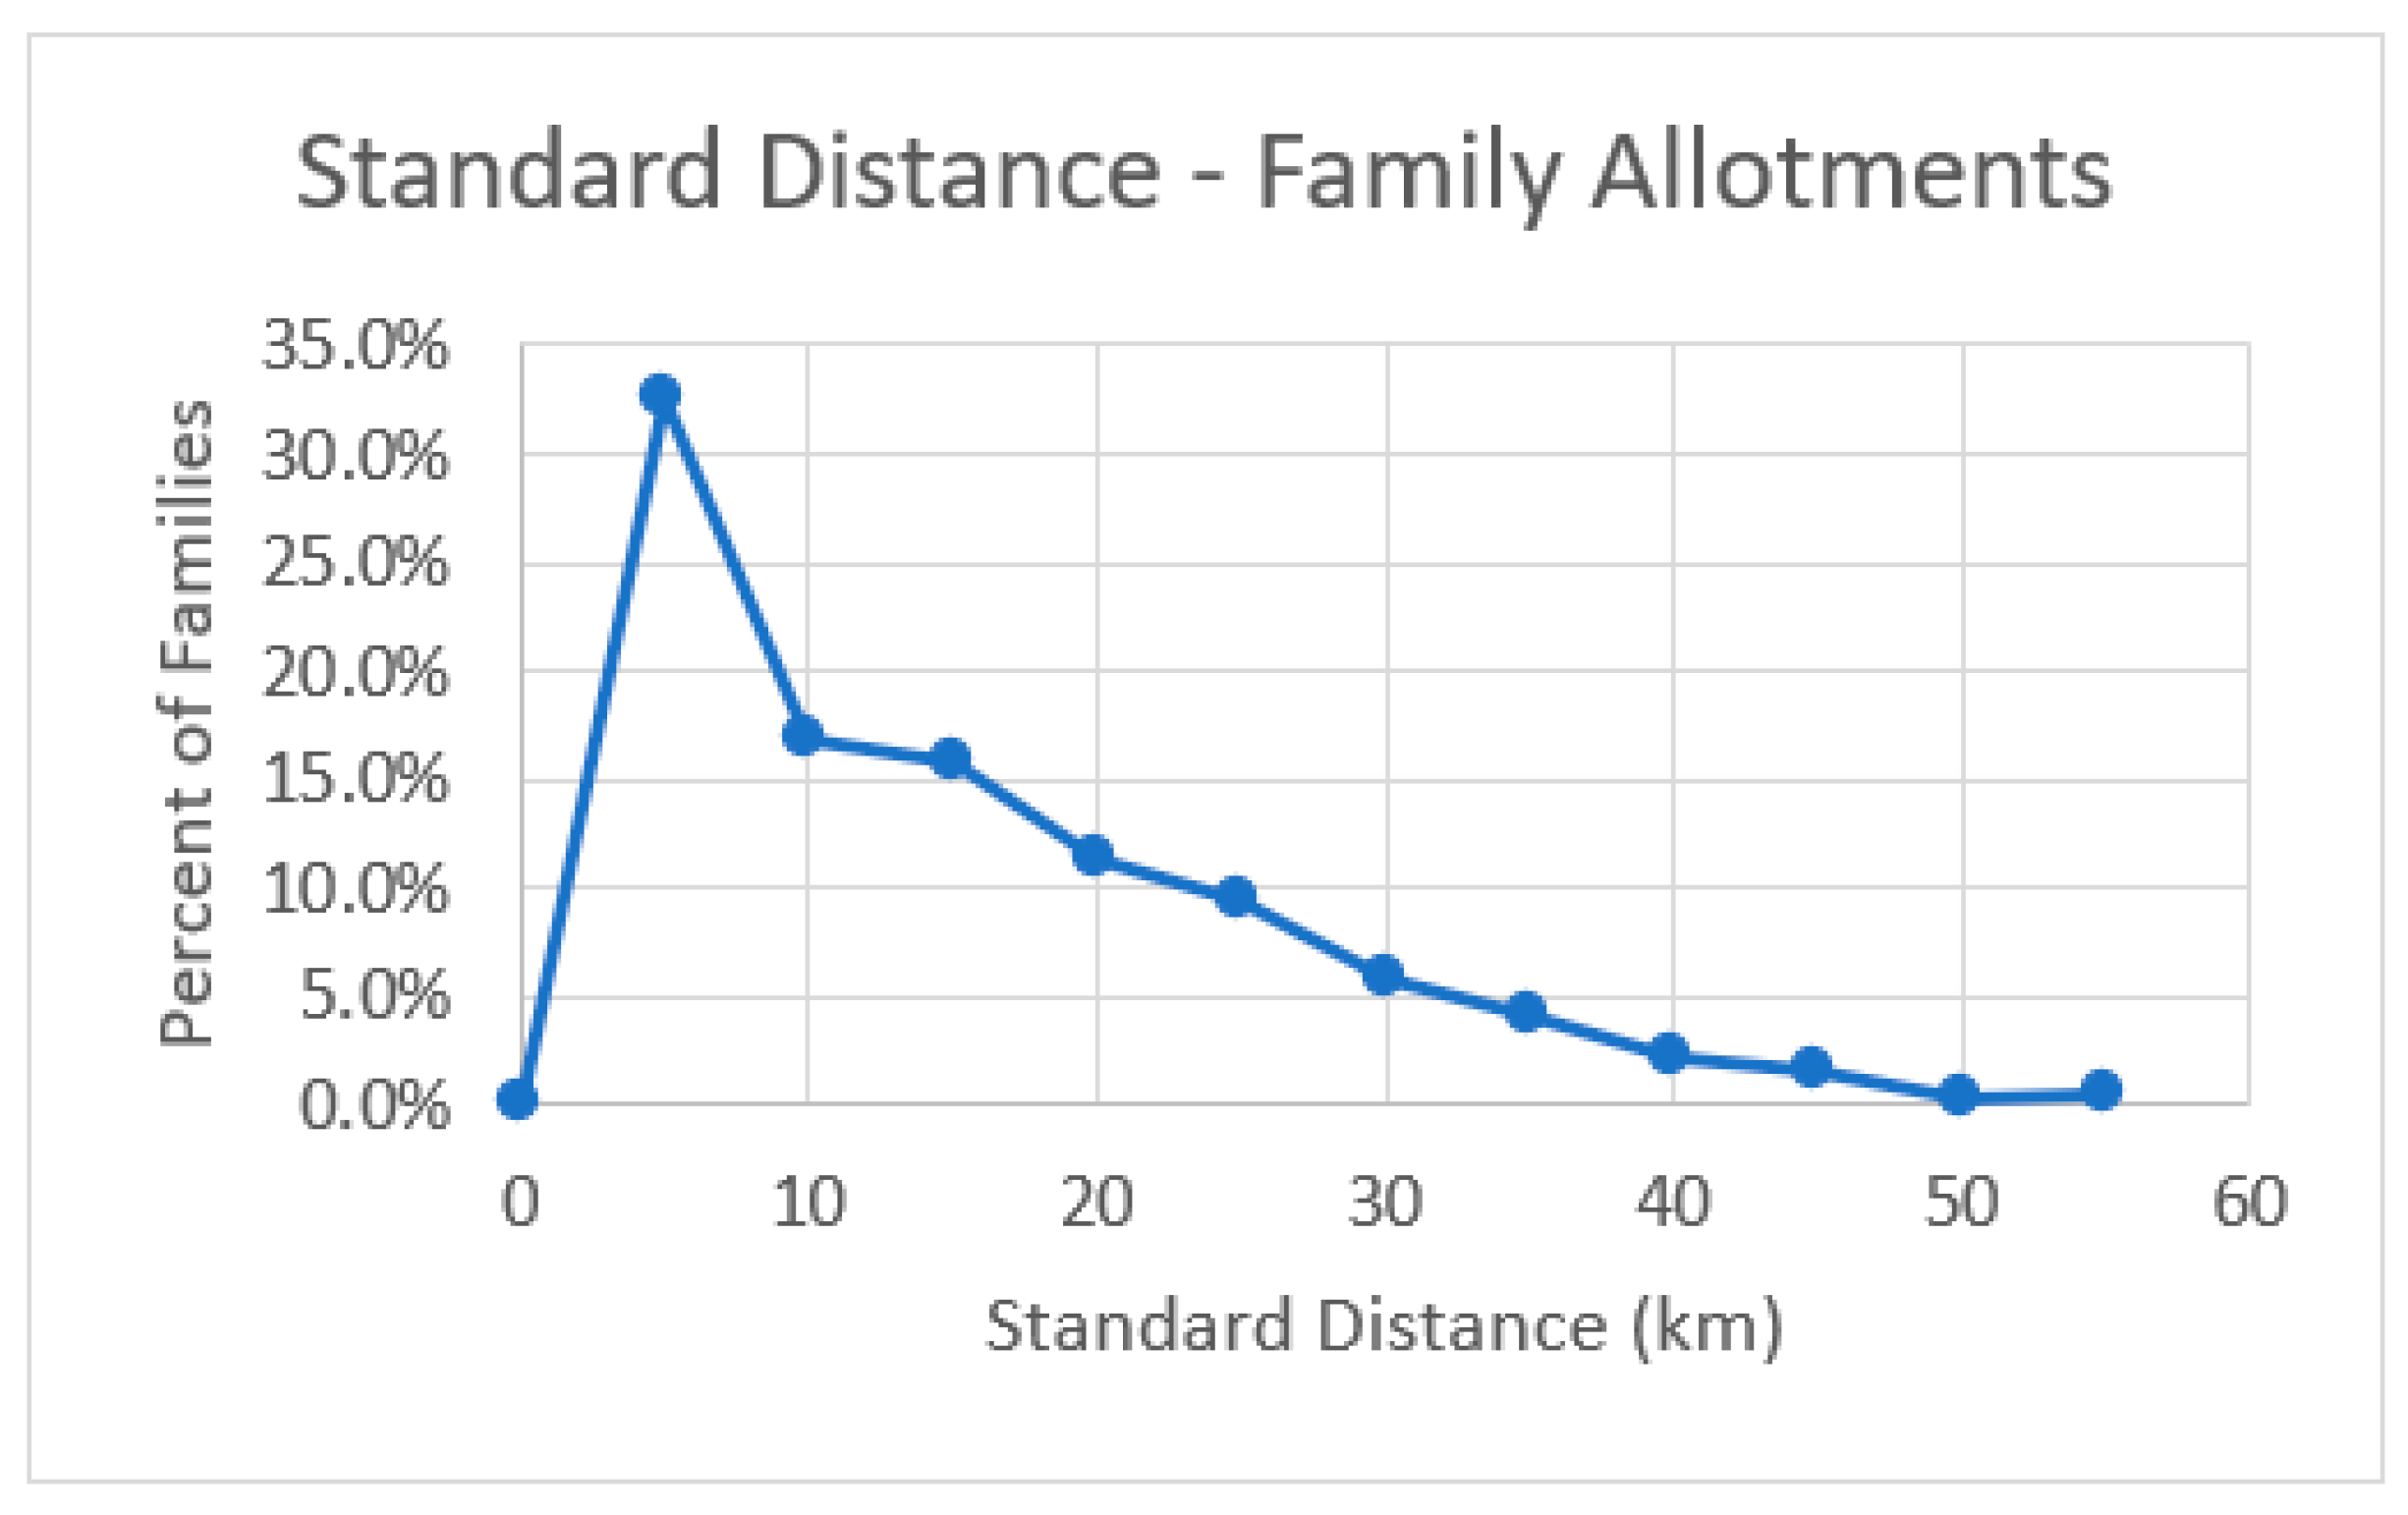
Figure 11 shows the frequency distribution of standard distances between allotments, calculated by family. The difference between the standard distance distributions for families (Figure 11) and those for individuals (Figure 9) are striking. The “fat tail” of the distance distribution for families versus the “thin tail” for individuals shows that family allotment distributions were much more widely dispersed than those for individuals. The median standard distance value of 10.7 km for family allotment parcels versus 0.52 km for individuals confirms this, as does the standard deviation value for families, 10.95 km, vs. 5.91 km for individuals.
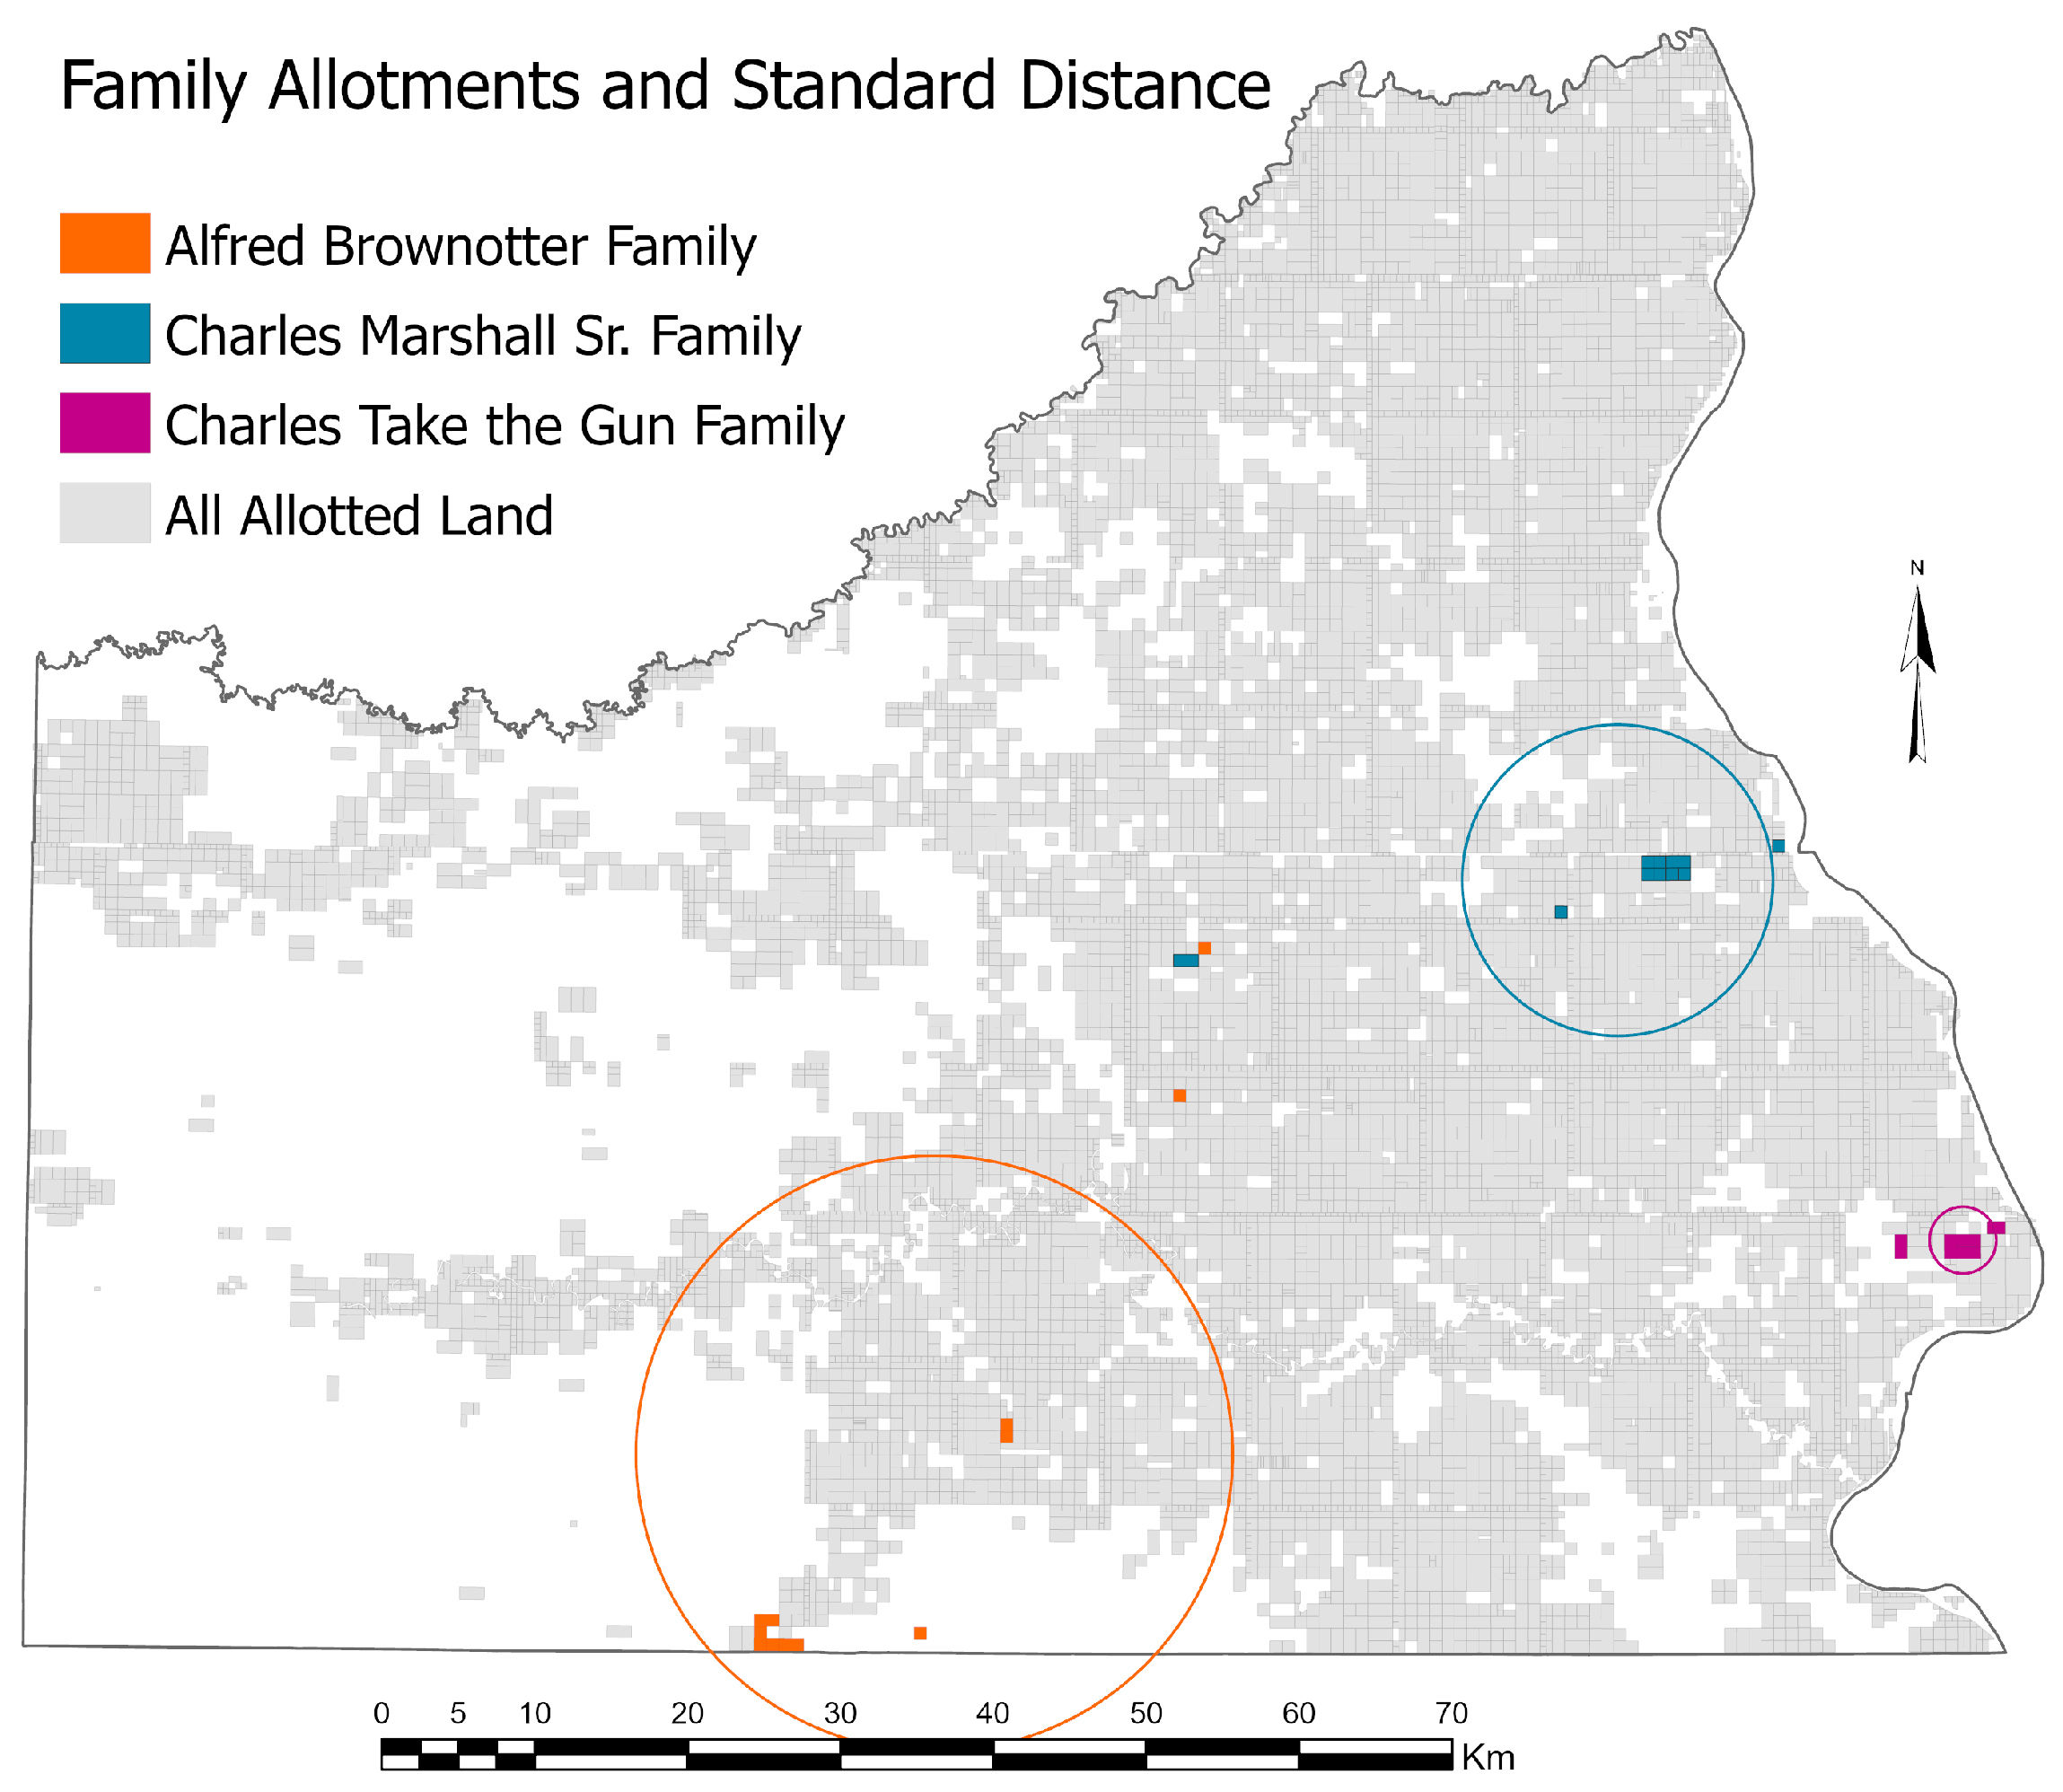
Examples of the standard distance values for three different families can be seen in map form in Figure 12. Since standard distance was calculated using one standard deviation in this case, the circles do not enclose all the allotment selections made by the members of each family. However, the diameter of each circle is indicative of the relative clustering or dispersal of all the allotment parcels for all members of each family: in this case the Brownotter family’s distribution is most dispersed, while the Take the Gun family’s distribution is most compact, and the Marshall family’s distribution lies in between.

5.4.2. Allotments to Married Women

Under the original Dawes Act, as noted above, married women did not receive allotments, although widows and divorced women were treated as heads of household and received full allotments. This policy ran counter to the traditions and practices of most Native people of North America, including the Lakota and Dakota tribes. Women’s agricultural production filled a crucial role in many tribes, and in many cases it served as the basis for individual property rights for Native women [60,61].
However, at the time of allotment, there were many who wanted to use that program as another opportunity to reinforce a Euro-American style of family-unit among Native people. For instance, former Supreme Court Justice William Strong, who was a supporter of allotment, explicitly spoke against granting separate allotments for married women in a statement to the Board of Indian Commissioners in 1886, “I want Indians brought together in families. There can never be any civilization without families. I would have the head of the family have the land, and have it descend to his wife and children.” (Strong, quoted in [62]). This statement speaks volumes about the common opinions of this era and the desire to change the traditional gender roles of Native people.
As noted earlier, the people at Standing Rock had petitioned for married women to have their own land allotments, which they received in a 1907 Act of Congress [30] in the amount of 320 acres for each married woman (vs. the 640 acres they requested). A positive outcome to this was that married women had their own allotment numbers and parcels of lands deeded in their names, which meant they could receive their own trust annuities or lease payments by virtue of being the legal owners of their land. It also returned property rights to women who had had it stripped from their cultural tradition in the Dawes Act. And, taking a broader view, their allotments added significantly to the land base held by the residents of Standing Rock.
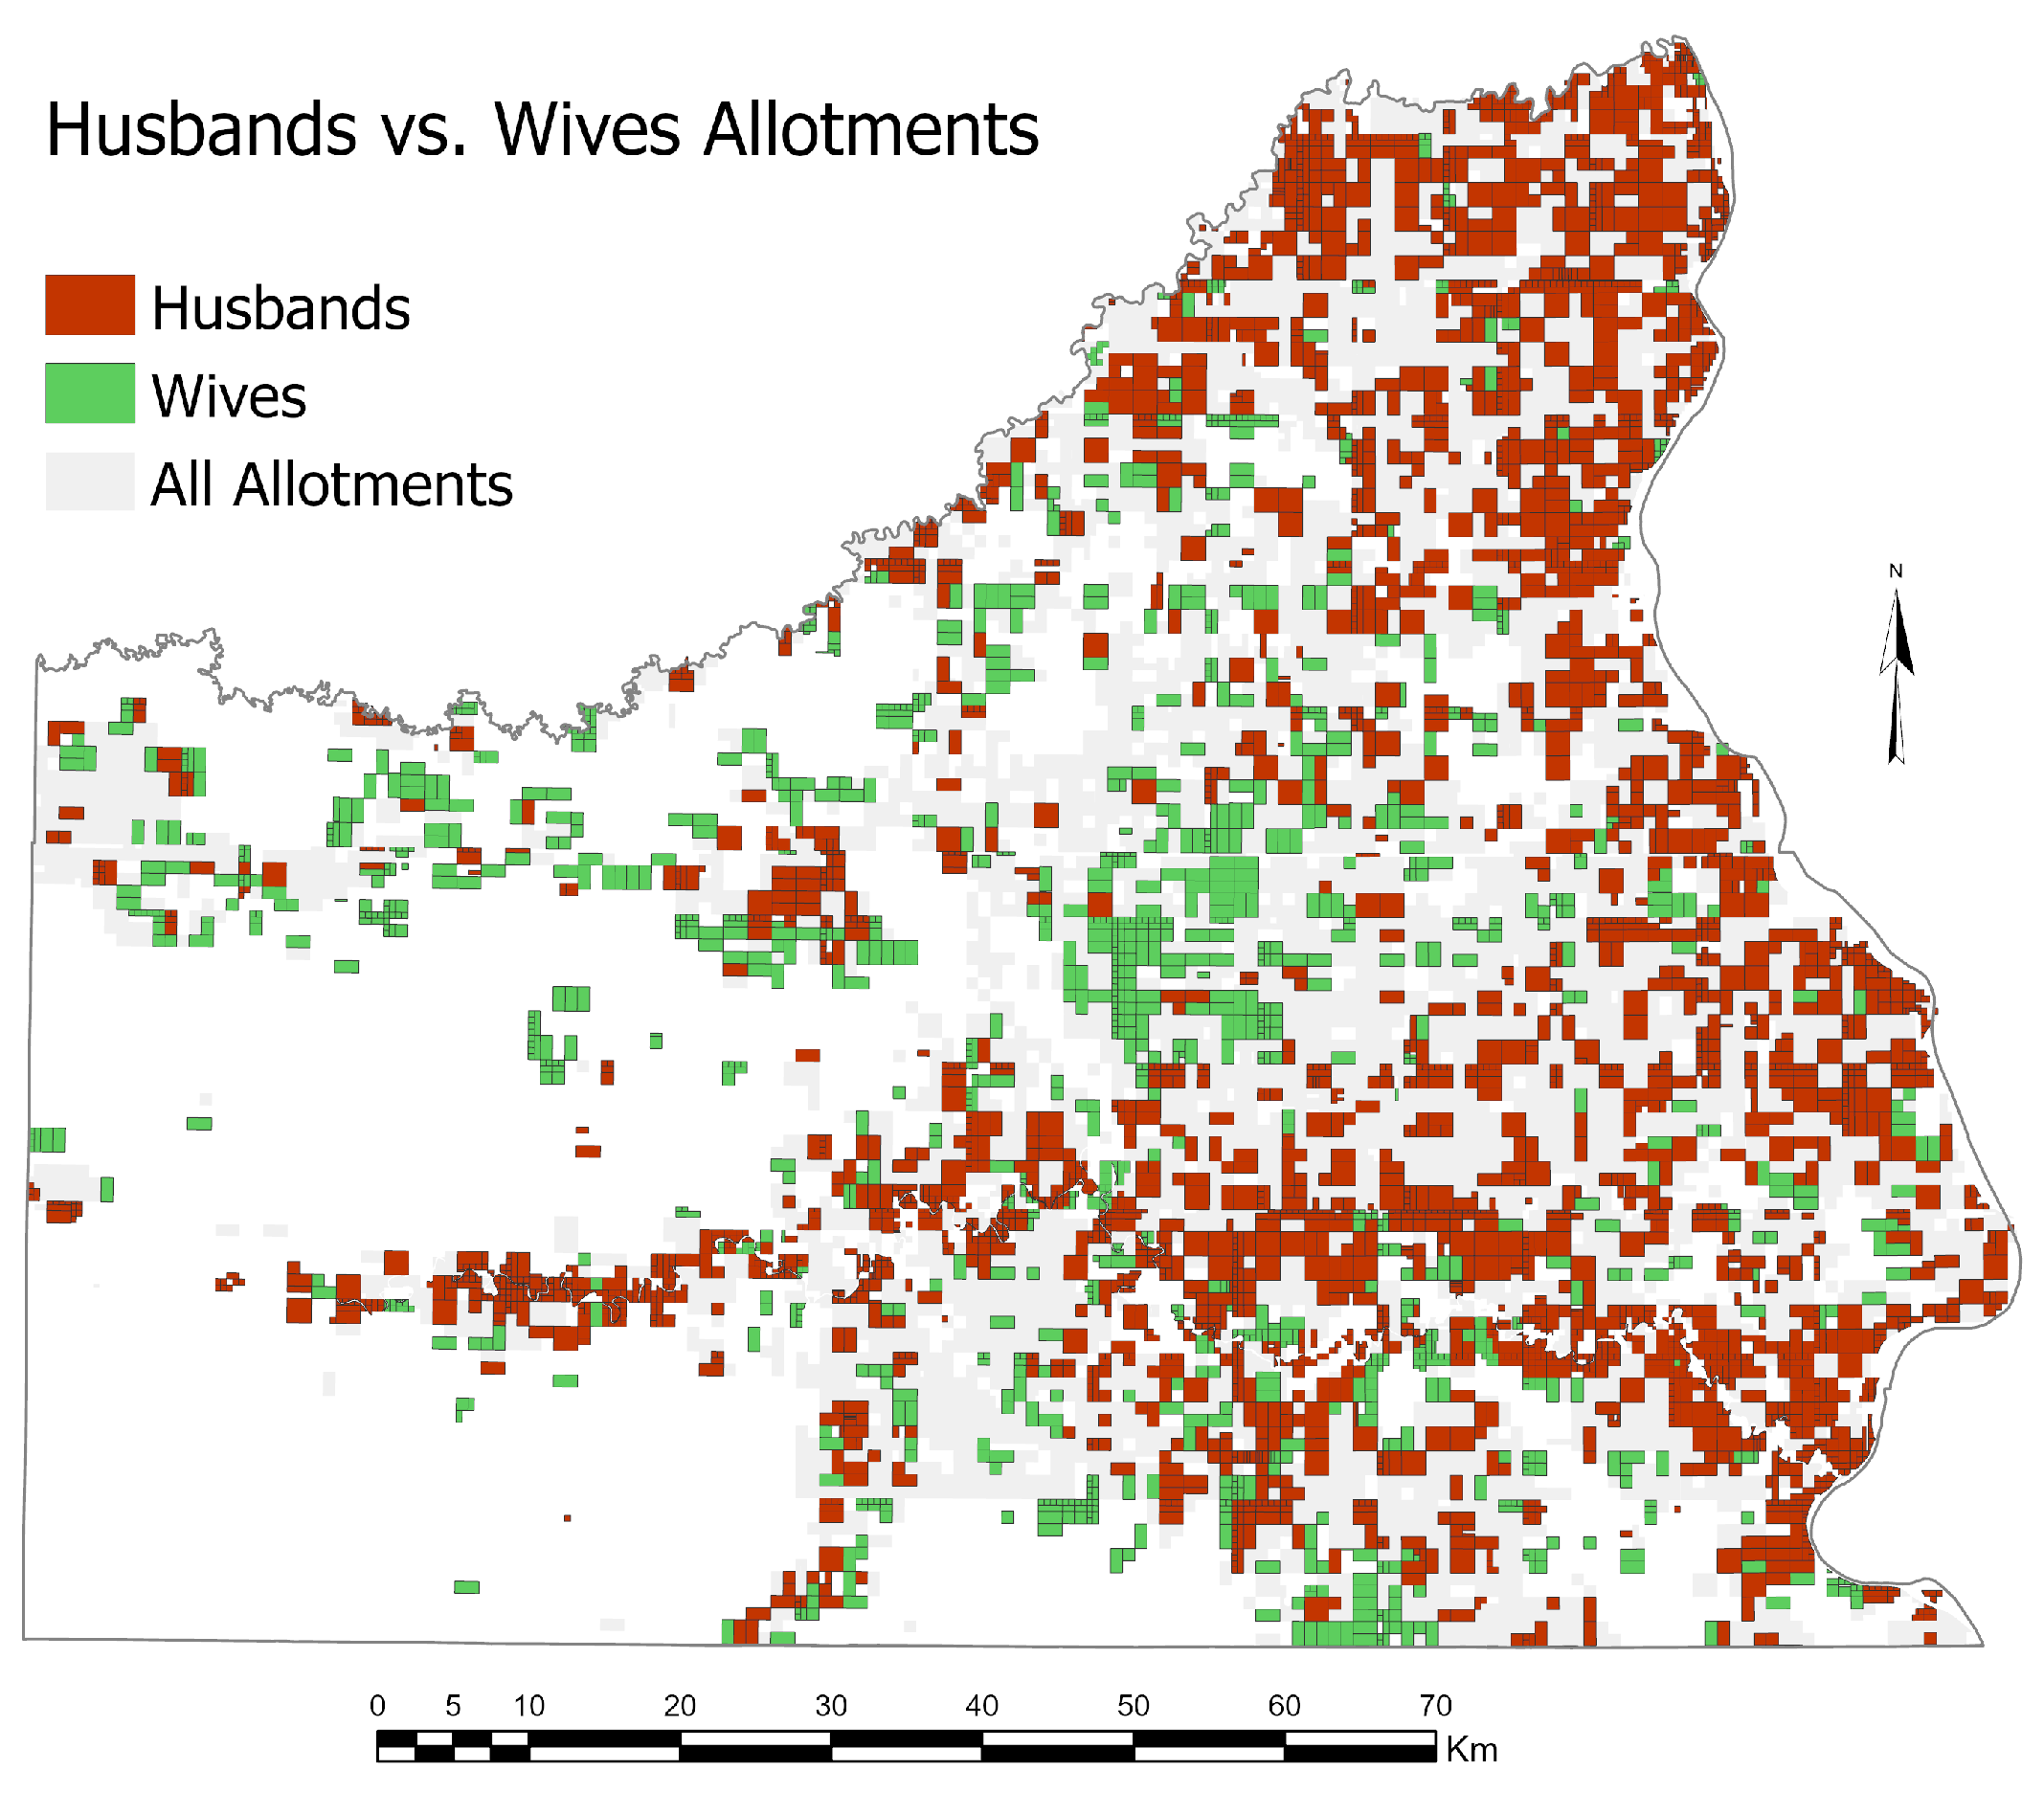
However, several negative consequences occurred because of the delayed selection of parcels by married women. Because these women received allotments later in time, in many cases it meant that desirable land parcels near their husbands’ and pre-cutoff children’s allotments were no longer available and had more than likely already been selected by someone else. Or, it might have meant that the wife would be forced to choose between poor quality land near that of her husband or better quality land farther away. Figure 13 reveals this difference in the spatial distribution between the land selections of husbands versus those of their wives. In general, the husbands (and their pre-cutoff children) received their lands first and had a better opportunity to choose parcels clustered together in the region near the Missouri River to the east and along the Grand River in the south-central portion of the reservation, while the majority of the wives’ selections ended up being located farther to the west.
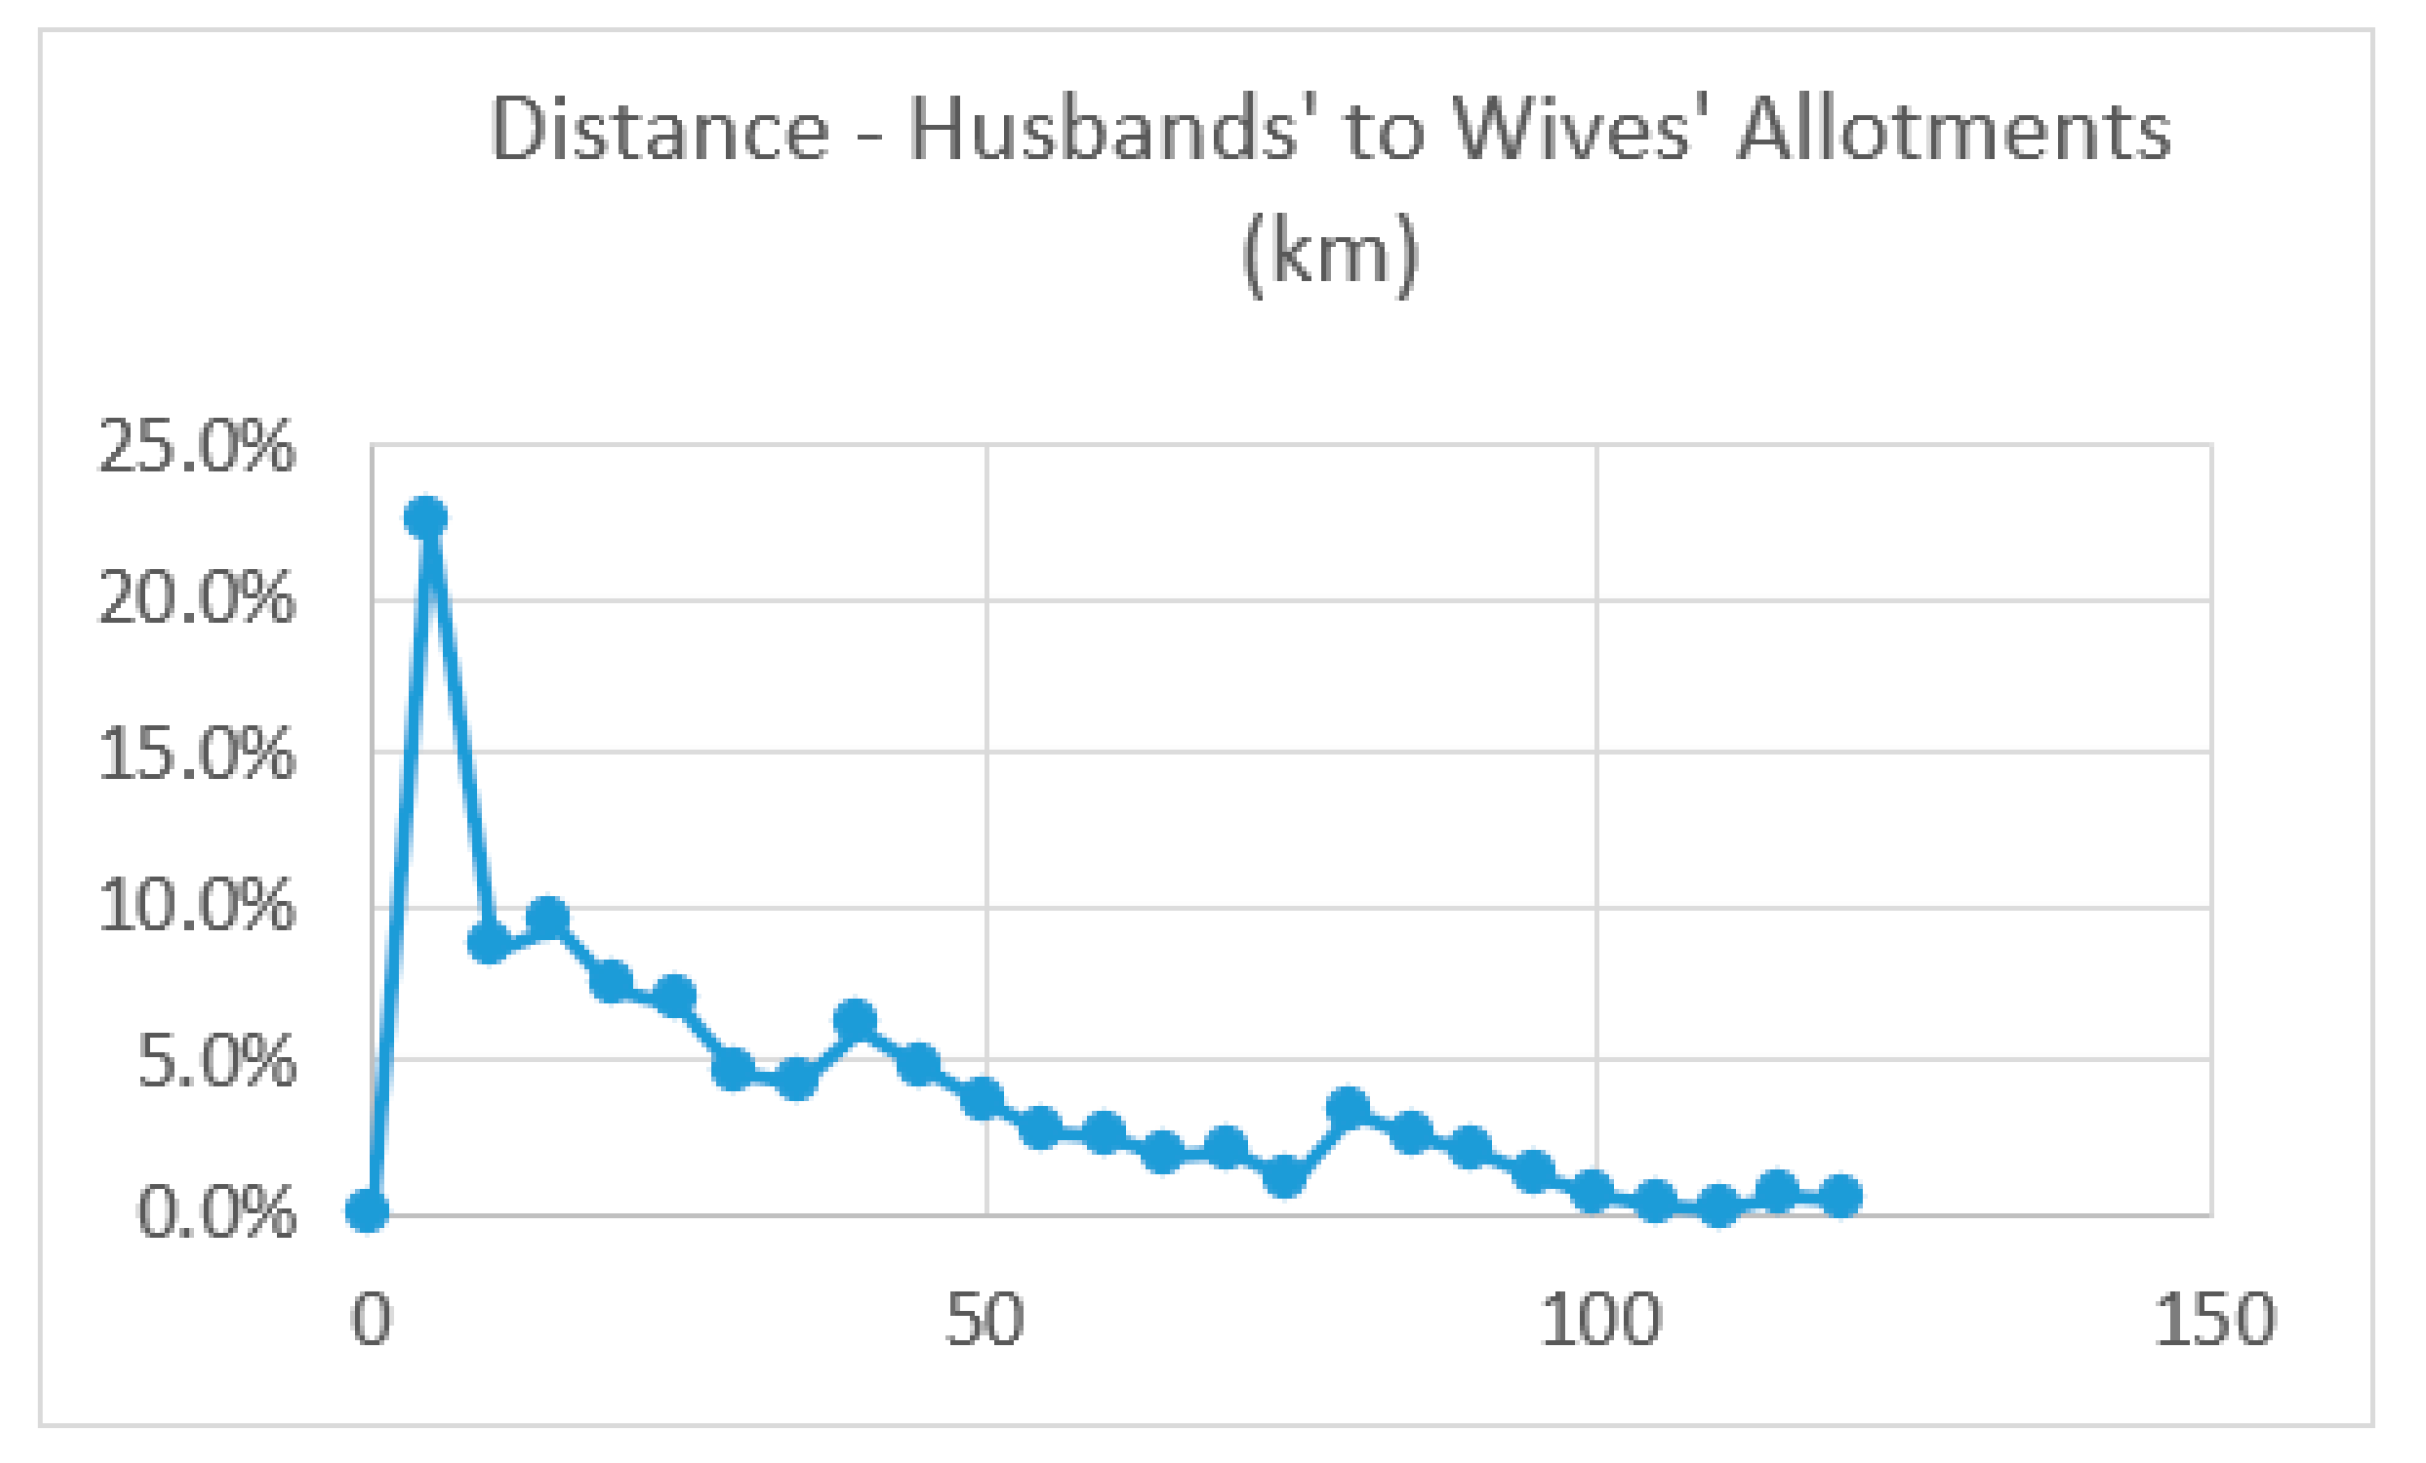
Although Figure 13 suggests that some wives were able to select allotments in the vicinity of those of their husbands (and, therefore, the lands of their pre-cutoff children) many married women indeed were forced to select lands at some distance, and generally to the west, from those of their husbands. A plot of the distances between husbands’ and wives’ allotments shows this “offset” even more clearly (Figure 14). The median distance between their allotments was 22.3 km, while the standard deviation was 28.0 km, and it must be further borne in mind that these are straight-line distances and are not representative of the actual distance (or time) that would have been required to travel between the allotment of a wife and her husband. It would have been difficult to cover these distances on horseback or in a horse-drawn wagon within a day, especially if farm implements were being moved.
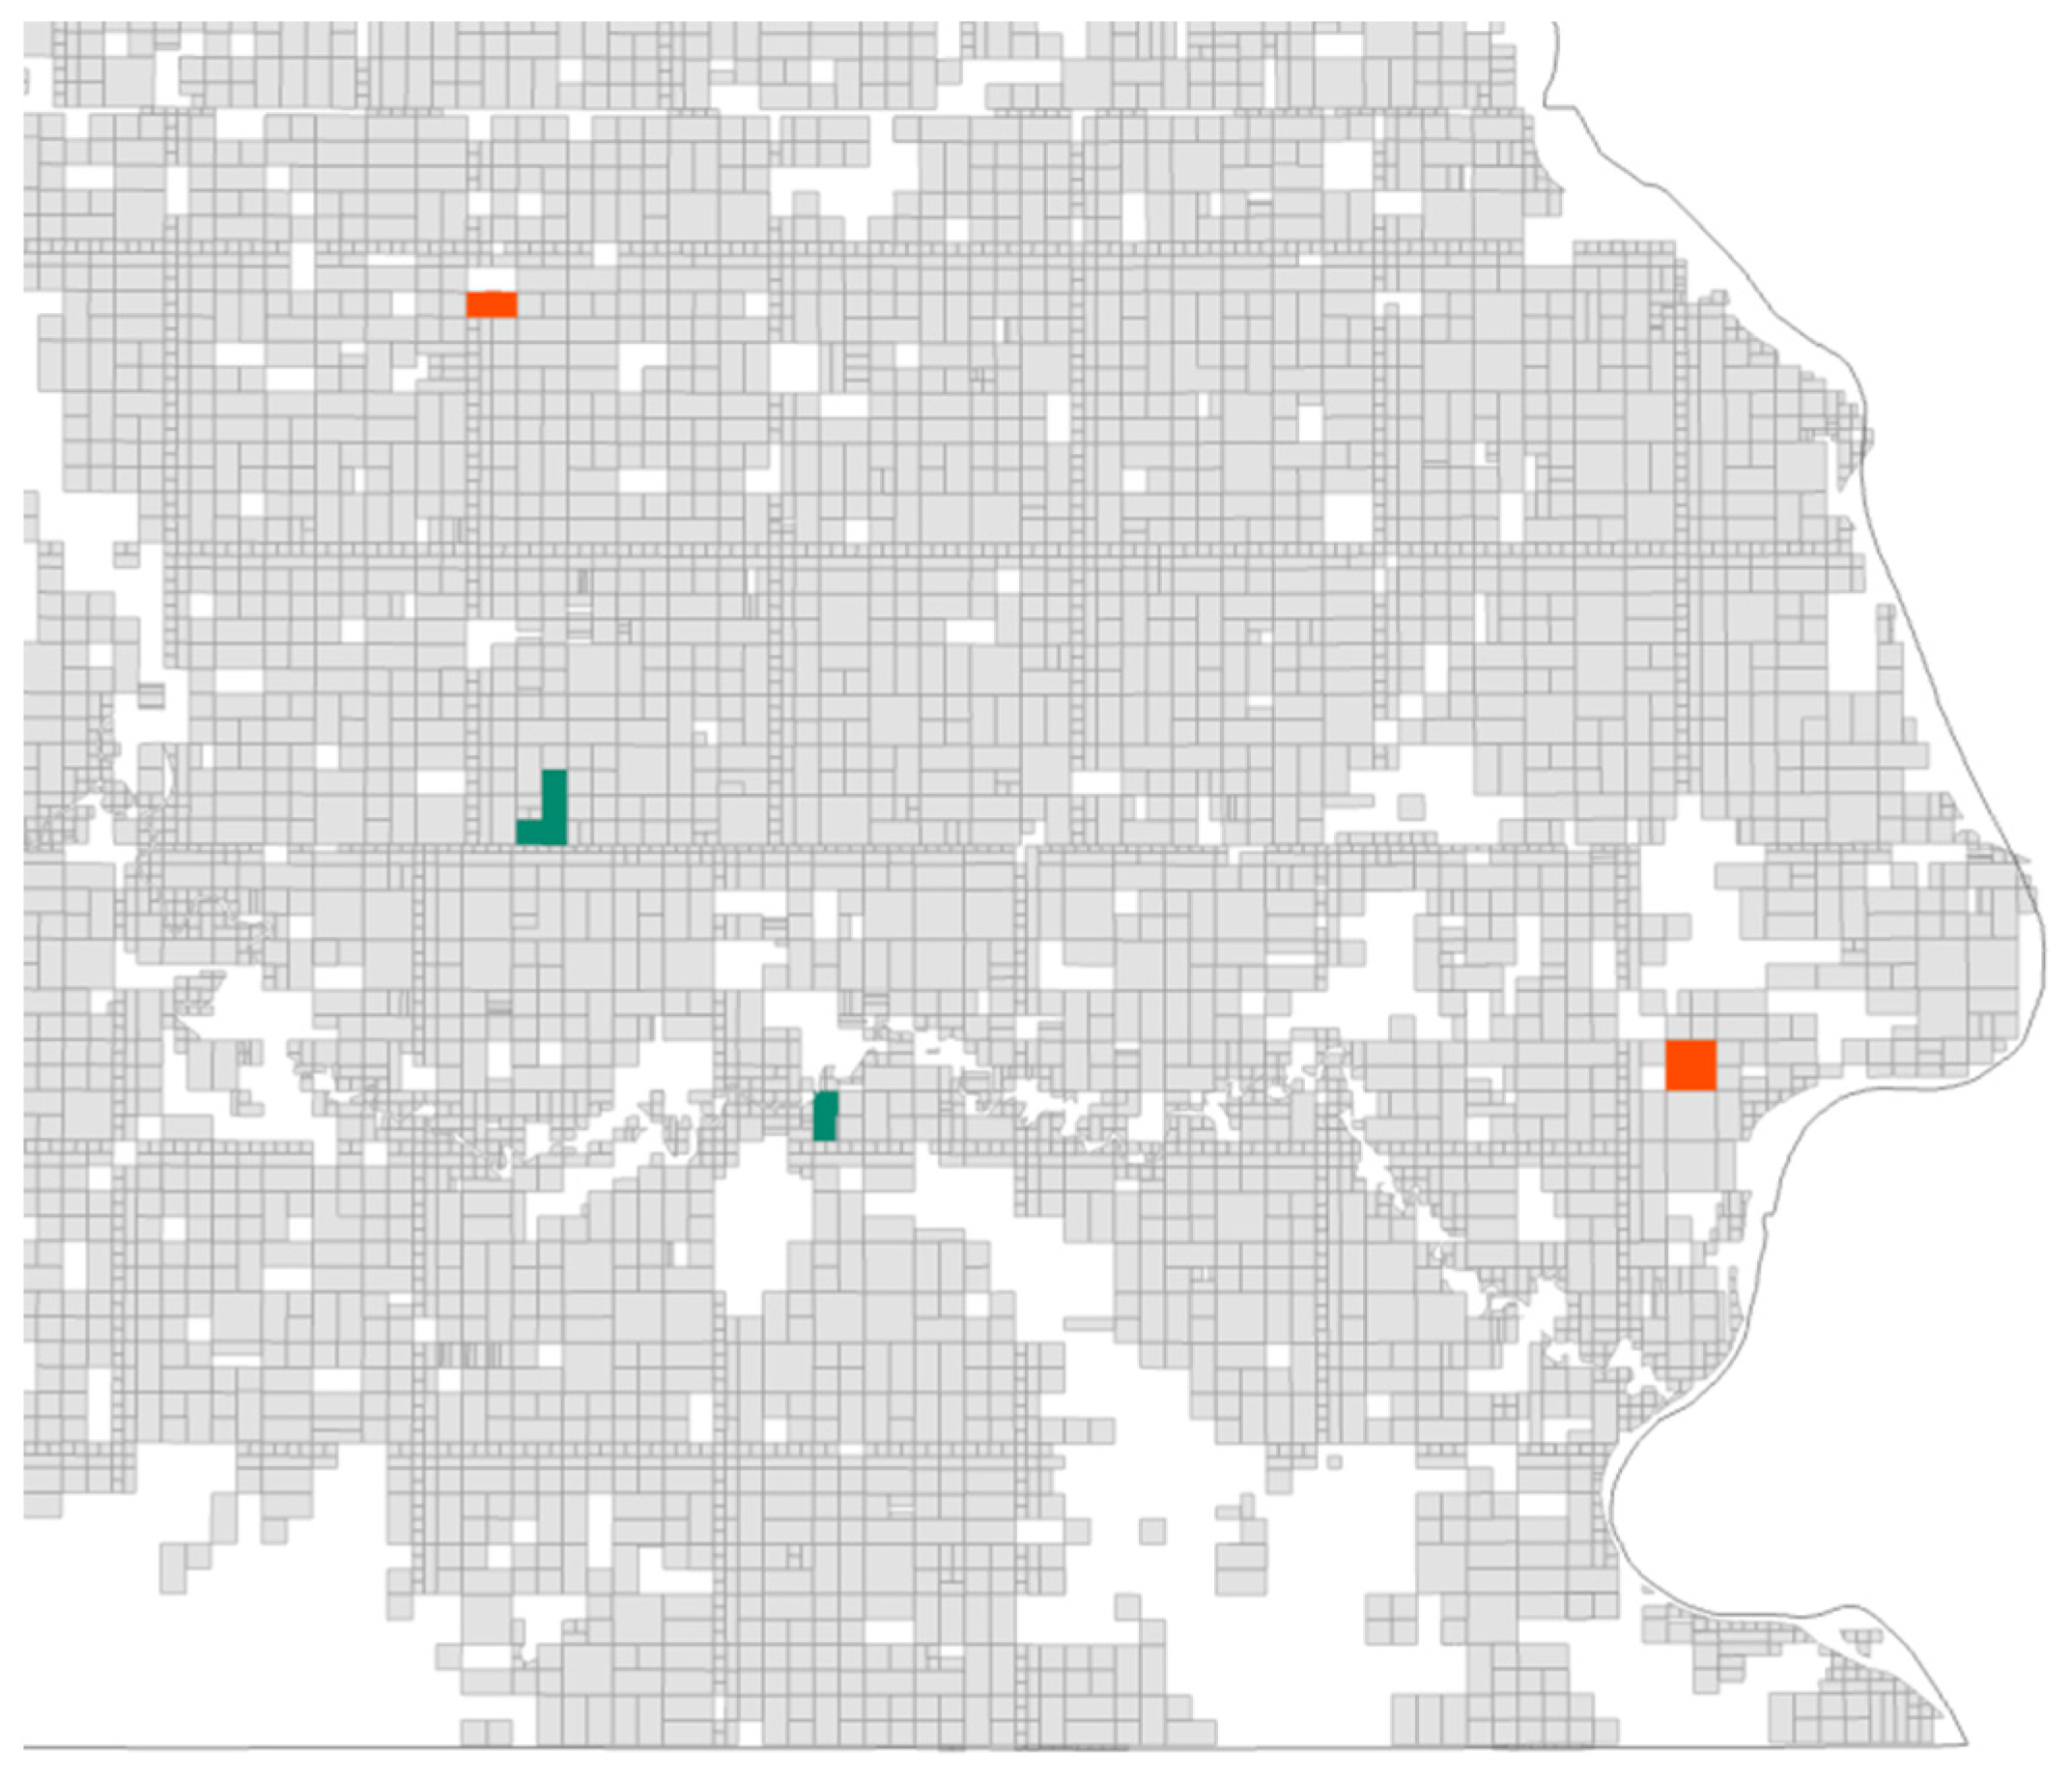
Thus, the belated allotment of land to married women at Standing Rock was a mixed blessing, at best. On the one hand, it granted land ownership rights to all married women, while adding a great deal to the total amount of land allotted to tribal members (over 206,000 acres, 82,400 ha). On the other hand, it worked against the main goal of allotment, which was to convert Native people into successful farmers and ranchers. Widely separated plots of land were not a recipe for agricultural success in the semi-arid high plains of North and South Dakota, where large contiguous, or near-contiguous, areas of land were needed, whether for raising crops or for cattle ranching. While individuals may have overwhelmingly taken their allotments in a “compact body”, as Gunderson had said, many families were compelled by the belated timing of allotments to married women (and to later-born children) to take allotments that were at some distance from each other, in widely dispersed patterns. This can be seen in a map of the allotments of two married couples, Luke and Amy Eagleman (in orange), and Walter and Annie Iron (in green) (Figure 15).

5.4.3. Allotments to Pre-Cutoff Children

Recall that we had formulated two initial hypotheses regarding the relative clustering or dispersal of allotment patterns between fathers and their minor children, depending on whether a child was born on or before the date of the President’s order to allot the reservation (pre-cutoff children) or after that date (later-born children). The first hypothesis was that the allotments of fathers and their pre-cutoff children would tend to be clustered together, while the second was that the allotments of later-born children would be located at some distance from their fathers’ allotments (in the same manner as the allotments of married women and their husbands), contributing to a more dispersed pattern of allotments for the family. We based these hypotheses on a close reading of the correspondence of Special Allotting Agent Gunderson as his work progressed, as well as the timing of the passage of the Congressional Act that authorized allotment to later-born children in early 1907 [23].
As noted earlier, Gunderson began allotting later-born children in the early summer of 1907, nearly as soon as he received authorization to do so. Since he was still in the midst of the process of making regular allotments to those who were already eligible (Figure 2 and Figure 4, above), as he continued making allotments to eligible adults and pre-cutoff children, he also began making allotments to later-born children (Figure 14); note that Gunderson did not begin making allotments to married women until 1908, even though he had been authorized to do so in the same act that authorized allotments to later-born children. As seen in Figure 16, the only children allotted in 1906 were pre-cutoff children, while the following year was the peak year for allotting children in that category. The final year for most regular allotments, 1908, saw roughly equal numbers of pre-cutoff and later-born children receive allotments, and from 1909 until the close of allotment making, virtually 100% of the allotments to children were to later-born children.
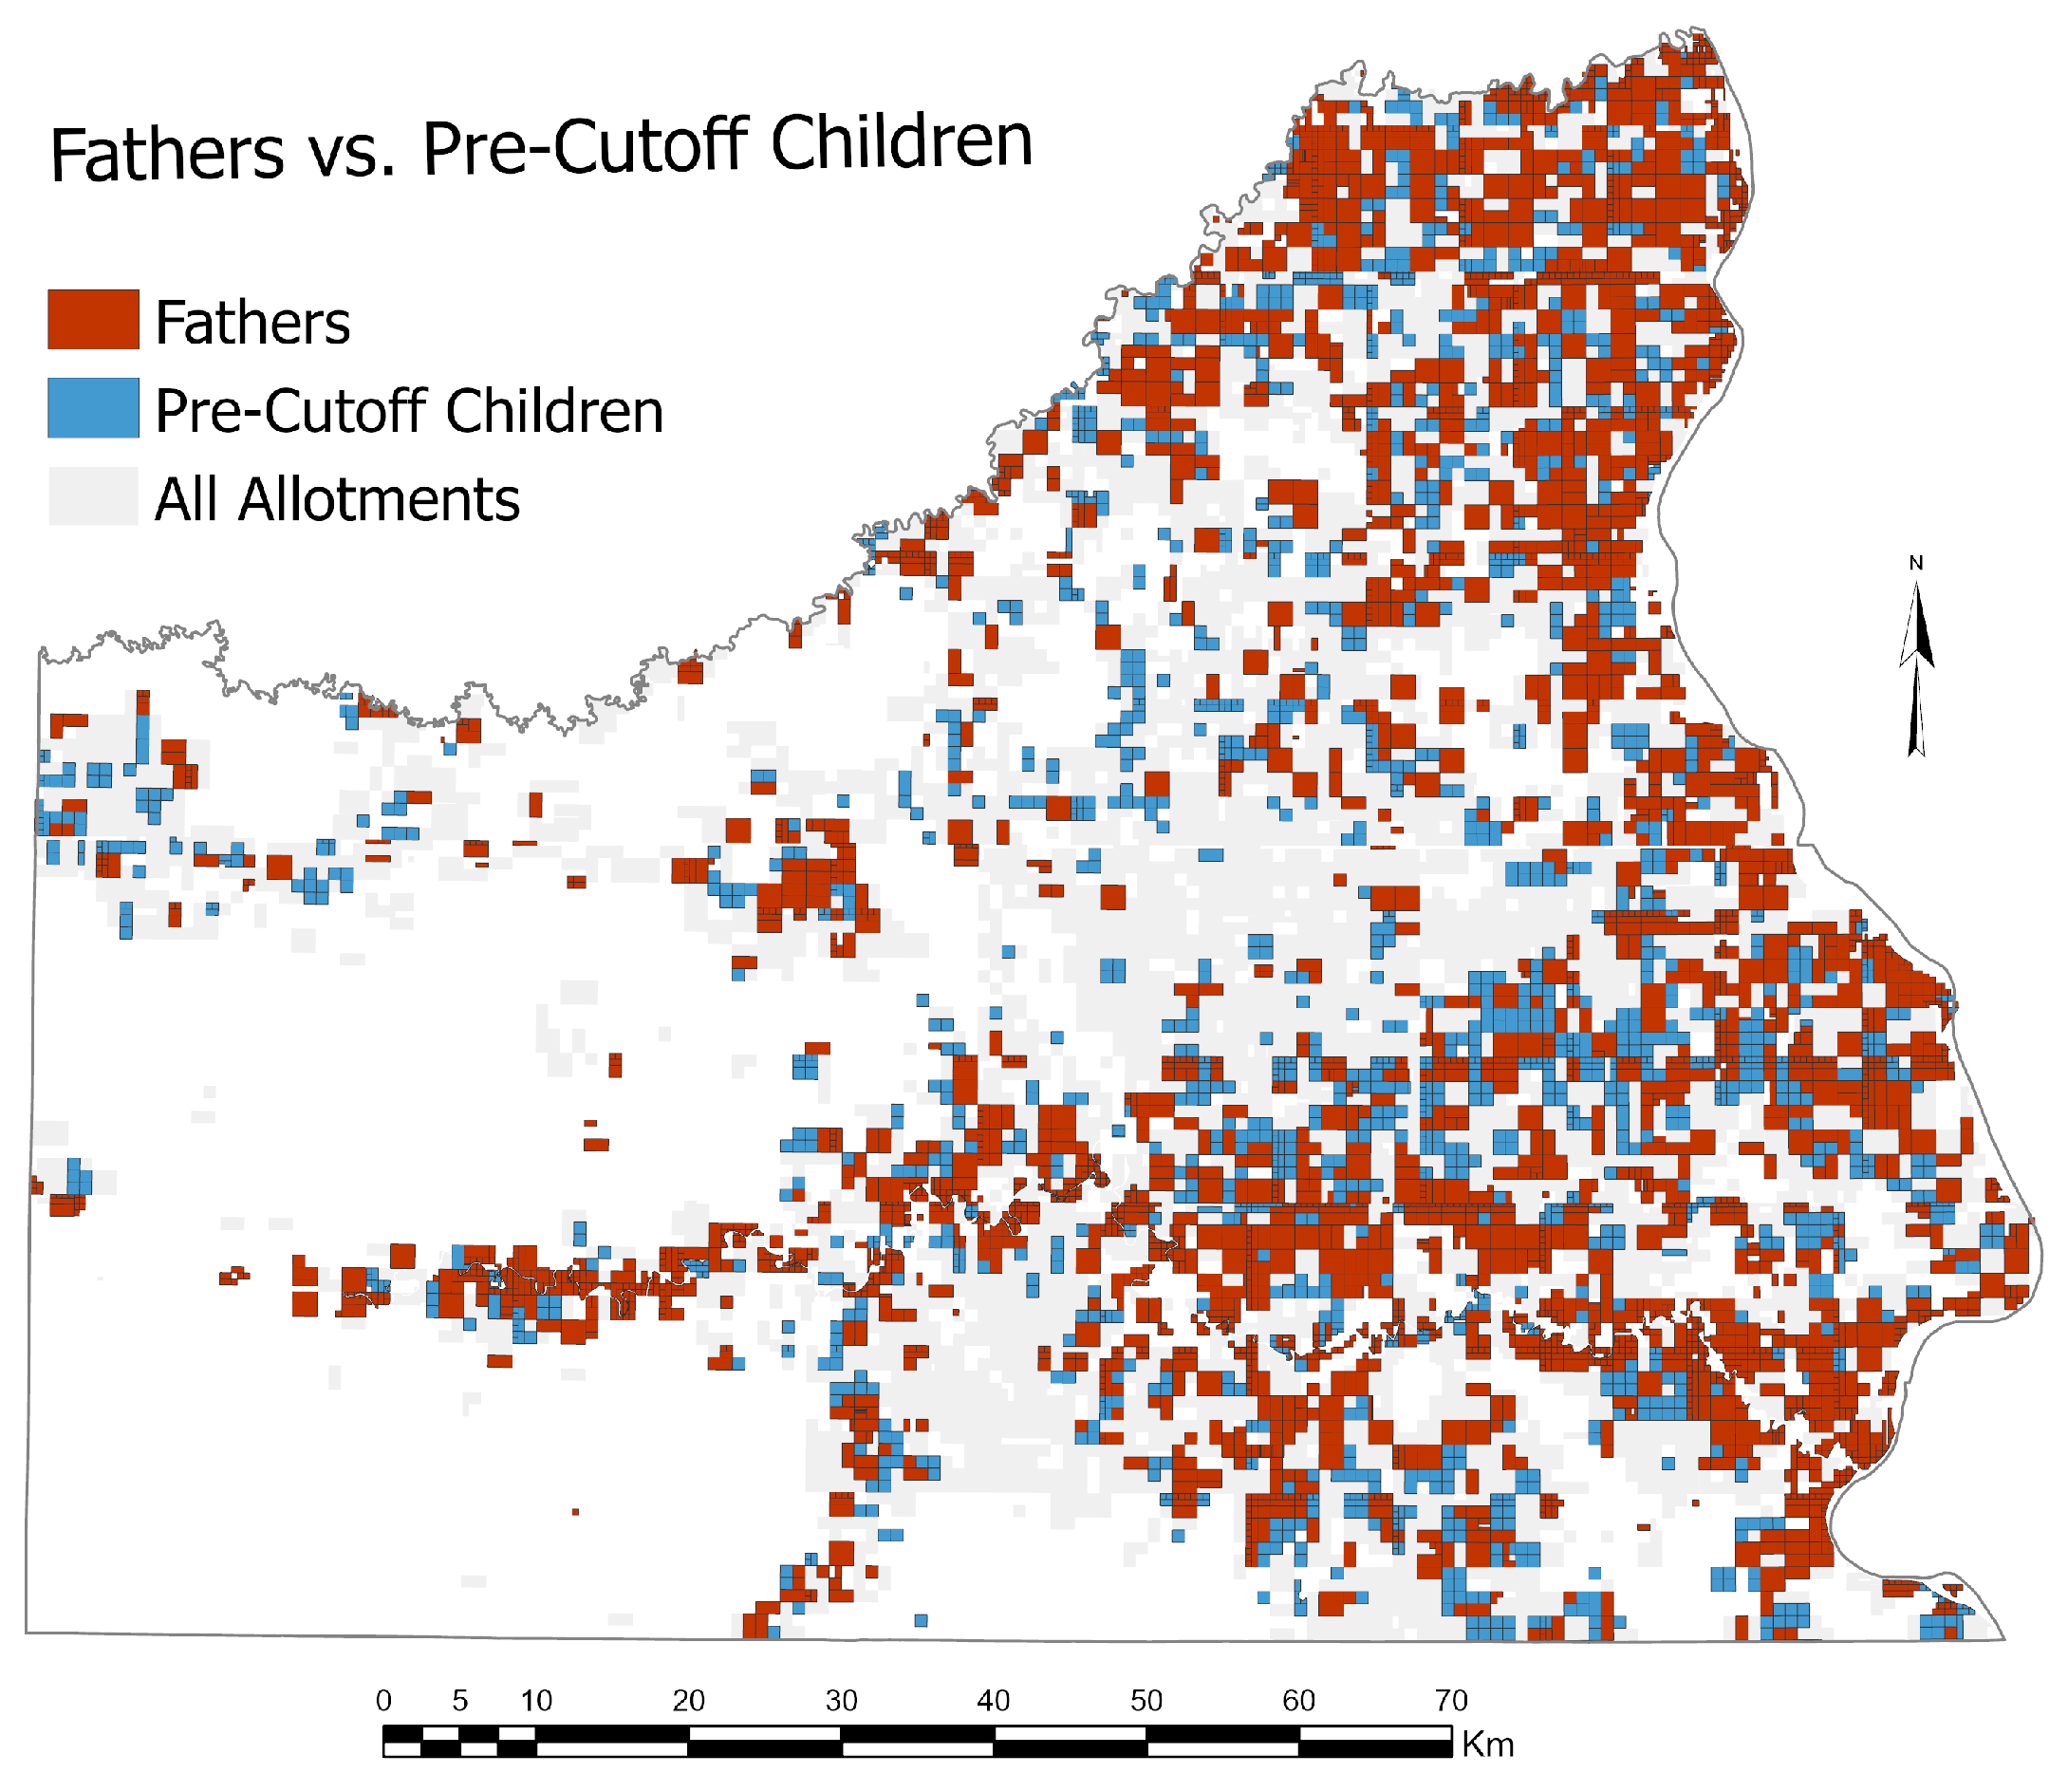
The mapped pattern of allotments to pre-cutoff children in relation to those of their fathers (Figure 17), appears to confirm our hypothesis that the allotments of pre-cutoff children were generally in close proximity to those of their fathers. This makes sense because in most cases the fathers selected the land for their minor children and generally would have wanted them to have their land adjacent to theirs or nearby. Table 5 further confirms this relationship. For 1906 and 1907, the median distance from a father’s allotments parcel(s) to those of their pre-cutoff children was 5.28 km for 1906 and 5.20 km for 1907. In 1908, the median distance jumped to 27.55 km, almost certainly due to the completion of virtually all regular allotments earlier in the year.

5.4.4. Allotments to Later-Born Children

Our hypothesis regarding the pattern of allotments to later-born children (those born after 26 September 1906) in relation to the allotments of their fathers was that the majority of allotments of later-born children would, of necessity, be located at some distance and to the west of their fathers’ allotments; in other words, very similar to the allotment patterns of married women in relation to those of their husbands. As noted earlier, Gunderson began making allotments to later-born children in 1907, and those allotments continued to be made even after Gunderson left, up until the close of allotment work at Standing Rock.
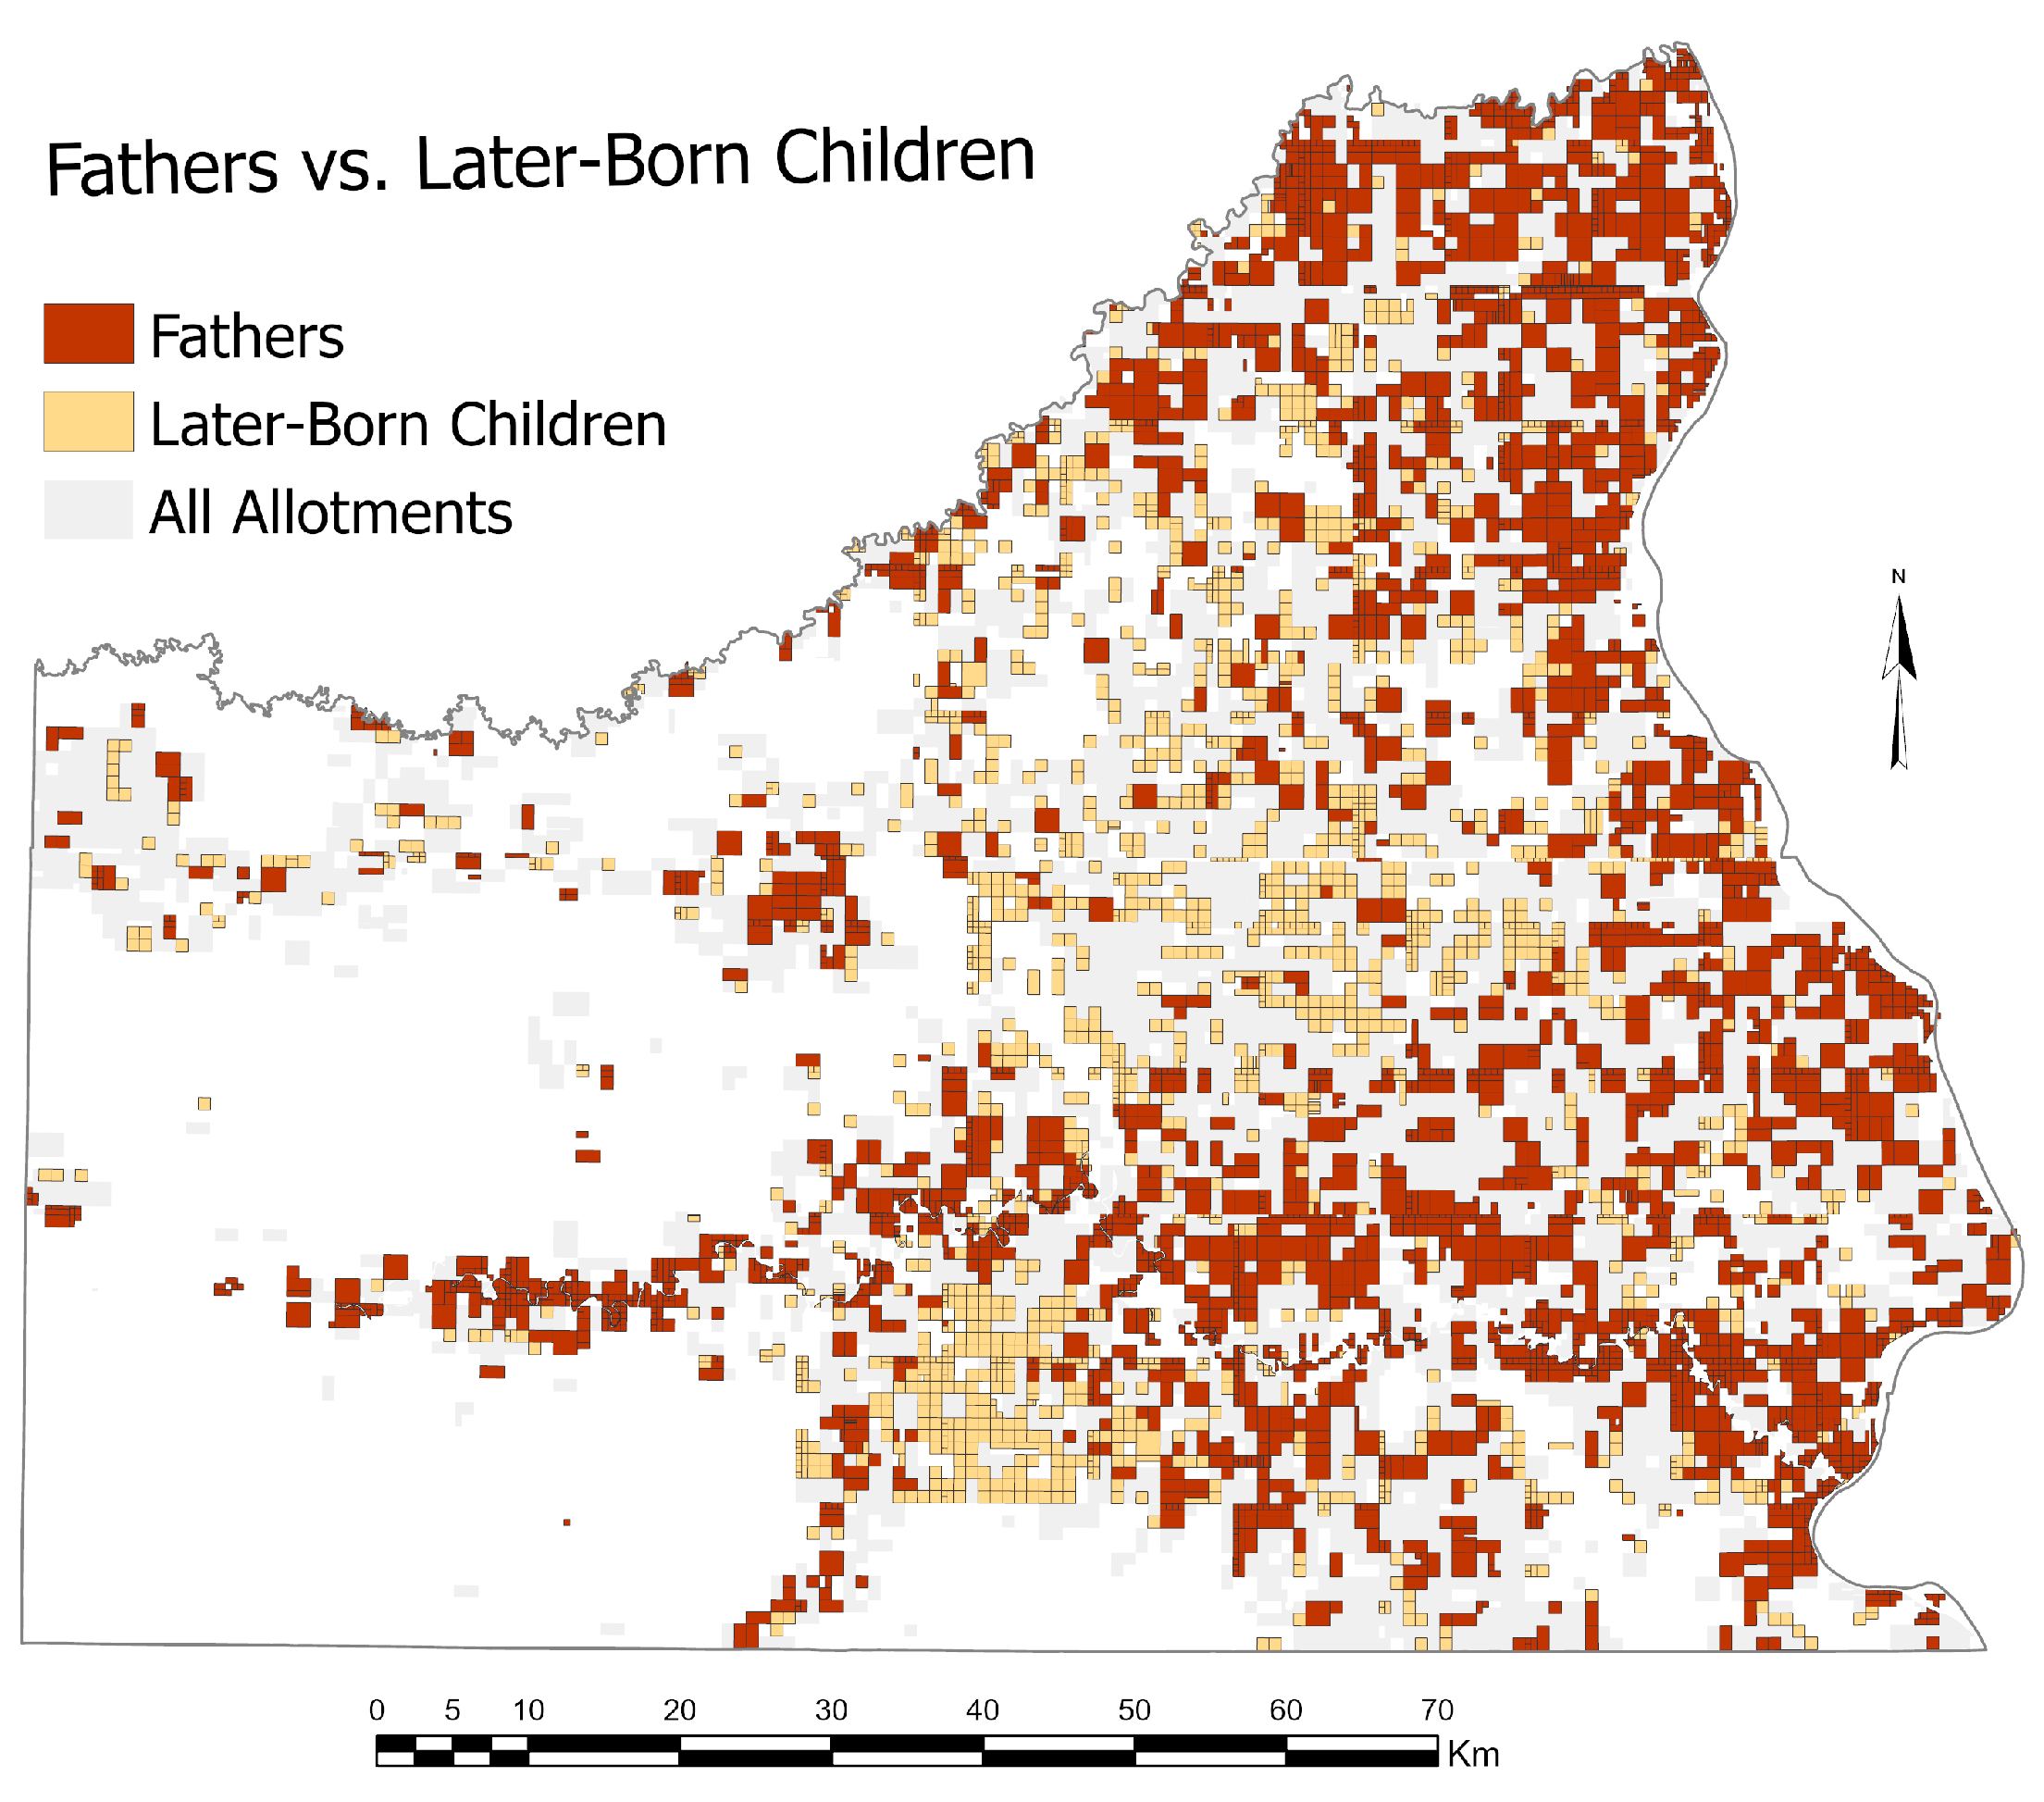
A map of the allotments of fathers and their later-born children (Figure 18) offers a clear contrast with the map of allotments of fathers and their pre-cutoff children (Figure 17, above). Although some of the later-born children’s allotments are interspersed with those of their fathers, it is apparent that there are large numbers of later-born children’s allotments well to the west and separate from those of their fathers. Table 6 confirms this: although the median distance between fathers’ and later-born children’s allotments was only 5.25 km for 1907, the distance jumped to 20.81 km in 1908 and remained in the 20s throughout the remainder of the allotment period. The reason for the low distance value for 1907 is undoubtedly the same as it was for the low value for pre-cutoff children for that year—Gunderson was still making regular allotments in 1907 (the peak year, in fact) and the fortunate few fathers with children born that year were able to select their children’s allotments simultaneously with theirs, and therefore adjacent or nearby.
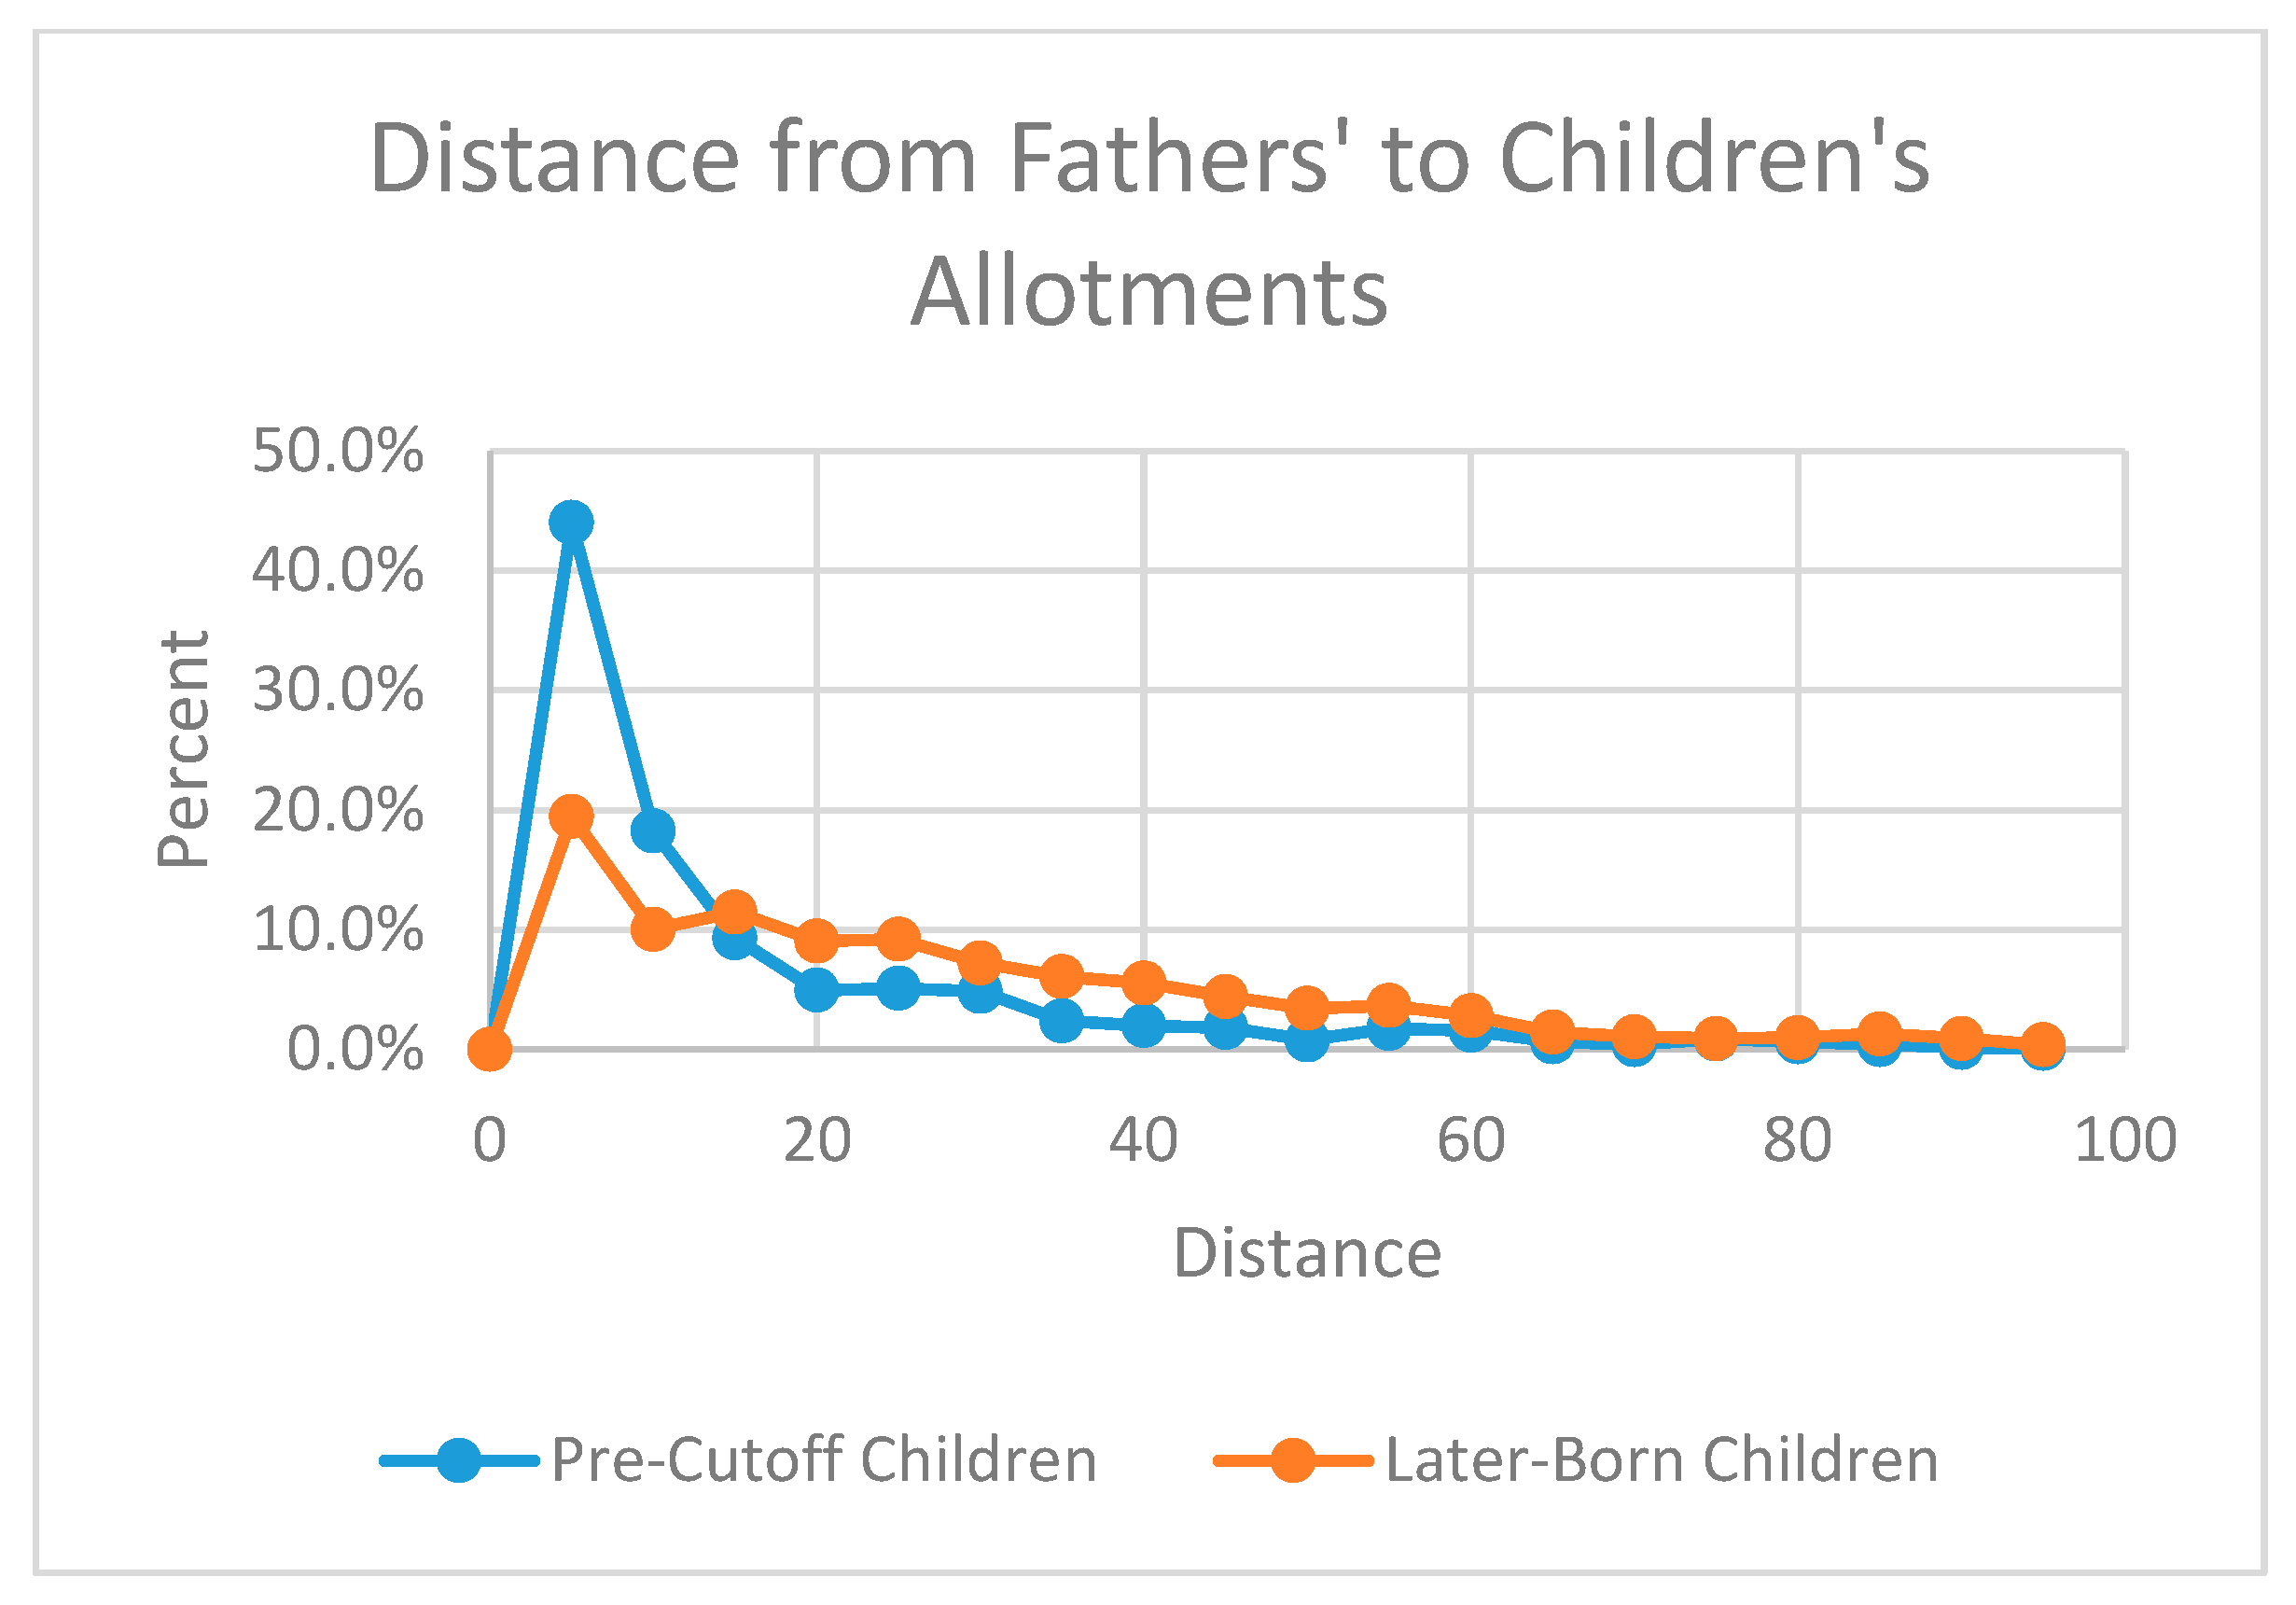
A further comparison of the distance patterns between the allotments made to fathers versus those of their pre-cutoff children and their later-born children can be seen in Figure 19. The height of the two curves at the 5 km point and the “fat tail” on the right side of the curve for later-born children tell the story. As we had surmised, because of the timing of allotments to these two groups, nearly all pre-cutoff children had the advantage of selecting allotments near those of their fathers versus their later-born siblings who had to choose later. Thus, as with allotments to married women, the story was one of good news/bad news. The good news, of course, was the additional land allotted to the later-born children who otherwise would have received none at all and the nearly 189,000 additional acres (75,600 ha) added to the total amount of land held by the people at Standing Rock. The bad news was that much of the land allotted to later-born children was far distant from that of their other family members, making it difficult to form successful farming or ranching enterprises.
One notable feature of the map of allotments of fathers to their later-born children (Figure 18) is the almost complete lack of allotments to later-born children in the western and far southern portions of the reservation, even though other people at Standing Rock had previously chosen their allotments in those areas. This was due to the establishment of the “Diminished Reserve” at the beginning of 1909 in preparation for sales of “surplus” land to the public (Figure 20). After that date, all persons receiving allotments were restricted to selecting their allotments only within the Diminished Reserve (dark blue), approximately 55% of the total area of the reservation. (Gunderson generally referred to the area outside the Diminished Reserve as the “Strip to Be Opened”, i.e., the land to be made available for sale to the public [34] (Letter of 24 November 1908). Since the vast majority of those receiving allotments after 1 January 1909 were later-born children, the concentration of their allotments within the area of the Diminished Reserve is conspicuous, underscoring the fact that these last later-born children were denied the opportunity to select allotments within approximately 45% of the land on their own reservation.
Furthermore, not only did the creation of the Diminished Reserve exclude children born in 1909 and later from selecting land in the “Strip to Be Opened”, it also marked the beginning of the government offering approximately 943,264 acres (381,727 ha) of tribal land for sale to outside settlers—land that by treaty belonged to the people of Standing Rock. Among other things, that land might have provided approximately 5900 additional allotments of 160 acres (64.7 ha) each to children born years into the future.

6. Conclusions and Future Research

6.1. Conclusions

We believe this research is groundbreaking in that it is one of the most complete and detailed examinations of the allotment patterns at any reservation in the U.S., since it explores allotment data in depth using additional attribute information and primary source data sets in the context of the written narrative of the Special Allotting Agent, thus enabling the exploration and discovery of allotment patterns at a detailed, granular level. To summarize, in this study we conducted in-depth research to further explore four specific subject areas: overall allotment patterns, tribal allotment patterns, individual patterns of allotment, and family patterns of allotment. Our major findings are as follows:
  • Overall allotment patterns. Our findings confirmed what we had earlier surmised in [2], namely that, where possible, people appear to have selected allotments on land they had already occupied for years and even decades. As expected, these lands favored proximity to rivers, streams, and timber resources and were therefore focused in the eastern portions of the reservation and along the rivers and streams that are more abundant in that part of the reservation. However, an important caveat is that, as we note above, “the overall pattern of allotments themselves was a reflection not only of the existing settlement patterns and preferences of the people but of the conditions and terms of allotment imposed by the U.S. government”.
  • Tribal allotment patterns. As we had hypothesized, the allotment selections of members of the two major related tribal groups, the Lakota and Dakota, tended to be clustered in separate areas of the reservation, with the Dakota (Upper Yanktonai and Lower Yanktonai) in the north and the Lakota (Hunkpapa and Sihsapa) in the south, although there was a large degree of intermingling.
  • Individual allotment patterns. We confirmed that individual patterns of allotments agreed with Gunderson’s claim that the majority of allottees were taking their allotments “in a compact body”, with nearly two-thirds of allottees (64.5%) selecting only a single parcel of land. Even when allottees were required by geographical or other circumstances to select multiple parcels, the parcels were almost always clustered together, either adjacent to each other or nearby.
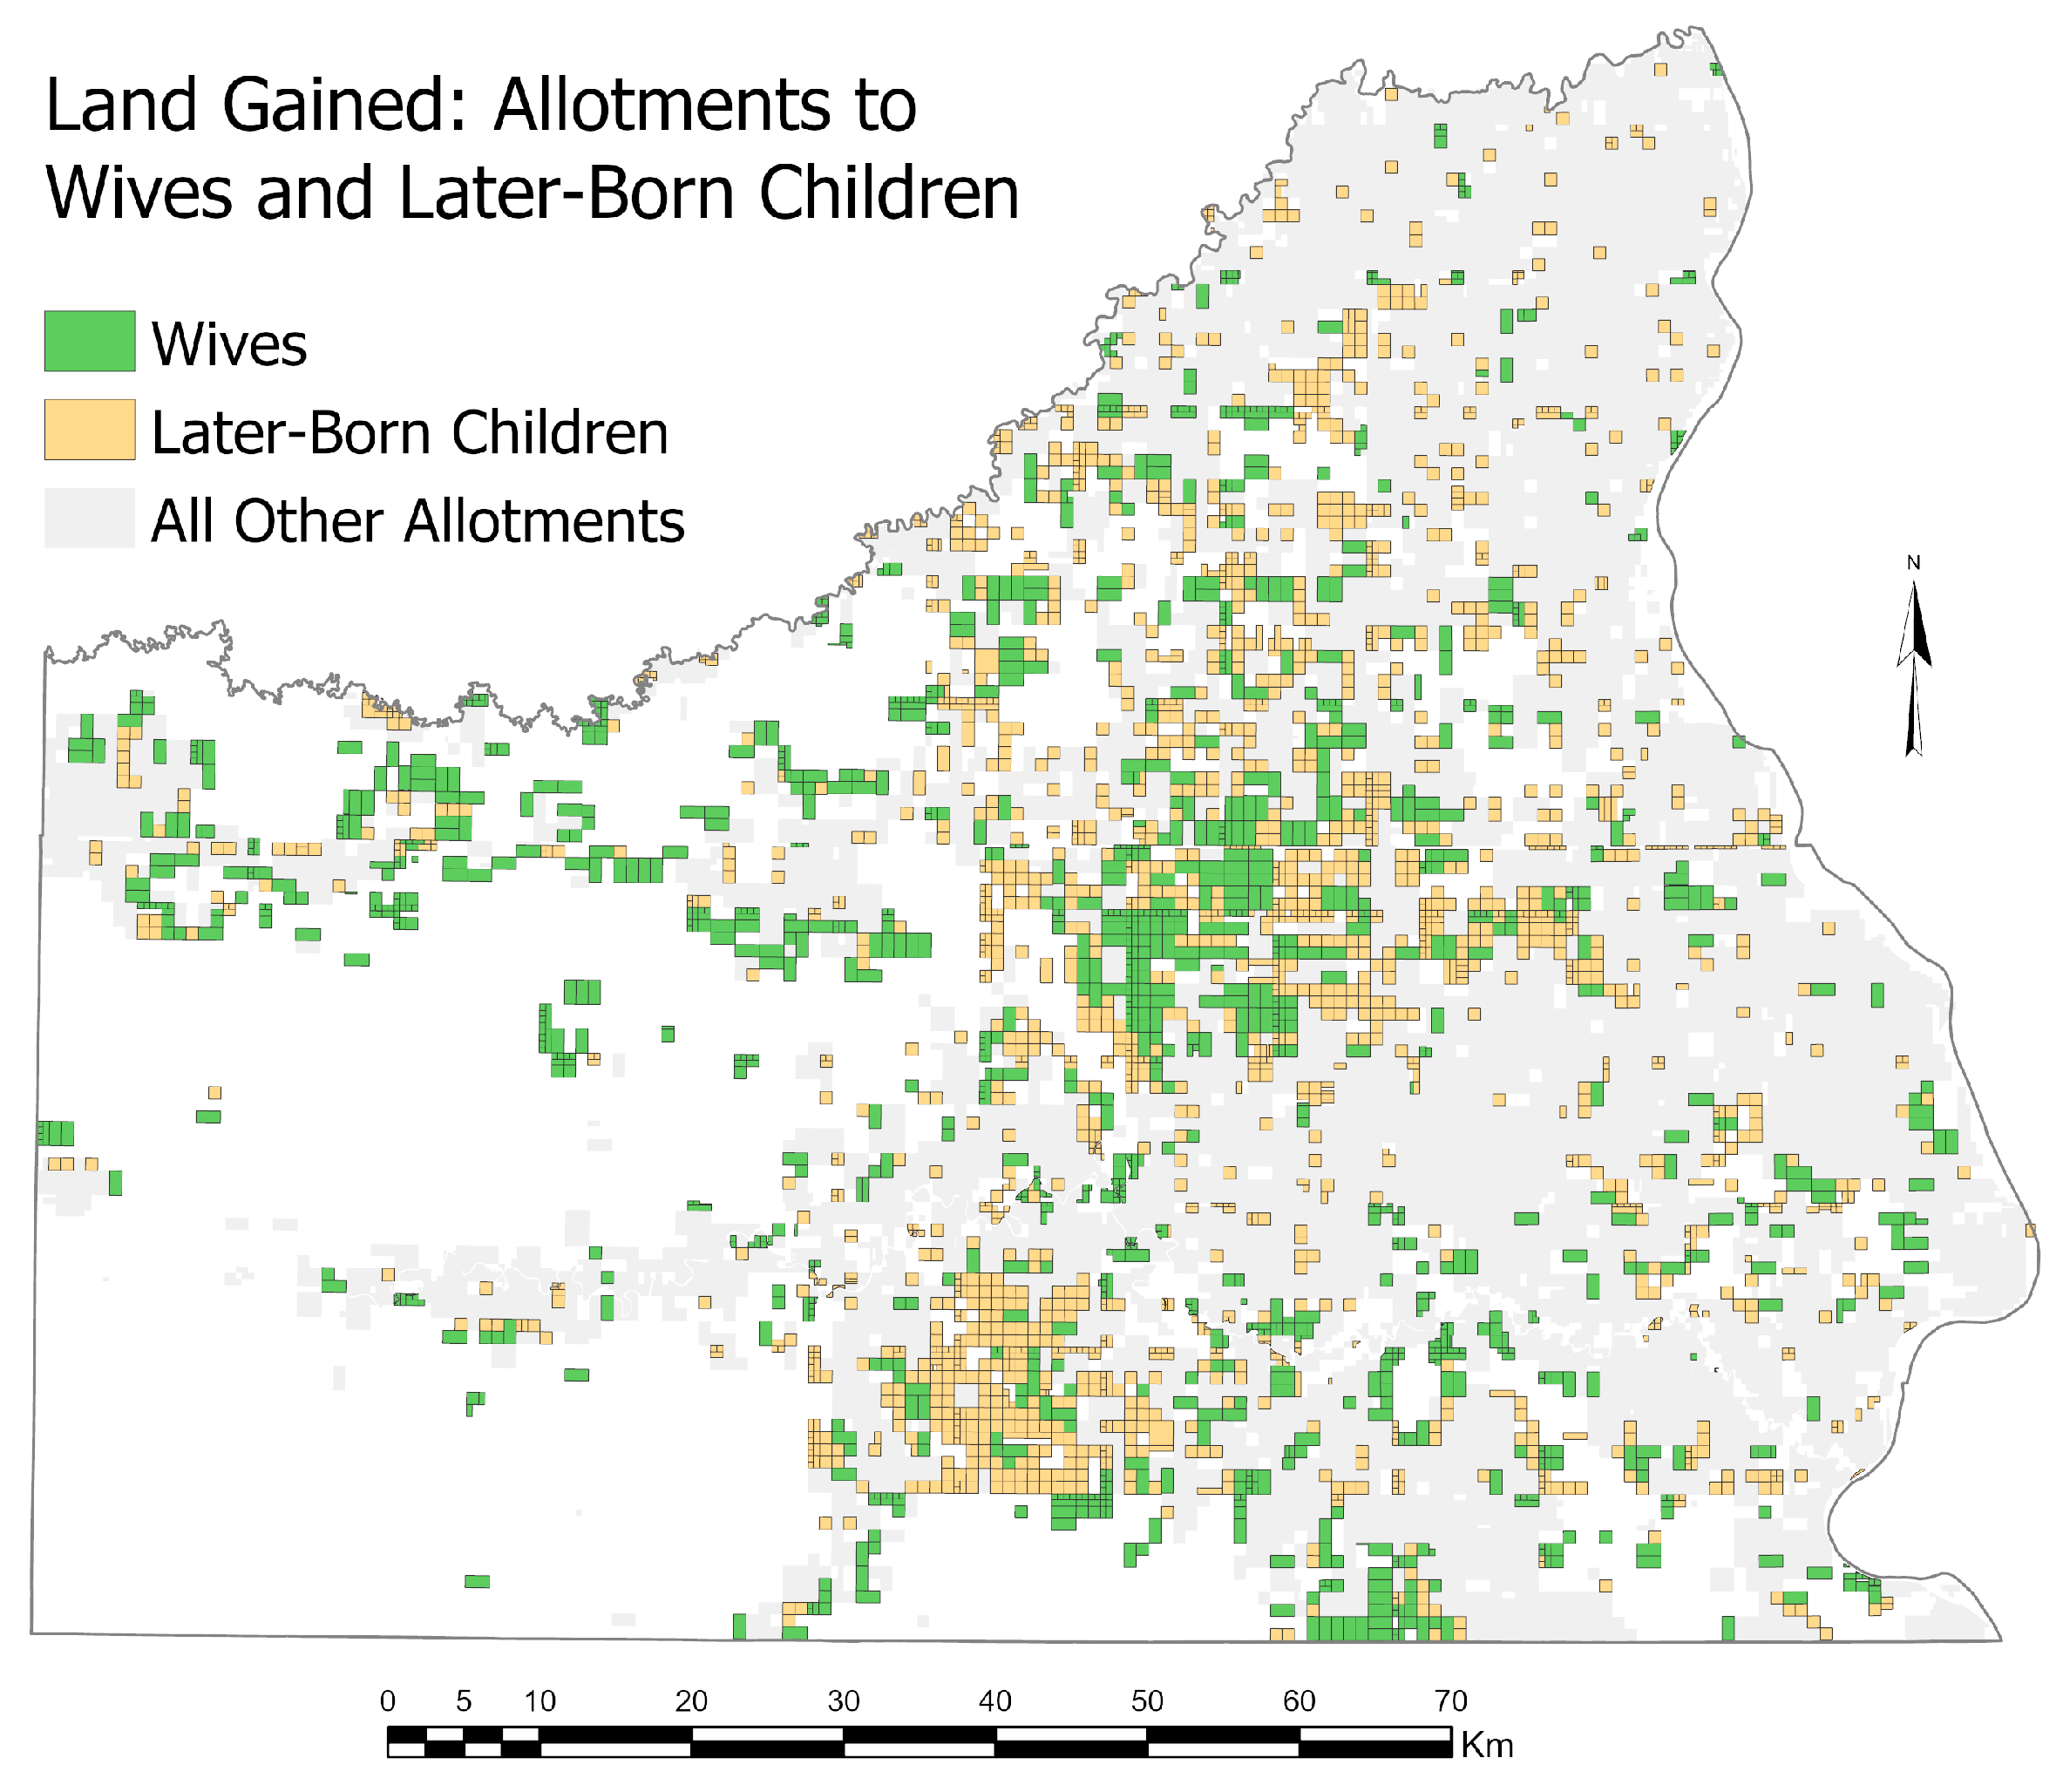
  • Family patterns of allotment. We confirmed that total allotments to families were swelled substantially by allotments to married women and later-born children due to legislation passed by Congress in 1907 at the insistence of the people at Standing Rock and with the support of the Special Allotting Agent and the Office of Indian Affairs. In all, nearly 400,000 acres (approx. 160,000 ha) of land were allotted to individuals who otherwise would have been landless (Figure 21).
However, the belated timing of allotments to wives and later-born children led to disjunct land holding patterns for families (summarized graphically in Figure 11, Figure 13 and Figure 18), which worked against the core idea of allotment as a pillar of assimilation, making it difficult or impossible for families to manage distant and dispersed land parcels for farming or ranching in a semi-arid and harsh environment by essentially creating undersized and isolated land holdings. It became one more factor that tended to encourage allotment holders to either (1) sell off their allotment parcels or (2) lease them to outside ranchers and farmers.

6.2. Unanswered Questions–Future Research Directions

We have analyzed and mapped the distribution of allotted lands based on tribe, age, gender, and family connections at detailed geospatial scales. This research answers a number of key questions about the allotment of land at the Standing Rock Reservation, but it can scarcely claim to be the final word on the subject, as there is much left to explore. For example, when studying families we only focused on nuclear family relationships because of the relatively easy access to that information from the archival records. Although it would prove more difficult, it may be possible to broaden this research to extended families by using information contained in the annual Indian censuses taken by the government beginning in 1887 and continuing through the late 1930s [52].
A major concern for Gunderson and the Indian Office was providing equitable access to timber for all allottees, a resource that was highly valued on the reservation. Since timber at Standing Rock was sparse and located primarily along rivers and streams, a plan was settled on to set aside blocks of timber which were then subdivided into small parcels for each individual [2] (Section 4.1). These parcels provided access to timber for the majority of allottees, but in many cases the timber was far distant from the allottees’ regular allotment parcels. A more in-depth study of the allotment of timber resources using not only the elements of our current GIS database but a map of timber resources at or near the time of allotment digitized from the original survey maps would add a deeper understanding of the allocation of timber resources.
Another topic at Standing Rock that bears exploration is the quality of the lands selected by the allottees, as reflected in surveyor’s notes, soil surveys, land cover maps, or tax assessments, if available, as surrogates for land quality (an issue we discussed earlier in the paper). And, although it would be a significant task, locating and transcribing the surveyors’ notes regarding land quality would add a contemporary evaluation of land quality. The analysis could be done at a broad scale, such as comparing the quality of lands selected by later-born children versus those of their pre-cutoff siblings or the lands chosen by married women versus those of their husbands, who had been able to select their land earlier. Or, it could be done for individuals, such as several mentioned in Gunderson’s letters who had come to regret their initial choices and sought to exchange them for better quality land.
A similar analysis might be done for individuals who had made deals with land agents for the Chicago Milwaukee and St. Paul Railroad to take allotments along the proposed route of the railroad in return for promises by the railroad to purchase the allotted lands at favorable prices. When it turned out that the railroad only planned to pay for the narrow strip of land lying along the right of way instead of the entire allotment parcels, the owners protested to Gunderson that they no longer wanted their allotments and wanted to exchange them [2] (p. 427). He agreed to the exchange because the land along the railroad right of way was of poor value for agriculture. Since the locations of these parcels are known, as are the ones received in exchange, it would be possible to compare the quality of the two sets of allotment selections.
Along the same line, if the 1909 and later allottees, mostly later-born children, had not had to restrict their land selections within the boundaries of the Diminished Reserve, where might they have made their selections? We already know that a fair number of married women and later-born children took allotments in the western part of the reservation (outside the Diminished Reserve) prior to the cutoff date of 1 January 1909. Would post-1909 allottees have continued that pattern, with most, or at least some, of them choosing more distant but presumably better quality land over nearer but lower quality land? Although this is a more complex question, using surrogate measures for land quality, as well as the locations of land selections of close family members, might suggest an answer.
The construction of the Oahe Dam and Reservoir, 1948–1959, displaced numerous owners of allotment lands, which amounted to a loss of 55,993 acres (22,660 ha), including a large amount of prime agricultural land. [63,64]. Using our allotment database, it would be a straightforward matter to map those lands and assess their quality and their value both historically and in the present in the light of the amount of compensation the owners received at the time.
Primarily because of missing data in the archival resources available, we were not able to map the locations of reservation schools, churches, town sites, and agency structures and activities, although we know that land was set aside for them. Access to this information through alternative records would no doubt provide additional information on settlement concentrations. Mapping railroad lines constructed during the time of allotment also should prove to be informative as to allotment choices.
“Micro” patterns might also be explored at individual levels, using both GIS-generated maps and notes from the allotting agents. One example of a micro pattern we discovered at Standing Rock is in the allotment made to Angela Winona (Figure 22), who received an unusually small allotment parcel (as part of her overall allotment) that did not conform to the overall PLSS survey pattern. Although not mentioned in Gunderson’s letters, we surmise that this unique parcel was created to accommodate the land that Angela had already settled and made improvements on and was surrounded by neighbors who made competing claims.
At the general level, there are four other major issues that deserve study in detail at each reservation and across reservations: fractionation, checkerboarding, and leasing and sales of allotment lands to non-tribal members [65]. Each of these phenomena grew out of allotment and each is manifested in spatial patterns across most reservations in the U.S. Archival resources exist to enable the mapping and analysis of many of these issues at both general and fine-grained scales. Of particular concern has been the intractable problem of fractionation, the division of individual land allotment parcels into ever-smaller undivided ownership interests among the heirs of the original allotment recipient [66], (“Land Tenure Issues, Fractionated Ownership”); this has led to myriad legal issues and court cases, but few solutions [66,67]. However, in a recent landmark legal settlement, the U.S. government instituted the Cobell Buyback Program [68,69], where the government purchased fractionated land interests from descendants of allotment holders and deeded the lands to the tribes. Although the specific locations of land parcels purchased under Cobell are not generally available because of privacy concerns, analysis of the detailed summary statistics for each reservation could provide eye-opening insights into the breadth and depth of the fractionation problem and the potential impacts of the Cobell settlement and similar programs.
In a similar vein, by employing the allotment mapping method we have developed, along with publicly available allotment data for other reservations, comparative studies are now possible as a way to examine and contrast the allotment experience at other reservations. For example, one interesting study might be to compare allotment processes and patterns at Standing Rock with those at the Cheyenne River and Pine Ridge reservations in South Dakota. Both of these reservations were also included in the Congressional Act awarding allotments to married women and later-born children [30]. How similar or different were the resulting allotment patterns on those reservations, particularly regarding allotments made to individuals and families? The Cheyenne River Reservation, which abuts Standing Rock to the south, had been allotted just prior to Standing Rock, while Pine Ridge, in the southwest corner of the state, was allotted nearly simultaneously with Standing Rock. Now that there are data available, future researchers can develop their own specific avenues of interest.
Beyond carrying out comparative studies on allotment processes and patterns within the U.S., an expanded focus of comparative studies might examine the geospatial patterns and impacts of the dispossession of Indigenous peoples of their lands in other countries, especially in the Americas (e.g., in Canada [15] or Brazil [17]). Similarly, comparative studies of efforts to reassert and regain rights to Indigenous lands [16] would be of great benefit and insight.
In short, with the tools and datasets now available, these and many more questions are open to visualization, exploration, and analysis. And as this work continues, ideas on how to represent and analyze this data will reveal themselves in ways not previously imagined.

Author Contributions

Conceptualization, Stephen L. Egbert and Joshua J. Meisel; formal analysis, Stephen L. Egbert and Joshua J. Meisel; methodology, Stephen L. Egbert and Joshua J. Meisel; resources, Stephen L. Egbert and Joshua J. Meisel; graphics, Stephen L. Egbert and Joshua J. Meisel; writing—original draft, Stephen L. Egbert and Joshua J. Meisel; writing—review and editing, Stephen L. Egbert. All authors have read and agreed to the published version of the manuscript.

Funding

The authors express appreciation for funding from the Indian Land Tenure Foundation, grant numbers ILTF20151015 and ILTF20170101, and from the General Research Fund of the University of Kansas, grant number 2301149.

Data Availability Statement

All data sources used in this study are publicly available from the U.S. National Archives and Records Administration (NARA), the U.S. Library of Congress, or the Bureau of Land Management. The tables, maps, and numbers included in this paper were prepared from original archival data sources with care and attention to detail. Nevertheless, we acknowledge that errors and omissions are inevitable in data of this nature, whether they occur in the original data, data transcription, or in data analysis. Therefore, the tables, maps, and numbers herein are to be used for illustrative and reference purposes only and should not be relied on, and are not intended, for legal, survey, cadastral, engineering, or navigation purposes.

Acknowledgments

The authors wish to acknowledge Ximena Sevilla Benavides, Chelsea Burgess, and Cheyenne Sun Eagle for assistance in transcribing and analyzing archival records.

Conflicts of Interest

The authors declare no conflict of interest.

Appendix A. Example Map of Government Lots
Figure A1. This map is a portion of a survey map for Rancho San Blas, Montana, USA, that includes a large number of government survey lots. The government survey lots are those that have two numbers in the center of the lot, one above the other: the first is the lot number and second is the number of acres in the lot. For example, in the upper left corner, lot number 2 contains 36.03 acres, while lot number 3, just below it and bordering on Lins Lake, contains 19.7 acres.
Ijgi 14 00363 g0a1

Appendix B. Regular Allotments to Females and Males, by Age and Relationship Category

FemaleChild < 18Adult ≥ 18
Relationship CategoryNumber AllotteesTotal AcresMean AcresNumber AllotteesTotal AcresMean Acres
Wife4839210655210,177321
Mother13203202610,064387
Divorced00---1320320
Widow395031721380,583378
Second Wife00---62212369
Wife of White Man00---21281640
Head (F)420935233319,219582
Present Wife116016000---
Grandmother00---2641321
Aunt00---3962321
Sister9223124862241373
Daughter1224197,3371618226,040318
Stepdaughter3149501603961320
Granddaughter13351527000---
Single (F)919222146220,460330
Orphan (F)717602511320320
Adopted (Daughter)395531800---
Mother-in-law00---3960320
Niece34801600480---
Total Female1312217,5131661098376,921343
   
MaleChild < 18Adult ≥ 18
Relationship CategoryNumber AllotteesTotal AcresMean AcresNumber AllotteesTotal AcresMean Acres
Husband31279426649389,086600
Father1651651147795557
Widower00---2913,710473
Head (M)00---7240,057556
Brother7160122972237320
Nephew23201601320320
Son1158190,75516512941,327320
Stepson294850167113542322
Grandson817622202639319
Adopted 116916900---
Single (M)12223118611336,368322
Orphan (M)9273830400---
Total Male1230206,3571681027535,081521

References

  1. Meisel, J.J.; Egbert, S.L.; Brewer, J.P., II; Li, X. Automated Mapping of Historical Native American Land Allotments at the Standing Rock Sioux Reservation Using Geographic Information Systems. ISPRS Int. J. Geo-Inf. 2021, 10, 183. [Google Scholar] [CrossRef]
  2. Egbert, S.L.; Meisel, J.J. “The Indians Complain, and with Good Cause”: Allotting Standing Rock—U.S. Policy Meets a Tribe’s Assertion of Rights. Geographies 2024, 4, 411–440. [Google Scholar] [CrossRef]
  3. Banner, S. How the Indians Lost Their Land: Law and Power on the Frontier, 1st ed.; The Belknap Press of the Harvard University Press: Cambridge, MA, USA, 2005; ISBN 067402396X. [Google Scholar]
  4. Fritz, H.E. The Movement for Indian Assimilation: 1860–1890; University of Pennsylvania Press: Philadelphia, PA, USA, 1963. [Google Scholar]
  5. Genetin-Pilawa, C.J. Crooked Paths to Allotment: The Fight over Federal Indian Policy After the Civil War; The University of North Carolina Press: Chapel Hill, NC, USA, 2014. [Google Scholar]
  6. Hoxie, F.E. A Final Promise: The Campaign to Assimilate the Indians, 1880–1920; Cambridge University Press: Cambridge, UK, 1984. [Google Scholar]
  7. McDonnell, J.A. The Dispossession of the American Indian, 1887–1934; Indiana University Press: Bloomington, IN, USA, 1991; ISBN 0253336287. [Google Scholar]
  8. Otis, D.S. The Dawes Act and the Allotment of Indian Lands, 1st ed.; University of Oklahoma Press: Norman, OK, USA, 1973; ISBN 0806110392. [Google Scholar]
  9. Sutton, I. Cartographic Review of Indian Land Tenure and Territoriality: A Schematic Approach. Am. Indian Cult. Res. J. 2002, 26, 63–114. [Google Scholar] [CrossRef]
  10. Washburn, W.E. The Assault on Indian Tribalism: The General Allotment Law (Dawes Act) of 1887; Hyman, H.M., Ed.; J.B. Lippincott: Philadelphia, PA, USA, 1975. [Google Scholar]
  11. Debo, A. And Still the Waters Run; Reprint Edition; Princeton University Press: Princeton, NJ, USA, 1973. [Google Scholar]
  12. Gates, P.W. Fifty Million Acres: Conflicts over Kansas Land Policy, 1854–1890; Cornell University Press: Ithaca, NY, USA, 1954. [Google Scholar]
  13. Meyer, M.L. The White Earth Tragedy: Ethnicity and Dispossession at a Minnesota Anishinaabe Reservation, 1889–1920; University of Nebraska Press: Lincoln, NE, USA, 1999. [Google Scholar]
  14. Paulson, H.W. The Allotment of Land in Severalty to the Dakota Indians before the Dawes Act. South Dak. Hist. 1971, 1, 132–153. [Google Scholar]
  15. Harris, C. Making Native Space: Colonialism, Resistance, and Reserves in British Columbia; UBC Press: Vancouver, BC, Canada, 2002. [Google Scholar]
  16. Herlihy, P.H.; Knapp, G. Maps of, by, and for the peoples of Latin America. Hum. Organ. 2003, 62, 303–314. [Google Scholar] [CrossRef]
  17. Chernela, J. Lex Talionis: Recent Advances and Retreats in Indigenous Rights in Brazil. J. Lat. Am. Anthropol. 2006, 11, 138–153. [Google Scholar] [CrossRef]
  18. Brennan, S. Terra nullius, aboriginal sovereignty and land rights in Australia. Political Geogr. 1993, 12, 319–346. [Google Scholar]
  19. Byrnes, G. Boundary Markers: Land Surveying and the Colonisation of New Zealand; Bridget Williams Books: Wellington, New Zealand, 2001. [Google Scholar]
  20. U.S. Congress. U.S. Statutes at Large, Volume 24—1887, 49th Congress. United States—1887. An Act to Provide for the Allotment of Lands in Severalty to Indians—On the Various Reservations, and to Extend the Protection of the Laws of the United States and the Territories over the Indians, and for Other Purposes. Retrieved from the Library of Congress. 1887. Available online: https://www.loc.gov/item/llsl-v24/ (accessed on 14 July 2025).
  21. U.S. Congress. U.S. Statutes at Large, Volume 12—1861, 36th and 37th Congress. United States—1861. Chap. 75. An Act to Secure Homesteads to Actual Settlers on the Public Domain. Retrieved from the Library of Congress. Available online: https://www.loc.gov/item/llsl-v12/ (accessed on 14 July 2025).
  22. U.S. Congress. U.S. Statutes at Large, Volume 41–1921, 66th Congress. United States, 1919–1921. Chap 224, Section 6. An Act To Provide for the Allotment of Lands of the Crow Tribe, for the Distribution of Tribal Funds, and for Other Purposes. Retrieved from the Library of Congress. Available online: https://www.loc.gov/item/llsl-v41/ (accessed on 14 July 2025).
  23. U.S. Congress. U.S. Statutes at Large, Volume 34—1907, 59th Congress. United States—1907. Chap. 2285. An Act Making Appropriations for the Current and Contingent Expenses of the Indian Department, for Fulfilling Treaty Stipulations with Various Indian Tribes, and for Other Purposes, for the Fiscal Year Ending June Thirtieth, Nineteen Hundred and Eight. Retrieved from the Library of Congress. 1907. Available online: https://www.loc.gov/item/llsl-v34/ (accessed on 14 July 2025).
  24. United States v. Powers, 305 U.S. 527, 1939. Retrieved from: JUSTIA: U.S. Supreme Court. Available online: https://supreme.justia.com/cases/federal/us/305/527/ (accessed on 14 July 2025).
  25. Sherman, W.T.; Harney, W.S.; Terry, A.H.; Augur, C.C.; Henderson, J.B.; Taylor, N.G.; Sanborn, J.B.; Tappan, S.F. Treaty with the Sioux–Brule, Oglala, Miniconjou, Yanktonai, Hunkpapa, Blackfeet, Cuthead, Two Kettle, San Arcs, and Santee and Arapaho [Fort Laramie Treaty], 29 April 1868; Record on File at National Archives and Records Administration; General Records of the United States Government, Record Group: Washington, DC, USA; Indian Treaties: Washington, DC, USA, 1868; pp. 1722–1869.
  26. U.S. Congress. U.S. Statutes at Large, Volume 25—1889, 50th Congress. United States—1889. [Periodical] Chap 405. An Act to Divide a Portion of the Reservation of the Sioux Nation of Indians in Dakota into Separate Reservations and to Secure the Relinquishment of the Indian Title to the Remainder, and for Other Purposes. March 2, 1889, pp. 888–899. Retrieved from the Library of Congress. 1889. Available online: https://www.loc.gov/item/llsl-v25/ (accessed on 14 July 2025).
  27. Standing Rock Agency. Copies of Correspondence Received, 1869–1910. Record on File at National Archives and Records Administration, Kansas City Branch (NARA-KC) USA, ARC ID: 1986649, Record Group 75, Boxes 23–68; Department of the Interior, Office of Indian Affairs: Washington, DC, USA, 1986.
  28. Stretton, T.; Kesselring, K.J. Introduction: Coverture and Continuity. In Married Women and the Law: Coverture in England and the Common Law World; Stretton, T., Kesselring, K.J., Eds.; Montreal and Kingston: Kingston, ON, Canada, 2013; p. 3. [Google Scholar]
  29. Ireland, E. Re-examining the Presumption: Coverture and ‘Legal Impossibilities’ in Early Modern English Criminal Law. J. Leg. Hist. 2022, 43, 187–209. [Google Scholar] [CrossRef]
  30. U.S. Congress. U.S. Statutes at Large, Volume 35—1909, 60th Congress. United States—1909. [Periodical] Chap. 218. An Act to Authorize the Sale and Disposition of a Portion of the Surplus and Unallotted Lands in the Cheyenne River and Standing Rock Indian Reservations in the States of South Dakota and North Dakota, and Making Appropriation and Provision to Carry the Same into Effect. Retrieved from the Library of Congress. 1908. Available online: https://www.loc.gov/item/llsl-v35/ (accessed on 14 July 2025).
  31. Sun Eagle, C. Spatial and Temporal Patterns of Land Allotment on the Pawnee Reservation. Master’s Thesis, University of Kansas, Lawrence, KS, USA, 2019. [Google Scholar]
  32. Moore, J.H. Aboriginal Indian Residence Patterns Preserved in Censuses and Allotments. Science 1980, 207, 201–202. [Google Scholar] [CrossRef] [PubMed]
  33. Moore, J.H. The Cheyenne Nation: A Social and Demographic History; University of Nebraska Press: Lincoln, NE, USA, 1988. [Google Scholar]
  34. Standing Rock Agency. Copies of Correspondence Sent by the Special Allotting Agent, 1906–1910; [Gunderson Letters]; Department of the Interior, Office of Indian Affairs, Record on File at National Archives and Records Administration, Kansas City Branch (NARA-KC) USA, ARC ID: 5634369, Record Group 75, Box 735; Standing Rock Agency: Washington, DC, USA, 1910. Available online: https://catalog.archives.gov/id/5634369 (accessed on 21 August 2025).
  35. U.S. Library of Congress, Research Guides. Reservations and Allotments, in Native American Spaces: Cartographic Resources at the Library of Congress. Available online: https://guides.loc.gov/native-american-spaces/cartographic-resources/reservations-allotments (accessed on 21 August 2025).
  36. Hoffmeister, H. The Consolidated Ute Indian Reservation. Geogr. Rev. 1945, 35, 601–623. [Google Scholar] [CrossRef]
  37. Middleton, E.R. Seeking Spatial Representation: Reflections on Participatory Ethnohistorical GIS Mapping of Maidu Allotment Lands. Ethnohistory 2010, 57, 363–387. [Google Scholar] [CrossRef]
  38. Greenwald, E. Allotment in Severalty: Decision-making During the Dawes Act Era on the Nez Perce, Jicarilla Apache, and Cheyenne River Sioux Reservations. Ph.D. Thesis, Yale University, New Haven, CT, USA, 1994. [Google Scholar]
  39. Greenwald, E. Reconfiguring the Reservation: The Nez Perce, Jicarilla Apaches, and the Dawes Act, 1st ed.; University of New Mexico Press: Albuquerque, NM, USA, 2002. [Google Scholar]
  40. Greenwald, E. (Historical Research Associates, Inc., Missoula, MT, USA). Personal communication, 2020.
  41. Palmer, M. Sold! The Loss of Kiowa Allotment in the Post-Indian Reorganization Era. Am. Indian Cult. Res. J. 2011, 35, 37–57. [Google Scholar] [CrossRef]
  42. Kretzler, I. Archives of Native Presence: Land Tenure Research on the Grand Ronde Reservation. Am. Indian Cult. Res. J. 2017, 41, 45–70. [Google Scholar] [CrossRef]
  43. Kretzler, I. An Archaeology of Survivance on the Grand Ronde Reservation: Telling Stories of Enduring Native Presence. Ph.D. Thesis, University of Washington, Seattle, WA, USA, 2019. [Google Scholar]
  44. Egbert, S.; Smith, P. “Great Frauds and Grievous Wrongs”: Mapping the Loss of Kickapoo Allotment Lands. In Native American Symposium, Representations and Realities; Southeastern Oklahoma State University: Durant, OK, USA, 2017. [Google Scholar]
  45. Allen, A.G. Allotting the Omaha Reservation: Patterns and Impacts, 1884–1940. Ph.D. Thesis, University of Kansas, Lawrence, KS, USA, 2019. [Google Scholar]
  46. Dippel, C.; Frye, D. The Effect of Land Allotment on Native American Households During the Assimilation Era. 2021; unpublished manuscript. Available online: https://dustindfrye.com/files/dawes_.pdf (accessed on 13 July 2025).
  47. Dippel, C.; Frye, D.; Leonard, B. Property Rights Without Transfer Rights: A Study of Indian Land Allotment, 67 pp. Natl. Bur. Econ. Res. 2020. [Google Scholar] [CrossRef]
  48. Village Earth Native Lands Advocacy Project. Pine Ridge Land Information System. Available online: https://nativeland.info/maps/pine-ridge-land-information-system-prlis/ (accessed on 21 August 2025).
  49. Webb, W.P. The Great Plains; Ginn and Company: Boston, MA, USA, 1931. [Google Scholar]
  50. Brooks, A.; Jacon, S.; Bedeau, M. (Eds.) Homesteading and Agricultural Development Context; South Dakota State Historical Preservation Center: Vermillion, SD, USA, 1994.
  51. Bureau of Land Management. General Land Office Records. Bureau of Land Management. Available online: www.glorecords.blm.gov (accessed on 28 June 2025).
  52. United States, Bureau of Indian Affairs. Indian Census Rolls, 1885–1940. National Archives and Records Administration. Available online: https://www.archives.gov/research/census/native-americans/1885-1940.html (accessed on 28 June 2025).
  53. ESRI. ArcGIS Pro. Standard Distance. Available online: https://pro.arcgis.com/en/pro-app/latest/tool-reference/spatial-statistics/standard-distance.htm (accessed on 23 August 2025).
  54. White, C.A. A History of the Rectangular Survey System; Department of the Interior, Bureau of Land Management: Washington, DC, USA, 1983.
  55. Wishart, D.J. An Unspeakable Sadness: The Dispossession of the Nebraska Indians; University of Nebraska Press: Lincoln, NE, USA, 1995. [Google Scholar]
  56. United States Department of the Interior. Annual Report of the Commissioner of Indian Affairs to the Secretary of the Interior for the Year 1871; GPO: Washington, DC, USA, 1871; Retrieved from the University of Wisconsin Digital Collections. Available online: https://search.library.wisc.edu/digital/AGUE2MXEEDR2LD8B (accessed on 14 July 2025).
  57. United States Department of the Interior. Annual Report of the Commissioner of Indian Affairs to the Secretary of the Interior for the Year 1872; GPO: Washington, DC, USA, 1872; Retrieved from the University of Wisconsin Digital Collections. Available online: https://search.library.wisc.edu/digital/ASDQ2JVRPCCT2N8T (accessed on 14 July 2025).
  58. United States Department of the Interior. Annual Report of the Commissioner of Indian Affairs to the Secretary of the Interior for the Year 1883; GPO: Washington, DC, USA, 1883; Retrieved from the University of Wisconsin Digital Collections. Available online: https://search.library.wisc.edu/digital/AUSIINXBHKS3GO8P (accessed on 14 July 2025).
  59. United States Department of the Interior. Annual Report of the Commissioner of Indian Affairs to the Secretary of the Interior for the Year 1885; GPO: Washington, DC, USA, 1885; Retrieved from the University of Wisconsin Digital Collections. Available online: https://search.library.wisc.edu/digital/AC5UOFLSZHEGOL8A (accessed on 14 July 2025).
  60. Jensen, J.M. Native American women and agriculture: A Seneca case study. Sex Roles 1977, 3, 423–441. [Google Scholar] [CrossRef]
  61. Bobroff, K.H. Retelling Allotment: Indian Property Rights and the Myth of Common Ownership. Vanderbilt Law Rev. 2001, 54, 1557–1624. Available online: https://scholarship.law.vanderbilt.edu/vlr/vol54/iss4/2 (accessed on 14 July 2025).
  62. Strong, W. Quoted in Prucha, F.P. The Great Father: The United States Government and the American Indians; University of Nebraska Press: Lincoln, NE, USA, 1984; Volume 1, p. 672. [Google Scholar]
  63. Randell, H.; Curley, A. Dams and Tribal Land Loss in the United States. Environ. Res. Lett. 2023, 18, 094011. [Google Scholar] [CrossRef] [PubMed]
  64. Lawson, M.L. Dammed Indians: The Pick-Sloan Plan and the Missouri River Sioux, 1944–1980; University of Oklahoma Press: Norman, OK, USA, 1982; ISBN 0-8061-2672-8. [Google Scholar]
  65. Indian Land Tenure Foundation. Land Issues. Available online: https://iltf.org/land-issues/issues/ (accessed on 11 September 2025).
  66. Royster, J.V. The Legacy of Allotment. Ariz. State Law J. 1995, 27, 1–78. [Google Scholar]
  67. Shoemaker, J.A. Like Snow in the Spring Time: Allotment, Fractionation, and the Indian Land Tenure Problem. Wis. Law Rev. 2003, 4, 729–788. [Google Scholar]
  68. Cobell v. Salazar. 573 F.3d 808, United States Court of Appeals for the District of Columbia Circuit, 2009. Retrieved from FindLaw. Available online: https://caselaw.findlaw.com/court/us-dc-circuit/1385636.html (accessed on 14 July 2025).
  69. United States Department of the Interior. Land Buy-Back Program for Tribal Nations. U.S. Department of the Interior. 25 April 2016. Available online: www.doi.gov/buybackprogram (accessed on 14 July 2025).
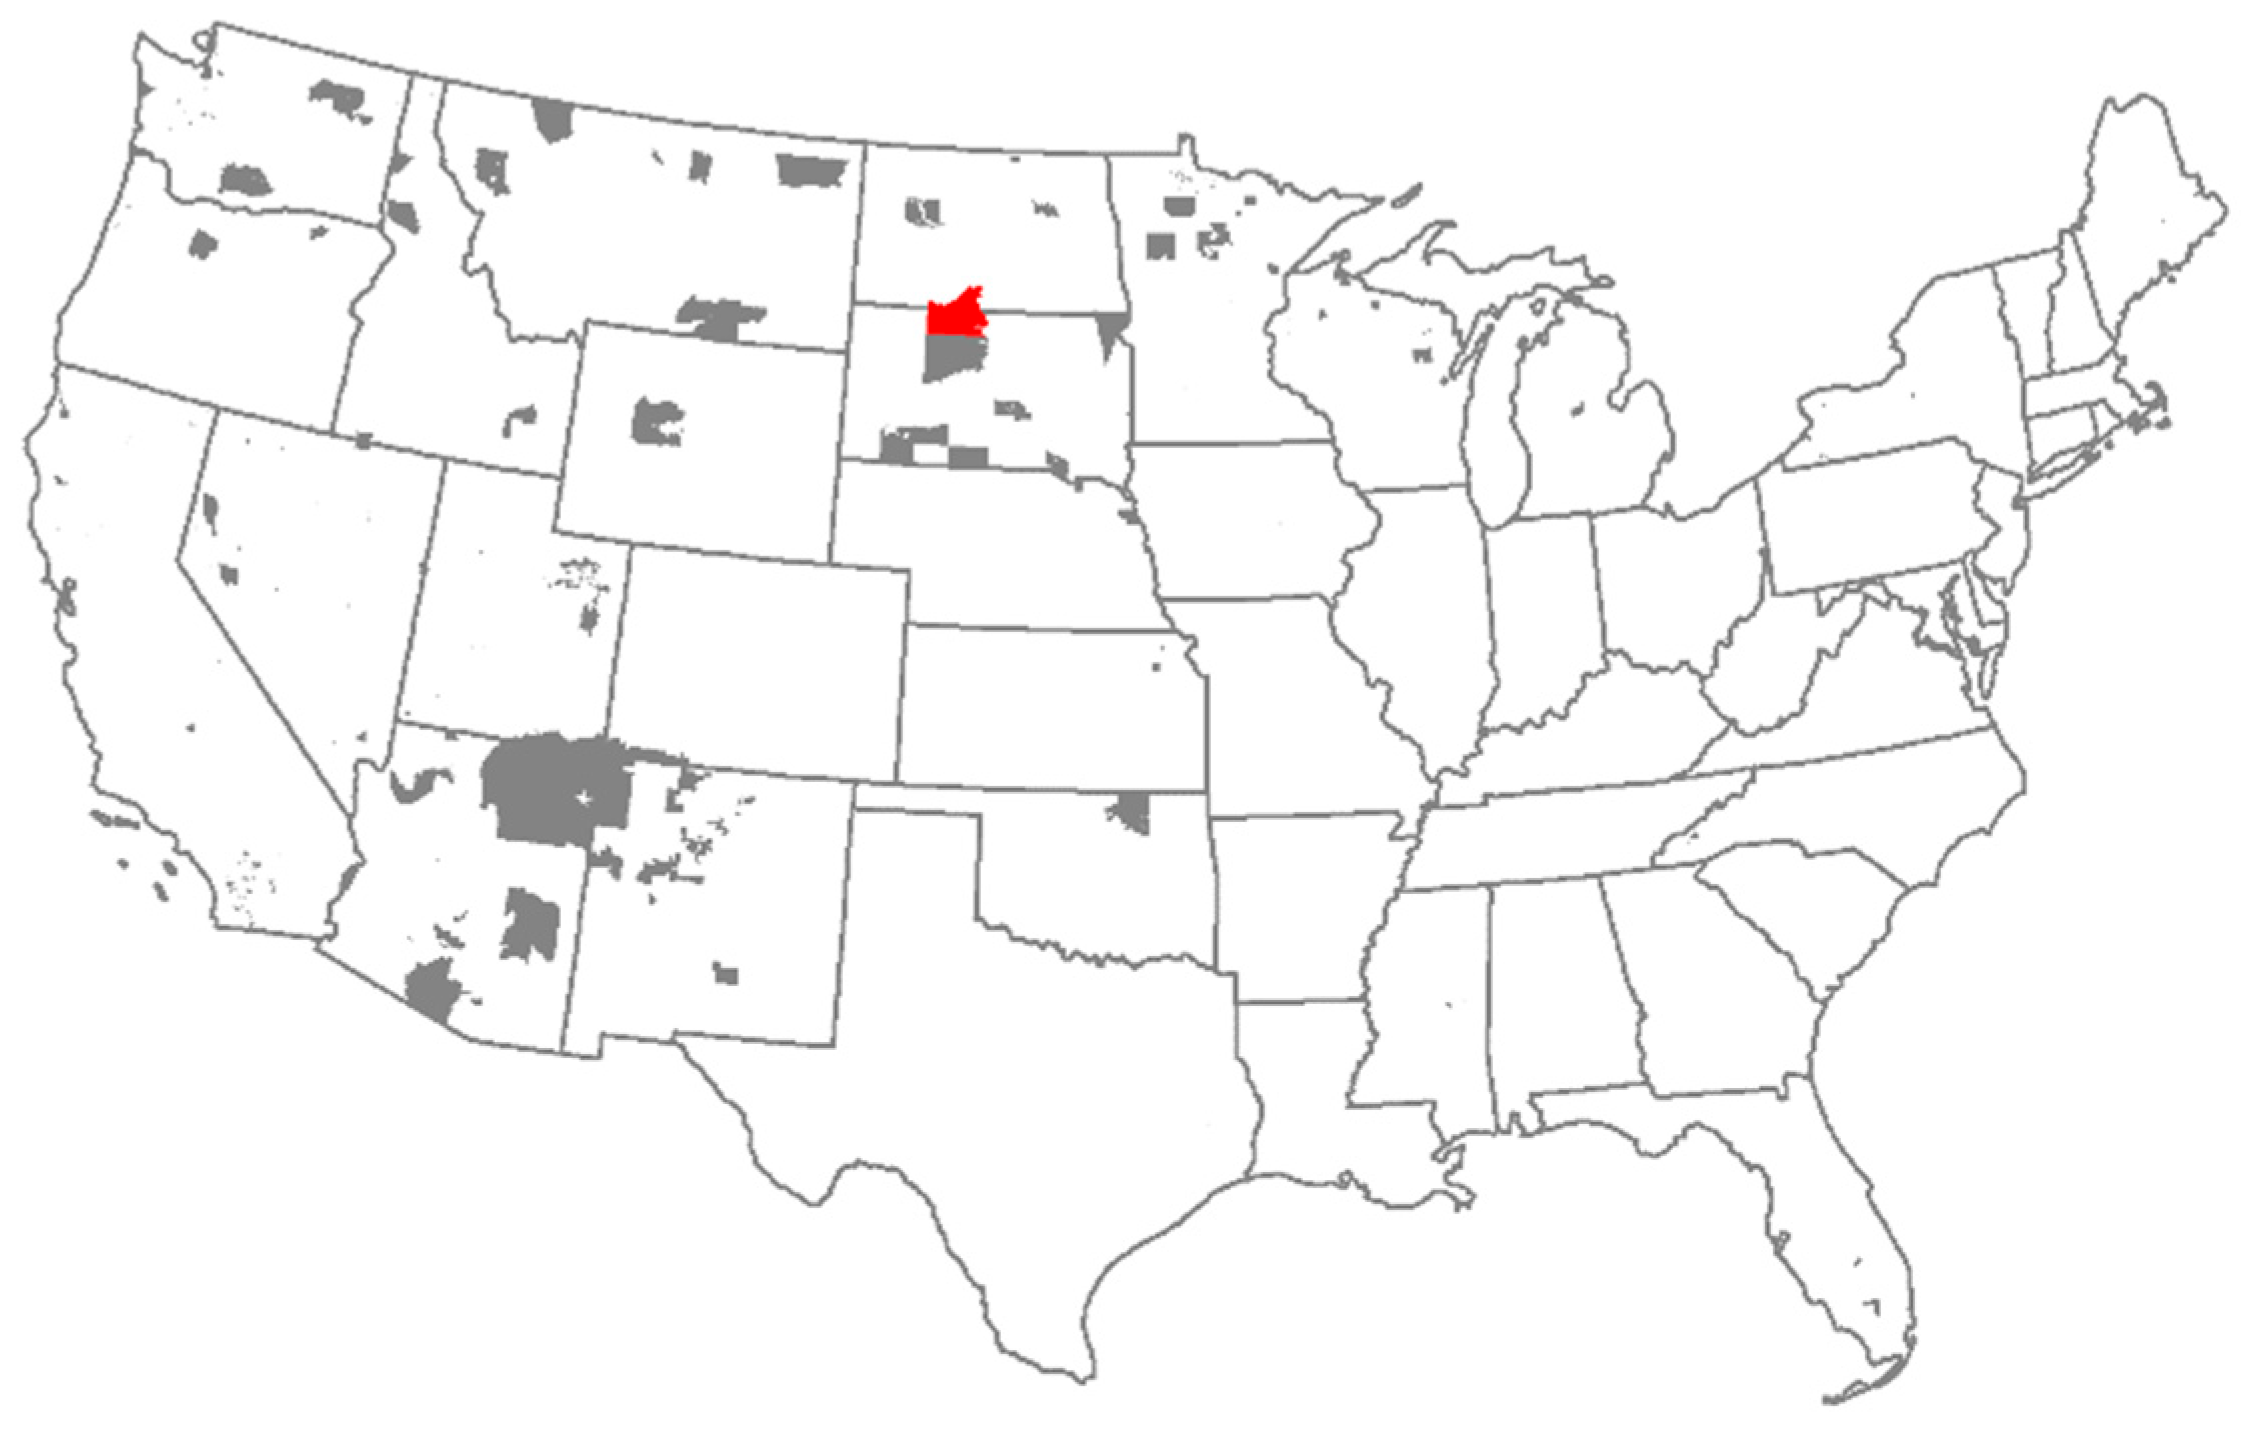
Figure 1. Map of American Indian reservations in the contiguous United States. The Standing Rock Sioux reservation is highlighted in red. Data source: U.S. Census Bureau, Federal American Indian Reservations (AIR). Used with permission [1].
Ijgi 14 00363 g001
Figure 2. Yearly allotment numbers—total and by category of recipient. Y-axis shows number of allotments. Although allotments to later-born children (beige) began sometime in 1907, allotments to married women (green) did not begin until the next year. From [2], used with permission.
Ijgi 14 00363 g002
Figure 3. Standard distance formula, unweighted, in two dimensions.
Ijgi 14 00363 g003
Figure 4. Spatio-temporal pattern of allotment making at Standing Rock (modified from [2], used with permission).
Ijgi 14 00363 g004
Figure 5. Final map of allotments, Standing Rock.
Ijgi 14 00363 g005
Figure 6. Example of Public Land Survey System (PLSS) subdivisions at Standing Rock. The largest squares are 640 acres (259 ha) in size, the size of an allotment authorized to a head of household. Rectangles of half that size (320 acres, 129 ha) were awarded to single adults and married women, while square parcels one-quarter that size (160 acres, 65 ha) were awarded to minor children. The vertical column of smaller squares on the right side of the figure consists of government lots (see Appendix A for further explanation).
Ijgi 14 00363 g006
Figure 7. Allotments by Tribes at Standing Rock. The Dakota linguistic group generally settled in the north, while the Lakota group generally settled in the south, although there was significant intermingling.
Ijgi 14 00363 g007
Figure 8. Allotment parcels and standard distance circle (1.0 std. dev.) for Brave Crow. Radius of circle is 2.28 km, i.e., the standard distance. Distance between centroids of the two parcels with the greatest distance between them is 6.35 km.
Ijgi 14 00363 g008
Figure 9. Frequency distribution curve of standard distance between parcels for allottees with three or more allotment parcels. Peak distance, representing over 80% of allottees with three or more parcels, is at approximately 5 km.
Ijgi 14 00363 g009
Figure 10. Histogram of family sizes at Standing Rock during time of allotment. Mean family size was 4.3 for families or two or more persons.
Ijgi 14 00363 g010
Figure 11. Frequency distribution curve of standard distance between all allotment parcels, by family. Because of the belated awarding of allotments to married women and later-born children, standard distances for family allotments tended to be quite large, sometimes as much as 50 km or more.
Ijgi 14 00363 g011
Figure 12. Allotment parcels and standard distance circles (1 std. dev.) for three representative families at Standing Rock, ranging from relatively compact to widely dispersed distributions of parcels.
Ijgi 14 00363 g012
Figure 13. Locations of allotments to husbands in relation to allotments to wives.
Ijgi 14 00363 g013
Figure 14. Distance distribution of husbands’ allotments to those of their wives. Mean distance was 22.3 km, which is one indication of the greatly reduced ability of most married couples to manage their land as a single farm or ranch.
Ijgi 14 00363 g014
Figure 15. Allotments to two married couples: Luke and Amy Eagleman (orange) and Walter and Annie Iron (green). The large distances reflect the belated timing of allotment to wives.
Ijgi 14 00363 g015
Figure 16. Allotments to pre-cutoff vs. later-born children, by year. Allotments to pre-cutoff children (orange) began in 1906 and were virtually completed by 1908, while allotments to later-born children (blue) began on a small scale in 1907 and comprised nearly half of children’s allotments in 1908. From 1909 until the end of allotment, nearly all allotments were made to later-born children.
Ijgi 14 00363 g016
Figure 17. Allotments to fathers vs. pre-cutoff children.
Ijgi 14 00363 g017
Figure 18. Allotments to fathers vs. those of their later-born children.
Ijgi 14 00363 g018
Figure 19. Distance from fathers’ allotments to their children’s allotments: pre-cutoff children vs. later-born children. Even though allotments to pre-cutoff children (blue) began part-way through 1907, a large proportion of those allotments was made while regular allotments were still ongoing, enabling fathers to choose allotments for their pre-cutoff children that were closer to their own allotments. Allotments to later-born children (orange) did not begin until 1908, after most regular allotments had been made, which generally meant that those children’s allotments were farther away from those of their fathers than with pre-cutoff children.
Ijgi 14 00363 g019
Figure 20. Diminished Reserve and the Strip to Be Opened. The Diminished Reserve was established as of 1 January 1909 in preparation for opening the area outside the Diminished Reserve (i.e., the Strip to be Opened) for the sale of “surplus lands”.
Ijgi 14 00363 g020
Figure 21. Land gained by allotments to married women and later-born children. Although these belated allotments added nearly 400,000 acres (~160,000 ha) of land, the majority of the land was located west of the majority of allotments.
Ijgi 14 00363 g021
Figure 22. Unique allotment to Angela Winona.
Ijgi 14 00363 g022
Table 1. Annual number of allotments at Standing Rock. From [2], used with permission. (Note that the small differential between the last-numbered allottee, 4726, and the total number of allotments, 4699, is likely due to relinquished or cancelled allotments).
YearAllottee Roll
Numbers
Annual Number of
Allotments
Cumulative Number of AllotmentsPercentCum. %
19061–87187187118.5%18.5%
1907872–24941623249434.5%53.0%
19082495–37681274376627.1%80.1%
19093769–402625840265.5%85.6%
1910 to end4027–4726673469914.3%99.9%
Table 2. Allotments based on tribal affiliation (minor differences due to rounding).
TribeAllottees% of AllotmentsAcres AllottedHectares% of Land Allotted Allotted
Blackfoot78017%221,54889,65716%
Hunkpapa167936%491,112198,74636%
Lower Yanktonai116825%326,420132,09725%
Upper Yanktonai4159%120,48848,7609%
Other/Blank65714%183,18474,13215%
Total4699-------1,342,752543,392-
Table 3. Allotments by age and sex. Note that although boys and girls under the age of 18 received, on average, the same amount of land, adult females received far fewer acres that adult men—343 acres vs. 521 acres (139 ha vs. 211 ha).
Age and Sex CategoryNumberAcresHaMean AcresMean Ha
Adult Men ≥ 181028535,401216,669521210.8
Boys < 181231206,51683,57416868.0
Adult Women ≥ 181102378,036152,986343138.8
Girls < 181319218,79488,54216667.2
Not reported194005162121185.4
Total46991,342,752543,392286115.7
Table 4. Total count and percentage of number of allottees that took a given number of parcels (note that most took their allotment as a single parcel, but over one-third selected multiple parcels).
Num. of ParcelsNum. of Allottees Percent
1303064.48%
2 to 6135128.75%
≥73186.77%
Table 5. Distance from fathers’ allotments to those of their pre-cutoff children, by year.
Measure (km)190619071908
Median5.285.2027.55
Standard Deviation9.1714.9823.52
Table 6. Distance from fathers’ allotments to those of their later-born children, by year.
Measure (km)190719081909Post-1909
Median5.2520.8126.7021.53
Standard Deviation15.5426.6321.4920.00
Disclaimer/Publisher’s Note: The statements, opinions and data contained in all publications are solely those of the individual author(s) and contributor(s) and not of MDPI and/or the editor(s). MDPI and/or the editor(s) disclaim responsibility for any injury to people or property resulting from any ideas, methods, instructions or products referred to in the content.