Article

Analysis of Land-Use Spatial Equilibrium in the Yangtze River Economic Belt Under the Context of High-Quality Development: Quantity Balance and Efficiency Coordination

Department of Land Resource Management, School of Public Administration, Sichuan University, Chengdu 610065, China
*
Author to whom correspondence should be addressed.
ISPRS Int. J. Geo-Inf. 2025, 14(9), 355; https://doi.org/10.3390/ijgi14090355
Submission received: 15 July 2025 / Revised: 12 September 2025 / Accepted: 15 September 2025 / Published: 17 September 2025

Abstract

As the spatial carrier, the high-quality development of land complements the high-quality development of the economy and society. Imbalanced land use severely restricts regional high-quality development. This study uses panel data from 110 cities at or above the prefecture level in the Yangtze River Economic Belt (YREB) from 2013 to 2022. Based on a conjugate perspective, it comprehensively considers quantitative balance and efficiency coordination to calculate the spatial equilibrium degree of land use. Kernel density estimation and Moran’s I index are employed to reveal the spatiotemporal differentiation characteristics. This study divides land-use spatial equilibrium into different types and proposes differentiated development paths. The findings are as follows: ① In terms of temporal evolution, the spatial equilibrium degree of land use in the YREB exhibits a nonlinear progression, overall trending towards stable convergence. ② In terms of spatial evolution, provincial capital cities and municipalities directly under the central government drive the development of surrounding cities, forming three major urban clusters in the upper, middle, and lower reaches. ③ The spatial clustering characteristics of land-use equilibrium in the YREB are significant, but the degree of agglomeration is continuously weakening. ④ The optimization paths for different types of land-use spatial equilibrium show significant differences, requiring differentiated governance. These findings provide a scientific foundation for optimizing the national spatial pattern of land use, advancing regional balanced development and achieving high-quality development.

1. Introduction

Land is a core resource and spatial carrier for human survival and development, and its supply–demand balance directly impacts the process of sustainable societal development [1,2]. Distorted land spatial development models have led to a series of negative effects, including regional spatial imbalances [3], exacerbated food crises [4], and environmental degradation [5,6]. The United Nations’ Sustainable Development Goals (SDGs) clearly emphasize promoting comprehensive economic, social, and environmental sustainability through scientific land management, with balanced land use and spatial development being crucial to achieving this goal [7,8]. Internationally, land supply–demand contradictions are widespread. For example, the rapid urban expansion in the Middle East has led to a significant reduction in agricultural land [9], while excessive agricultural development in South America has resulted in forest degradation [10]. These cases highlight the global challenge of land-use imbalance. As industrialization and urbanization rapidly progress, China’s human–land conflict has become increasingly severe, with the imbalance in land-use space becoming more prominent [11,12,13]. Significant regional differences in natural resource endowment, combined with the policy and agglomeration effects of national development strategies, have caused a “supply–demand” spatial misalignment: underdeveloped regions suffer from weak demand, leading to inefficient land idleness, while developed regions face land supply shortages due to ecological constraints. This ultimately results in a complex crisis of resource waste and ecological degradation, severely hindering regional high-quality development.
With the significant shift in China’s primary social contradiction, the CPC’s Central Committee and the State Council have placed emphasis on solving the issue of regional development imbalance and inadequacy at an unprecedented strategic level. They have repeatedly issued important instructions on strategies such as “regional coordinated development,” “common prosperity,” and “optimizing national land spatial development,” highlighting the urgency of addressing spatial imbalances. The report of the 20th National Congress of the CPC points out that “high-quality development is the primary task in building a modern socialist country.” High-quality development requires a shift in the development model from scale- and speed-driven extensive growth to quality- and efficiency-driven intensive growth [14]. As the spatial carrier, the high-quality development of land complements economic and social development, with the coordination of production, living, and ecological spaces being crucial to restructuring land spatial layouts under the high-quality development requirement [15]. Therefore, interpreting the “quantity” and “quality” of regional development through “balance” and “sufficiency,” as well as evaluating regional land-use spatial balance based on the “three major spaces” framework—considering both “quantity balance” and “efficiency coordination”—is of significant importance for promoting regional balanced development.
Academic research on land-use spatial balance has mainly focused on the following three aspects: (1) The concept and measurement of spatial balance. Balance is divided into quantity balance and state balance. The Gini coefficient decomposition [16,17], and the Theil index [18] are commonly used to measure quantity balance. State balance is determined by the relationship between spatial development intensity and supply capacity [19], and the matching relationship between spatial demand intensity and spatial supply capacity [20,21]. (2) Spatial–temporal differentiation of spatial balance. Research scales have shifted from macro-scales, such as national [7] and provincial levels [11], to micro-scales, such as counties [22]. Time-series analysis has expanded from static cross-sections [11] to dynamic panels [23]. (3) Analysis of spatial balance trends. Methods such as Markov chains [7] are used to predict the future development trends of land-use spatial balance. Previous studies have been mainly limited to the static total quantity balance of land supply and demand, lacking systematic analysis of the efficiency coordination between supply and demand quality, making it difficult to reveal the connotations of land-use spatial balance under the context of high-quality development. Moreover, research on the internal mechanisms of land-use spatial balance is still in the exploratory stage, and empirical analysis remains insufficient.
Based on panel data from 110 cities in the Yangtze River Economic Belt (YREB) during 2013–2022, this study constructs an evaluation system for land demand intensity and land supply capacity based on the “three major spaces” framework. This study interprets the “quantity” and “quality” of land-use spatial balance through “quantity balance” and “efficiency coordination,” and constructs measurement models for the land-use supply–demand balance index and efficiency index to calculate land-use spatial balance. Three-dimensional kernel density estimation and Moran’s I are applied to analyze the spatial–temporal evolution characteristics. This study classifies the balance types and proposes differentiated development pathways, providing scientific evidence for optimizing the spatial pattern of land use, promoting regional balanced development, and achieving high-quality development.

2. Materials and Methods

2.1. Theoretical Mechanism Analysis

Traditional equilibrium theories define land-use spatial equilibrium as the spatial pattern of human–land systems shaped at a specific point in time by the intensity of land demand and the capacity of land supply [7,11]. When demand–supply exhibits adaptive matching, the system enters an equilibrium state; otherwise, it triggers spatial imbalance. In the context of the transformation towards high-quality development, facing the prominent contradiction between people’s increasing pursuit of a better life and the unbalanced and inadequate development [24], the connotation of land-use spatial equilibrium should be appropriately deepened. “Balanced development” and “sufficient development” ought to serve as both the theoretical foundation and directional goal for spatial equilibrium. Therefore, land-use spatial equilibrium is not merely a quantitative spatial match between land demand and supply within human–land systems, but a comprehensive spatial state that integrates balanced and sufficient spatial development in the pursuit of high-quality growth.
Traditional equilibrium theories emphasize the quantitative matching between supply and demand while neglecting the interactive relationship between the two, making it difficult to fully analyze the dynamic coordination mechanism of “quantity–quality synergy” [11,23]. The “conjugate” theory offers a novel perspective with distinct advantages for addressing this issue. From the perspectives of materiality, systematization, dynamics, and antagonism, the conjugate approach emphasizes the developmental essence, coupling relationships, and transformation mechanisms of contradictory phenomena [25]. These characteristics make it particularly suitable for understanding the complex interactions between land demand and land supply in the context of land use. On one hand, the sufficiently balanced state under the conjugate framework requires the simultaneous satisfaction of both quantity and quality dimensions, effectively illustrating the contemporary demand for coordinated quantity–quality development under the context of high-quality growth. On the other hand, the conjugate theory emphasizes the mutual influence and complementary interaction of two elements jointly determining a dependent variable in system development, thereby effectively revealing the dynamic interaction mechanism of the system. For example, some scholars have applied the conjugate perspective to analyze conjugate phenomena in natural systems [26,27], the interactive evolution of rural production–living systems, [28] social–ecological systems [25,29], and the development of strategic models [30]. Expanding into the field of land use, land demand intensity and land supply capacity can be seen as the “conjugate dual elements” driving spatial balance in land use. The former represents the pressure of human activities on the land system, while the latter reflects the capacity of natural, social, and economic systems to sustain the demand. The interactive relationship between these two elements shapes the dynamic evolution path of land-use spatial balance, as depicted in Figure 1. The applicability of this theoretical framework is mainly reflected in two aspects. First, it overcomes the limitation of traditional equilibrium theories that focus solely on quantitative matching, accommodating the dual requirements of “quantity balance” and “quality sufficiency,” which aligns with the connotation of high-quality development. Second, it emphasizes the interaction and coordination between the dual elements rather than static matching, thereby helping to reveal the dynamic processes through which land-use systems adapt to external changes.
If we consider land demand intensity and land supply capacity as “two horses,” then spatial balance in land use can be seen as the “carriage” being driven by them, with the “yoke” representing the interactive relationship connecting all three. If one horse moves too fast or too slow, it can lead to spatial imbalance, resulting in poor system stability and efficiency. When the “two horses” move forward in sync, it achieves a state of quantitative spatial balance, known as the conjugate status. However, there are different levels of the conjugate status: high-intensity conjugate, where both land demand intensity and land supply capacity are at high levels, and low-intensity conjugate, where both are at low levels. Only when land demand intensity and land supply capacity are quantitatively matched and both reach a high level of development in terms of quality can the system be considered to be in a state of high-intensity conjugation [19,28].
Therefore, this paper defines land-use spatial balance as follows: At a specific point in time, the high-level coordinated state of “quantity–quality” is formed by the dynamic adaptation of land demand intensity and land supply capacity. Specifically, it encompasses three dimensions: (1) System interactivity, where land demand intensity and land supply capacity achieve balance through a certain interactive mechanism, with the essence of the balance being the dynamic adaptive equilibrium of their synergistic action. (2) Multidimensional complexity, as a fully balanced state requires simultaneous satisfaction of constraints in both quantity and quality dimensions, i.e., quantity balance and efficiency coordination. (3) Gradient hierarchy, in which the states of imbalance and equilibrium are distinguished based on the combined trends of land demand intensity and land supply capacity in the quantity dimension. Imbalance states include insufficient development and excessive development. By combining the synergy level of the quality dimension, the equilibrium states can be further categorized into high-level equilibrium, moderate-level equilibrium, and low-level equilibrium.

2.2. Research Framework

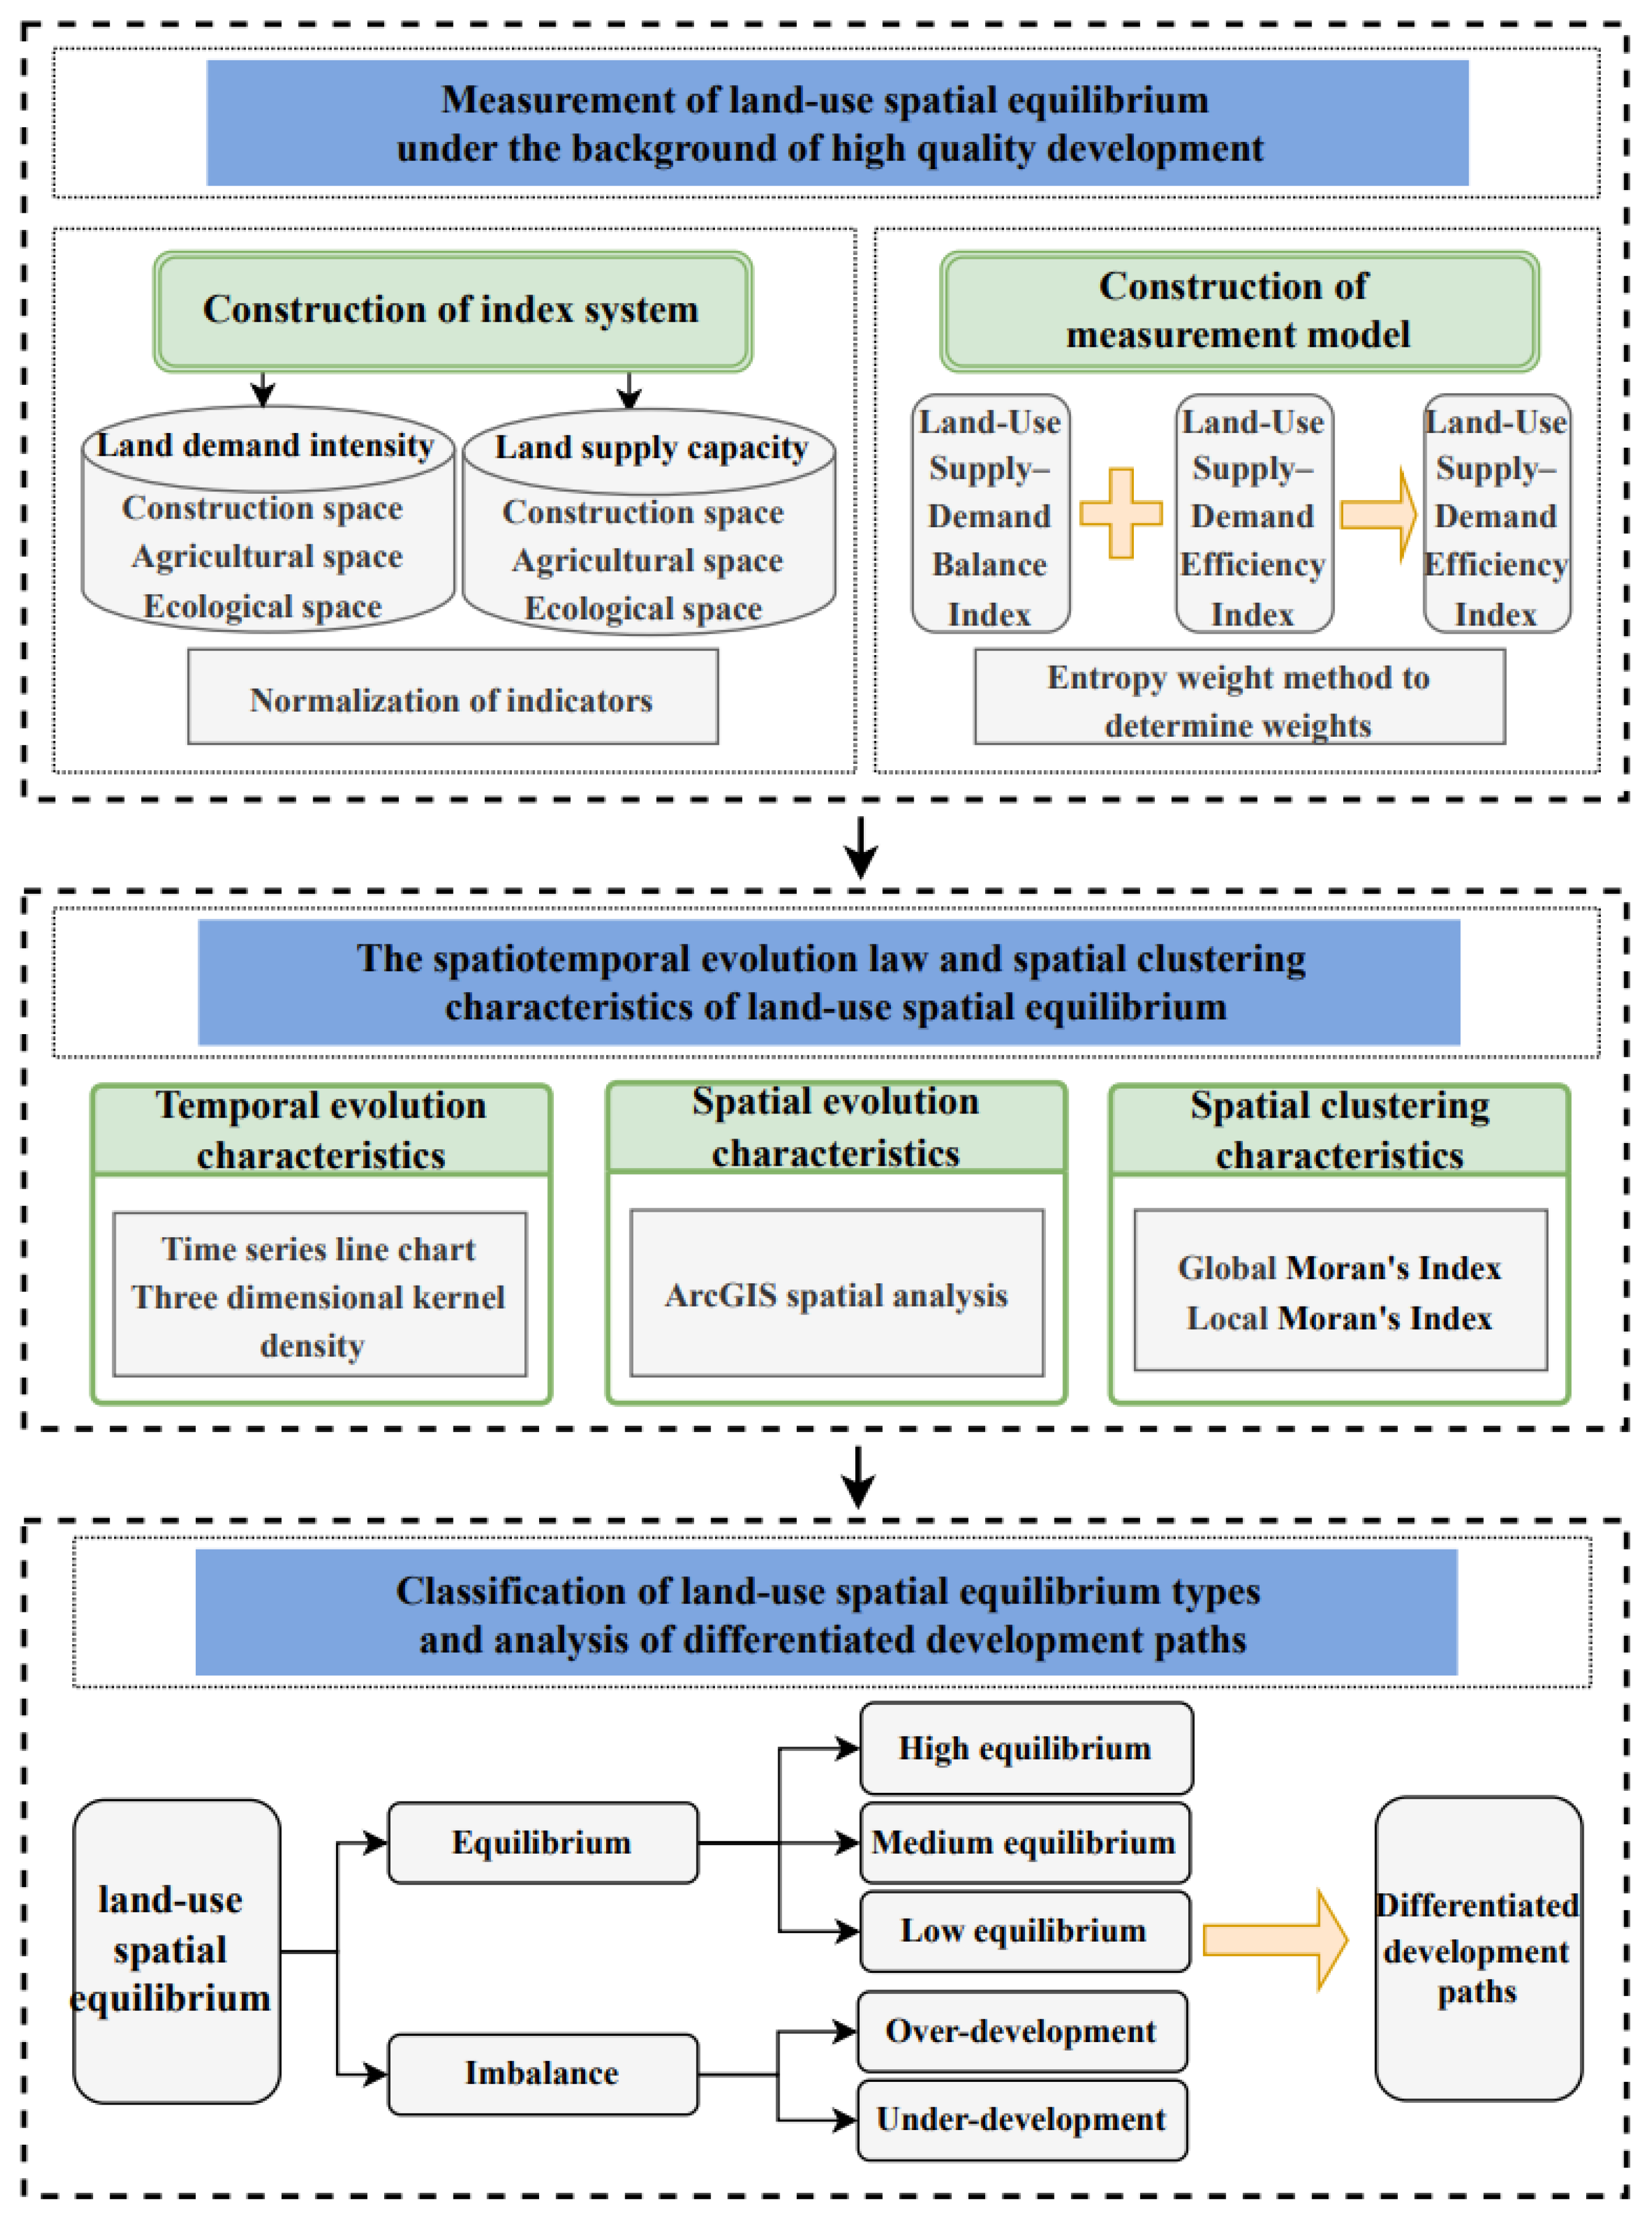
To achieve the research objectives, this study constructs a systematic research framework, as shown in Figure 2. First, drawing on the conjugate theory and based on the connotation of land-use spatial equilibrium under the context of high-quality development, an evaluation indicator system of land demand intensity and land supply capacity is developed from the three spatial dimensions of construction, agricultural, and ecological spaces. All indicators are normalized, and the entropy weight method is applied to determine the index weights, thereby enabling the quantitative measurement of land-use spatial equilibrium through the constructed model. Second, by comprehensively employing time-series line charts, three-dimensional kernel density estimation, ArcGIS spatial analysis, and Moran’s index, the study reveals the spatiotemporal evolution patterns and spatial clustering characteristics of land-use spatial equilibrium. Finally, on this basis, the types of land-use spatial equilibrium are classified, and differentiated regulation pathways and development strategies are proposed accordingly.

2.3. Study Area and Data Sources

2.3.1. Research Area

As an important economic region that spans east, central, and western China, integrating economically developed and underdeveloped areas, the YREB is a typical representative of China’s unbalanced and inadequate regional development [31,32], as shown in Figure 3. Researching the spatial equilibrium of land use in the YREB is of great significance for optimizing the national land development pattern and promoting balanced and sufficient regional development. This study sets the research period from 2013 to 2022, based on the full consideration of data availability and continuity. This study excludes sixteen autonomous prefectures from five provinces—Hubei, Hunan, Sichuan, Yunnan, and Guizhou—ultimately selecting a total of 110 cities at the prefecture level or above for analysis.

2.3.2. Data Sources

The socio-economic data in this study were mainly obtained from the corresponding year’s “China Urban Statistical Yearbook,” “China Urban Construction Statistical Yearbook,” and “China Statistical Yearbook,” as well as regional statistical yearbooks and National Economic and Social Development Statistical Bulletins. For missing values in individual years, the mean of adjacent years in the time series was used to impute intermediate gaps, while systematic missing data were estimated using multiple imputation techniques. Land-use data were obtained from the 30 m resolution annual land-cover grid dataset for China (1990–2022) released by Professors Yang Jie and Huang Xin at Wuhan University. Taking the grid as the basic unit, the data were clipped by ArcGIS according to the prefecture-level city administrative boundaries in 2013, and the area of each land-use type was calculated using the zonal statistics tool. Geographic spatial coordinate information was extracted with ArcGIS. To ensure spatial consistency and comparability during the study period, the urban boundaries in 2013 were uniformly adopted as the reference scope.

2.4. Construction of Evaluation Indicator System

The 18th National Congress of the Communist Party of China proposed the planning concept of “intensive and efficient production space, moderately livable living space, and beautiful ecological space.” The “14th Five-Year Plan” further specifies that in the future, a spatial pattern consisting of urbanized areas, main agricultural production areas, and ecological functional zones will be gradually formed. Coordinating the “three major spaces” is a key challenge in restructuring the national spatial layout under the requirement of high-quality development. Therefore, drawing on relevant study [33], this research constructs an evaluation indicator system for land demand intensity (LD) and land supply capacity (LS) based on the three spatial dimensions of “construction–agricultural–ecological”, as shown in Table 1. In the process of indicator data processing, to eliminate the impact of dimensional differences, this study refers to relevant research and adopts the min–max method to normalize all indicators [7]. To overcome the random errors associated with subjective weighting methods, the weights of the indicators in the evaluation system are determined using the entropy weight method [7,11].
The essential connotation of high-quality development lies in achieving efficient, equitable, and green sustainable development that aims to meet the people’s growing aspirations for a better life, requiring the unification of both quantity and quality [34]. Accordingly, when selecting evaluation indicators, land demand intensity is aligned with the characteristics of the times and fully reflects the diversified needs of the people, while land supply capacity considers both the quantity and quality dimensions of land provision. Land demand intensity characterizes the total volume of spatial land-use demand arising from the composite needs for land-based products and services in production, living, and ecological domains within a specific temporal and spatial context. The construction space demand index is characterized by population density [35] and GDP per unit of land area [36], the agricultural space demand index is characterized by per capita grain consumption and per capita meat consumption [37], and the ecological space demand index is characterized by per capita water supply and carbon emissions per unit of GDP [7,11]. Land supply capacity reflects, under specific temporal and spatial constraints, the regional limit for providing construction, agricultural, and ecological spaces based on natural conditions, socio-economic status, and institutional and policy factors, comprehensively considering both quantity and quality dimensions. The construction space supply index is characterized by output per unit of construction land and per capita construction land area [38], the agricultural space supply index is characterized by per capita arable land area [39] and grain yield per unit of arable land [40], and the ecological space supply index is characterized by ecological service value per unit of land and forest coverage rate [7]. The evaluation of ecological service value refers to relevant studies [41,42]. To avoid double counting, ecological land is classified based on land-use type and includes five categories: forest land, grassland, water bodies, wetlands, and deserts.

2.5. Research Methods

2.5.1. Measurement Model of Land-Use Spatial Balance

Drawing on existing studies [28] and grounded in theoretical analysis, this study employs the Balance Index ( B I ) to characterize the “quantity balance” dimension of land-use spatial equilibrium during the study period. A B I value closer to 1 indicates a state approaching quantitative spatial equilibrium, i.e., the conjugate state. The Efficiency Index ( E I ) is used to quantitatively depict “efficiency coordination,” with a higher EI value indicating more effective utilization of regional resource elements. Only when BI approaches 1 and EI reaches a relatively high level can the system be considered to be in a state of high-intensity conjugation. On this basis, the entropy weight method is applied to quantitatively measure the degree of land-use spatial equilibrium. Compared with traditional one-dimensional equilibrium measurement methods such as the Gini coefficient or Theil index, this approach can capture the equilibrium state between two interrelated variables—land demand intensity and land supply capacity—within a single regional unit. It shifts the focus from “inter-regional” comparisons to “intra-regional” diagnostics, revealing the internal structure and quality of the system rather than relative differences across regions. This enables a distinction between high- and low-level equilibria and is particularly suitable for assessing land-use spatial equilibrium under the context of high-quality development.
(1)
Land Demand Intensity and Land Supply Capacity
For the regional indices of land demand intensity and land supply capacity, a combined approach of arithmetic mean and geometric mean was used for calculation [11,23]. The formulas are as follows:
L D = 1 2 C D + A D + E D 3 + C D × A D × E D 3
L S = 1 2 C S + A S + E S 3 + C S × A S × E S 3
In Equations (1) and (2), L D represents the land demand intensity index, L S represents the land supply capacity index, C D denotes the construction space demand index, A D denotes the agricultural space demand index, E D denotes the ecological space demand index, C S denotes the construction space supply index, A S denotes the agricultural space supply index, and E S denotes the ecological space supply index.
(2)
Land-Use Supply–Demand Balance Index
The land-use balance index (BI) represents the relationship between land demand intensity and supply capacity, and is calculated as follows:
B I i j = L D i j L S i j
In Equation (3), B I i j denotes the balance index of land-use supply and demand for region j in year i ; L D i j denotes the land demand intensity for region j in year i ; and L S i j denotes the land supply capacity for region j in year i . When B I   >   1 , land demand intensity surpasses supply capacity; when B I   <   1 , supply capacity exceeds demand intensity; and when B I     1 , the two are approximately balanced in quantitative terms.
(3)
Land-Use Supply–Demand Efficiency Index
The land-use supply–demand balance index only indicates whether a region’s land demand intensity and land supply capacity are in balance in terms of intensity, but it cannot reflect the comprehensive utilization of regional resource elements and the state of high-quality development. Therefore, this study uses the ratio of a region’s land demand intensity and supply capacity to the average level of the study area to measure the efficiency coordination of land-use supply and demand [28]. The model is as follows:
E I i j = W 1 L D i j L D ^ + W 2 L S i j L S ^
In Equation (4), E I i j denotes the efficiency index of land-use supply and demand for year i in region j ; L D i j and L S i j j have the same meanings as in Equation (3); L D ^ and L S ^ represent the average values of land demand intensity and land supply capacity in the study area, respectively. A higher E I i j value indicates more efficient utilization of regional resource elements relative to the study area’s average level. W 1 and W 2 are weights assigned to the indices of land demand intensity and land supply capacity. The entropy weight method is applied to assign weights to the intermediary variables and efficiency indices.
(4)
Land-Use Spatial Balance
To comprehensively measure land-use spatial balance from the perspectives of quantity and quality of coordination between land-use supply and demand, an intermediary variable Z i j j is introduced, as shown in Equation (5). The entropy weight method is used to assign weights to the intermediary variables and efficiency indices, overcoming the random errors of traditional subjective weighting methods in measuring land-use spatial balance, as shown in Equation (6):
Z i j = 1 B I i j 1  
S E i j = W 3 Z i j + W 4 E I i j      
In Equation (6), S E i j represents the comprehensive land-use spatial balance for year i in region j ; a larger value indicates a better state of land-use spatial balance. W 3 and W 4 are the weights assigned to the Z i j j and E I i j indices, respectively.

2.5.2. Three-Dimensional Kernel Density Estimation

Kernel density estimation (KDE) is a non-parametric approach for characterizing the dynamic distribution of data [43]. Compared with parametric methods, it avoids the subjectivity involved in functional form specification and thus enhances the reliability of the estimation results. Let f ( w ) be the density function of a random variable w; the probability density at point w can be estimated as follows [44]:
f w = 1 n h i = 1 n K ( w i w ¯ h )  
In Equation (7), K ( · ) denotes the kernel function, n is the sample size, h represents the bandwidth, w i are independent and identically distributed observations, and w ¯ is the sample mean.

2.5.3. Moran’s Index

(1)
Global Moran’s Index
This study used the global Moran’s index to measure the overall spatial pattern characteristics of land-use spatial balance. Its mathematical expression is as follows [45,46,47]:
G l o b a l   M o r a n s   I = n i = 1 n j = 1 n w i j ( x i x ¯ ) ( x j x ¯ ) i = 1 n j = 1 n w i j i = 1 n ( x i x ¯ ) 2
In Equation (8), n is the sample size; x i and x j are the geographical attribute observation values at locations i and j , respectively; x ¯ is the mean of the observation values; w i j is the entry in the i th row and j th column of the spatial weight matrix.
(2)
Local Moran’s Index
To further explore the clustering characteristics of local spatial units in space, the local Moran’s index was selected to measure local spatial features. Its mathematical expression is as follows [45,46,47]:
L o c a l   M o r a n s   I i = n ( x i x ¯ ) j = 1 n w i j ( x j x ¯ ) i = 1 n ( x i x ¯ ) 2
The variables have the same meanings as in Equation (8).

3. Results

3.1. Temporal Evolution of Land-Use Spatial Equilibrium Degrees in the YREB

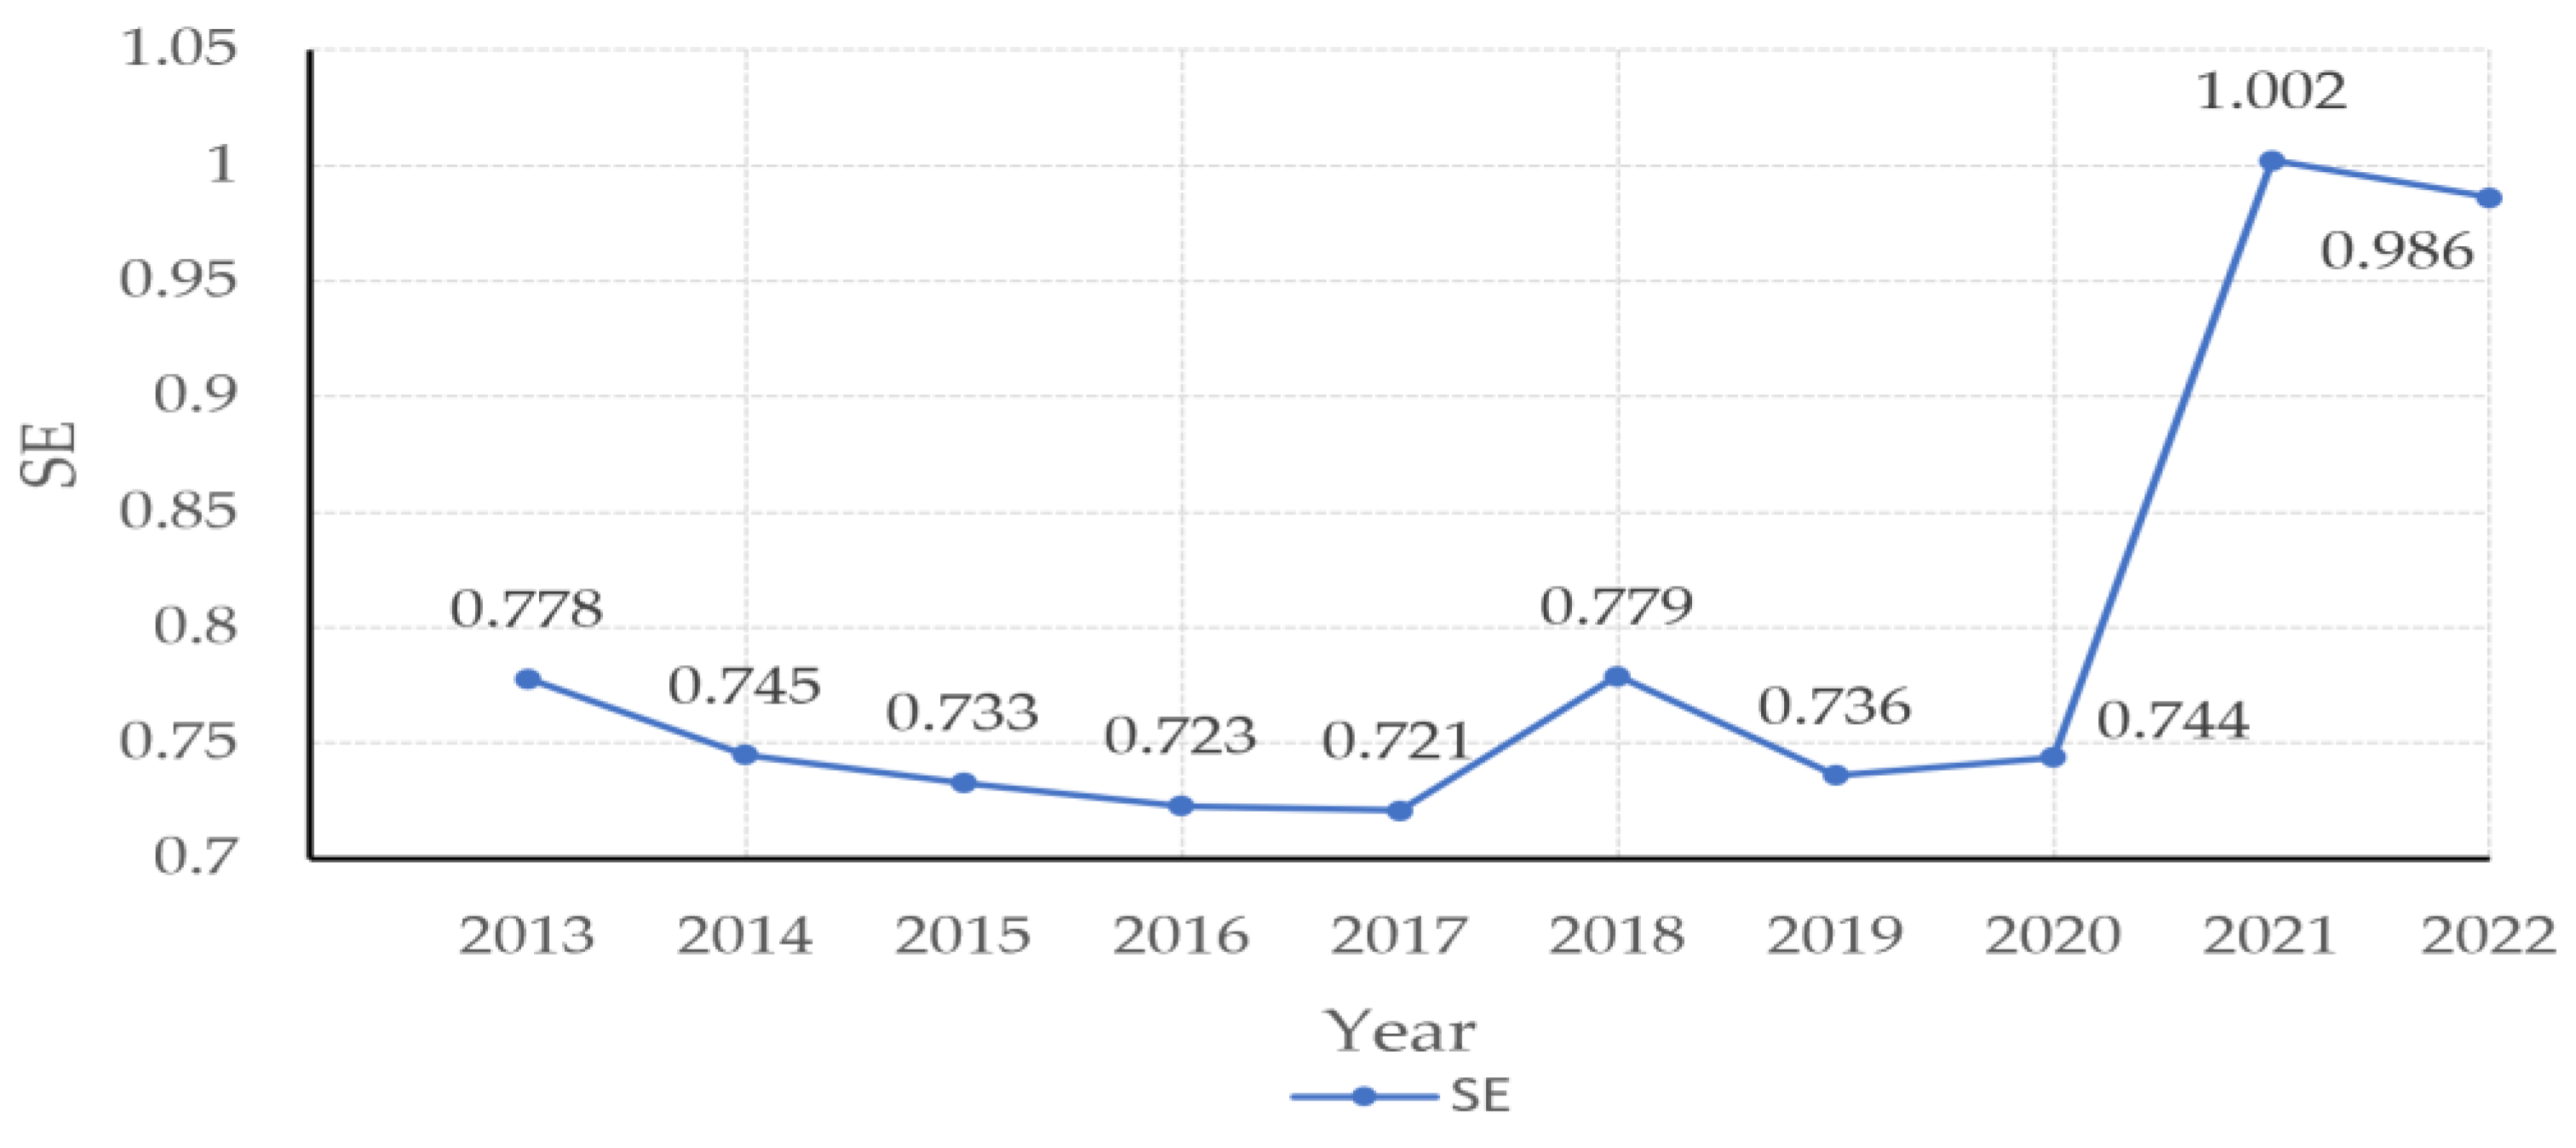
In terms of numerical levels, from 2013 to 2022, the evolution of land-use spatial balance in the YREB showed a trend of initial decline followed by an increase, as illustrated in Figure 4. From 2013 to 2017, the spatial equilibrium of land use in the YREB showed a declining trend, indicating an increasing imbalance in land use spatially. After 2018, the trend began to rebound with fluctuations, particularly showing a notable surge between 2020 and 2021, when the SE value increased from 0.744 to 1.002. This sharp growth was mainly associated with the abrupt shifts in the socio-economic landscape during the COVID-19 pandemic [48,49,50]: pandemic control measures reduced population mobility, strengthened localized residence and employment, and, together with the rise in the digital economy, partly alleviated the long-standing land-use conflicts between urban and rural areas as well as across regions, thereby promoting a short-term adjustment toward spatial equilibrium. In addition, the initiation of the 14th Five-Year Plan, which reinforced ecological protection and regional coordination policies, further accelerated the process of land-use optimization [51,52]. In terms of growth rate, there was an overall upward trend, increasing from 0.778 in 2013 to 0.986 in 2022, with a growth rate of 26.7%. This confirms the significant achievements of spatial governance policies since the 18th National Congress of the CPC, particularly following the implementation of the YREB Development Plan, in advancing ecological civilization construction [53], urban–rural integration [54], and other regional governance initiatives.
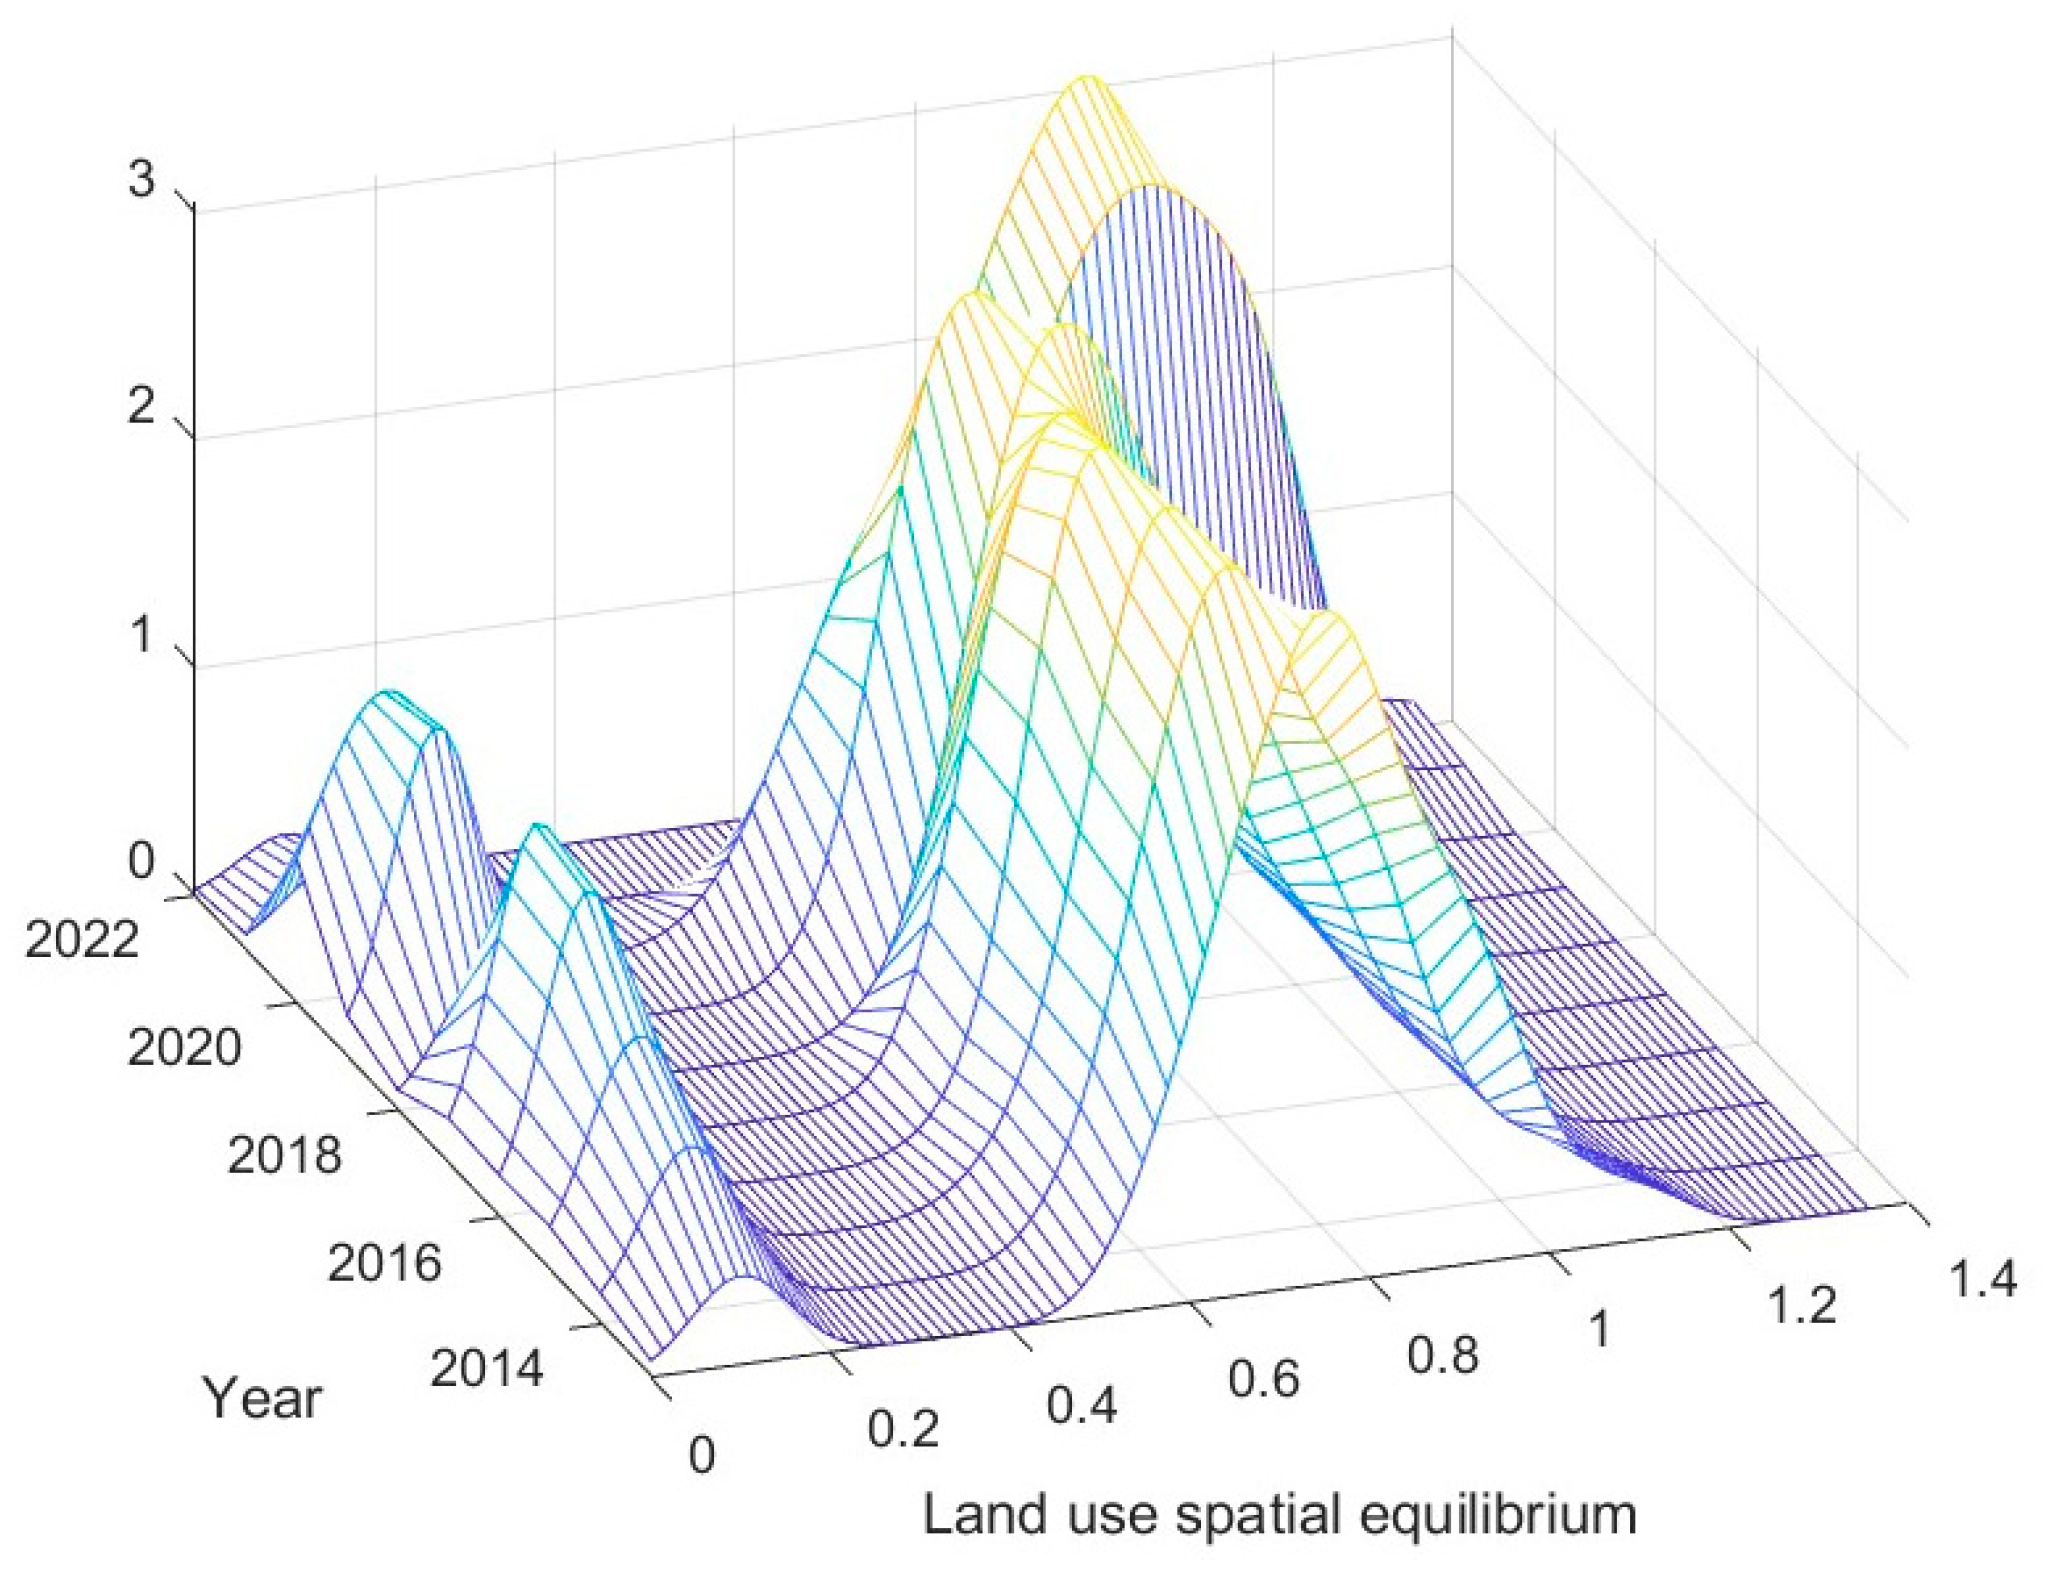
To further analyze the temporal evolution characteristics of land-use spatial equilibrium in the YREB, this study employs Matlab 2024 to plot the three-dimensional kernel density evolution map of land-use spatial equilibrium in the YREB, as shown in Figure 5. Specifically, based on the annual sample data of 110 prefecture-level cities, the ksdensity3 function is applied to perform kernel density estimation. The function adopts the Gaussian kernel by default, with the bandwidth determined by its built-in automatic optimization rule. A year-by-year calculation strategy is used rather than mixing data from different years, in order to reveal the temporal dynamics of spatial structure.
From the distribution perspective, the kernel density curve continues to shift rightwards, indicating a steady increase in the spatial equilibrium of land use across various regions in the Yangtze River basin, which is attributed to the strategic implementation of ecological priority and coordinated development in the YREB. In terms of the main peak distribution pattern, the curve shows an evolution trend of “sharp and narrow → flat and wide → sharp and narrow,” with the height of the curve displaying a trend of “increase → decrease → increase,” and the width of the curve initially narrowing, then widening, and narrowing again. Regional differences first widen and then narrow, but overall, they show a converging trend. As the regional development level improves, transportation infrastructure construction drives interregional linkage, weakens terrain barriers, and accelerates regional integration.
Regarding polarization characteristics, the kernel density curve generally maintains a bimodal state, indicating a phenomenon of “club convergence.” The first peak represents the distribution pattern of cities in imbalance states, showing an overall trend of initially increasing and then decreasing. The second peak, which is the main peak, reflects the distribution pattern of cities in equilibrium states, showing an overall increasing trend. This indicates that the YREB exhibits significant characteristics of two-tier differentiation in land-use spatial equilibrium, but with continuous improvement at the regional development level, the overall spatial equilibrium status has significantly increased.

3.2. Spatial Evolution Characteristics of Land-Use Spatial Equilibrium Degrees in the YREB

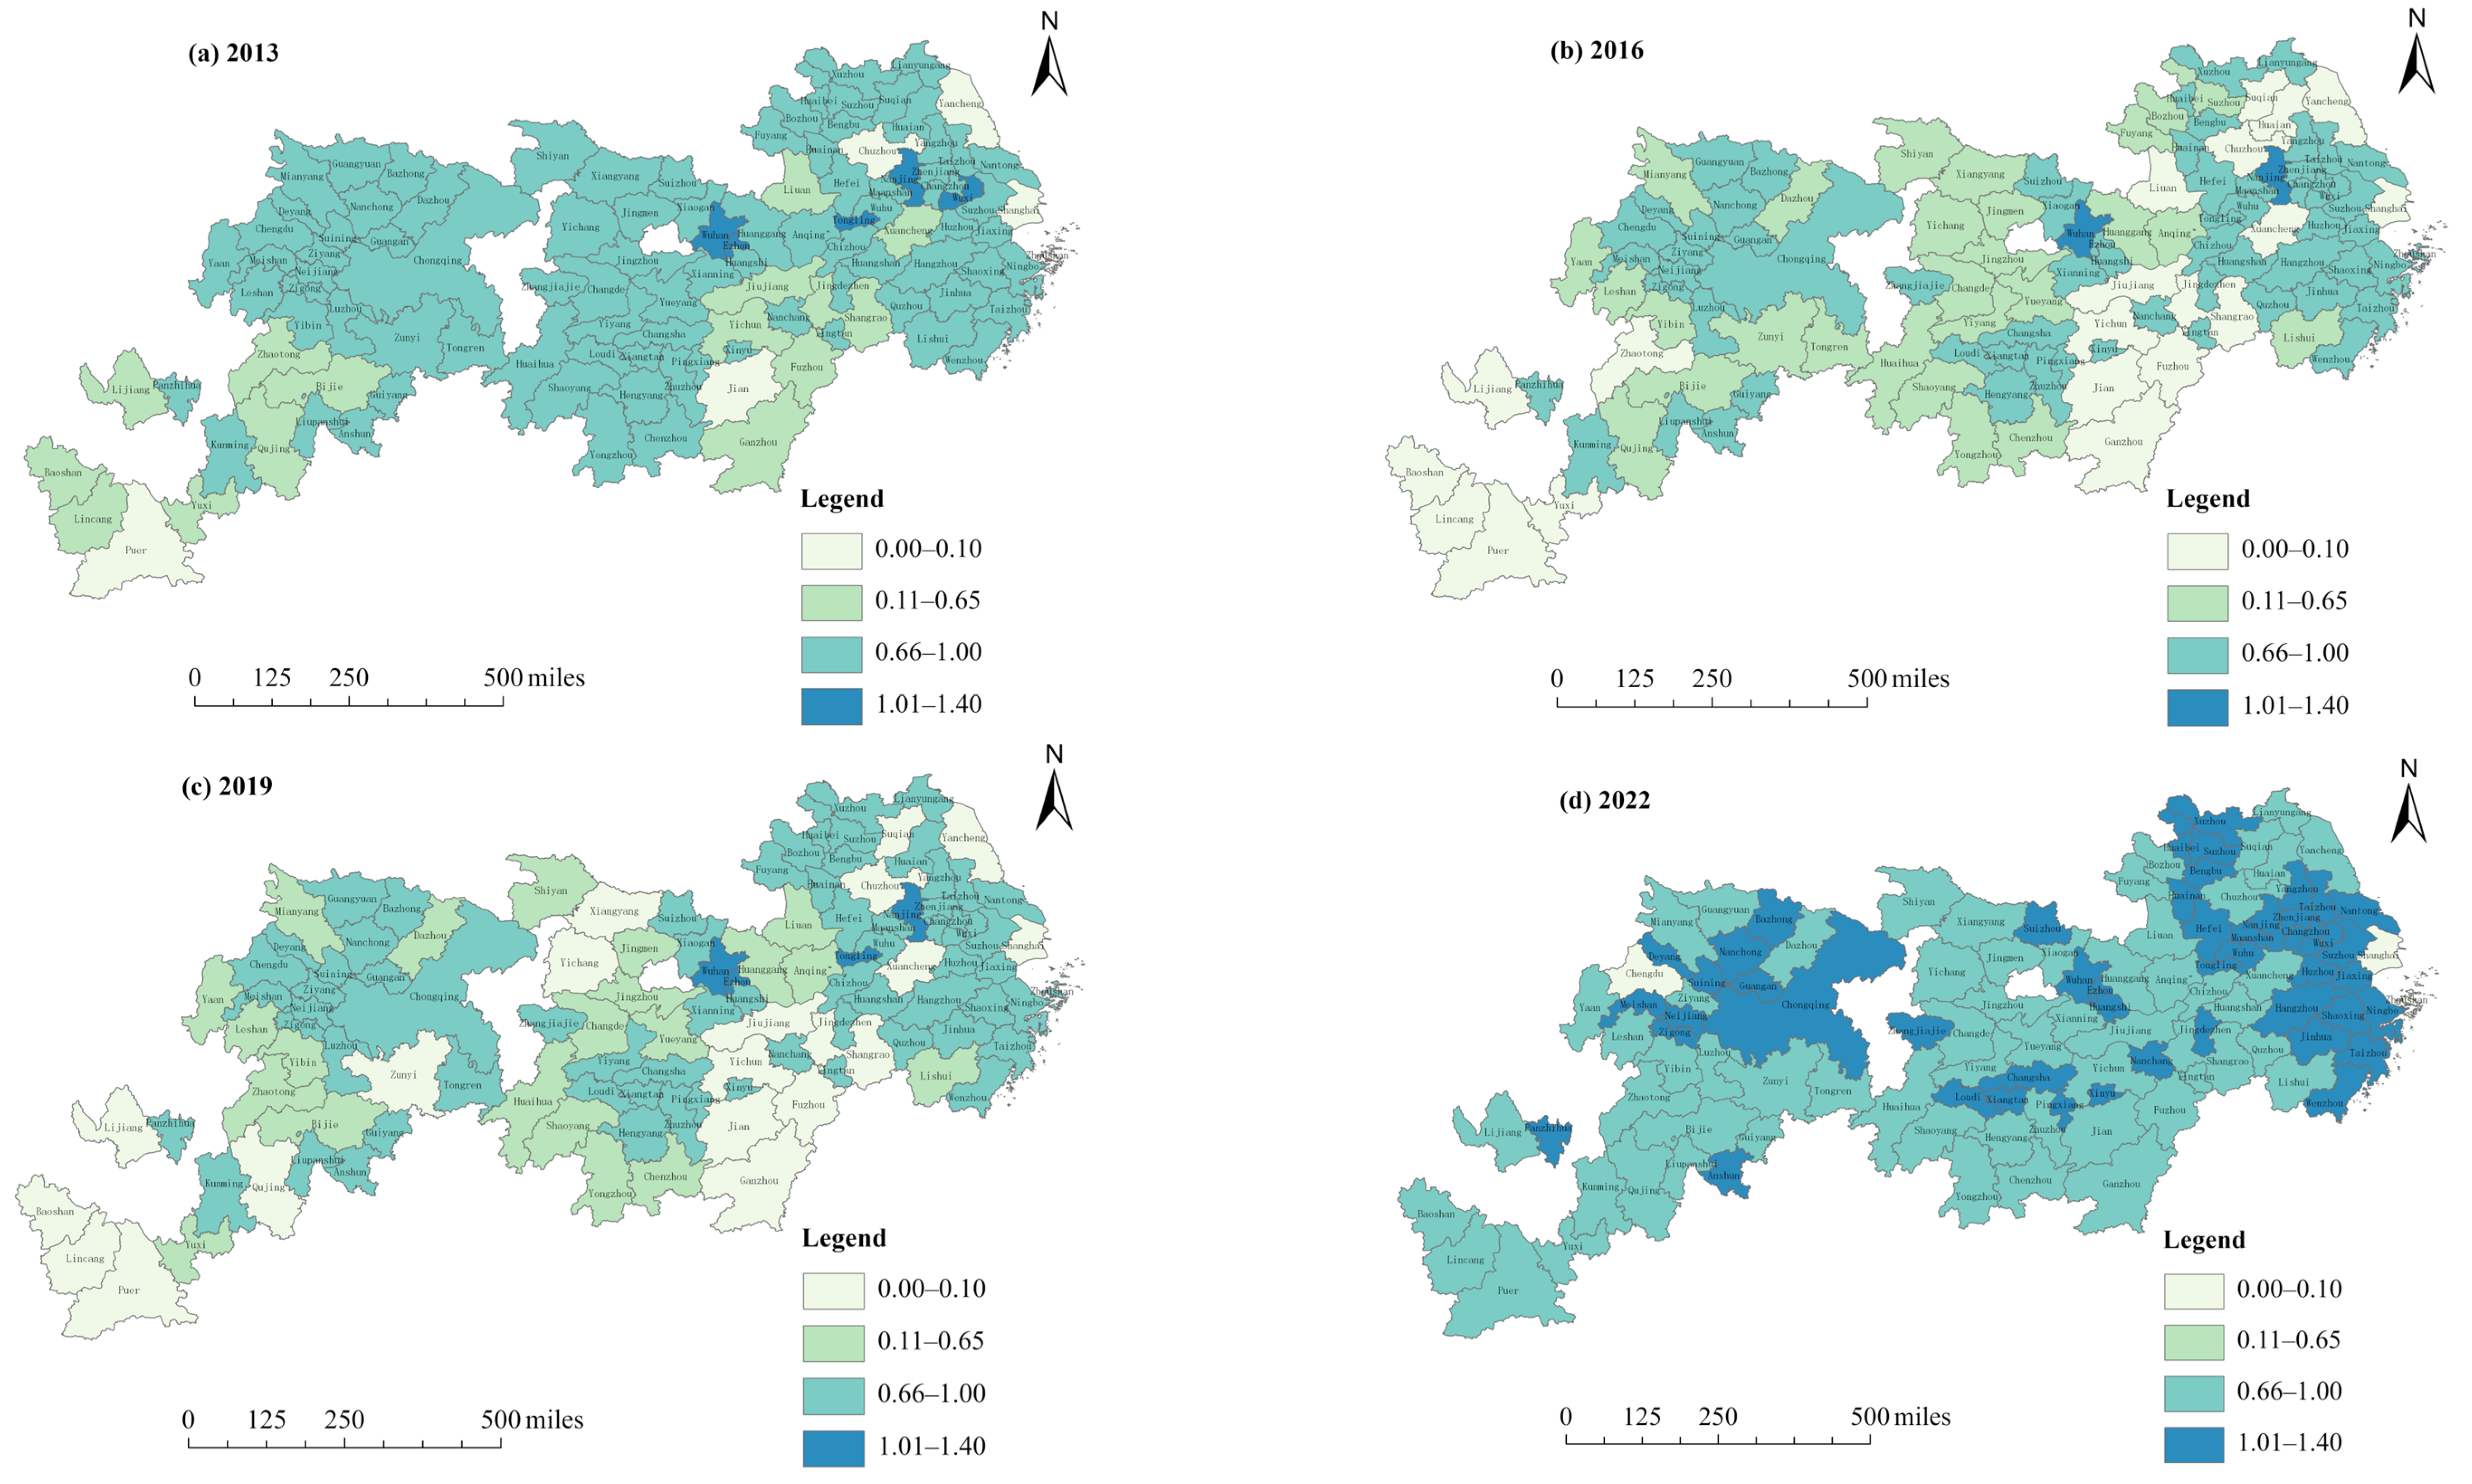
From 2013 to 2022, the clustering characteristics of land-use equilibrium in the YREB gradually emerged. Provincial capitals and municipalities directly under the central government radiated and significantly drove the development of surrounding cities. This formed three major high-level equilibrium city clusters: the Yangtze River Delta downstream cluster of Nanjing–Suzhou–Hangzhou, the middle reaches cluster of Changsha–Wuhan–Nanchang (“Central Triangle”), and the upstream dual-city economic circle of Chengdu–Chongqing, as shown in Figure 6.
The issuance and implementation of the “Outline of Regional Integration Development Plan for the Yangtze River Delta” in 2018 marked the formal entry of the Yangtze River Delta development into a new stage led by national strategic guidance. By 2022, the Yangtze River Delta had achieved the “1-h commuting circle” in infrastructure connectivity across major cities. It established the “2 + 8 + N” advanced manufacturing cluster system to promote industrial synergy and implemented cross-provincial and cross-city environmental standards recognition mechanisms in the ecological field. Influenced by Shanghai, Nanjing, and Hangzhou, the surrounding cities leveraged their own advantages to achieve sustained economic development, significant ecological improvement, and matched intensity in land demand and supply efficiency. By the end of the study period, the Yangtze River Delta presented a form of city clusters in high-level equilibrium.
The “Central Triangle,” centered around Wuhan, Changsha, and Nanchang, acted as growth poles, driving regional spatial equilibrium development through a “hub-and-spoke” linkage model. Under the radiance of core regional cities, the spatial equilibrium status of land use in the surrounding cities continuously improved from medium-low equilibrium to medium-high equilibrium. However, constrained by the overall regional development level and the lag in relevant policies (the formal release of the “14th Five-Year Plan for Development of the Yangtze River Midstream City Cluster” in 2022), coupled with the lag effect of policy implementation, by 2022, only 12 cities in the region achieved high-level equilibrium, and there was no clear formation of city clusters in high-level equilibrium.
In 2020, during the Sixth Meeting of the Central Financial and Economic Affairs Commission, it was proposed to vigorously promote the construction of the Chengdu–Chongqing Economic Circle, marking the rise of its construction to a national strategic level. As the strategic “opening move,” the Chengdu–Chongqing integration was accelerated through the construction of the “Three Zones and Three Belts,” leading the way in advancing infrastructure connectivity. Coupled with the promotion of the Chengdu–Chongqing Economic Circle construction, cities such as Meishan, Neijiang, Deyang, and Zigong improved from a medium-level equilibrium status in the early stages of the study to a high-level equilibrium status by the end of the study period.

3.3. Spatial Clustering Characteristics of Land-Use Spatial Equilibrium Degrees in the YREB

In calculating the global Moran’s I, the spatial weight matrix was constructed based on distance relationships, specifically using the Inverse Distance Weighting (IDW) method with Euclidean distance as the metric. The weights decay with increasing distance and were not subjected to row standardization. The weight matrix was kept fixed across all years to ensure the comparability of spatial structures over time. As shown in Table 2, the global Moran’s I values of land-use spatial equilibrium degrees in the YREB range from 0.022 to 0.210. Except for 2021 and 2022, all years passed the 1% significance level test, indicating significant spatial clustering of land-use spatial equilibrium degrees before 2021. The Global Moran’s I values for land-use spatial equilibrium in the YREB showed an overall declining trend, decreasing from 0.174 in 2013 to 0.168 in 2020. This indicates that the spatial clustering characteristics of land-use spatial equilibrium have weakened over time. This trend may be attributed to the implementation of the YREB Development Plan, which has continuously promoted policies such as coordinated regional development strategies, industrial transfer and upgrading, and joint ecological protection and governance [55]. These policies have contributed to narrowing intra-regional development gaps and optimizing spatial patterns, thereby enhancing coordinated development and gradually weakening spatial clustering effects. By the end of the study period, with the implementation of the 14th Five-Year Plan—which further emphasizes synergistic and integrated regional development in the YREB [56]—this effect became more pronounced, as reflected in the statistically insignificant results of Moran’s I index.
To further explore the spatial clustering characteristics among prefecture-level cities, local spatial autocorrelation analysis of land-use spatial equilibrium degrees in 2013, 2016, 2019, and 2022 was conducted, and the results are shown in Figure 7. In the local spatial autocorrelation analysis (LISA), the number of permutations was set to 499, and the False Discovery Rate (FDR) method was applied for multiple testing control to reduce the risk of false significance.
Non-significant areas of land-use spatial equilibrium degrees in the YREB were more prevalent than significant areas, with the significant areas predominantly characterized by High–High (HH), High–Low (HL), and Low–High (LH) clusters. HH clusters were concentrated in the southeastern Chengdu Plain, eastern Hubei Province, and central Jiangsu Province, and at the end of the study period, they were concentrated in the downstream areas of the Yangtze River. HL clusters were initially dispersed geographically but later concentrated around the provincial capitals and municipalities directly under central government administration, and they were significantly influenced by the spillover effects of these regions. LH clusters were mainly distributed in the middle and lower reaches of the Yangtze River in Hubei and Anhui provinces, surrounding Wuhan and Nanchang. LL clusters were primarily distributed in the southwestern Yunnan Province, where economic development lagged behind and land-use efficiency was low.

4. Classification of Land-Use Spatial Equilibrium Types and Analysis of Differentiated Development Paths

Referring to a relevant study [57], B I [ 1.4 , 2.2 ) and B I ( 0 , 0.4 ] both represent land-use spatial imbalance states. The former is defined as overdevelopment, while the latter is defined as underdevelopment. B I ( 0.4 , 1.4 ) represents a spatial equilibrium state. To further reveal the internal heterogeneity within the equilibrium state, this study, drawing on relevant research [58], adopts the mean-based zoning method [28,59], and fully considers the sample distribution characteristics of land-use spatial equilibrium degree ( S E ) in the YREB. Based on this approach, the equilibrium state is ultimately classified into high-level, medium-level, and low-level equilibrium categories. Specifically, S E [ 1.0 , 1.4 ) is defined as high equilibrium; S E ( 0 , 0.65 ] is defined as low equilibrium; and S E ( 0.65 , 1.0 ) is defined as medium equilibrium. For medium equilibrium, further classification is performed based on the relative strength of demand and supply. B I [ 0.6 , 1.4 ) is defined as the demand-strong type; B I ( 0.4 , 0.6 ) is defined as the supply-strong type; I [ 1.0 , 1.5 ) is defined as high-efficiency development; and E I ( 0.5 , 1.0 ) is defined as medium–low-efficiency development.
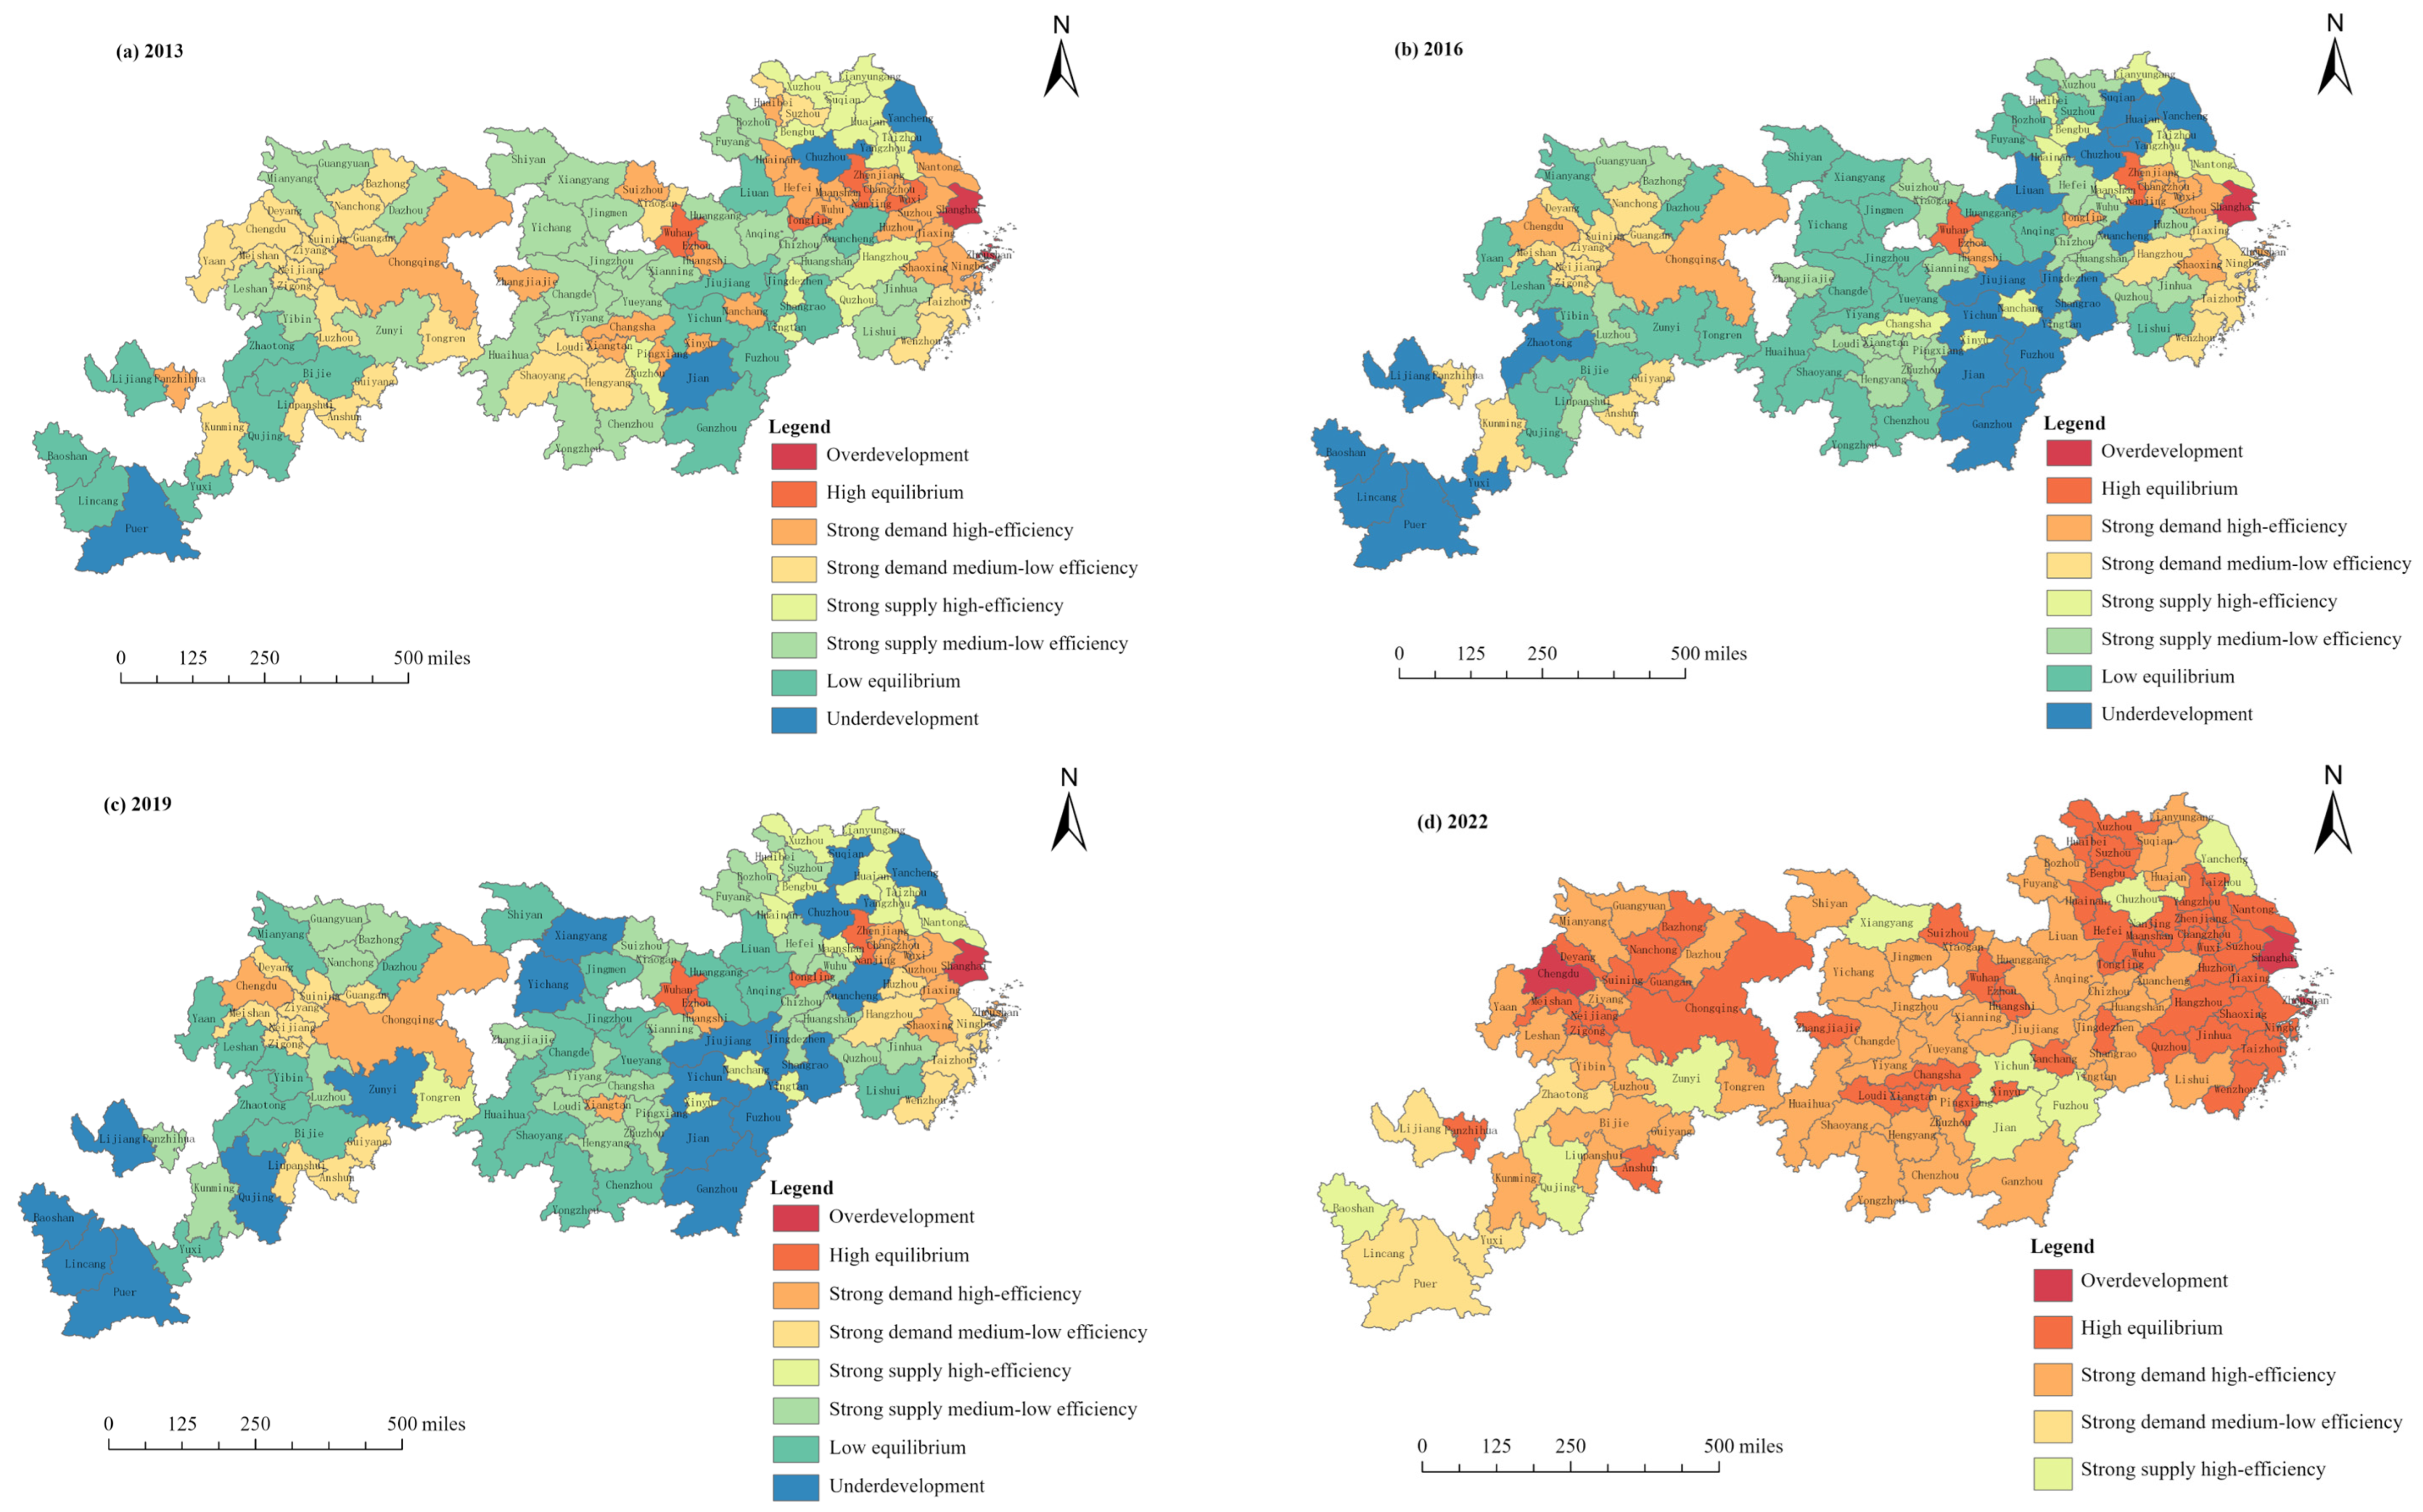
Finally, based on the quantitative classification results of the land-use spatial balance index and efficiency index from 2013, 2016, 2019, and 2020, combined with the analysis results of the land-use spatial equilibrium degrees in the YREB, eight types are identified, including overdevelopment, underdevelopment, high equilibrium, medium equilibrium (differentiated into strong-demand, high-efficiency; strong-demand, medium–low-efficiency; strong-supply, high-efficiency; and strong-supply, medium–low-efficiency), and low equilibrium, as shown in Table 3.
(1) Overdevelopment. As shown in Figure 8, Shanghai has long been in an overdevelopment state, which is related to its high-density economic and social activities and limited land resources. Zhoushan’s advantageous geographical location, combined with its high economic development and population concentration, leads to high land demand intensity. However, its agricultural space supply is severely insufficient, and its land supply capacity is low, resulting in overdevelopment. Chengdu, known as the “Land of Abundance,” has superior natural endowments, but as a western growth pole, its rapid economic development in recent years has sharply increased land demand. Combined with rigid constraints on agricultural ecological space, the imbalance of land supply and demand has been continuously exacerbated, turning it from a balanced area into an overdeveloped area. In overdeveloped areas, it is necessary to break the pattern of excessive factor concentration, promote the coordinated development of urban clusters, and alleviate the non-core functions of the central cities (such as industrial transfer and function spillover). Simultaneously, supply-side reforms should be advanced, with a focus on the intensive management of agricultural land and the promotion of eco-friendly development models. This will help construct a land supply capacity enhancement mechanism to achieve a dynamic regional land resource balance.
(2) Underdevelopment. As shown in Figure 8, underdeveloped areas are mainly located in Yunnan and Jiangxi. These areas have complex terrain and lagging infrastructure, with urban construction and industrial layouts severely restricted, showing the typical characteristics of low land development demand intensity and insufficient economic and social momentum. Therefore, it is crucial to improve regional development capabilities, enhance intelligent infrastructure networks, and increase the investment attractiveness of county-level economies. A “natural base + specialized industries” integration model should be developed, promoting organic agriculture in mountainous areas, as well as photovoltaic and other green industries, to stimulate land development demand. Innovative cross-regional compensation mechanisms should be established to promote the attainment of ecological product values and resolve the development bottleneck.
(3) High-equilibrium state. As shown in Figure 8, provincial capitals and their surrounding areas form high-equilibrium clusters. Provincial capitals have significant advantages in transportation, location, and resources, with regional industries and populations concentrating in these areas, leading to the high demand for construction, agricultural, and ecological spaces. By intensifying land use and implementing ecological restoration, construction land demand can grow while maintaining the balance between farmland occupation and compensation and improving ecological space quality, thereby driving the upgrade of land use from “quantity equilibrium” to “quality equilibrium.” High-equilibrium areas have already achieved relatively ideal development states but still need to pursue the long-term sustainability of the equilibrium state. Efforts should be made to address the risks of “path dependence” and maintain the resilience of sustainable development through institutional innovations.
(4) Moderate equilibrium state. The moderate equilibrium state is divided into four types: high-efficiency, demand-driven; low-to-medium-efficiency, demand-driven; high-efficiency, supply-driven; and low-to-medium-efficiency, supply-driven. The high-efficiency, demand-driven type, as the transition state closest to high equilibrium, exhibits a “core–periphery” spatial distribution. Initially concentrated in the metropolitan areas of the provincial capitals, it later expands to secondary cities as regional coordination develops. The low-to-medium-efficiency, demand-driven type exhibits a “gradient lock-in” feature, initially distributed in the Chengdu–Chongqing economic zone and the core regions of Yunnan and Guizhou. Later, it is restricted by factor misallocation, remaining only in the ecologically sensitive areas of northwest Yunnan, reflecting the “inefficient expansion” path-dependency risk. The high-efficiency, supply-driven type shows a “leapfrog distribution” pattern, initially concentrated in the resource-rich northern Anhui region, and later exemplified by cities such as Baoshan and Zunyi, demonstrating the “supply-driven” development potential. The low-to-medium-efficiency, supply-driven type has both “peripheral–ecological” attributes, concentrated in ecological barrier areas such as the northern Sichuan–Qinba mountain area and the border regions of Hubei, Hunan, and Jiangxi, showing deep contradictions between ecological advantages and institutional constraints. The high-efficiency, demand-driven type should focus on improving supply quality; the low-to-medium-efficiency, demand-driven type should focus on optimizing factor allocation efficiency; the high-efficiency, supply-driven type should work to stimulate demand potential; and the low-to-medium-efficiency, supply-driven type must address institutional transaction costs. Common strategies include improving infrastructure, building cross-regional factor coordination platforms, deepening industrial division, and enhancing ecological collaborative governance in order to promote a development state where both land demand intensity and land supply capacity increase in quantity and quality, thus improving regional land-use spatial equilibrium and achieving a high-equilibrium state.
(5) Low-equilibrium state. As shown in Figure 8, low-equilibrium cities exhibit “marginal location characteristics,” and they are mainly distributed in inter-provincial border areas and geographically peripheral zones far from the provincial capitals. These cities do not exhibit spillover effects from provincial capitals and are constrained by administrative boundaries, making policy coordination difficult. Additionally, their fragmented terrain results in high infrastructure costs and weak industrial carrying capacity. Low-equilibrium regions should actively explore strategies for industrial development and ecological construction, implementing an “ecological industrialization + industrial ecology” dual-drive strategy to gradually break the unfavorable situation of low equilibrium and achieve sustainable land-use development.

5. Discussion and Conclusions

5.1. Discussion

Compared to existing studies [7,19,23], building on the new requirements of the high-quality development stage, this study emphasizes the importance of giving equal weight to both “balanced development” and “sufficient development” in land-use spatial equilibrium. It expands the traditional equilibrium concept that mainly focused on quantitative matching into a comprehensive category of “quantity–quality” coordination, thereby more systematically revealing the coordination relationship between “quantity” and “quality” in regional land use. This provides a new research perspective for examining land-use spatial equilibrium under the context of high-quality development. The measurement results were validated by referencing the studies by Bian et al. [57] and Zhu and Chen [23], but there are some discrepancies with the results reported by Huang et al. [11], which may stem from differences in the research areas and measurement indicators. In addition, drawing on China’s planning concepts of the “production–living–ecological space” and the “three major spatial patterns,” this study separately evaluates construction, agricultural, and ecological spaces. This improves upon previous approaches that assessed the land system as a whole while overlooking internal functional differentiation [7], thereby better responding to the needs of refined spatial governance.
The YREB exhibits a wide variety of land-use spatial equilibrium types with substantial regional disparities. On the one hand, region-specific differentiated regulation should be implemented. In areas of excessive development, policies such as “non-core function dispersion” and “quality improvement of existing land” should be adopted to curb land demand intensity. In equilibrium regions, localized strategies should be employed to promote infrastructure connectivity, factor coordination, industrial upgrading, and ecological governance, thereby facilitating simultaneous improvements in both the quantity and quality of land supply and demand. In areas of insufficient development, efforts should focus on improving new infrastructure networks and fostering the integration of “ecological foundation + characteristic industries” to enhance land demand intensity. On the other hand, spatially coordinated governance should be strengthened by leveraging peer effects among neighboring cities. In High–High clusters, collaborative efforts in industrial innovation and technological development should be intensified; in Low–Low clusters, mechanisms for ecological compensation and industrial transfer should be established; in High–Low mixed areas, institutional barriers to factor mobility should be eliminated to promote integrated regional development.
From an international comparative perspective, land-use spatial conflicts and coordination represent common cross-regional issues. For example, the Netherlands’ “green zones” and “red zones” [60] as well as the “smart growth” strategies in North American metropolitan areas [61], though embedded in different policy contexts, all aim to reconcile the tension between land development and ecological protection, making them comparable to the theoretical objectives of this study. The proposed “conjugate dual-element” framework, which builds an identification system from the dimensions of system interaction, multidimensional complexity, and gradient differentiation, demonstrates a certain methodological transferability. It can be applied to other developing regions facing the dual pressures of rapid urbanization and ecological conservation, such as Southeast Asia and Latin American urban agglomerations. However, its concrete application requires adaptive adjustment of indicators according to local data availability, spatial governance structures, and policy objectives. For instance, in regions where land tenure systems differ significantly, the quantification of “land supply capacity” may need to be redefined.
However, this study has certain limitations. At present, most of the selected indicators are based on local static attributes. However, under the context of China’s unified national market and regional coordination strategies [62], cross-boundary flows of factors have become increasingly significant, and land demand and supply may go beyond the constraints of administrative boundaries. Future indicators should incorporate interregional economic linkages, ecosystem service flows, and the intensity of factor mobility, thereby enabling the assessment of equilibrium states within more open spatial units. Moreover, although the proposed framework has preliminary international comparability and potential for wider application, its suitability still needs to be tested through more case studies under diverse institutional and cultural contexts. Subsequent research should further identify key driving factors influencing equilibrium states and conduct mechanism-oriented analyses across multiple scales and scenarios, in order to enhance both theoretical explanatory power and policy responsiveness.

5.2. Conclusions

Based on the conjugate theory, this study defined the concept of land-use spatial equilibrium under the high-quality development context and constructed a land-use spatial equilibrium measurement model that incorporates both “quantity balance” and “efficiency coordination.” The study revealed the spatial–temporal differentiation characteristics of land-use spatial equilibrium in the YREB, classified the equilibrium types, and proposed differentiated development paths. The main conclusions are as follows:
(1) Land-use spatial equilibrium in the YREB shows significant spatial–temporal differences. From 2013 to 2022, the development of land-use spatial equilibrium in the YREB displayed instability but showed significant improvement in spatial equilibrium. Spatially, three major high-value urban clusters emerged: the Lower Yangtze (Nanjing–Suzhou–Hangzhou), the Central Yangtze (Changsha–Wuhan–Nanchang “Central Triangle”), and the Upper Yangtze (Chengdu–Chongqing Twin City Economic Circle). Land-use spatial equilibrium exhibited a spatial proximity effect, although this clustering characteristic weakened over time.
(2) The land-use spatial imbalance types mainly include excessive development and insufficient development, with fewer and more unstable excessive development areas. Areas showing insufficient development were predominantly found in Yunnan and Jiangxi provinces. Areas in a high-level equilibrium state are mainly concentrated in some developed provincial capitals and their neighboring cities. Areas in a medium-level equilibrium state include the high-efficiency, demand-driven; medium-efficiency, demand-driven; high-efficiency, supply-driven; and medium-efficiency, supply-driven types, which are spatially scattered and correspond well with cities that have mid-to-high levels of economic and social development. Areas in a low-level equilibrium state are primarily located in inter-provincial border areas and geographic edge zones far from the provincial capitals, where the terrain is fragmented. The characteristics of different land-use spatial equilibrium types vary significantly, with a different development path for each.

Author Contributions

Conceptualization, Aihui Ma and Wanmin Zhao; methodology, Aihui Ma and Wanmin Zhao; formal analysis, Wanmin Zhao and Yijia Gao; investigation, Wanmin Zhao and Yijia Gao; resources, Aihui Ma and Yijia Gao; data curation, Wanmin Zhao and Yijia Gao; writing—original draft preparation, Wanmin Zhao, Yijia Gao and Aihui Ma; writing—review and editing, Wanmin Zhao, Yijia Gao and Aihui Ma; visualization, Wanmin Zhao; supervision, Aihui Ma and Yijia Gao; project administration, Aihui Ma and Yijia Gao; funding acquisition, Aihui Ma. All authors have read and agreed to the published version of the manuscript.

Funding

Ministry of Education Humanities and Social Sciences Project (Approval No. 20YJA790051).

Data Availability Statement

The original contributions presented in the study are included in the article; further inquiries can be directed to the corresponding author.

Acknowledgments

The authors are grateful to the anonymous reviewers for their comments and suggestions which contributed to the further improvement of this paper.

Conflicts of Interest

The authors declare no conflicts of interest.

References

  1. Cegielska, K.; Rozycka-Czas, R.; Gorzelany, J.; Olczak, B. Land use and land cover conflict risk assessment model: Social and spatial impact of suburbanisation. Landsc. Urban Plan. 2025, 257, 105302. [Google Scholar] [CrossRef]
  2. Liu, H.X.; Soares-Filho, B.S.; Leite-Filho, A.T.; Zhang, S.H.; Du, J.Z.; Yi, Y.J. How to balance land demand conflicts to guarantee sustainable land development. iScience 2023, 26, 106641. [Google Scholar] [CrossRef] [PubMed]
  3. Li, X.; Fu, J.Y.; Jiang, D.; Lin, G.; Cao, C.L. Land use optimization in Ningbo City with a coupled GA and PLUS model. J. Clean. Prod. 2022, 375, 134004. [Google Scholar] [CrossRef]
  4. Jiang, Z.M.; Wu, H.; Lin, A.Q.; Shariff, A.R.M.; Hu, Q.; Song, D.X.; Zhu, W.C. Optimizing the spatial pattern of land use in a prominent grain-producing area: A sustainable development perspective. Sci. Total Environ. 2022, 843, 156971. [Google Scholar] [CrossRef] [PubMed]
  5. Jing, X.D.; Tian, G.L.; He, Y.C.; Wang, M.R. Spatial and temporal differentiation and coupling analysis of land use change and ecosystem service value in Jiangsu Province. Ecol. Indic. 2024, 163, 112076. [Google Scholar] [CrossRef]
  6. Deng, C.X.; Liu, J.Y.; Liu, Y.J.; Li, Z.W.; Nie, X.D.; Hu, X.Q.; Wang, L.X.; Zhang, Y.T.; Zhang, G.Y.; Zhu, D.M.; et al. Spatiotemporal dislocation of urbanization and ecological construction increased the ecosystem service supply and demand imbalance. J. Environ. Manag. 2021, 288, 112478. [Google Scholar] [CrossRef]
  7. Tan, S.K.; Liu, Q.; Li, Y.N. Spatial-temporal characteristics of spatial balance degrees on land use in China. China Land Sci. 2017, 31, 40–46. [Google Scholar]
  8. Qu, Y.B.; Dong, X.Z.; Su, D.S.; Jiang, G.H.; Ma, W.Q. How to balance protection and development? A comprehensive analysis framework for territorial space utilization scale, function and pattern. J. Environ. Manag. 2023, 339, 117809. [Google Scholar] [CrossRef]
  9. Sadian, A.; Shafizadeh-Moghadam, H. The future of agricultural lands under the combined influence of shared socioeconomic pathways and urban expansion by 2050. Agric. Syst. 2025, 224, 104234. [Google Scholar] [CrossRef]
  10. Franco-Solís, A.; Montania, C.V. Dynamics of deforestation worldwide: A structural decomposition analysis of agricultural land use in South America. Land Use Policy 2021, 109, 105619. [Google Scholar] [CrossRef]
  11. Huang, J.C.; Wang, S.; Wang, Y.H. Evaluation of land use space equilibrium degree from perspective of supply and demand driven in Henan Province. Resour. Dev. Mark. 2018, 34, 35–40. [Google Scholar]
  12. Zhou, Y.; Zhong, Z.; Cheng, G.Q. Cultivated land loss and construction land expansion in China: Evidence from national land surveys in 1996, 2009 and 2019. Land Use Policy 2023, 125, 106496. [Google Scholar] [CrossRef]
  13. Liu, X.Z.; Li, X.S.; Zhang, Y.H.; Wang, Y.X.; Chen, J.Q.; Geng, Y.W. Spatiotemporal evolution and relationship between construction land expansion and territorial space conflicts at the county level in Jiangsu Province. Ecol. Indic. 2023, 154, 110662. [Google Scholar] [CrossRef]
  14. Ren, Y.F.; He, X.N.; Jiang, Q.N.; Zhang, F.; Zhang, B.T. Advancing high-quality development in China: Unraveling the dynamics, disparities, and determinants of inclusive green growth at the prefecture level. Ecol. Indic. 2024, 169, 112898. [Google Scholar] [CrossRef]
  15. Fu, J.Y.; Bu, Z.Q.; Jiang, D.; Lin, G.; Li, X. Sustainable land use diagnosis based on the perspective of production-living-ecological spaces in China. Land Use Policy 2022, 122, 106386. [Google Scholar] [CrossRef]
  16. Dagum, C. A new approach to the decomposition of the Gini income inequality ratio. Empir. Econ. 1997, 22, 515–531. [Google Scholar] [CrossRef]
  17. Zhou, R.X.; Jin, J.L.; Cui, Y.; Ning, S.W.; Zhou, L.G.; Zhang, L.B.; Wu, C.G.; Zhou, Y.L. Spatial equilibrium evaluation of regional water resources carrying capacity based on dynamic weight method and Dagum Gini coefficient. Front. Earth Sci. 2022, 9, 790349. [Google Scholar] [CrossRef]
  18. Jiang, Y.Q.; Shi, C.M. Estimating sustainability and regional inequalities using an enhanced sustainable development index in China. Sustain. Cities Soc. 2023, 99, 104555. [Google Scholar] [CrossRef]
  19. Ma, A.H.; Gao, Y.J.; Zhao, W.M. Research on territorial spatial development non-equilibrium and temporal-spatial patterns from a conjugate perspective: Evidence from Chinese provincial panel data. Land 2024, 13, 797. [Google Scholar] [CrossRef]
  20. Shen, H.Y.; Teng, F.; Song, J.P. Evaluation of spatial balance of China’s regional development. Sustainability 2018, 10, 3314. [Google Scholar] [CrossRef]
  21. Han, M.Y.; Chen, G.Q.; Dunford, M. Land use balance for urban economy: A multi-scale and multi-type perspective. Land Use Policy 2019, 83, 323–333. [Google Scholar] [CrossRef]
  22. Li, X.; Lv, X.; Yin, R.M.; Fang, B.; Jin, T. Spatial equilibrium state and its time evolution of the multi-functionalization of regional land use in the Eastern China. Pol. J. Environ. Stud. 2021, 30, 2827–2841. [Google Scholar] [CrossRef]
  23. Zhu, R.M.; Chen, S.L. Research on spatial-temporal characteristics and driving forces of spatial balance degrees on land use in Fujian Province. J. Shanxi Normal Univ. (Nat. Sci. Ed.) 2021, 35, 96–105. [Google Scholar]
  24. Ma, Q.; Shi, F.F. New urbanization and high-quality urban and rural development: Based on the interactive coupling analysis of industrial green transformation. Ecol. Indic. 2023, 156, 111044. [Google Scholar] [CrossRef]
  25. Gao, Q.; Fang, C.L.; Liu, H.M.; Zhang, L.F. Conjugate evaluation of sustainable carrying capacity of urban agglomeration and multi-scenario policy regulation. Sci. Total Environ. 2021, 785, 147373. [Google Scholar] [CrossRef] [PubMed]
  26. De Bonis, M.V.; Ruocco, G. A generalized conjugate model for forced convection drying based on an evaporative kinetics. J. Food Eng. 2008, 89, 232–240. [Google Scholar] [CrossRef]
  27. Selvamurugan, R.; Pathan, B.M.; Hanchinal, A.N.; Dhar, A. Geomagnetic pulsation over conjugate locations during geomagnetic storms and substorm. Adv. Space Res. 2011, 48, 1591–1599. [Google Scholar] [CrossRef]
  28. Hong, H.K.; Cai, Z.C.; Liao, H.P.; Wang, G.; Liu, T. Housing-employment coordinated development and rural revitalization path at the county level in Chongqing Municipality: From the conjugate perspective. Prog. Geogr. 2023, 42, 1098–1111. [Google Scholar] [CrossRef]
  29. Yu, G.M.; Li, M.X.; Tu, Z.F.; Yu, Q.W.; Jie, Y.; Xu, L.L.; Dang, Y.F.; Chen, X.X. Conjugated evolution of regional social-ecological system driven by land use and land cover change. Ecol. Indic. 2018, 89, 213–226. [Google Scholar] [CrossRef]
  30. Bandurski, K.; Kwedlo, W. A Lamarckian hybrid of differential evolution and conjugate gradients for neural network training. Neural Process. Lett. 2010, 32, 31–44. [Google Scholar] [CrossRef]
  31. Xie, Z.Y.; He, L.J.; Mao, Z.; Wan, W.; Song, X.; Wu, Z.J.; Liang, H.; Liu, J.; Zheng, B.F.; Zhu, J.Q. Spatial heterogeneity of natural and socio-economic features shape that of ecosystem services. A large-scale study on the Yangtze River Economic Belt, China. Ecol. Indic. 2024, 159, 111729. [Google Scholar] [CrossRef]
  32. Li, J.C.; Zhang, X.Y.; Kahil, T.; Chen, D.N.; Wang, G.Y.; Xu, S.S.; Zhang, Y.; Chen, Y. From regional imbalances to latecomer advantage: Phosphorus pollution and economic development in the Yangtze economic belt. Ecol. Indic. 2025, 173, 113423. [Google Scholar] [CrossRef]
  33. Liu, Q.; Su, Z.Z.; Huang, W.H. Analysis of the influencing factors of the high-quality utilization of territorial space based on the perspective of spatial equilibrium: A case study of Hunan Province, China. Sustainability 2022, 14, 12818. [Google Scholar] [CrossRef]
  34. Zhang, J.K.; Hou, Y.Z.; Liu, P.L.; He, J.W.; Zhuo, X. The objectives, requirements, and strategic pathways of high-quality development. J. Manag. World 2019, 35, 1–7. [Google Scholar]
  35. Li, Z.Y.; Luan, W.X.; Zhang, Z.C.; Su, M. Relationship between urban construction land expansion and population/economic growth in Liaoning Province, China. Land Use Policy 2020, 99, 105022. [Google Scholar] [CrossRef]
  36. Guo, Z.L.; Hu, Y.C.; Wang, J.; Bai, Y.P. Has China completed the supply-side structural reform of construction land supply? Evidence from 335 cities. Habitat Int. 2025, 156, 103271. [Google Scholar] [CrossRef]
  37. Xiang, A.; Ye, X.; Chuai, X.W.; Cai, Y.Y.; Wang, T.; Luo, Y.T. Heterogeneity analysis of food supply-demand patterns and land carbon loss under different dietary structures in China. Land Use Policy 2024, 145, 107290. [Google Scholar] [CrossRef]
  38. Bole, Y.; Rina, S.; Guga, S.; Na, M.; Fan, S.M.; Zhang, J.Q. Evaluation of resources, environment, and ecological carrying capacity from the perspective of “production-living-ecology” spaces: A case study of western Jilin Province, China. J. Clean. Prod. 2025, 491, 144770. [Google Scholar] [CrossRef]
  39. Wang, S.L.; Yang, L.P.; Arif, M. Evolutionary analysis of ecological-production-living space-carrying capacity in tourism-centric traditional villages in Guangxi, China. J. Environ. Manag. 2025, 375, 124182. [Google Scholar] [CrossRef]
  40. Li, X.; Xu, X.; Yin, R.M. Spatial optimization of agricultural production from the perspective of “Greater Food Concept” in Yangzhou, China. Ecol. Indic. 2024, 169, 112805. [Google Scholar] [CrossRef]
  41. Zhu, X.N.; Liu, Y.Z.; Wang, Y.; Chen, Y.; Zhang, Z.; Song, G.F. Response mechanism of ecosystem service function to urban land expansion process in Wuhan. Resour. Environ. Yangtze Basin 2020, 29, 1515–1524. [Google Scholar]
  42. Xie, G.D.; Lu, C.X.; Leng, Y.F.; Zheng, D.; Li, S.C. Ecological assets valuation of the Tibetan Plateau. J. Nat. Resour. 2003, 18, 189–196. [Google Scholar]
  43. Peng, S.Y.; Yu, Y.J. Green development efficiency measurement and influencing factors analysis in the Yangtze River Economic Belt, China. Ecol. Indic. 2024, 162, 112025. [Google Scholar] [CrossRef]
  44. Wang, C.Q.; Ibrahim, H.; Wu, F.H.; Chang, W.T. Spatial and temporal evolution patterns and spatial spillover effects of carbon emissions in China in the context of digital economy. J. Environ. Manag. 2025, 373, 123811. [Google Scholar] [CrossRef] [PubMed]
  45. Anselin, L. Local indicators of spatial association—LISA. Geogr. Anal. 1995, 27, 93–115. [Google Scholar] [CrossRef]
  46. Li, Y.H.; You, X.; Sun, X.Y.; Chen, J. Dynamic assessment and pathway optimization of agricultural modernization in China under the sustainability framework: An empirical study based on dynamic QCA analysis. J. Clean. Prod. 2024, 479, 144072. [Google Scholar] [CrossRef]
  47. Lu, C.; She, J.J.; Pan, H.Z.; Zhou, X.L.; Zhou, S.T.; Guo, Z.H. Spatiotemporal dynamics of urban–rural integration and resilience: A multi-layer network study in the Chengdu–Chongqing urban agglomeration. Environ. Sustain. Indic. 2025, 27, 100800. [Google Scholar] [CrossRef]
  48. Wei, S.M.; Pan, J.H. Spatiotemporal characteristics of residents’ intercity travel in China under the impact of COVID-19 pandemic. Cities 2024, 152, 105206. [Google Scholar] [CrossRef]
  49. Xu, A.D.; Qian, F.B.; Pai, C.H.; Yu, N.; Zhou, P. The impact of COVID-19 epidemic on the development of the digital economy of China: Based on the data of 31 provinces in China. Front. Public Health 2022, 9, 778671. [Google Scholar] [CrossRef]
  50. Martinho, V.J.P.D. Impacts of the COVID-19 pandemic and the Russia–Ukraine conflict on land use across the world. Land 2022, 11, 1614. [Google Scholar] [CrossRef]
  51. Hepburn, C.; Qi, Y.; Stern, N.; Ward, B.; Xie, C.P.; Zenghelis, D. Towards carbon neutrality and China’s 14th Five-Year Plan: Clean energy transition, sustainable urban development, and investment priorities. Environ. Sci. Ecotechnol. 2021, 8, 100130. [Google Scholar] [CrossRef]
  52. Li, J.F.; Gu, A.L.; Ma, Z.Y.; Zhang, C.L.; Sun, Z.Q. Economic development, energy demand, and carbon emission prospects of China’s provinces during the 14th Five-Year Plan period: Application of CMRCGE model. Adv. Clim. Change Res. 2019, 10, 165–173. [Google Scholar] [CrossRef]
  53. Zhang, Z.Y.; Zhang, L.J.; Liang, T.; Cheng, L.; Fang, L.H.; Zhao, B.; Zhang, J.Y.; Wen, C.H. Has the Yangtze River Economic Belt strategy promoted the construction of ecological civilization in the upper reaches of the Yangtze River? Front. Environ. Sci. 2022, 10, 1046323. [Google Scholar] [CrossRef]
  54. Zhao, W.; Jiang, C.J. Analysis of the spatial and temporal characteristics and dynamic effects of urban-rural integration development in the Yangtze River Delta Region. Land 2022, 11, 1054. [Google Scholar] [CrossRef]
  55. Huang, L.J.; Yang, P.; Zhang, B.Q.; Hu, W.Y. Spatio-temporal coupling characteristics and the driving mechanism of population-land-industry urbanization in the Yangtze River Economic Belt. Land 2021, 10, 400. [Google Scholar] [CrossRef]
  56. Fan, J. High-quality development of national territory space governance and regional economic layout during 14th Five-Year Plan in China. Bull. Chin. Acad. Sci. (Chin. Ver.) 2020, 35, 796–805. [Google Scholar]
  57. Bian, F.M.; Liu, Y.T.; Zhao, L. The spatial balance degree evaluation on land use in Jilin Province. China Land Sci. 2015, 29, 74–80. [Google Scholar]
  58. Yang, Q.K.; Wang, L.; Li, Y.L.; Qin, X.H. Land use spatial equilibrium from the perspective of supply and demand matching: A case study of Jiangsu Province. Resour. Sci. 2021, 43, 932–943. [Google Scholar] [CrossRef]
  59. Rey, S.J.; Murray, A.T.; Anselin, L. Visualizing regional income distribution dynamics. Lett. Spat. Resour. Sci. 2011, 4, 81–90. [Google Scholar] [CrossRef]
  60. Louw, E.; van der Krabben, E.; Priemus, H. Spatial development policy: Changing roles for local and regional authorities in the Netherlands. Land Use Policy 2003, 20, 357–366. [Google Scholar] [CrossRef]
  61. Downs, A. Smart growth: Why we discuss it more than we do it. J. Am. Plan. Assoc. 2005, 71, 367–378. [Google Scholar] [CrossRef]
  62. Feng, Y.C.; Sun, M.M.; Pan, Y.X.; Zhang, C. Fostering inclusive green growth in China: Identifying the impact of the regional integration strategy of Yangtze River Economic Belt. J. Environ. Manag. 2024, 358, 120952. [Google Scholar] [CrossRef]
Figure 1. Theoretical analysis framework.
Ijgi 14 00355 g001
Figure 2. Research framework.
Ijgi 14 00355 g002
Figure 3. Location map of the study area. Note: the figure is drawn with reference to the standard map authorized by the Ministry of Natural Resources (Approval No. GS(2019)1822), without any alterations to the original base map.
Ijgi 14 00355 g003
Figure 4. Line chart of temporal changes in spatial equilibrium degrees of land use in the YREB. Note: SE refers to the spatial equity of land use.
Ijgi 14 00355 g004
Figure 5. Three-dimensional kernel density map of spatial equilibrium degrees of land use in the YREB. Note: For cities in imbalance states (overdevelopment and underdevelopment), the spatial equilibrium of land use was uniformly assigned a value of 0.1; hence, the first peak reflects the distribution pattern of cities in imbalance states.
Ijgi 14 00355 g005
Figure 6. Spatial distribution maps of land-use spatial equilibrium degrees in 2013, 2016, 2019, and 2022. Note: Due to unmeasured land-use spatial equilibrium in cities experiencing imbalances (overdevelopment and underdevelopment), a uniform value of 0.1 is assigned, displayed as (0, 0.10] in the subfigures.
Ijgi 14 00355 g006
Figure 7. LISA maps of land-use spatial equilibrium degrees in 2013, 2016, 2019, and 2022.
Ijgi 14 00355 g007
Figure 8. Spatial distribution of land-use spatial equilibrium types in 2013, 2016, 2019, and 2022.
Ijgi 14 00355 g008
Table 1. Evaluation index system for land demand intensity and land supply capacity.
Target
Level
Criterion LevelIndicator LevelIndicator DefinitionCalculation Method
Land
demand intensity (LD)
Construction space demandPopulation density
(persons/km2)
Represents residential land demandResident population/total land area
GDP per unit of land area
(104 CNY/km2)
Represents industrial land demandRegional GDP/total land area
Agricultural space demandPer capita grain consumption (kg)Represents agricultural space demand due to human grain consumption(urban per capita grain consumption × urban population ratio) + (rural per capita grain consumption × rural population ratio)
Per capita meat consumption (kg)Represents agricultural space demand due to human meat consumptionMeat consumption/resident population
Ecological space
demand
Carbon
emission per GDP (t/108 CNY)
Represents ecological space demand due to production and living carbon emissionsCarbon emissions/regional GDP
Per capita
water supply (m3)
Represents ecological space demand due to production and living water consumptionRegional water supply/resident population
Land
supply
capacity (LS)
Construction space supplyPer capita construction land area (km2/104 persons)Represents quantity of construction space supplyConstruction land area/resident population
Unit construction land output
(108 CNY/km2)
Represents quality of construction space supplyAdded value of secondary and tertiary industries/construction land area
Agricultural space supplyPer capita arable land area
(km2/104 persons)
Represents quantity of agricultural space supplyArable land area/resident population
Unit area grain yield
(t/km2)
Represents quality of agricultural space supplyTotal grain yield/arable land area
Ecological space
supply
Forest coverage rate (%)Represents quantity of ecological space supplyForest area/total land area
Per capita ecological service valueRepresents quality of ecological space supplyEcological service value/ecological land area
Table 2. Global Moran’s I values of land-use spatial equilibrium degrees in the YREB.
YearMoran’s Ip-ValueZ-Value
20130.1740.0122.499
20140.1950.0052.760
20150.1740.0132.466
20160.2100.0032.933
20170.1510.0322.147
20180.1820.0092.609
20190.1540.0282.191
20200.1680.0042.880
20210.0220.6570.443
20220.0680.2721.096
Table 3. Classification of land-use spatial equilibrium types.
StatusLand-Use Spatial
Equilibrium Degree
Classification Criteria
ImbalanceOverdevelopmentBI ∈ [1.40, 2.20)
UnderdevelopmentBI ∈ (0, 0.40]
EquilibriumHigh equilibrium S E ∈ [1.00, 1.40)
Medium
equilibrium
Strong-demand, high-efficiency: S E ∈ (0.65, 1.00), BI ∈ [0.60, 1.40) and EI ∈ [1.00, 1.50)
Strong-demand, medium–low-efficiency: S E ∈ (0.65, 1.00), BI ∈ [0.60, 1.40) and EI ∈ (0.65, 1.00)
Strong-supply, high-efficiency: S E ∈ (0.65, 1.00), BI ∈ (0.40, 0.60) and EI ∈ [1.00, 1.50)
Strong-supply, medium–low-efficiency: S E ∈ (0.65, 1.00), BI ∈ (0.40, 0.60) and EI ∈ (0.65, 1.00)
Low equilibrium S E ∈ (0, 0.65]
Note: S E refers to the spatial equity of land use, BI refers to the balance index of land-use supply and demand, and EI refers to the efficiency index of land-use supply and demand.
Disclaimer/Publisher’s Note: The statements, opinions and data contained in all publications are solely those of the individual author(s) and contributor(s) and not of MDPI and/or the editor(s). MDPI and/or the editor(s) disclaim responsibility for any injury to people or property resulting from any ideas, methods, instructions or products referred to in the content.