Article

Assessing the Available Landslide Susceptibility Map and Inventory for the Municipality of Rio de Janeiro, Brazil: Potentials and Challenges for Data-Driven Applications

by
Pedro Henrique Muniz Lima
1,2,
Luiz Carlos Teixeira Coelho
1,3,4,*,
Guilherme Damasceno Raposo
1,
Irving da Silva Badolato
1,
Raquel Batista Medeiros da Fonseca
5,
Sonia Maria Lima Silva
1 and
Jonatas Goulart Marinho Falcão
1,4
1
Photogrammetry and Remote Sensing Laboratory, School of Engineering, Rio de Janeiro State University, Rua São Francisco Xavier 524, PJLF Sala 4044F-Maracanã, Rio de Janeiro 20550-013, RJ, Brazil
2
ENGAGE-Geomorphological Systems and Risk Research, Institute of Geography and Regional Research, University of Vienna, Universitätsstraße 7 A, 1010 Vienna, Austria
3
City Information Coordination Office (Coordenadoria de Informações da Cidade), Pereira Passos Municipal Institute of Urban Planning, Rua Gago Coutinho, 52-Laranjeiras, Rio de Janeiro 22221-070, RJ, Brazil
4
Post-Graduate Program in Urban Engineering, Polytechnic School, Federal University of Rio de Janeiro, Av. Athos da Silveira Ramos, 149, CT-Bloco D, Sala D101, Cidade Universitária, Rio de Janeiro 21941-909, RJ, Brazil
5
Monitoring Management, Foundation Institute of Geotechnics of the Municipality of Rio de Janeiro, Campo de São Cristóvão, 268-São Cristóvão, Rio de Janeiro 20921-440, RJ, Brazil
*
Author to whom correspondence should be addressed.
ISPRS Int. J. Geo-Inf. 2025, 14(9), 330; https://doi.org/10.3390/ijgi14090330
Submission received: 7 June 2025 / Revised: 18 August 2025 / Accepted: 22 August 2025 / Published: 26 August 2025

Abstract

This study presents an initial evaluation of the heuristic landslide susceptibility map for the Municipality of Rio de Janeiro by comparing it with the official landslide inventory. The objective is to provide a first analysis of the accuracy of the current map (Reference Map), which was developed using heuristic methods, in contrast with a basic predictive model based on Generalized Additive Models (GAMs). The study includes a critical review of the existing inventory and examines landslide records from 2010 to 2016, using georeferenced data provided by the GeoRio Foundation. Data from 2017 and 2018 are used for a preliminary test of the model. Rather than proposing a replacement, this study suggests that even simple data-driven models can offer useful insights into potential improvements in the reference susceptibility map. The results are exploratory and intended to inform future, more detailed analyses. While limited in scope, this work illustrates how quantitative approaches may complement existing methods in landslide prediction assessment.

1. Introduction

The city of Rio de Janeiro has been dealing with landslides for many years, with systematic records in recent decades [1]. This period coincides with significant rural-to-urban migration, driven by industrialization in major southeastern cities, particularly Rio de Janeiro and São Paulo [2]. As housing costs historically increased and available land became scarce, many migrants began to occupy areas along rivers and hillsides. Due to financial constraints, many constructions were carried out precariously, lacking proper protections against landslides [3].
Landslide phenomena have always occurred but are of growing concern, especially in large and complex urban regions like the Rio de Janeiro municipality. Over more than seven decades of intense rural-to-urban migration—Rio de Janeiro being one of the main destinations, especially during its time as the nation’s capital—this movement contributed to the formation of favelas and informal urban settlements [4].
The occupation of hillsides, often irregular and unplanned, combined with uncontrolled land-use changes and deforestation, significantly exacerbates landslide susceptibility. These human-induced factors alter natural drainage patterns, reduce soil stability, and increase surface runoff, making slopes more prone to failure, particularly during intense rainfall events [1]. Additionally, climate change and extreme rainfall are the main natural triggers for landslides [5]. Recent studies have demonstrated that anthropogenic climate change has already influenced individual landslide events. For instance, in June 2009, up to 10% of the 952 landslides in a region of Austria were attributed to climate change [6].
Also, favela settlements often involve earthworks—mostly unplanned—which have been proven to greatly enhance landslides and other tragedies [7]. Considerable research has been developed in terms of enhancing preparedness of urban environments [8] so citizens are evacuated as soon as possible. Nevertheless, they must rely on more trustworthy assessments, since a variety of technical reports may hinder the discussion and convince citizens to stay in areas where they should not [9]. Moreover, the microrelief generated by narrow alleys and poorly planned construction in informal settlements exacerbates landslide susceptibility. Intense rainfall concentrates runoff along irregularly occupied hillslopes, increasing slope instability. These conditions are difficult to represent in models, as they require detailed spatial data and frequent updates. Addressing these challenges requires continued investigation, with fundamental research laying the scientific foundation for improved modeling efforts.
The lack of adequate access in favelas and other informal urban settlements complicates oversight, facilitating the construction of irregular housing and, unfortunately, contributing to the occurrence of landslides. This phenomenon primarily affects the poorest segments of society, who are most dependent on government assistance. For instance, favelas occupy approximately 4% of Rio de Janeiro’s territory [10] while being home to 21.73% of the population [11], and are always a cause for concern during heavy rains. A precise landslide susceptibility map is essential for the stakeholders to enhance safety strategies and effectively manage populations and infrastructure in landslide-prone areas. It helps identify imminent hazards, enabling proactive measures [12]. For public authorities, such maps serve as crucial tools for planning and implementing policies to prevent landslides and mitigate their potential impacts.
This study aims to establish a foundational baseline evaluation of Rio de Janeiro’s landslide inventory while assessing the current susceptibility map against recorded occurrences in recent years. In turn, it characterizes the inventory and explores its usability for future data-driven assessments, such as applications in geostatistics, artificial intelligence, and spatio-temporal modeling [13,14,15].
Secondary objectives include:
  • Help establishing a database of landslide occurrences, originally stored as PDF (Portable Document Format) files, enabling researchers and public administrators to have a spatial view of where landslides most frequently occur in the city;
  • Critically analyze the current susceptibility map (Reference Map), contrasting and comparing it with the recorded occurrences in recent years;
  • Assessing and/or recommending the use of data-driven models in the production of susceptibility mappings.

2. Study Area

This study focuses on the municipality of Rio de Janeiro (Figure 1), the capital of the state of Rio de Janeiro, Brazil. The city has a territorial area of 1200.329 km2, with a population of 6,211,223 people, resulting in a population density of 5174.60 inhabitants/km2 [16]. The city is renowned for its unique geography, characterized by diverse terrain that includes mountain ranges (Tijuca, Pedra Branca, and Gericinó-Mendanha massifs), hills, valleys, and an extensive urban area stretching to the Atlantic coast [17].
The Rio de Janeiro municipality, like many other densely populated cities in southern and southeastern Brazil, frequently experiences extreme rainfall events, particularly during the summer [18]. Beyond the inherent susceptibility of the terrain, which is largely determined by its geology, geomorphology, soils, and the dynamicity of its landscapes. Rainfall serves as the primary trigger for landslides in the city [18,19,20,21,22,23,24,25]. Both rainfall intensity and accumulated precipitation—in interaction with these underlying conditioning factors—are crucial for analyzing landslide occurrences [26].
Urban reorganization occasionally exposes fresh sections of natural terrain, providing valuable empirical data on the interactions between geomorphology, soil properties, and rainfall that govern slope failure. Although spatially and temporally limited, such exposures enable the identification of thresholds in slope gradient, soil strength, and rainfall intensity and duration, which can be statistically formalized to enhance the predictive accuracy of susceptibility models.
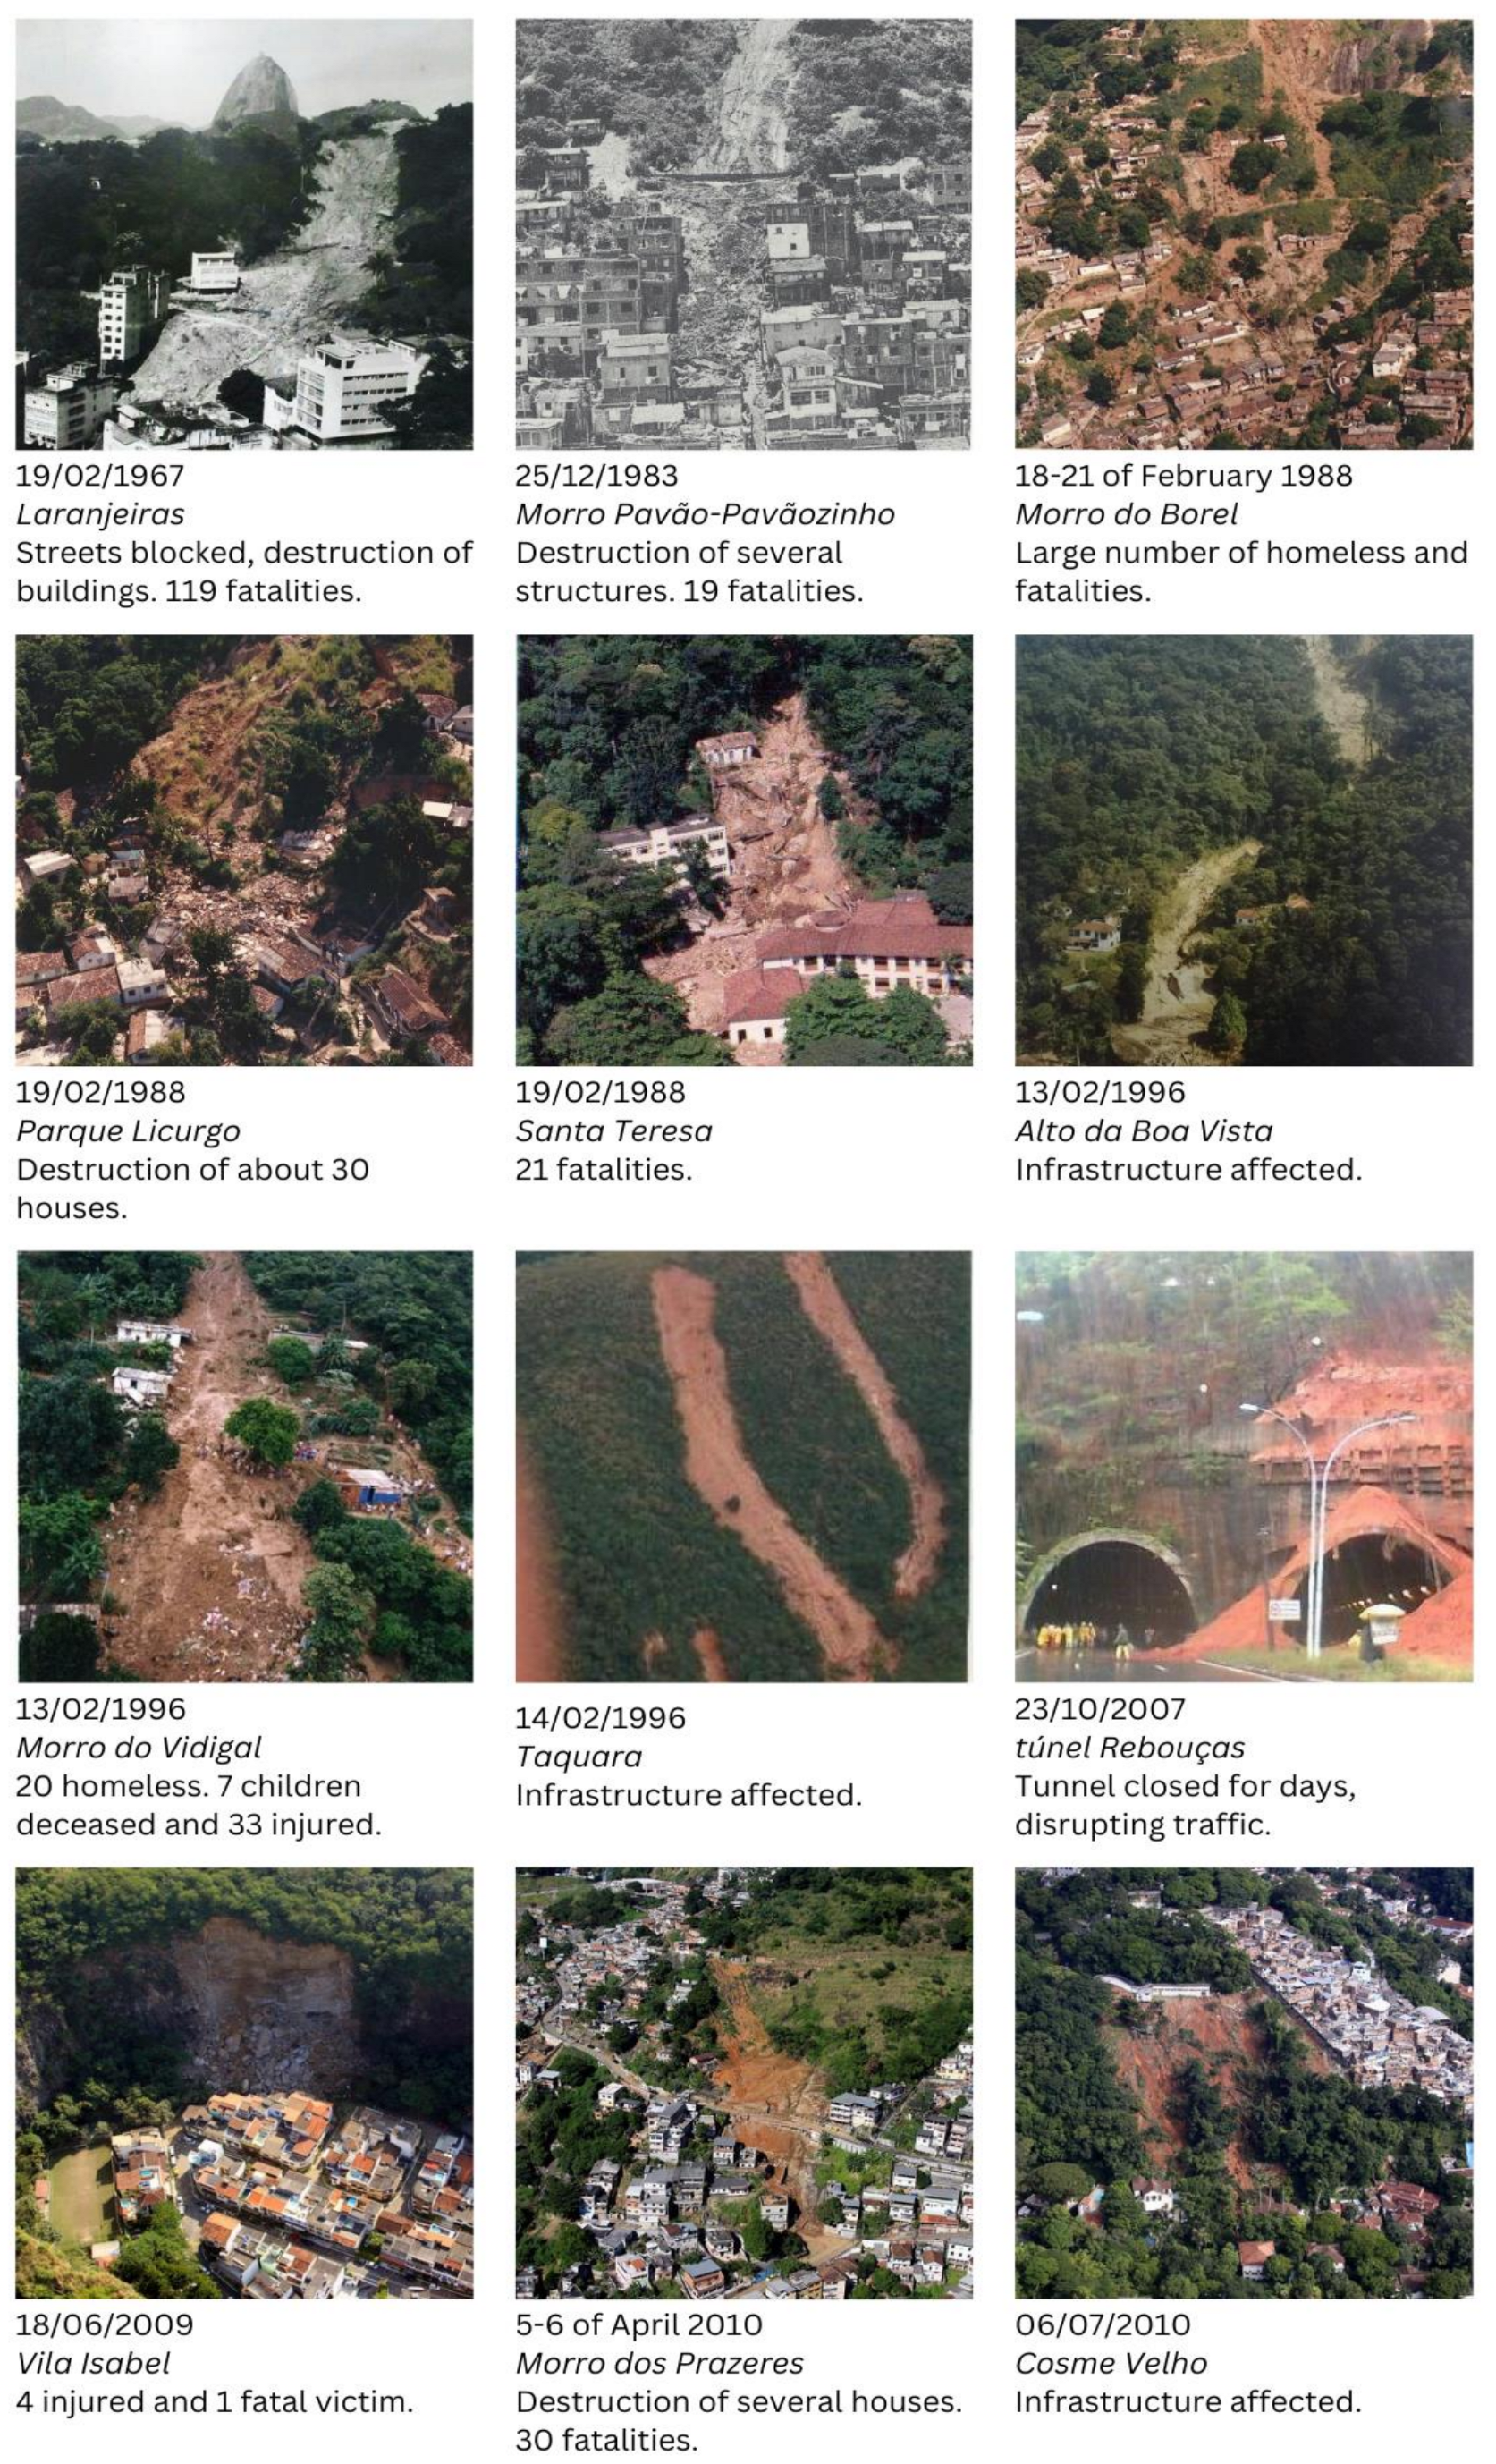
A Geo-Rio report [1] from 2016 documents the 50 largest geological-geotechnical disasters in Rio de Janeiro between 1966 and 2016, illustrated with photos (Figure 2) and descriptions. Fatalities, infrastructural losses, and major blocked roads, are between the consequences frequently caused ba landslides in the region.

2.1. Climatic, Seasonal, Rainfall, and Morphological Characterization

The geomorphology of Rio de Janeiro is shaped by a complex interaction between mountainous terrain and coastal dynamics, producing a diverse landscape. This results from long-term geological, tectonic, and climatic processes. Prominent features include granite massifs such as Tijuca, Pedra Branca, and Gericinó-Mendanha, and sedimentary lowlands along the coast and lagoons [27]. These massifs, with steep slopes and variable relief, are particularly susceptible to erosion and landslides, especially under heavy rainfall. Local climate plays a key role in landslide occurrence, particularly during periods of hydrometeorological extremes [18].
The city is located in a tropical climate region, with rainfall concentrated primarily in the summer, from January to March. This climatic pattern, combined with rugged terrain and urban occupation on slopes, makes the city particularly vulnerable to landslides [28]. During summer, convective rainfall is intensified by local warming, especially in the northern sectors of the city. Rainfall seasonality shows a clear pattern: summer is the wettest season, followed by spring and autumn, with winter being the driest [29]. Spatial patterns also reflect topographic influences: massifs such as Serra da Carioca (2200 mm), Serra do Mendanha (1400 mm), and Serra Geral de Guaratiba (1200 mm) receive much higher rainfall than lowland areas like Penha (870 mm) and Irajá (905 mm) [29].
This variability is further explained by recent studies showing that rainfall distribution over Rio de Janeiro is strongly modulated by mesoscale and large-scale meteorological systems, including the South Atlantic Convergence Zone (SACZ), frontal systems, and local circulations enhanced by complex topography [30,31]. These influences create high spatial and temporal variability, with rainfall totals varying significantly even over short distances.
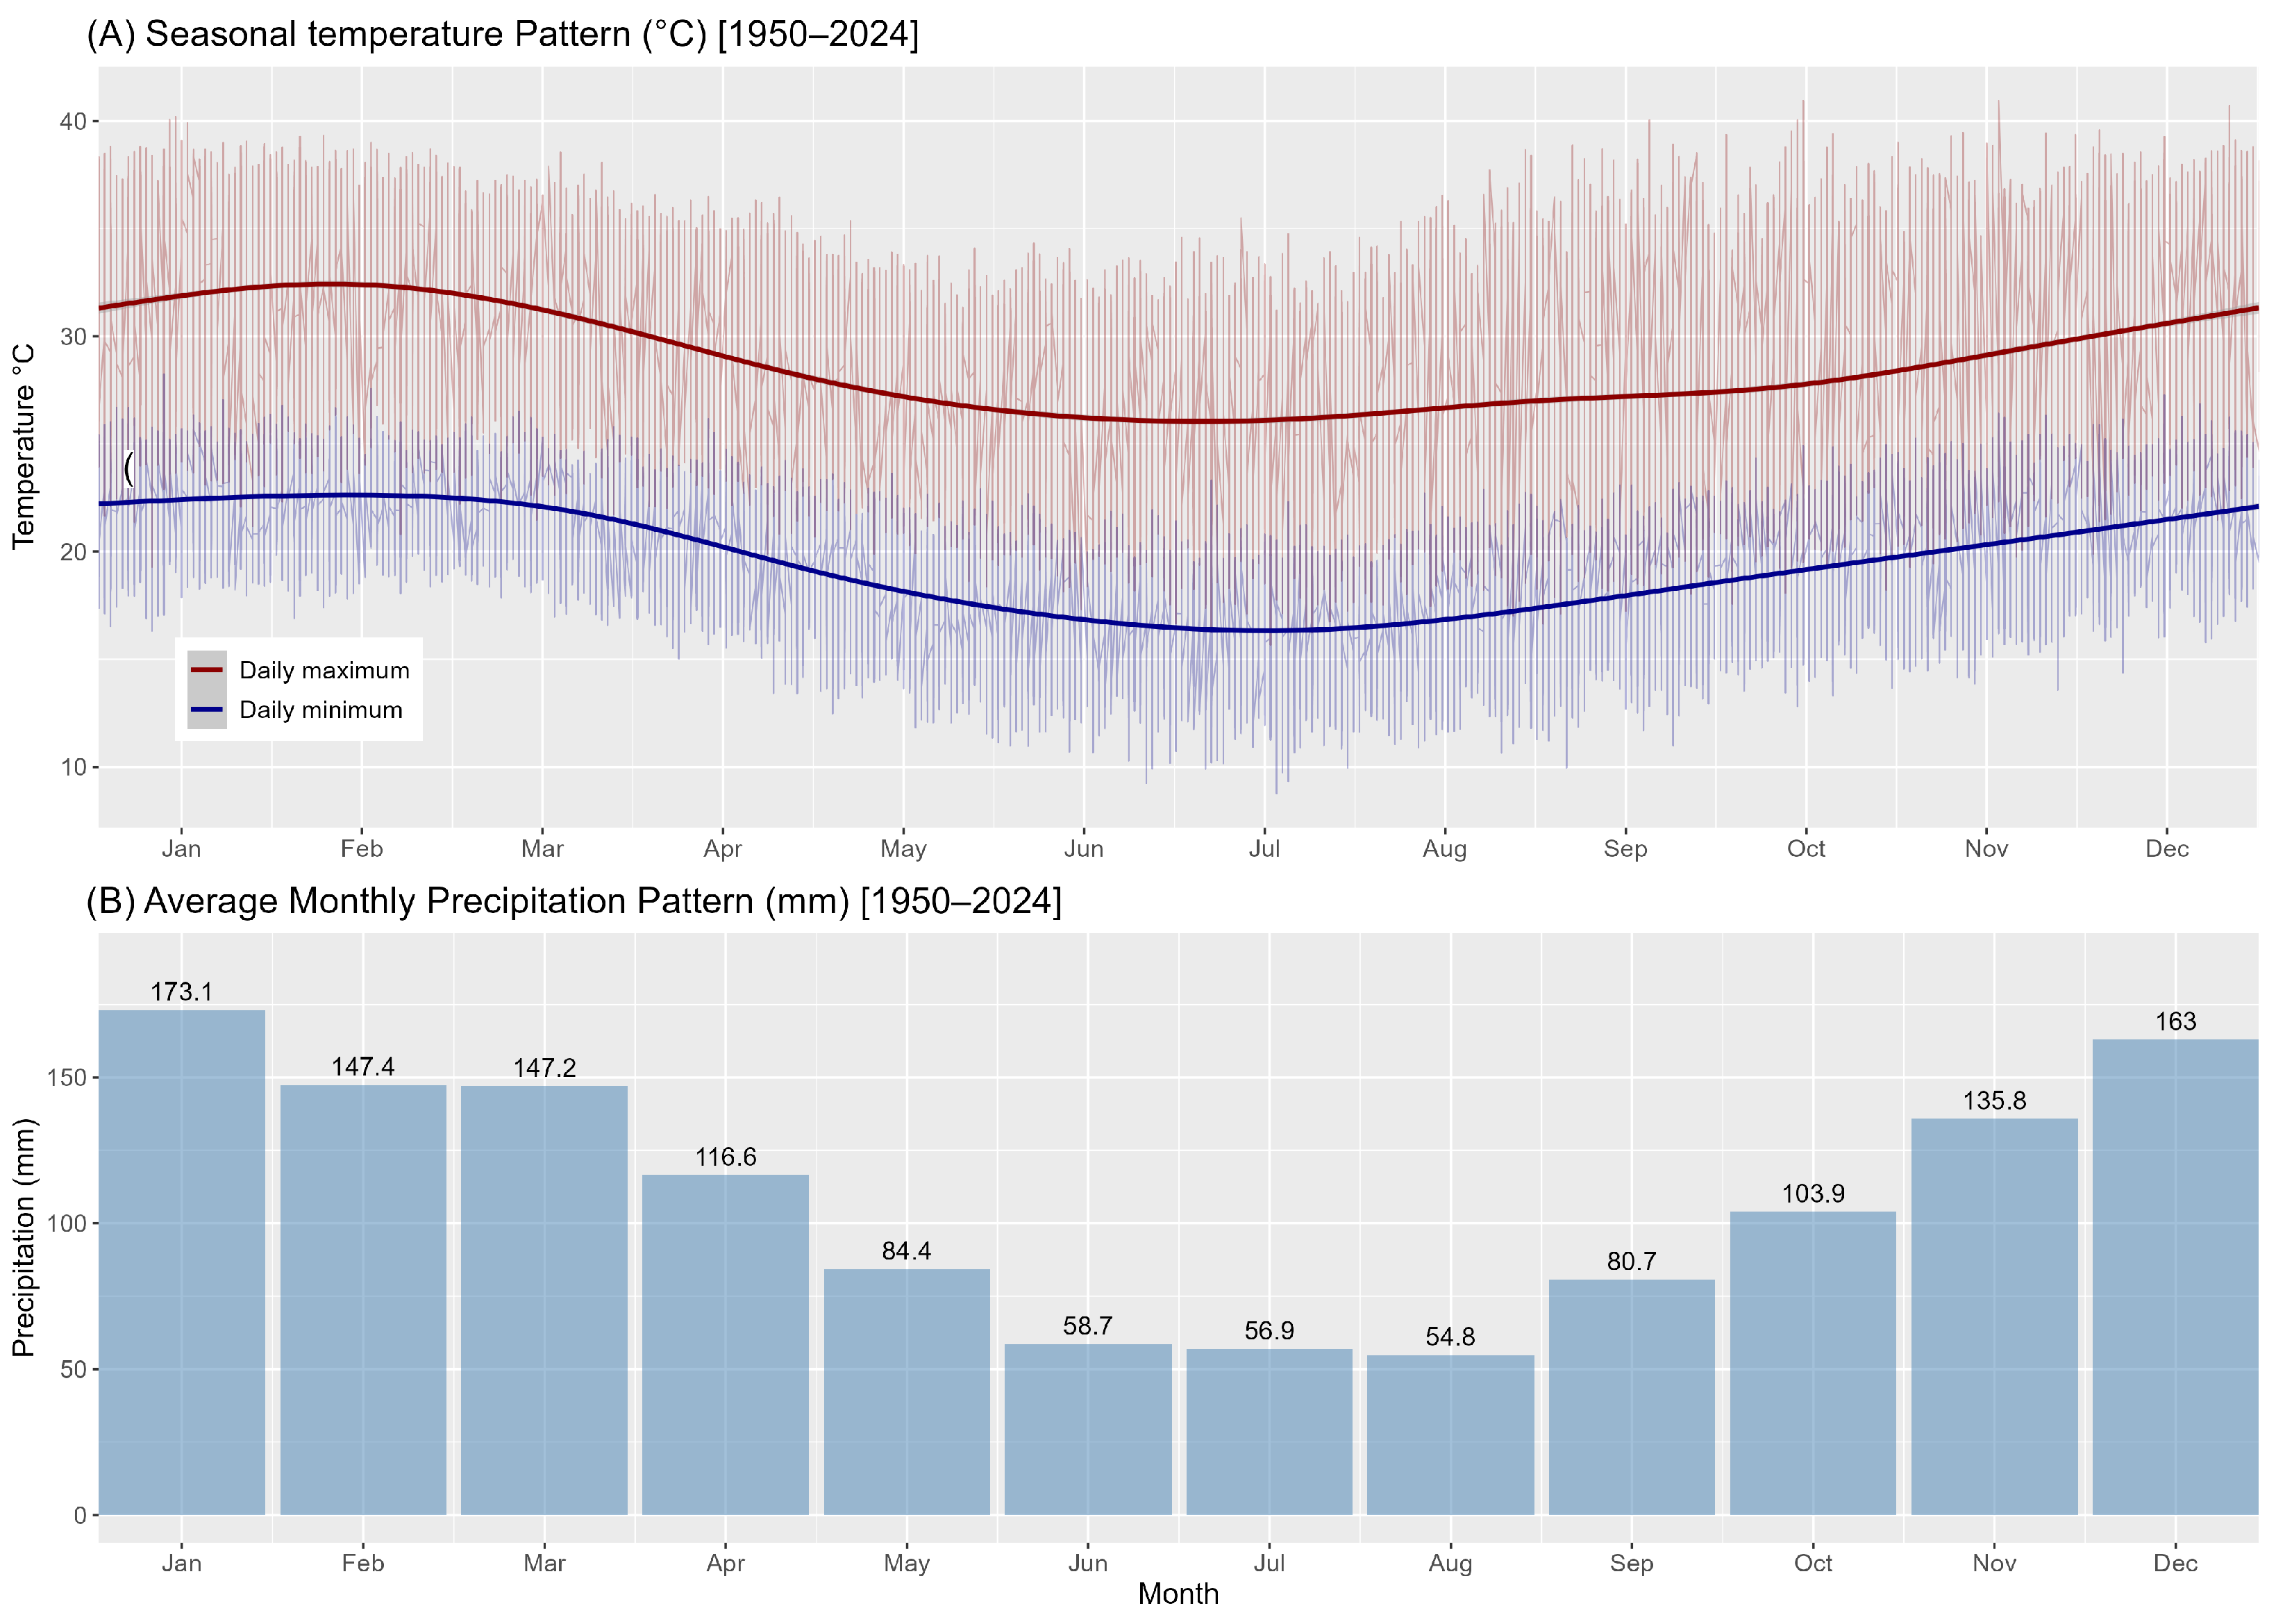
As shown in Figure 3, temperature and precipitation patterns between 1950 and 2021 reveal a clear seasonal cycle [32]. Rainfall is higher from December to March, coinciding with the hottest months, when monthly precipitation often exceeds 140 mm and daily maximum temperatures surpass 30 °C.
Some rainfall events in recent years have reached notably high daily accumulations, reflecting the city’s exposure to hydrometeorological extremes. On 6 April 2010, the Sumaré station recorded 360.2 mm of precipitation within 24 h. Similarly, on 9 April 2019, rain gauges in Rocinha, Alto da Boa Vista, and Jardim Botânico measured daily totals exceeding 300 mm [33]. As noted by da Fonseca Martins [34], the April 2010 event alone resulted in over 60 fatalities in the municipality. In tropical residual soils, like those in the mountainous and urbanized areas of Rio de Janeiro, slope instability has been associated with rainfall infiltration and its effects on the hydro-mechanical behavior of soils. Studies from the region [22,35,36,37] describe how infiltration can lead to a reduction in matric suction, which lowers the apparent cohesion and may contribute to shallow slope failures under intense or prolonged rainfall.

2.2. Key Definitions

To better understand this research, it is important to outline some definitions, including susceptibility, and landslide inventory.
  • Landslide: The downslope movement of soil, rock, debris, and/or organic material under the influence of gravity, encompassing a range of processes and magnitudes [38,39,40,41].
  • Landslide inventory: A compilation containing information about geotechnical event occurrences in a specific area, typically including location, classification, volume, activity, occurrence date, and other relevant characteristics [42,43]. A well-prepared inventory links slope failures to terrain conditions, supports model validation, and is essential for integrating slope stability into land-use planning [42].
  • Landslide susceptibility: Mapping that estimates the relative likelihood of landslides occurring across spatial units under current environmental conditions [44,45,46,47]. Susceptibility maps express this likelihood either qualitatively or quantitatively, depending on the methodology, and are a core tool for anticipating hazardous areas and informing territorial planning. Serving as a decision-making aid in urban development [38,47].

2.3. Methods for Landslide Mapping

Landslide susceptibility methods are generally classified into qualitative (heuristic) and quantitative (data-driven and physically-based) approaches [47,48,49]. Qualitative methods rely on expert judgment, while quantitative ones use empirical or physical models to estimate landslide likelihood [50,51]. Heuristic methods assign weights to factors such as slope, aspect, land use, and soils, often through geomorphological analysis and weighted GIS overlays, based on expert understanding [47,48,51,52]. Multi-criteria decision analysis (MCDA) integrates multiple factors [53,54,55], offering cost-effective solutions in data-scarce areas but limited by subjectivity and validation issues [56]. Data-driven methods instead relate mapped landslides to geo-environmental factors such as slope, geology, hydrology, and rainfall [48,57], offering greater objectivity but depending strongly on inventory quality and predictor choice [52,58]. Physically-based models simulate slope stability using geotechnical parameters (e.g., pore pressure, shear strength) to estimate the Factor of Safety [47,59], but require detailed inputs and are mostly suited to slope- or site-scale studies.
At the regional scale, current state-of-the-art approaches for landslide susceptibility mapping combine diverse computational methods with geospatial analysis of historical landslide inventories. Quantitative data-driven methods have evolved from classical statistical frameworks such as frequency ratio analysis [60,61], hybrid approaches integrating information theory and bivariate statistics [62,63,64], and multivariate models like logistic regression [65,66,67,68]. More recent advances employ ensemble and machine-learning algorithms (e.g., random forest, naïve Bayes, boosting methods, kernel logistic regression), often reporting improved predictive performance [69,70,71,72,73]. This study investigates the potential of Generalized Additive Models (GAMs): a type of flexible yet computationally efficient algorithm capable of capturing complex non-linear relationships that remains underutilized in landslide susceptibility assessment [74,75]. Also, as an assessment of their efficacy, we employ a more concise set of covariates to evaluate the model’s predictive performance under parsimonious conditions, as detailed in subsequent sections.
Across all approaches, key trade-offs persist. Classical statistical methods are interpretable and less resource-intensive, while advanced ML models can enhance accuracy but demand higher data quality and computational resources. The choice of method thus reflects a balance between predictive performance, data availability, and operational feasibility [47,48,50,58,76].

3. Materials and Methods

3.1. Materials

3.1.1. Reference Map: The Existing Susceptibility Map

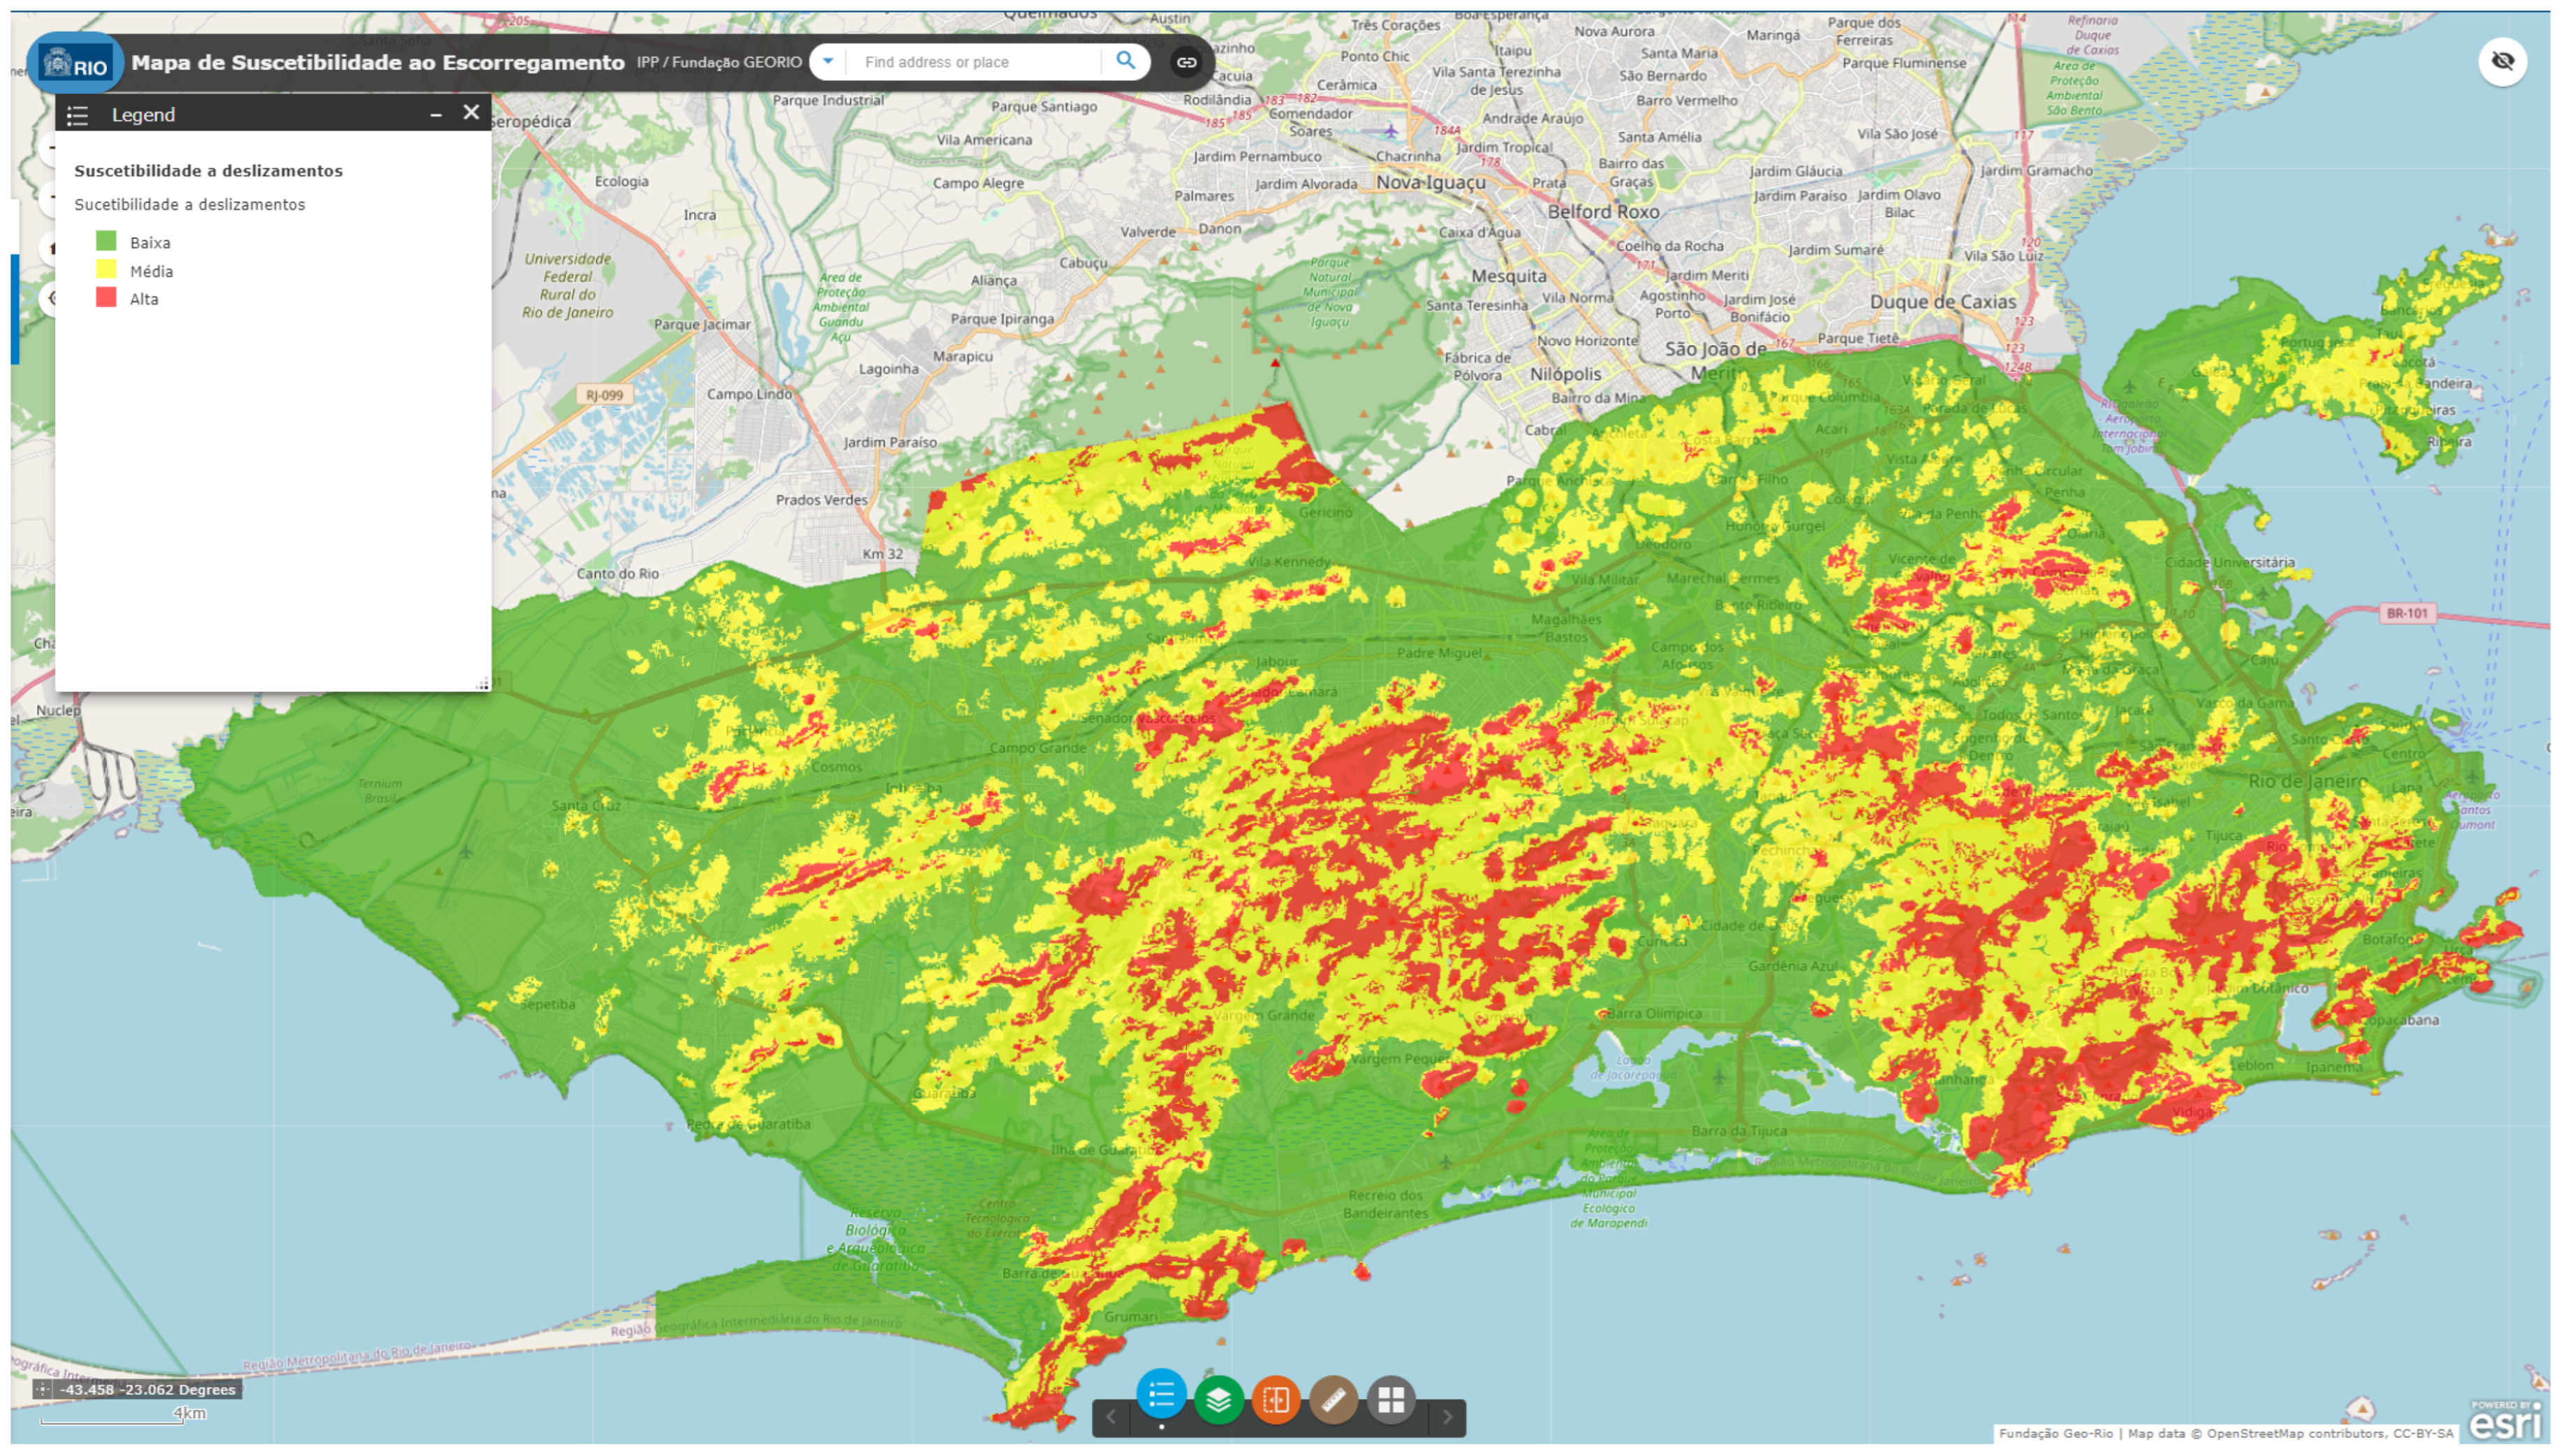
The current landslide susceptibility map of the municipality of Rio de Janeiro [77], was produced by Geotechnical Institute Foundation of the Municipality of Rio de Janeiro (Geo-Rio) in 2015 at a 1:10,000 scale. The map is available at DataRio (https://www.data.rio/apps/PCRJ::suscetibilidade-a-deslizamentos/explore, accessed on 17 December 2024) and can also be seen in Figure 4. Traditionally, such maps were created using heuristic methods, where an expert technician’s knowledge determined the weights assigned to factors influencing landslides in a specific area [47]. Hereafter, the official Rio de Janeiro map will be referred to as the “Reference Map”.

3.1.2. Landslide Inventory

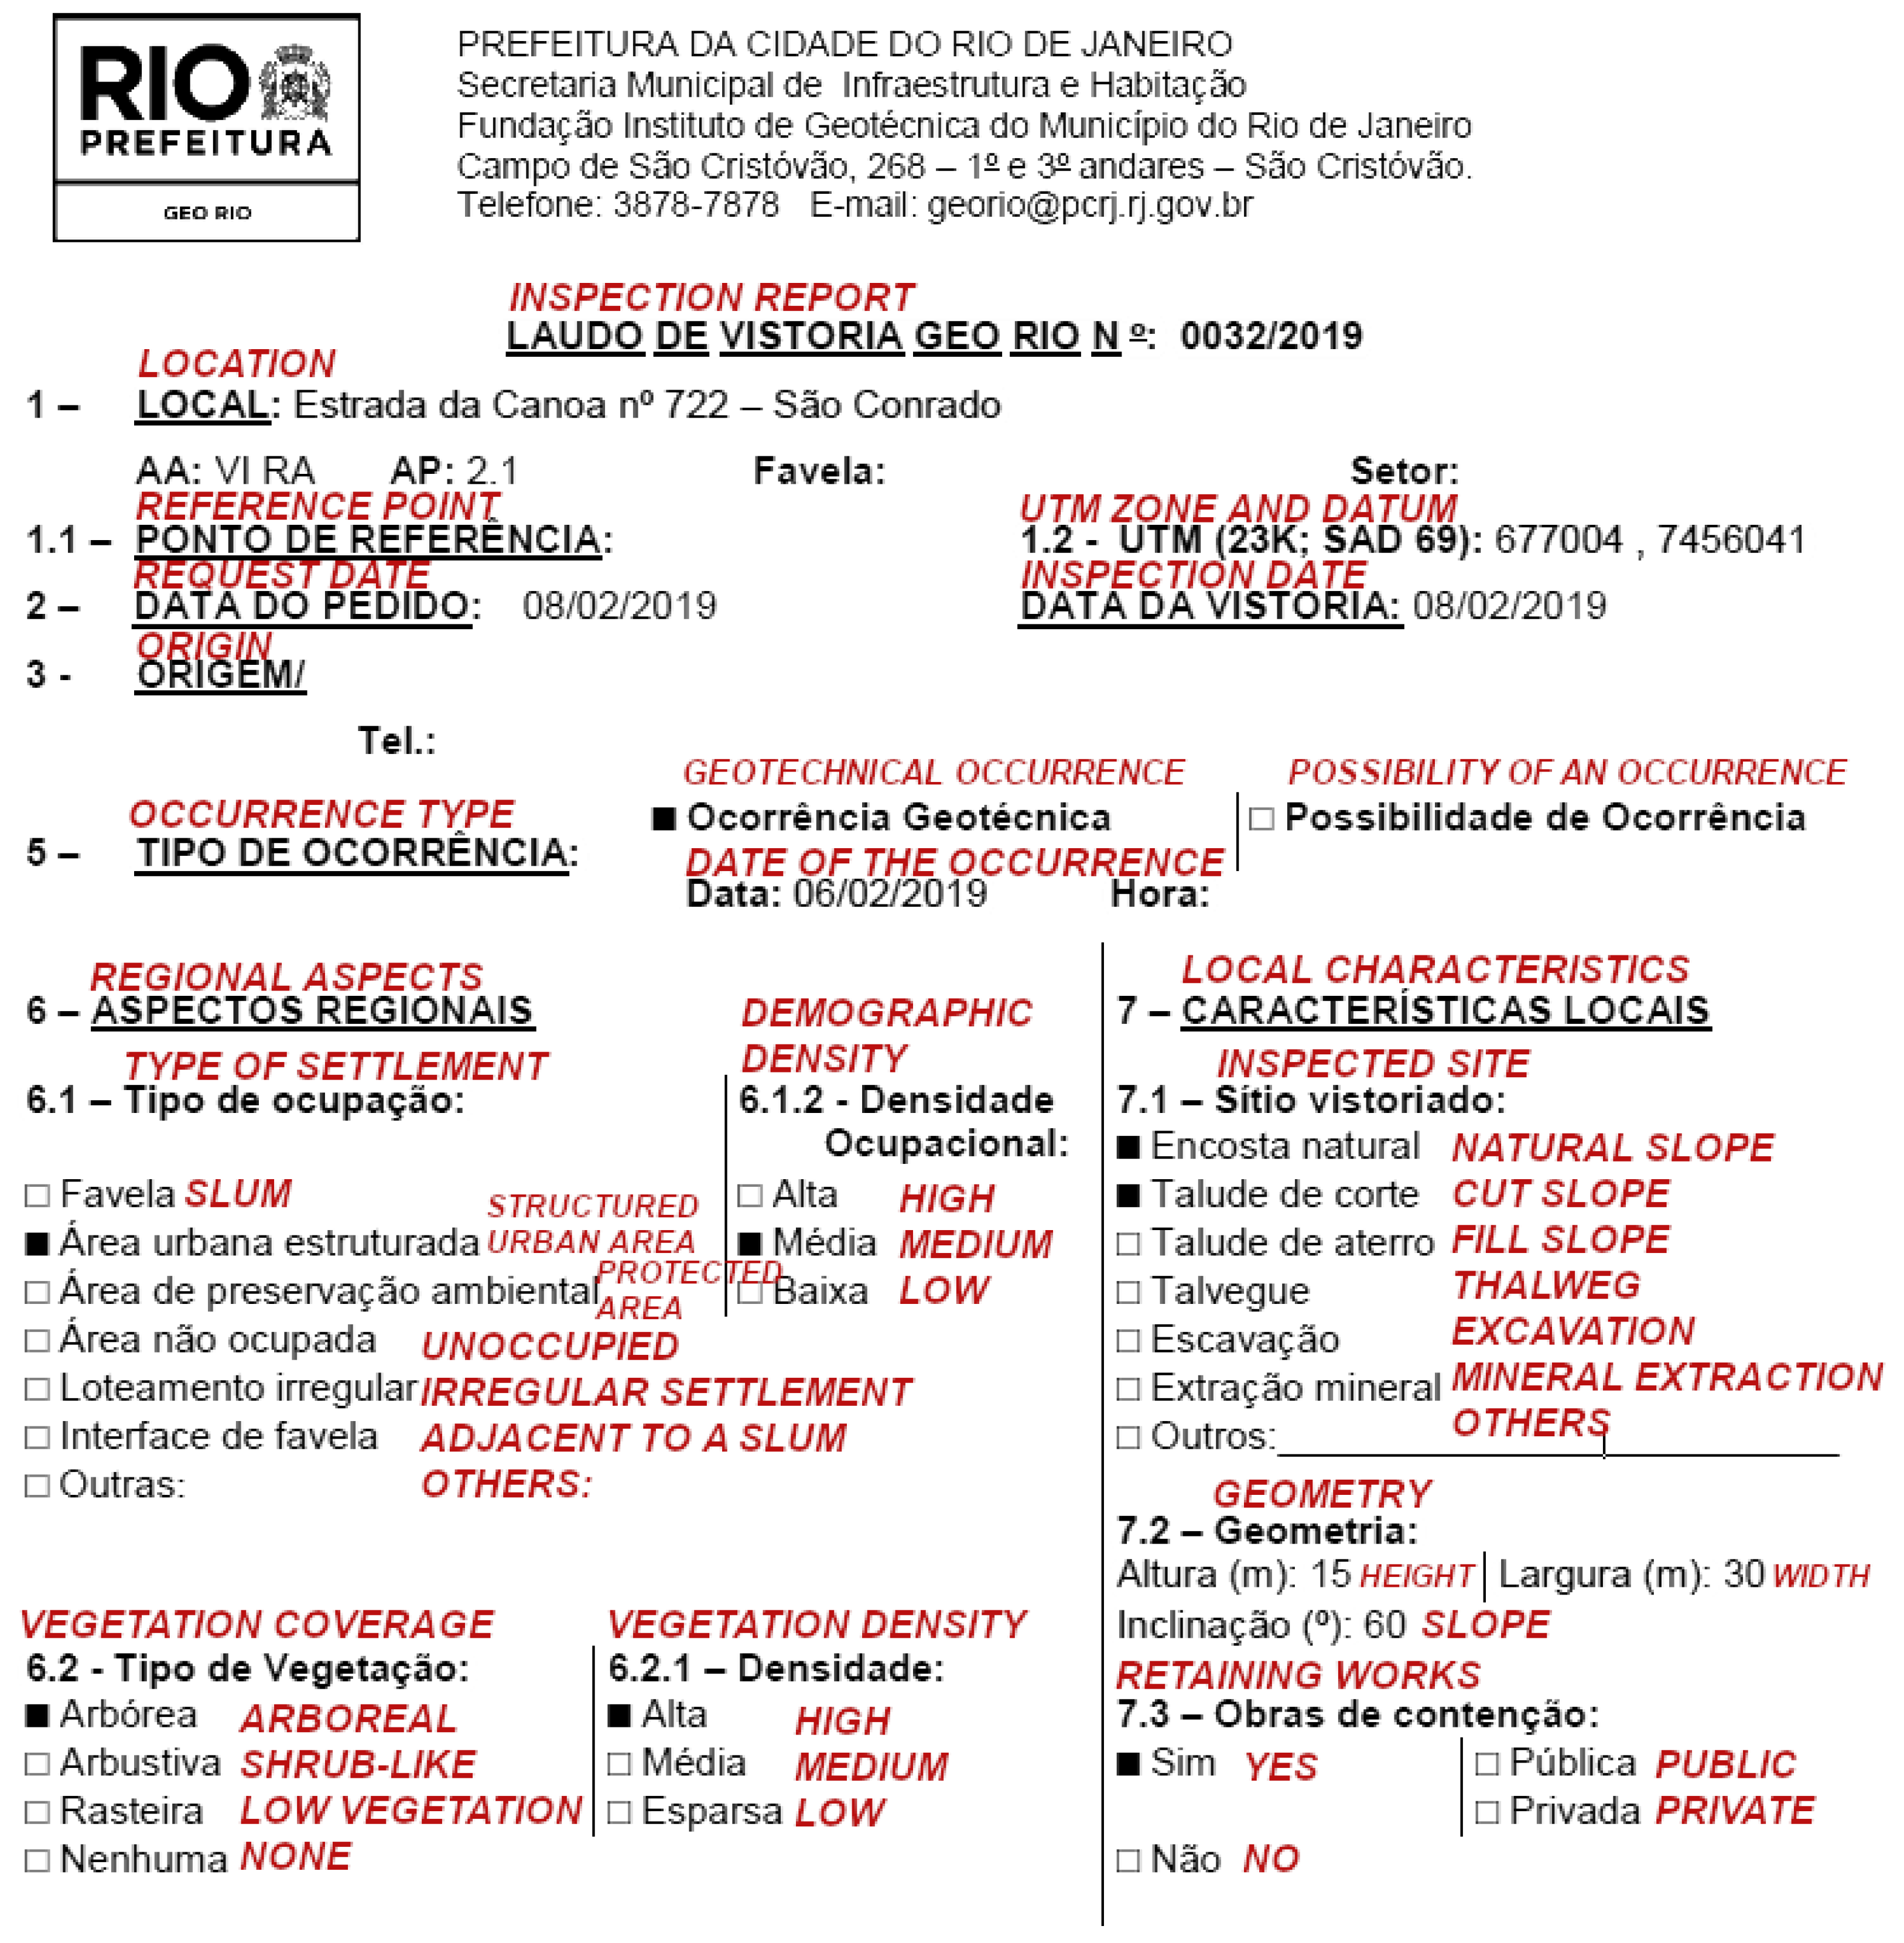
When a geotechnical occurrence happens, GeoRio is contacted by Civil Defense, which may be notified by a local resident or act proactively depending on the severity of the case. GeoRio then sends a technician, usually a geologist or civil engineer, to assess the situation onsite. This professional performs a detailed analysis and records the information in a specific form (Figure 5), containing the main fields, such as location, reference point, UTM coordinates, type of occurrence, etc.
Although the inspection reports were digitized, full access was restricted by Brazil’s General Data Protection Law (in Portuguese, LGPD), requiring the manual removal of confidential information. Files were accessed in person at GeoRio, and only well-documented geotechnical occurrences related to mass movements were included. Non-geocoded reports were excluded, ensuring the database contains only verified events assessed in situ by a geologist or civil engineer. Reports include fields detailing each landslide occurrence, such as date and time, location (coordinates or address), type of mass movement, geomorphological context, weather conditions, and affected infrastructure (e.g., homes or roads).
A total of 1663 landslide occurrences recorded between 2010 and 2016 were initially compiled into a structured database, considering only shallow landslides (based on the [39,41] definition) as defined in the Geo-Rio inventory. Temporal data in day granularity were present for 701 cases, while 962 records lacked such information.
It is worth mentioning that a larger number of landslide occurrences were recorded in 2010, a year affected by severe rainfall events. This may partially explain the higher count of reported occurrences between 2010 and 2016 compared to the following two years. As more data became available, 189 additional reports from 2017–2018 were retrieved. Though not used for training, they were reserved for later evaluation.

3.1.3. Digital Terrain Models Obtained Through LASER Scanning

The Digital Elevation Model (DEM) is obtained via an active sensor attached to an aircraft, which emits LASER pulses (Light Amplification by Stimulated Emission of Radiation). These pulses strike the ground and return to the sensor in a technique known as Laser Scanning. Based on the speed of light, the time taken for the pulse to travel back and forth, and the aircraft’s altitude, the elevation of each point captured by the sensor can be calculated by multiplying the elapsed time by the speed and knowing the sensor’s inclination angle at the time of the pulse emission [78].
The data for the Digital Elevation Models, with an original resolution of 8 points per m2, were provided by the Instituto Pereira Passos, which is responsible for the cartography of the city of Rio de Janeiro. The dataset corresponds to a survey conducted in 2019 [79].
According to ASPRS [80], when analyzing a DEM in LAS format, each captured point is classified into categories such as “ground,” “building,” “low vegetation,” “medium vegetation,” “high vegetation,” “noise,” among others. The sensor captures all visible information during the flight; therefore, to generate a Digital Terrain Model (DTM), only the points classified as “ground” need to be selected. Additionally, the sensor has direct orientation via GNSS and an integrated IMU (Inertial Measurement Unit), enabling precise coordinates of each perspective center and altitude [78,81].
For this work, only the DTM, containing exclusively ground information and excluding elements above the surface, was used. This model was resampled to a spatial resolution of 5 m for the following reasons:
  • Although the point cloud acquisition resolution is very dense, after removing points related to reflections from vegetation and buildings, many slope areas were interpolated at the sub-meter level, making it unsuitable to use a DTM resolution smaller than 1 m.
  • Landslide occurrences (explained in more detail in the following section) were geolocated using expedited Global Navigation Satellite System (GNSS) devices (e.g., handheld receivers and cell phones), which, at best, achieve an accuracy no better than 5 m.
  • High-density models result in excessive computational processing. Since better resolutions would exaggerate interpolations and not necessarily improve the accuracy of occurrence points, a resolution of 5 m per cell was deemed adequate.
Thus, a DTM, in grid format, was generated and converted to raster, as better explained in Section 3.2.2.

3.2. Methods

3.2.1. Geolocation of Occurrences

To convert the table into a point feature class with each occurrence georeferenced, it was first necessary to design a database capable of receiving this information. All fields from the original table were recreated, with appropriate data types defined (text, double, date, among others).
Each occurrence had its geographical coordinates extracted from the respective technical reports using the ‘XY Table to Point’ [82] tool available in ArcGIS Pro. Coordinates originally obtained in the SAD69 reference system, an old geodetic standard in Brazil, were converted to SIRGAS2000. Also, some inventories in favelas had informal street names, which had to be located using the Pereira Passos Institute’s geocoding tool.
Coordinates were collected using portable GNSS devices, such as cell phones, which have a minimum error of about 5 m under ideal conditions [83,84].

3.2.2. Conversion of the Digital Terrain Model to Raster

The Digital Terrain Model (DTM), obtained from the Instituto Pereira Passos, was in LAS format, designed for vector representation of point clouds, originating from persistent data in files collected by the sensor. However, the point cloud of the DTM exhibited several areas with low point density, caused by surfaces obstructing the sensor’s line of sight to the ground, preventing the acquisition of complete terrain information. This low density is not found in the Digital Surface Model (DSM), which captures features above the ground. To ensure that the entire study area contained consistent elevation data, interpolation between the available DTM points was necessary.
Using the “LAS Dataset to Raster” [85] tool from ArcGIS Pro, it was possible to convert from vector representation (in LAS format) to raster representation (as TIF), filling the gaps in point density. The application of this tool was performed with the parameters shown in Table 1. Since the model was interpolated in various areas and considering the accuracy of the GNSS technology used for locating the occurrence points, the final raster was interpolated to a spatial resolution of 5 m × 5 m. This resolution allows geospatial data processing algorithms to work with similar error margins for the different input data.

3.2.3. Comparative Analysis of Occurrences with the Reference Susceptibility Map

The comparison between the collected occurrences and the Reference Map was performed in a GIS by overlaying both layers. The georeferenced points showed most events occurred on slopes, often in slum areas. The Reference Map was then converted from raster to vector (polygon) format using ArcGIS’s ‘Raster to Polygon’ tool [86]. Based on color intensity, three susceptibility classes (high, medium, low) were defined. Polygon simplification was disabled to preserve class boundaries, and multipart features were enabled to keep each class as a single feature. Point counts per class were calculated using the Spatial Join tool [87].

3.2.4. Exploring GAM-Based Data-Driven Models

As part of this study, the use of data-driven models is explored. The predictive model developed for this study is based on the application of Generalized Additive Models (GAMs), a mix of generalized linear models with additive models, which is particularly effective in capturing non-linear relationships and complex interactions between variables [88]. Unlike traditional neural networks, GAMs are models that facilitate interpretability, allowing visualization of the individual effects of each predictor variable [89].
The general form of a GAM is given by:
g ( E ( Y ) ) = β 0 + f 1 ( X 1 ) + f 2 ( X 2 ) + + f p ( X p ) ,
where f 1 + f 2 + + f p are smooth functions that model the relationship between each predictor variable X i and the response Y, the scalar β 0 is the intercept term, and g ( E ( Y ) ) is a link function, which maps the mean of the response variable Y to the prediction space. To avoid the over-fitting characteristic of other flexible models, the functions f i ( X i ) are typically represented using smoothing splines or other basis functions.
A low-complexity model was adopted to ensure interpretability and methodological transparency. Slope and elevation (DTM) were chosen as predictors due to their established relevance in landslide susceptibility research [42,48,49,90,91], reflecting key geomorphological controls on terrain stability. Slope was modeled using splines (k = 2), yielding two coefficients, while elevation was treated linearly. Including the intercept, the model comprises approximately four parameters. This study explores the potential of Generalized Additive Models (GAMs), a flexible and efficient tool for capturing complex non-linear relationships [92,93].
To implement this model, R 4.5.1 software tools were used for: raster data processing; statistical modeling; tabular data manipulation; and visualization. Statistical modeling was carried out using the ‘gam’ function from the ‘mgcv’ package, which enabled the GAM model to be built. Tabular data manipulation, such as grouping and sampling, was carried out using ‘dplyr’. To visualize the results, the ‘ggplot2’ and ‘gridExtra’ modules were used to create graphs and organize the visualizations. The susceptibility classification was performed using three quantiles—Low, Moderate, and High—to ensure clarity and comparability. These classes, defined by percentile thresholds, allow direct comparison with the Reference Map, which uses a similar categorical scheme.

3.2.5. Filtering out Trivial Terrain and Noise Reduction

In this study, areas with slopes below 5 degrees were excluded to remove “trivial terrains” [94], which are homogeneous zones with minimal topographic variation and low landslide likelihood. These areas add little statistical value and can obscure patterns linked to meaningful geomorphological variation. To address this, focal statistics [95] using a 100-m (20-cell) filter was applied to smooth local variations and emphasize broader topographic features like slopes, convexities, and concavities.

3.2.6. Inspection of Modeling Results

The Experimental Data-Driven Map was evaluated using two sets of georeferenced landslide occurrences. The first, from 2010–2016, was used to train the model and served as a baseline for assessing how well the map captured known patterns and conditions. The second dataset, from 2017–2018, became available after model training and was used to independently access benchmark the model’s predictive capacity on previously unseen data. This comparison allowed for an assessment of both the model’s internal consistency and its generalization to unknown events. To assess predictive performance and generalization, we conducted internal validation using both random (RCV) and spatial (SCV) cross-validation schemes [89], each implemented with 10 folds and 10 repetitions, followed by an external validation using a distinct landslide inventory (2017–2018) applied directly—without model retraining.

4. Results

4.1. Exploratory Data Analysis

The exploratory analysis of the topographic predictors—slope and elevation—provides initial insights into their relationship with landslide occurrence across the study area (Figure 6). Panels A and D represent the slope and elevation distributions for all pixels in the study area, whereas Panels B and E refer exclusively to the distribution of the training samples. These are therefore distinct datasets, and apparent similarities do not indicate duplication but rather allow comparison between overall terrain characteristics and the conditions where landslides have been recorded. The pixel-based distributions (Panels A and D) indicate that most of the terrain is characterized by low to moderate slopes (below 25°) and low elevations (generally below 200 m). However, the training sample distributions (Panels B and E) reveal that landslide occurrences are more concentrated in areas with intermediate slopes (15–35°) and moderate elevation ranges (up to approximately 400 m). Panels C and F show the spatial distribution of slope and elevation over the terrain.
Taken together, these visualizations and summary statistics support the relevance of topographic variables and reveal possible biases in the reported inventory, particularly underrepresenting steep and less accessible regions [58]. Landslides are more frequently reported in accessible or inhabited areas, while high-altitude zones—many of which overlap with protected areas such as national parks—are generally uninhabited, resulting in a spatial bias that underrepresents events in these remote or densely vegetated regions.

4.2. Model Evaluation

The performance and generalization capacity of the landslide susceptibility model were assessed through internal and external validation procedures. For internal validation, we used data from landslide events recorded between 2011 and 2016. A Generalized Additive Model (GAM) was trained using two resampling strategies: random cross-validation and spatial cross-validation. In both cases, a 10-fold structure was repeated 10 times to ensure robustness. The random approach split the data randomly into training and testing subsets, while the spatial approach employed k-means clustering on coordinate data to define spatially independent folds. The resulting median AUROC values were 0.769 for the random method and 0.736 for the spatial one, confirming the conservative nature of spatial validation due to reduced spatial autocorrelation. To evaluate temporal and spatial generalization, the model trained on the 2011–2016 data was directly applied to an independent landslide inventory collected between 2017 and 2018, without retraining. The external validation yielded a higher AUROC of 0.847. Table 2 presents all such results.

4.3. Spatial Analysis of Occurrences on the Reference Map

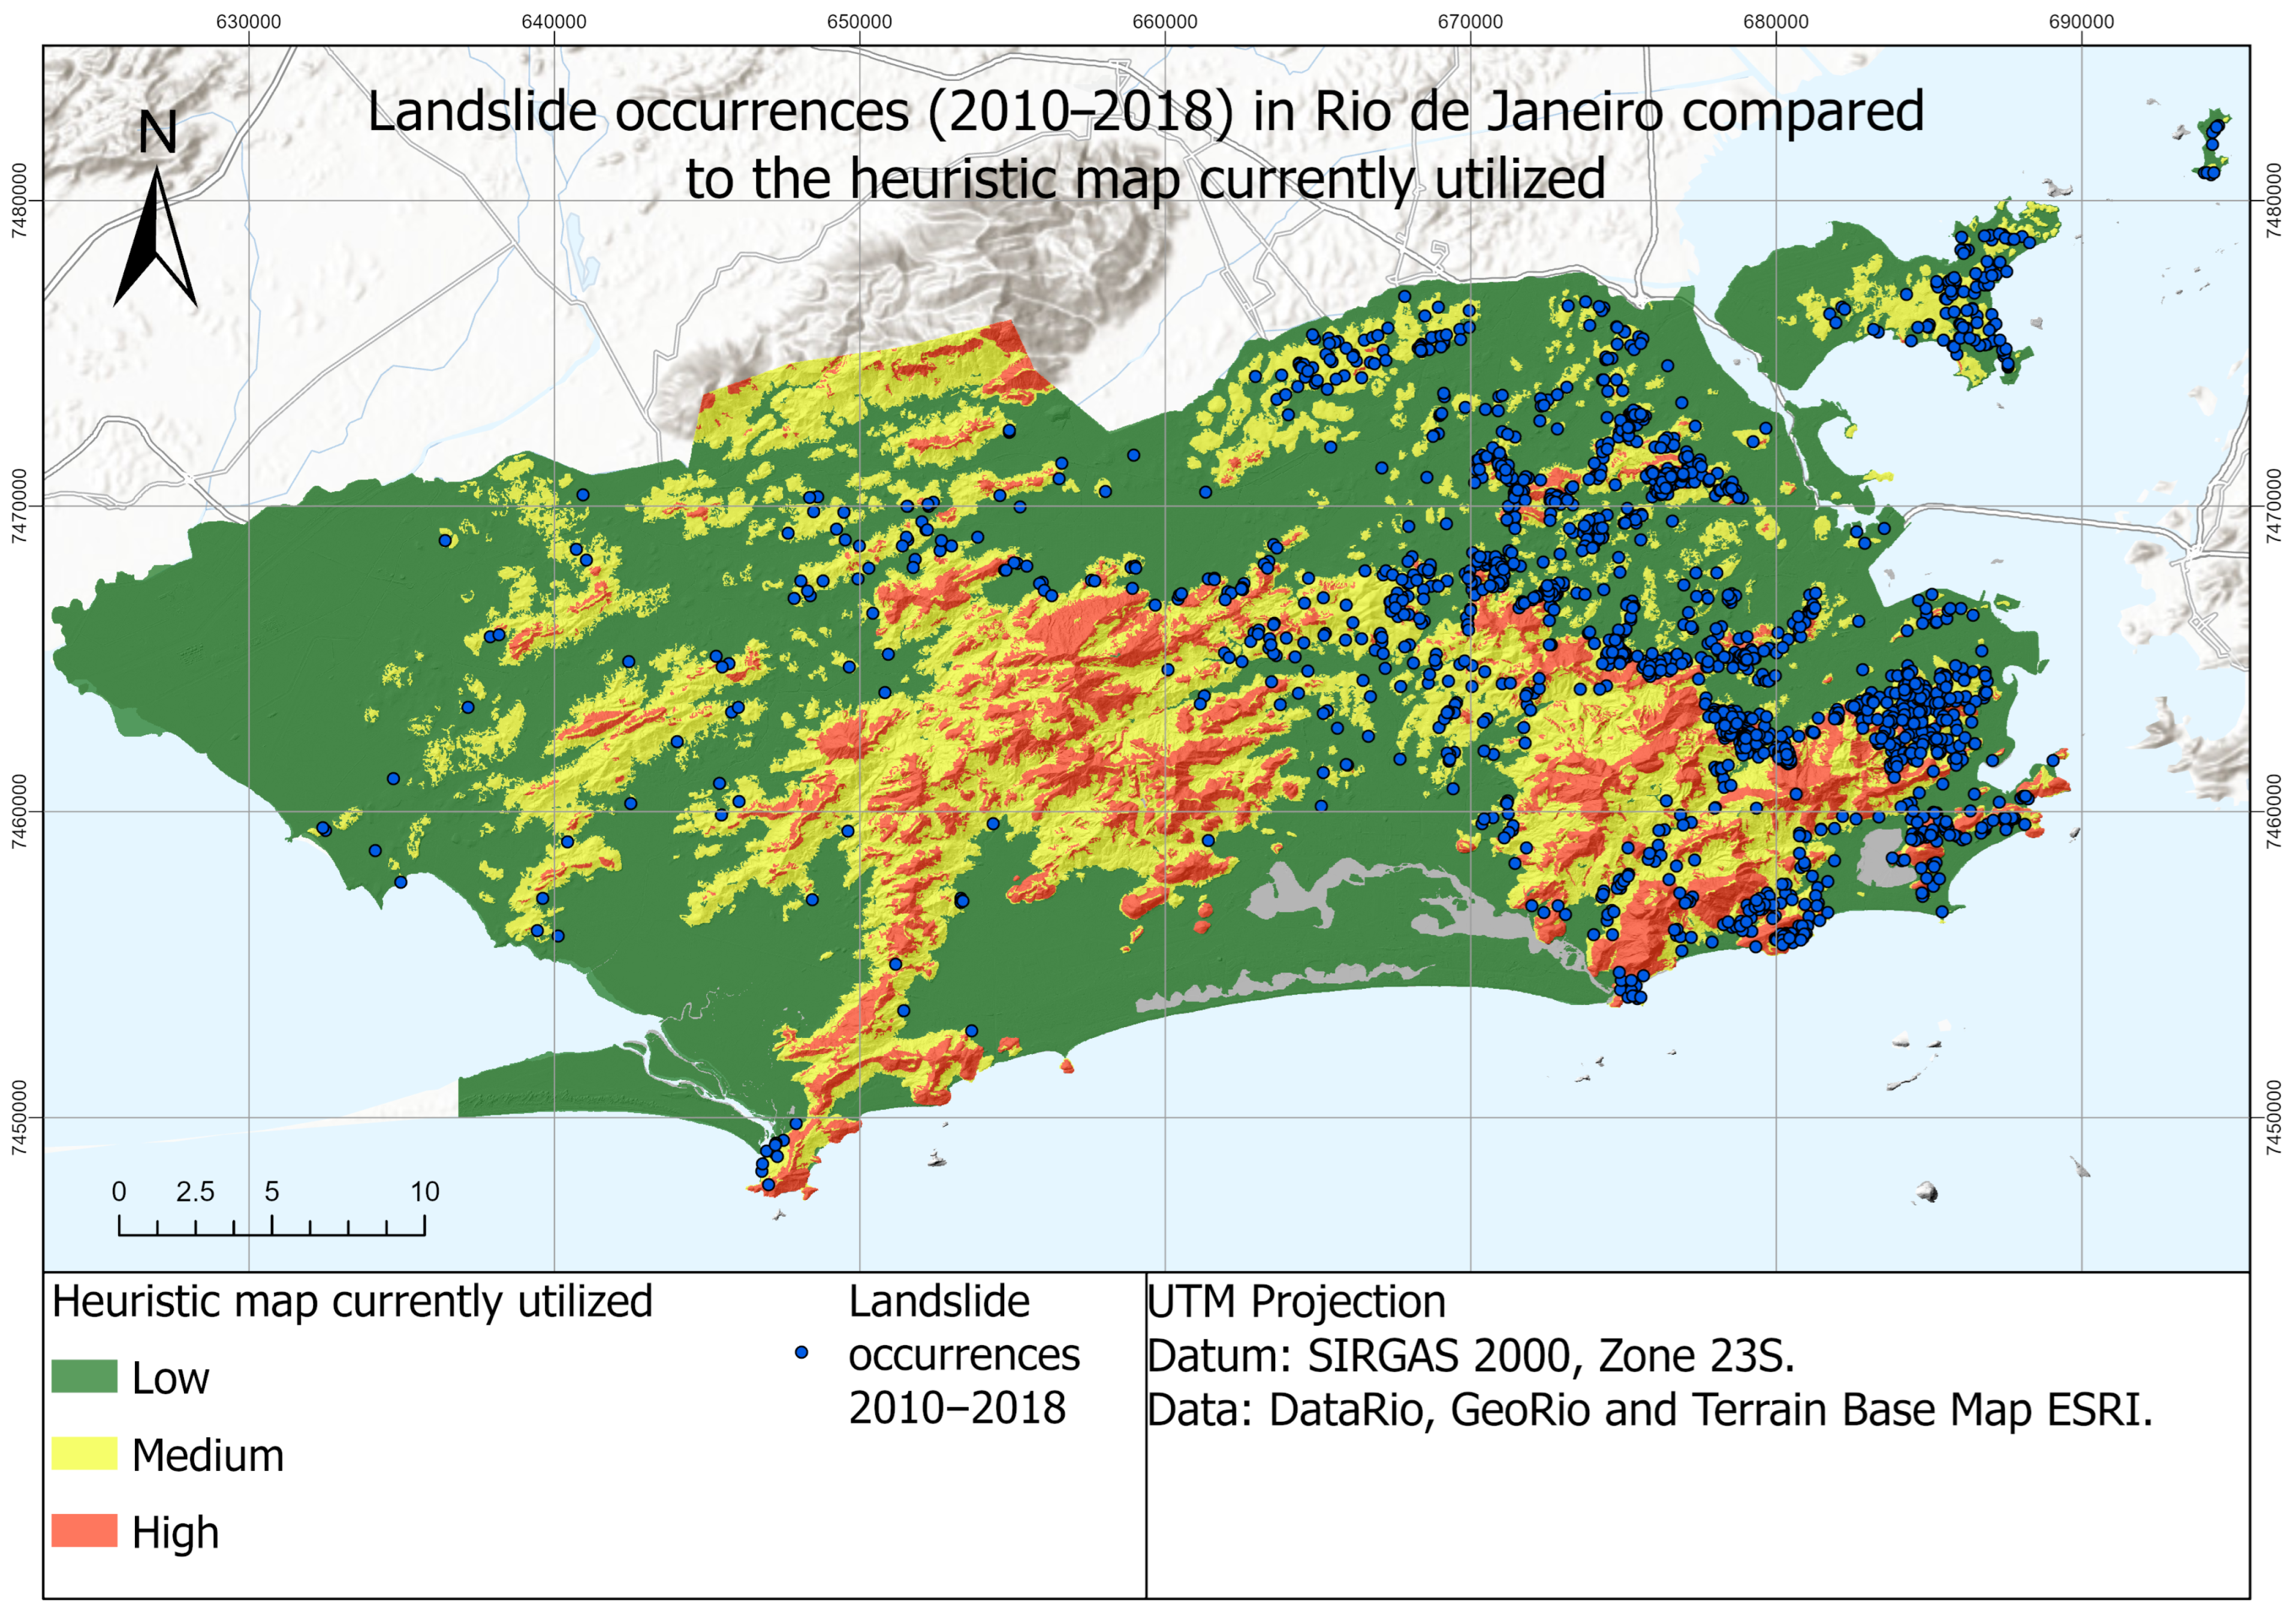
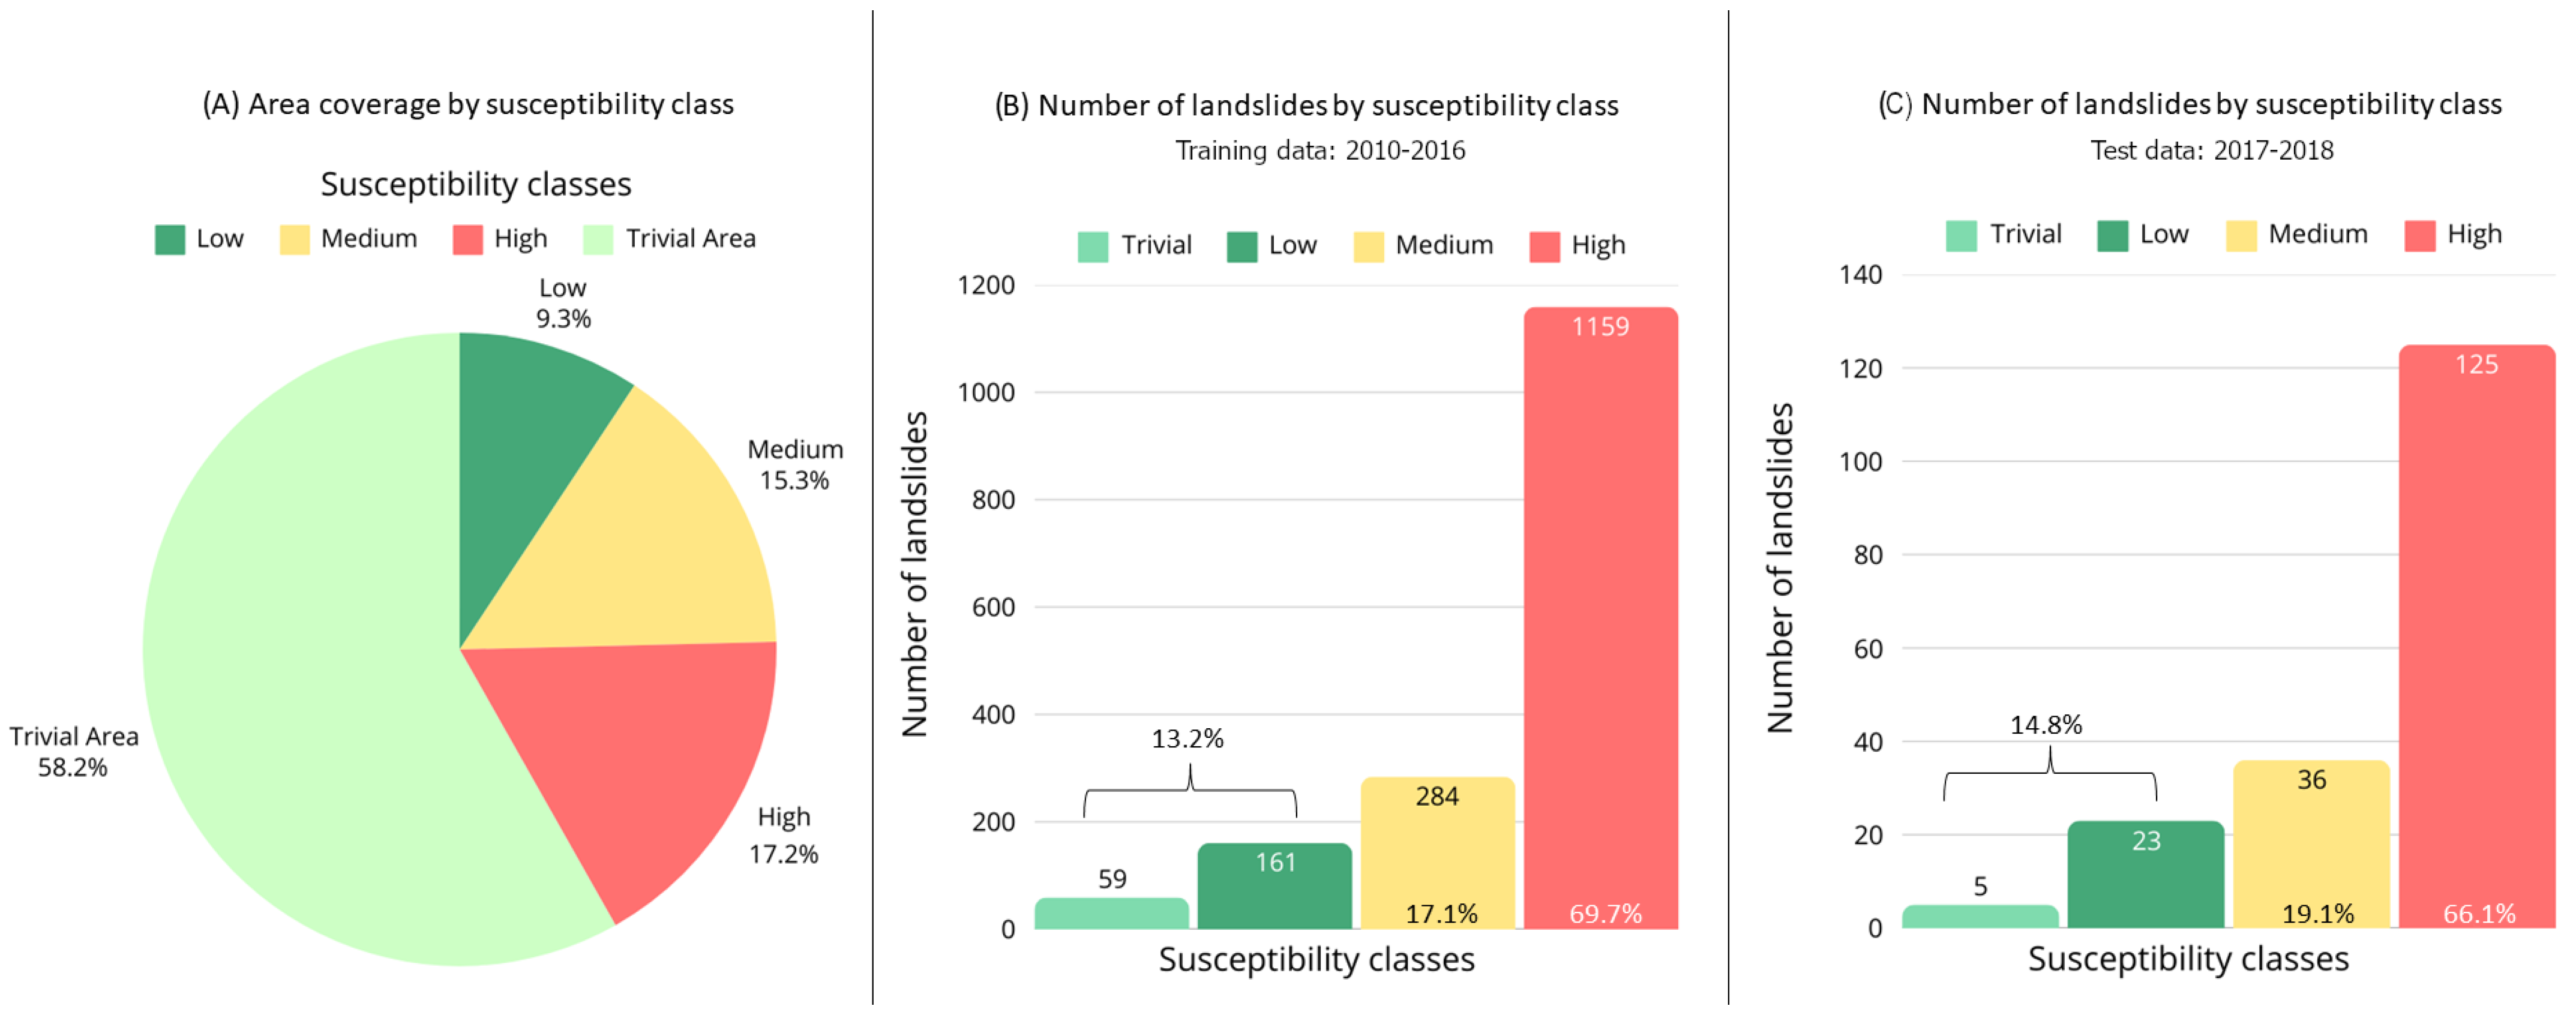
The percentage of the city’s area covered by each susceptibility class is shown in Figure 7A. Analysis of the landslide inventory revealed that 242 events (14.9%) occurred in low-susceptibility zones, 878 (54.3%) in medium-susceptibility areas, and 540 (30.8%) in high-susceptibility zones. As illustrated in Figure 7B, over two-thirds (69.2%) of the mapped landslides occurred in areas classified as low or medium susceptibility, while fewer events were located in areas designated as high susceptibility.
Similarly, the map was evaluated against the 189 landslide occurrences reported in 2017 and 2018. Figure 7C summarizes these findings. Of these occurrences, 23 landslides (12.2%) were located in areas of low susceptibility, 105 landslides (55.5%) in areas of medium susceptibility, and 61 landslides (32.3%) in areas of high susceptibility. These results demonstrate a strong consistency with the data from the earlier period (2010–2016). Notably, more than half (67.7%) of the landslides in this subset also occurred in areas classified as having low or medium susceptibility. This striking similarity in the percentage distribution across both datasets further underscores the reliability of the observed patterns and highlights the potential limitations of the reference susceptibility map in accurately capturing landslide-prone areas.
This discrepancy suggests that the reference map could be improved, indicating the need for a methodological revision based on more up-to-date data. This would allow for the development of a refined version of the landslide susceptibility map. A notable characteristic of the inventory is the spatial concentration of landslides and other geotechnical occurrences in areas occupied by vulnerable communities, such as favelas, which cover only 4% of Rio de Janeiro’s territory. Despite their small territorial extent, these areas accounted for 35% of the recorded landslides.
To highlight this disproportion, a new map was created by overlaying the landslide occurrences layer with the susceptibility map layer. The legend shows landslides that occurred in areas of low or medium susceptibility in purple and landslides that occurred in areas of high susceptibility in blue (Figure 8).

4.4. Spatial Analysis of Occurrences on the New, Data-Driven Based Map

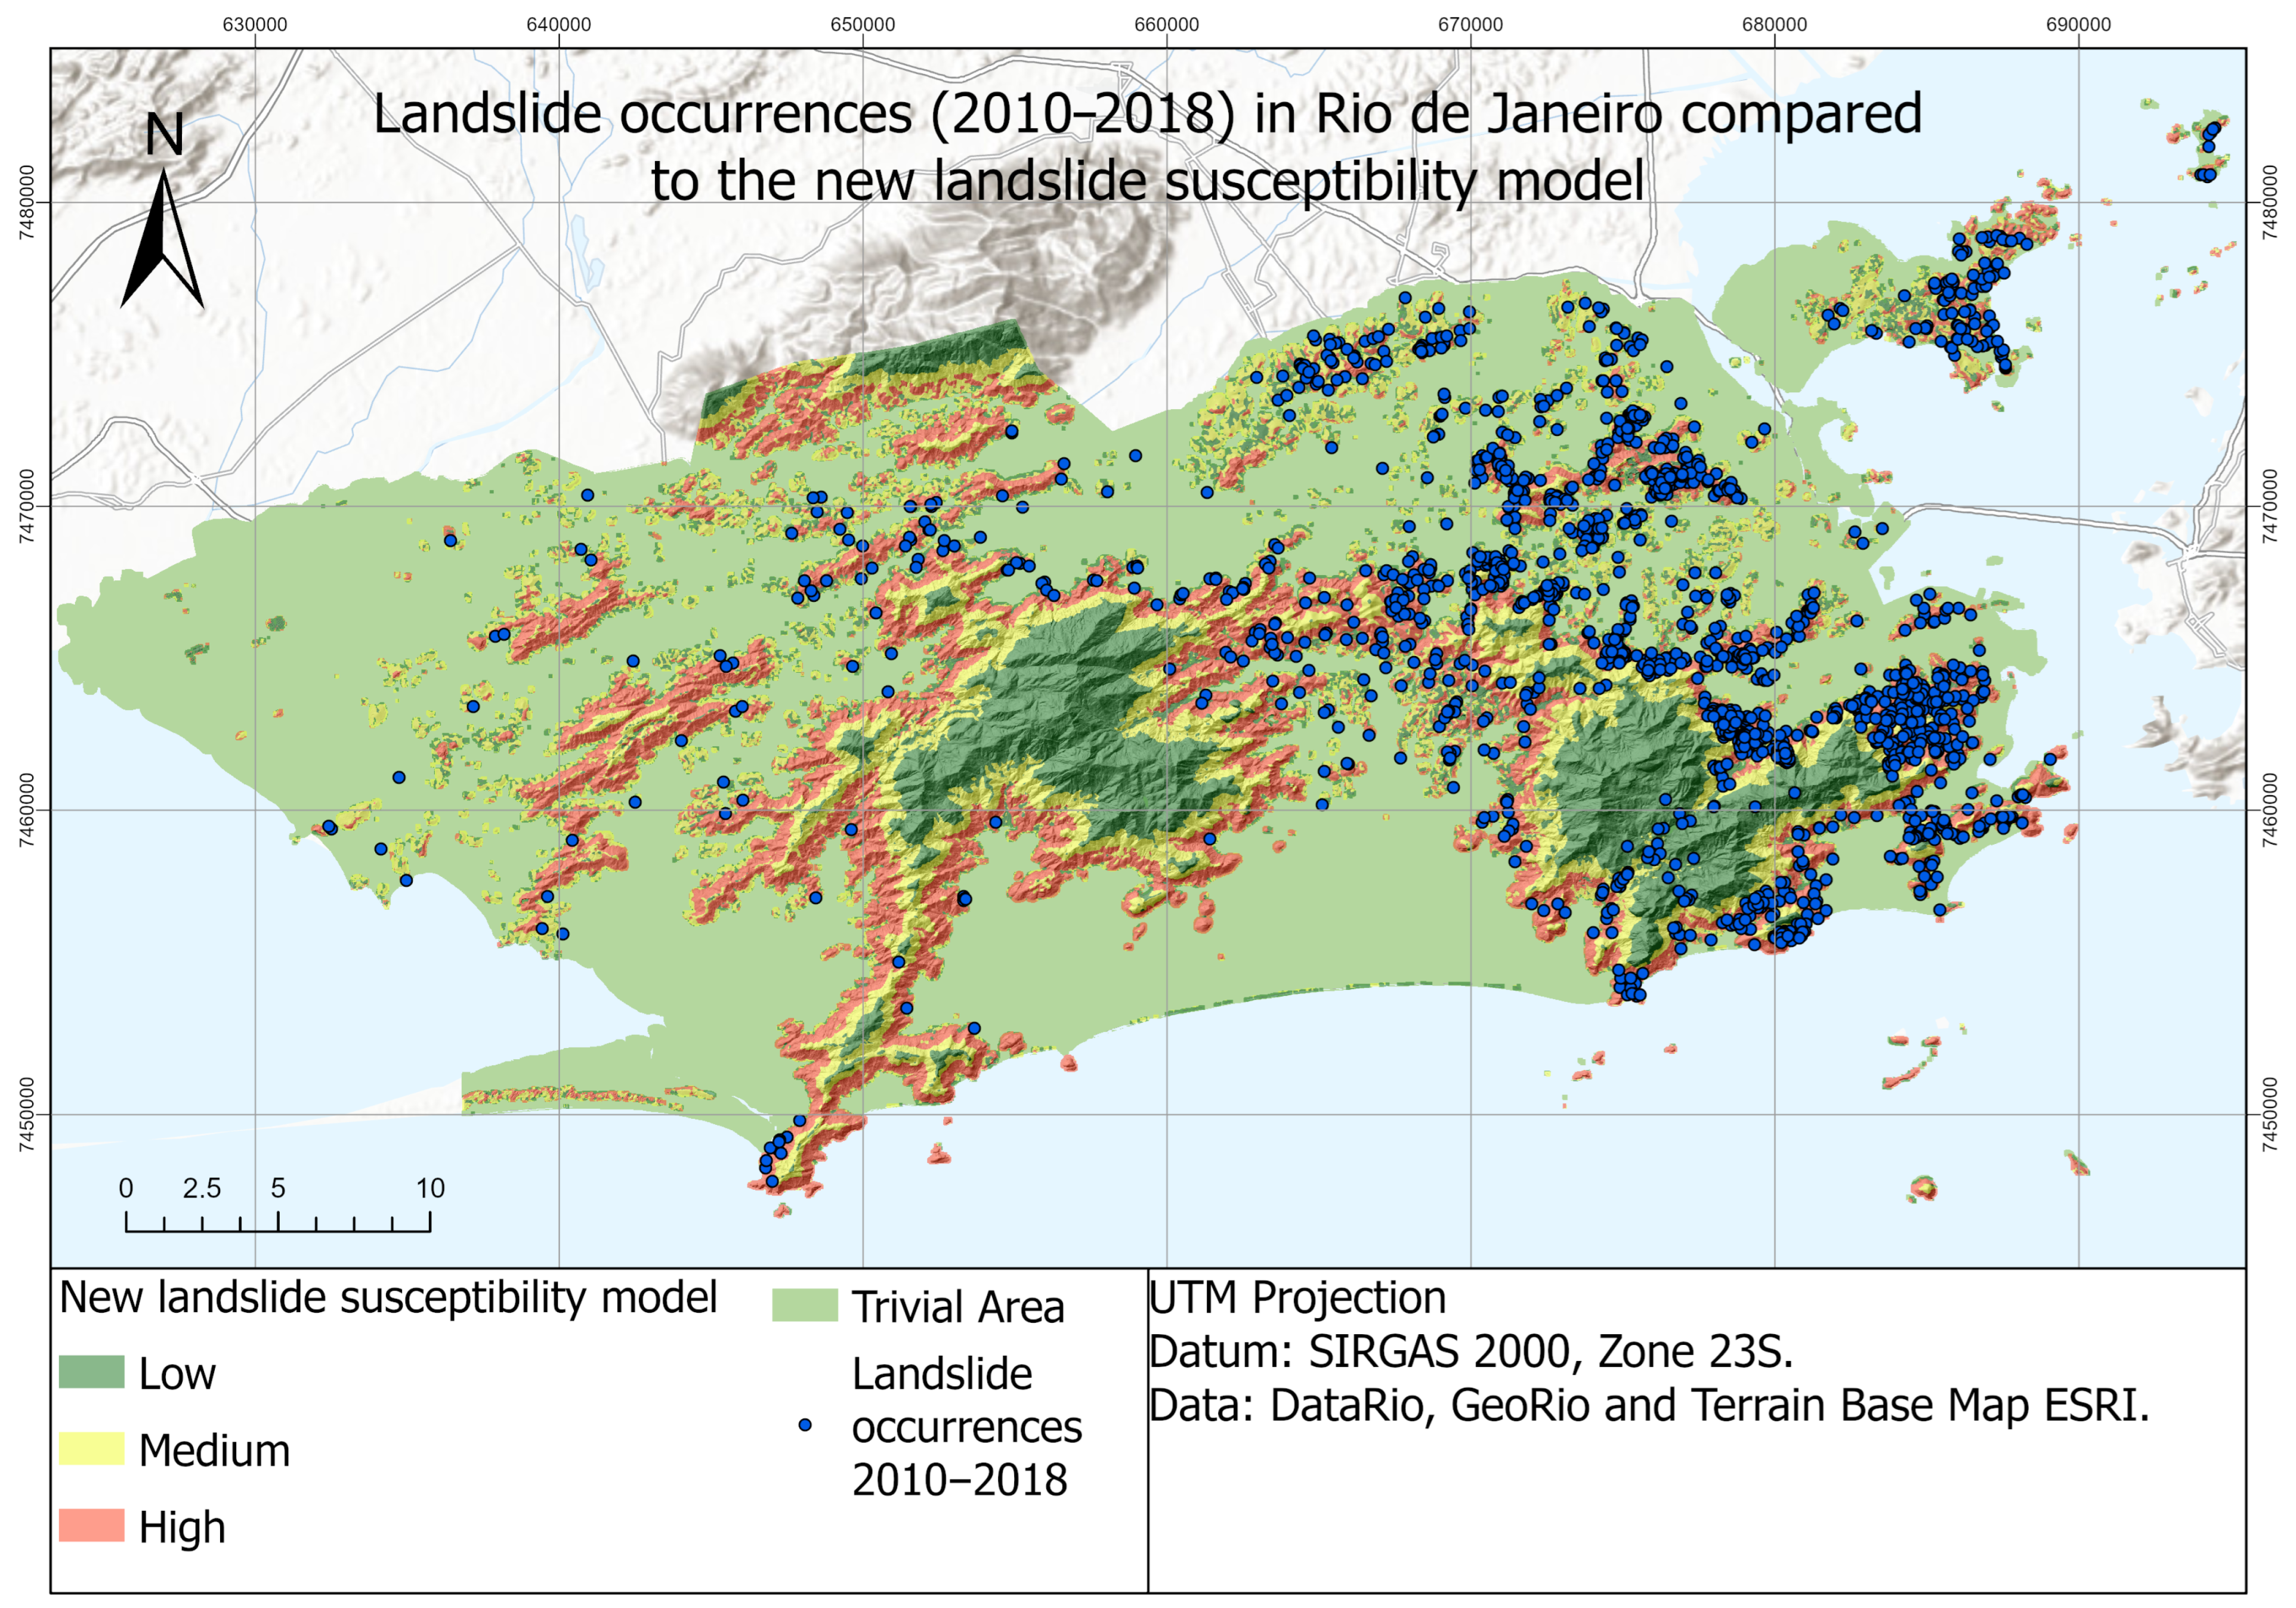
Likewise, a map was created by overlaying the landslide occurrences layer with the Experimental Data-Driven Map (Figure 9).
The susceptibility values were classified into three ranges: Low (0–0.4003), Moderate (0.4004–0.6727), and High (0.6728–1.000). When the 1663 documented landslide occurrences from the period 2010–2016 were overlaid onto the new map (as illustrated in Figure 10B), the analysis revealed that 220 landslides (13.2%) occurred in areas of low susceptibility, 284 landslides (17.1%) in areas of medium susceptibility, and the majority—1159 landslides (69.7%)—were located in areas of high susceptibility. This distribution highlights a strong correlation between landslide occurrences and areas classified as highly susceptible.
However, it is important to note that the same landslide occurrences from 2010–2016 were used to train the model. To evaluate its performance, the 189 occurrences reported in 2017 and 2018 were spatially compared with the new map. As illustrated in Figure 10C, the analysis showed that 28 landslides (14.8%) occurred in areas of low susceptibility (including trivial areas), 36 landslides (19.1%) in areas of medium susceptibility, and the majority—125 landslides (66.1%)—were located in areas of high susceptibility.
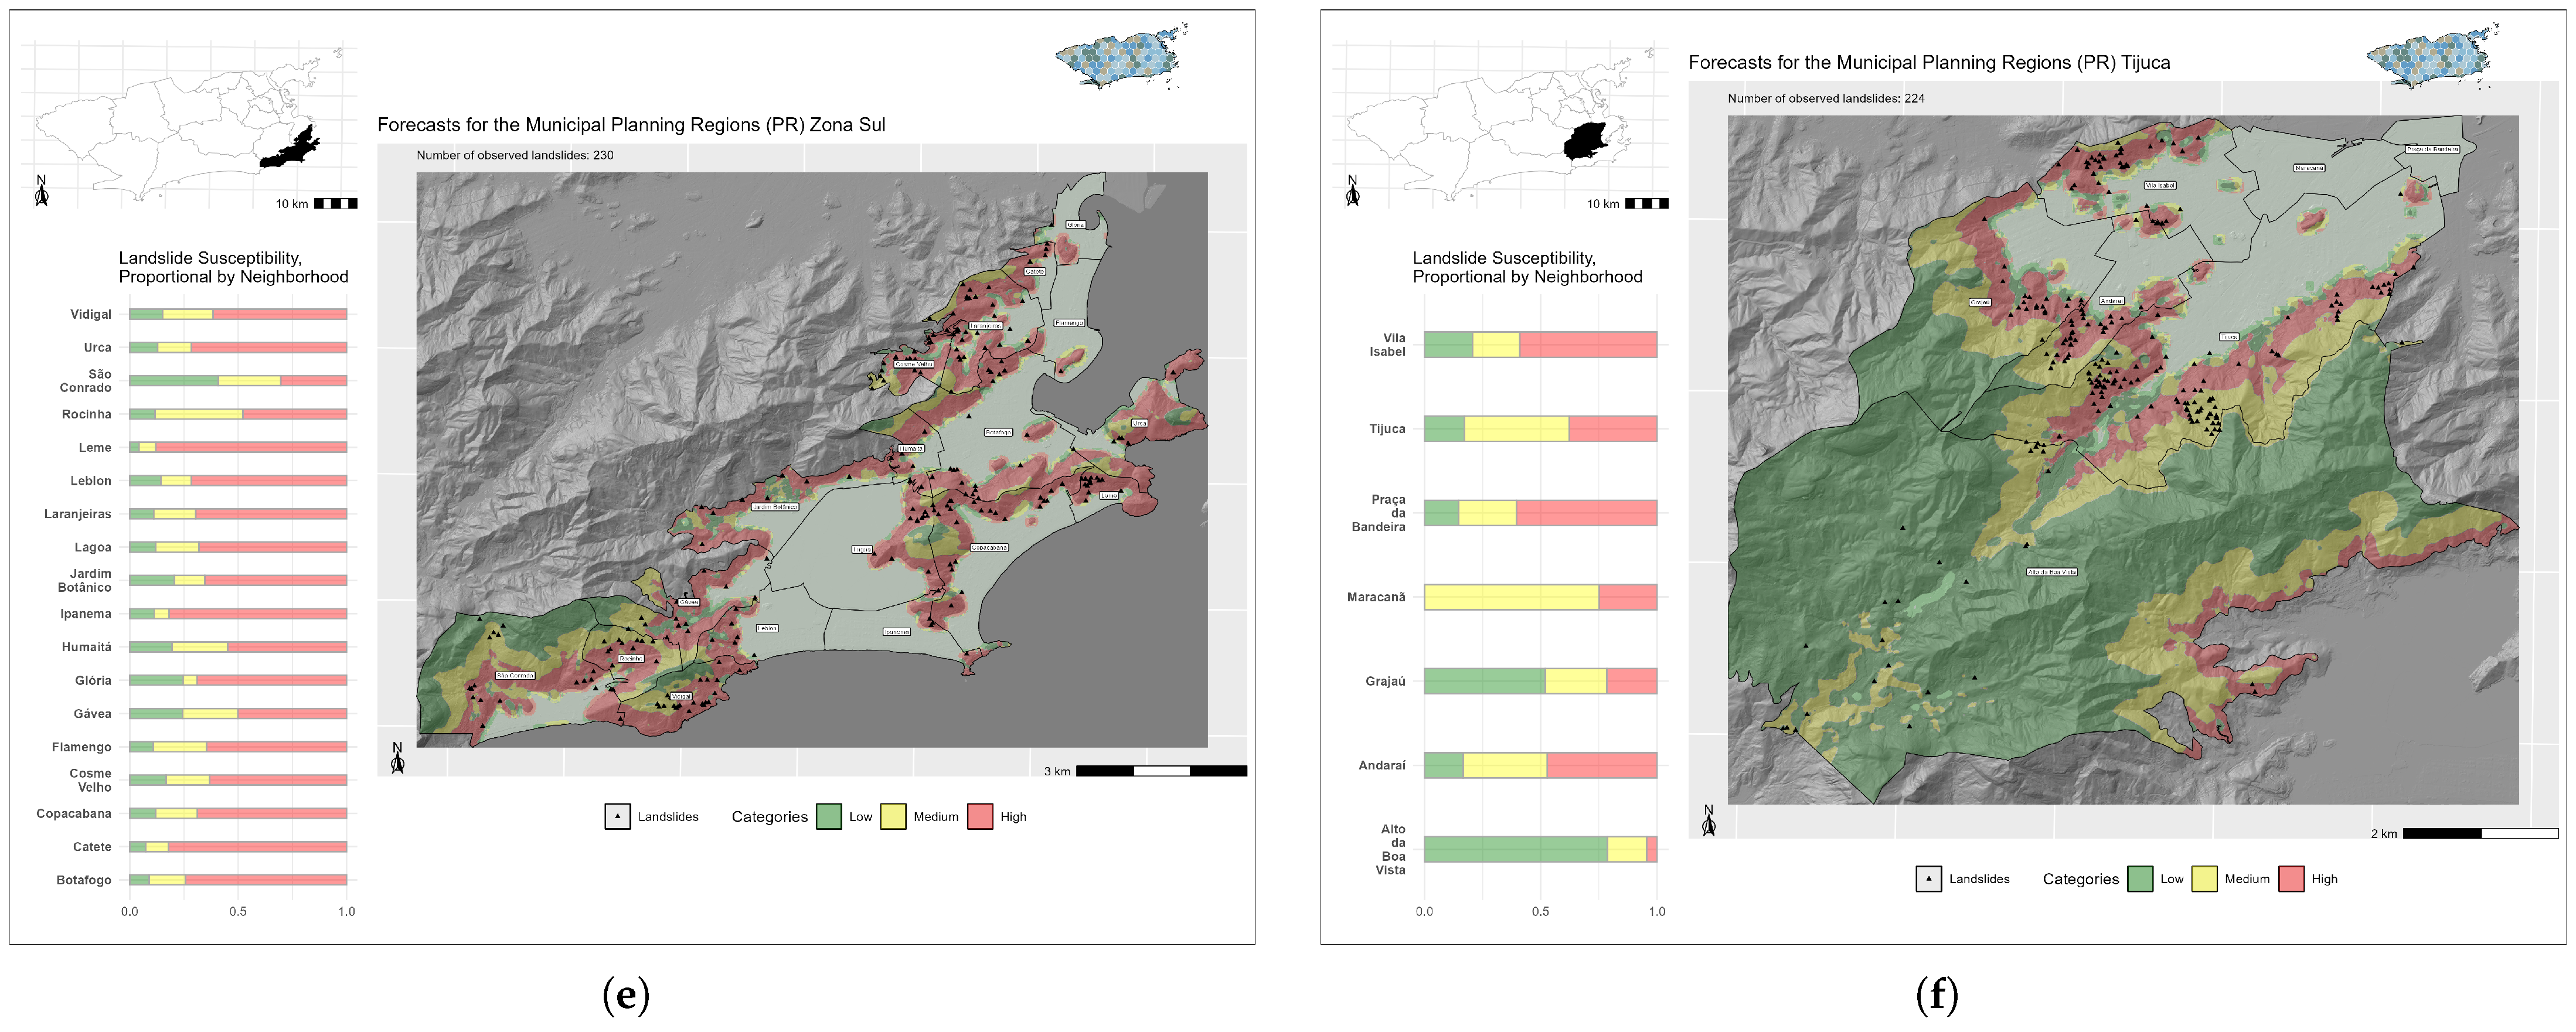
In terms of percentages, these results are remarkably consistent with those obtained from the training data, demonstrating the model’s reliability and robustness. Furthermore, the new map represents a significant improvement over the original heuristic-based model, underscoring the enhanced predictive capability of the updated approach. The new prediction map was subset for each of the seventeen Administrative Planning Regions (APR) within the municipality of Rio de Janeiro, with six representative examples illustrated in Figure 11.

5. Discussion

5.1. Area Coverage Pertaining to Each Class

In terms of the area covered by each susceptibility class, as illustrated in Figure 9 compared to Figure 8, a slight increase is observed in the extent of both low susceptibility classes (including negligible or trivial areas) and high susceptibility classes. The low susceptibility area rose from 59% to 67.5%, while the high susceptibility area increased from 12% to 17.2%. In contrast, the area classified as medium susceptibility decreased by nearly half, from 29% to 15.3%. This shift suggests that the new, data-driven map is more effective at distinguishing areas of low and high susceptibility, resulting in a greater proportion of cells being classified at these extremes.

5.2. Landslide Inventory Occurrences and Their Distribution Across Susceptibility Classes

Regarding the number of landslides in each class, a significant shift was noted. For both the training and the test datasets, there was a marked increase in landslides occurring in high susceptibility areas (more than double—from 30.8% to 69.7% when using the training data (2010–2016) and from 32.3% to 66.1% when using the test data (2017–2018)). This indicates that the new model was more effective in identifying high susceptibility areas where landslides actually occurred. Landslides in low susceptibility areas saw a slight decrease, while those in medium susceptibility areas dropped significantly (Table 3). This reduction reflects a reclassification of areas, with many likely being shifted to the high susceptibility class in the new model.
In the reference map, the combined landslides in low and medium susceptibility areas accounted for a notable two-thirds of all cases, whereas in the new model, they represent only about one-third of all cases. This suggests a more coherent and concentrated redistribution toward high susceptibility areas, which appears to strengthen the reliability of the new model. The new map shows a considerable increase in landslides occurring in high susceptibility areas, making it the class with the highest number of landslides. The new model seems more efficient in correctly identifying high susceptibility areas, reducing the occurrence of landslides classified in low and medium susceptibility zones. This indicates an improvement in the model’s accuracy and utility for landslide prediction, making it more valuable for urban management and planning.

5.3. Assessing the Inventory

A critical assessment of the landslide inventory used in this study is essential, as its inherent limitations and potential biases directly impact the reliability of data-driven susceptibility analyses. The current inventory primarily documents landslides occurring near human settlements. This methodological constraint stems from its reliance on two main data sources: (1) citizen reports to municipal authorities; and (2) documented disasters affecting infrastructure and populated areas. Consequently, the inventory systematically underrepresents landslide susceptbility in natural environments such as forested areas and undeveloped terrain. Future efforts should incorporate landslides occurring in natural environments, either through systematic documentation of historical events or via remote-sensing analysis of landslide scars and geomorphological features. Such comprehensive data collection would provide a more complete representation of slope instability patterns across both anthropogenic and natural landscapes.

5.4. Potentials and Limitations of Rio de Janeiro’s Landslide Information for Modeling

The model, based on the chosen methodology, yielded generally positive results but revealed an intrinsic bias in the data used. The concentration of most landslides in areas with lower slopes and elevations reflects a bias influenced by higher population density in these regions, leading to more reported incidents. Such patterns, common in inventories based on reported records, as highlighted by studies in the field [96], can be mitigated by approaches that neutralize this effect, as suggested in other research [58,97].
This bias is further illustrated by the absence of training observations in higher-altitude areas (Figure 12), which leads the model to underpredict susceptibility in these zones despite their geomorphic predisposition to landslides. For example, in the Alto da Boa Vista region, many steep, forested slopes remain classified as low susceptibility simply because no landslides were recorded there during the inventory period. As a result, the model reproduces the spatial patterns of the training data. Strategies to mitigate data biases, as proposed by [97], offer a promising path toward producing more robust and geomorphologically plausible maps.
This study established a proof-of-concept for simplified modeling under data and computational constraints—a key need in resource-limited regions—while empirically testing the current susceptibility map (Reference Map). A foreseen key development will be spatio-temporal integration via the RioSLIDE project, building on established frameworks [13,14,15] to balance accessibility with advanced dynamic modeling. The approach leverages a comprehensive landslide inventory with temporal data and over two decades of 15-min rainfall records (https://www.sistema-alerta-rio.com.br/download/dados-pluviometricos/, accessed on 17 December 2024), enabling future spatio-temporal modeling.

6. Conclusions

Using the landslide inventory obtained from GeoRio, this study conducted an initial assessment of the current (reference) susceptibility map by comparing it with recorded landslide locations. It also tested the inclusion of landslide data as a variable to improve map accuracy. Incorporating landslides into a data-driven process applies statistical methods to transform occurrences into interpretable predictors, showing the potential to increase objectivity and reproducibility even at this early stage. By comparing both maps, a clear shift in landslide distribution across susceptibility classes was observed. The current (reference) map classified about one-third of landslides as high susceptibility, whereas the simple model raised this to roughly two-thirds, with consistent results for training and test data. These findings suggest that even a basic data-driven approach may better capture areas of higher landslide incidence, though further analysis is needed to confirm this pattern across other datasets and conditions.
The results of the tested model point to potential directions for future improvement, including: (a) the development of more precise models; and (b) the need to address limitations such as data bias. While the current approach is basic, it suggests that more robust methods and refined methodologies could, in time, support the creation of more reliable predictive maps—ones that better reflect both reported records and broader patterns of landslide occurrence. However, even though the overall results were encouraging, a more detailed examination of specific regions highlights limitations in the model.
Given the recent rise in landslides in urban areas—linked to factors such as climate change, global warming, unregulated slope occupation, and deforestation—it is increasingly important to improve landslide susceptibility maps. While this study presents only a first step, such improvements are essential for refining how susceptible areas are identified and for supporting more effective public policy. More advanced models, integrating historical and dynamic variables, may in the future offer more reliable outputs adapted to the specific conditions of the municipality. These tools could help inform authorities about areas of frequent landslide activity, contributing to more objective planning and more efficient use of public resources.

Author Contributions

Conceptualization, Pedro Henrique Muniz Lima and Luiz Carlos Teixeira Coelho; methodology, Pedro Henrique Muniz Lima and Luiz Carlos Teixeira Coelho; software, Pedro Henrique Muniz Lima, Luiz Carlos Teixeira Coelho and Guilherme Damasceno Raposo; validation, Guilherme Damasceno Raposo, Pedro Henrique Muniz Lima and Raquel Batista Medeiros da Fonseca; formal analysis, Pedro Henrique Muniz Lima, Luiz Carlos Teixeira Coelho, Irving da Silva Badolato, Raquel Batista Medeiros da Fonseca and Sonia Maria Lima Silva; investigation, Guilherme Damasceno Raposo, Pedro Henrique Muniz Lima and Luiz Carlos Teixeira Coelho; resources, Luiz Carlos Teixeira Coelho, Raquel Batista Medeiros da Fonseca, Sonia Maria Lima Silva and Jonatas Goulart Marinho Falcão; data curation, Guilherme Damasceno Raposo, Sonia Maria Lima Silva and Jonatas Goulart Marinho Falcão; writing—original draft preparation, Luiz Carlos Teixeira Coelho; writing—review and editing, Pedro Henrique Muniz Lima, Irving da Silva Badolato, Raquel Batista Medeiros da Fonseca and Sonia Maria Lima Silva; visualization, Guilherme Damasceno Raposo, Pedro Henrique Muniz Lima, Luiz Carlos Teixeira Coelho and Jonatas Goulart Marinho Falcão; supervision, Pedro Henrique Muniz Lima and Luiz Carlos Teixeira Coelho; project administration, Luiz Carlos Teixeira Coelho and Pedro Henrique Muniz Lima; funding acquisition, Luiz Carlos Teixeira Coelho and Pedro Henrique Muniz Lima. All authors have read and agreed to the published version of the manuscript.

Funding

This research was funded by Fundação Carlos Chagas Filho de Amparo à Pesquisa do Estado do Rio de Janeiro (SEI-260003/005823/2024) and Coalition for Disaster Resilient Infrastructure (CDRI; 2401282387).

Institutional Review Board Statement

Not applicable.

Informed Consent Statement

Not applicable.

Data Availability Statement

The data presented in this study are available on request. Please contact the corresponding author.

Acknowledgments

The authors thank the Photogrammetry and Remote Sensing Laboratory at Rio de Janeiro State University (especially Luiz Felipe de Almeida Furtado), the City Information Coordination at Pereira Passos Institute (especially Felipe Cerbella Mandarino), and the Foundation Institute of Geotechnics of Rio de Janeiro (Geo-Rio) for providing the landslide inventory. The authors further appreciate the support the Brazilian National Council for Scientific and Technological Development (CNPq). Finally, the authors also acknowledge the taxpayers whose indirect contributions support scientific research in Brazil. This paper stems from the undergraduate thesis of the third author, developed as part of the requirements for the Bachelor’s degree in Engineering at the State University of Rio de Janeiro (UERJ), under the supervision of the first and second authors. This research is also part of the RioSLIDE project (https://shinyapps.io/Shinny_app_RioSlide/, accessed on 17 December 2024), conceptualized and developed by Pedro H. M. Lima.

Conflicts of Interest

The authors declare no conflict of interest.

Abbreviations

The following abbreviations are used in this manuscript:
ASPRSAmerican Society for Photogrammetry and Remote Sensing
APRAdministrative Planning Regions
DEMDigital Elevation Model
DSMDigital Surface Model
DTMDigital Terrain Model
FDEMATEL-ANPFuzzy decision-making trial and evaluation laboratory
combining with the analytic network process
GAMGeneralized Additive Models
Geo-RioFundação Instituto de Geotécnica do Município do Rio de Janeiro
(Municipal Geotechnical Institute Foundation of Rio de Janeiro
GISGeographic Information System
GNSSGlobal Navigation Satellite System
IBGEInstituto Brasileiro de Geografia e Estatística
(Brazilian Institute of Geography and Statistics)
IPPInstituto Municipal de Urbanismo Pereira Passos
(Pereira Passos Municipal Urban Planning Institute)
IMUInertial Measurement Unit
LASLIDAR Aerial Survey
LaserLight Amplification by Stimulated Emission of Radiation
LGPDLei Geral de Proteção de Dados
(General Data Protection Law—Brazil)
MCDAMulti-criteria Decision Analysis
MLMachine Learning
NBNaïve Bayes
RFRandom Forest
WoEWeight of Evidence

References

  1. Neiva d’Orsi, R.; Paes, N.M.; Magalhães, M.A.; Silva Junior, L.R.; Schiavinato Valente, L.R. Os 50 Maiores Acidentes Geológico-Geotécnicos na Cidade do Rio de Janeiro Entre 1966 e 2016; Fundação Instituto de Geotécnica do Município do Rio de Janeiro, Diretoria de Estudos e Projetos, Gerência de Programas Especiais: Rio de Janeiro, Brazil, 2016. [Google Scholar]
  2. Alves, E.; Souza, G.; Marra, R. Êxodo e sua contribuição à urbanização de 1950 a 2010. Rev. Política Agrícola 2011, 20, 82–83. [Google Scholar]
  3. Izaga, F.; Pereira, M.d.S. A mobilidade urbana na urbanização das favelas no Rio de Janeiro. Cad. Desenvolv. Flum. 2014, 4, 88–115. [Google Scholar] [CrossRef]
  4. Matos, R. Migração e urbanização no Brasil. Rev. Geogr. 2012, 8, 7–23. [Google Scholar] [CrossRef]
  5. Parma, G.O.C. O risco ambiental aos deslizamentos de terra. Rev. Gestão Sustentabilidade Ambient. 2023, 12, e18741. [Google Scholar] [CrossRef]
  6. Mishra, A.N.; Maraun, D.; Knevels, R.; Truhetz, H.; Brenning, A.; Proske, H. Climate change amplified the 2009 extreme landslide event in Austria. Clim. Chang. 2023, 176, 124. [Google Scholar] [CrossRef]
  7. Mirandola, F.A.; Macedo, E.S.d. Proposta de classificação do tecnógeno para uso no mapeamento de áreas de risco de deslizamento. Quat. Environ. Geosci. 2014, 5, 66–81. [Google Scholar] [CrossRef]
  8. Bittencourt, B.K.; Cannabrava, M.P.; Del Rosario, T.K.; Hamilton, M.C.; Kampmann, M.E.; McGrath, J.T.; Ribeiro, B.B.; Gomes, J.O.; Lambert, J.H. Evaluating preparedness and resilience initiatives for distressed populations vulnerable to disasters in Rio de Janeiro, Brazil. In Proceedings of the 2013 IEEE Systems and Information Engineering Design Symposium, San Francisco, CA, USA, 25–28 March 2013; pp. 58–63. [Google Scholar] [CrossRef]
  9. Mendes Barbosa, L.; Walker, G. Epistemic injustice, risk mapping and climatic events: Analysing epistemic resistance in the context of favela removal in Rio de Janeiro. Geogr. Helv. 2020, 75, 381–391. [Google Scholar] [CrossRef]
  10. Instituto Municipal de Urbanismo Pereira Passos (IPP). SABREN-Sistema de Assentamentos de Baixa Renda. 2024. Available online: https://sabren-pcrj.hub.arcgis.com (accessed on 13 November 2024).
  11. Instituto Brasileiro de Geografia e Estatística (IBGE). Panorama de Favelas-Censo 2022. 2022. Available online: https://www.ibge.gov.br/geociencias/organizacao-do-territorio/tipologias-do-territorio/15788-favelas-e-comunidades-urbanas.html (accessed on 13 November 2024).
  12. Ronchi, S.; Arcidiacono, A. Adopting an Ecosystem Services-Based Approach for Flood Resilient Strategies: The Case of Rocinha Favela (Brazil). Sustainability 2019, 11, 4. [Google Scholar] [CrossRef]
  13. Lombardo, L.; Opitz, T.; Ardizzone, F.; Guzzetti, F.; Huser, R. Space-time landslide predictive modelling. Earth-Sci. Rev. 2020, 209, 103318. [Google Scholar] [CrossRef]
  14. Moreno, M.; Lombardo, L.; Crespi, A.; Zellner, P.J.; Mair, V.; Pittore, M.; van Westen, C.; Steger, S. Space-time data-driven modeling of precipitation-induced shallow landslides in South Tyrol, Italy. Sci. Total Environ. 2024, 912, 169166. [Google Scholar] [CrossRef]
  15. Steger, S.; Moreno, M.; Crespi, A.; Gariano, S.L.; Brunetti, M.T.; Melillo, M.; Peruccacci, S.; Marra, F.; de Vugt, L.; Zieher, T.; et al. Adopting the margin of stability for space-time landslide prediction—A data-driven approach for generating spatial dynamic thresholds. Geosci. Front. 2024, 15, 101822. [Google Scholar] [CrossRef]
  16. Instituto Brasileiro de Geografia e Estatística (IBGE). Cidades e Estados: Rio de Janeiro, Brazil. 2024. Available online: https://www.ibge.gov.br/cidades-e-estados/rj.html (accessed on 17 November 2024).
  17. da Silva, T.M.d.S.; Eduardo, C.C. Transformações geomorfológicas na cidade do Rio de Janeiro durante os séculos XIX e XX. Geo UERJ 2020, 37, e48492. [Google Scholar] [CrossRef]
  18. Coelho-Netto, A.L.; Avelar, A.S.; Fernandes, M.C.; Lacerda, W.A. Landslide susceptibility in a mountainous geoecosystem, Tijuca Massif, Rio de Janeiro: The role of morphometric subdivision of the terrain. Geomorphology 2007, 87, 120–131. [Google Scholar] [CrossRef]
  19. Silva, F.F.; Loureiro, H.A.S.; Silveira, T.S. Diagnóstico dos deslizamentos na cidade do Rio de Janeiro a partir das chuvas de abril de 2010: Estudo de caso do Morro dos Prazeres. Revista de Geografia (Recife) 2010, 27, 180–192. [Google Scholar]
  20. dos Santos Alvalá, R.C.; de Assis Dias, M.C.; Saito, S.M.; Stenner, C.; Franco, C.; Amadeu, P.; Ribeiro, J.; Souza de Moraes Santana, R.A.; Nobre, C.A. Mapping characteristics of at-risk population to disasters in the context of Brazilian early warning system. Int. J. Disaster Risk Reduct. 2019, 41, 101326. [Google Scholar] [CrossRef]
  21. Abelheira, M.A.; Salinas, G.; Soares, I.; Gomes Filho, S. Sirenes de alarme para deslizamentos de encostas: A experiência precursora da cidade do Rio de Janeiro. Rev. Mosaicos Estud. Governança Sustentabilidade E Inovação 2019, 1, 49–64. [Google Scholar] [CrossRef]
  22. Lacerda, W.A. The behavior of colluvial slopes in a tropical environment. In Proceedings of the 9th International Symposium on Landslides, Rio de Janeiro, Brazil, 28 June–2 July 2004; pp. 1183–1194. [Google Scholar]
  23. Chaves, F.L.; Gerscovich, D.M.S.; Sales, L.S.d. Correlação Chuva versus Escorregamento-Comunidade Formiga/Rio de Janeiro/Correlation Rain versus Sliding-Community Formiga/Rio de Janeiro. Braz. J. Dev. 2021, 7, 63901–63911. [Google Scholar] [CrossRef]
  24. Calvello, M.; d’Orsi, R.N.; Piciullo, L.; Paes, N.; Magalhaes, M.; Lacerda, W.A. The Rio de Janeiro early warning system for rainfall-induced landslides: Analysis of performance for the years 2010–2013. Int. J. Disaster Risk Reduct. 2015, 12, 3–15. [Google Scholar] [CrossRef]
  25. Calvello, M.; d’Orsi, R.; Piciullo, L.; Paes, N.; Magalhaes, M.; Coelho, R.; Lacerda, W. The Community-Based Alert and Alarm System for Rainfall Induced Landslides in Rio de Janeiro, Brazil. In Engineering Geology for Society and Territory, Volume 2 “Landslide Processes”, Proceedings of the XII Int. IAEG Congress, Torino, Italy, 13–19 September 2014; Springer: Cham, Switzerland, 2017; pp. 653–657. [Google Scholar] [CrossRef]
  26. Bogaard, T.; Greco, R. Invited perspectives: Hydrological perspectives on precipitation intensity-duration thresholds for landslide initiation: Proposing hydro-meteorological thresholds. Nat. Hazards Earth Syst. Sci. 2018, 18, 31–39. [Google Scholar] [CrossRef]
  27. Dantas, M.E. Geomorfologia do Estado do Rio de Janeiro; Estudo Geoambiental do Estado do Rio de Janeiro; CPRM–Serviço Geológico do Brasil: Brasília, Brazil, 2000. [Google Scholar]
  28. Monteiro, C.A.d.F.; Mendonça, F.d.A. Climatologia: Noções Básicas e Climas do Brasil; Editora Contexto: São Paulo, Brazil, 2003. [Google Scholar]
  29. Dereczynski, C.P.; de Oliveira, J.S.; Machado, C.O. Climatologia da precipitação no município do Rio de Janeiro. Rev. Bras. Meteorol. 2009, 24, 24–38. [Google Scholar] [CrossRef]
  30. Brito, T.T.; Oliveira-Júnior, J.F.; Lyra, G.B.; Gois, G.; Zeri, M. Multivariate analysis applied to monthly rainfall over Rio de Janeiro state, Brazil. Meteorol. Atmos. Phys. 2016, 129, 509–528. [Google Scholar] [CrossRef]
  31. Lyra, G.B.; Oliveira-Júnior, J.F.; Brito, T.T.; Gois, G.; Zeri, M. Interpolation methods for monthly rainfall data over the state of Rio de Janeiro, Brazil. Theor. Appl. Climatol. 2017, 130, 449–463. [Google Scholar] [CrossRef]
  32. Saldanha, R.; Akbarinia, R.; Pedroso, M.; Ribeiro, V.; Cardoso, C.; Pena, E.H.M.; Valduriez, P.; Porto, F. Zonal Statistics Datasets of Climate Indicators for Brazilian Municipalities. Environ. Data Sci. 2024, 3, e2. [Google Scholar] [CrossRef]
  33. Centro de Operações Rio. Maiores Chuvas–Alerta Rio, 2023. Available online: https://www.sistema-alerta-rio.com.br/maiores-chuvas/ (accessed on 30 March 2025).
  34. da Fonseca Martins, T. Pluviometria Crítica de Escorregamentos na Cidade do Rio de Janeiro: Comparação Entre Regiões e Períodos. Master’s Thesis, Universidade Federal do Rio de Janeiro (UFRJ), COPPE, Rio de Janeiro, Brasil, 2014. [Google Scholar]
  35. Fernandes, N.F.; Guimarães, R.F.; Gomes, R.A.; Vieira, B.C.; Montgomery, D.R.; Greenberg, H. Topographic controls of landslides in Rio de Janeiro: Field evidence and modeling. Catena 2004, 55, 163–181. [Google Scholar] [CrossRef]
  36. Gerscovich, D.; de Campos, T.; Vargas, E., Jr. Back analysis of a landslide in a residual soil slope in Rio de Janeiro, Brazil. In Proceedings of the Canadian Geotechnical Conference. Canadian Geotechnical Society, Halifax, NS, Canada, 20–23 September 2009. [Google Scholar]
  37. Avelar, A.S.; Coelho Netto, A.L.; Lacerda, W.A.; Becker, L.B.; Mendonça, M.B. Mechanisms of the recent catastrophic landslides in the mountainous range of Rio de Janeiro, Brazil. In Proceedings of the Second World Landslide Forum, International Consortium on Landslides, Rome, Italy, 3–9 October 2011. [Google Scholar]
  38. Fell, R.; Corominas, J.; Bonnard, C.; Cascini, L.; Leroi, E.; Savage, W.Z. Guidelines for landslide susceptibility, hazard and risk zoning for land use planning. Eng. Geol. 2008, 102, 85–98. [Google Scholar] [CrossRef]
  39. Cruden, D.M.; Varnes, D. Landslide Types and Processes. Landslide types and processes. In Landslides, Investigation and Mitigation; Turner, A.K., Schuster, R.L., Eds.; Transportation Research Board Special Report; National Academies Press: Washington, DC, USA, 1996; Volume 247, pp. 36–76. [Google Scholar]
  40. Varnes, D.J. Slope Movement. Types and Processes. In Landslides: Analysis and Control; Schuster, R., Krizek, R., National Research Council, Eds.; Transportation Research Board, National Academy Press: Washington, DC, USA, 1978; Volume Special Report 176, pp. 11–33. [Google Scholar]
  41. Hungr, O.; Leroueil, S.; Picarelli, L. The Varnes classification of landslide types, an update. Landslides 2014, 11, 167–194. [Google Scholar] [CrossRef]
  42. Guzzetti, F.; Mondini, A.C.; Cardinali, M.; Fiorucci, F.; Santangelo, M.; Chang, K.T. Landslide inventory maps: New tools for an old problem. Earth-Sci. Rev. 2012, 112, 42–66. [Google Scholar] [CrossRef]
  43. Hervás, J. Landslide Inventory. In Encyclopedia of Natural Hazards; Bobrowsky, P.T., Ed.; Springer: Dordrecht, The Netherland, 2013; pp. 610–611. [Google Scholar]
  44. Brabb, E.E. Innovative approaches to landslide hazard and risk mapping. In Proceedings of the 4th International Symposium on Landslides, Toronto, ON, Canada, 16–21 September 1984; Volume 1, pp. 307–324. [Google Scholar]
  45. Crozier, M.J.; Glade, T. Landslide hazard and risk: Issues, Concepts, and Approach. In Landslide Hazard and Risk; Glade, T., Anderson, M.G., Crozier, M.J., Eds.; Wiley: Chichester, UK, 2005; pp. 1–38. [Google Scholar] [CrossRef]
  46. Guzzetti, F. Landslide Hazard and Risk Assessment. Ph.D. Thesis, Rheinische Friedrich-Wilhelms-Universität, Bonn, Germany, 2005. [Google Scholar]
  47. Corominas, J.; van Westen, C.; Frattini, P.; Cascini, L.; Malet, J.P.; Fotopoulou, S.; Catani, F.; Van Den Eeckhaut, M.; Mavrouli, O.; Agliardi, F.; et al. Recommendations for the quantitative analysis of landslide risk. Bull. Eng. Geol. Environ. 2014, 73, 209–263. [Google Scholar] [CrossRef]
  48. Reichenbach, P.; Rossi, M.; Malamud, B.D.; Mihir, M.; Guzzetti, F. A review of statistically-based landslide susceptibility models. Earth-Sci. Rev. 2018, 180, 60–91. [Google Scholar] [CrossRef]
  49. Lima, P.; Steger, S.; Murillo-García, F.; Glade, T. Literature review and bibliometric analysis on data-driven assessment of landslide susceptibility. J. Mt. Sci. 2022, 19, 1670–1698. [Google Scholar] [CrossRef]
  50. Cascini, L. Applicability of landslide susceptibility and hazard zoning at different scales. Eng. Geol. 2008, 102, 164–177. [Google Scholar] [CrossRef]
  51. van Westen, C.J.; Castellanos, E.; Kuriakose, S.L. Spatial data for landslide susceptibility, hazard, and vulnerability assessment: An overview. Eng. Geol. 2008, 102, 112–131. [Google Scholar] [CrossRef]
  52. Shano, L.; Raghuvanshi, T.K.; Meten, M. Landslide susceptibility evaluation and hazard zonation techniques—A review. Geoenviron. Disasters 2020, 7, 18. [Google Scholar] [CrossRef]
  53. Brito, M.M.d.; Weber, E.J.; Silva Filho, L.C.P.d. Multi-criteria analysis applied to landslide susceptibility mapping. Rev. Bras. Geomorfol. 2017, 18, 719–735. [Google Scholar]
  54. Vojteková, J.; Vojtek, M. Assessment of landslide susceptibility at a local spatial scale applying the multi-criteria analysis and GIS: A case study from Slovakia. Geomat. Nat. Hazards Risk 2020, 11, 131–148. [Google Scholar] [CrossRef]
  55. Bera, A.; Mukhopadhyay, B.P.; Das, D. Landslide hazard zonation mapping using multi-criteria analysis with the help of GIS techniques: A case study from Eastern Himalayas, Namchi, South Sikkim. Nat. Hazards 2019, 96, 935–959. [Google Scholar] [CrossRef]
  56. Van Westen, C.; Van Asch, T.W.; Soeters, R. Landslide hazard and risk zonation—Why is it still so difficult? Bull. Eng. Geol. Environ. 2006, 65, 167–184. [Google Scholar] [CrossRef]
  57. Brenning, A. Statistical Geocomputing combining R and SAGA: The Example of Landslide susceptibility Analysis with generalized additive Models. In SAGA-Seconds Out; Böhner, J., Blaschke, T., Montanarella, L., Böhner, J., Eds.; Hamburger Beiträge zur Physischen Geographie und Landschaftsökologie, Universität Hamburg, Institut für Geographie: Hamburg, Germany, 2008. [Google Scholar]
  58. Lima, P.; Steger, S.; Glade, T. Counteracting flawed landslide data in statistically based landslide susceptibility modelling for very large areas: A national-scale assessment for Austria. Landslides 2021, 18, 3531–3546. [Google Scholar] [CrossRef]
  59. Montgomery, D.R.; Dietrich, W.E. A physically based model for the topographic control on shallow landsliding. Water Resour. Res. 1994, 30, 1153–1171. [Google Scholar] [CrossRef]
  60. Meten, M.; PrakashBhandary, N.; Yatabe, R. Effect of Landslide Factor Combinations on the Prediction Accuracy of Landslide Susceptibility Maps in the Blue Nile Gorge of Central Ethiopia. Geoenviron. Disasters 2015, 2, 9. [Google Scholar] [CrossRef]
  61. Silalahi, F.E.S.; Pamela; Arifianti, Y.; Hidayat, F. Landslide susceptibility assessment using frequency ratio model in Bogor, West Java, Indonesia. Geosci. Lett. 2019, 6, 10. [Google Scholar] [CrossRef]
  62. Addis, A. GIS-Based Landslide Susceptibility Mapping Using Frequency Ratio and Shannon Entropy Models in Dejen District, Northwestern Ethiopia. J. Eng. 2023, 2023, 1062388. [Google Scholar] [CrossRef]
  63. Wilopo, W.; Putra, D.P.E.; Fathani, T.F.; Pramaditya, A.; Tandirerung, R.; Erzagian, E. Comparison of two landslide hazard zonation methods in the volcanic terrain of Temanggung Regency, Central Java, Indonesia. J. Degrad. Min. Lands Manag. 2023, 10, 4537–4546. [Google Scholar] [CrossRef]
  64. Batar, A.K.; Watanabe, T. Landslide Susceptibility Mapping and Assessment Using Geospatial Platforms and Weights of Evidence (WoE) Method in the Indian Himalayan Region: Recent Developments, Gaps, and Future Directions. ISPRS Int. J. Geo-Inf. 2021, 10, 114. [Google Scholar] [CrossRef]
  65. Bernknopf, R.L.; Campbell, R.H.; Brookshire, D.S.; Shapiro, C.D. A Probabilistic Approach to Landslide Hazard Mapping in Cincinnati, Ohio, with Applications for Economic Evaluation. Environ. Eng. Geosci. 1988, 25, 39–56. [Google Scholar] [CrossRef]
  66. Chung, C.J.F.; Fabbri, A.G. Probabilistic prediction models for landslide hazard mapping. Photogramm. Eng. Remote Sens. 1999, 65, 1389–1399. [Google Scholar]
  67. Lee, S.; Pradhan, B. Landslide hazard mapping at Selangor, Malaysia using frequency ratio and logistic regression models. Landslides 2007, 4, 33–41. [Google Scholar] [CrossRef]
  68. Ayalew, L.; Yamagishi, H. The application of GIS-based logistic regression for landslide susceptibility mapping in the Kakuda-Yahiko Mountains, Central Japan. Geomorphology 2005, 65, 15–31. [Google Scholar] [CrossRef]
  69. Goetz, J.N.; Brenning, A.; Petschko, H.; Leopold, P. Evaluating machine learning and statistical prediction techniques for landslide susceptibility modeling. Comput. Geosci. 2015, 81, 1–11. [Google Scholar] [CrossRef]
  70. Ali, S.A.; Parvin, F.; Vojteková, J.; Costache, R.; Linh, N.T.T.; Pham, Q.B.; Vojtek, M.; Gigović, L.; Ahmad, A.; Ghorbani, M.A. GIS-based landslide susceptibility modeling: A comparison between fuzzy multi-criteria and machine learning algorithms. Geosci. Front. 2021, 12, 857–876. [Google Scholar] [CrossRef]
  71. Kadavi, P.R.; Lee, C.W.; Lee, S. Application of Ensemble-Based Machine Learning Models to Landslide Susceptibility Mapping. Remote Sens. 2018, 10, 1252. [Google Scholar] [CrossRef]
  72. Chen, X.; Chen, W. GIS-based landslide susceptibility assessment using optimized hybrid machine learning methods. Catena 2021, 196, 104833. [Google Scholar] [CrossRef]
  73. Brenning, A. Spatial prediction models for landslide hazards: Review, comparison and evaluation. Nat. Hazards Earth Syst. Sci. 2005, 5, 853–862. [Google Scholar] [CrossRef]
  74. Knevels, R.; Leopold, P.; Proske, H.; Wang, Z.; Brenning, A. Does Random Forest outperform the Generalized Additive Model? An evaluation based on rainfall-triggered landslides in the Styrian Basin, Austria. In Proceedings of the World Landslide Forum 6, Florence, Italy, 14–17 November 2023. [Google Scholar]
  75. Petschko, H.; Bell, R.; Glade, T. Landslide susceptibility modeling with generalized additive models—Facing the heterogeneity of large regions. In Landslides and Engineered Slopes: Protecting Society through Improved Understanding; Eberhardt, E., Froese, C., Turner, K.A., Leroueil, S., Eds.; Taylor & Francis: London, UK, 2012; Volume 1, pp. 769–775. [Google Scholar]
  76. Glade, T. Ranging Scales in Spatial Landslide Hazard and Risk Analysis; WIT Press: Southampton, UK, 2002; pp. 719–729. [Google Scholar]
  77. Prefeitura da Cidade do Rio de Janeiro. Data.Rio–Painel Interativo de Monitoramento e Prevenção a Desastres no Rio de Janeiro. 2024. Available online: https://www.data.rio/ (accessed on 4 November 2024).
  78. Kraus, K. Photogrammetry: Geometry from Images and Laser Scans; De Gruyter: Berlin, Germany; Boston, TX, USA, 2007. [Google Scholar] [CrossRef]
  79. Topocart Aerolevantamentos. Relatório de Execução de Mapeamento Aerofotogramétrico do Município do Rio de Janeiro por Mosaicos de Ortoimagens Digitais Coloridas Obtidas por Plataforma Aérea e Ortorretificadas de Acordo com Elevações (“True Ortho”); Modelo Digital de Elevações e Modelo Digital do Terreno por Perfilamento a LASER; Topocart Aerolevantamentos: Brasília, Brazil, 2019. [Google Scholar]
  80. American Society for Photogrammetry and Remote Sensing. LAS Specification 1.4-R14. 2019. Available online: https://www.usgs.gov/ngp-standards-and-specifications/clarify-intensity-requirement (accessed on 17 November 2024).
  81. LiDAR Brasil. Retornos e Classificação do Pulso Laser. 2024. Available online: https://www.ibm.com/br-pt/think/topics/lidar (accessed on 11 November 2024).
  82. Esri. XY Table to Point (Data Management)—ArcGIS Pro. 2024. Available online: https://pro.arcgis.com/en/pro-app/latest/tool-reference/data-management/xy-table-to-point.htm (accessed on 30 December 2024).
  83. van Diggelen, F.; Enge, P. The World’s first GPS MOOC and Worldwide Laboratory using Smartphones. In Proceedings of the 28th International Technical Meeting of the Satellite Division of The Institute of Navigation (ION GNSS+ 2015), Tampa, FL, USA, 14–18 September 2015; pp. 361–369. [Google Scholar]
  84. GNSS, I. High-Precision Positioning with Smartphone Measurements. 2024. Available online: https://insidegnss.com/high-precision-positioning-with-smartphone-measurements/ (accessed on 6 November 2024).
  85. Esri. LAS Dataset to Raster (Conversion)—ArcGIS Pro. 2024. Available online: https://pro.arcgis.com/en/pro-app/latest/tool-reference/conversion/las-dataset-to-raster.htm (accessed on 30 December 2024).
  86. Esri. Raster to Polygon (Conversion)—ArcGIS Pro. 2024. Available online: https://pro.arcgis.com/en/pro-app/latest/tool-reference/conversion/raster-to-polygon.htm (accessed on 30 December 2024).
  87. Esri. Spatial Join (Analysis)—ArcGIS Pro. 2024. Available online: https://pro.arcgis.com/en/pro-app/latest/tool-reference/analysis/spatial-join.htm (accessed on 30 December 2024).
  88. Petschko, H.; Brenning, A.; Bell, R.; Goetz, J.; Glade, T. Assessing the quality of landslide susceptibility maps—Case study Lower Austria. Nat. Hazards Earth Syst. Sci. 2014, 14, 95–118. [Google Scholar] [CrossRef]
  89. Brenning, A. Spatial cross-validation and bootstrap for the assessment of prediction rules in remote sensing: The R package sperrorest. In Proceedings of the International Geoscience and Remote Sensing Symposium (IGARSS), Munich, Germany, 22–27 July 2012; pp. 5372–5375. [Google Scholar] [CrossRef]
  90. Malamud, B.D.; Turcotte, D.L.; Guzzetti, F.; Reichenbach, P. Landslide inventories and their statistical properties. Earth Surf. Process. Landforms 2004, 29, 687–711. [Google Scholar] [CrossRef]
  91. Budimir, M.E.A.; Atkinson, P.M.; Lewis, H.G. A systematic review of landslide probability mapping using logistic regression. Landslides 2015, 12, 419–436. [Google Scholar] [CrossRef]
  92. Brenning, A. Benchmarking classifiers to optimally integrate terrain analysis and multispectral remote sensing in automatic rock glacier detection. Remote Sens. Environ. 2009, 113, 239–247. [Google Scholar] [CrossRef]
  93. Goetz, J.N.; Guthrie, R.H.; Brenning, A. Integrating physical and empirical landslide susceptibility models using generalized additive models. Geomorphology 2011, 129, 376–386. [Google Scholar] [CrossRef]
  94. Steger, S.; Glade, T. The challenge of “trivial areas” in statistical landslide susceptibility modelling. In Advancing Culture of Living with Landslides, Proceedings of the 4th World Landslide Forum, Ljubljana, Slovenia, 29 May–2 June 2017; Advances in Landslide Science; Springer International Publishing: Cham, Switzerland, 2017; Volume 2. [Google Scholar]
  95. ESRI. Focal Statistics (Spatial Analyst). 2023. Available online: https://pro.arcgis.com/en/pro-app/latest/tool-reference/spatial-analyst/focal-statistics.htm (accessed on 17 November 2024).
  96. Lin, Q.; Lima, P.; Steger, S.; Glade, T.; Jiang, T.; Zhang, J.; Liu, T.; Wang, Y. National-scale data-driven rainfall induced landslide susceptibility mapping for China by accounting for incomplete landslide data. Geosci. Front. 2021, 12, 101248. [Google Scholar] [CrossRef]
  97. Steger, S.; Brenning, A.; Bell, R.; Glade, T. The propagation of inventory-based positional errors into statistical landslide susceptibility models. Nat. Hazards Earth Syst. Sci. 2016, 16, 2729–2745. [Google Scholar] [CrossRef]
Figure 1. Rio de Janeiro location.
Ijgi 14 00330 g001
Figure 2. Some of the major landslides in Rio de Janeiro in recent decades (adapted from [1]).
Ijgi 14 00330 g002
Figure 3. Monthly temperature and precipitation patterns in the municipality of Rio de Janeiro from 1950 to 2021. The upper panel displays daily maximum and minimum air temperatures, while the lower panel shows average total monthly precipitation. Data are aggregated at the municipal level, based on the TerraClimate dataset [32].
Ijgi 14 00330 g003
Figure 4. Landslide susceptibility map of Rio de Janeiro. Available at: https://www.data.rio/apps/PCRJ::suscetibilidade-a-deslizamentos, accessed on 17 December 2024).
Ijgi 14 00330 g004
Figure 5. Example of an inspection report. Form filled out by field professionals at the occurrence site. English translations in red.
Ijgi 14 00330 g005
Figure 6. Topographic characteristics of the study area. Panels (A,D) show the frequency distribution of slope and elevation for all pixels in the study area. Panels (B,E) show the relative density of landslide and non-landslide training samples across slope and elevation classes, corresponding exclusively to the balanced dataset used for model training and allowing comparison with Panels (A,D). Panels (C,F) show the spatial distribution of slope and elevation over the terrain.
Ijgi 14 00330 g006
Figure 7. Spatial analysis of occurrences when contrasted with the heuristic map currently in use by Geo-Rio.
Ijgi 14 00330 g007
Figure 8. Geolocation of inventoried landslide occurrences (2010–2018) overlaid on the heuristic map currently utilized by Geo-Rio (Reference Map).
Ijgi 14 00330 g008
Figure 9. Geolocation of inventoried landslide occurrences (2010–2018) overlaid on the new, Experimental Data-Driven Map developed by this research.
Ijgi 14 00330 g009
Figure 10. Spatial analysis of occurrences (2017–2018) when contrasted with the Experimental Data-Driven Map developed by this research.
Ijgi 14 00330 g010
Figure 11. Data-driven landslide susceptibility maps for the following administrative regions: (a) Bangu; (b) Barra da Tijuca; (c) Centro; (d) Ilha do Governador; (e) Zona Sul; and (f) Tijuca. The slider bars on the side display the territorial percentages of each susceptibility category for the neighborhood within these administrative regions.
Ijgi 14 00330 g011aIjgi 14 00330 g011b
Figure 12. The Experimental Data-Driven Map developed by this research, highlighting occurrences in the Tijuca planning region. This map shows some discrepancies regarding landslides falling on areas of low susceptibility in the Alto da Boa Vista Neighborhood (the hilly area to the West).
Ijgi 14 00330 g012
Table 1. Parameters used in the LAS Dataset to Raster tool.
ParameterValue
Value fieldElevation
Interpolation typeBinning
Cell assignmentAverage
Void fill methodLinear
Output data typeFloating Point
Sampling typeCell Size
Sampling value5
Z factor1
Table 2. AUROC for different validation types.
Validation TypeLandslide Inventory PeriodAUROC
Random CV2011–20160.769
Spatial CV2011–20160.736
External2017–20180.847
Table 3. Landslide occurrences for both the training sample and the test sample, when contrasted with the Reference Map and with the Experimental Data-Driven Map.
Training Sample (2010–2016)Test Sample (2017–2018)
Reference Map
Low susceptibility14.9%12.2%
Medium susceptibility54.3%55.5%
High susceptibility30.8%32.3%
Experimental Data-Driven Map
Low susceptibility13.2%14.8%
Medium susceptibility17.1%19.1%
High susceptibility69.7%66.1%
Disclaimer/Publisher’s Note: The statements, opinions and data contained in all publications are solely those of the individual author(s) and contributor(s) and not of MDPI and/or the editor(s). MDPI and/or the editor(s) disclaim responsibility for any injury to people or property resulting from any ideas, methods, instructions or products referred to in the content.