Abstract
This study investigates the spatiotemporal optimization of small-scale emergency infrastructure in high-density urban environments, using nucleic acid testing sites in Macao as a case study. The objective is to enhance emergency responsiveness during future public health crises by aligning infrastructure deployment with dynamic patterns of population influx. A behaviorally informed spatial decision-making framework is developed through the integration of kernel density estimation, point-of-interest (POI) distribution, and origin–destination (OD) path simulation based on an Ant Colony Optimization (ACO) algorithm. The results reveal pronounced temporal fluctuations in testing demand—most notably with crowd peaks occurring around 12:00 and 18:00—and highlight spatial mismatches between existing facility locations and key residential or functional clusters. The proposed approach illustrates the feasibility of coupling infrastructure layout with real-time mobility behavior and offers transferable insights for emergency planning in compact urban settings.
1. Introduction
In recent years, the frequent occurrence of public health emergencies has underscored the need for resilient urban systems. Cities must be capable of rapidly deploying temporary medical infrastructure to contain viral transmission while minimizing public disruption [1,2,3]. However, high-density urban areas face unique challenges in aligning emergency response strategies with dynamic population flows, infrastructural constraints, and spatial inequalities. A resilient city refers to one that can swiftly restore core functions, mitigate losses, and achieve long-term sustainable development through flexible planning, efficient resource deployment, and dynamic adaptive capacity in response to sudden shocks such as natural disasters, public health events, or climate change [4,5]. While global research on resilient cities has primarily focused on natural and unforeseen disasters [6,7,8], relatively less attention has been paid to public health emergencies [9].
Since the outbreak of COVID-19 in Wuhan in December 2019 and its subsequent global spread, China’s experiences with large-scale testing revealed several weaknesses in the layout and use of nucleic acid testing sites. These shortcomings have drawn renewed attention to the spatial planning of medical infrastructure under emergency conditions [10,11,12]. In this context, the spatiotemporal configuration of small-scale emergency infrastructure has become a growing area of interest. As a key component of epidemic prevention and control, the placement of testing facilities directly influences detection efficiency, crowd clustering, and overall response effectiveness [13,14]. Existing studies have employed spatial analysis techniques to evaluate the coverage and accessibility of testing facilities [15,16], often incorporating factors such as population density, transportation accessibility, and infection risk levels to construct optimization models [17,18,19]. While these approaches have improved the logic of facility placement, most rely on static population data or fixed service radii, failing to capture the temporal dynamics of human movement, particularly in high-density, rapidly changing urban environments.
In summary, three key research gaps remain: ① Limited modeling of dynamic spatiotemporal crowd behavior: Most studies rely on static population metrics, which overlook temporal variations and peak-period crowd surges. ② Insufficient integration of multi-source behavioral data: The over-reliance on census or GIS data neglects the behavioral dimensions of urban operation, leading to mismatches between planning outputs and actual service demand. ③ Lack of fine-grained studies focused on high-density micro-cities: Existing research often targets megacities such as Wuhan, Guangzhou, or Beijing, with limited attention to the unique conditions of small, high-density urban environments. The core research question addressed in this study is the following: How can spatiotemporal patterns of population influx inform the timing and layout of emergency facilities in high-density cities? Against this backdrop, we focus on the spatial and temporal configuration of nucleic acid testing sites in Macao during the COVID-19 pandemic. By integrating multi-source data—including appointment records, POI distributions, and OD flows—with GIS-based simulation and an ACO algorithm, we propose an adaptive spatial strategy that reflects real-time mobility dynamics. The goal is to offer a replicable decision-support framework for emergency infrastructure deployment.
The main contributions of this study are as follows: ① We introduce crowd-gathering dynamics as a core variable in spatiotemporal facility planning under public health emergencies. ② We integrate ACO-simulated OD flows with POI and population data to identify demand hotspots and spatial mismatches. ③ We propose a three-dimensional analytical framework linking service efficiency, functional demand, and population activity, particularly tailored to the needs of high-density micro-city contexts. ④ We demonstrate the feasibility and replicability of our framework through an empirical case study in Macao, offering actionable insights for future emergency infrastructure planning. While the integration of ACO, POI, and OD data is not novel, this study extends such methods to a micro-city context characterized by spatial granularity and rapid mobility cycles. The originality of our work lies not in algorithmic innovation, but in its context-specific adaptation and real-world applicability under pandemic constraints.
2. Literature Review
Current research has accumulated abundant research results in the areas of emergency facility sitting, population dynamics analysis and urban spatial response mechanisms, but there are still deficiencies in considering the dynamic characteristics of population influx and the actual demand for facility use. They are mainly categorized into three aspects.
- (1)
- Dynamic characteristics of urban crowds
Traditional urban facility planning mainly relies on static population data or long-term average demand indicators, which is difficult to reflect the rapid changes in crowd behavior under unexpected events. In recent years, with the development of new data sources such as big data, mobile signaling, and social media, dynamic crowd research has become a hot direction. For example, some scholars reveal the activity patterns of crowds in different space and time scales through mobile signaling data, which provides an empirical basis for understanding the activity level and facility deployment in urban functional areas [20,21,22]. Meanwhile, “dynamic crowd heat map” is constructed based on urban big data, which can be used for urban spatial characterization and coordinated allocation of resources [23,24]. In terms of disaster prevention, coordinated dynamic signage for evacuation guidance has been proposed as a multi-intelligence reinforcement learning approach integrating fine-grained crowd modeling and fire propagation, which can provide coordinated, real-time directional guidance for multiple signs, which provides a new perspective for emergency response infrastructures based on crowd gathering dynamics [25]. Overall, assessing the time-varying nature of facility needs from crowd behavior has become an important direction for fine-grained management of emergency layouts.
- (2)
- Optimization methods
Optimization methods for small emergency infrastructure layout: In responding to emergencies, Euclidean distance, the Location Set Covering Problem (LSCP) Model, and the p-Median Problem (pMP) Model are used for the layout of medical resources, emergency supplies, and shelters [26,27]. For example, Jia et al. constructed an optimal coverage model of medical facilities for large-scale emergencies, which achieves the balance between resource minimization and service maximization [28]. Wang Zhenbao et al. combined the minimum point model and GIS spatial analysis in the siting of nucleic acid testing facilities to compare and analyze the coverage of residents in different types of siting methods, and proposed a siting method oriented to the dual dimensions of settlements and accessibility [29]. As a city with compact spatial resources and high population density [30,31], Macau introduces the ACO to simulate OD paths and optimize siting in combination with the density of POI grids, which can help to solve the problems of “redundancy of points”, “insufficient edge coverage”, etc., and realize the problem of “redundancy” and “insufficient edge coverage” from the actual service. It helps to solve the problems of “point redundancy” and “insufficient edge coverage” in the actual service and realizes the improvement of the method from “static layout” to “dynamic response”.
- (3)
- Emergency infrastructure
Emergency infrastructure practice and case study in the context of the new coronavirus epidemic: In the context of epidemic prevention and control, temporary and small-scale emergency facilities such as nucleic acid testing sites and square cabin hospitals have become the core of the response [32]. On the one hand, planning research has gradually transitioned from the perspective of “emergency response” to that of “normal disaster preparedness”. The China Society of Urban Planning puts forward the concept of incorporating emergency facilities such as nucleic acid detection sites into the construction of the “15 min living circle”, realizing the layout concept of the “combination of level and emergency” facility system [33]. On the other hand, empirical studies have gradually focused on the coupling relationship between facilities and population density and urban function distribution. Li Qinghai et al. found that the nucleic acid testing sites showed obvious spatial agglomeration but weak coupling with population distribution, and suggested optimizing the layout strategy from the data of crowd activities and usage [34]. As a tourist-dominated city, Macau’s population fluctuates significantly between day and night [35,36]. Therefore, it is particularly suitable for the study of dynamic demand-oriented emergency facilities. Based on the operational data of nucleic acid detection sites in Macau in 2022, this study constructs a representative facility layout optimization strategy through the identification of tidal phenomenon, optimization of service hours, and modeling of POI density, which is of great significance for the future response to high-density urban epidemics.
Based on this, this study takes the nucleic acid testing site in Macao Special Administrative Region of China as an object, conducts on-site flow statistics on the crowd gathering dynamics of the testing site, and analyzes the demand in combination with the distribution of the surrounding businesses to screen and sort out the major and minor factors affecting the crowd gathering dynamics of the city’s emergency infrastructure, and then constructs a strategy for optimizing the layout of the Macao nucleic acid testing site that is related to the influencing factors. The innovations of this study are as follows: ① “Crowd gathering dynamics” is introduced as a core variable for quantitative analysis, and the spatial and temporal changes in the demand for emergency services are taken as the core driving factor for optimizing the layout. ② Crowd OD paths based on GIS kernel density and ACO algorithm are simulated and a dynamic analysis model with behavior simulation and spatial analysis is formed. ③ The “15 min nucleic acid circle” coverage analysis + POI grid density grading optimization strategy is proposed, alongside a highly replicable three-dimensional analytical framework of service efficiency, functional demand, and population activity. “Dual use” infrastructure for micro high-density cities is explored.
3. Method
3.1. Site and Data
This study focuses on the Macau Special Administrative Region of China, which has a total urban area of 32.9 square kilometers, including three main areas: the Macau Peninsula, Taipa Island, and Coloane Island. As a pioneer area for the change in nucleic acid testing methods, Macau has a rich and complete sample of the population and the surrounding business, which is an important reference for the study of the layout of emergency measures. Nucleic acid detection sites are categorized into BX (nucleic acid testing services for people who need to use nucleic acid certificates), B1X (special nucleic acid testing services for key areas/populations), and CX (nucleic acid testing services for casino and hotel housing patrons and related staff) according to the differences in the target populations they cater to. The distribution map of nucleic acid testing sites in Macao (Figure 1) shows that these sites are mainly concentrated in the Macao Peninsula, with a pattern of density in the north and dispersion in the south, consistent with the living and working areas of Macao’s urban residents. From 30 November to 5 December 2022, at 8:00, 10:00, 12:00, 15:00, 18:00 and 20:00 h, the real-time number of appointments and the number of people queuing up on-site were collected through the public reservation system provided by the Macao SAR Government for all the nucleic acid detection sites open for reservation within the city area, with a total of 36 time sites over 6 days and a total of 2592 open data.
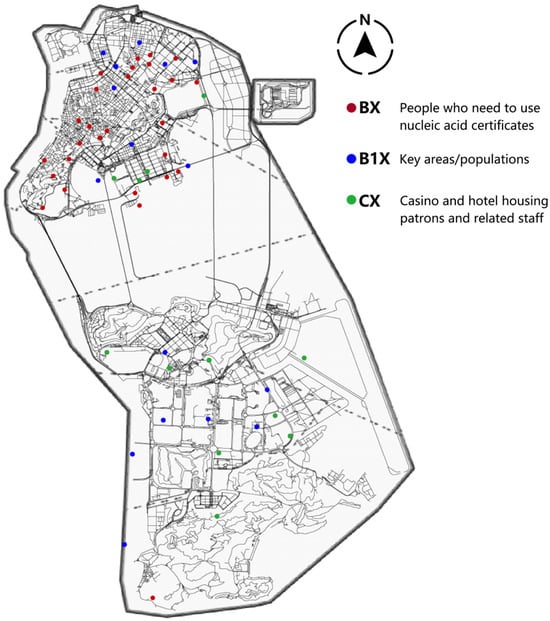
Figure 1.
Schematic diagram of the classification of nucleic acid detection sites.
3.2. Research Methodology
3.2.1. Algorithm Selection
In this study, we focus on the cyclical patterns of population aggregation and dispersion within specific time periods and spatial units, as well as the spatial density of the resident population. To simulate population movement paths in the urban space and optimize the spatial layout of nucleic acid testing sites, we employ the Ant Colony Optimization (ACO) algorithm for OD (origin–destination) path modeling [37]. ACO is a swarm intelligence-based heuristic search method that incrementally approaches the optimal solution through iterative information exchange among agents. Its core mechanism includes several key components. ① State transition rule (path selection probability).
where is the pheromone level on edge ; is the heuristic desirability, inversely proportional to the distance; α and β are the weights of the pheromone trail and the heuristic function, respectively; is the set of nodes yet to be visited by ant k.
② Pheromone Update Rule: After each iteration, the pheromone levels on the edges are updated based on the quality of the paths traversed by all ants. The pheromone update rule is defined as
where is the pheromone level on edge at time t; is the evaporation rate, controlling how quickly pheromones decay over time; m is the total number of ants; is the amount of pheromone deposited on edge by ant k.
The study employs a standard Ant Colony Optimization framework adapted for urban OD simulation, with parameter tuning and spatial constraints grounded in empirical calibration. We emphasize context-specific application: dynamic OD simulation with real-world POI density as heuristic weight, and path validation against both public route datasets and actual appointment behavior.
3.2.2. Algorithm Advantages
The ACO algorithm is particularly suitable for simulating OD (origin–destination) paths in urban mobility studies due to the following advantages: ① Path diversity: In high-density urban environments, residents often face multiple possible routes for the same trip. ACO is capable of capturing the probabilistic nature of path selection, including the tendency to select suboptimal or alternative paths based on real-world constraints or preferences. ② Dynamic adaptability: ACO allows for flexible adjustment of edge weights based on contextual variables such as POI density, population flow intensity, and road hierarchy. This enables the algorithm to reflect dynamic routing behavior influenced by temporal demand shifts and functional urban structures. ③ Weak-supervision modeling: In situations where complete real-world trajectory data is not available, ACO offers a practical solution by leveraging spatial topological structures and heuristic rules to generate high-confidence, approximate movement paths without requiring extensive labeled datasets. This enables the algorithm to reflect dynamic routing behavior influenced by temporal demand shifts and functional urban structures. In our implementation, the underlying urban mobility graph was constructed using the official vectorized road network of Macao SAR.
3.2.3. Parameter Settings and Path Validity Assurance
In this study, the ACO algorithm was implemented with parameter settings derived from prior literature and adjusted through empirical calibration [38,39] (Table 1). To enhance the realism of the model, all nodes and edges were defined based on vectorized street network data from the Macao Special Administrative Region. This design prevents the generation of non-physical paths, such as direct-line shortcuts that would unrealistically cross through buildings or inaccessible areas.

Table 1.
Parameter settings and basis for setting ACO algorithm parameters.
The tuning process followed the following strategy: ① Minimizing convergence time without sacrificing path diversity. ② Maximizing path realism compared to official routing data. ③ Improving spatial overlap with high-demand POI zones. For instance, we observed that increasing β beyond 2.5 led to overly deterministic paths with reduced variability, while a lower ρ (<0.4) caused premature convergence to suboptimal routes. The final adopted parameter set () offered the best trade-off between exploration and convergence, yielding stable and spatially consistent OD simulation results. This case-specific empirical calibration ensures the applicability of ACO in the high-density, multimodal context of Macao.
To validate the realism and reliability of the simulated OD paths produced by ACO, the study employed a three-dimensional analytical framework: ① Comparison with navigation routes: Ten representative OD pairs were selected and compared against actual routing results from Gaode Map and public routing datasets from the Land and Urban Construction Bureau of Macao. The average path similarity between ACO-generated routes and official recommended paths reached 78%, indicating high spatial conformity. Specifically, the statement “78% path similarity” refers to the average path-level Intersection over Union (IoU) between ACO-generated routes and official navigation paths from Gaode Map. ② Verification with real-world appointment behavior: We analyzed high-traffic testing sites (e.g., B88 and B65) during peak hours and compared the spatial distribution of source zones in actual reservation records against ACO-generated origin points. The analysis showed that over 73% of high-frequency paths overlapped with actual source areas, validating the behavioral plausibility of the simulation. ③ Correlation with POI kernel density maps: By overlaying the ACO-generated OD heatmap with kernel density maps of urban POIs, we observed a strong spatial correlation: simulated flows were consistently concentrated around POI-dense urban subzones, particularly in mixed-use commercial, and transit-dense areas. This supports the model’s capacity to reflect functional attractiveness in urban movement.
The selection of OD pairs significantly influences the resulting simulated flow distribution in the ACO model. In this study, OD pairs were derived from a hybrid approach: origins were defined based on residential POI clusters (classified by density and type), while destinations corresponded to nucleic acid testing sites. A total of 680 OD pairs were constructed, covering peak-hour and non-peak-hour scenarios across the six-day period. These OD pairs aim to reflect realistic population movement patterns during COVID-19 testing demand windows. The temporal resolution is aligned with 6 observation intervals (8:00–20:00), capturing both morning and evening peaks. Furthermore, the ten representative OD paths used for validation were selected based on three criteria: ① Geographic coverage across all districts in Macao; ② inclusion of both high-demand and low-demand testing sites (e.g., B88, B65, B103); and ③ temporal representation across peak and off-peak time intervals. This ensures a diversified and representative validation sample reflective of real operational conditions.
4. Result and Analysis
4.1. Crowd Gathering Dynamics at Different Times of a Week
- (1)
- The tidal phenomenon of nucleic acid detection sites at different times
To understand the temporal variation in nucleic acid testing demand, we examined appointments and queued data across six consecutive days, covering both weekdays and non-working days. Rather than detailing daily patterns in a repetitive manner, we summarize the main findings here.
BX-type testing sites, which serve the general population, consistently exhibited a bi-modal tidal pattern with peaks around 12:00 and 18:00. This trend remained stable across weekdays and weekends, although minor shifts in timing were observed. Most of BX sites followed this bi-peak structure. In contrast, B1X-type sites—designated for specific populations—demonstrated flatter profiles with moderate single peaks, largely shaped by policy mandates. CX-type sites, catering to service-sector workers, showed minimal fluctuations and often maintained consistent, low-volume demand throughout the day.
Representative data are provided in Figure 2, highlighting typical weekday and non-working-day tidal phenomena. Figure 2a–d show weekday patterns (November 30 to December 2 and December 5), while Figure 3 shows weekend and transitional day trends (December 3 to 4). These plots validate the temporal clustering and service rhythm of each site type.
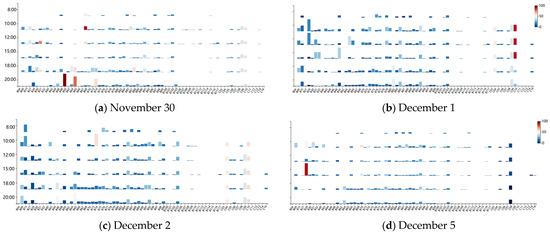
Figure 2.
The tidal phenomenon of nucleic acid detection sites on weekdays.
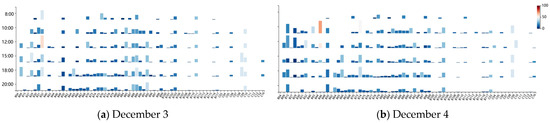
Figure 3.
The tidal phenomenon of nucleic acid detection sites on non-workdays.
- (2)
- Comparative analysis of the crowd gathering dynamics in weekdays and non-weekdays.
Crowd gathering dynamics varied significantly between weekdays and non-working days, even at the same testing site locations. As illustrated in Figure 4 (e.g., November 30 vs. December 3), queuing time patterns at nucleic acid testing sites exhibited distinct cyclical fluctuations across site types. At BX-type testing sites, weekday crowd volumes were substantially higher than those on non-working days, although the peak hours—typically around 12:00 and 18:00—remained consistent across both scenarios. In contrast, B1X-type sites showed smaller temporal fluctuations, with crowd demand relatively stable and less influenced by the weekday/non-weekday distinction. The magnitude of demand variability was most pronounced at BX sites, reflecting their greater sensitivity to daily activity cycles.
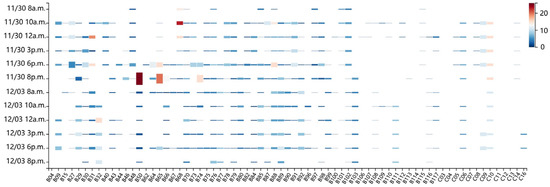
Figure 4.
Comparison of weekday and non-workday tidal phenomena.
4.2. Dynamics of Population Influx at Different Types of Nucleic Acid Detection Sites
Each type of nucleic acid testing site exhibits distinct demand dynamics throughout the day, shaped by its service orientation and user groups. BX sites, primarily serving the general public, show the most pronounced and stable cyclical fluctuations in demand. B1X sites, designated for area-specific priority groups, display relatively moderate fluctuations. CX sites, which serve travelers and service personnel, are more susceptible to external influences such as policy adjustments and the spatial distribution of surrounding industries.
- (1)
- Weekday Dynamics (e.g., November 30):
On typical weekdays, clear differences emerge in the temporal demand profiles across the three site types. BX sites exhibit both single-peak and bi-peak tidal patterns, reflecting structured public activity cycles. These sites show substantial intra-site variability (temporal shifts in peak time) and inter-site variation (differentiated intensity among BX locations). In contrast, B1X sites demonstrate more uniform peak timings with milder fluctuations, and CX sites display weak single-peak behavior with minimal variation across both time and location. These patterns are illustrated in Figure 5.
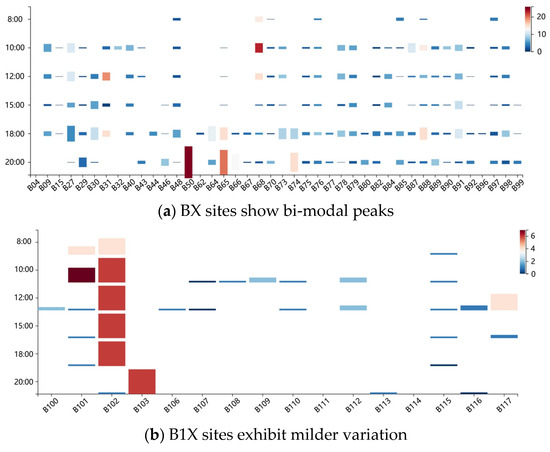
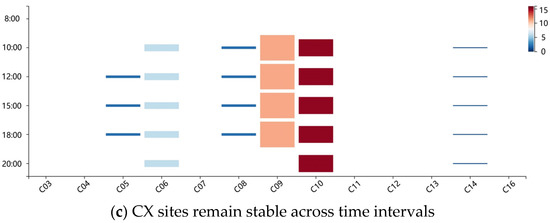
Figure 5.
Comparative tidal patterns of different types of testing sites on a weekday.
- (2)
- Non-Working-Day Dynamics (e.g., December 3):
Compared to weekdays, demand fluctuations on non-working days are generally subdued but still exhibit type-specific patterns. BX sites continue to show notable peak shifts across locations, with persistent single- and bi-peak structures. B1X sites show minimal changes in both peak timing and amplitude, while CX sites remain the least dynamic, exhibiting weak single-peak behavior with negligible spatiotemporal variability (Figure 6).
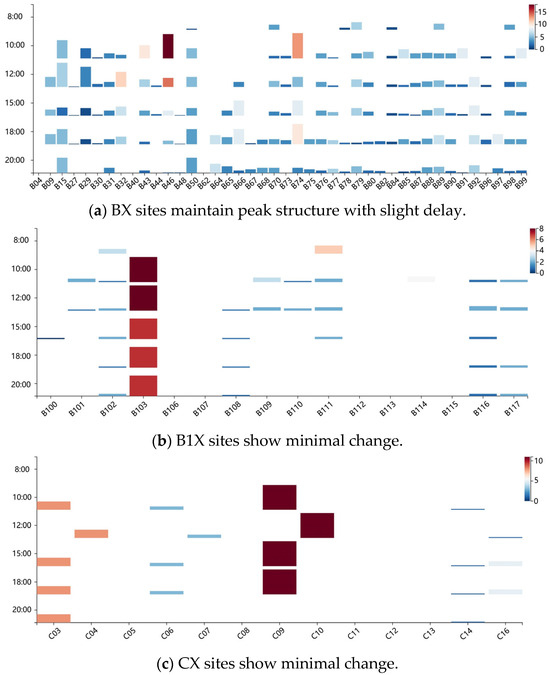
Figure 6.
Comparative tidal patterns of different types of testing sites on a non-working day.
4.3. Analysis of the Correlation Between the Flow of People at Nucleic Acid Testing Sites and the Surrounding Businesses
Different types of tidal patterns observed across weekdays and non-working days can be exemplified by specific testing sites. ① Weekday bi-peak pattern: At testing site B88, demand peaks occur at 12:00 and 18:00, corresponding to midday lunch breaks and post-work hours. The site is surrounded by dense residential clusters, and the observed fluctuation reflects the typical work–rest cycles of nearby residents. ② Weekday single-peak pattern: Testing site B65 experiences a crowd peak at 18:00, influenced by surrounding residential zones and a public park. The demand pattern likely corresponds to post-leisure or after-dinner activities common in the area. ③ Non-working-day single-peak pattern: Site B32 exhibits a peak around 12:00, with surrounding residential areas and a multipurpose community hall. The surge is likely driven by weekend lunchtime activities and family outings. ④ Non-working-day bi-peak pattern: At site B70, peaks are observed at 08:00 and 12:00. The site is embedded within a high-density residential district, and the early peak aligns with morning travel, while the midday peak reflects typical weekend routines. These case-specific patterns (Figure 7) illustrate how localized land-use functions and temporal rhythms shape crowd dynamics across different testing site types and days of the week.
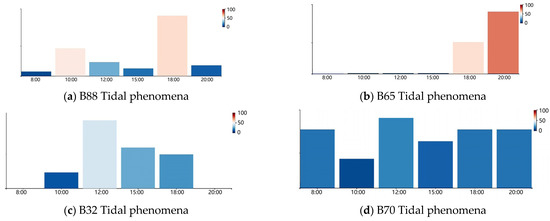
Figure 7.
Tidal phenomena in nucleic acid detection sites.
Furthermore, to enhance the adaptability of the proposed model and improve its operational relevance for real-world implementation, this study conducted targeted case analyses of three nucleic acid testing sites—B50, B102, and B103—that exhibited exceptionally high demand peaks during specific time intervals. ① Site B50–peak concentrations driven by transportation hub proximity: Located near a major arterial road on the eastern side of the Macao Peninsula, B50 is situated close to a border checkpoint and a light rail station. On weekdays, the site exhibited a distinct double-peak pattern at 08:00 and 18:00, with crowd volumes significantly surpassing those at nearby locations. This phenomenon is likely attributed to its proximity to cross-border commuter zones, which experience surges during peak transit hours. POI analysis further confirmed the presence of numerous transport-related facilities and short-stay services in the surrounding area. ② Site B102–policy-driven population surges: B102 is a B1X-type testing site designated for sector-specific groups such as casino employees and essential personnel. On December 1 and 3, the site recorded sustained demand peaks between 10:00 and 15:00. According to public notices from the Macao Health Bureau, these time windows coincided with policy-mandated screening periods for designated occupational groups. This alignment triggered a sharp increase in reservation activity, resulting in dual surges in both online bookings and on-site queuing. ③ Site B103–recreational overlap during non-working days: Located in a dense residential area in northern Macao, B103 is adjacent to major shopping complexes and traditional markets. On Sunday, December 4, the site experienced a sharp crowd peak around 12:00, exceeding the CX-type site average by 210%. Based on POI distribution and temporal alignment, it is inferred that weekend leisure activities, public events, or promotional campaigns may have encouraged residents to conveniently access testing services while engaging in other activities nearby.
4.4. Dynamic Analysis of the Crowd Gathering in the 15-Minute Nucleic Acid Testing Circle
To analyze the spatial influence of nucleic acid testing site distribution on population influx dynamics in Macao, this study implements an optimized spatial layout strategy aimed at improving the operational efficiency of emergency infrastructure while minimizing disruptions to daily urban life. The optimization is based on a temporally informed analysis, combining the Location–Allocation model from the GIS network analysis toolkit with multi-source spatial data, including urban POIs, OD flows, and population distribution across the city.
The 15 min coverage zones were modeled using Euclidean buffers, which are widely applied in Chinese public service planning standards. Given Macao’s compact and highly walkable urban structure, this approximation is considered acceptable for preliminary coverage estimation. It is important to note that the 15 min accessibility layer and the OD-based simulation represent two distinct yet complementary spatial perspectives: the former captures localized service accessibility within neighborhoods, while the latter reflects broader urban-scale mobility patterns and inter-zonal population flows. Given Macao’s dense, grid-like urban form and fine-grained pedestrian infrastructure, prior studies have shown that Euclidean buffers closely approximate network-based service areas in such contexts. Thus, while a detailed network analysis was not implemented in this study, the spatial bias introduced by using Euclidean coverage zones is expected to be minimal and does not affect the validity of the coverage evaluation [40,41].
- (1)
- OD analysis:
By calculating the 15 min walking service areas of all nucleic acid testing sites in Macao, we derived the spatial distribution of service coverage. These coverage zones show substantial overlap with the city’s high-density urban cores. In parallel, ACO algorithm was employed to simulate OD flows across the Macao SAR. The resulting spatial pattern reveals that nucleic acid testing sites are closely aligned with high-traffic corridors and mobility hotspots. Furthermore, when overlaying population density data with the spatial distribution of testing site coverage, a strong correspondence is observed: areas with higher population density are generally well served by nearby testing sites, indicating an overall spatial consistency between facility placement and residential demand intensity. To quantitatively support the spatial alignment between testing site coverage and dynamic demand patterns, we conducted a spatial overlap analysis using a 300 m × 300 m grid system. OD path density and testing site coverage were rasterized and binarized using percentile thresholds. The resulting spatial comparison shows an Intersection over Union (IoU) value of 0.72, indicating substantial overlap between simulated demand hotspots and service areas. This supports the claim that testing site placement aligns with areas of high population influx (Figure 8). In addition, the computed Pearson correlation coefficients was r = 0.81 (p < 0.001), indicating a moderate to positive spatial association.
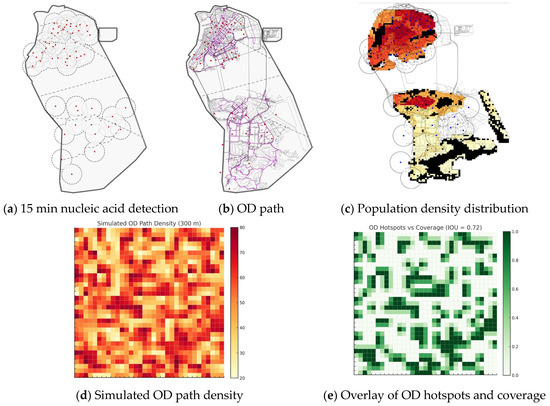
Figure 8.
Analysis of crowd dynamic gathering.
- (2)
- Kernel density analysis:
Kernel density analysis reveals a relatively strong spatial correlation between POI density and the distribution of nucleic acid testing sites in the Macao SAR. In the northern urban core, POI density is the highest, and testing site coverage reaches 100%, with a clear clustering pattern that reflects planning responsiveness to functional intensity. In the southern districts, although POI density is lower and more uneven, most high-density POI zones remain covered by nearby testing sites, demonstrating an overall alignment between service placement and functional spatial demand.
- (3)
- POI analysis:
The spatial relationship between POI categories and nucleic acid testing site distribution exhibits significant regional variation. In the northern Macao Peninsula, POIs are densely and evenly distributed, corresponding with a relatively uniform testing site layout and a coverage rate of 92%. In contrast, Taipa and Coloane Islands show a more uneven POI distribution. Nucleic acid testing sites tend to cluster around high-POI-density zones, resulting in an overall coverage rate of 85%. In residential areas, POIs are typically clustered. Northern residential zones have a coverage rate of 91%, while southern zones lag behind at 60%, indicating a stronger planning emphasis on residential accessibility in the north. Commercial POIs are scattered in the northern region, with an 80% coverage rate, while in the south they form distinct clusters with a 70% coverage rate. Spatially, the correlation between commercial POIs and testing sites is higher than that of other functional types. Educational and cultural POIs are heavily concentrated in the north, yet coverage in the central corridor remains sparse. Overall coverage reaches 95% in these areas. On the southern islands, POIs in this category are grouped, but testing site coverage drops to 80%, suggesting a spatial disconnect. Parking POIs are widely dispersed in the north, where coverage reaches 95%. In the south, their radial distribution around transportation hubs results in a weaker spatial correlation with testing sites (82% coverage). School POIs show the strongest spatial alignment, with dense clustering in both the north and south and 100% testing site coverage, indicating strong planning coordination in educational zones (see Figure 9 and Figure 10).
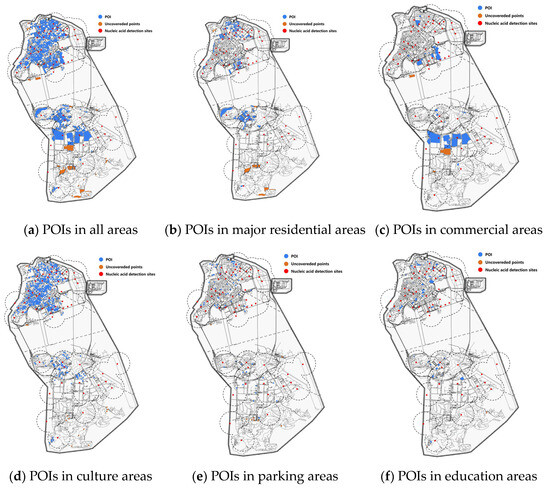
Figure 9.
POI in different functional areas.
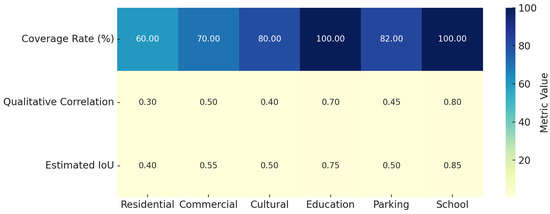
Figure 10.
Spatial alignment metrics between POI types and testing sites.
5. Discussion
5.1. Time Management Optimization
This study investigates the temporal fluctuations in demand at nucleic acid testing sites through tidal pattern analysis and proposes a dynamic, time-window-based optimization strategy. While the logic of social resource allocation aligns with previous research, this work introduces several methodological advancements. Prior studies have explored emergency logistics and medical transport networks using various optimization algorithms, primarily focusing on improving temporal allocation efficiency [42]. However, they often overlook the fine-grained temporal rhythms of crowd activity. In contrast, this study distinguishes between single- and double-peak demand structures by comparing weekdays and non-working days and proposes a targeted, time-segmented scheduling scheme. Moreover, some scholars have applied multi-agent models to simulate resident behavior and predict testing demand under epidemic conditions [43,44]. Such models are typically based on hypothetical behavioral rules. By contrast, this study leverages empirical appointment data, yielding results that are more grounded in observed human mobility patterns. The analysis reveals that approximately 80% of testing sites experience significant intra-day demand variation, with consistent peaks around 12:00 and 18:00, and greater volatility at other times. These findings support the need for rational scheduling of testing hours, allowing for compressed operational windows that match actual crowd demand and help mitigate large-scale gatherings. The results also suggest site-type-specific strategies: For BX-type sites (general public access), extending service windows during peak periods (12:00 and 18:00) can improve throughput and reduce congestion. For B1X-type sites (policy-driven testing), service hours should be adjusted dynamically in accordance with government mandates. For CX-type sites (serving travelers and service personnel), a more balanced spatial distribution is required to avoid over-concentration in certain areas. Overall, the service schedule of testing sites should be closely aligned with the spatiotemporal activity rhythms of nearby populations. During expected peak hours, a dual adjustment strategy, including early opening and delayed closing, can help absorb testing pressure and ensure smoother crowd dispersion.
5.2. Spatial Layout Strategy
This study combines an ant colony algorithm and GIS analysis to optimize spatial layout, which makes up for the shortcomings of traditional static planning and pure algorithmic models. Meanwhile, based on the real data for high-density cities, a dual optimization framework of “temporal elasticity+ spatial dynamics” is proposed, which provides a replicable template for similar cities. Unlike other current research aspects, such as optimizing the layout of emergency facilities through multi-source data and multi-stage algorithms, this study emphasizes high precision [45,46]. In contrast, our framework is lightweight and operationally replicable, requiring minimal input data and low computational cost, which supports rapid deployment in emergency scenarios. Meanwhile, prior studies on emergency facility placement have often relied on static models such as the Location Set Covering Problem (LSCP) [47], p-Median [48], or maximal covering formulations (MCLP) [49,50], which optimize coverage under fixed demand distributions. While effective in ensuring minimum service levels, these approaches assume static population profiles and rarely capture real-time mobility dynamics. In contrast, our model incorporates path-based simulation and demand-weighted routing behavior through ACO, providing adaptive spatial solutions that reflect actual origin–destination patterns. Compared to gravity models or kernel density-based estimations, our approach is also capable of replicating behavioral variability under time-constrained or policy-sensitive conditions.
The results reveal several key challenges in the current spatial distribution of crowd influx at nucleic acid testing sites, including insufficient coverage in peripheral areas, inadequate access in residential zones, uneven demand across sites, and redundant resource allocation in overlapping service areas. To address these issues and optimize emergency infrastructure deployment with minimal resource expenditure, the study incorporated the principles of two complementary GIS-based location–allocation models—the Minimum Facility model and the Maximum Coverage model—as heuristic guidelines within the overall workflow rather than as complete, standalone optimization formulations. The Minimum Facility principle was applied to minimize the number of candidate points required to achieve target coverage thresholds in each grid cell, while the Maximum Coverage principle guided the redistribution of facilities toward underserved areas to maximize the population served within available resources. These principles were embedded in the POI correlation and population density validation stages, respectively, and implemented through rule-based adjustments rather than exact mathematical programming, enabling the framework to retain the conceptual strengths of both models while remaining lightweight and adaptable.
The optimization process consists of four main components: ① POI correlation analysis: The entire Macao SAR was divided into 300 m grids. Within each grid, POI density was recalculated based on a 0.09 km2 moving window and weighted by functional significance. Densities were then visualized using graduated dot symbols—larger dots indicate higher POI concentration (ranging from 1 to 28 POIs per 0.09 km2). These POI clusters were used to generate initial facility candidates, each located at the centroid of a high-density grid, with the grid itself representing the facility’s initial service area. ② OD interference adjustment: The locations derived from POI clustering were further corrected using simulated OD paths. Each candidate testing site was adjusted to its nearest OD route to enhance alignment with real mobility flows. While the overall site layout remained topologically stable, the adjustment improved each site’s accessibility to primary population corridors. ③ Commercial–residential tandem strategy: In core residential and commercial zones, additional testing sites were introduced to ensure full coverage within the predefined service radius. Particular attention was paid to nodes near major transportation corridors to enhance multimodal accessibility and alleviate pressure at peak periods. ④ Population density validation: The optimized layout was overlaid onto Macao’s population density map to verify service coverage in high-density residential areas. Coupled with synchronized temporal scheduling strategies, this integrated approach is expected to improve testing efficiency and spatial equity (Figure 11). In general, spatial comparison between the current arrangement Figure 8c and the optimized configuration Figure 11f reveals several improvements. The optimized layout redistributes facilities away from over-served central zones toward underserved peripheral areas, increasing coverage in residential neighborhoods on the southern islands. In addition, facilities are repositioned to better align with high OD flow corridors, thereby improving potential accessibility for transient and commuting populations. Importantly, the revised configuration achieves these gains without sacrificing coverage in high-demand central districts, suggesting that the proposed method can yield more balanced and behaviorally aligned service provision than the existing arrangement.
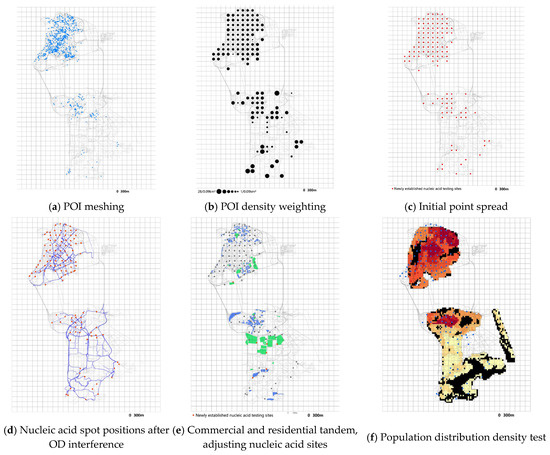
Figure 11.
POI analysis of different functional areas.
“Initial point spread”: the study area was divided into 300 m × 300 m grids, and POI density in each cell was calculated (POIs per 0.09 km2) and normalized to 0–1. Initial facility points were placed at grid centroids in proportion to POI density, with a maximum of three points per cell to avoid clustering. “OD interference”: these points were adjusted using ACO-simulated OD path densities. OD paths were rasterized at the same resolution, smoothed with a 100 m kernel, and the top 20% density cells were marked as high-mobility corridors. Points outside these corridors were relocated to the nearest high-density OD path vertex, selecting the one closest to the original high-POI grid centroid when multiple options existed. This two-step adjustment aligns facilities with both functional hotspots and major movement flows, improving coverage and accessibility.
5.3. Research Limitations and Perspectives
This study proposes a dynamic optimization strategy for nucleic acid testing site deployment in Macao, based on spatiotemporal data and multidimensional analysis methods. However, several limitations should be acknowledged: ① Data coverage limitations: The primary dataset used in this study was derived from six consecutive days of reservation records from the government system. As a result, the analysis does not account for unregistered individuals or sudden testing demands triggered by emergent policy shifts or outbreak events. This constraint may lead to partial underrepresentation of actual population dynamics. As such, the goal of this study is not to generalize across all urban time scales, but rather to demonstrate the operational feasibility of spatiotemporal optimization under short-term, high-intensity demand conditions. Future studies will incorporate multi-month data and before–after validation experiments to test longitudinal generalizability. ② Simplified model assumptions: The proposed workflow is heuristic in nature and therefore does not guarantee a globally optimal solution. Nevertheless, its transparency, low computational cost, and adaptability to multi-source data make it well-suited for emergency planning in compact urban environments. Building on this foundation, future research could integrate the different stages into a formal multi-objective optimization framework to strengthen the coupling among analytical dimensions. Within this framework, although the ACO algorithm effectively simulates OD flows, the current implementation relies on simplified behavioral assumptions and does not fully capture complex real-world factors such as behavioral heterogeneity, policy shocks, and inter-site dependencies. This may limit the model’s responsiveness to dynamic disruptions in actual deployment scenarios. ③ Challenges in real-time dynamic adjustment: Although the proposed framework incorporates dynamic population behavior through OD flow simulation, its validation currently relies on overlaying the optimized layout with static population density data. This limitation arises from the lack of multi-day or time-resolved movement datasets for the study period, which prevents direct quantification of the temporal advantages of the dynamic approach over a static baseline. Furthermore, the time-phased optimization strategy is primarily based on historical data and does not yet integrate real-time crowd monitoring or automated feedback mechanisms. The current model framework does not explicitly incorporate emerging technologies such as IoT sensors, AI-based demand forecasting, or real-time adaptive control, which could significantly improve responsiveness in live deployment scenarios. To address these limitations, future research will focus on integrating real-time data streams and predictive modeling tools to enhance adaptability, and on developing dynamic validation metrics such as peak-hour coverage rates, time-varying accessibility indices, and observed–simulated OD flow match rates. In addition, a comparative before–after analysis will be conducted to empirically evaluate the effectiveness of the proposed spatial layout strategy, using indicators including service coverage rate, population–facility match rate, and spatial redundancy index. These enhancements are expected to improve both the empirical robustness and the operational feasibility of the model in real-world applications.
The findings of this study offer practical implications for integrating dynamic spatial planning into urban emergency infrastructure strategies, particularly within the framework of 15 min city design. ① Dynamic resource allocation: Testing site hours and capacity should be flexibly adjusted based on temporal population tides (e.g., peaks at 12:00 and 18:00) rather than static administrative schedules. ② Behavior-based siting: OD-based mobility simulation can inform more responsive site placement than traditional density or zoning-based siting models. ③ Coverage equity: Residential areas, especially in southern subdistricts, exhibited under-coverage despite high POI clustering. Prioritizing residential accessibility aligns with the equity principles of the 15 min city model. ④ Replicability in micro-cities: The proposed lightweight framework can be adapted to other high-density, small-footprint cities lacking large-scale urban simulation infrastructure. ⑤ Dual-use planning: Integration of emergency and routine infrastructure (e.g., health stations within community centers) can reduce redundancy and improve readiness without increasing urban footprint.
6. Conclusions
This study analyzes the spatiotemporal dynamics of crowd gatherings at nucleic acid testing sites in the Macao Special Administrative Region by integrating testing facility data with geographic information. The spatial characteristics of residential trajectories, surrounding commercial functions, and local population densities serve as key determinants in shaping facility usage. As a high-density micro-city, Macao offers paradigm significance in terms of compact urban form, infrastructure saturation, and data accessibility. Empirical findings derived from 2592 time-series reservation records indicate that over 80% of testing sites exhibited significant daily fluctuations in demand, with stable peaks around 12:00 and 18:00. Among the site types, BX-type facilities (serving the general public) showed the highest temporal variance, while CX-type sites remained relatively stable. Spatial mismatch analysis revealed coverage gaps in southern residential zones (60%), compared to near-complete coverage (91–100%) in northern educational and commercial areas. Furthermore, the ACO-based OD simulation model demonstrated high empirical validity, achieving 78% path-level similarity with official routing networks and 73% spatial overlap with actual reservation origins. These results confirm the model’s strong capacity to replicate real-world population movement patterns with operational reliability. The conclusions are as follows: ① Temporal dimension: Testing demand fluctuates in alignment with population rest and activity cycles, exhibiting regular peak periods. ② Spatial dimension: Demand variation is influenced by the surrounding land-use context, particularly in commercial and residential zones. ③ POI coupling: While testing sites broadly align with the city’s main activity centers, spatial correlation with residential and educational areas remains suboptimal. Overall, the current layout of nucleic acid testing facilities in Macao is reasonably effective in dispersing crowds and minimizing congestion. However, persistent peak-hour surges underscore the need for a refined spatiotemporal optimization strategy that closely reflects population mobility rhythms and functional land-use patterns.
Author Contributions
Conceptualization, Zhen Wang; Methodology, On Kei Yeung, Mengmeng Zheng and Yitao Zhong; Software, On Kei Yeung and Zheyu Wang; Formal analysis, Zhen Wang, Zheyu Wang and Mengmeng Zheng; Resources, Yitao Zhong; Writing—original draft, Zheyu Wang, On Kei Yeung, Mengmeng Zheng and Yitao Zhong; Writing—review & editing, Zheyu Wang; Supervision, Sanqing He; Project administration, Sanqing He; Funding acquisition, Zhen Wang and Sanqing He. All authors have read and agreed to the published version of the manuscript.
Funding
This study was supported by the National Natural Science Foundation Project of China (Grant Number: 52078229).
Data Availability Statement
Data will be made available on request.
Conflicts of Interest
The authors declare no conflict of interest.
References
- Wang, Z.; Wang, X.; Wang, W.; Deveci, W.; Wu, Z.; Pedrycz, W. Consensus reaching-based decision model for assessing resilient urban public health safety ecosystem with social network analysis. J. Ind. Inf. Integr. 2024, 42, 100716. [Google Scholar] [CrossRef]
- Meduri, Y.; Singh, R.; Manoharan, G. Key networks to create disaster resilient Smart Cities Mission: A case for remodeling India’s Smart Cities Mission to include disaster resilience. Resilient Cities Struct. 2024, 3, 52–62. [Google Scholar] [CrossRef]
- Martínez, L.; Short, J.R. The pandemic city: Urban issues in the time of COVID-19. Sustainability 2021, 13, 3295. [Google Scholar] [CrossRef]
- Kleinschroth, F.; Kleinschroth, Z.; Savilaakso, S.; Kowarik, I.; Martinez, P.; Chang, Y.; Jakstis, K.; Schneider, J.; Fischer, L. Global disparities in urban green space use during the COVID-19 pandemic from a systematic review. Nat. Cities 2024, 1, 136–149. [Google Scholar] [CrossRef]
- Ahern, J. From fail-safe to safe-to-fail: Sustainability and resilience in the new urban world. Landsc. Urban Plan. 2011, 100, 341–343. [Google Scholar] [CrossRef]
- Chen, C.; Chen, C.; Zhao, D.; He, F.; Sun, F. A comprehensive multi-hazard risk assessment model for urban agglomeration with multiple factors. J. Saf. Sci. Resil. 2023, 4, 43–51. [Google Scholar] [CrossRef]
- Liu, S.-C.; Peng, F.; Qiao, Y.; Zhang, J. Evaluating disaster prevention benefits of underground space from the perspective of urban resilience. Int. J. Disaster Risk Reduct. 2021, 58, 102206. [Google Scholar] [CrossRef]
- Venter, Z.S.; Barton, D.N.; Gundersen, V.; Figari, H.; Nowell, M. Urban nature in a time of crisis: Recreational use of green space increases during the COVID-19 outbreak in Oslo, Norway. Environ. Res. Lett. 2020, 15, 104075. [Google Scholar] [CrossRef]
- Machado, C.; Melina Nassif Mantovani Ribeiro, D.; Backx Noronha Viana, A. Public health in times of crisis: An overlooked variable in city management theories? Sustain. Cities Soc. 2021, 66, 102671. [Google Scholar] [CrossRef]
- Shahin, M.; Chen, F.; Hosseinzadeh, A.; Maghanaki, M. Deploying deep convolutional neural network to the battle against cancer: Towards flexible healthcare systems. Inform. Med. Unlocked 2024, 47, 101494. [Google Scholar] [CrossRef]
- Sumrit, D. An investigation of the impact of organizational big data analytics capabilities on healthcare supply chain resiliency. Healthc. Anal. 2025, 7, 100393. [Google Scholar] [CrossRef]
- Marconi, P.L.; Perelman, P.E.; Salgado, V.G. Green in times of COVID-19: Urban green space relevance during the COVID-19 pandemic in Buenos Aires City. Urban Ecosyst. 2022, 25, 941–953. [Google Scholar] [CrossRef]
- Zhang, Y.; Liu, Q.; Li, X.; Zhang, X.; Qiu, Z. Spatial-temporal evolution characteristics and critical factors identification of urban resilience under public health emergencies. Sustain. Cities Soc. 2024, 102, 105221. [Google Scholar] [CrossRef]
- Chen, T.-L.; Li, Y.-E. Building urban resilience: Lessons from the COVID-19 pandemic for future-proofing city infrastructure. J. Urban Manag. 2024; in press. [Google Scholar] [CrossRef]
- Zhao, Y.; Zhou, Y. Isochrone-Based Accessibility Analysis of Pre-Hospital Emergency Medical Facilities: A Case Study of Central Districts of Beijing. ISPRS Int. J. Geo-Inf. 2024, 13, 288. [Google Scholar] [CrossRef]
- Wang, S.; Sun, Q.; Chen, P.; Qiu, H.; Chen, Y. Location scheme of routine nucleic acid testing sites based on location-allocation models: A case study of Shenzhen City. ISPRS Int. J. Geo-Inf. 2023, 12, 152. [Google Scholar] [CrossRef]
- Wang, J.; Pan, Z.; Tang, H.; Guo, W. Assessment of airborne viral transmission risks in a large-scale building using onsite measurements and CFD method. J. Build. Eng. 2024, 95, 110222. [Google Scholar] [CrossRef]
- Xiao, P.; Xiao, P.; Zhao, D.; Shen, S.; Liao, Q.; Wang, W.; Cao, Y.; Liao, J.; Lv, X.; Liu, Y.; et al. Insights into the risk of COVID-19 infection in urban neighborhood and its environmental influence factors: A novel approach. Sustain. Cities Soc. 2024, 106, 105383. [Google Scholar] [CrossRef]
- Barbosa, V.; Thoene, U.; Alonso, R.; Chaparro, P. A space syntax approach: Covid-19 and socio-spatial inequalities in Bogotá, Colombia. ACE Archit. City Environ. 2023, 18, 11702. [Google Scholar] [CrossRef]
- Zhang, C.; Hu, Y.; Adams, M.; Bu, R.; Xiong, Z.; Liu, M.; Du, Y.; Li, B.; Li, C. Distribution patterns and influencing factors of population exposure risk to particulate matters based on cell phone signaling data. Sustain. Cities Soc. 2023, 89, 104346. [Google Scholar] [CrossRef]
- Yang, Y.; Fu, M.; Dong, R.; Xie, F.; Ren, X. Towards a transformation in urban commuting analysis with high-precision mobile phone signaling data: Identifying commuting characteristics based on individual scale. Front. Archit. Res. 2025, 14, 560–580. [Google Scholar] [CrossRef]
- Chung, Y.; Nam, S. Decomposition of travel time expenditure through individual mobility trajectories based on mobile phone signaling data. Travel Behav. Soc. 2024, 34, 100702. [Google Scholar] [CrossRef]
- Luo, Z.; Marchi, L.; Chen, F.; Zhang, Y.; Gaspari, J. Correlating urban spatial form and crowd spatiotemporal behavior: A case study of Lhasa, China. Cities 2025, 160, 105812. [Google Scholar] [CrossRef]
- Shi, R.; Luo, J.; Zhou, N.; Liu, Y.; Hong, C.; Zhang, X.; Chen, X. Phy-APMR: A physics-informed air pollution map reconstruction approach with mobile crowd-sensing for fine-grained measurement. Build. Environ. 2025, 272, 112634. [Google Scholar] [CrossRef]
- Xie, C.-Z.T.; Chen, Q.; Zhu, B.; Lee, E.; Tang, T.; Yin, X.; Yuan, Z.; Zhang, B. Coordinating dynamic signage for evacuation guidance: A multi-agent reinforcement learning approach integrating mesoscopic crowd modeling and fire propagation. Chaos Solitons Fractals 2025, 194, 116246. [Google Scholar] [CrossRef]
- Han, B.; Hu, W.; Tang, X.; Zheng, J.; Hu, M.; Li, Z. Optimization of pre-hospital emergency facility layout in Nanjing: A spatiotemporal analysis using multi-Source big data. Int. J. Appl. Earth Obs. Geoinf. 2024, 133, 104112. [Google Scholar] [CrossRef]
- Takedomi, S.; Ishigaki, T.; Hanatsuka, T.; Mori, T. Facility location optimization with pMP modeling incorporating waiting time prediction function for emergency road services. Comput. Ind. Eng. 2022, 164, 107859. [Google Scholar] [CrossRef]
- Jia, H.; Ordóñez, F.; Dessouky, M. A modeling framework for facility location of medical services for large-scale emergencies. IIE Trans. 2007, 39, 41–55. [Google Scholar] [CrossRef]
- Wang, Z.; Li, H.; Zhu, S. Analysis on the Location of Emergency Medical Facilities: Taking Urban District of Handan City as an Example. J. Hum. Settl. West China 2022, 37, 69–75. [Google Scholar]
- Li, Z.; Quan, S.J.; Yang, P.P.-J. Energy performance simulation for planning a low carbon neighborhood urban district: A case study in the city of Macau. Habitat Int. 2016, 53, 206–214. [Google Scholar] [CrossRef]
- Zhang, R.; Li, Y.; Chen, T.; Zhou, L. Flood risk identification in high-density urban areas of Macau based on disaster scenario simulation. Int. J. Disaster Risk Reduct. 2024, 107, 104485. [Google Scholar] [CrossRef]
- Ma, C.; Song, M.; Zeng, W.; Wang, X.; Chen, T.; Wu, S. Enhancing urban emergency response: A Euclidean distance-based framework for optimizing rescue facility layouts. Sustain. Cities Soc. 2025, 118, 106006. [Google Scholar] [CrossRef]
- Chinese Society of Urban Planning. Emergency Planning Guidelines for Community Living Areas for Epidemic Preparedness. Official Release, 4 January 2023. [Google Scholar]
- Li, Q.; Xiang, Z.; Bai, H.; Ban, P. Study on the coupling relationship between the spatial layout of emergency medical facilities and population under public health emergencies—A case study of nucleic acid testing sites in Kunming. Settlement 2023, 117, 161–169. [Google Scholar]
- Zhou, L.; Li, Y.; Cheng, J.; Qin, Y.; Shen, G.; Li, B.; Yang, H.; Li, S. Understanding the aesthetic perceptions and image impressions experienced by tourists walking along tourism trails through continuous cityscapes in Macau. J. Transp. Geogr. 2023, 112, 103703. [Google Scholar] [CrossRef]
- Wen, J.; Huang, S.S.; Ying, T. Relationships between Chinese cultural values and tourist motivations: A study of Chinese tourists visiting Israel. J. Destin. Mark. Manag. 2019, 14, 100367. [Google Scholar] [CrossRef]
- Li, G.; Liu, C.; Wu, L.; Xiao, W. A mixing algorithm of ACO and ABC for solving path planning of mobile robot. Appl. Soft Comput. 2023, 148, 110868. [Google Scholar] [CrossRef]
- Yan, F. Autonomous vehicle routing problem solution based on artificial potential field with parallel ant colony optimization (ACO) algorithm. Pattern Recognit. Lett. 2018, 116, 195–199. [Google Scholar] [CrossRef]
- Gawas, M.A.; Govekar, S.S. A novel selective cross layer based routing scheme using ACO method for vehicular networks. J. Netw. Comput. Appl. 2019, 143, 34–46. [Google Scholar] [CrossRef]
- Luo, W.; Wang, F. Measures of spatial accessibility to health care in a GIS environment: Synthesis and a case study in the Chicago region. Environ. Plan. B Plan. Des. 2003, 30, 865–884. [Google Scholar] [CrossRef]
- Apparicio, P.; Abdelmajid, M.; Riva, M.; Shearmur, R. Comparing alternative approaches to measuring the geographical accessibility of urban health services: Distance types and aggregation-error issues. Int. J. Health Geogr. 2008, 7, 7. [Google Scholar] [CrossRef]
- Hu, Y.; Liu, Q.; Li, S.; Wu, W. Robust emergency logistics network design for pandemic emergencies under demand uncertainty. Transp. Res. Part E Logist. Transp. Rev. 2025, 196, 103957. [Google Scholar] [CrossRef]
- Palomino-Perez, Y.; Rojas, M.; Amaya-Mier, R. Design of a reverse logistics network for medical waste considering location and routing decisions. J. Clean. Prod. 2024, 474, 143592. [Google Scholar] [CrossRef]
- Yaspal, B.; Jauhar, S.; Kamble, S.; Belhadi, A.; Tiwari, S. A data-driven digital transformation approach for reverse logistics optimization in a medical waste management system. J. Clean. Prod. 2023, 430, 139703. [Google Scholar] [CrossRef]
- Choudhury, N.A.; Ramkumar, M.; Schoenherr, M.; Singh, S. The role of operations and supply chain management during epidemics and pandemics: Potential and future research opportunities. Transp. Res. Part E Logist. Transp. Rev. 2023, 175, 103139. [Google Scholar] [CrossRef]
- Pan, C.; Yue, H.; Zhu, L.; Ma, G.; Wang, H. Prophylactic vaccine delivery systems against epidemic infectious diseases. Adv. Drug Deliv. Rev. 2021, 176, 113867. [Google Scholar] [CrossRef]
- Meng, L.; Wang, X.; He, J.; Han, C.; Hu, S. A two-stage chance constrained stochastic programming model for emergency supply distribution considering dynamic uncertainty. Transp. Res. Part E Logist. Transp. Rev. 2023, 179, 103296. [Google Scholar] [CrossRef]
- Choi, M.; Jung, H.; Lee, H. Determining the optimum service area and station location for personal mobility sharing services. KSCE J. Civ. Eng. 2021, 25, 3966–3976. [Google Scholar] [CrossRef]
- Wei, L.; Li, W.; Li, K.; Liu, H.; Cheng, L. Decision support for urban shelter locations based on covering model. Procedia Eng. 2012, 43, 59–64. [Google Scholar] [CrossRef]
- Fattah, M.A.; Morshed, S.; Morshed, S.; Hoque, M.; Haque, M. The impact of urban street median in pedestrian behavior and traffic flow: Experience from a growing city Khulna, Bangladesh. Transp. Eng. 2021, 6, 100090. [Google Scholar] [CrossRef]


Disclaimer/Publisher’s Note: The statements, opinions and data contained in all publications are solely those of the individual author(s) and contributor(s) and not of MDPI and/or the editor(s). MDPI and/or the editor(s) disclaim responsibility for any injury to people or property resulting from any ideas, methods, instructions or products referred to in the content. |
© 2025 by the authors. Published by MDPI on behalf of the International Society for Photogrammetry and Remote Sensing. Licensee MDPI, Basel, Switzerland. This article is an open access article distributed under the terms and conditions of the Creative Commons Attribution (CC BY) license (https://creativecommons.org/licenses/by/4.0/).