Article

Identification of Abandoned Tea Lands in Kandy District, Sri Lanka Using Trajectory Analysis and Satellite Remote Sensing

by
Sirantha Jagath Kumara Athauda
1,* and
Takehiro Morimoto
2
1
Graduate School of Science and Technology, University of Tsukuba, 1-1-1, Tennodai, Tsukuba 305-8572, Japan
2
Institute of Life and Environmental Sciences, University of Tsukuba, 1-1-1, Tennodai, Tsukuba 305-8572, Japan
*
Author to whom correspondence should be addressed.
ISPRS Int. J. Geo-Inf. 2025, 14(8), 312; https://doi.org/10.3390/ijgi14080312
Submission received: 25 June 2025 / Revised: 10 August 2025 / Accepted: 14 August 2025 / Published: 15 August 2025

Abstract

Tea is a prominent cash crop in global agriculture, and it is Sri Lanka’s top agricultural export known as ‘Ceylon Tea,’ employing nearly one million people, with land covering an area of 267,000 ha. However, over the past decade, many tea lands in Sri Lanka have been abandoned, leading to a gradual decline in production. This research aims to identify, map, and verify tea land abandonment over time and space by identifying and analyzing a series of land use trajectories with Landsat, Google Earth, and PlanetScope imageries to provide a substantial knowledge base. The study area covers five Divisional Secretariats Divisions in Kandy District, Central Highlands of Sri Lanka: Delthota, Doluwa, Udapalatha, Ganga Ihala Korale, and Pasbage Korale, where around 70% of the tea lands in Kandy District are covered. Six land use/cover (LULC) classes were considered: tea, Home Garden and Other Crop, forest, grass and bare land, built-up area, and Water Body. Abandoned tea lands were identified if the tea land was converted to another land use between 2015 and 2023. The results revealed the following: (1) 85% accuracy in LULC classification, revealing tea as the second-largest land use. Home Garden and Other Crop dominated, with an expanding built-up area. (2) The top 22 trajectories dominating the tea trajectories were identified, indicating that tea abandonment peaked between 2017 and 2023. (3) In total, 12% (5457 ha) of pixels were identified as abandoned tea lands during the observation period (2015–2023) at an accuracy rate of 94.7% in the validation. Significant changes were observed between the two urban centers of Gampola and Nawalapitiya towns. (4) Tea land abandonment over 7 years was the highest at 35% (1892.3 ha), while 5-year and 3-year periods accounted for 535.4 ha and 353.6 ha, respectively, highlighting a significant long-term trend. (5) The predominant conversion observed is the shift in tea towards Home Garden and Other Crop (2986.2 ha) during the timeframe. The findings underscore the extent and dynamics of tea land abandonment, providing critical insights into the patterns and characteristics of abandoned lands. This study fills a key research gap by offering a comprehensive spatial analysis of tea land abandonment in Sri Lanka. The results are valuable for stakeholders in the tea industry, providing essential information for sustainable management, policy-making, and future research on the spatial factors driving tea land abandonment.

1. Introduction

Tea (Camellia sinensis) stands as a prominent cash crop in global agriculture, with cultivation spanning approximately 50 countries across a total area of 4.8 million hectares (ha) [1]. Key cultivating countries in 2023 include China, India, Sri Lanka, Kenya, and Vietnam. From these, Kenya leads in tea exports in the world [2]. Beyond its economic significance, tea holds a global reputation as one of the most extensively consumed health beverages, second only to water [3,4]. The growing global demand for tea is driving the expansion of tea-cultivating areas, making it a key factor in the socio-cultural and economic dynamics of many nations [5,6,7].
Tea is the top agricultural export in Sri Lanka, known as ‘Ceylon Tea,’ and recognized worldwide as one of the highest-quality teas, primarily as black tea [8,9]. Sri Lanka contributes about 5% to global production and 14% to global exports. In 2023, tea exports generated a total revenue of USD 1310 million from a quantity of 241.9 million kilograms [2]. It was recorded as 11.26% of the export share from the total exports in Sri Lanka [10]. Moreover, the tea industry of Sri Lanka, which is structured into two distinct sectors—the estate sector and the smallholding sector—is a vital part of the country’s economy [11]. It provides employment to nearly one million people, and around 4% of the land area [9], amounting to 267,000 ha, was covered in tea plantations in 2023 [2].
However, over the last decade, many tea lands in Sri Lanka have been abandoned due to various factors, leading to a continuous decline in tea production and revenue loss in the tea industry. In 2000, tea production reached 305.8 million kilograms, increasing to 331.4 million kilograms by 2010. The peak production of 340.2 million kilograms occurred in 2013. Nevertheless, since then, there has been a gradual decline, amounting to a 2.6% decrease based on the Compound Annual Growth Rate (CAGR) [12]. This decline in production has contributed to a downturn in the tea industry. The Sri Lanka Export Development Board [10] reports that export revenue has gradually decreased from USD 1542 million in 2013 to USD 1310 million in 2023. Additionally, Sri Lanka’s global market share in tea has dropped from 28.4% in 1975 to around 18% in 2023. In contrast, from 1976 to 2023, Sri Lanka’s main competitors—Kenya, China, and India—saw significant expansions in their tea cultivation areas [13,14].
A considerable amount of research has been devoted to examining various aspects of tea cultivation, including land use changes, land suitability, socio-economic implications, and environmental influences. For instance, Parida et al. [15] analyzed the dynamics of tea plantations; Hossan et al. [6] explored the transformation of land use into tea plantation areas; and Prokop [16] investigated the impact of large tea plantations on forest cover change. Furthermore, several studies have focused on identifying suitable lands for tea cultivation in different regions of the world [17,18]. In addition, some researchers have examined the socio-economic factors that influence tea farmers’ decisions to adapt tea farming technologies [19], while others have investigated environmental and nutritional factors affecting tea cultivation [20,21]. In the Sri Lankan context, previous studies have evaluated the impact of current and future climate factors on tea cultivation, focusing on climate changes in tea-growing areas [22,23,24,25]. Additionally, some studies have assessed the role of policy in the Sri Lankan tea sector [26,27,28] and the socio-economic aspects of the tea industry [27,29]. Moreover, certain studies have discussed environmental covariates and the utilization of marginal tea lands in Sri Lanka concerning non-spatial aspects [30,31], while others have mapped tea lands using Geographical Information Systems (GISs) and remote sensing (RS) techniques [32]. More recently, efforts have been made to map spatiotemporal dynamics of tea lands in specific regions, estimating the course of tea occurrence and simulating future scenarios [5]. Among these, numerous studies have utilized RS and GIS methods and techniques in their research [5,6,15,18,32].
RS and GIS techniques, combined with trajectory analysis, have proven to be efficient and well-suited for cropland detection and abandonment studies, offering a more precise alternative to traditional methods [33,34]. For example, Wang et al. [35], Song [36], Wang et al. [37], and Yand and Song [38] have employed trajectory analysis with RS and GIS to examine crop land abandonment in China, while Zomlot et al. [39], Mena [40], and Dara et al. [41] have applied these techniques to study crop land abandonment in other regions. However, there has been a lack of studies utilizing trajectory analysis combined with RS and GIS to assess LULC changes or the abandonment of tea cultivation in Sri Lanka. Few studies have addressed this topic, and those that do often focus on other regions [42].
Despite these contributions, significant research gaps remain, particularly in the spatiotemporal identification of abandoned tea lands, analysis of their characteristics, and understanding the factors driving abandonment. Tea-growing regions in Sri Lanka possess diverse landscapes and climates, rendering them vulnerable to degradation and land use changes [24,30,43]. Identifying abandoned tea lands is crucial, as there is currently no comprehensive data on their location and extent. Such information is essential for sustainable management, rehabilitation, and land use planning of tea lands in Sri Lanka. Furthermore, recognizing these lands enables the reintroduction of productive tea cultivation or alternative agricultural uses, which can prevent environmental degradation—such as soil erosion and biodiversity loss—and support economic sustainability and community development, given that tea cultivation is a major economic activity in Sri Lanka.
Building upon these identified research gaps, this study aims to identify, map, and verify tea land abandonment over time and space by analyzing a series of land use trajectories. This approach will provide a critical foundation for future investigations into the factors influencing abandonment in Sri Lanka. Additionally, it will lay the groundwork for subsequent research, facilitating a deeper understanding of the spatial dynamics underlying tea land abandonment.

2. Materials and Methods

2.1. Study Area

Kandy District was chosen as the study area for this research on tea land abandonment for several key reasons. Historically, Kandy holds significant importance as the site of Sri Lanka’s first tea plantation, the Loolkadura estate, marking the beginning of the country’s tea industry. Located in the mid-tea growing region, Kandy was, from the 1960s to the 1990s, home to the highest concentration of tea cultivation in Sri Lanka [14]. However, over the past few decades, tea production in this region has declined significantly. This decline, coupled with the challenges faced by the area in expanding tea cultivation, makes Kandy an ideal location to study tea land abandonment. Additionally, previous studies have highlighted the Gampola tea-growing area within Kandy as having a notably higher proportion of abandoned tea lands compared to other regions in the district [44]. Furthermore, the latest available statistics from 2018 indicate that 40–50% of the tea lands in Kandy have been marginalized due to improper land management and soil degradation, emphasizing the urgency of addressing the issue of land abandonment in this critical tea-growing region [32]. Given these historical, geographical, and socio-economic factors, Kandy provides a reliable and relevant study area to investigate the dynamics of tea land abandonment and its broader implications.
The study area consists of five local administrative divisions called Divisional Secretariats Divisions (DSDs) in Kandy District in the Central Highlands of Sri Lanka. The DSDs are namely Deltota, Doluwa, Udapalatha, Ganga Ihala Korale, and Pasbage Korale, where around 70% of the tea lands in Kandy District are covered. The area is located to the south of the Kandy Municipal Council Area (KMC), which is the largest economic and administrative hub in the central part of Sri Lanka (Figure 1). According to government statistics in 2022, the population is 312,912 [45], and the area has a total land area of 454 km2. Its latitude and longitude coordinates are from 6°56′00″ N to 7°14′30″ N and from 80°27′00″ E to 80°45′20″ E, respectively. The study area mostly belongs to a Wet climate zone, predominantly situated in the Mid-country agro-ecological zone (WM). The prevalent soil types in these areas are red–yellow podzolic soils with a semi-prominent A1 horizon. On the other hand, the southern parts of Doluwa, Udapalatha, and Pasbage Korale DSDs area belong to the Wet Zone Up-country agro-ecological zone (WU). The major soil types in this zone include red–yellow podzolic soil and mountain regosols. Moreover, the Delthota DSD is characterized by the intermediate zone in the Mid-country (IM) and Up-country (IU) climates, featuring reddish-brown earth and immature brown loams soil in the IM climate, and red–yellow podzolic soils, mountain regosol, and lithosol soils in the IU climate. The terrain exhibits steep, hilly, and rolling features. The elevation profile of the study area plays a crucial role in tea cultivation, with a medium elevation ranging from 293 m to 1723 m above sea level as shown in Figure 1.
This area is primarily influenced by the south-western monsoon and two inter-monsoons, with its significant rainfall occurring during the south-western monsoon in May and September. The two inter-monsoonal periods, extending from October to November and March to April, also contribute to this area’s considerable rainfall. The area records a mean annual precipitation of 2121 mm and a mean annual temperature of 24 °C. According to the 1:50,000 topographic maps, the LULC in the study area mostly consists of tea plantations, home gardens, forests with pine plantations, grassland, and rocky areas. Additionally, tea cultivation serves as the predominant agricultural activity in the study area. The study area also consists of two urban centers: Gampola, which belongs to Udapalatha DSD, and Nawalapitiya, which belongs to Pasbage Korale DSD. According to the 2012 Census and Statistics Report [46], the population of the Gampola urban area is 37,819, while the Nawalapitiya urban area is populated by 13,086 residents.

2.2. Data Collection

As the primary dataset, medium-resolution (30 m) Landsat level 2 satellite images, which were radiometrically calibrated and atmospherically corrected, were utilized to map LULC in the study area for each two-year interval from 2015 to 2023. These images were provided by the United States Geological Survey and the National Aeronautics and Space Administration (USGS/NASA). Despite being covered by a single Landsat image, cloud cover in some images was occasionally induced by mountainous terrain. However, clear images characterized by cloud cover of less than 15% were chosen for analysis. The dataset included multispectral bands from Landsat-8 Operational Land Imager (OLI), as well as Landsat-9 OLI-2 images. These images were pre-georectified using the World Geodetic System 1984 and the Universal Transverse Mercator (WGS84/UTM) zone 44 north projection. All the images were selected from the first half of the year to minimize cloud cover and avoid climate or seasonal effects. The details of the selected images are provided in Table 1. Google Earth images (7 m) were utilized for the accuracy assessment of the LULC classification. These images, covering the period from 2015 to 2023, were crucial for verifying the classification results and ensuring their reliability over time.
High-resolution satellite images from PlanetScope (3 m) were used for map validation, as they are ideal for monitoring small-scale land changes, such as identifying abandoned tea lands. Two sets of images in 2023 were downloaded to ensure 0% cloud cover and were then mosaicked to generate the study area, as detailed in Table 2. Moreover, the Digital Elevation Model (DEM) dataset with a 30 m resolution from USGS/NASA was utilized to create a DEM that visualizes the Earth’s surface in a digital, three-dimensional (3D) format, which helps to better understand the topographic characteristics of the study area (Figure 1).
Additionally, the shape file of Sri Lanka’s boundary, Sri Lanka’s Districts, and DSD boundaries were downloaded from the Humanitarian Data Exchange webpage of the United Nations Office for the Coordination of Humanitarian Affairs (OCHA) official website. Furthermore, using the accessibility provided by the University of Tsukuba, ArcGIS online open data were used to make relevant maps in the study area.

2.3. Methods

The study followed a systematic sequence of four key steps. The initial step involved downloading relevant datasets and preparing the data to align with the study area by clipping all datasets to the study area boundary and defining the LULC classes for map classification. Subsequently, the second step entailed classifying the images based on LULC and conducting accuracy assessments using Google Earth images. Moving forward, the third step focused on defining tea land abandonment, detecting trajectories associated with the classified maps, and creating the trajectory map. The final step in the methodology involved identifying relevant trajectories and utilizing the gathered information to detect abandoned tea lands and validate the final output using high-resolution satellite images. ArcGIS 10.8.1 was utilized for geospatial data processing, mapping, and spatial analysis, allowing for a detailed examination of the study area.

2.3.1. Define the Land Use/Cover (LULC) Classes

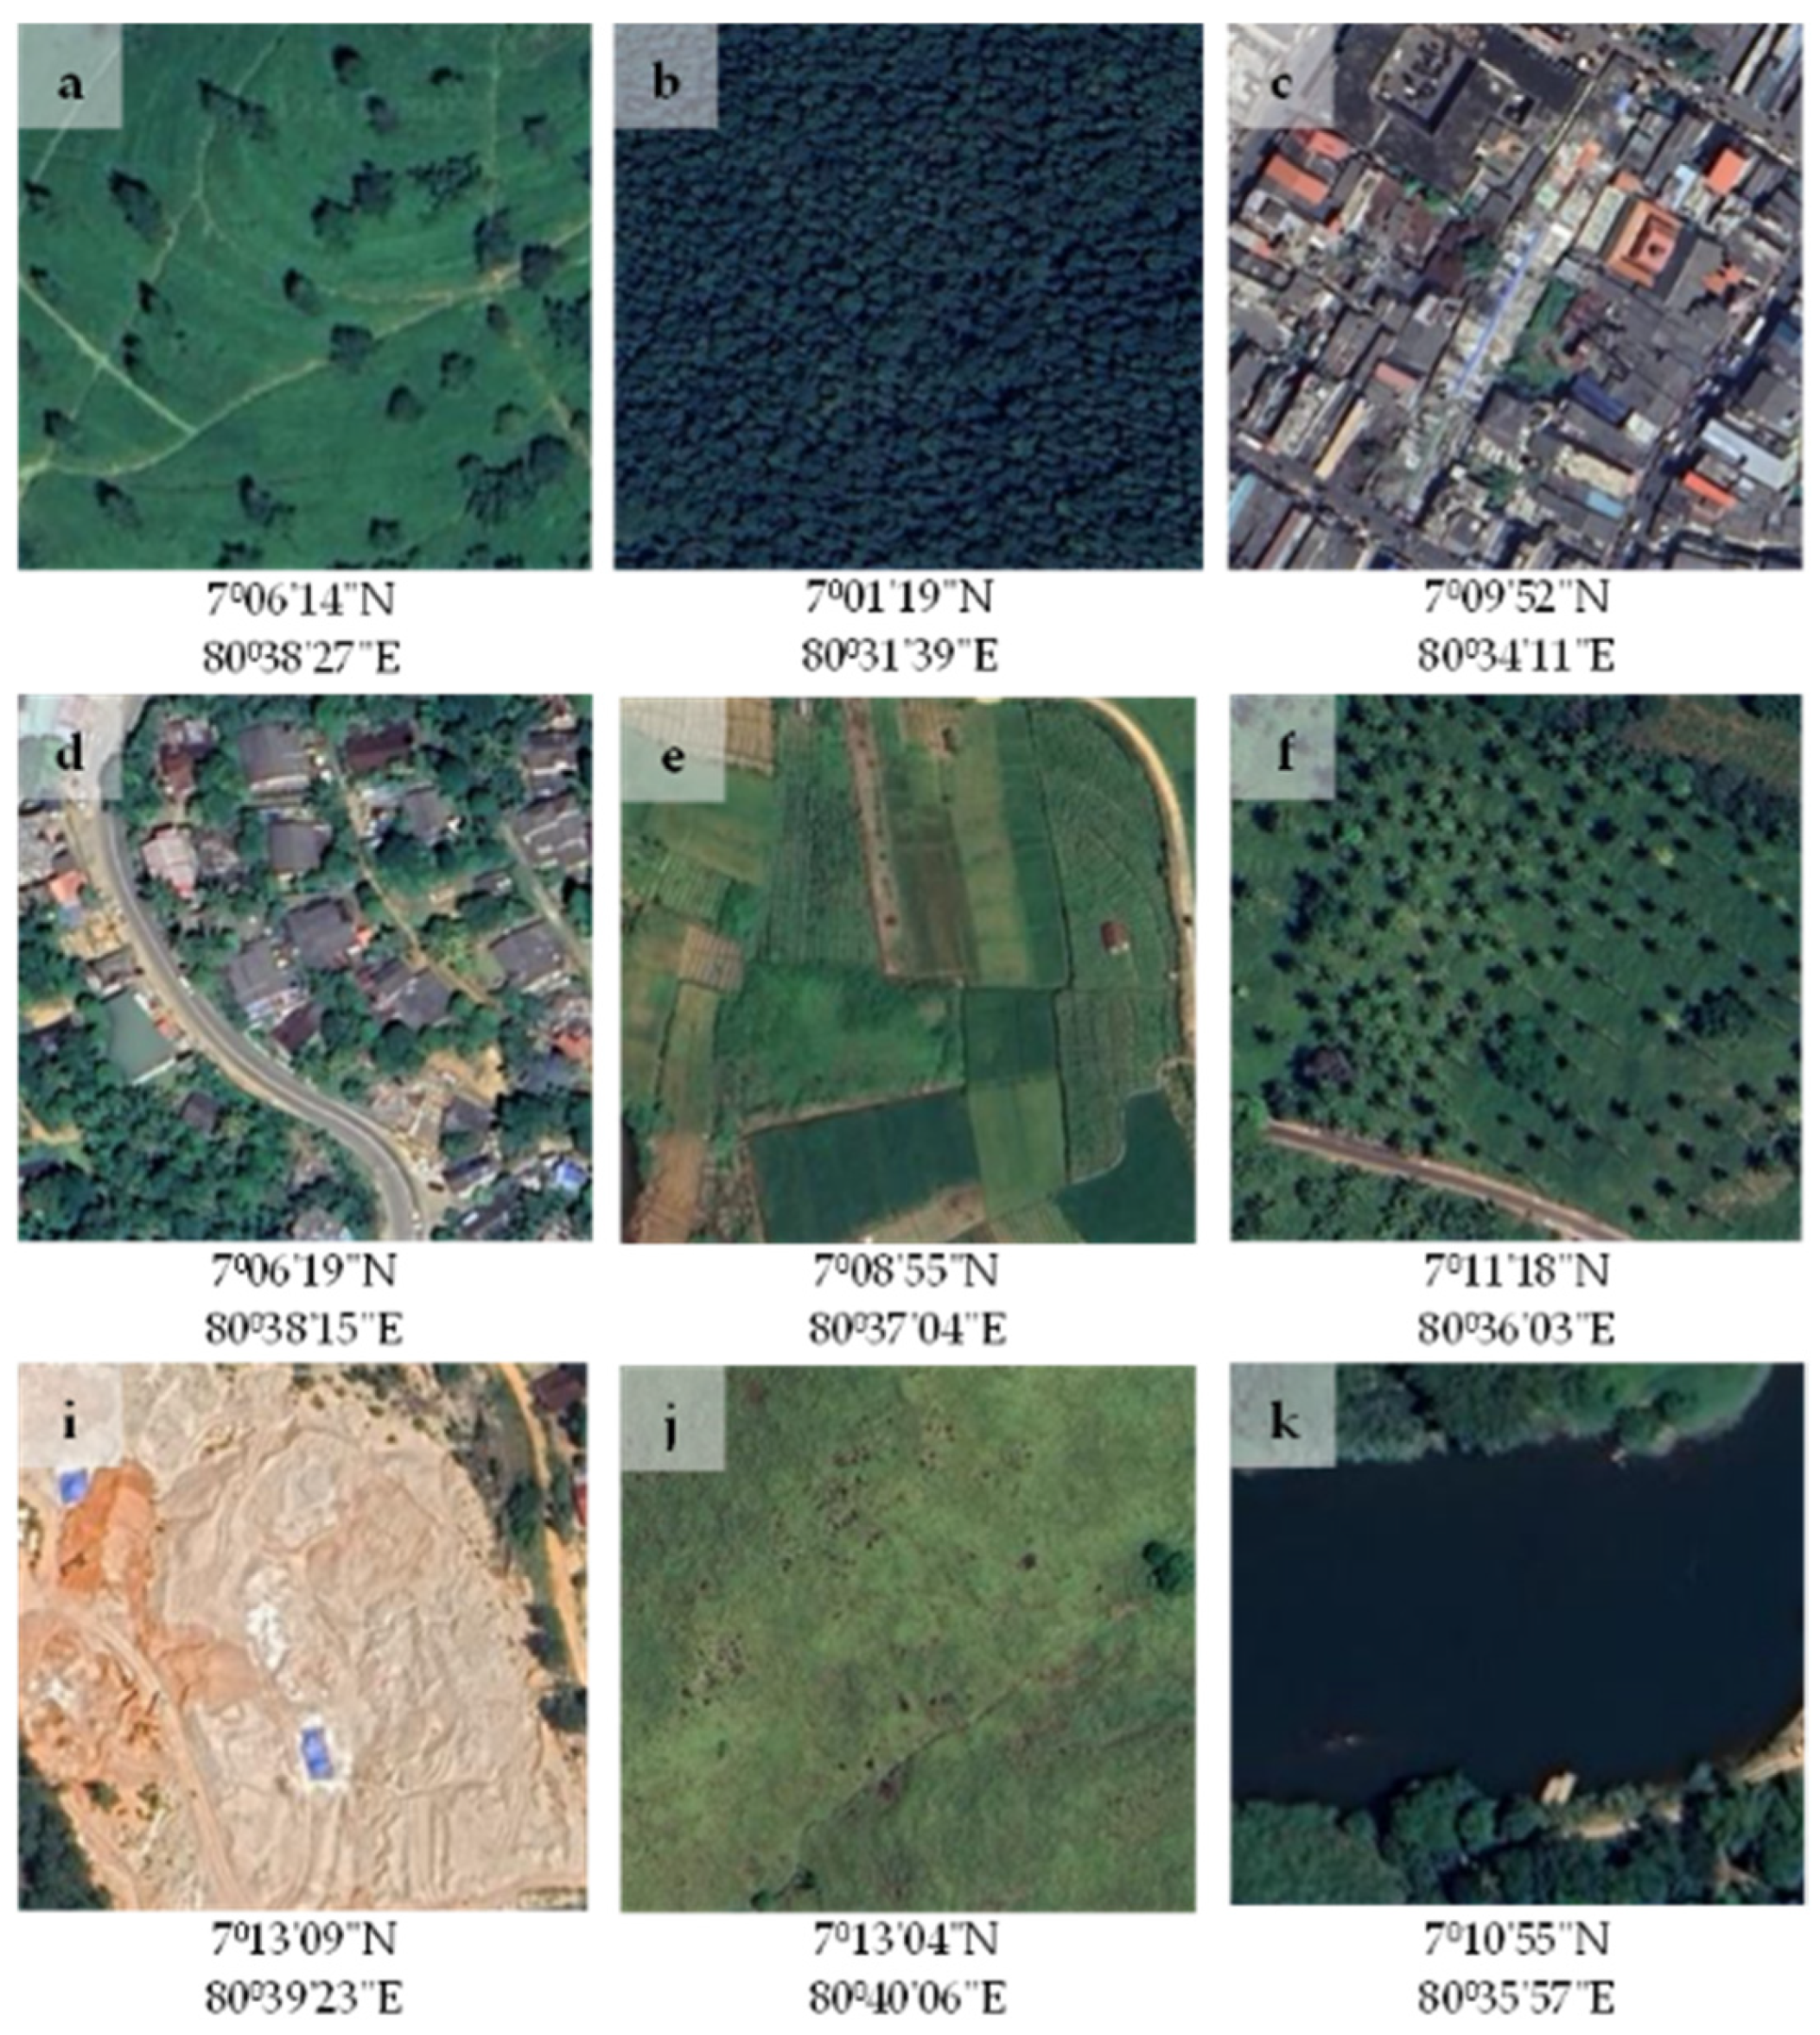
Land cover classification was conducted to identify and categorize six distinct LULC types: tea (T), home gardens and other crops (H), forests (F), grass and bare lands (G), built-up areas (B), and Water Bodies (W) as outlined in Table 3. These LULC classes were identified using 1:50,000 topographic analog maps obtained from the Survey Department of Sri Lanka and supported by some relevant literature. For the years 2015, 2019, 2021, and 2023, the presence of a few small cloud patches in the images led to the classification of Clouds (C) as a separate LULC class, distinct from the six other classes. Figure 2 visually represents the LULC classifications based on the information in Table 3, utilizing images sourced from Google Earth on 20 February 2023, with efforts made to maintain a consistent temporal resolution in the illustrations.

2.3.2. Image Classification Using the Random Forest Classifier

The Random Forest (RF) classifier was used to classify the Landsat images. The RF classifier is a powerful tool widely utilized in image classification, leveraging multiple decision trees. This algorithm excels in handling high-dimensional datasets typical of remote sensing, where numerous spectral bands represent diverse wavelengths. Its robustness to noise and ability to incorporate spatial information make it particularly suited for capturing patterns in LULC. Known for its accuracy, the RF ensemble approach aggregates predictions from multiple decision trees, providing reliable results even in the presence of imbalanced class distributions. Overall, RF classifiers offer a versatile and effective solution for accurate and robust image classification in the field of remote sensing [35,47,48,49].
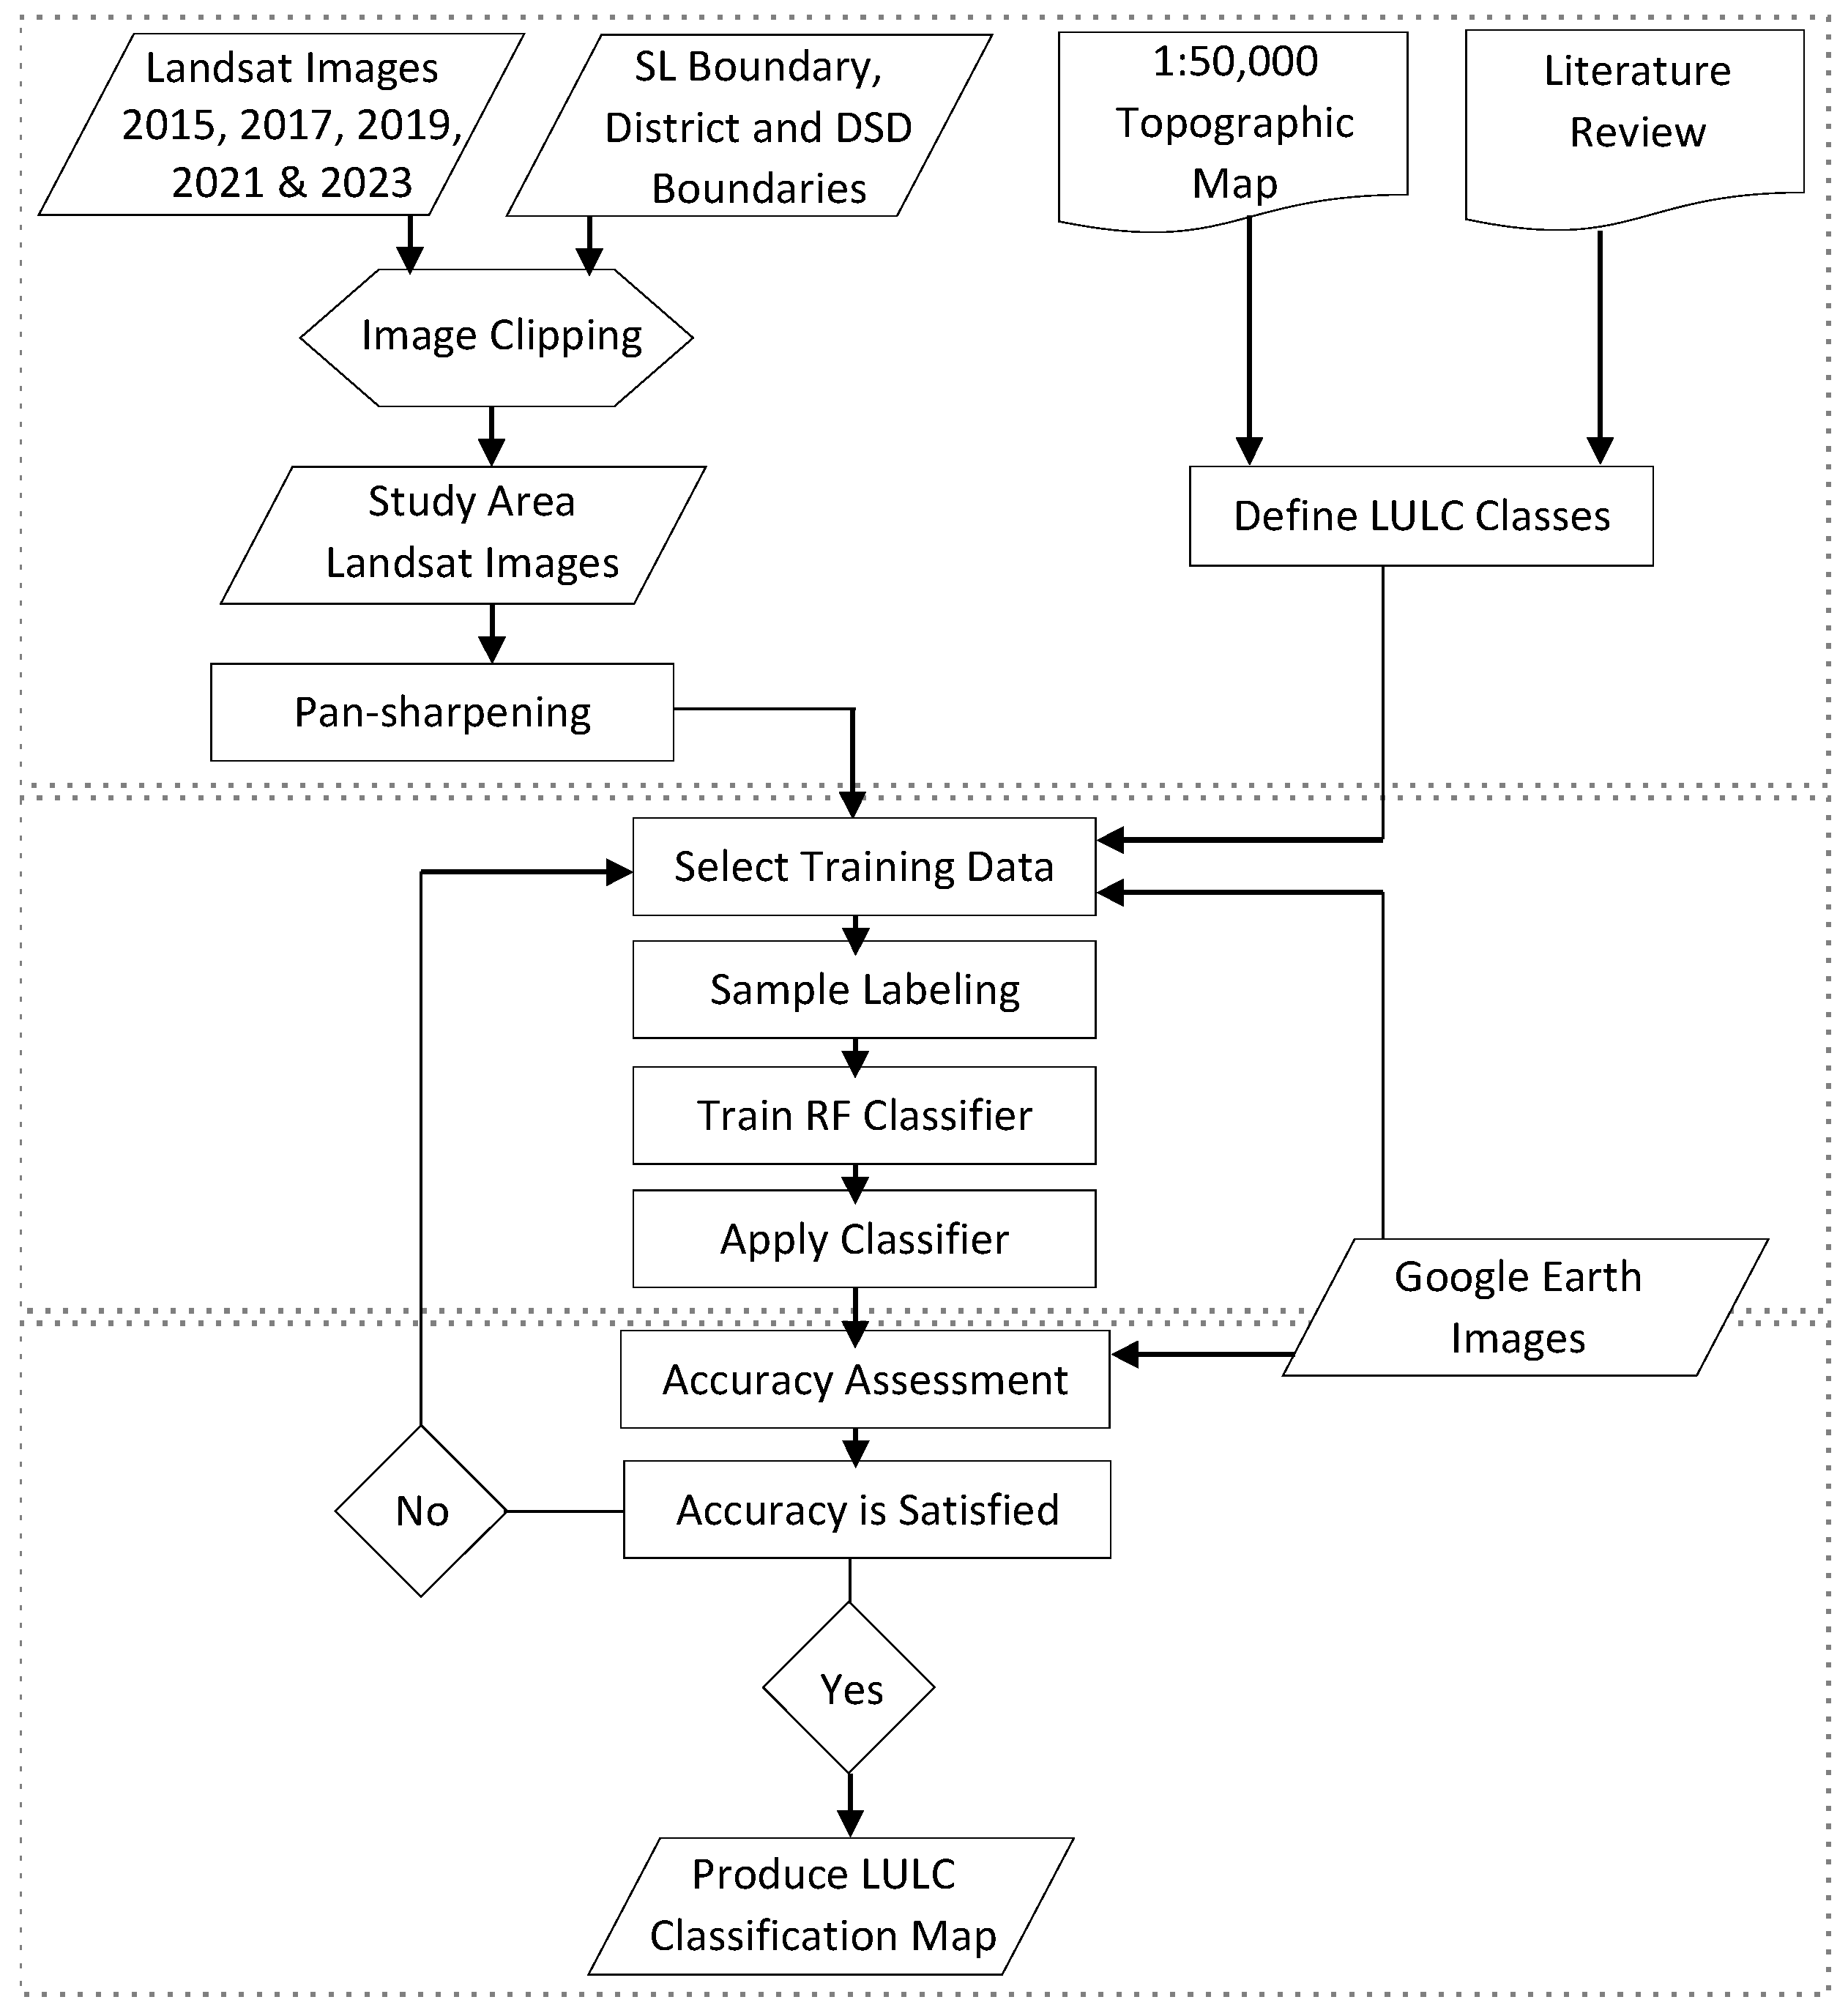
In this study, three key steps were carried out for the RF classification, as illustrated in Figure 3. As the initial step, relevant datasets were prepared by clipping the Landsat imagery to the study area, while the land use/land cover (LULC) classes were defined using 1:50,000 topographic analog maps and a review of the existing literature. Subsequently, training samples representing the major LULC categories were manually selected based on visual interpretation of Google Earth imagery. To enhance spatial detail and ensure accurate class representation, a pan-sharpening technique was applied during this stage. Each training sample was then assigned a corresponding LULC class label to prepare the dataset for supervised classification. The RF model was trained using the labeled samples, with two key parameters configured, as follows: the number of decision trees was set to 50, and the maximum tree depth to 30, in accordance with the default settings in ArcGIS 10.8.1. The trained model was then applied to the full image to produce the final LULC classification map. Finally, for the accuracy assessment, a stratified random sampling approach was employed, generating 200 validation points per year to ensure adequate representation of all LULC types. Google Earth imagery was used as reference data for validation, following established methodologies in previous studies [50,51]. This integrated approach contributed to ensuring the reliability and consistency of the classification outputs across all time periods.

2.3.3. Identification Process of Abandoned Tea Lands

The literature on cropland abandonment highlights a global trend, pointing to a significant increase in abandoned agricultural lands across various regions. It is recognized as an extreme manifestation of cropland marginalization, particularly in areas with challenging geographical conditions like mountainous terrain. Cropland abandonment is also characterized as a complex and gradual process, making it challenging to provide a precise definition. Consequently, based on specific circumstances and regional nuances, scholars present diverse definitions of abandonment. For example, some studies identify abandonment thresholds, considering a cultivation span of at least 2 to 4 years, contingent upon regional specifications [35,36,52,53].
In this study, the criteria for defining abandoned tea land were established by incorporating insights from prior research and considering the unique characteristics of tea cultivation in Sri Lanka. Unlike many other crops, tea cultivation in Sri Lanka does not have a specific ‘fallow period,’ as it is a perennial evergreen crop with an economic lifespan of 50–60 years. The commencement of plucking can vary, typically starting around 4 to 5 years after planting, contingent on the climatic conditions in different regions [54,55].
For the purposes of this research, the abandonment of tea land was identified if the land was converted to another LULC between 2015 and 2023. Various timeframes were considered to map tea land abandonment, ranging from 3 to 7 years based on the LULC trajectories of each pixel, which is discussed in the next section. By employing the LULC trajectory method, these abandoned tea lands can be classified into categories such as grass and bare lands or home garden and other crops, depending on the level of abandonment.

2.3.4. Land Use/Cover (LULC) Trajectory Analysis

This study employs LULC trajectory analysis to assess tea land abandonment and its spatiotemporal distribution. This methodology is a recently developed method and relies on time series data for each pixel [36,37,39,40]. Unlike traditional approaches that identify individual change events between two dates, LULC trajectory analysis aims to uncover distinctive signatures within the entire temporal trajectories of spectral values [37]. While previous studies have mainly applied trajectory analysis to contexts related to land use changes in forests, urban areas, or specific land use types [37,39,40], recent advancements have expanded its application to crop land abandonment [35,36]. In this study, the trajectory analysis encompasses all LULC changes rather than focusing on specific land use types, providing a comprehensive understanding of the dynamics associated with tea land abandonment.
The method for calculating LULC trajectory is shown in Figure 4, which is modified from [35] to illustrate arbitrary LULC trajectories. Taking three pixels, labeled ‘a,’ ‘d,’ and ‘g,’ as an example, the trajectories are observed from 2015 to 2023, with data collected every other year. Pixel ‘a’ is identified as an area with no tea abandonment during the entire period. However, the area of pixel ‘d’ undergoes conversion to grass and bare land and ultimately returns to tea cultivation. The area of pixel ‘g’ exhibits abandonment after 2017, transitioning first into a home garden and other crops, subsequently converting to a built-up area, and the length of abandonment for pixel ‘g’ is 7 years.
According to Wang et al. [37], trajectories in a time series can be represented by trajectory codes, taking various forms such as numbers or letters, for each pixel in a raster image. Hence, in this study, the initial letter of the LULC class (Table 4) was employed as trajectory codes to identify the trajectories for each pixel across the five temporal periods of 2015, 2017, 2019, 2021, and 2023. Codes like T T T T T, H H H H H, and so forth, with the same code for each time slice, denote trajectories with no LULC changes. On the other hand, codes like T T H H B, T G G G G, and F F H H H indicate a change in land cover during a specific period. For example, T T H H H signifies the transition from tea (T) to home garden and other crops (H) after 2019. Assigning a set of rational rules depending on each study is crucial in trajectory analysis to generate meaningful maps, as emphasized in previous studies [42,43]. Consequently, the subsequent two steps were executed to formulate trajectory maps adhering to a set of rational rules:
(a)
Compute trajectories for the five-time period, generating a time series trajectory map.
(b)
Evaluate all trajectories and combine necessary trajectories based on the predefined rational rules as shown in Table 4.
Table 4. Rules for the evaluation of the trajectories.
Rule #TrajectoryTrajectory CodesDescription
Rule 1No changeT T T T T, H H H H H, F F F F F, and so forthA pixel maintains the same LULC class across the five periods, it is considered to be ‘No changes.’
Rule 2Trajectories for abandoned tea and other LULC classesT N N N N, T T N N N, and so forth for abandoned teaPixels classified into LULC classes other than tea were collectively assigned the code ‘N’ (non tea).
T N N N T, T N N T T, and so forth for intermediate (2017–2021) abandoned tea
N T N T T, N N N N T, and so forth for tea gain
N T T T N, N T T N N, and so forth for intermediate tea gain
Rule 3Other trajectoriesG G H H B, F F G H H, H G G W W, and so forthPixels classified into LULC classes other than tea throughout all five-time periods were categorized as ‘Other trajectories.’
Raster calculator tools in the ArcGIS 10.8.1 software was utilized to generate LULC trajectory maps.

2.3.5. Validation of the Results

The validation of the final map is a critical step in ensuring its precision and relevance to the study’s objectives. The following steps were undertaken. First, a total of 150 random points were generated on the abandoned tea lands map. These points were then compared with high-resolution PlanetScope images (with a resolution of 3 m), and a comprehensive visual assessment was conducted.

2.3.6. Grid-Based Density Analysis

The study also used grid-based density analysis to identify the characteristics of spatial distribution of abandoned tea lands. This analysis is commonly used to understand the spatial variation in features, identify hotspots, or quantify the intensity of certain phenomena across a landscape. Previous studies have explored various grid sizes, also known as window size utilization, primarily in Land Surface Temperature (LST) studies [56,57]. However, in LULC-based studies, a common practice is to employ a 1 km2 ground cover for analysis [58,59]. Therefore, for this analysis, a grid size of 990 m × 990 m (33 × 33 pixels) was chosen to cover approximately 1 km2 of ground area without dividing the pixels.

3. Results and Discussion

3.1. Land Use/Cover (LULC) Changes and Accuracy Assessment

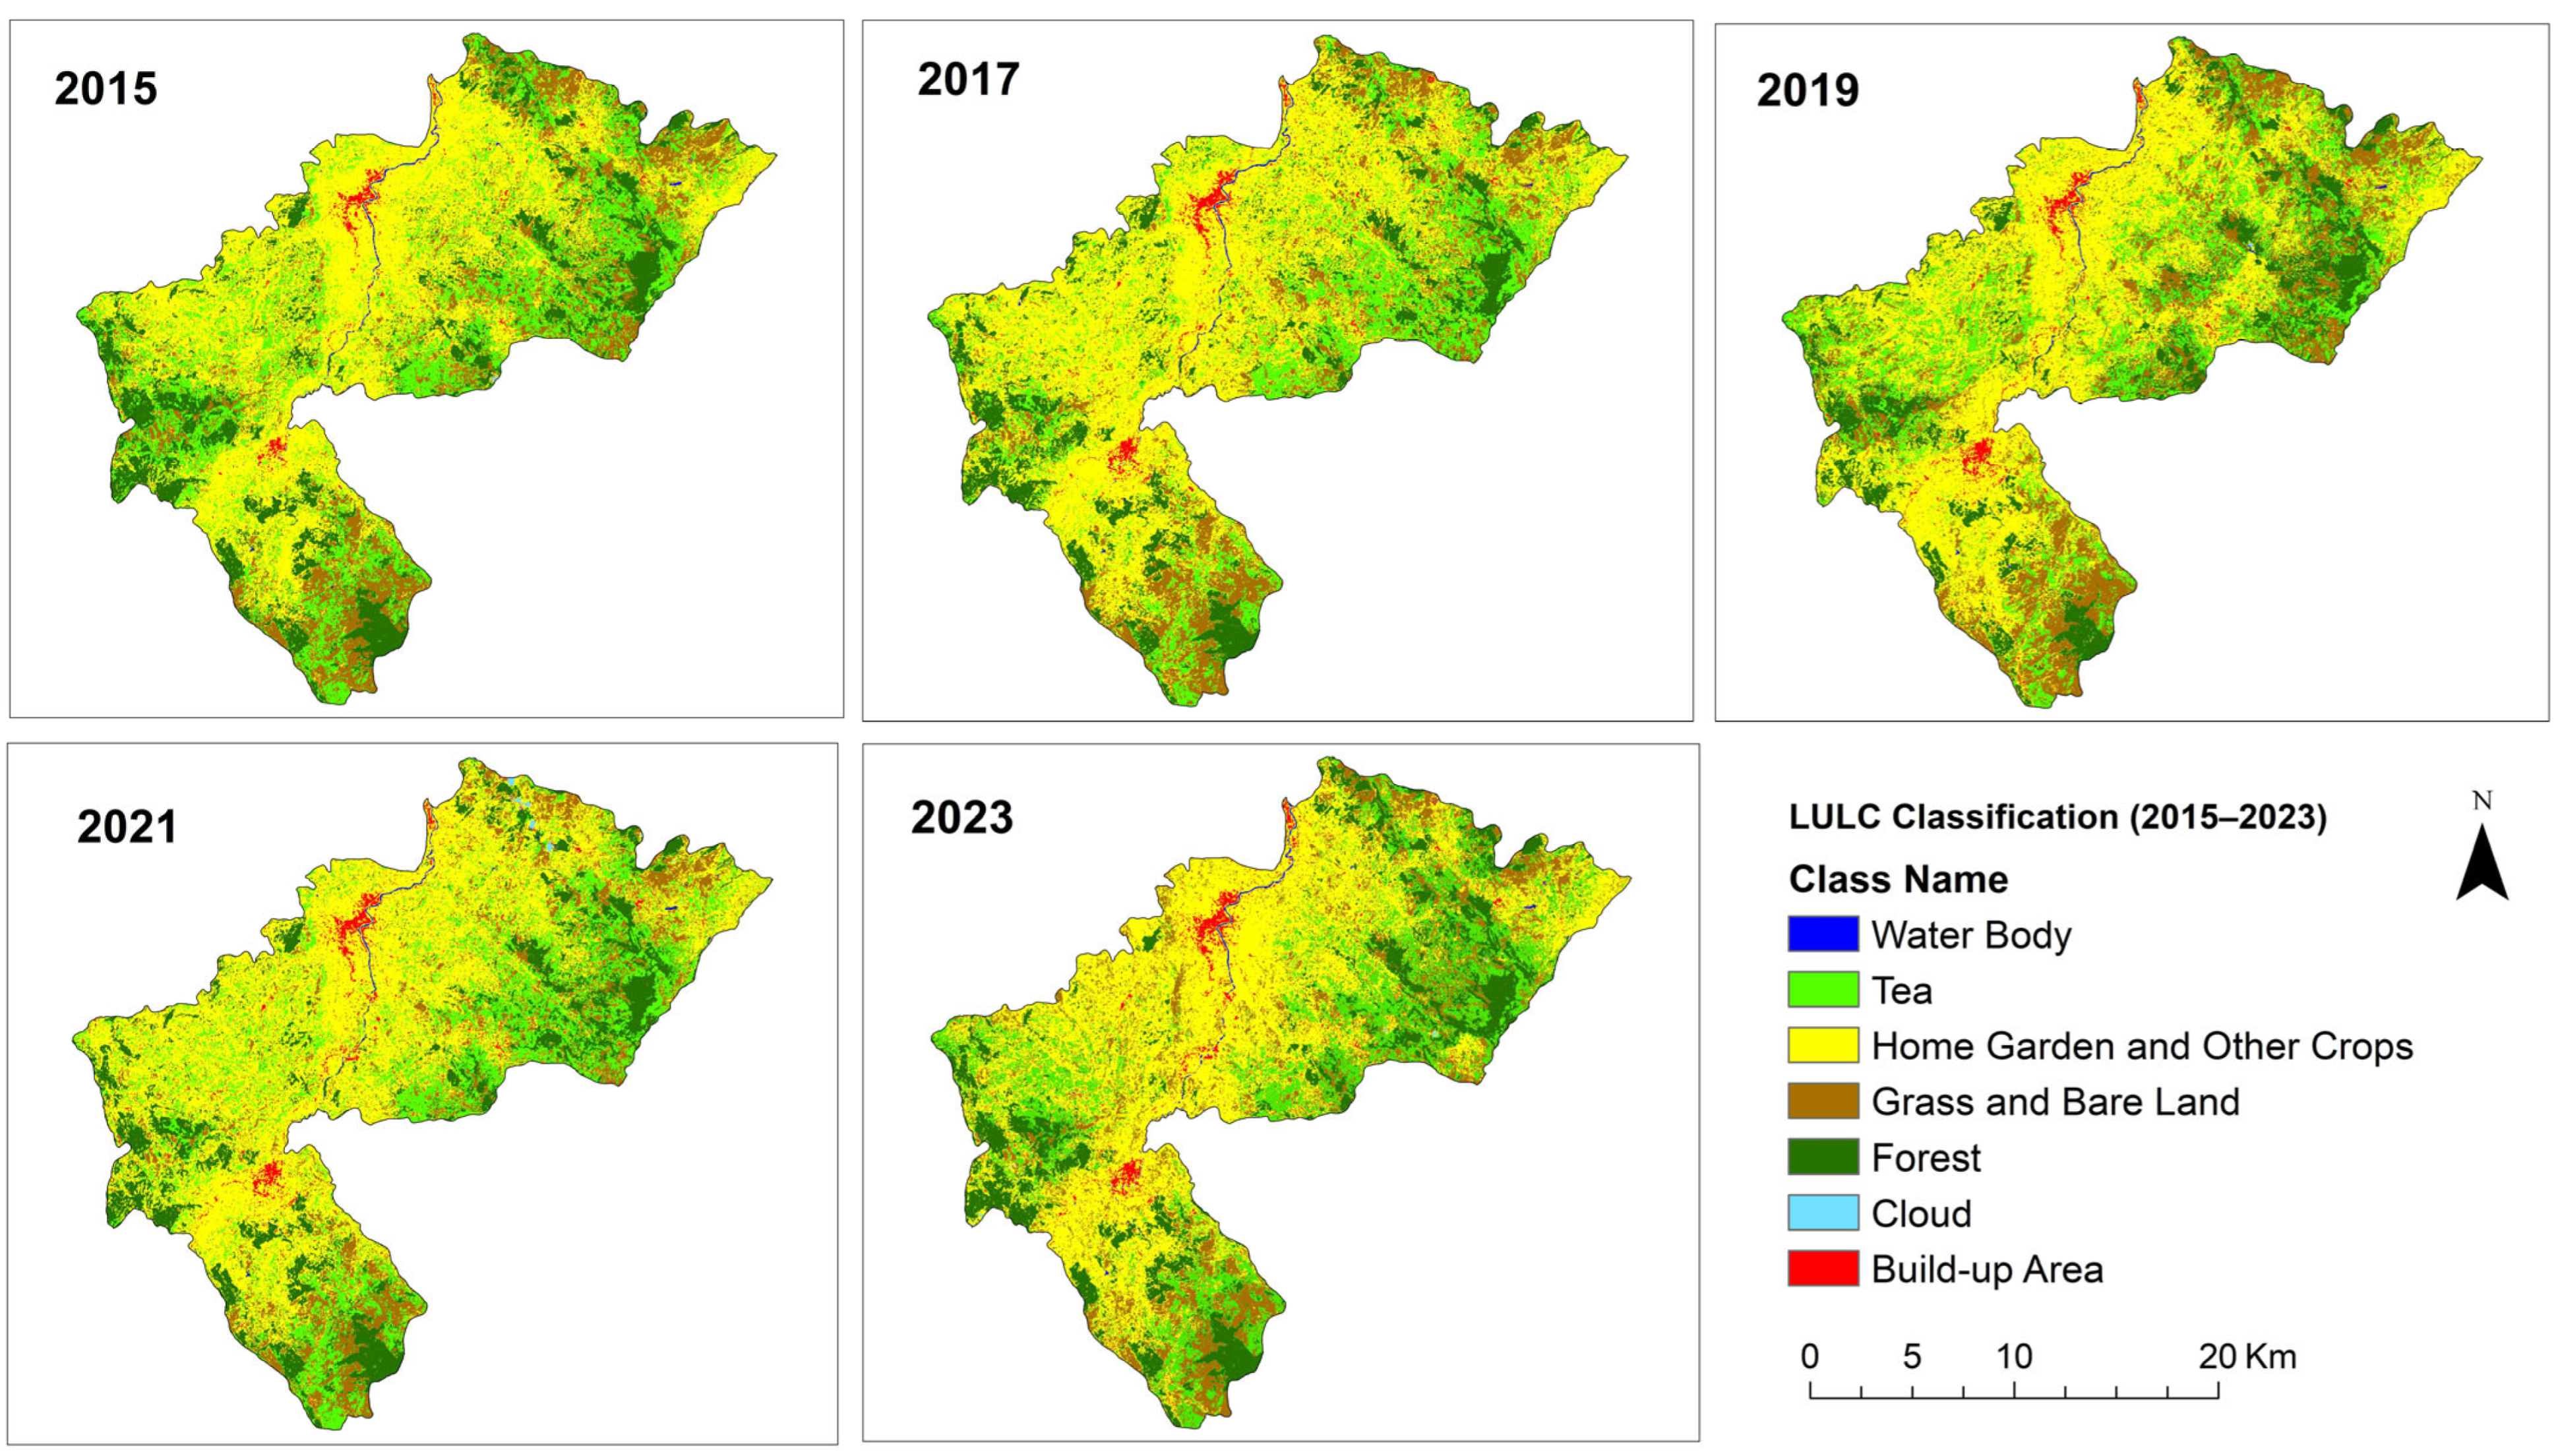
The results of the LULC classification are shown in Figure 5, revealing a notable trend of tea land decline over a period of 8 years, particularly concerning tea cultivation as the second largest LULC type in the study area. Table 5 outlines tea land changes from 9818 ha (21.6%) in 2015 to 8446.4 ha (18.6%) in 2023. The most noteworthy decline in tea cultivation is observed during the period from 2015 to 2019, with the tea lands diminishing first to 7605.1 ha (16.7%) in 2017 and slightly increasing to 7756.5 ha (17.1%) in 2019. This downward trend raises critical questions about the sustainability of tea cultivation in the study area. Possible factors contributing to this decline could include climate changes, economic crisis, or land use practices, and urban sprawl. Understanding these dynamics is essential for stakeholders in the agricultural sector.
Conversely, home garden and other crops have increased from 20,986.2 ha (46.2%) in 2015 to 22,156.1 ha (48.7%) in 2023. As the most extensively covered LULC type in the study area, this increase suggests a shift toward more diversified land use practices. Additionally, the expansion of built-up area from 353.6 ha (0.8%) to 701.5 ha (1.5%) indicates urban growth primarily around Gampola and Nawalapitiya. This trend may correlate with increased migration and urbanization, further pressuring agricultural lands, including tea cultivation. While changes in forest, grass and bare land, and Water Body were noted, they were not significant compared to the more substantial shifts in tea, home garden and other crops, and built-up area. This relative stability in other land types suggests that the area is undergoing a fundamental transformation driven mainly by shifts in agricultural focus and settlement or urban expansion.
The accuracy assessment of LULC classification maps recorded overall accuracies of 89%, 85%, 89%, 86%, and 86% for the years 2015, 2017, 2019, 2021, and 2023, respectively. Further, the Kappa calculation reveals consistently enhanced value, demonstrating strong agreement with a Kappa value exceeding 0.81 each year. According to [60], reaching an accuracy level of 85% is considered a satisfactory standard for digital image classification. The accuracy observed in this classification underscores the significance of strategic selection of training areas through stratified random points, thoughtful interpretation approaches, and the utilization of a substantial number of reference data (e.g., 200) for achieving improved classification results [61]. This accuracy assessment further substantiates that, similar to various other researchers [34,50,62], Google Earth emerges as a robust and potential data source for research and initial studies, offering both adequate accuracy and cost-effectiveness.

3.2. Land Use/Cover (LULC) Trajectories

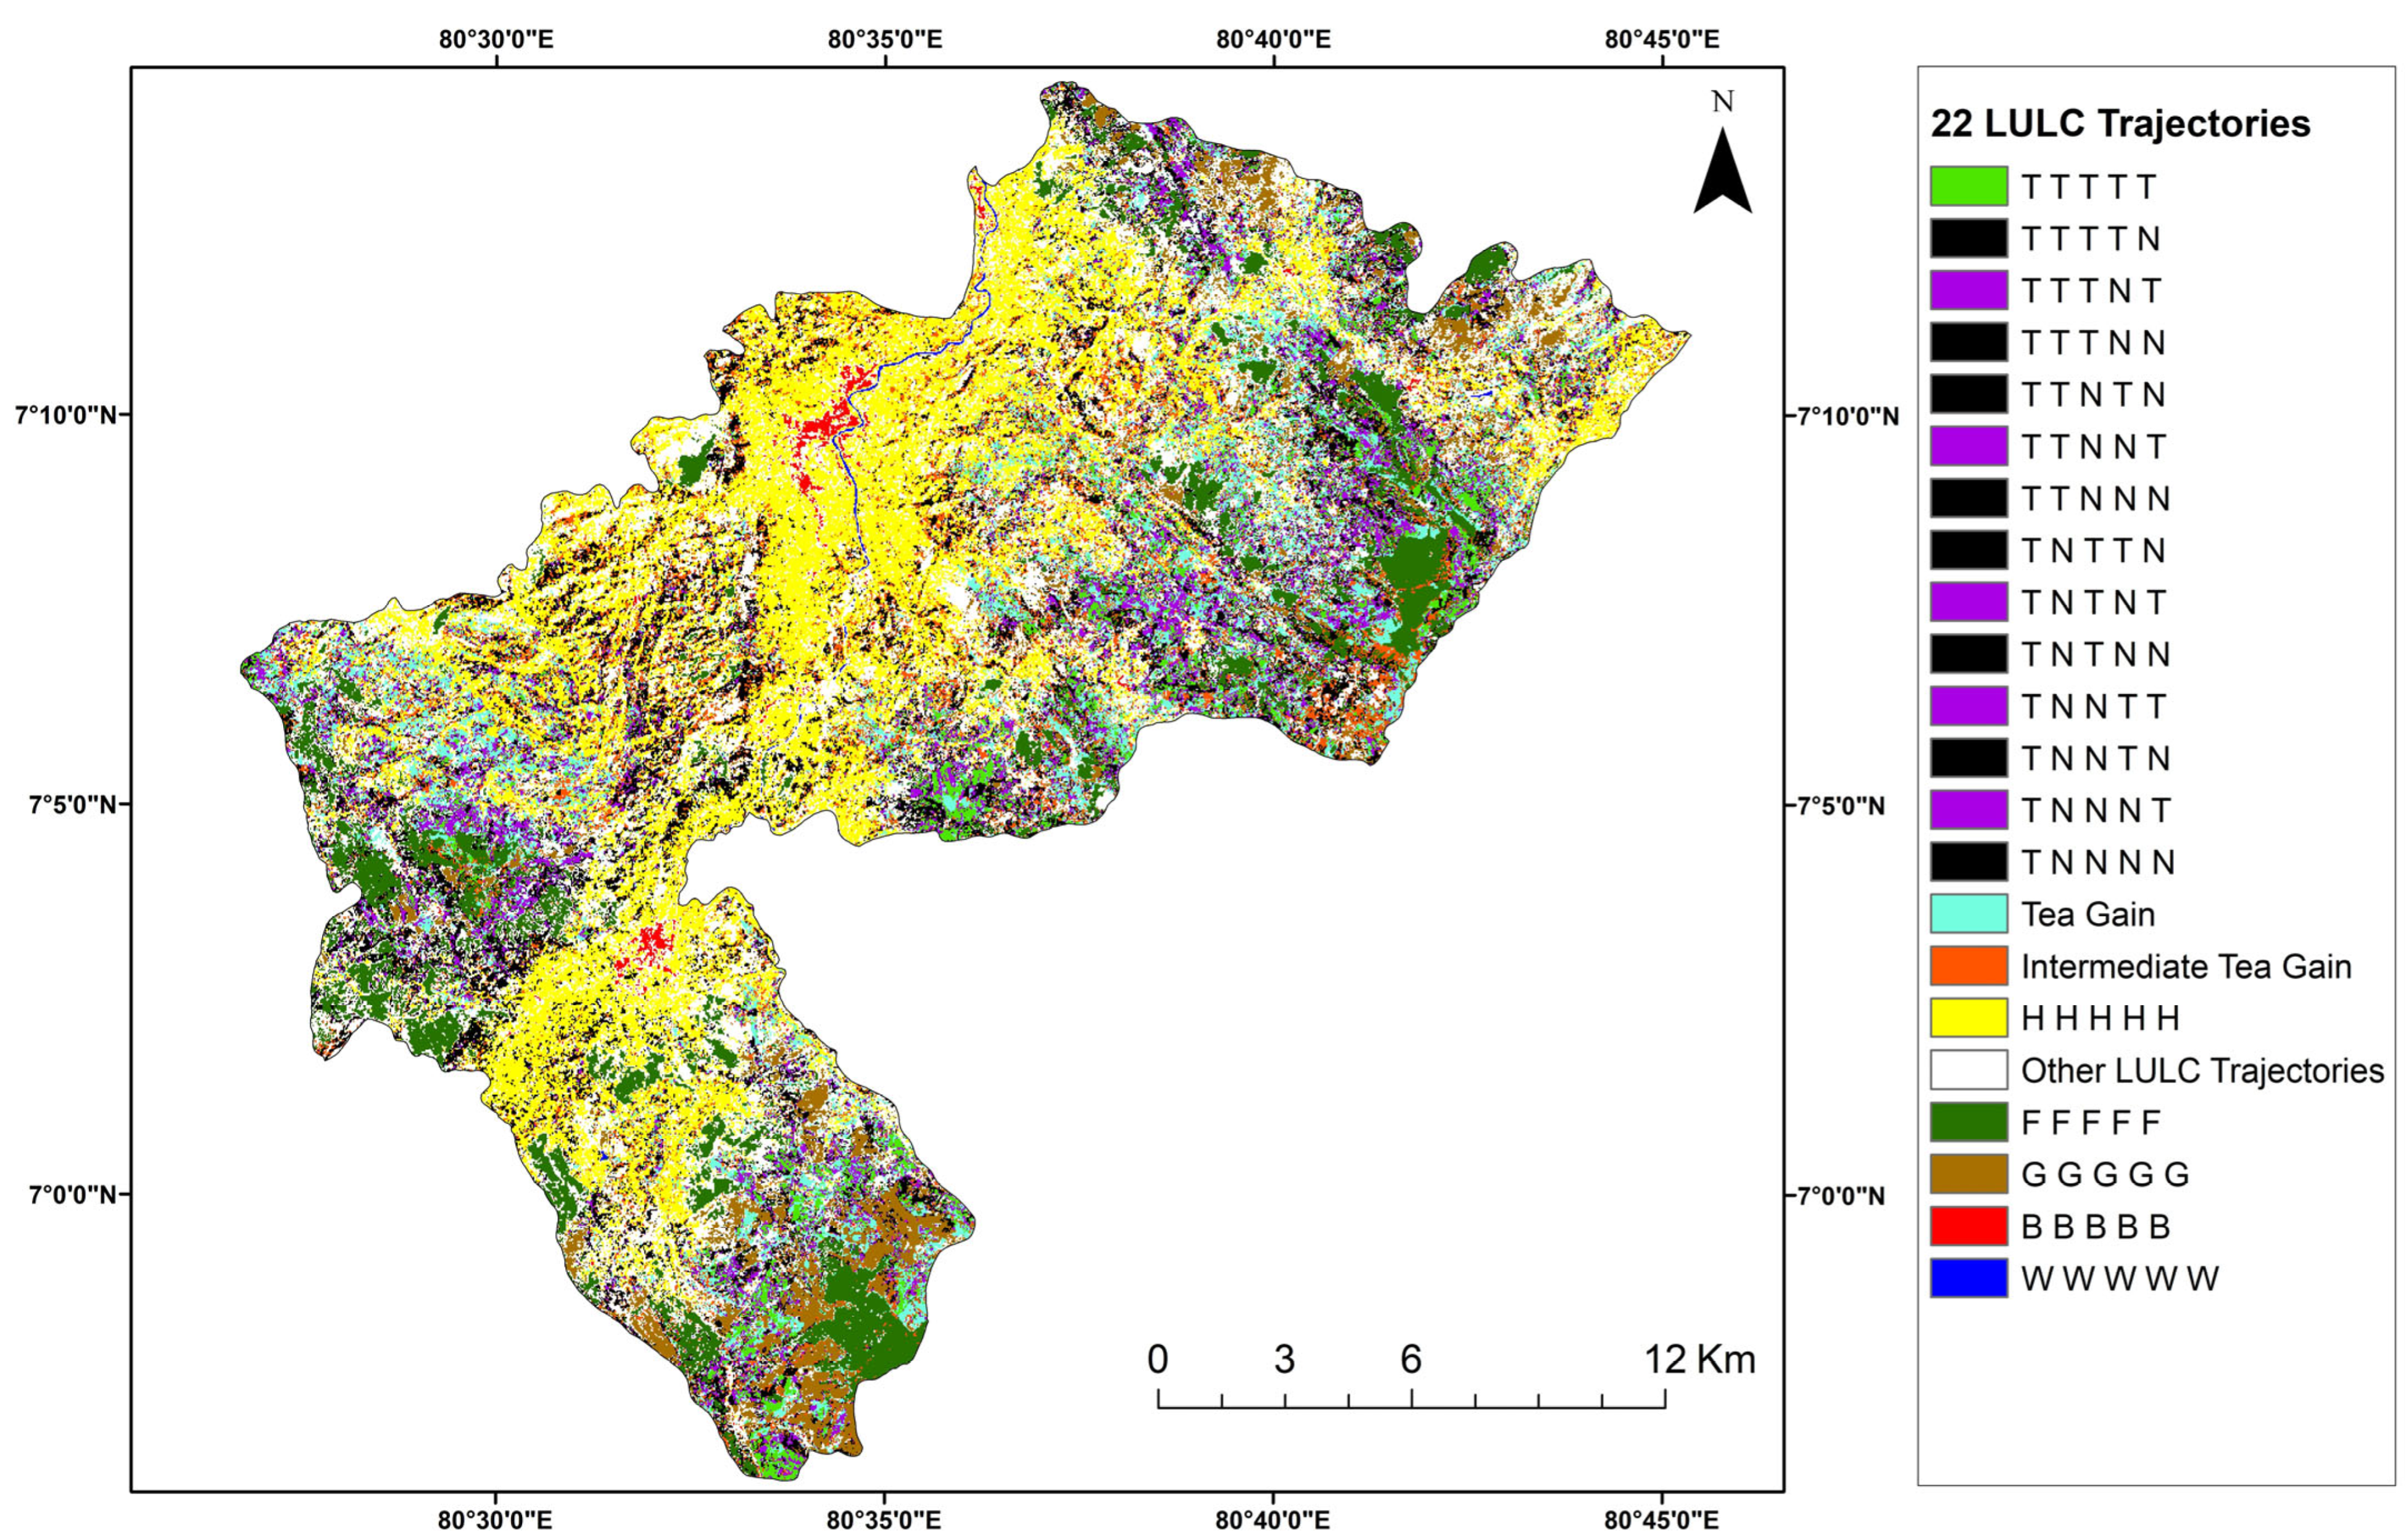
The top 22 spatiotemporal trajectories dominating the tea trajectories were identified for five LULC maps (2015, 2017, 2019, 2021, and 2023) as shown in Figure 6. This identification occurred after grouping several similar trajectories based on rational rules (see Section 2.3.5). All trajectories were used for grouping and trajectories with cloud cover were grouped with respect to nearest pixel values.
The analysis revealed that 3.7% (1676.7 ha) of pixels were continuously classified as tea over the 8-year period (Table 6) as tea is the second largest LULC type in the study area. This indicates stable long-term use in certain locations, while variations observed in other areas may be attributed to various factors such as land use shifts, agricultural practices, or environmental changes affecting the tea lands as discussed in the introduction. In total, 39.8% of the pixels were also consistent with stable LULC types, while home garden and other crops, forest, and grass and bare land showed higher percentages, representing 22.7%, 8.1%, and 4.5% of the pixel count, respectively, This suggests a greater prevalence and persistence of these LULC types in the study area. The dominance of these land cover types may be influenced by factors such as residential expansion, forest management policies, and agricultural practices unrelated to tea cultivation. This trajectory analysis reveals significant insights into the changing landscape of the study area, particularly regarding the vulnerabilities of tea cultivation amidst competing land uses.

3.2.1. Tea Land Trajectories

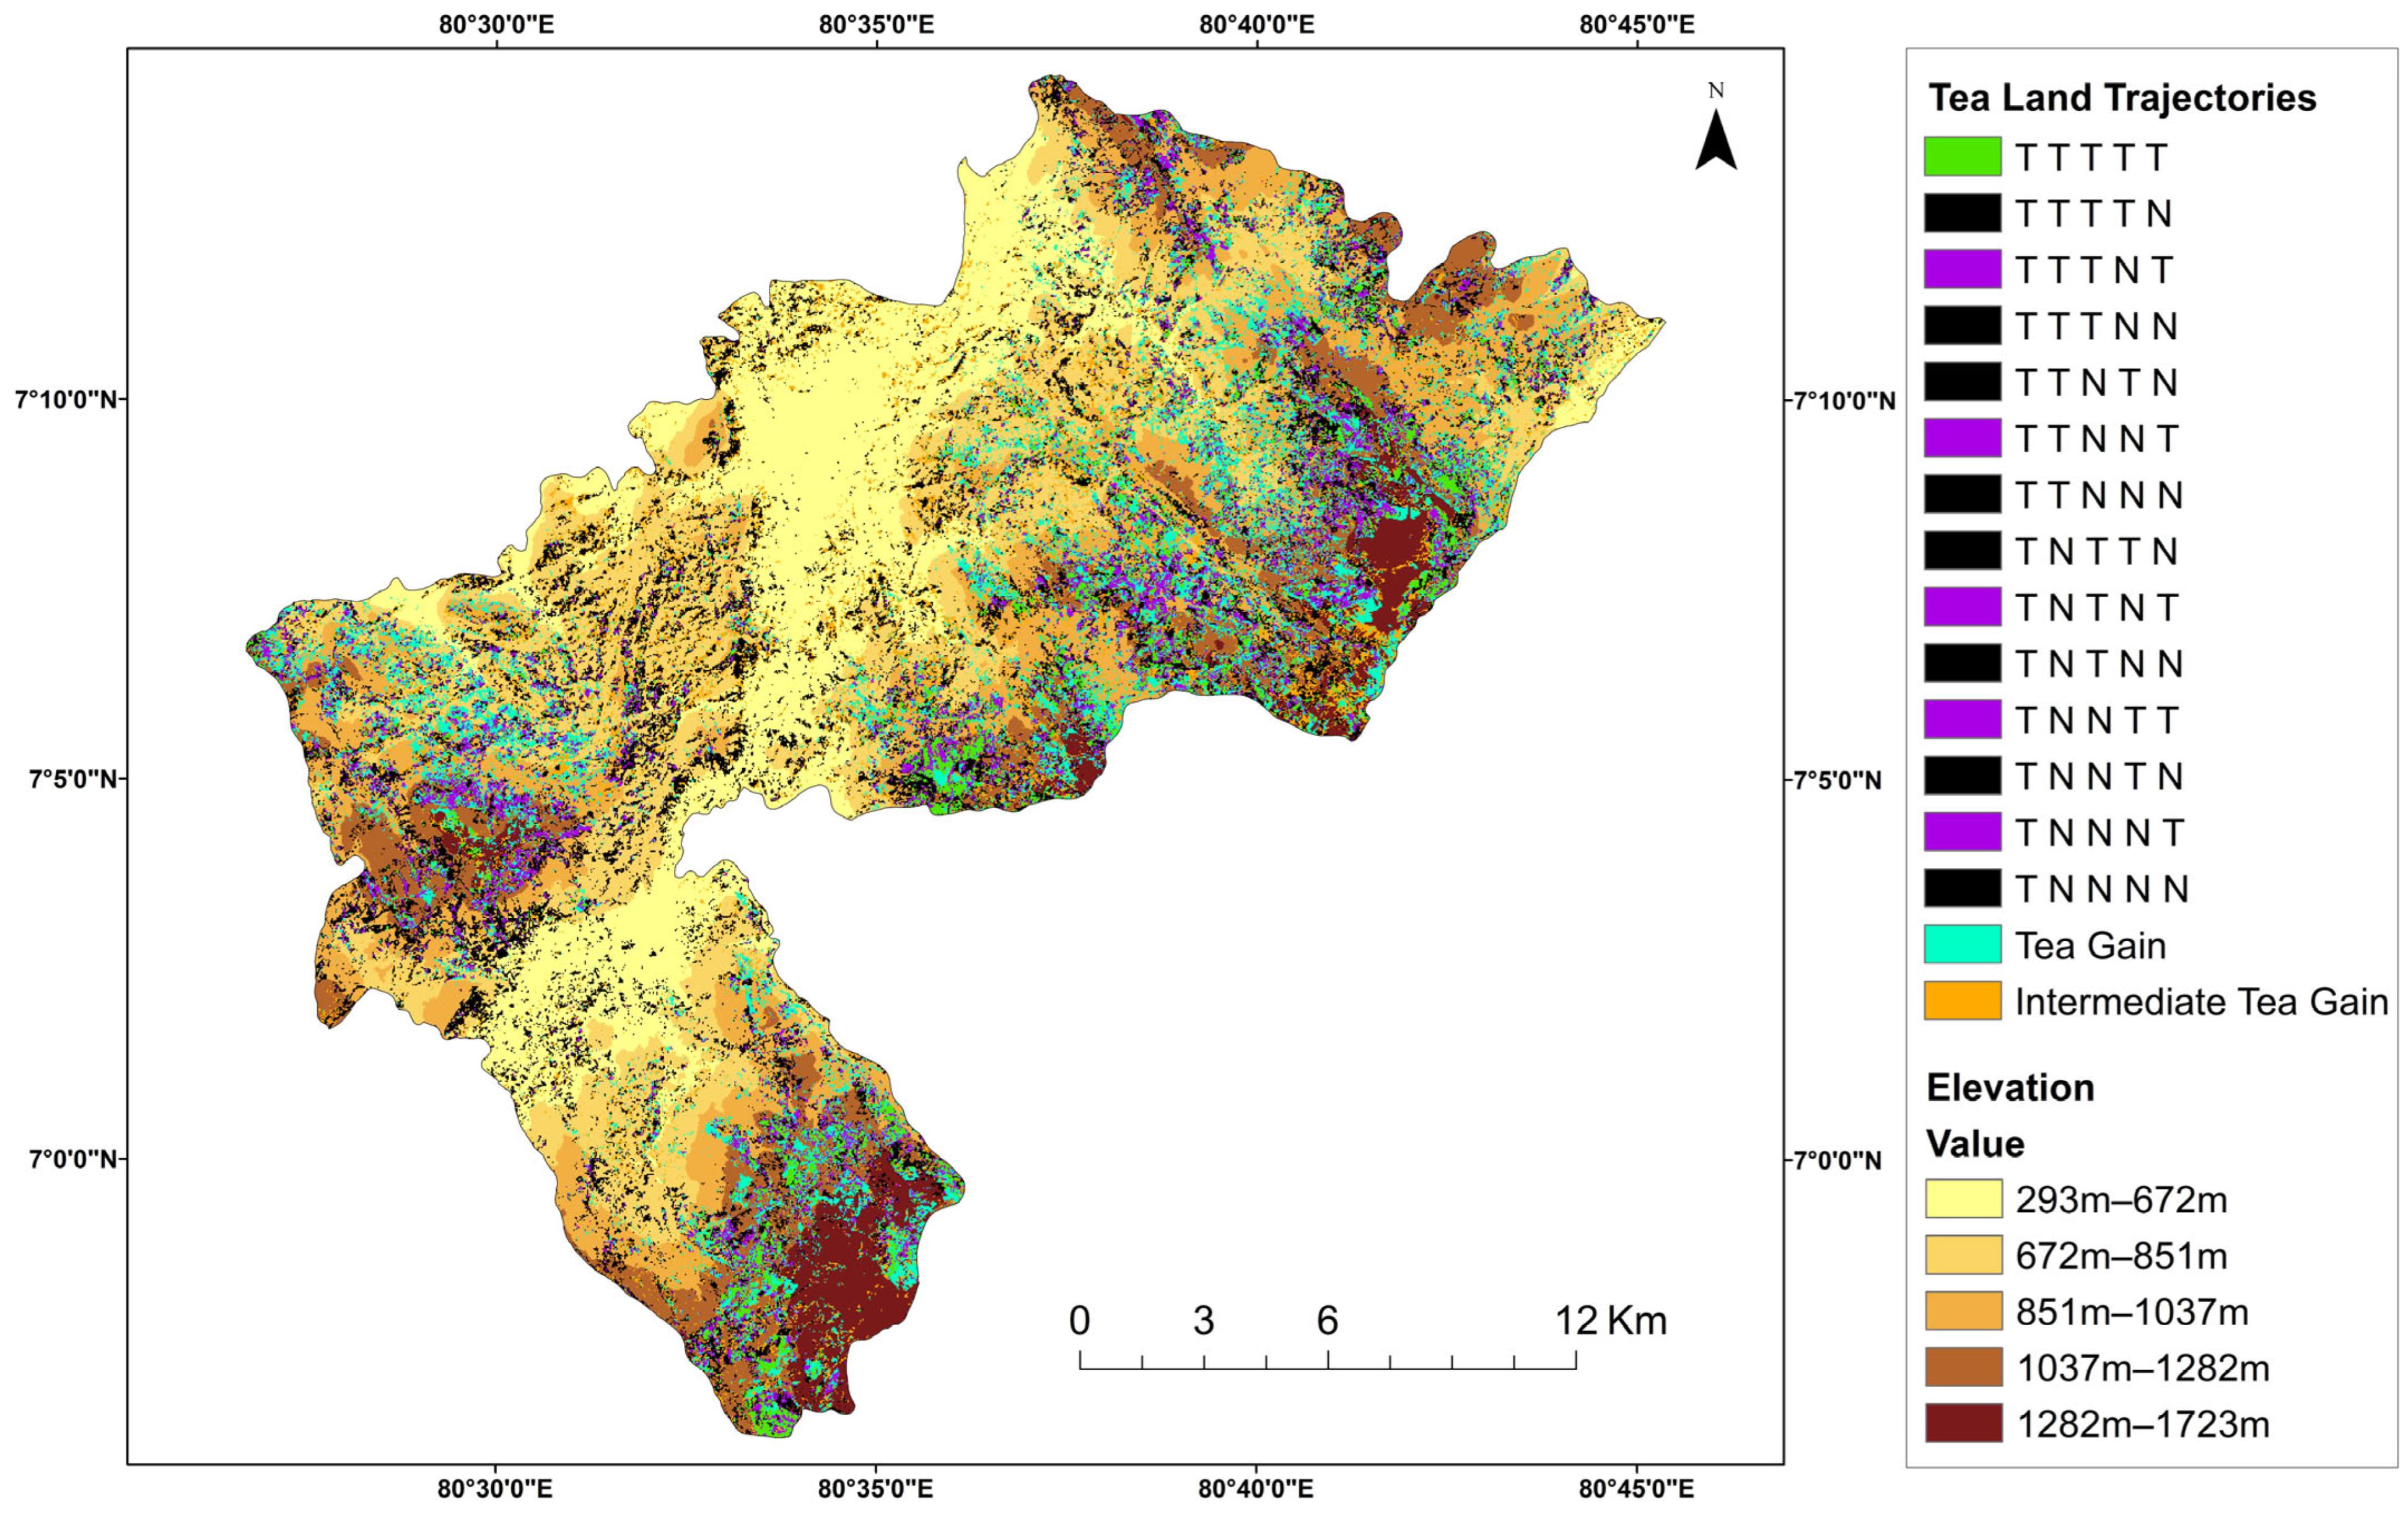
This section presents the results related to tea land trajectories and their abandonment. As illustrated in Figure 7, eight trajectories, marked in black, represent the abandoned tea land over the seven years from 2015 to 2023.
Additionally, five trajectories, indicated in purple, correspond to abandoned tea lands during intermediate periods of 3 to 5 years. In total, 12% of pixels covering an area of 5457 ha were identified as abandoned tea lands from 2015 to 2023. This suggests a noteworthy trend of tea land abandonment during the observed period. Delving deeper into the temporal aspect, the results indicate that 6.3% of the pixel area, equivalent to 2873.3 ha, experienced tea abandonment specifically between 2017 and 2021, shown in purple color. This temporal detail provides insights into a concentrated period of tea land transitions within the broader 8-year timeframe. Moreover, the study also identified instances of tea gains over the 8 years, covering 8.7% of the pixel area (3954.3 ha) as a distinctive observation. This suggests a dynamic and potentially reversible pattern of tea land use within this relatively brief period.

3.2.2. Spatial Distribution of Abandoned Tea Lands

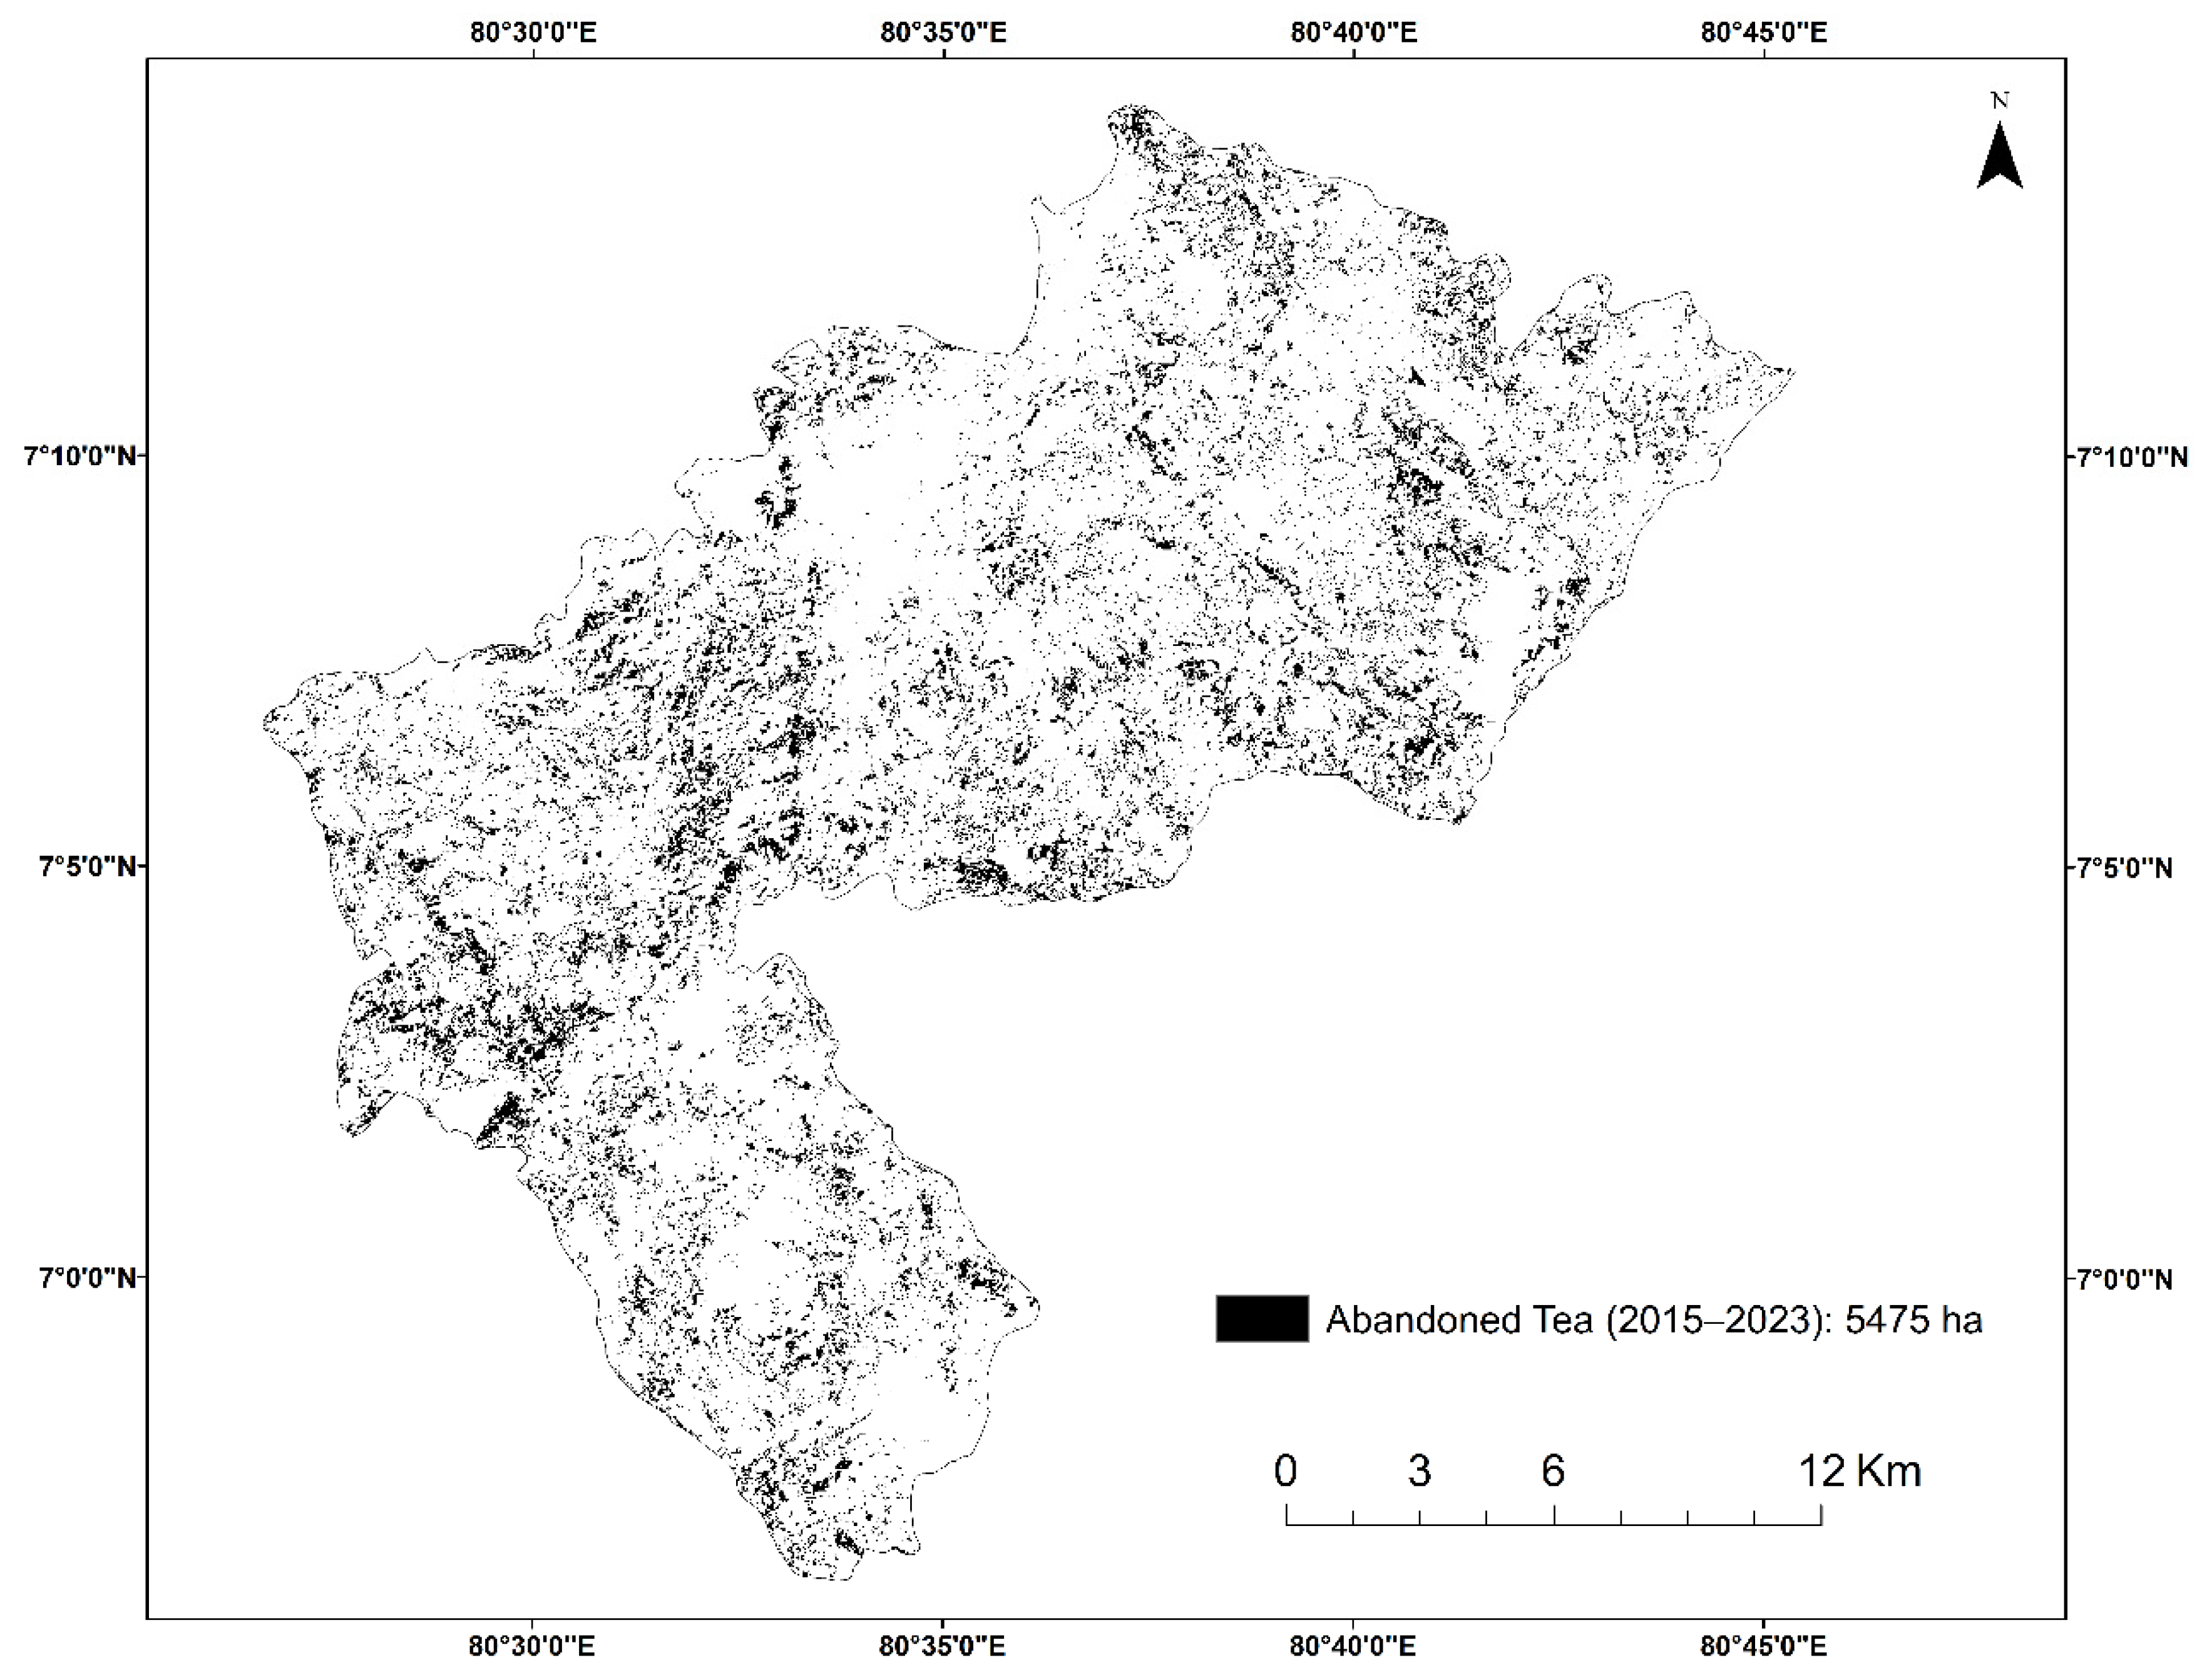
The results shown in Figure 8 provide valuable insights into the spatial distribution of abandoned tea lands, specifically regarding the duration of abandonment when compared to the total tea land abandonment. This indicates that tea land abandonment is not confined to specific regions but is dispersed throughout the landscape. On the other hand, tea gains predominantly occur in hilly areas, highlighting a spatial variation in the dynamics of tea cultivation. The preference for hilly terrain in tea gain areas might be influenced by factors such as topography, soil conditions, agricultural practices, or expanding urban and residential areas in the low elevation.
The final output of the tea land abandonment trajectories map (Figure 8) was validated as detailed in Section 2.3.6. Out of 150 points, 142 were accurately identified as abandoned tea lands, while 8 points were incorrectly classified. This results in an accuracy rate of 94.7%, demonstrating that the map is highly reliable for identifying abandoned tea lands in the study area. This rigorous validation process ensures that the map accurately reflects the spatial phenomena and adheres to the methodological and analytical standards necessary for drawing valid and reliable conclusions.
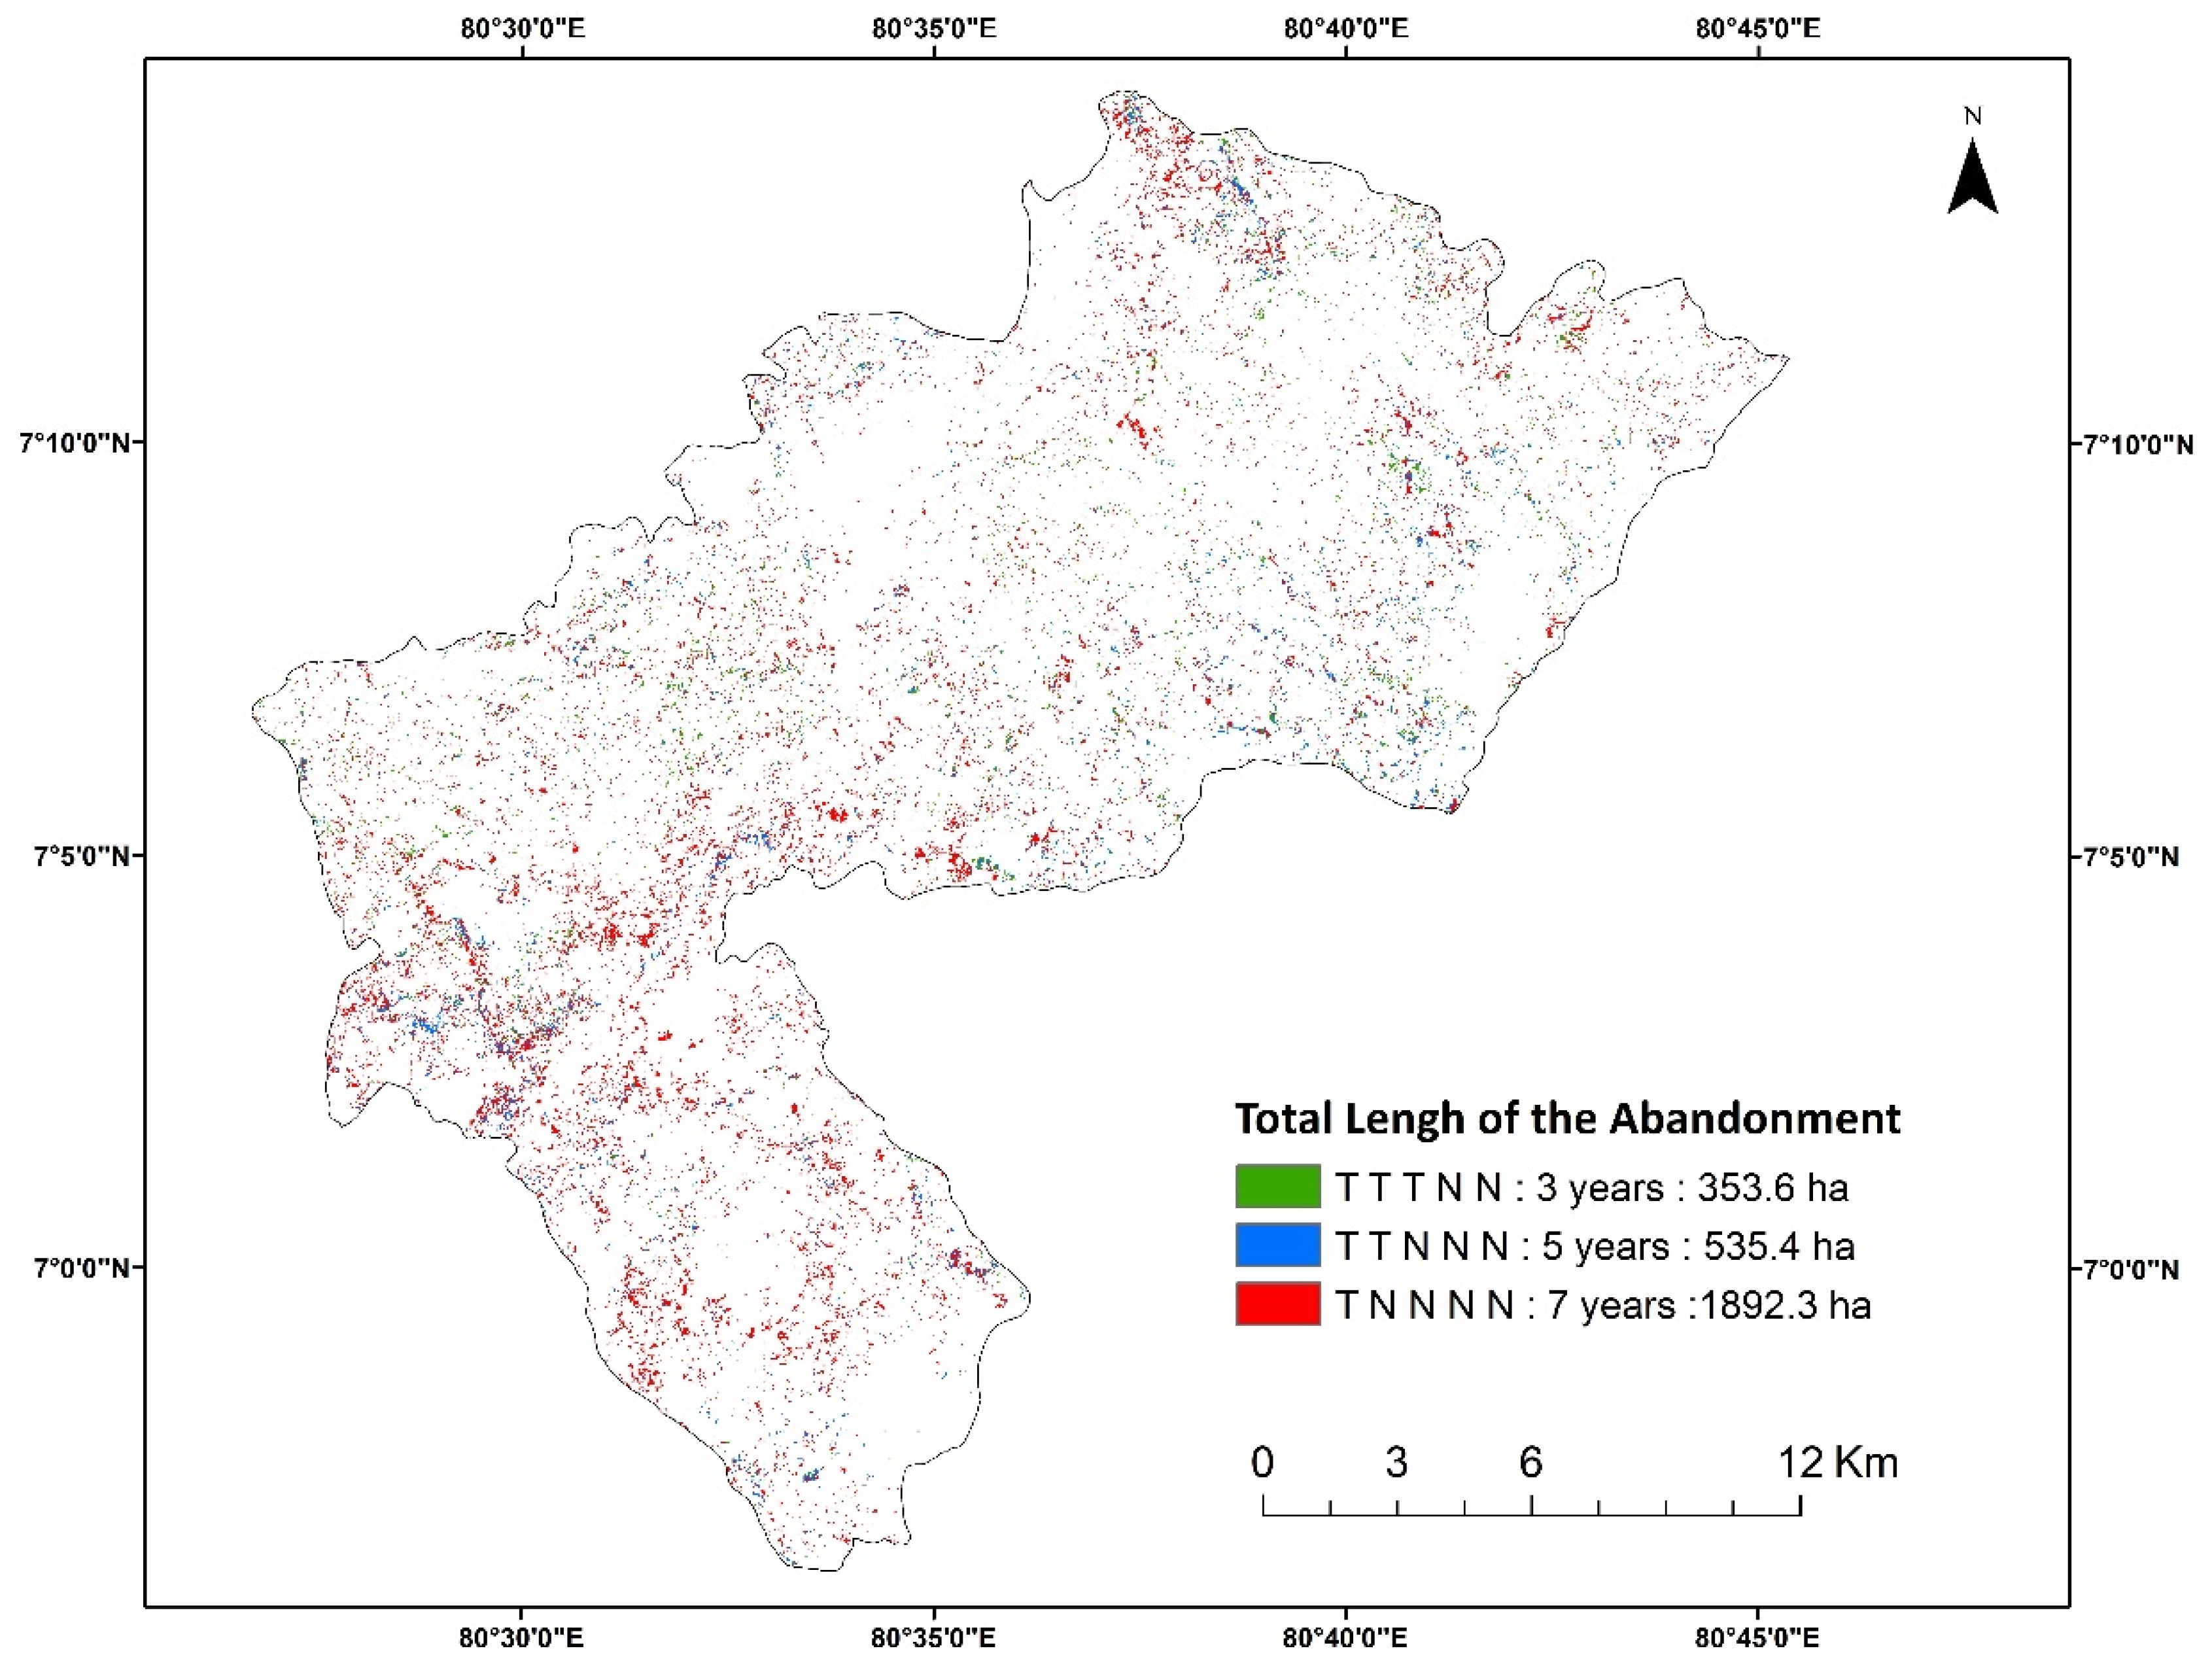
The high accuracy of the abandonment map, as demonstrated by the validation results, provides a solid foundation for further analysis of tea land abandonment patterns. Figure 9 illustrates distinct categories of tea land abandonment, varying in length from 3 to 5 to 7 continuous years. Notably, the results indicate that the area of tea land abandonment for a continuous period of 7 years was the largest, accounting for 35% of the total abandonment areas, equivalent to 1892.3 ha. In contrast, the period of 5 years and 3 years accounted for 535.4 ha and 353.6 ha, respectively. This finding indicates a significant and prolonged trend of tea land abandonment within the study area. Furthermore, the spatial distribution map reveals that during these 7 years, tea land abandonment occurred extensively across the entire study area, indicating the widespread nature of this phenomenon.
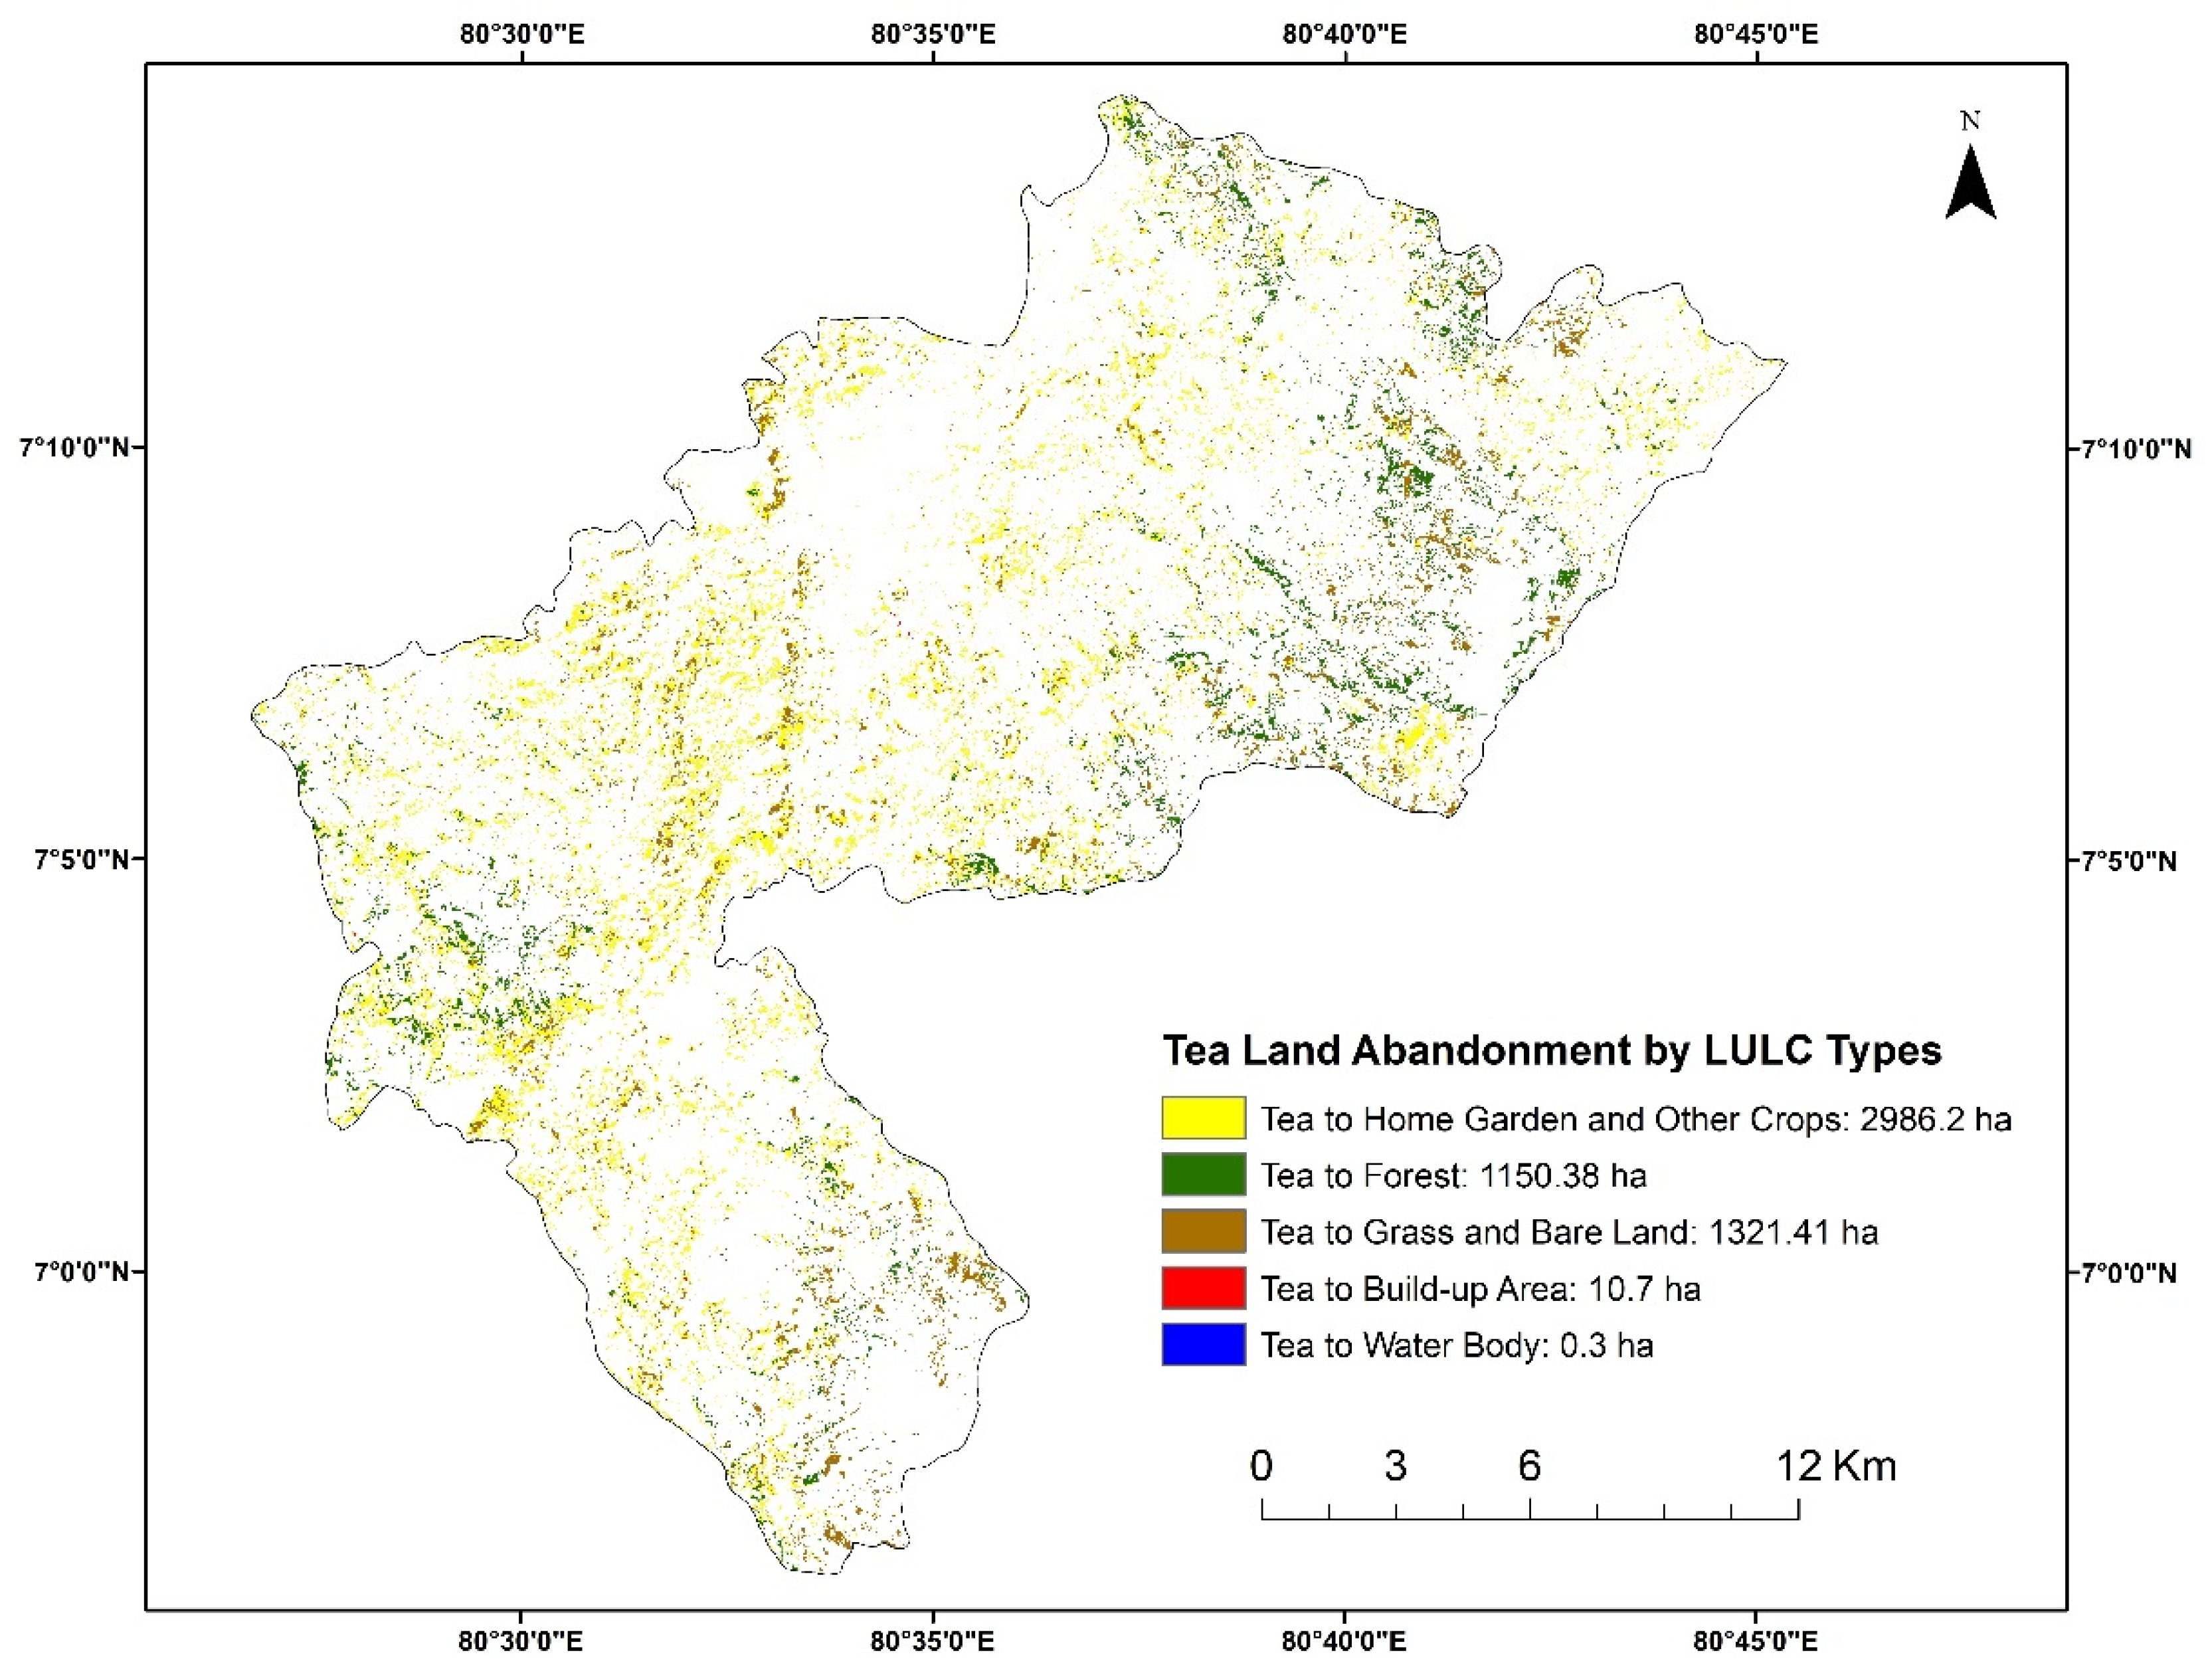
The insights provided by Figure 10 regarding the spatial distribution of abandoned tea lands over the 8 years reveal notable transformations within LULC classes. The predominant conversion observed is the shift in tea lands towards home garden and other crops and grass and bare land during this timeframe. This change signifies a dynamic alteration in land utilization patterns, possibly influenced by tea land marginalization.
Additionally, the growth of forest cover on tea lands during the abandonment period indicates a natural succession process. The expansion of the canopy cover is likely a result of reduced human intervention and the establishment of natural vegetation on abandoned tea lands. This ecological shift suggests the potential for the restoration of forested areas in response to tea land abandonment. However, according to Google Earth images, some forest covers have been established over the tea land due to forest cover establishment for the forest expansion, as shown in Figure 10.
The observed changes in LULC classes underscore the interconnectedness of land use dynamics and environmental processes. The conversion of tea lands to home garden and other crops and grass and bare land may reflect shifts in agricultural priorities or land development, while the natural growth of forest cover highlights the resilience and regenerative capacity of ecosystems in the absence of active cultivation.
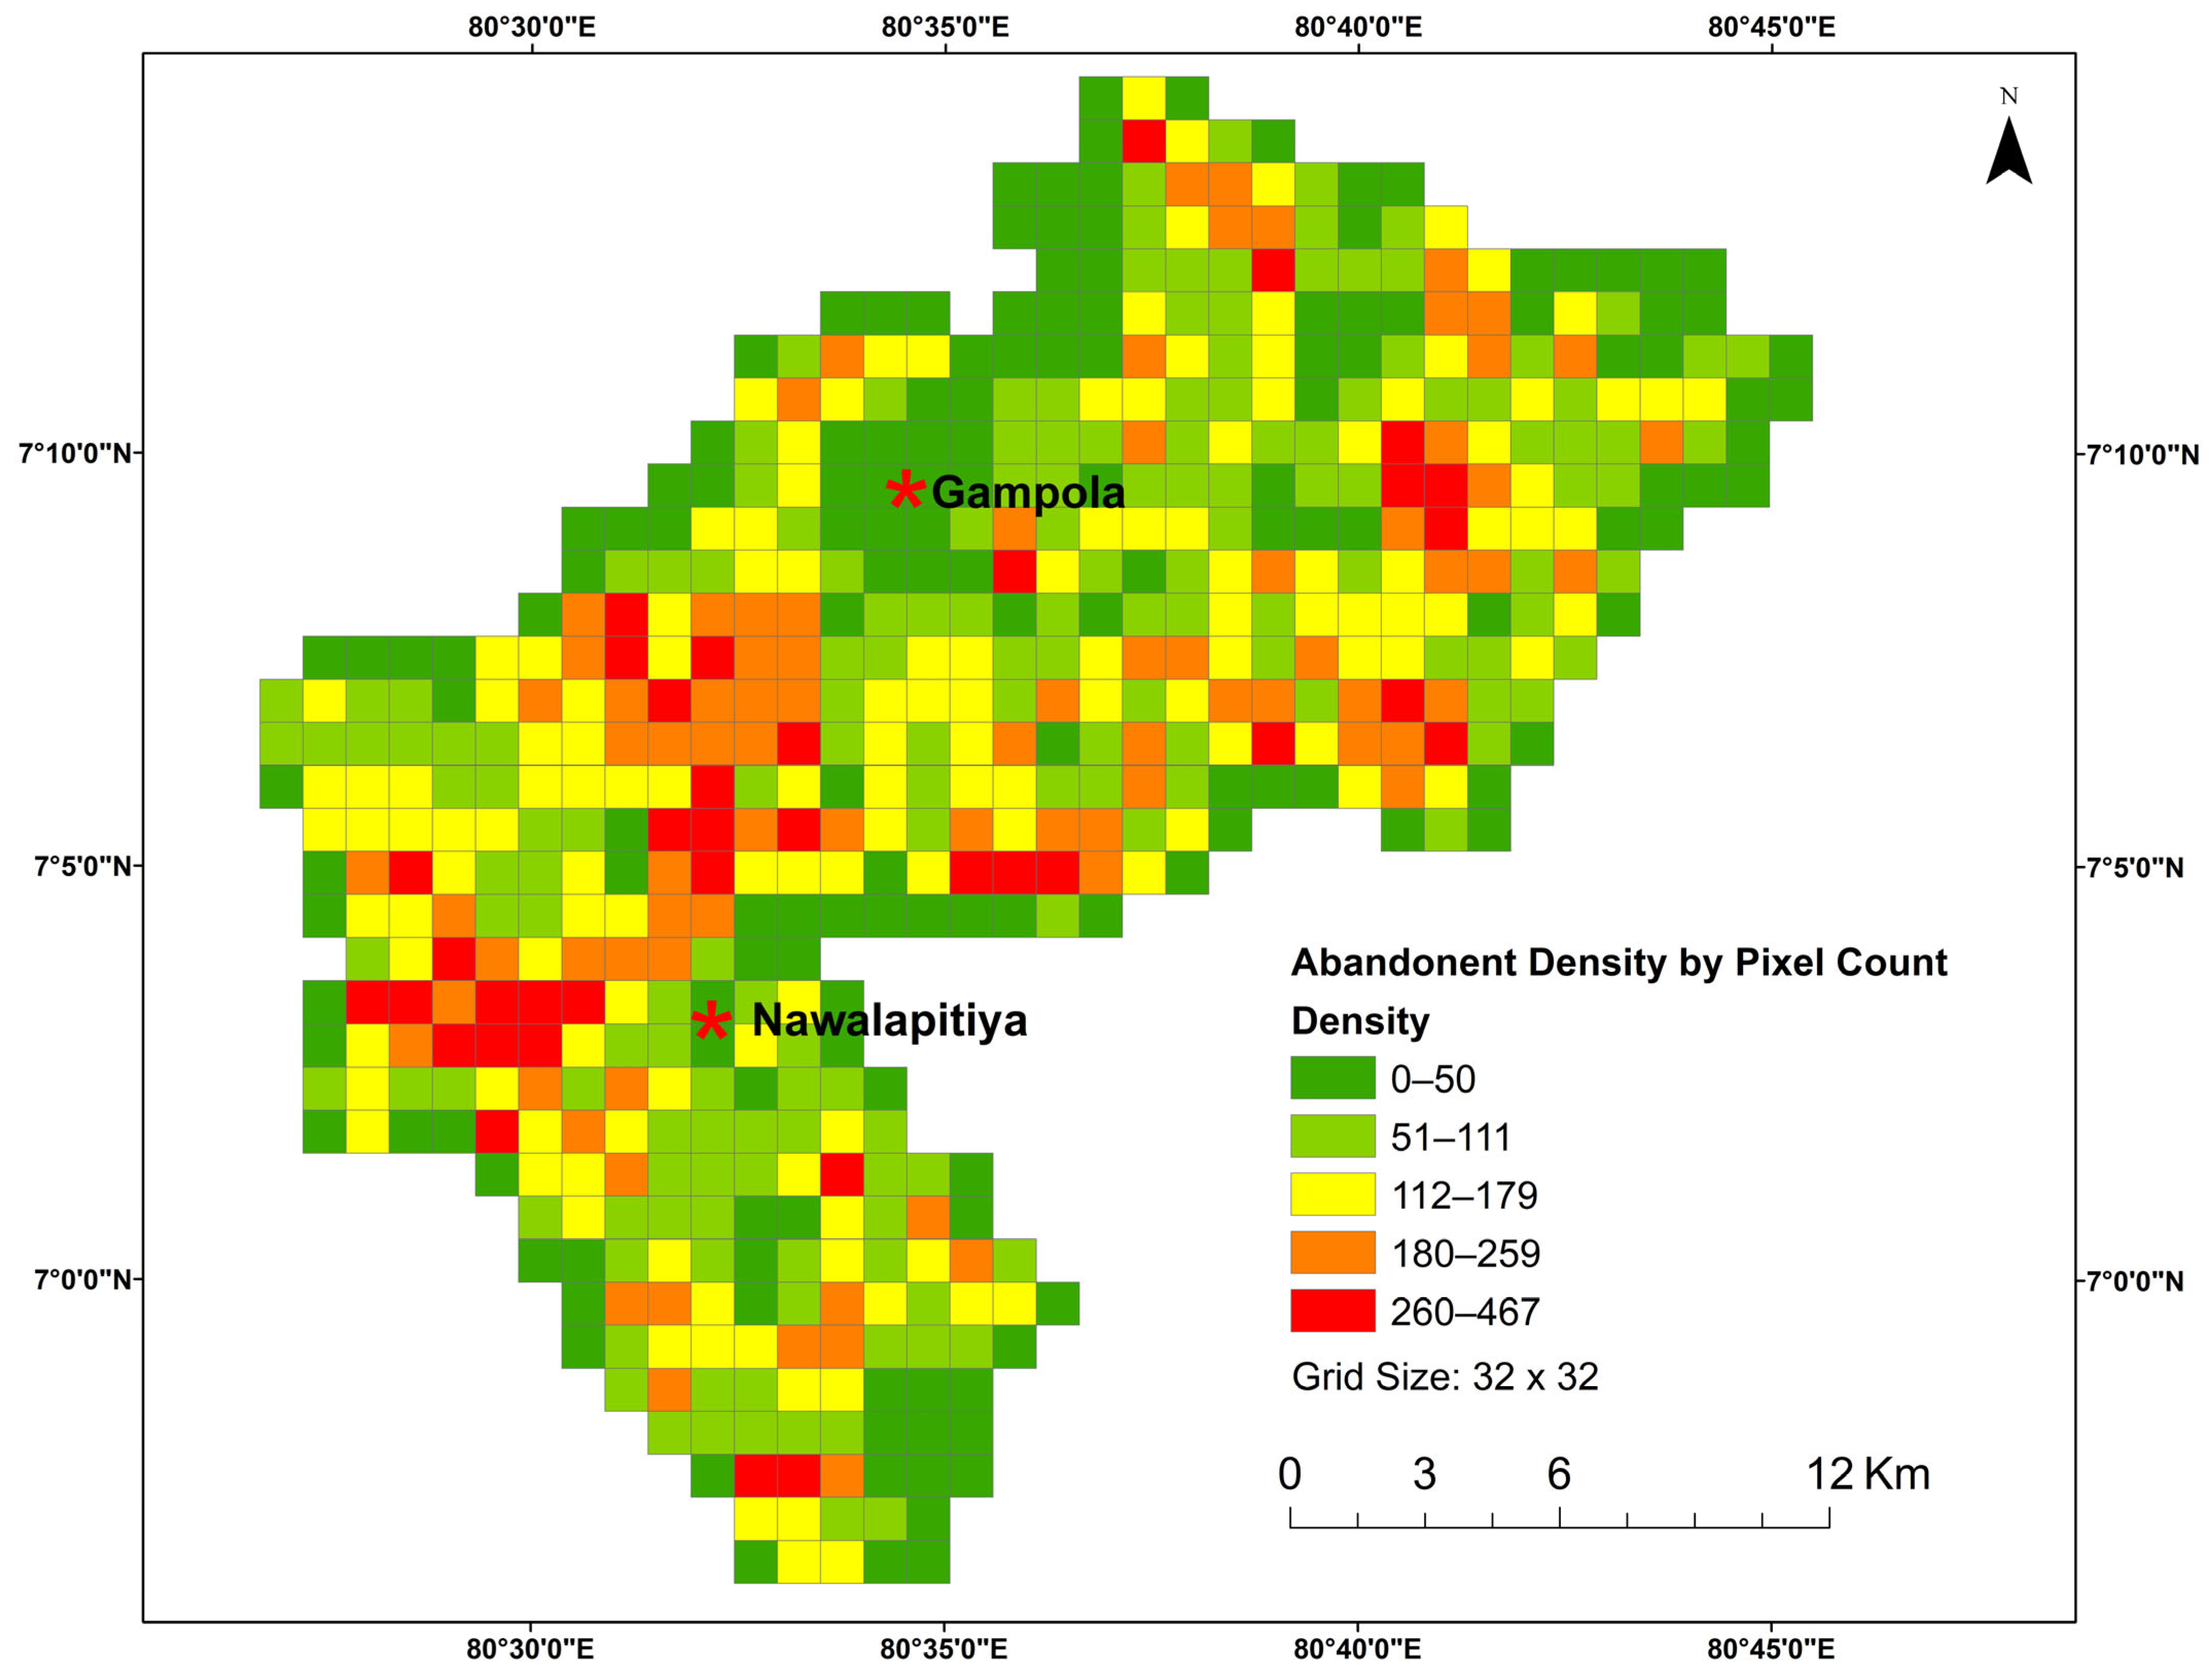
Figure 11 presents the tea land abandonment density map, created through grid density estimation and categorized by pixel count using natural breakpoints. This map also offers valuable insights into the distribution of abandoned tea lands within the study area, highlighting the dynamic nature of land use changes over the observed period. Notably, the region with the highest abandoned density is prominently situated between the urban centers of Gampola and Nawalapitiya, particularly extending towards the west. This distinctive spatial distribution raises the hypothesis that urban sprawl, marked by the expansion of built-up areas, may be a significant contributing factor to this density pattern.
This conjecture finds support in a recent study on the Urban Heat Island of Gampola City [63], which reveals that the city has expanded notably along the Peradeniya—Hatton Road. This road, serving as a crucial connection between Gampola and Nawalapitiya, aligns with the observed concentration of abandoned tea lands. The simultaneous findings in the LULC classification map (Figure 5) further confirm this correlation, demonstrating a gain in built-up areas particularly surrounding the two cities.
These results suggest a dynamic interaction between urban development and the abandonment of tea lands, indicating the need for a comprehensive understanding of the interplay between land use changes and urbanization processes. The concentration of abandoned tea lands around the urban centers might be influenced by factors such as infrastructure development, population growth, or shifts in agricultural practices. This knowledge also contributes to a broader understanding of the evolving landscape dynamics, informing strategies for sustainable land management and urban planning in the study area.

4. Conclusions

In conclusion, the utilization of LULC trajectory methods with Landsat and Google Earth imagery has proven instrumental in comprehensively assessing tea land abandonment in the study area. The research findings underscore the effectiveness of these methods, highlighting their valuable contribution to detecting land use changes with high accuracy. The temporal analysis provides a comprehensive overview of the observed tea land changes over the past 8 years, revealing a noteworthy decline in tea cultivation. The shift from 9818 ha (21.6%) in 2015 to 8446.4 ha (18.6%) in 2023 underscores the significant impact on the tea landscape. The most striking decline occurred from 2015 to 2019, emphasizing the need for a closer examination of this period to uncover the underlying factors influencing tea land abandonment.
The trajectories identified through spatiotemporal analysis offer a detailed understanding of the transitions of tea lands. The finding that only 3.7% of pixels were continuously classified as tea land over a period of 8 years suggests relatively limited spatial stability in tea cultivation compared to other land cover types. This inconsistency may stem from various factors, such as land use shifts, agricultural practices, or economic or environmental changes affecting the tea lands. The identified trajectories of tea land abandonment, as depicted in Figure 6 and Figure 9, provide critical insights into the spatial and temporal dynamics of this phenomenon. The widespread distribution of abandoned tea lands across the landscape implies that this issue is not confined to specific places but rather extends throughout the study area. The duration analysis further reveals that a substantial portion, 35% of the abandoned tea lands, persisted in a state of abandonment for seven continuous years, emphasizing a prolonged and significant trend.
The spatiotemporal trajectories also shed light on the interconnectedness of land use dynamics and environmental processes. The shift in tea lands towards home garden and other crops, coupled with the observed growth of forest cover on abandoned tea lands, signifies a complex interplay between agricultural priorities, land development, and natural ecological processes. The regenerative capacity of ecosystems in response to tea land abandonment is evident, presenting an opportunity for the potential restoration of forested areas.
Noteworthy is the correlation between the concentration of abandoned tea lands and urban centers, particularly between Gampola and Nawalapitiya. This spatial distribution, highlighted in the tea land abandoned density map (Figure 11), suggests a dynamic interaction between urban development and tea land abandonment. The simultaneous gain in built-up areas surrounding these urban centers further supports this correlation, emphasizing the need for a holistic understanding of the interplay between land use changes and urbanization processes.
It is clear from these results that the LULC trajectory methodology allows identification of abandoned tea lands while revealing the other changes such as tea gain and abandonment in different time periods. These research findings provide crucial geographical information for stakeholders involved in tea cover enforcement and land management. The identification of factors influencing tea land abandonment and the spatial patterns observed in this study pave the way for future research directions. Understanding the underlying causes of tea land abandonment and its implications for landscape dynamics will contribute to informed decision-making and sustainable land management strategies in the study area and beyond.

Author Contributions

Conceptualization, Sirantha Jagath Kumara Athauda and Takehiro Morimoto; methodology, Sirantha Jagath Kumara Athauda and Takehiro Morimoto; software, Sirantha Jagath Kumara Athauda; validation, Sirantha Jagath Kumara Athauda and Takehiro Morimoto; formal analysis, Sirantha Jagath Kumara Athauda; investigation, Sirantha Jagath Kumara Athauda and Takehiro Morimoto; resources, Sirantha Jagath Kumara Athauda and Takehiro Morimoto; data curation, Sirantha Jagath Kumara Athauda; writing—original draft preparation, Sirantha Jagath Kumara Athauda; writing—review and editing, Sirantha Jagath Kumara Athauda and Takehiro Morimoto; visualization, Sirantha Jagath Kumara Athauda; supervision, Takehiro Morimoto; project administration, Takehiro Morimoto; funding acquisition, Takehiro Morimoto. All authors have read and agreed to the published version of the manuscript.

Funding

This study was supported by the Japan Society for the Promotion of Science (JSPS) KAKENHI Grant Number 23K00997.

Data Availability Statement

The data presented in this study is available on request from the corresponding author.

Acknowledgments

The authors express their gratitude to the anonymous reviewers and the editor for their valuable comments and suggestions to improve the manuscript.

Conflicts of Interest

The authors declare no conflicts of interest.

References

  1. Crops and Livestock Products—FAOSTAT. Available online: https://www.fao.org/faostat/en/#data/QCL/visualize (accessed on 7 August 2025).
  2. Annual Report 2023. Available online: http://srilankateaboard.lk/publications/ (accessed on 7 August 2025).
  3. Khan, N.; Mukhtar, H. Tea and Health: Studies in Humans. Curr. Pharm. Des. 2013, 19, 6141–6147. [Google Scholar] [CrossRef] [PubMed]
  4. Hicks, A. Current Status and Future Development of Global Tea Production and Tea Products. Au J. Technol. 2009, 12, 251–264. [Google Scholar]
  5. Jayasinghe, S.L.; Kumar, L. Causes of Tea Land Dynamics in Sri Lanka between 1995 and 2030. Reg. Environ. Change 2023, 23, 127. [Google Scholar] [CrossRef]
  6. Hossan, M.S.; Afjal, M.I.; Hasan, M.F.; Hanif, M.A. Assessment of Land Dynamics Transformation into Tea Plantations Using Support Vector Machine. Trees For. People 2024, 18, 100703. [Google Scholar] [CrossRef]
  7. Wang, B.; Li, J.; Jin, X.; Xiao, H. Mapping Tea Plantations from Multi-Seasonal Landsat-8 OLI Imageries Using a Random Forest Classifier. J. Indian. Soc. Remote Sens. 2019, 47, 1315–1329. [Google Scholar] [CrossRef]
  8. Kottawa-Arachchi, J.D.; Ranatunga, M.A.B.; Amarakoon, A.M.T.; Gunasekare, M.T.K.; Attanayake, R.N.; Sharma, R.K.; Chaudhary, H.K.; Sood, V.K.; Katoch, R.; Banyal, D.K. Variation of Catechin and Caffeine Content in Exotic Collection of Tea [Camellia sinensis (L.) O. Kuntze] in Sri Lanka and Potential Implication in Breeding Cultivars with Enhanced Quality and Medicinal Properties. Food Chem. Adv. 2022, 1, 100108. [Google Scholar] [CrossRef]
  9. Ceylon Tea Industry Capability Report. Available online: https://www.srilankabusiness.com/ebooks/industry-capability-report-tea-2021.pdf (accessed on 29 November 2024).
  10. Ceylon Tea Export Performance in Sri Lanka—EDB Sri Lanka. Available online: https://www.srilankabusiness.com/tea/about-tea/export-performance.html (accessed on 7 August 2025).
  11. Herath, S.; Sugiyama, M.; Sugiyama, K.; Arahata, K. Consequence of the Policy Changes on the Plantation Agriculture A Case Study of the Sri Lanka Tea Industry (STI). Jpn. J. Farm Manag. 1998, 36, 137–142. [Google Scholar]
  12. Annual Report 2021. Available online: https://www.srilankateaboard.lk/wp-content/uploads/2023/09/Annual-report-2021.pdf (accessed on 29 November 2024).
  13. Industry Facts—EDB Sri Lanka. Available online: https://www.srilankabusiness.com/tea/ (accessed on 7 August 2025).
  14. Review of Tea Industry in Sri Lanka for Climate Analysis. Available online: https://www.dilmahconservation.org/pdf/review-of-tea-industry-in-sl.pdf (accessed on 17 December 2024).
  15. Parida, B.R.; Mahato, T.; Ghosh, S. Monitoring Tea Plantations during 1990–2022 Using Multi-Temporal Satellite Data in Assam (India). Trop. Ecol. 2024, 65, 387–398. [Google Scholar] [CrossRef]
  16. Prokop, P. Tea Plantations as a Driving Force of Long-Term Land Use and Population Changes in the Eastern Himalayan Piedmont. Land Use Policy 2018, 77, 51–62. [Google Scholar] [CrossRef]
  17. Das, A.C.; Noguchi, R.; Ahamed, T. Integrating an Expert System, GIS, and Satellite Remote Sensing to Evaluate Land Suitability for Sustainable Tea Production in Bangladesh. Remote Sens. 2020, 12, 4136. [Google Scholar] [CrossRef]
  18. Rahaman, S.A.; Aruchamy, S. Land Suitability Evaluation of Tea (Camellia sinensis L.) Plantation in Kallar Watershed of Nilgiri Bioreserve, India. Geographies 2022, 2, 701–723. [Google Scholar] [CrossRef]
  19. Tanui, J.K. Socio-Economic Constraints to Adoption of Yield Improving Tea Farming Technologies: A Study of Small Holder Tea Farmers Affiliated to Estates in Nandi Hills, Kenya. Afr. J. Agric. Res. 2012, 7, 2560–2568. [Google Scholar] [CrossRef]
  20. Dutta, R.; Stein, A.; Smaling, E.M.A.; Bhagat, R.M.; Hazarika, M. Effects of Plant Age and Environmental and Management Factors on Tea Yield in Northeast India. Agron. J. 2010, 102, 1290–1301. [Google Scholar] [CrossRef]
  21. Hajiboland, R. Environmental and Nutritional Requirements for Tea Cultivation. Folia Hortic. 2017, 29, 199–220. [Google Scholar] [CrossRef]
  22. Jayasinghe, H.; Suriyagoda, L.D.B.; Karunarathne, A.S.; Wijeratna, M.A. Modelling Shoot Growth and Yield of Ceylon Tea Cultivar TRI-2025 (Camellia sinensis (L.) O. Kuntze). J. Agric. Sci. 2018, 156, 200–214. [Google Scholar] [CrossRef]
  23. Jayasinghe, S.L.; Kumar, L. Potential Impact of the Current and Future Climate on the Yield, Quality, and Climate Suitability for Tea [Camellia sinensis (L.) O. Kuntze]: A Systematic Review. Agronomy 2021, 11, 619. [Google Scholar] [CrossRef]
  24. Jayasinghe, S.L.; Kumar, L. Modeling the Climate Suitability of Tea [Camellia sinensis (L.) O. Kuntze] in Sri Lanka in Response to Current and Future Climate Change Scenarios. Agric. For. Meteorol. 2019, 272, 102–117. [Google Scholar] [CrossRef]
  25. Jayasinghe, S.L.; Kumar, L. Climate Change May Imperil Tea Production in the Four Major Tea Producers According to Climate Prediction Models. Agronomy 2020, 10, 1536. [Google Scholar] [CrossRef]
  26. Herath, D.; Weersink, A. From Plantations to Smallholder Production: The Role of Policy in the Reorganization of the Sri Lankan Tea Sector. World Dev. 2009, 37, 1759–1772. [Google Scholar] [CrossRef]
  27. Ganewatta, G.; Edwards, G.W. The Sri Lanka Tea Industry: Economic Issues and Government Policies. In Proceedings of the 44th Annual Conference of Australian Agricultural and Resources Economics Society, University of Sydney, Sydney, Australia, 23–25 January 2000. [Google Scholar]
  28. Wickramasinghe, D.A.; Cameron, D. A Cultural Political Economy of Business Strategy in a Developing Country Context: The Case of the Sri Lankan Tea Industry; University of Queensland: Brisbane, Australia, 2004. [Google Scholar]
  29. Mahindapala, K.; Jayathilaka, M.; Jayawardane, L.; Kopiyawattage, K.P.P.; De Mel, M.P.M. Role and Capacity of Tea Societies in the Smallholding Sector in Sri Lanka: An Assessment Based on the Perceptions of Extension Officers. Trop. Agric. Res. 2020, 31, 43–55. [Google Scholar] [CrossRef]
  30. Jayasinghe, S.L.; Kumar, L.; Hasan, M.K. Relationship between Environmental Covariates and Ceylon Tea Cultivation in Sri Lanka. Agronomy 2020, 10, 476. [Google Scholar] [CrossRef]
  31. Palihakkara, I.R.; Mohammed, A.J.; Inoue, M. Current Livelihood Condition of and Futurity of Tea Farming for Marginal Small Tea Farm Holders (MSTH) of Sri Lanka: Case Study from Badulla and Matara District. Environ. Nat. Resour. Res. 2015, 5, 11–21. [Google Scholar] [CrossRef]
  32. Fernando, T.; Gunawardena, A. Determination of Convertion of Tea Lands in Kandy District Using Different Remote Sensing Indices. In Proceedings of the Asian Conference on Remote Sensing (ACRS), Colombo, Sri Lanka, 17–21 October 2016; pp. 17–21. [Google Scholar]
  33. Atzberger, C. Advances in Remote Sensing of Agriculture: Context Description, Existing Operational Monitoring Systems and Major Information Needs. Remote Sens. 2013, 5, 949–981. [Google Scholar] [CrossRef]
  34. Löw, F.; Fliemann, E.; Abdullaev, I.; Conrad, C.; Lamers, J.P. Mapping Abandoned Agricultural Land in Kyzyl-Orda, Kazakhstan Using Satellite Remote Sensing. Appl. Geogr. 2015, 62, 377–390. [Google Scholar] [CrossRef]
  35. Wang, Y.; Song, W. Mapping Abandoned Cropland Changes in the Hilly and Gully Region of the Loess Plateau in China. Land 2021, 10, 1341. [Google Scholar] [CrossRef]
  36. Song, W. Mapping Cropland Abandonment in Mountainous Areas Using an Annual Land-Use Trajectory Approach. Sustainability 2019, 11, 5951. [Google Scholar] [CrossRef]
  37. Wang, D.; Gong, J.; Chen, L.; Zhang, L.; Song, Y.; Yue, Y. Spatio-Temporal Pattern Analysis of Land Use/Cover Change Trajectories in Xihe Watershed. Int. J. Appl. Earth Obs. Geoinf. 2012, 14, 12–21. [Google Scholar] [CrossRef]
  38. Yang, D.; Song, W. Tracking Land Use Trajectory to Map Abandoned Farmland in Mountainous Area. Ecol. Inform. 2023, 75, 102103. [Google Scholar] [CrossRef]
  39. Zomlot, Z.; Verbeiren, B.; Huysmans, M.; Batelaan, O. Trajectory Analysis of Land Use and Land Cover Maps to Improve Spatial–Temporal Patterns, and Impact Assessment on Groundwater Recharge. J. Hydrol. 2017, 554, 558–569. [Google Scholar] [CrossRef]
  40. Mena, C.F. Trajectories of Land-Use and Land-Cover in the Northern Ecuadorian Amazon. Photogramm. Eng. Remote Sens. 2008, 74, 737–751. [Google Scholar] [CrossRef]
  41. Dara, A.; Baumann, M.; Kuemmerle, T.; Pflugmacher, D.; Rabe, A.; Griffiths, P.; Hölzel, N.; Kamp, J.; Freitag, M.; Hostert, P. Mapping the Timing of Cropland Abandonment and Recultivation in Northern Kazakhstan Using Annual Landsat Time Series. Remote Sens. Environ. 2018, 213, 49–60. [Google Scholar] [CrossRef]
  42. Xiao, Z.; Huang, X.; Zang, Z.; Yang, H. Spatio-Temporal Variation and the Driving Forces of Tea Production in China over the Last 30 Years. J. Geogr. Sci. 2018, 28, 275–290. [Google Scholar] [CrossRef]
  43. De Costa, W.A.; Mohotti, A.J.; Wijeratne, M.A. Ecophysiology of Tea. Braz. J. Plant Physiol. 2007, 19, 299–332. [Google Scholar] [CrossRef]
  44. Dharmasena, P.; Bhat, M. Economic Analysis of Multipurpose Agroforestry Plantation in Abandoned Tea Lands in Mid Country of Sri Lanka. J. Agric. Res. 2012, 50, 271–278. [Google Scholar]
  45. Population by DS Division and Age. 2022. Available online: http://srilankaeldercare.gov.lk/web_3/statistic.html (accessed on 20 December 2024).
  46. Sri Lanka Census of Population and Housing. 2011. Available online: http://203.94.94.83:8041/index.php?fileName=P1&gp=Activities&tpl=3 (accessed on 20 December 2024).
  47. Pareeth, S.; Karimi, P.; Shafiei, M.; De Fraiture, C. Mapping Agricultural Landuse Patterns from Time Series of Landsat 8 Using Random Forest Based Hierarchial Approach. Remote Sens. 2019, 11, 601. [Google Scholar] [CrossRef]
  48. Nguyen, H.T.T.; Doan, T.M.; Radeloff, V. Applying Random Forest Classification to Map Land Use/Land Cover Using Landsat 8 OLI. Int. Arch. Photogramm. Remote Sens. Spat. Inf. Sci. 2018, 42, 363–367. [Google Scholar] [CrossRef]
  49. Rodriguez-Galiano, V.F.; Ghimire, B.; Rogan, J.; Chica-Olmo, M.; Rigol-Sanchez, J.P. An Assessment of the Effectiveness of a Random Forest Classifier for Land-Cover Classification. ISPRS J. Photogramm. Remote Sens. 2012, 67, 93–104. [Google Scholar] [CrossRef]
  50. Tilahun, A.; Teferie, B. Accuracy Assessment of Land Use Land Cover Classification Using Google Earth. Am. J. Environ. Prot. 2015, 4, 193–198. [Google Scholar] [CrossRef]
  51. Islami, F.A.; Tarigan, S.D.; Wahjunie, E.D.; Dasanto, B.D. Accuracy Assessment of Land Use Change Analysis Using Google Earth in Sadar Watershed Mojokerto Regency. In Proceedings of the IOP Conference Series: Earth and Environmental Science; IOP Publishing: Bristol, UK, 2022; Volume 950, p. 012091. [Google Scholar]
  52. Nunes, A.N.; Coelho, C.O.A.; De Almeida, A.C.; Figueiredo, A. Soil Erosion and Hydrological Response to Land Abandonment in a Central Inland Area of Portugal. Land Degrad. Dev. 2010, 21, 260–273. [Google Scholar] [CrossRef]
  53. Estel, S.; Kuemmerle, T.; Alcántara, C.; Levers, C.; Prishchepov, A.; Hostert, P. Mapping Farmland Abandonment and Recultivation across Europe Using MODIS NDVI Time Series. Remote Sens. Environ. 2015, 163, 312–325. [Google Scholar] [CrossRef]
  54. Piyathissa, S.D.S.; Kahandage, P.D.; Dissanayake, P.; Rambanda, M. Selective Tea Plucking Machine to Reduce the Labor Involvement. In Proceedings of the Third International Research Symposium, Rajarata University of Sri Lanka, Anuradhapura, Sri Lanka, 26 May 2015. [Google Scholar]
  55. Williges, U. Status of Organic Agriculture in Sri Lanka with Special Emphasis on Tea Production Systems (Camellia sinensis (L.) O. Kuntze). Ph.D. Thesis, University of Giessen, Giessen, Germany, 2004. Available online: https://orgprints.org/id/eprint/4587/1/WilligesUte-2004-10-26.pdf (accessed on 10 August 2025).
  56. Myint, S.W.; Brazel, A.; Okin, G.; Buyantuyev, A. Combined Effects of Impervious Surface and Vegetation Cover on Air Temperature Variations in a Rapidly Expanding Desert City. GISci. Remote Sens. 2010, 47, 301–320. [Google Scholar] [CrossRef]
  57. Chen, Y.; Yang, J.; Yu, W.; Ren, J.; Xiao, X.; Xia, J.C. Relationship between Urban Spatial Form and Seasonal Land Surface Temperature under Different Grid Scales. Sustain. Cities Soc. 2023, 89, 104374. [Google Scholar] [CrossRef]
  58. Bagan, H.; Yamagata, Y. Land-Cover Change Analysis in 50 Global Cities by Using a Combination of Landsat Data and Analysis of Grid Cells. Environ. Res. Lett. 2014, 9, 064015. [Google Scholar] [CrossRef]
  59. Bagan, H.; Yamagata, Y. Landsat Analysis of Urban Growth: How Tokyo Became the World’s Largest Megacity during the Last 40 Years. Remote Sens. Environ. 2012, 127, 210–222. [Google Scholar] [CrossRef]
  60. Mather, P.M.; Koch, M. Computer Processing of Remotely-Sensed Images; John Wiley & Sons: Hoboken, NJ, USA, 2022; ISBN 1-119-50282-9. [Google Scholar]
  61. Foody, G.M. Harshness in Image Classification Accuracy Assessment. Int. J. Remote Sens. 2008, 29, 3137–3158. [Google Scholar] [CrossRef]
  62. Xiao, G.; Zhu, X.; Hou, C.; Xia, X. Extraction and Analysis of Abandoned Farmland: A Case Study of Qingyun and Wudi Counties in Shandong Province. J. Geogr. Sci. 2019, 29, 581–597. [Google Scholar] [CrossRef]
  63. Arachchi, M.A.S.M.M. Determination of Urban Heat Island Phenomena in a Small-Scale City, Based on Landsat 8 Data: A Case Study of Gampola Urban Area, Sri Lanka. J. Trop. Environ. 2022, 2, 1–17. [Google Scholar]
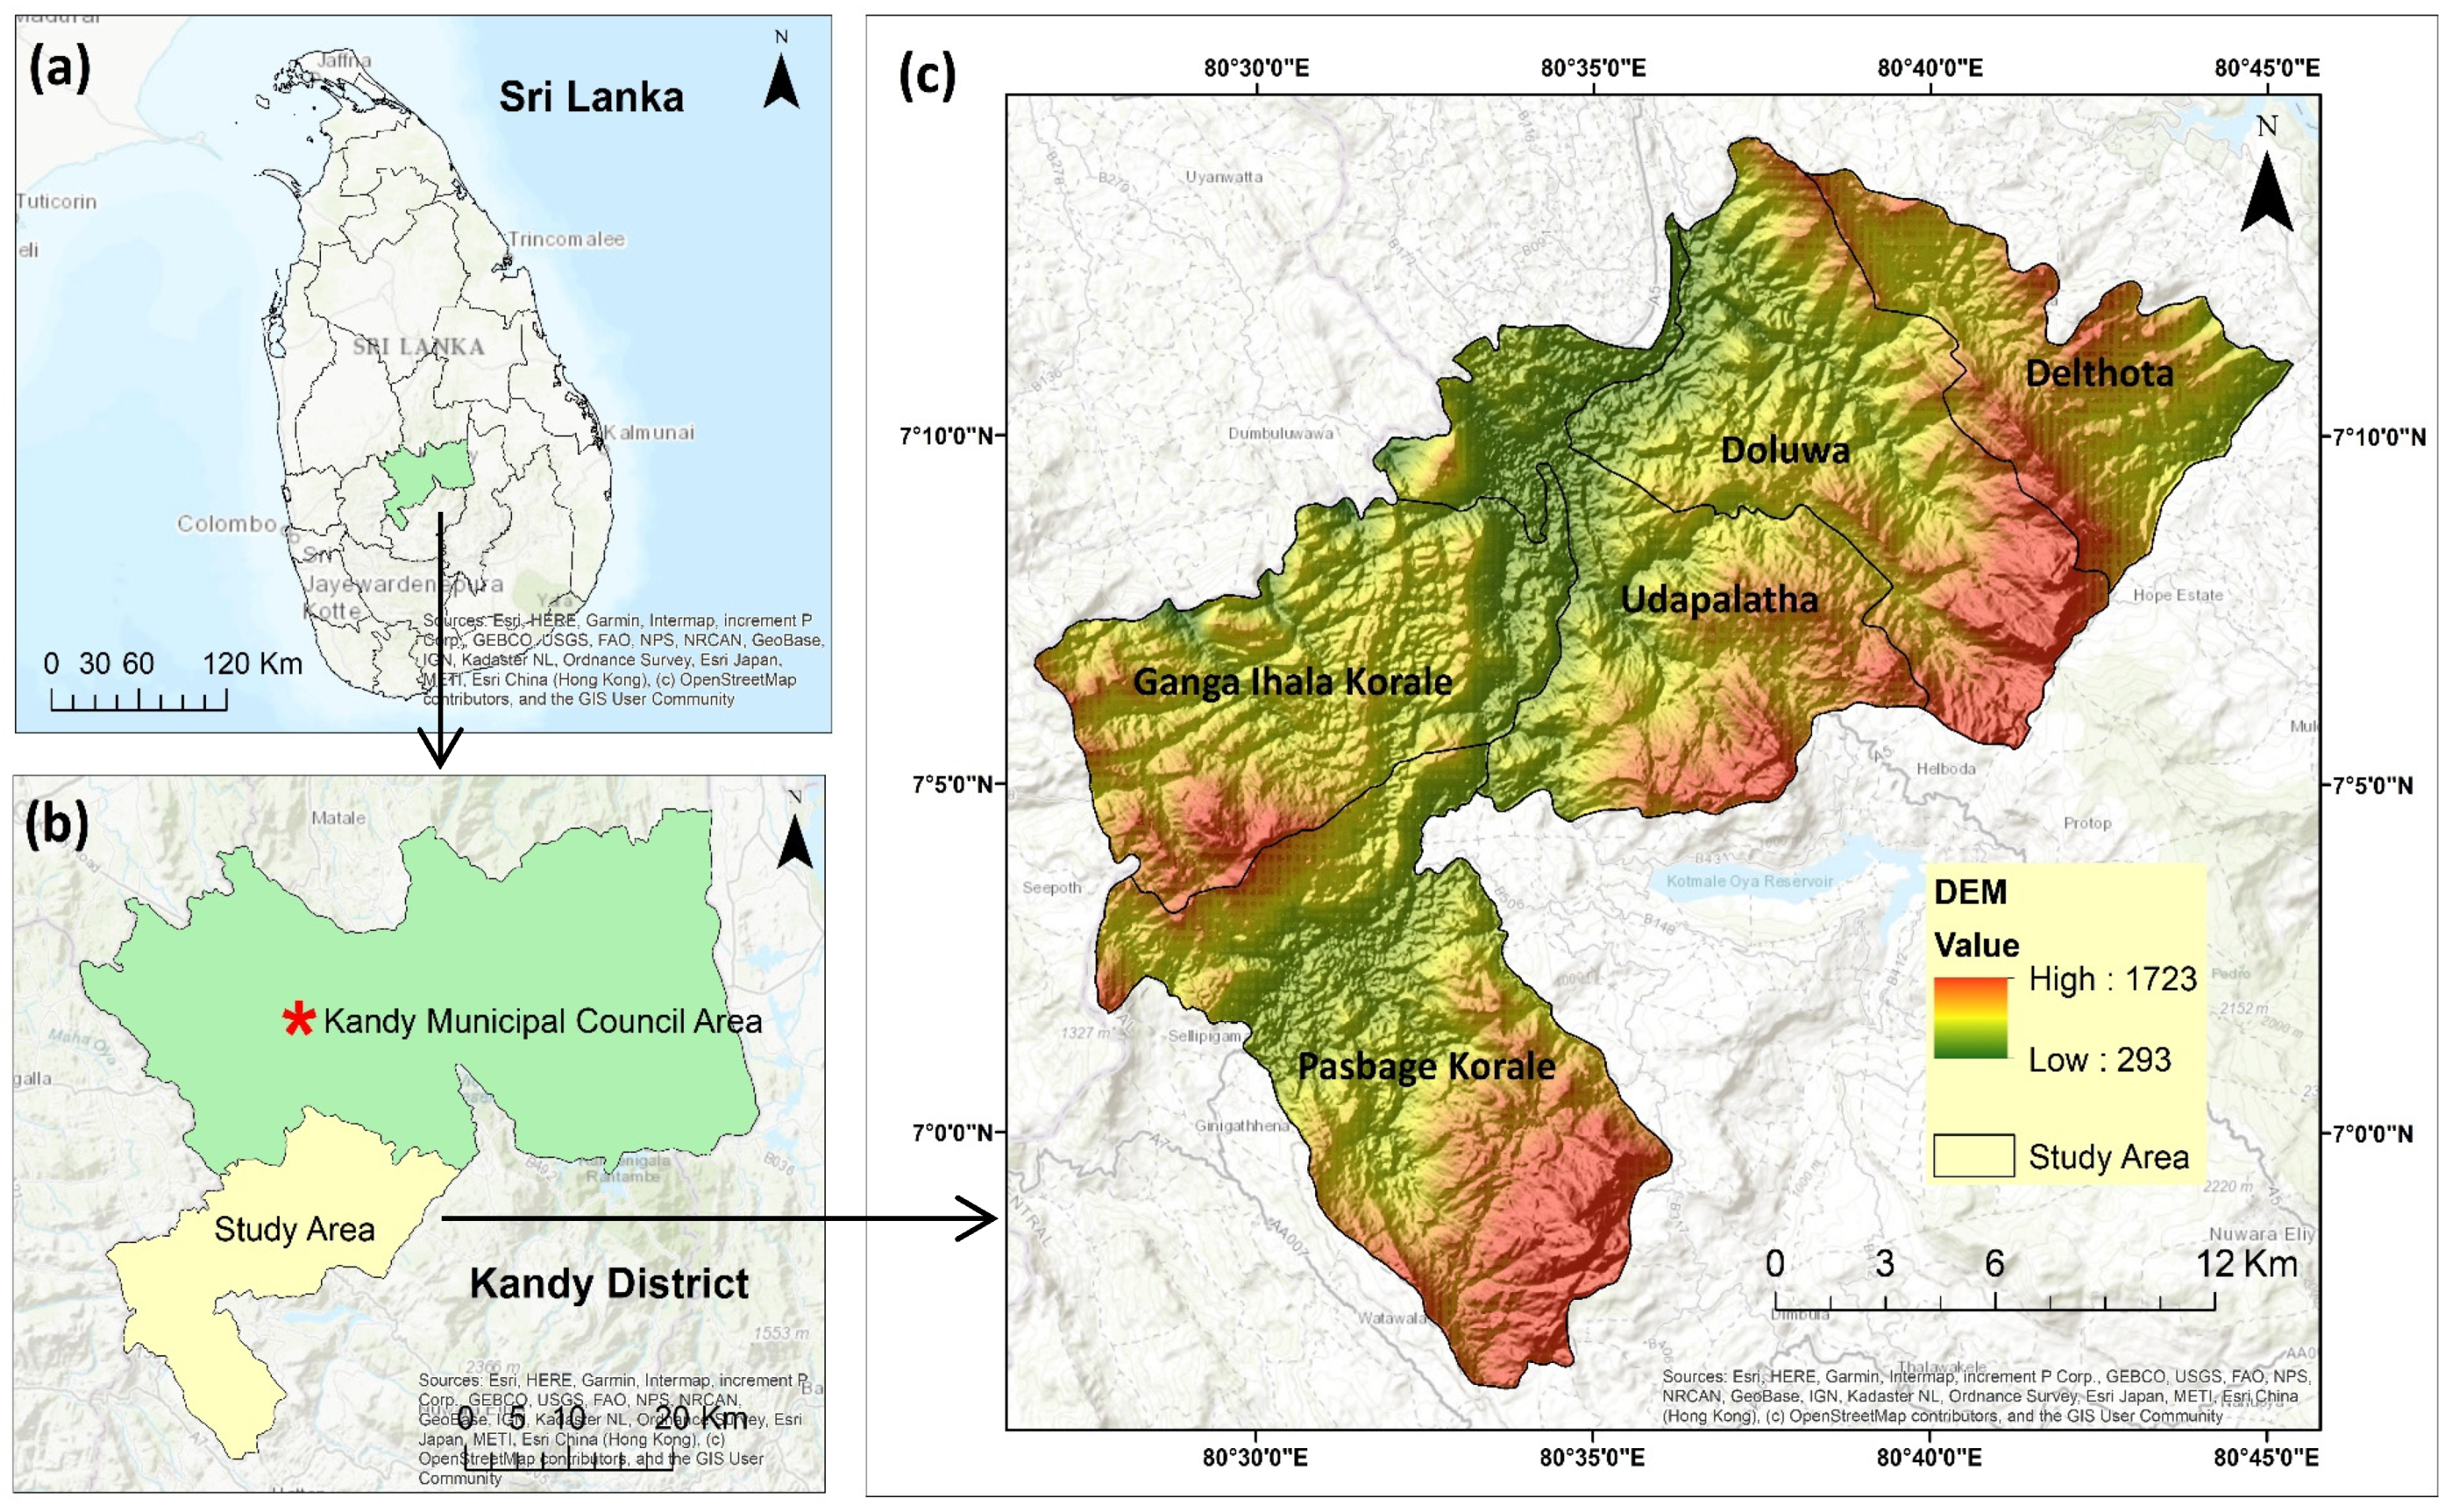
Figure 1. Study area. (a) Map of Sri Lanka showing Kandy District; (b) map of Kandy District showing the study area; and (c) DEM map of the study area with five DSDs.
Ijgi 14 00312 g001
Figure 2. Land use/cover (LULC) sample images with location information: (a) tea (T), (b) forest (F), (c) built-up area (B), (df) home garden and other crops (H), (i,j) grass and bare land (G), and (k) Water Body (W).
Ijgi 14 00312 g002
Figure 3. A workflow to illustrate the process of the Random Forest (RF) classification and validation process.
Ijgi 14 00312 g003
Figure 4. Extraction of tea land abandonment with land use/cover (LULC) trajectories Note: modified from [35].
Ijgi 14 00312 g004
Figure 5. Land use/cover (LULC) changes in the study area (2015, 2017, 2019, 2021, and 2023).
Ijgi 14 00312 g005
Figure 6. Land use/cover (LULC) trajectories from 2015 to 2023. Tea is shown in light green; abandoned tea land over the entire period (2015–2023) is in black; abandoned tea land during intermediate periods of 3–5 years is shown in purple; tea gain is shown in cyan, and intermediate tea gain is in orange; home gardens and other crops are shown in yellow; other LULC trajectories are in white; forest is in dark green; grassland and bare land are in brown; built-up areas are in red; and water bodies are in blue.
Ijgi 14 00312 g006
Figure 7. Tea land trajectories from 2015 to 2023 with elevation.
Ijgi 14 00312 g007
Figure 8. Spatial distribution of abandoned tea lands.
Ijgi 14 00312 g008
Figure 9. Total length of abandoned tea for 3 to 5 to 7 years.
Ijgi 14 00312 g009
Figure 10. Spatial distribution of abandoned tea lands with respect to land use/cover (LULC) classes.
Ijgi 14 00312 g010
Figure 11. Density of abandoned tea lands with respect to pixel count.
Ijgi 14 00312 g011
Table 1. Meta data of Landsat images.
SensorScene IDAcquisition Data
Landsat-8 OLI/TIRS
(Resolution—30 m)
LC81410552015008LGN018 January 2015
LC81410552017013LGN0113 January 2017
LC81410552019003LGN003 January 2019
LC81410552021024LGN0024 January 2021
Landsat-9 OLI/TIRS-2
(Resolution—30 m)
LC91410552023102LGN0012 April 2023
Table 2. Meta data of high-resolution PlanetScope images.
Image 1Image 2
Area of Interest Deltota, Doluwa, UdapalathaGanga Ihala Koralaya, Pasbaga Koralaya
SensorSuper DoveSuper Dove
InstrumentPSB.SDPSB.SD
Acquisition Data9 April 202311 April 2023
GSD3.7 m3.9 m
Table 3. Land use/cover (LULC) classes and details.
LULC ClassCode for
Trajectory
Analysis
DescriptionImage
Reference
TeaTTea landa
ForestFDense vegetation, forest plantation, and scrublandb
Built-up AreaBUrban residential, commercial, industrial, and transportation areasc
Home Garden and Other CropsHResidence with some form of cultivation, paddy, and other cropsd, e, f
Grass and Bare LandGGrasslands, barren lands, and open spacesi, j
Water BodyWNatural and artificial water areask
Table 5. Details of the land use/cover (LULC) distribution and changes in the study area (2015, 2017, 2019, 2021, and 2023).
LULC Class20152017201920212023
Area (ha)%Area (ha)%Area (ha)%Area (ha)%Area (ha)%
Tea 9818.021.67605.116.77756.517.18458.418.68446.418.6
Home Garden and Other Crop20,986.246.223,970.252.721,676.847.723,412.051.522,156.148.7
Forest7361.016.26789.814.96916.515.27132.715.77185.115.8
Grass and Bare Land6805.515.06416.714.18425.018.55649.612.46834.415.0
Build-up Area353.60.8549.21.2589.81.3657.51.4701.71.5
Water Body143.20.3141.00.3103.00.2110.50.2126.00.3
Cloud4.00.00.00.04.30.051.40.122.60.0
Total45,47210045,47210045,47210045,47210045,472100
Table 6. Top 22 land use/cover (LULC) trajectories and its land use proportions.
Other LULCAbandoned TeaIntermediate Tea Lost or Gain
TrajectoriesPixel CountArea (ha)%TrajectoriesPixel CountArea (ha)%TrajectoriesPixel CountArea (ha)%
T T T T T18,6301676.73.7T T T T N7252652.71.4T T T N T17,5001575.03.5
H H H H H114,59510,313.622.7T T T N N3929353.60.8T T N N T2799251.90.6
F F F F F40,7903671.18.1T T N N N5949535.41.2T N N N T4194377.50.8
G G G GG22,8932060.44.5T N N N N21,0261892.34.2T N N T T4179376.10.8
B B B B B2901261.10.6T N T N N5874528.71.2T N T N T3254292.90.6
W W W W W79371.40.2T N N T N6638597.41.3Tea Gain43,9373954.38.7
Other LULC Trajectories125,52411,297.224.8T T N T N5717514.51.1Intermediate Tea Gain42,5303827.78.4
T N T T N4448400.30.9
Total326,12629,35265Total60,833547512Total118,39310,65523
* N = non tea.
Disclaimer/Publisher’s Note: The statements, opinions and data contained in all publications are solely those of the individual author(s) and contributor(s) and not of MDPI and/or the editor(s). MDPI and/or the editor(s) disclaim responsibility for any injury to people or property resulting from any ideas, methods, instructions or products referred to in the content.