

Investigating the Impact of Inter-City Patient Mobility on Local Residents’ Equity in Access to High-Level Healthcare: A Case Study of Beijing

Abstract
1. Introduction
2. Literature Review
2.1. Inter-City Patient Mobility
2.2. Accessibility Model
2.3. Travel Modes
3. Study Area and Data Source
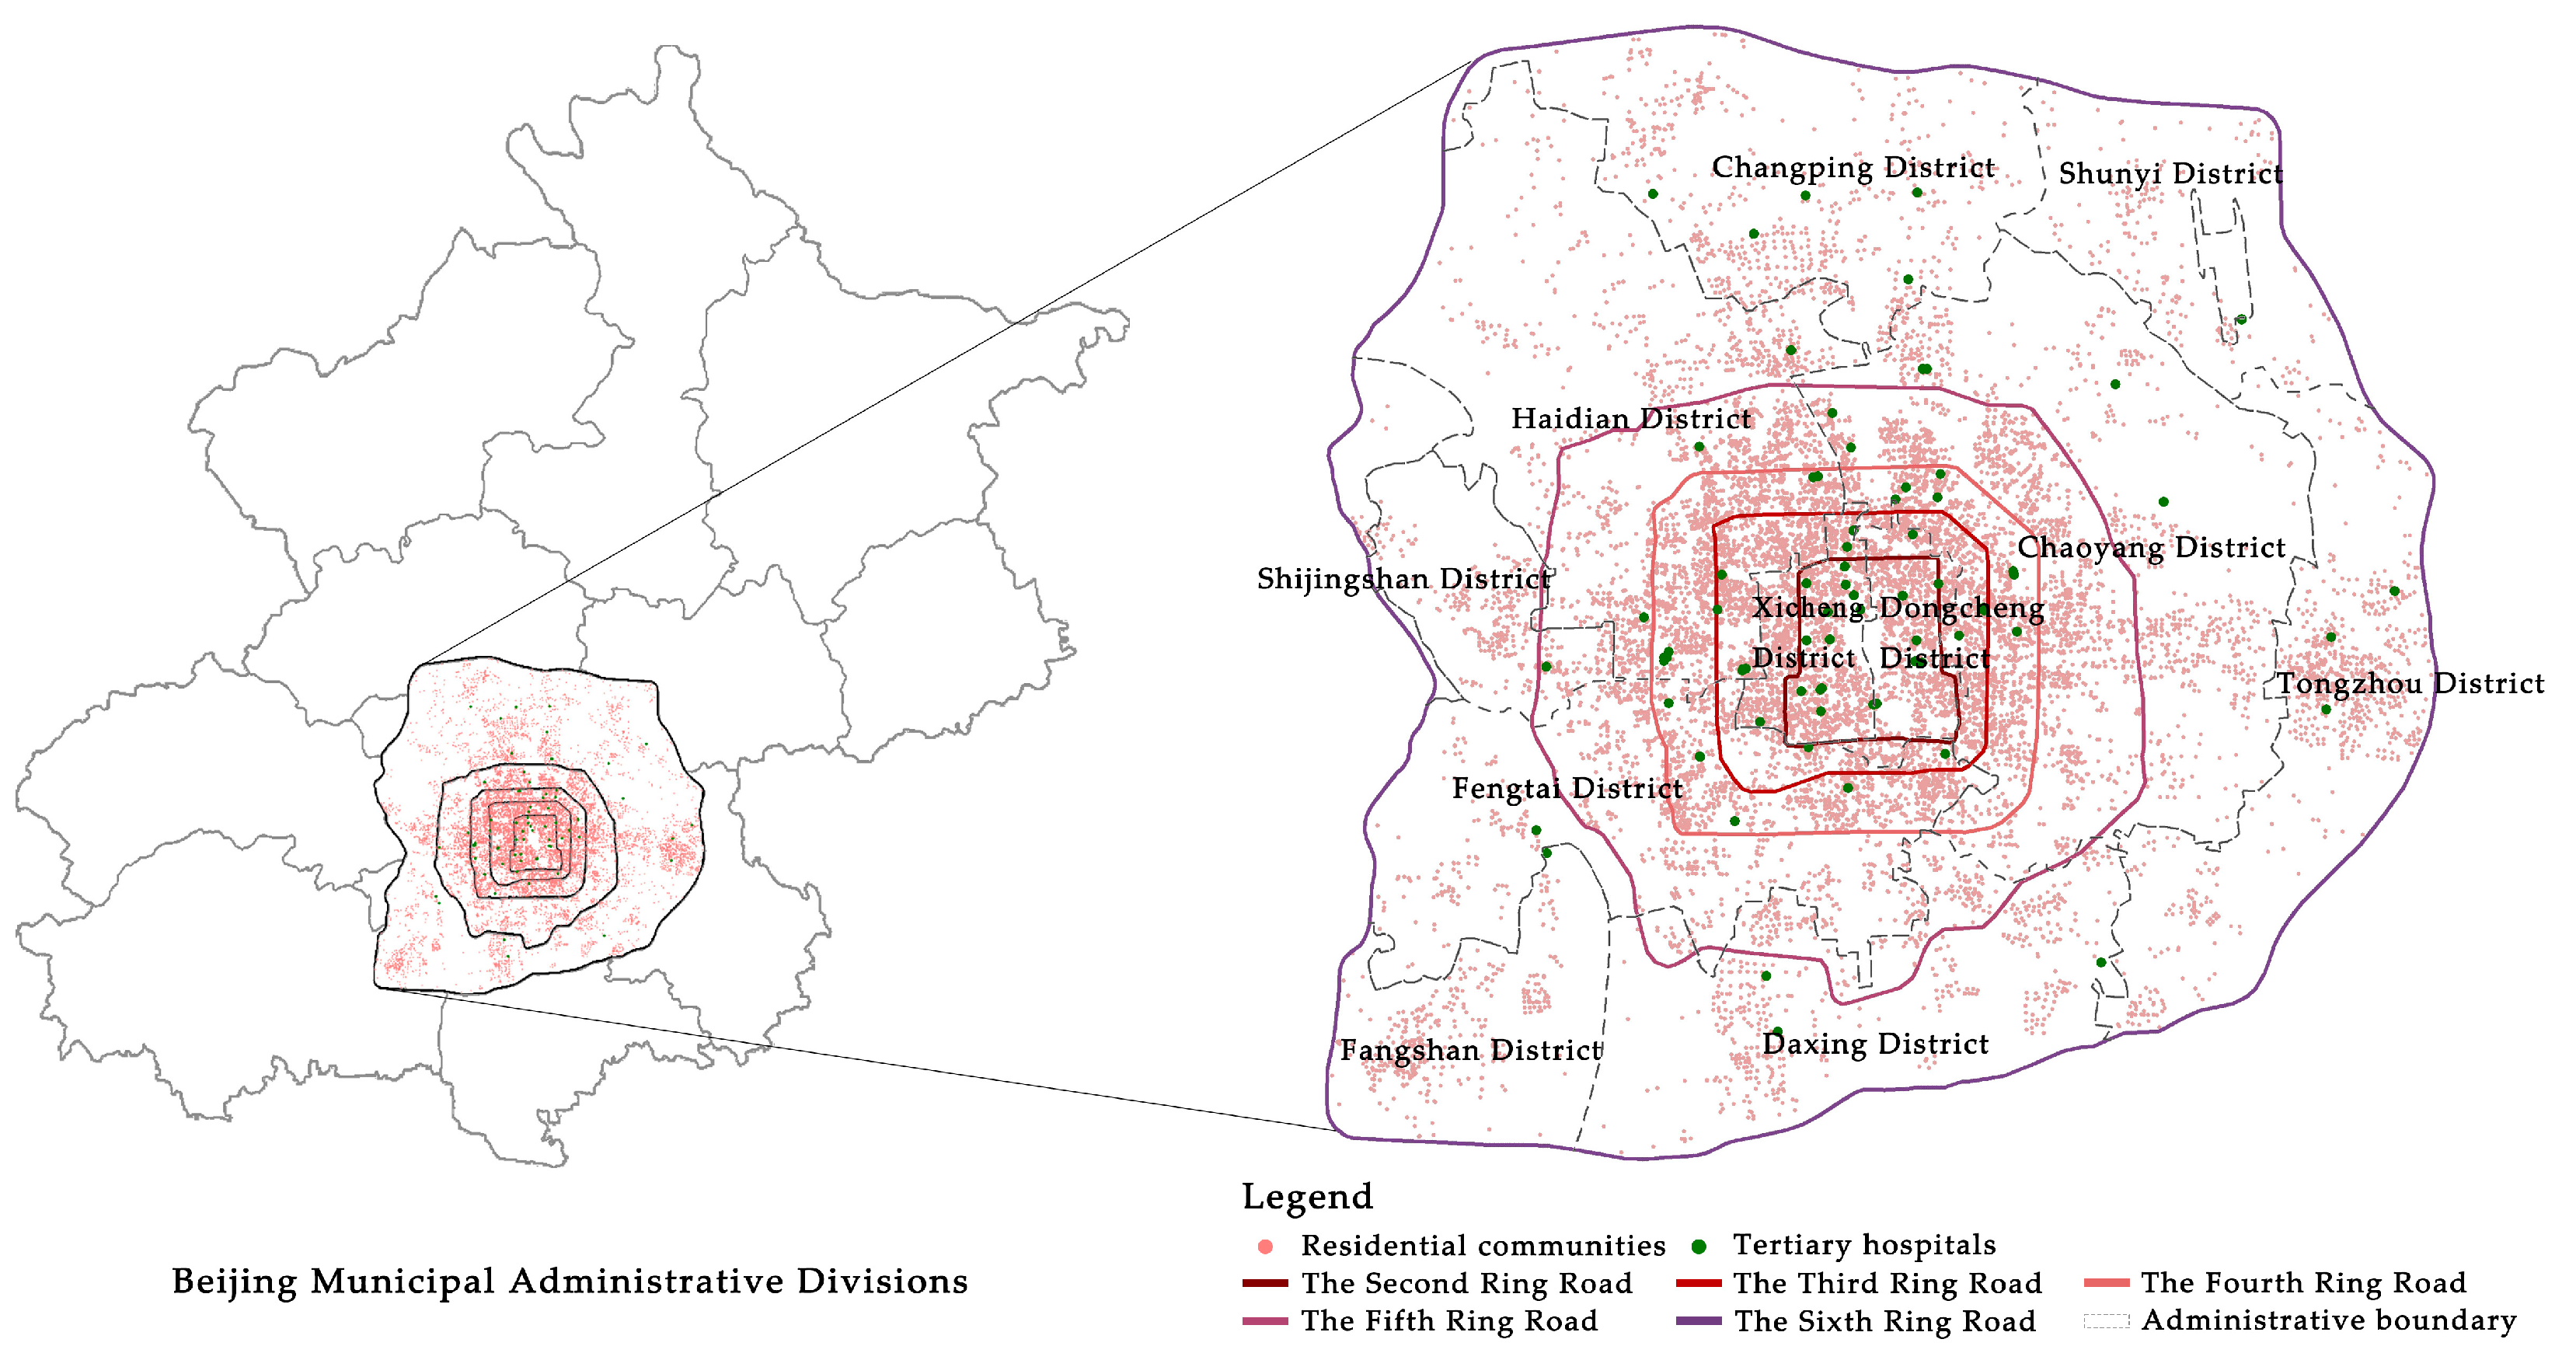
3.1. Study Area
3.2. Data Source
3.2.1. Hospital Data
3.2.2. Residential Community Data
3.2.3. Travel Cost and Travel Modes Share
4. Methodology
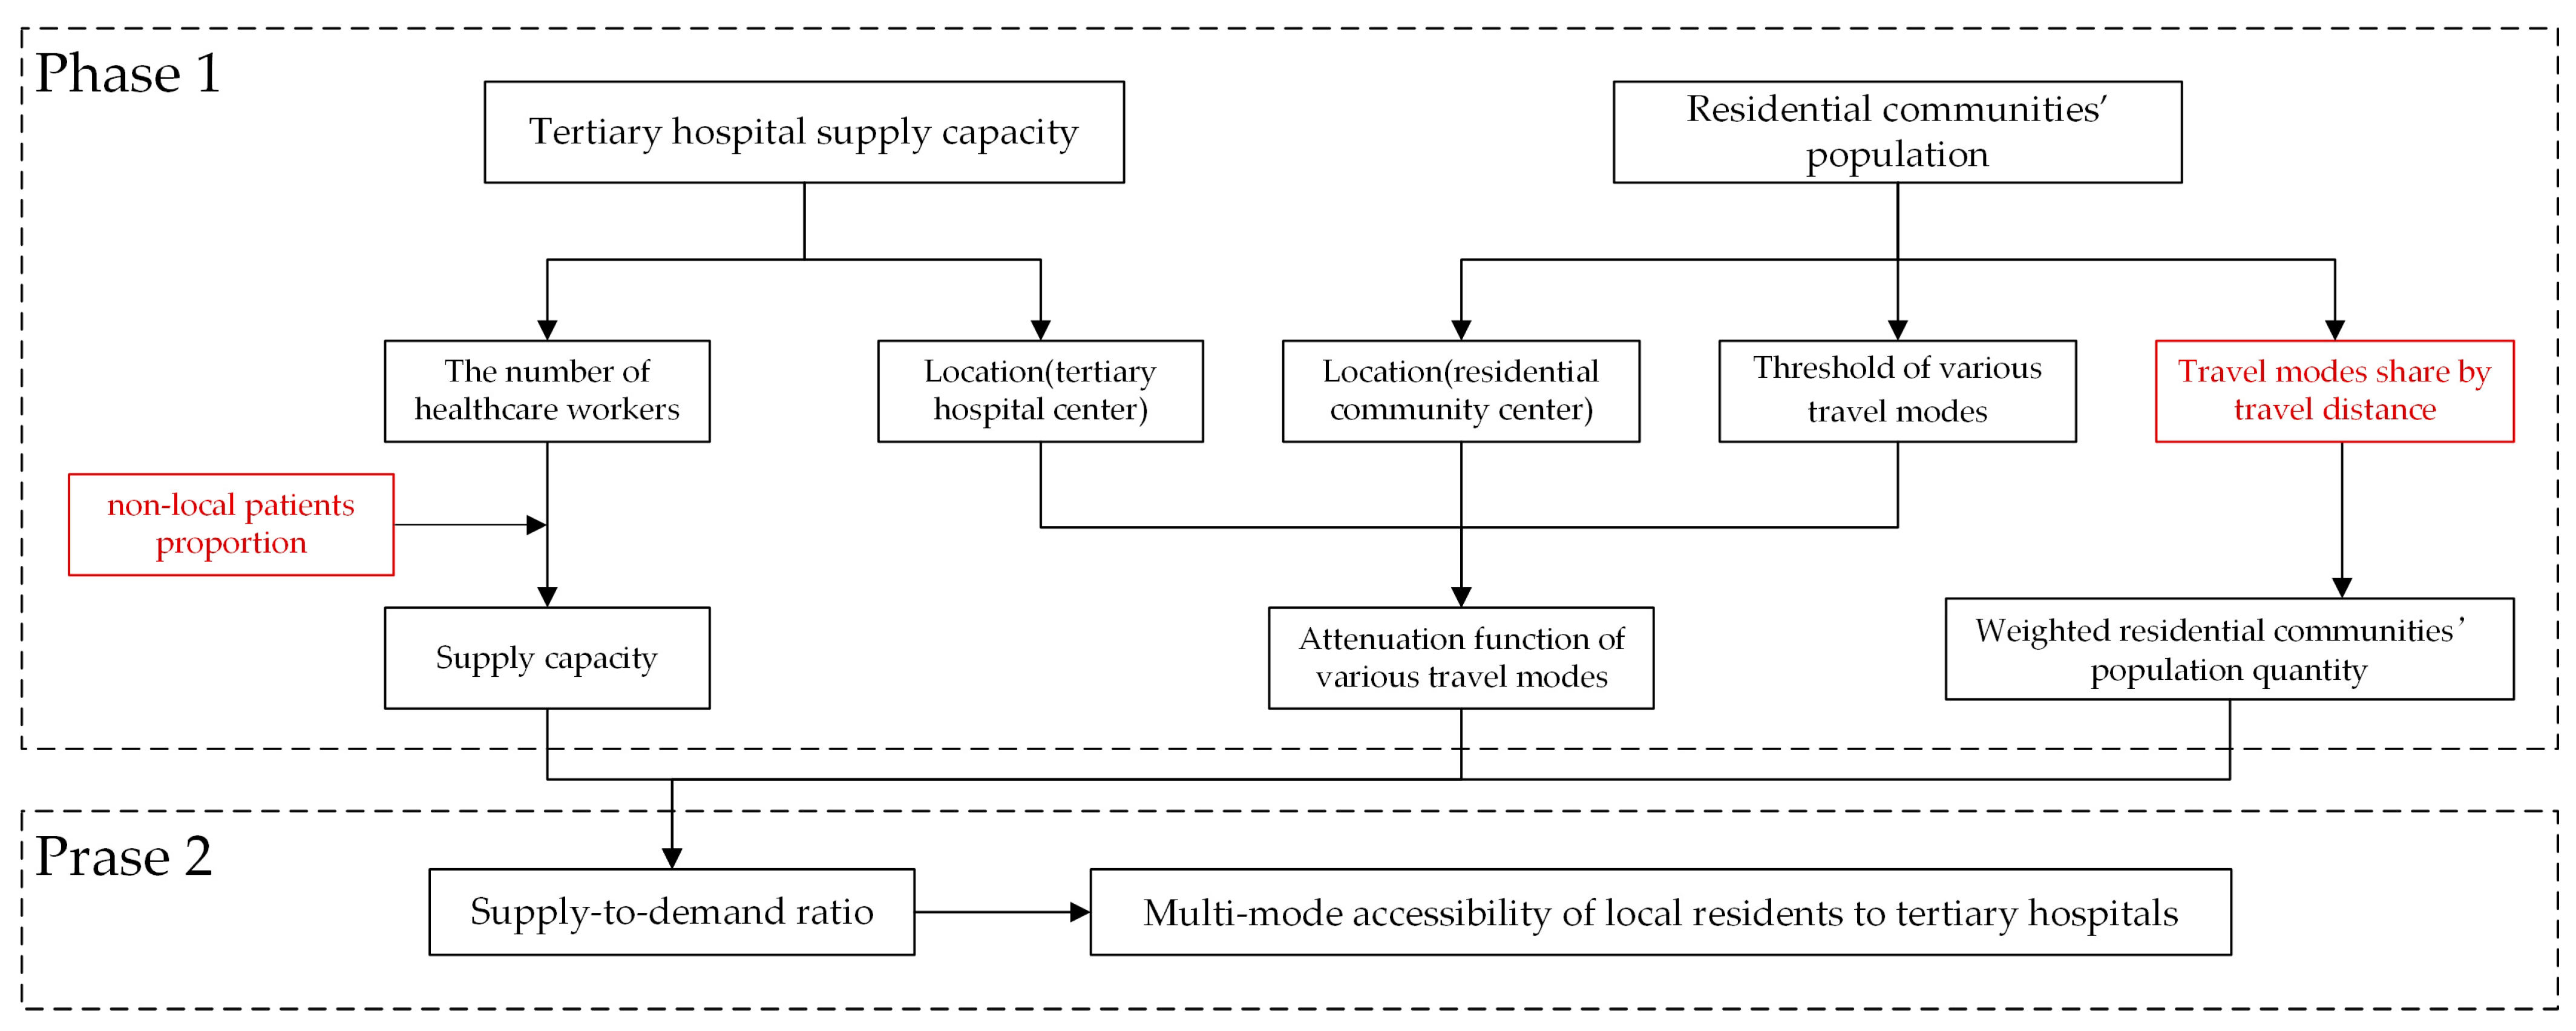
4.1. Research Framework
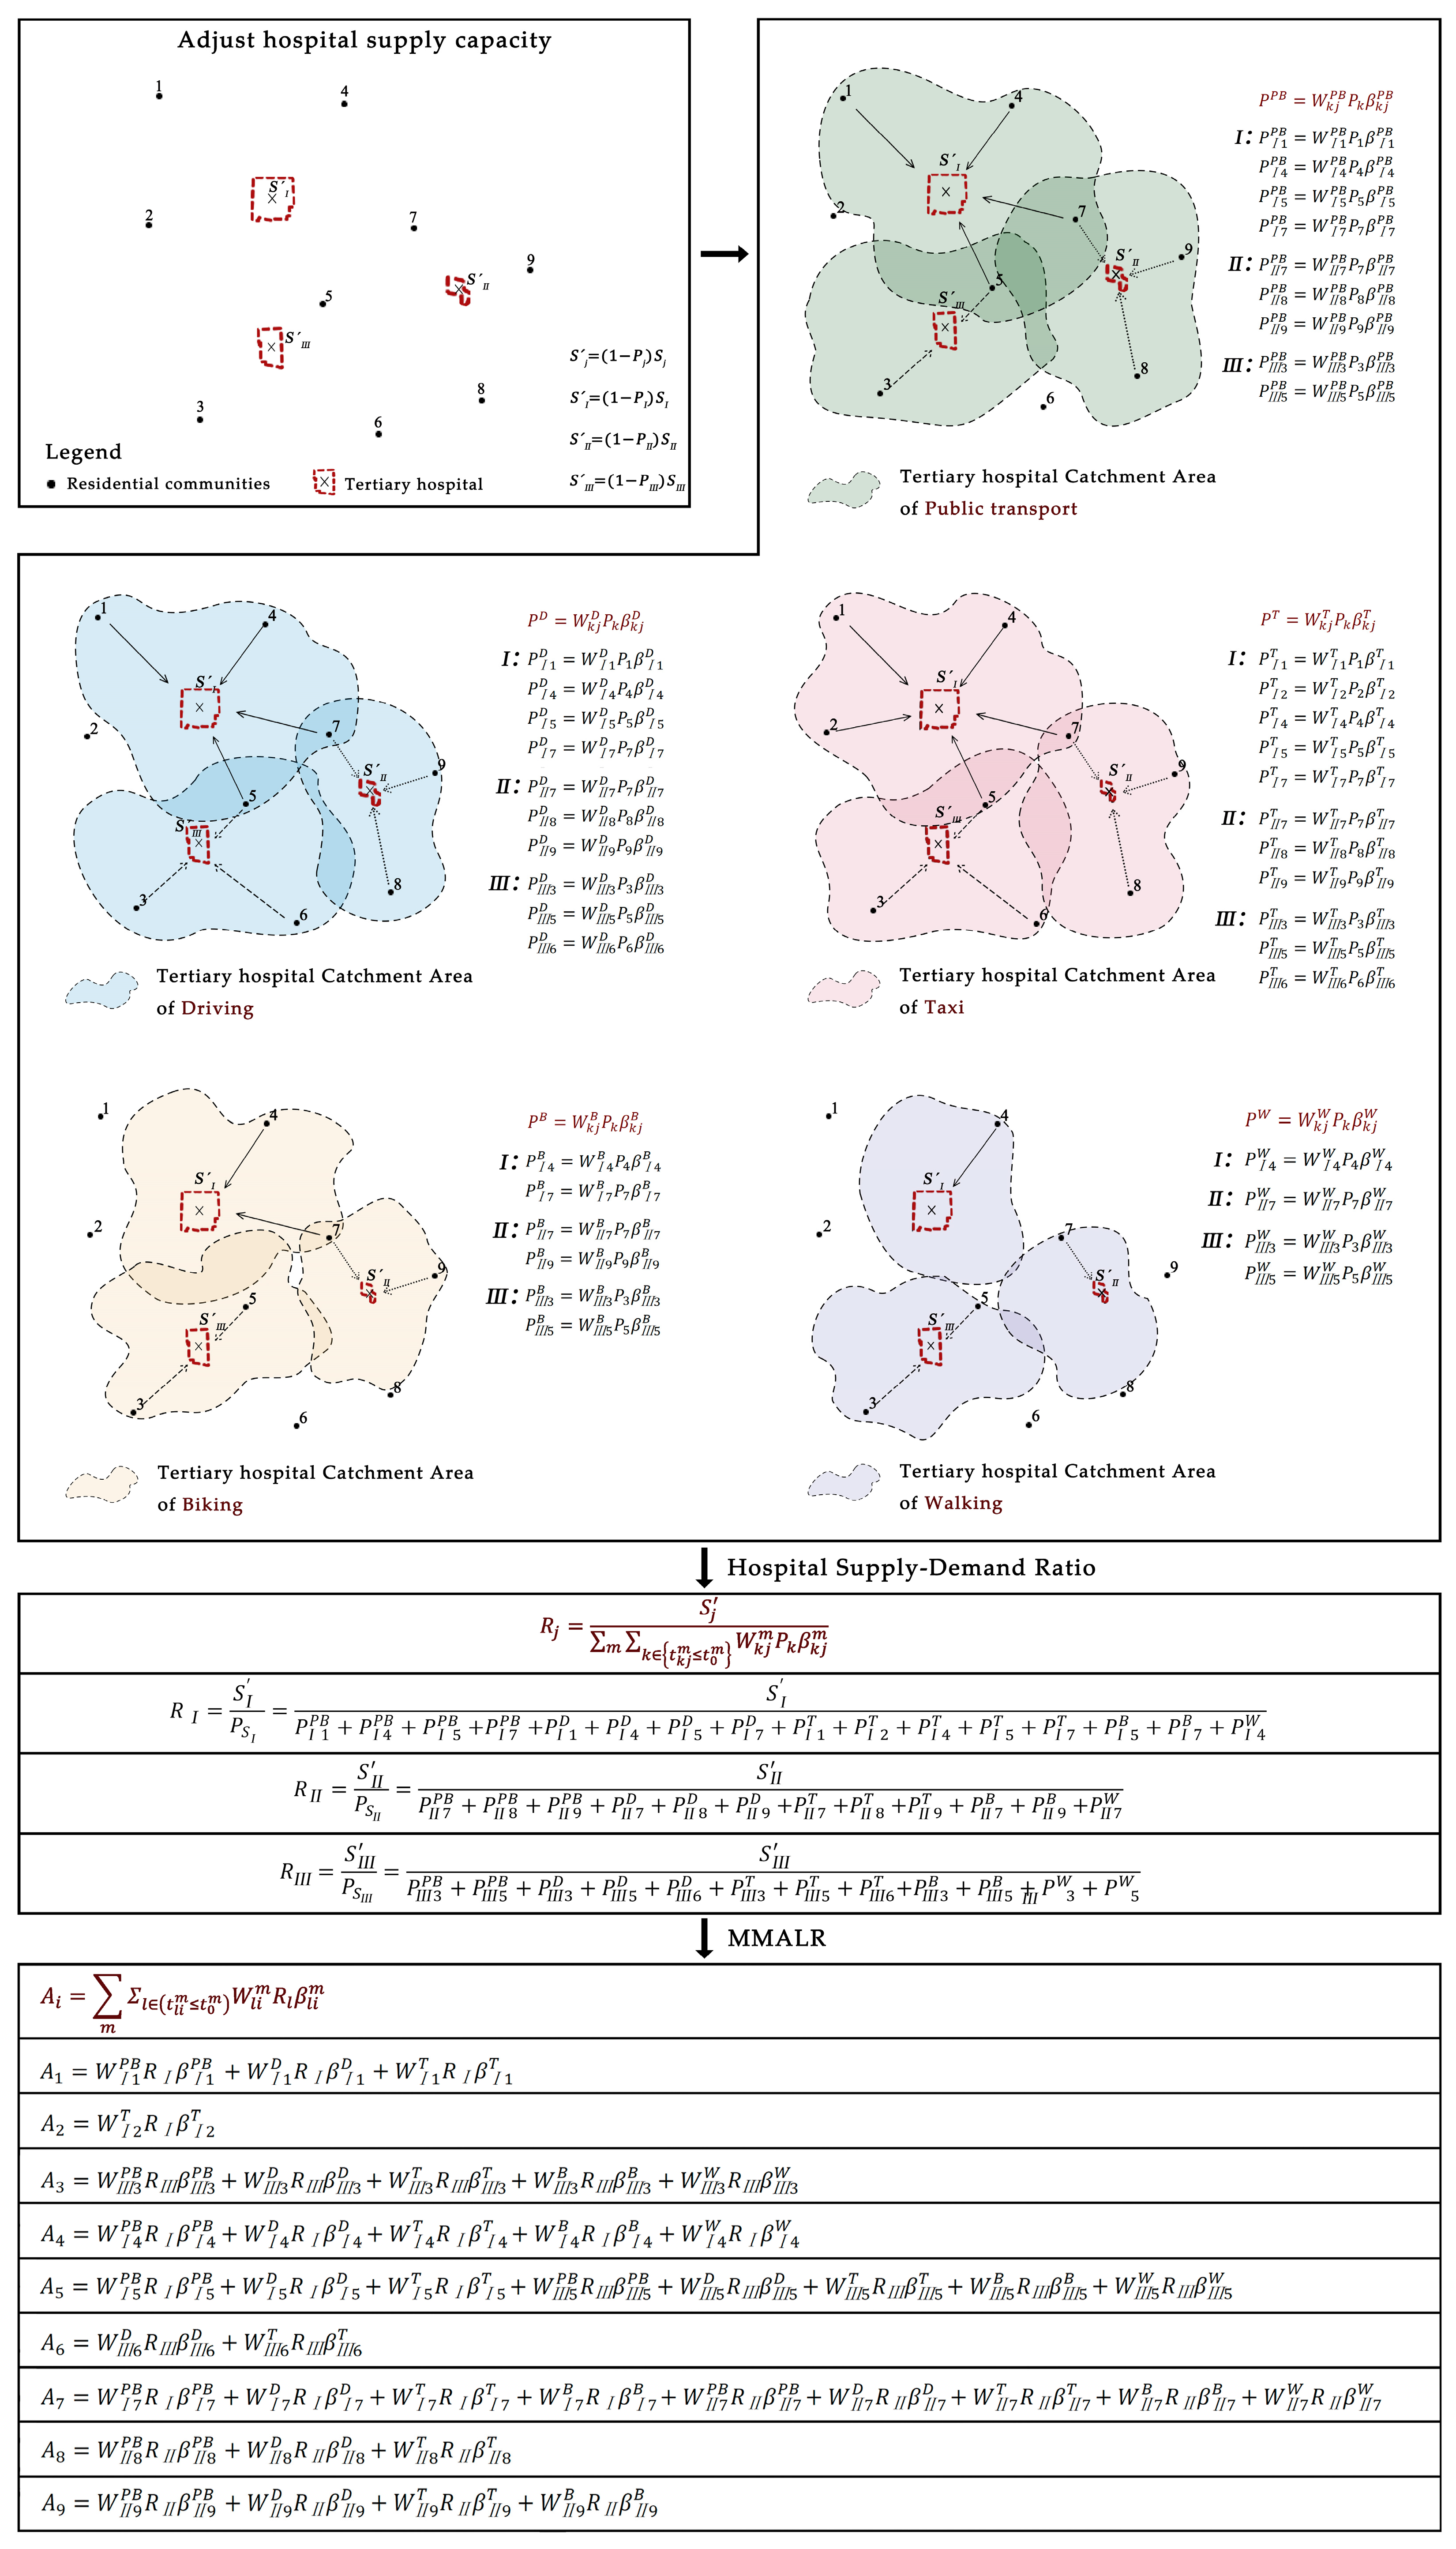
4.2. Calculation of MMALR
4.3. Gini Coefficient
5. Results
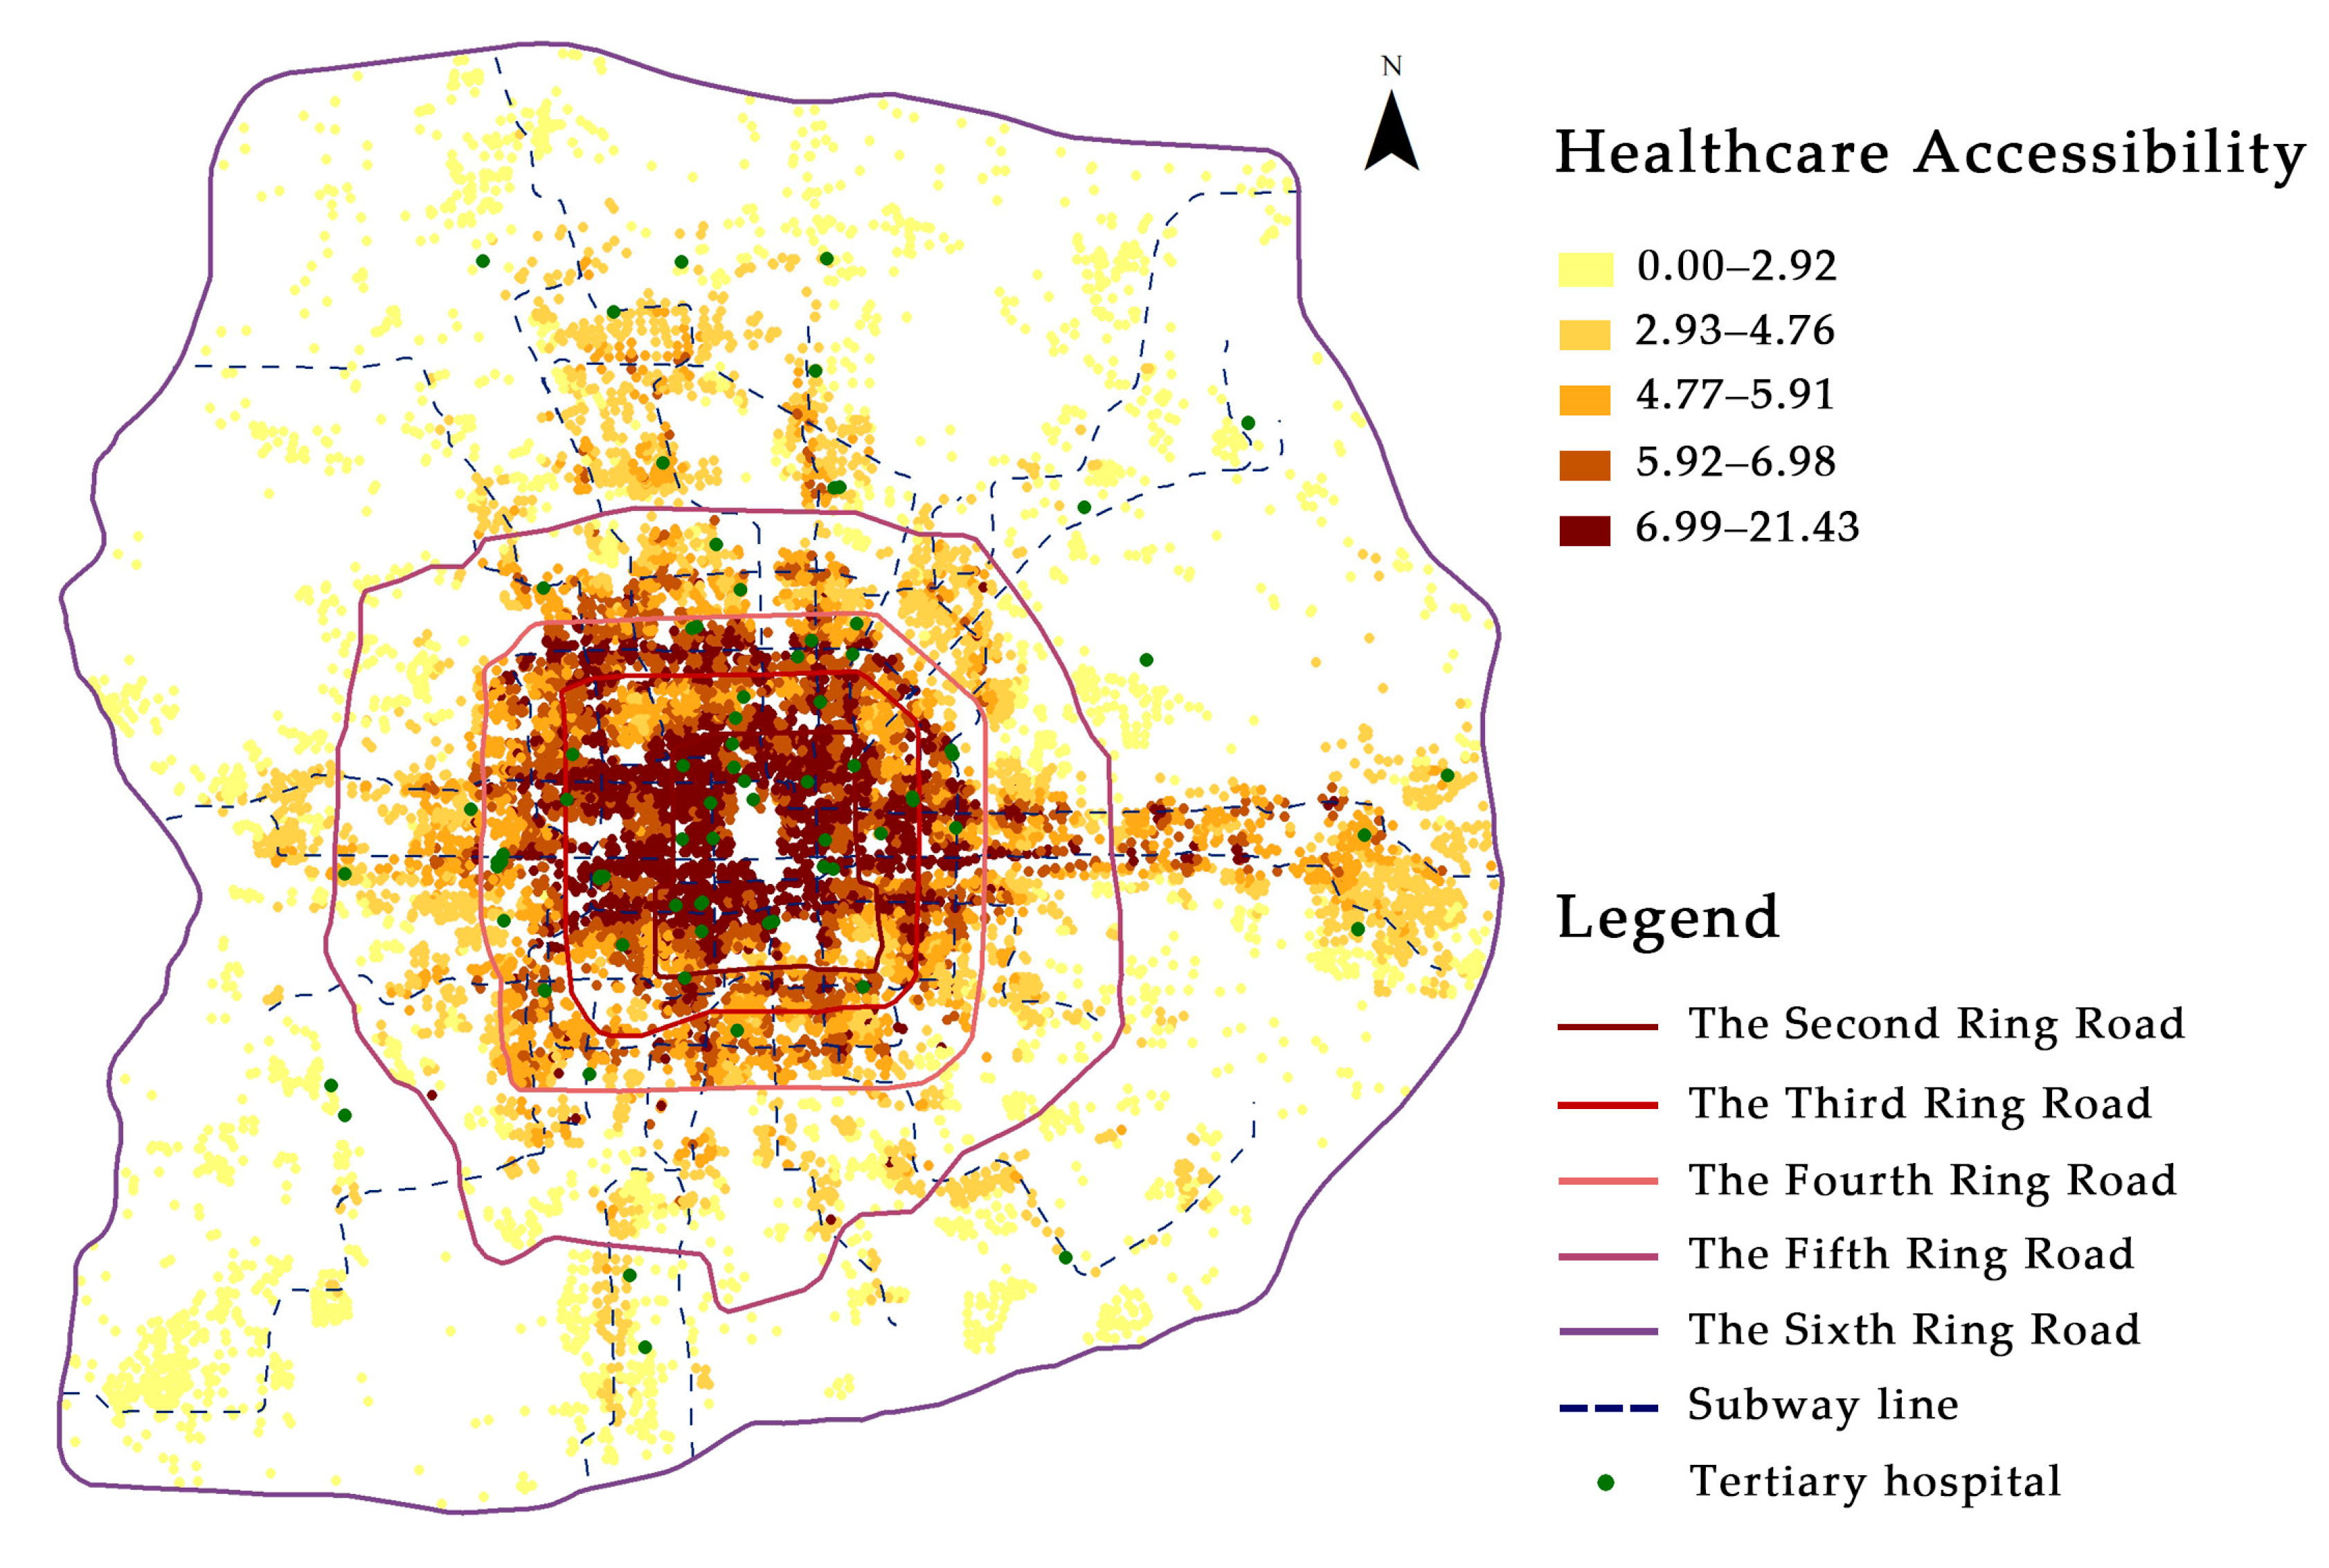
5.1. MMALR Results
5.2. MMALR vs. PTALR or PCALR
5.3. Multi-Mode vs. Single-Mode Equity Analysis
6. Discussion
7. Conclusions
Author Contributions
Funding
Data Availability Statement
Acknowledgments
Conflicts of Interest
References
- Tan, X.; Liu, X.; Shao, H. Healthy China 2030: A Vision for Health Care. Value Health Reg. Issues 2017, 12, 112–114. [Google Scholar] [CrossRef] [PubMed]
- Wang, X.; Yang, E.; Zheng, C.; Yuan, S. Effects of vertical integration on the healthcare system in China: A systematic review and meta-analysis. Health Policy Plan. 2024, 39, 66–79. [Google Scholar] [CrossRef] [PubMed]
- Zhao, P.; Li, S.; Liu, D. Unequable spatial accessibility to hospitals in developing megacities: New evidence from Beijing. Health Place 2020, 65, 102406. [Google Scholar] [CrossRef]
- Jin, C.; Cheng, J.; Lu, Y.; Huang, Z.; Cao, F. Spatial inequity in access to healthcare facilities at a county level in a developing country: A case study of Deqing County, Zhejiang, China. Int. J. Equity Health 2015, 14, 67. [Google Scholar] [CrossRef]
- Li, C.; Wang, J. A hierarchical two-step floating catchment area analysis for high-tier hospital accessibility in an urban agglomeration region. J. Transp. Geogr. 2022, 102, 103369. [Google Scholar] [CrossRef]
- Zhang, H.; Zhou, B.-B.; Liu, S.; Hu, G.; Meng, X.; Liu, X.; Shi, H.; Gao, Y.; Hou, H.; Li, X. Enhancing intercity transportation will improve the equitable distribution of high-quality health care in China. Appl. Geogr. 2023, 152, 18. [Google Scholar] [CrossRef]
- Legido-Quigley, H.; Glinos, I.; Baeten, R.; McKee, M. Patient mobility in the European Union. BMJ 2007, 334, 188–190. [Google Scholar] [CrossRef]
- Xiang, B.W.; Wei, W.; Guo, F.; Hong, M.Y. How Does Cross-City Patient Mobility Impact the Spatial Equity of Healthcare in China? Land 2025, 14, 214. [Google Scholar] [CrossRef]
- Zhao, X.; Wang, X.; Liu, J.; Wang, R.; Xue, B. Regional Differences of Quality Medical Resources in China Based on Different Scales. Econ. Geogr. 2020, 40, 22–31. [Google Scholar] [CrossRef]
- Yuan, L.; Cao, J.; Wang, D.; Yu, D.; Liu, G.; Qian, Z. Regional disparities and influencing factors of high quality medical resources distribution in China. Int. J. Equity Health 2023, 22, 8. [Google Scholar] [CrossRef]
- State Council, Central Committee of CPC. Outline of the Plan for “Healthy China 2030”. Available online: https://www.gov.cn/zhengce/2016-10/25/content_5124174.htm (accessed on 15 April 2019).
- Wang, X.; Seyler, B.C.; Han, W.; Pan, J. An integrated analysis of spatial access to the three-tier healthcare delivery system in China: A case study of Hainan Island. Int. J. Equity Health 2021, 20, 60. [Google Scholar] [CrossRef] [PubMed]
- Liu, Y.; Kong, Q.; Yuan, S.; van de Klundert, J. Factors influencing choice of health system access level in China: A systematic review. PLoS ONE 2018, 13, e0201887. [Google Scholar] [CrossRef]
- Wang, J.; Du, F.; Huang, J.; Liu, Y. Access to hospitals: Potential vs. observed. Cities 2020, 100, 102671. [Google Scholar] [CrossRef]
- Jue Yang, L.M. Understanding temporal change of spatial accessibility to healthcare: An analytic framework for local factor impacts. Health Place. 2018, 51, 118–124. [Google Scholar] [CrossRef]
- Wu, J.; Cai, Z.; Li, H. Accessibility of Medical Facilities in Multiple Traffic Modes: A Study in Guangzhou, China. Complexity 2020, 2020, 8819836. [Google Scholar] [CrossRef]
- Wang, Z.; Liu, D.; Li, S.; Liu, S.; Li, H.; Chen, N. Analyzing the Impact of Decreasing Out-of-Vehicle Time of Public Transportation Travel on Accessibility to Tertiary Hospitals. Sustainability 2023, 15, 12453. [Google Scholar] [CrossRef]
- Jiao, W.; Huang, W.; Fan, H. Evaluating spatial accessibility to healthcare services from the lens of emergency hospital visits based on floating car data. Int. J. Digit. Earth 2022, 15, 108–133. [Google Scholar] [CrossRef]
- Alam, M.S.; Tabassum, N.J.; Tokey, A.I. Evaluation of accessibility and equity to hospitals by public transport: Evidence from six largest cities of Ohio. BMC Health Serv. Res. 2023, 23, 598. [Google Scholar] [CrossRef] [PubMed]
- Langford, M.; Higgs, G.; Fry, R. Multi-modal two-step floating catchment area analysis of primary health care accessibility. Health Place. 2016, 38, 70–81. [Google Scholar] [CrossRef]
- Mao, L.; Nekorchuk, D. Measuring spatial accessibility to healthcare for populations with multiple transportation modes. Health Place. 2013, 24, 115–122. [Google Scholar] [CrossRef]
- Macioszek, E.; Karami, A.; Farzin, I.; Abbasi, M.; Mamdoohi, A.R.; Piccioni, C. The Effect of Distance Intervals on Walking Likelihood in Different Trip Purposes. Sustainability 2022, 14, 3406. [Google Scholar] [CrossRef]
- Lee, S.; Ko, E.; Jang, K.; Kim, S. Understanding individual-level travel behavior changes due to COVID-19: Trip frequency, trip regularity, and trip distance. Cities 2023, 135, 104223. [Google Scholar] [CrossRef]
- Scheiner, J. Interrelations between travel mode choice and trip distance: Trends in Germany 1976–2002. J. Transp. Geogr. 2010, 18, 75–84. [Google Scholar] [CrossRef]
- Song, T.; Ma, R.; Zhang, X.; Lv, B.; Li, Z.; Guo, M.; Yuan, M.; Tang, Z. Analysis of the current status and influencing factors of cross-regional hospitalization services utilization by basic medical insurance participants in China−taking a central province as an example. Front. Public Health 2023, 11, 1246982. [Google Scholar] [CrossRef]
- Delil, S.; Çelik, R.N.; San, S.; Dundar, M. Clustering patient mobility patterns to assess effectiveness of health-service delivery. BMC Health Serv. Res. 2017, 17, 458. [Google Scholar] [CrossRef] [PubMed]
- Zhong, Q.; Wu, J.; Tao, Z. Intercity patient mobility can improve healthcare accessibility and equality in metropolitan areas: A case study of Shenzhen metropolitan area, China. Appl. Geogr. 2024, 171, 103383. [Google Scholar] [CrossRef]
- Wang, Y.; Chen, L.; Liu, B.; Tao, Z. Unveiling the Spatial Inequality of Accessibility to High-Quality Healthcare Resources in the Beijing–Tianjin–Hebei Urban Agglomeration of China: A Focus on the Impacts of Intercity Patient Mobility. ISPRS Int. J. Geo-Inf. 2025, 14, 168. [Google Scholar] [CrossRef]
- Balia, S.; Brau, R.; Moro, D. Choice of hospital and long-distances: Evidence from Italy. Reg. Sci. Urban. Econ. 2020, 81, 103502. [Google Scholar] [CrossRef]
- Yan, X.; Dong, D.; He, S.; Webster, C. Examining Trans-Provincial Diagnosis of Rare Diseases in China: The Importance of Healthcare Resource Distribution and Patient Mobility. Sustainability 2020, 12, 5444. [Google Scholar] [CrossRef]
- Zhang, B.; Wang, H.; Zhang, H.; Tian, G.; Zhang, T.; Shi, Q.; Liu, J.; Xu, J.; Liu, J.; Wu, Q.; et al. The influence of cross-regional medical treatment on total medical expenses, medical insurance payments, and out-of-pocket expenses of patients with malignant tumors in Chinese low-income areas. Cost. Eff. Resour. Alloc. 2022, 20, 35. [Google Scholar] [CrossRef]
- Pecoraro, F.; Cellini, M.; Luzi, D.; Clemente, F. Analysing the intra and interregional components of spatial accessibility gravity model to capture the level of equity in the distribution of hospital services in Italy: Do they influence patient mobility? BMC Health Serv. Res. 2024, 24, 973. [Google Scholar] [CrossRef] [PubMed]
- Zhao, P.; Li, J.; Zhang, M. Unequal roles of cities in the intercity healthcare system. Nat. Cities 2025, 2, 198–209. [Google Scholar] [CrossRef]
- Yan, X.; Shan, L.; He, S.J.; Zhang, J.K. Cross-city patient mobility and healthcare equity and efficiency: Evidence from Hefei, China. Travel Behav. Soc. 2022, 28, 1–12. [Google Scholar] [CrossRef]
- Wang, F. Quantitative Methods and Socio-Economic Applications in GIS, 2nd ed.; CRC Press: Boca Raton, FL, USA, 2015; pp. 103–126. [Google Scholar]
- Geurs, K.T.; van Wee, B. Accessibility evaluation of land-use and transport strategies: Review and research directions. J. Transp. Geogr. 2004, 12, 127–140. [Google Scholar] [CrossRef]
- Chen, B.Y.; Hui, Y.; Qingquan, L.; Donggen, W.; Shih-Lung, S.; Hui-Ping, C.; Lam, W.H.K. Measuring place-based accessibility under travel time uncertainty. Int. J. Geogr. Inf. Sci. 2017, 31, 783–804. [Google Scholar] [CrossRef]
- Kwan, M.-P. Beyond Space (As We Knew It): Toward Temporally Integrated Geographies of Segregation, Health, and Accessibility. Ann. Assoc. Am. Geogr. 2013, 103, 1078–1086. [Google Scholar] [CrossRef]
- Miller, H.J. Place-Based Versus People-Based Accessibility, In Access to Destinations; Levinson, D.M., Krizek, K.J., Eds.; Emerald Group Publishing Limited: Leeds, UK, 2005; pp. 63–89. [Google Scholar] [CrossRef]
- Guagliardo, M.F. Spatial accessibility of primary care: Concepts, methods and challenges. Int. J. Health Geogr. 2004, 3, 3. [Google Scholar] [CrossRef]
- Hansen, W.G. How Accessibility Shapes Land Use. J. Am. Inst. Plan. 1959, 25, 73–76. [Google Scholar] [CrossRef]
- Joseph, A.E.; Bantock, P.R. Measuring potential physical accessibility to general practitioners in rural areas: A method and case study. Soc. Sci. Med. 1982, 16, 85–90. [Google Scholar] [CrossRef]
- Morrill, R.L.; Kelley, M.B. The simulation of hospital use and the estimation of location efficiency. Geogr. Anal. 1970, 2, 283–300. [Google Scholar] [CrossRef]
- Reilly, W.J. The Law of Retail Gravitation. Am. J. Sociol. 1931, 37, 5. [Google Scholar] [CrossRef]
- Kluckhohn, C. Human behavior and the principle of least effort. Am. Anthropol. 1950, 52, 268–270. [Google Scholar] [CrossRef]
- Huff, D.L. Defining and Estimating a Trading Area. J. Mark. 1964, 28, 34–38. [Google Scholar] [CrossRef]
- Dijkstra, E.W. A note on two problems in connexion with graphs. Numer. Math. 1959, 1, 269–271. [Google Scholar] [CrossRef]
- Parzen, E. On Estimation of a Probability Density Function and Mode. Ann. Math. Stat. 1962, 33, 1065–1076. [Google Scholar] [CrossRef]
- Shao, Y.; Luo, W. Supply-demand adjusted two-steps floating catchment area (SDA-2SFCA) model for measuring spatial access to health care. Soc. Sci. Med. 2022, 296, 114727. [Google Scholar] [CrossRef]
- Luo, W.; Wang, F. Measures of Spatial Accessibility to Health Care in a GIS Environment: Synthesis and a Case Study in the Chicago Region. Environ. Plan B Plan. Des. 2003, 30, 865–884. [Google Scholar] [CrossRef] [PubMed]
- Wang, F.; Luo, W. Assessing spatial and nonspatial factors for healthcare access: Towards an integrated approach to defining health professional shortage areas. Health Place 2005, 11, 131–146. [Google Scholar] [CrossRef]
- Zhuolin, T.; Yang, C. Research progress of the two-step floating catchment area method and extensions. Prog. Geogr. 2016, 35, 589–599. [Google Scholar] [CrossRef]
- Wan, N.; Bin, Z.; Sternberg, T. A three-step floating catchment area method for analyzing spatial access to health services. Int. J. Geogr. Inf. Sci. 2012, 26, 1073–1089. [Google Scholar] [CrossRef]
- Tao, Z.; Han, W. Assessing the Impacts of Hierarchical Healthcare System on the Accessibility and Spatial Equality of Healthcare Services in Shenzhen, China. ISPRS Int. J. Geo-Inf. 2021, 10, 615. [Google Scholar] [CrossRef]
- Xing, J.; Ng, S.T. Analyzing spatiotemporal accessibility patterns to tertiary healthcare services by integrating total travel cost into an improved E3SFCA method in Changsha, China. Cities 2022, 122, 103541. [Google Scholar] [CrossRef]
- Guo, X.; Zeng, S.; Namaiti, A.; Zeng, J. Evaluation of Supply–Demand Matching of Public Health Resources Based on Ga2SFCA: A Case Study of the Central Urban Area of Tianjin. ISPRS Int. J. Geo-Inf. 2023, 12, 156. [Google Scholar] [CrossRef]
- Qian, T.; Chen, J.; Li, A.; Wang, J.; Shen, D. Evaluating Spatial Accessibility to General Hospitals with Navigation and Social Media Location Data: A Case Study in Nanjing. Int. J. Environ. Res. Public Health 2020, 17, 2752. [Google Scholar] [CrossRef] [PubMed]
- Tao, Z.; Zhong, Q.; Dang, Y. A Maximal Multimodal Accessibility Equality Model to Optimize the Equality of Healthcare Services. ISPRS Int. J. Geo-Inf. 2024, 13, 278. [Google Scholar] [CrossRef]
- Tahmasbi, B.; Mansourianfar, M.H.; Haghshenas, H.; Kim, I. Multimodal accessibility-based equity assessment of urban public facilities distribution. Sustain. Cities Soc. 2019, 49, 101633. [Google Scholar] [CrossRef]
- Dony, C.C.; Delmelle, E.M.; Delmelle, E.C. Re-conceptualizing accessibility to parks in multi-modal cities: A Variable-width Floating Catchment Area (VFCA) method. Landsc. Urban Plan. 2015, 143, 90–99. [Google Scholar] [CrossRef]
- Zhao, P.; Wang, H.; Liu, Q.; Yan, X.-Y.; Li, J. Unravelling the spatial directionality of urban mobility. Nat. Commun. 2024, 15, 4507. [Google Scholar] [CrossRef]
- Meng, M.; Memon, A.A.; Wong, Y.D.; Lam, S.-H. Impact of traveller information on mode choice behaviour. Proc. Inst. Civ. Eng. Transp. 2018, 171, 11–19. [Google Scholar] [CrossRef]
- Pan, X.; Kwan, M.-P.; Yang, L.; Zhou, S.; Zuo, Z.; Wan, B. Evaluating the Accessibility of Healthcare Facilities Using an Integrated Catchment Area Approach. Int. J. Environ. Res. Public Health 2018, 15, 2051. [Google Scholar] [CrossRef]
- Liang, G.; Tang, L.; Zhang, L.; Yang, X.; Tan, X. Measuring spatial accessibility to medical facilities: Aligning with actual medical travel behavior. Habitat Int. 2025, 157, 103308. [Google Scholar] [CrossRef]
- Kattan, L.; de Barros, A.G.; Saleemi, H. Travel behavior changes and responses to advanced traveler information in prolonged and large-scale network disruptions: A case study of west LRT line construction in the city of Calgary. Transp. Res. Part F Traffic Psychol. Behav. 2013, 21, 90–102. [Google Scholar] [CrossRef]
- Ding, C.; Wang, D.; Liu, C.; Zhang, Y.; Yang, J. Exploring the influence of built environment on travel mode choice considering the mediating effects of car ownership and travel distance. Transp. Res. Part A Policy Pract. 2017, 100, 65–80. [Google Scholar] [CrossRef]
- Bhat, C.R.; Guo, J.Y. A comprehensive analysis of built environment characteristics on household residential choice and auto ownership levels. Transp. Res. Part B Methodol. 2007, 41, 506–526. [Google Scholar] [CrossRef]
- Li, W.; Deng, A.; Zheng, Y.; Yin, Z.; Wang, B. Analysis of Residents’ Travel Mode Choice in Medium-sized City Based on Machine Learning. J. Transporation Syst. Eng. Inf. Technol. 2024, 24, 13–23. [Google Scholar] [CrossRef]
- Liu, D.; Kwan, M.P.; Kan, Z.H. Analyzing disparities in transit-based healthcare accessibility in the Chicago Metropolitan Area. Can. Geogr. Geogr. Can. 2022, 66, 248–262. [Google Scholar] [CrossRef]
- Boisjoly, G.; Deboosere, R.; Wasfi, R.; Orpana, H.; Manaugh, K.; Buliung, R.; El-Geneidy, A. Measuring accessibility to hospitals by public transport: An assessment of eight Canadian metropolitan regions. J. Transp. Health 2020, 18, 100916. [Google Scholar] [CrossRef]
- Dai, T.; Guo, K.; Zhao, J.; Lu, W. Impact of the presence of private hospitals on the spatial equality of healthcare accessibility in Beijing, China. Geospat. Health 2022, 17, 2. [Google Scholar] [CrossRef]
- Dong, L.; Lv, Y.; Sun, H.; Zhi, D.; Chen, T.; Truong, L. GPS Trajectory-Based Spatio-Temporal Variations of Traffic Accessibility under Public Health Emergency Consideration. J. Adv. Transp. 2021, 2021, 8854451. [Google Scholar] [CrossRef]
- Xia, Y.; Chen, H.; Zuo, C.; Zhang, N. The impact of traffic on equality of urban healthcare service accessibility: A case study in Wuhan, China. Sustain. Cities Soc. 2022, 86, 104130. [Google Scholar] [CrossRef]
- Ma, L.; Luo, N.; Wan, T.; Hu, C.; Peng, M. An Improved Healthcare Accessibility Measure Considering the Temporal Dimension and Population Demand of Different Ages. Int. J. Environ. Res. Public Health 2018, 15, 2421. [Google Scholar] [CrossRef]
- Jing, C.; Zhou, W.; Qian, Y.; Zheng, Z.; Wang, J.; Yu, W. Trajectory big data reveals spatial disparity of healthcare accessibility at the residential neighborhood scale. Cities 2023, 133, 104127. [Google Scholar] [CrossRef]
- Chen, B.Y.; Cheng, X.-P.; Kwan, M.-P.; Schwanen, T. Evaluating spatial accessibility to healthcare services under travel time uncertainty: A reliability-based floating catchment area approach. J. Transp. Geogr. 2020, 87, 102794. [Google Scholar] [CrossRef]
- Xing, L.; Chen, Q.; Liu, Y.; He, H. Evaluating the accessibility and equity of urban health resources based on multi-source big data in high-density city. Sustain. Cities Soc. 2024, 100, 105049. [Google Scholar] [CrossRef]
- Ma, X.; Ren, F.; Du, Q.; Liu, P.; Li, L.; Xi, Y.; Jia, P. Incorporating multiple travel modes into a floating catchment area framework to analyse patterns of accessibility to hierarchical healthcare facilities. J. Transp. Health 2019, 15, 100675. [Google Scholar] [CrossRef]
- Jin, T.H.; Cheng, L.; Wang, K.L.; Cao, J.; Huang, H.S.; Witlox, F. Examining equity in accessibility to multi-tier healthcare services across different income households using estimated travel time. Transp. Policy 2022, 121, 1–13. [Google Scholar] [CrossRef]
- Zhou, X.; Yu, Z.; Yuan, L.; Wang, L.; Wu, C. Measuring Accessibility of Healthcare Facilities for Populations with Multiple Transportation Modes Considering Residential Transportation Mode Choice. ISPRS Int. J. Geo-Inf. 2020, 9, 394. [Google Scholar] [CrossRef]
- Du, X.; Liu, M.; Luo, S. Exploring Equity in a Hierarchical Medical Treatment System: A Focus on Determinants of Spatial Accessibility. ISPRS Int. J. Geo-Inf. 2023, 12, 318. [Google Scholar] [CrossRef]
- Lu, C.; Zhang, Z.; Lan, X. Impact of China’s referral reform on the equity and spatial accessibility of healthcare resources: A case study of Beijing. Soc. Sci. Med. 2019, 235, 112386. [Google Scholar] [CrossRef]
- Shaoying, Z.; Xin, Y.; Rui, C. The accessibility measurement of hierarchy public service facilities based on multi-mode network dataset and the two-step 2SFCA: A case study of Beijing’s medical facilities. Geogr. Res. 2016, 35, 731–744. [Google Scholar] [CrossRef]
- Yang, Z.; Guo, Y.; Feng, X.; Zhou, Y.; Zhou, P.; Li, X.; Qian, X. Evaluating temporal variations in access to multi-tier hospitals using personal vehicles and public transit: Implications for healthcare equity. Sustain. Cities Soc. 2024, 113, 105687. [Google Scholar] [CrossRef]
- Cheng, L.; Yang, M.; De Vos, J.; Witlox, F. Examining geographical accessibility to multi-tier hospital care services for the elderly: A focus on spatial equity. J. Transp. Health 2020, 19, 100926. [Google Scholar] [CrossRef]
- Whitehead, J.; Pearson, A.L.; Lawrenson, R.; Atatoa-Carr, P. How can the spatial equity of health services be defined and measured? A systematic review of spatial equity definitions and methods. J. Health Serv. Res. Policy 2019, 24, 270–278. [Google Scholar] [CrossRef] [PubMed]
- Althoff, T.; Sosič, R.; Hicks, J.L.; King, A.C.; Delp, S.L.; Leskovec, J. Large-scale physical activity data reveal worldwide activity inequality. Nature 2017, 547, 336–339. [Google Scholar] [CrossRef] [PubMed]
- Hu, L.; He, S.; Su, S. Accessibility of Healthcare Resources to Public Housing in Shenzhen, China: Indirect Map Service and Optimized Two-Step Floating Catchment Area Method. Trop. Geogr. 2024, 44, 226–235. [Google Scholar] [CrossRef]
- Tao, Z.; Wang, Q.; Han, W. Towards Health Equality: Optimizing Hierarchical Healthcare Facilities towards Maximal Accessibility Equality in Shenzhen, China. Appl. Sci. 2021, 11, 10282. [Google Scholar] [CrossRef]
- Kanuganti, S.; Sarkar, A.K.; Singh, A.P. Evaluation of access to health care in rural areas using enhanced two-step floating catchment area (E2SFCA) method. J. Transp. Geogr. 2016, 56, 45–52. [Google Scholar] [CrossRef]
- Wang, J.; Kwan, M.-P.; Liu, D.; Peng, X. Assessing the spatial distribution of and inequality in 15-minute PCR test site accessibility in Beijing and Guangzhou, China. Appl. Geogr. 2023, 154, 102925. [Google Scholar] [CrossRef]
- Wang, F.; Tang, Q. Planning toward Equal Accessibility to Services: A Quadratic Programming Approach. Environ. Plan B 2013, 40, 195–212. [Google Scholar] [CrossRef]


| Type | Travel Mode | Authors | Study Area | Method | Functions | Threshold | Destination |
|---|---|---|---|---|---|---|---|
| Single-mode | Public transit | Z. W [17] | Beijing, China | Ga2SFCA | Gaussian | 90 min | Tertiary hospital |
| P. Zhao [3] | Beijing, China | E2SFCA | Gaussian | 82.9 min | All public hospitals | ||
| D. Liu [69] | Chicago | 2SFCA | Distance decay | 50 min | hospital | ||
| G. Boisjoly [70] | Canada | 2SFCA | none | 45 min | hospital | ||
| private cars | T. Dai [71] | Beijing, China | 2SFCA | Distance decay | 30 min | County level hospitals | |
| L. Dong [72] | Beijing, China | Cumulative opportunity measures | none | 30 min | All public hospitals | ||
| Y. Xia [73] | Wuhan, China | Ga2SFCA | Gaussian | 30 min | All hospital | ||
| L. Ma [74] | Wuhan, China | 3SFCA | Gaussian | 30 min | Tertiary, secondary hospitals | ||
| Z. L. Tao [54] | Shenzhen, China | H2SFCA | Gaussian | 70 min | Tertiary hospital | ||
| 40 min | secondary hospitals | ||||||
| Taxi | C. Jing [75] | Beijing, China | 2SFCA | exponential function | 28.4 km | Tertiary hospital | |
| W. Jiao [18] | Shanghai, China | Ga2SFCA | Gaussian | 22.3 min | All public hospitals | ||
| B. Y. Chen [76] | Shanghai, China | 2SFCA | CDF | 20 min | Tertiary, secondary hospitals | ||
| Walking | L. Xing [77] | Guangzhou, China | Ga2SFCA | Gaussian | 15 min | All hospital | |
| Biking | Z. L. Tao [54] | Shenzhen, China | H2SFCA | Gaussian | 25 min | primary facilities | |
| Multi-modal | Public transit | X. Ma [78] | Wuhan, China | 3SFCA | Gaussian | 120 min | All public hospitals |
| private cars | 45 min | ||||||
| Public transit | J. Xing [55] | Changsha, China | E3SFCA | Gaussian | 240 min | Tertiary hospital | |
| private cars | 120 min | ||||||
| Public transit | T. H. Jin [79] | Shanghai, China | G2SFCA | Gaussian | 103 min | Tertiary hospital | |
| private cars | 34 min | ||||||
| Public transit | X. Zhou [80] | Nanjing, China | G2SFCA | Gaussian | 100 km | Pediatric Clinic | |
| private cars | 120 km | ||||||
| Walking | 60 km | ||||||
| Biking | 80 km | ||||||
| Public transit | X. Du [81] | Shenyang, China | 2SFCA | None | 60 min | Tertiary hospitals | |
| private cars | 30 min | ||||||
| Walking | 15 min | ||||||
| Public transit | J. Wu [16] | Guangzhou, China | 3SFCA | Gaussian | 120 min | All hospitals | |
| private cars | 120 min | ||||||
| Walking | 30 min | ||||||
| Biking | 30 min | ||||||
| Public transit | L. Mao [21] | Florida, USA | 2SFCA | none | 30 min | hospital | |
| private cars |
| Distance (m) | Travel Mode | |||
|---|---|---|---|---|
| PT | Private Cars | Walking and Biking | Taxi | |
| [0, 1000] | 2% | 2% | 96% | 0% |
| (1000, 3000] | 4% | 6% | 90% | 0% |
| (3000, 5000] | 30% | 26% | 40% | 4% |
| (5000, 10,000] | 40% | 50% | 5% | 5% |
| (10,000, 15,000] | 47% | 45% | 2% | 6% |
| (15,000, 20,000] | 50% | 43% | 1% | 6% |
| (20,000, 25,000] | 51% | 42% | 0% | 7% |
| (25,000, 30,000] | 49% | 44% | 0% | 7% |
| (30,000, 35,000] | 45% | 47% | 0% | 8% |
| (35,000, 40,000] | 42% | 50% | 0% | 8% |
| (40,000, 45,000] | 35% | 57% | 0% | 8% |
| (45,000, 50,000] | 32% | 60% | 0% | 8% |
| (50,000, +∞) | 22% | 68% | 0% | 10% |
| Travel Mode | Q1 | Q2 | Q3 | Q4 | Q5 |
|---|---|---|---|---|---|
| Multi-mode | 2.92 | 4.76 | 5.38 | 5.91 | 6.98 |
| Public transit | 2.63 | 4.42 | 4.98 | 5.51 | 6.63 |
| Private cars | 1.95 | 3.66 | 4.91 | 6.27 | 10.03 |
| Administrative District | Multi-Mode | Rank | Private Car | Rank | Public Transit | Rank |
|---|---|---|---|---|---|---|
| Dongcheng District | 0.179 | 2 | 0.351 | 3 | 0.165 | 1 |
| Fengtai District | 0.197 | 4 | 0.384 | 4 | 0.207 | 4 |
| Chaoyang District | 0.260 | 6 | 0.498 | 6 | 0.267 | 6 |
| Haidian District | 0.234 | 5 | 0.414 | 5 | 0.214 | 5 |
| Shijingshan district | 0.182 | 3 | 0.225 | 2 | 0.205 | 3 |
| Xicheng District | 0.157 | 1 | 0.215 | 1 | 0.189 | 2 |
| Administrative District | Multi-Mode | Rank | Private Car | Rank | Public Transit | Rank |
|---|---|---|---|---|---|---|
| Dongcheng District | 6.992 | 2 | 9.944 | 2 | 6.951 | 1 |
| Fengtai District | 4.865 | 5 | 3.937 | 4 | 4.589 | 4 |
| Chaoyang District | 5.022 | 4 | 3.449 | 5 | 4.963 | 3 |
| Haidian District | 5.423 | 3 | 6.185 | 3 | 4.854 | 5 |
| Shijingshan district | 3.426 | 6 | 2.596 | 6 | 3.220 | 6 |
| Xicheng District | 7.328 | 1 | 14.464 | 1 | 6.591 | 2 |
| Ring Region | Multi-Mode | Rank | Private Car | Rank | Public Transit | Rank |
|---|---|---|---|---|---|---|
| Within Second Ring Road | 0.146 | 1 | 0.215 | 1 | 0.150 | 2 |
| Between Second Ring Road and Third Ring Road | 0.184 | 3 | 0.376 | 2 | 0.155 | 3 |
| Between Third Ring Road and Fourth Ring Road | 0.152 | 2 | 0.405 | 4 | 0.127 | 1 |
| Between Fourth Ring Road and Fifth Ring Road | 0.195 | 4 | 0.392 | 3 | 0.199 | 4 |
| Between Fifth Ring Road and Sixth Ring Road | 0.334 | 5 | 0.463 | 5 | 0.345 | 5 |
| Ring Region | Multi-Mode | Rank | Private Car | Rank | Public Transit | Rank |
|---|---|---|---|---|---|---|
| Within Second Ring Road | 7.362 | 1 | 13.726 | 1 | 7.030 | 1 |
| Between Second Ring Road and Third Ring Road | 6.564 | 2 | 8.551 | 2 | 6.119 | 2 |
| Between Third Ring Road and Fourth Ring Road | 6.074 | 3 | 4.999 | 3 | 5.803 | 3 |
| Between Fourth Ring Road and Fifth Ring Road | 4.226 | 4 | 3.041 | 4 | 3.999 | 4 |
| Between Fifth Ring Road and Sixth Ring Road | 2.755 | 5 | 2.924 | 5 | 2.571 | 5 |
Disclaimer/Publisher’s Note: The statements, opinions and data contained in all publications are solely those of the individual author(s) and contributor(s) and not of MDPI and/or the editor(s). MDPI and/or the editor(s) disclaim responsibility for any injury to people or property resulting from any ideas, methods, instructions or products referred to in the content. |
© 2025 by the authors. Published by MDPI on behalf of the International Society for Photogrammetry and Remote Sensing. Licensee MDPI, Basel, Switzerland. This article is an open access article distributed under the terms and conditions of the Creative Commons Attribution (CC BY) license (https://creativecommons.org/licenses/by/4.0/).
Share and Cite
Li, Z.; Wang, Z. Investigating the Impact of Inter-City Patient Mobility on Local Residents’ Equity in Access to High-Level Healthcare: A Case Study of Beijing. ISPRS Int. J. Geo-Inf. 2025, 14, 260. https://doi.org/10.3390/ijgi14070260
Li Z, Wang Z. Investigating the Impact of Inter-City Patient Mobility on Local Residents’ Equity in Access to High-Level Healthcare: A Case Study of Beijing. ISPRS International Journal of Geo-Information. 2025; 14(7):260. https://doi.org/10.3390/ijgi14070260
Chicago/Turabian StyleLi, Zhiqing, and Zhenbao Wang. 2025. "Investigating the Impact of Inter-City Patient Mobility on Local Residents’ Equity in Access to High-Level Healthcare: A Case Study of Beijing" ISPRS International Journal of Geo-Information 14, no. 7: 260. https://doi.org/10.3390/ijgi14070260
APA StyleLi, Z., & Wang, Z. (2025). Investigating the Impact of Inter-City Patient Mobility on Local Residents’ Equity in Access to High-Level Healthcare: A Case Study of Beijing. ISPRS International Journal of Geo-Information, 14(7), 260. https://doi.org/10.3390/ijgi14070260