Abstract
Critical transportation networks in developing countries often lack structural robustness and functional redundancy due to insufficient planning and preparedness. These deficiencies increase vulnerability to disruptions and impede effective post-disaster response and recovery. Understanding how such networks perform under stress is essential to improving resilience in hazard-prone urban environments. This paper presents an integrated predictive methodology for assessing the operational resilience of urban transportation networks under extreme events, specifically tailored to data-scarce and high-risk contexts. By combining Geographic Information Systems (GISs) with complex network theory, the framework captures both spatial and topological dependencies. The methodology is applied to Beirut, the capital of Lebanon, a densely populated and disaster-prone Mediterranean city, through scenario-based simulations that account for interdependent stressors such as traffic dynamics, structural fragility, and geophysical hazards. Results reveal that the network exhibits low redundancy and high sensitivity to even minor disruptions, leading to rapid performance degradation. These findings indicate that the network should be classified as highly vulnerable. The study offers a robust framework for assessing infrastructure resilience and supporting evidence-based decision-making in critical urban network management.
1. Introduction
Civil infrastructure systems, such as transportation, communication, energy, and water networks, are complex and indispensable for providing essential goods and services in modern cities [1,2,3,4]. However, increasing urbanization makes these systems vulnerable to natural and human-induced threats [5,6]. These threats can impair their performance and cause significant socioeconomic losses [7,8,9]. International commitments have been made to comprehensively understand the risk and vulnerability of these systems, with the aim of reducing disaster risk and losses [10]. The overarching goal is to enhance their resilience and adaptive capacity to hazards, ensuring the safety and resilience of human settlements [10,11].
Transportation infrastructure plays a critical role in providing local communities with smooth access to their daily activities [12,13]. Disruptions to transportation networks can result in significant losses that accumulate over time and affect communities. For instance, critical failures within the network may significantly hinder the ability of emergency responders to conduct timely evacuations and provide aid to at-risk populations [14]. In seismic-prone regions, damage within these networks is closely linked to the functionality of their components, particularly where structures are susceptible to failure [15]. Hence, in the context of extreme events, it is imperative to assess the fundamental topological properties of transportation networks [16]. Equally important is the evaluation of network resilience, which enhances sensitivity to extreme events, improves preparedness for potential damage scenarios, and ensures optimal resource allocation for swift recovery [17].
This paper employs a comprehensive approach to evaluate the serviceability of transportation networks before and after extreme events. The framework identifies critical network performance measures that are essential for practical functionality. Using a combination of GIS-derived spatial data and network concepts, quantitative and statistical modeling approaches are applied to evaluate the topological network properties. Various properties of graph theory are assessed to illustrate the behavior, distribution, and efficiency of urban network components under random and targeted failures. As such, connectivity analysis and topological measures are used to identify critical infrastructure locations that can cause system failures. This study is conducted in Lebanon, a developing country highly susceptible to system failures due to extreme hazards [18]. It focuses on assessing the road network resiliency of Beirut, the highly populated capital, in the face of extreme events. The results can help policymakers prioritize critical network components, allocate resources efficiently, and minimize system downtime and associated losses.
The structure of this study is as follows: Section 2 reviews the relevant literature on resilience quantification and the application of graph theory to transportation network analysis. Section 3 outlines the data sources and introduces the proposed framework for evaluating vulnerability and redundancy in critical transportation components. Section 4 presents the case study context, while Section 5 discusses the results and their interpretation. Finally, Section 6 concludes the study and summarizes key findings.
2. Literature Review
2.1. Resilience Quantification Concept
Assessing system resilience and identifying vulnerabilities are essential steps for effective risk mitigation [19,20]. In general terms, resilience is the capability of a system to cope, absorb, and withstand the effect of a random attack and then survive and recover immediately afterward [19,21]. Figure 1 depicts the different resilience phases and their impact on network performance. The resilience process involves four stages: anticipation, absorption, adaptation, and recovery. Anticipation involves forecasting and planning for possible system failures. Absorption consists of reducing the impact of an event on the system through robustness and redundancy. The initial system percentage drop in functionality at time t0 is based on these two interlinked aspects without differentiation. Adaptation involves resource allocation to restore functionality immediately after the event [22]. Finally, recovery consists of returning the system to an acceptable performance level at a time tf according to predetermined standards. The final state of the system after recovery depends on the extent of repairs and improvements [23]. The area between the curves indicates the system’s ability to adapt and recover from disruptions. The importance of prioritization is highlighted by the difference in performance levels between a prioritized and a non-prioritized recovery process at time t1, which is linked to the speed of performance criteria.
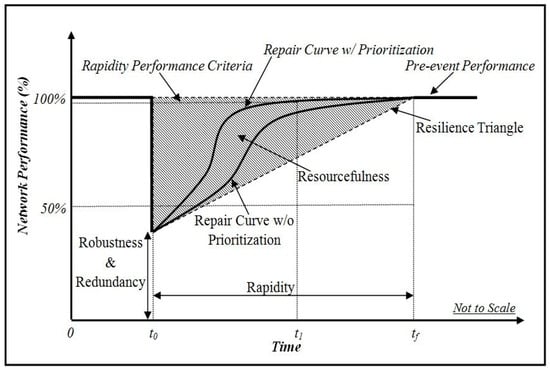
Figure 1.
Role of resilience properties on network performance.
Bruneau and Reinhorn in [24] proposed measuring the degree of resilience of civil infrastructure systems by quantifying the four phases of resilience, which include inherent and adaptive capacities. Resilience can be represented as a function of vulnerability, exposure, and adaptive capacity or expressed as shown in Equation (1). The functional capacity of community infrastructure over time is characterized by its resilience, a modified integral of the Q(t) function. The Q(t) function refers to the quality of community infrastructure changing with time. A smaller area under the “resilience triangle” indicates greater resilience. As such, resilience is defined as the normalized area below Q(t) [19,25]. For network-based infrastructure studies, evaluating network resilience involves measuring the proportion of failed links and nodes in system performance after an external shock [26,27].
2.2. Graph Theory and Transportation Networks
Graph theory applies various connectivity metrics that are associated with the physical and structural characteristics of a graph. This field of network science holds significant promise for analyzing transport networks, mainly due to its suitability for managing large-scale systems effectively [28,29,30]. In the academic literature, the connectivity metric is one of the most used indicators to evaluate network performance [31,32,33]. This metric is derived from graph theory and offers a simple yet effective way to assess the resilience of transportation networks. Connectivity is intrinsically linked to the intra-dependencies of the network, which is defined by adjacency and smooth flow between vertices via edges [34]. The primary aim of analyzing network connectivity is to identify reachable pathways to prevent the possible isolation of the system, particularly for emergency services in the aftermath of an event. By analyzing the complex network structure, connectivity metrics can provide valuable insights into the network’s ability to withstand disruptions and maintain functionality [28,35].
Graph theory provides measures of connectedness and redundancy, such as alpha, beta, and gamma indices, which are based on the network’s number of vertices, edges, and cycles [36]. The adaptability of these indices allows for evaluating the impact of adding or removing edges or vertices on network performance. Other network topological properties that can be used to quantify the efficiency of network functionality are shown in Table 1.

Table 1.
Network topological properties.
The network nodal degree determines the sum of vertices to the sum of edges per vertex |E(v)| (Equation (2)). The average network nodal degree computes system connectivity by considering the average number of edges connected to every vertex (Equation (3)) [36,37]. Graph topology features usually count on the law followed by the degree distribution. These features depend on pk, the ratio of vertices that possess a degree k, and the probability that a random vertex has the degree k. Furthermore, clusters are subgraphs of attached vertices whose existence reflects how perfectly the network behaves as a system. The clustering coefficients compute both local connectivity and the graph’s transitivity property. The network transitivity denotes that if a vertex v1 is joined with a vertex v2 adjacent to a third vertex v3, there is a high probability of adjacency between v1 and v3. This likelihood is designated as the clustering coefficient and rates the concentration of transitive triangles in the network. A neighborhood of vertex v is referred to as Г(v) and is principally a subgraph containing vertices adjacent to v but excluding it. The clustering coefficient rate between null and unity reveals the linked share of v neighbors. In Equation (4), |E(Гv)| represents the number of edges in the neighborhood of v, whereas the number of possible edges in Г(v) is denoted in the denominator [37].
Another significant concept in transportation networks is the shortest path [38]. In Equation (5), n denotes the number of network vertices. The algorithm begins at vertex i, iteratively calculating distances to connected neighbors. Once the shortest paths are determined, all vertices are evaluated to find the shortest route from i to any other vertex j. Relatedly, the most significant critical vertices can be identified by measuring their centrality with the betweenness centrality shown in Equation (6). The numerator in this equation defines the number of shortest paths from vertex i to j passing by v, whereas the denominator defines the total number of shortest paths between i and j [39]. The assessment of betweenness centrality values across all vertices in the system helps identify optimal resource allocation and guides effective interventions accordingly [40]. This measure can classify edges and vertices according to topology functions. Therefore, the likelihood of overlooking imperative vertices that may be critical bridges between regions is prevented. In this context, ranking network components form the former pace in expecting a response to the exclusion or breakdown of components.
2.3. Graph Theory and Resilience of Complex Networks
Graph-based representations have become a favored method for managing resilience, primarily due to their relative simplicity compared to alternative approaches [41]. According to Serdar et al. [42], the literature addressing the resilience of transportation networks is comparatively limited. In this regard, graph theory can effectively simplify and represent complex systems, making them more accessible for analysis and optimization. Transportation networks consist of nodes and links, which are interconnected in a complex manner. The interdependent nature of such systems gives rise to the concept of “systems-of-systems,” which can enhance their functional efficiency but may also reduce their robustness, making them more susceptible to disruptions [1,15]. Therefore, graph theory can evaluate such interdependency of network properties, defining fundamental characteristics and the contribution of each component [38,41].
Graph theory principles prove highly effective in assessing network topological features and quantifying resilience and reliability [41,43]. Candelieri et al. [44] applied graph theory to analyze public transportation networks, specifically assessing vulnerability to various connectivity failure events. Zhenwu et al. [30] explored resilience in terms of connectivity with the largest cluster, employing percolation theory to identify vulnerable links in the road transportation system. Relatedly, ranking critical network components based on their importance level is crucial, as specific transportation networks lack flexibility and redundancy. Ahmed et al. [45] assessed the network credentials of infrastructure components to enhance the resilience of infrastructure systems against disruptive events. They used geographic modeling with road network data to conduct experiments, ranking bridges based on their connectivity and attributes within the road network. Chatterjee et al. [46] explored statistical properties of L-space bus networks, analyzing degree distribution, path length, and assortativity. They used a modularity-based community detection method to identify operational zones. Network resilience was assessed by removing nodes in random and targeted modes, considering degree distributions and centrality measures. Li and Han [47] studied the topological characteristics and dynamics of various network models. Applying complex network theory, they analyzed the topological features of road, bus, and track networks in urban transportation systems. Their study concluded that these features could assess the network’s robustness to random attacks [47].
Several studies have applied graph theory to assess the resilience and properties of diverse transportation networks. De Bona et al. [48] analyzed bus, metro, and airport networks, finding small-world properties in degree, path length, and connectivity distributions. They noted scale-free characteristics in the initial network if the reduced network displayed a hierarchical structure. In this context, small-world networks feature high clustering and short path lengths, whereas scale-free networks are characterized by a few highly connected hubs following a power-law distribution [48]. Zhang et al. [49] applied graph theory to assess the resilience of complex metro networks. They discovered high robustness against random disruptions but relative vulnerability to intentional disruptions, aligning with characteristics of small-world and scale-free networks. Wang et al. [29] investigated railway networks, representing rail stations as vertices and transit services as edges. They analyzed complex network properties, including cumulative degree distribution, degree correlation, and betweenness centrality, revealing a core-periphery structure with small-world characteristics in the railway network. Wu and Kim [50] examined bike-sharing networks, investigating network properties and spatial autocorrelation using a network representation. Their evaluation, including nodal degree, clustering coefficient, average path length, and centrality measures, revealed a positive relationship between degree centrality and closeness centrality. The researchers suggested that high station accessibility and the small-world properties of bike-sharing networks facilitate efficient bike movement between highly clustered stations [50].
Building on the literature, this study adopts an integrated framework that combines resilience quantification and graph theory analysis to assess the vulnerability of urban transportation networks. The conceptual foundation, particularly the understanding of resilience as a dynamic, multi-phase process and the application of graph-based metrics to evaluate network topology and function, directly informs the methodological approach. Indicators such as connectivity, centrality, clustering coefficients, and shortest path measures are employed to capture structural attributes associated with robustness, redundancy, and functional importance. Applied in conjunction with resilience modeling, these metrics enable the systematic identification of critical components, and the estimation of disruption impacts on network performance. The selected methods in the next section reflect and build upon the theoretical insights reviewed, supporting a comprehensive and empirically grounded evaluation of transportation network resilience under varied hazard scenarios.
3. Materials and Methods
This section presents the proposed approach to evaluating the vulnerability of urban transportation networks under various simulated disruption scenarios. As illustrated in Figure 2, the methodology unfolds in three primary phases. The first phase involved a comprehensive survey of the study area to collect, update, and georeference relevant data. This included the identification of scenario-specific parameters such as traffic (peak traffic volumes), road class (functional classifications), geological/seismic conditions (soil and rock type-based damage increments), buildings (inventory including height, density, and locality), and natural hazards (exposure to sea-level rise, tsunamis, and river floods). While traffic and road class are line features representing network connectivity and flow, geological conditions, buildings, and natural hazards are polygon features that define spatial zones of impact and exposure. These polygons are essential for translating their effects onto the geometric structure of the transportation network and for assessing vulnerability across its overlaid nodes and links. The main road network and scenario-specific attributes were evaluated for geometric consistency, attribute completeness, and spatial accuracy using OpenStreetMap data, with visualizations conducted through Esri ArcGIS 10.8 and Google Earth platforms. Moreover, GIS was used to generate network datasets and define the entire network as G = (V, E), comprising a set of vertices V = (v1, v2 … vn) and a set of edges E = (e1, e2 … em). This study considered an undirected network, assuming drivers tend to ignore traffic directions in extreme events, particularly in developing contexts. Scenario-specific weights were assigned to network components according to their functional importance and spatial exposure; for instance, major roads providing access to hospitals and links located within hazard zones were given higher weights to reflect their criticality and vulnerability.
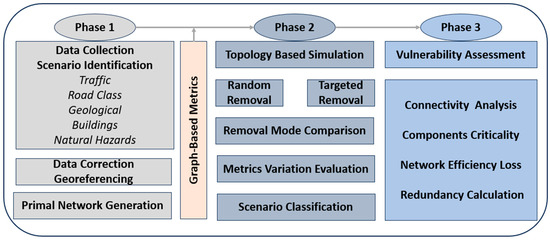
Figure 2.
Methodological workflow for critical infrastructure vulnerability assessment.
The Urban Network Analysis (UNA) toolbox was used to evaluate network graph-based metrics, which included essential features connected to spatial network analysis such as geometry, topology, network elements (e.g., nodes and links), and spatial units (e.g., buildings) [51]. The toolbox generated adjacency matrices for nodal weight and centrality calculations. Accordingly, the degree distribution of the original graph was assessed to unveil network characteristics and vulnerability. Fundamental structural connectivity indices—including alpha (ratio of actual to maximum cycles), beta (edges-to-nodes ratio), gamma (observed-to-possible edges ratio), and the grid-tree pattern (spatial configuration)—were quantified in conjunction with density metrics (nodal, link, and network densities) to characterize the overall form and redundancy of the network. These metrics complement the more granular topological indicators presented in Table 1, which describe local connectivity and flow criticality within the network. Subsequently, local and global connectivity redundancies were defined through the average nodal degree and the clustering coefficient. The straightness property was also calculated, reflecting the degree of closeness of the shortest path between a particular node and all other nodes within a certain radius and its similarity to Euclidean distances [52]. The average betweenness centrality was computed to identify the node’s significance level in the network. This centrality measure involves the number of shortest paths, which is crucial regarding redundancy and resource allocation in damaged networks.
In the second phase, the paper examined the behavior of the graph-based model under failure scenarios involving the random (i.e., uninformed) removal of nodes and their adjacent links at 10% intervals. The effects of these removals on various network components were simulated through random events to investigate network behavior trends. As the removal rate increased, changes in the graph’s degree distribution and topological properties were analyzed. Subsequently, the removal process was repeated using a rank-ordering technique based on attributed scenarios to study the impact of targeted failure (i.e., metric-based) modes on the network. Given the significant influence of nodal failures on graph performance, a nodal betweenness rank-ordering removal was applied. This method considers both critical nodes and shortest links to identify potential cascading failure mechanisms within the system. After each removal, the highest-ranked elements in the updated centrality distribution were selected for subsequent removal fractions. Then, removal modes were compared using network metric variations, and scenario criticality was classified based on failure impacts.
In the third phase, connectivity analysis was employed to assess component criticality and to quantify potential efficiency loss under disruption scenarios. Critical components were identified using topological measures that capture their relative importance to overall system performance. Vulnerability was defined as the reduction in both connectivity and efficiency, providing a basis for identifying internal dependencies and structural weaknesses within the network. In this context, the UNA toolbox was employed to compute the redundancy index, defined as the ratio of the total length of redundant links to the length of the shortest paths for each origin–destination (OD) pair. The average redundancy index was then calculated across multiple OD pairs, specifically those connecting critical emergency centers and hospitals. The index quantifies the additional weighted distance of redundant routes compared to the shortest path, reflecting the extent of alternative connectivity available within the network. A 5% increase in the redundant paths to the shortest path was applied in the analysis, where the redundancy coefficient is set to 1.05. The analysis focused on removing top-weighted structures exhibiting the highest average betweenness centrality and nodal degree across all scenarios. Following each removal, a new network dataset was created to analyze the paths of the most weighted structures. The critical nodes were determined by their average redundancy indices to available hospitals. The network’s global connectivity, percentage reach, and redundancy loss were computed after each removal fraction. Accordingly, resilience could be effectively evaluated by simulating the failure of critical network components and analyzing the resulting degradation in system connectivity.
4. Case Study
Beirut, the capital of Lebanon—a developing country located in the eastern Mediterranean region—occupies an area of approximately 20 km2 on a peninsula along the nation’s central coastline. Despite its limited size, the city is densely populated, driven in part by a substantial influx of daily commuters. Beirut also hosts Lebanon’s largest and principal seaport, making it a critical urban and economic center.
Lebanon has a history of devastating earthquakes, which have resulted in large-scale infrastructure destruction and significant death tolls. Given its location between the Arabian, African, and Eurasian Plates and the presence of the 1200 km-long Levant Fault System that crosses the country, the seismic history of Lebanon is not surprising. The three main fault branches intersecting Lebanon have historically been responsible for severe earthquakes (Mw 7+) and tsunamis. Given their reoccurrence dates, a strong earthquake could occur anytime, as these faults are sufficiently mature. Earthquakes are equally probable throughout the country due to their small size relative to the critical dimension of the active faults. Huijer et al. [18] classified Lebanon as a medium-to-high seismic hazard country, with an expected peak ground acceleration (PGA) ranging from 0.2 g to 0.3 g, with a 10% probability of exceedance in 50 years. The authors suggested increasing the PGA to 0.3 g in the coastal zones.
The geological basement of Beirut dates to the Cretaceous period and is mainly composed of marly limestone coupled with conglomeratic beds. However, the sandy cover is the most significant feature of Beirut’s geology, and its spatial variability can result in substantial seismic amplification [53]. While the hard rocky geology of Lebanon can attenuate seismic accelerations, the mountainous morphology along weak layer types can increase the probability of secondary hazards such as slope instabilities, rockfalls, and landslides [54,55]. In addition, the elevation of the water table and the presence of small fines in sandy areas, especially in coastal construction zones, can also lead to soil liquefaction or floods [56]. These hazards can severely damage critical infrastructure, putting the country at immediate risk.
5. Results and Discussion
The Beirut transportation network comprises 3207 nodes interconnected by 4739 unique links. Evaluating the network’s degree distribution is critical for understanding its vulnerability to failure, as robustness is closely tied to the distribution of vertex degrees. The analysis of the degree distribution in the Beirut transportation network suggests that nodes are moderately interconnected, with an average degree of three. This topology more closely resembles that of a random graph, following a Poisson distribution rather than a power law. This suggests that most nodes exhibit similar degrees, with few or no highly connected hubs—an important deviation from the heavy-tailed behavior characteristic of scale-free networks [57,58]. This structural configuration implies that the network responds to disruptions in a manner consistent with random graph behavior, wherein the impacts of random and targeted node removals are relatively comparable. Such a pattern suggests a degree of inherent robustness to targeted failures, as the absence of critical hubs reduces the likelihood of severe fragmentation following intentional attacks.
Topology-based simulation using a random removal technique was applied to assess graph theory topological and performance metrics (Figure 3). The average nodal degree, which describes the global connectivity of the system, decreased dramatically, highlighting the system’s high dependence on the state of individual nodes. To assess the accessibility of alternative routes, local clustering coefficients were employed to depict the local redundancy of the system. After randomly removing 10% of the nodal network, a sharp decline in local redundancy was evident. This reflects the importance of nodal connectivity, where highly connected nodes can induce significant impacts. Following this decline, the formation of isolated groups led to a localized increase in the clustering coefficient, as smaller interconnected clusters emerged within the fragmented network. Moreover, declines in betweenness centrality and straightness degree can degrade network performance, leading to substantial delays, detours, or cancelation of trips after relatively small nodal disruptions. In parallel, trends in connectivity indices and density measures indicate reduced network efficiency, with nearly half of the network’s functionality lost after just 30% of nodes were disrupted (Figure 4; see also [58]).
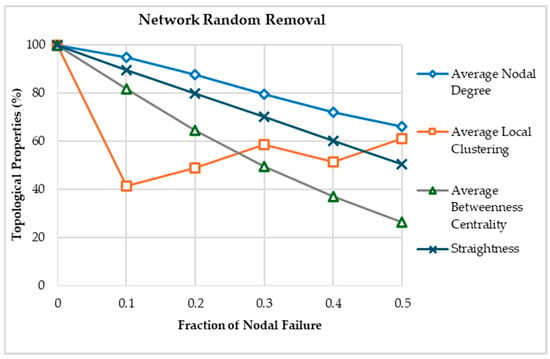
Figure 3.
Random nodal removal effects on topological properties.
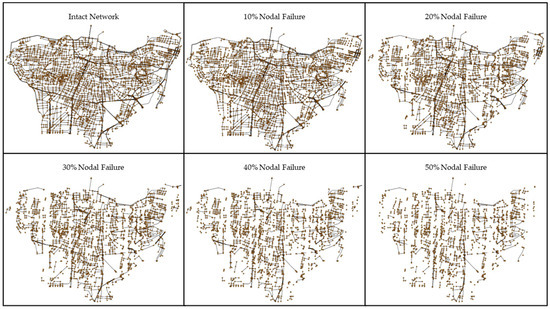
Figure 4.
Nodal random removal of Beirut original graph with a 10% interval.
The integrated weighted network was evaluated to determine vulnerability measures and network effectiveness under both random and targeted removal techniques. A contextual integration approach was applied, wherein each scenario contributed unique topological properties to the network, shaping the relative importance of its components. The evaluated scenarios included: traffic data from a typical weekday noon peak (i.e., Monday) (Figure 5a); road classifications and the location of main hospitals and emergency centers in Beirut and the surrounding governorate (Figure 5b); building inventories (i.e., height, density, and locality) (Figure 5c); potential natural hazards (i.e., sea-level rise, tsunamis, and river floods) (Figure 5d); and geological characteristics (i.e., damage increment of soil and rock) (Figure 6).
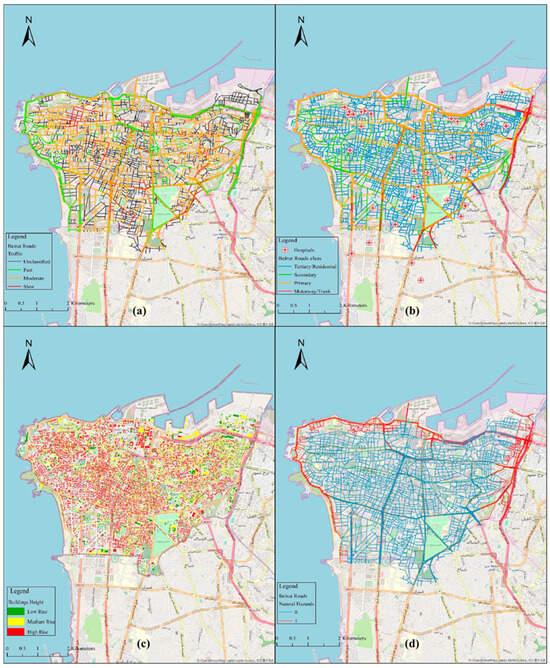
Figure 5.
Beirut transportation network weighted scenarios: (a) typical Monday noon peak traffic; (b) roads class and main hospitals; (c) building height distribution; and (d) vulnerable links to natural hazards.
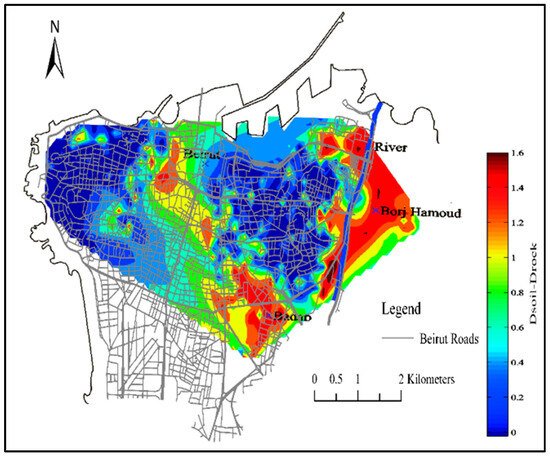
Figure 6.
Interpolated map of the damage increment computed based on the neural network approach for PGA = 0.25 g, modified from [53].
Scenario weights were determined through a data-driven, context-specific approach based on the relative impact of each factor on network vulnerability. Transportation data were weighted by assigning higher values to major roads (e.g., motorways and primary roads) with heavier traffic flow and direct access to critical infrastructure, particularly hospitals and emergency centers. Building-related weights reflected structural height, age, and typology, with greater emphasis placed on vulnerable low-rise and older buildings. Natural hazard risks were incorporated using spatial buffer analyses, with higher weights assigned to links located within predefined risk zones for floods, tsunamis, and sea-level rise, indicating higher exposure. Geological risk weights were derived from a seismic damage increment map, where nodes and links in areas with soft soils, elevated PGA, and strong soil-structure resonance effects received higher values. This multi-scenario weighting framework ensured that spatial risk patterns were appropriately reflected in the integrated network analysis.
A damage increment map was used to evaluate the seismic vulnerability of soil and structure data [53]. The map was based on a neural network approach that considers three typology classes: frequency ratio between soil and structure, PGA for various seismic scenarios, and horizontal-to-vertical spectral ratio interpolation, which is commonly used in seismic vulnerability and risk assessment. The parameter Dsoil–Drock represents the difference in expected structural damage between soft soil and rock under identical seismic loading. Higher values depicted in red indicate stronger amplification and thus greater damage potential (Figure 6). Links and nodes located within high-amplification zones were assigned higher weights to reflect increased vulnerability in the network analysis. Correspondingly, maps created for PGA equal to 0.25 indicated a significant damage increment for low-rise buildings (1–3 floors with an average height of 3 m each), as reported in [53,59]. The damage increment map was combined with the Beirut transportation network, along with 18,400 buildings represented by the height of their structure. Buildings were divided into three categories, where 27% of total buildings in Beirut were low-rise (i.e., 1–3 floors), 31% were medium-rise (i.e., 4–7 floors), and 42% were high-rise (i.e., >7 floors). It was considered that the low-rise buildings were the most vulnerable to seismic events as most of these structures were built before 1950 (i.e., masonry class) or between 1975 and 1990 during the civil war period, where a lack of quality control, construction, and reconstruction of structures was prevalent.
Based on traffic data, 16% of the network links were classified as fast-speed routes, while 74% and 10% were moderate- and slow-speed routes, respectively. Accordingly, 68% of the network nodes or intersections were deemed at a higher risk of being critical in the event of failure. As for road classification, 32% of the intersections on Beirut roads were considered essential for maintaining circulation to critical zones within the city. Moreover, 12% of network links and 20% of nodes were identified as susceptible to disturbances from natural hazards (e.g., sea-level rise and flooding), based on their proximity to designated buffer zones. Depending on the zonal geology and their susceptibility to liquefaction and landslides, 26% of network nodes were identified as vulnerable. Alternatively, the damage increment was minor in the two hills of Beirut created by rock formations, thereby having no aggravating effects on the structures. In fact, the damage on rock foundations is usually less than on soft soil due to the absence of soil amplification. Furthermore, around 25% of network links and 45% of their nodes were deemed high-risk due to their proximity to vulnerable buildings and unfavorable soil conditions (e.g., falling debris, ruptured utility lines, hazardous spills, and fires).
The topological parameters of the weighted network were interpreted through random nodal removal after each removal fraction. The average nodal degree, straightness, and connectivity indices of all weighted scenarios showed a significant downward trend. The most noteworthy trend was the average betweenness centrality, which decreased significantly for all cases after the second random removal, as shown in Figure 7. However, nodes in the degraded network were rearranged to form newly separated clusters, as reflected by the slight increase observed in the bar chart at the third removal iteration. Overall, the substantial decrease in the topological parameter indicates a network structure failure that can lead to severe resource scarcity and hinder emergency teams. Moreover, the network exhibited a low average path length, suggesting structural characteristics similar to both random and small-world networks. In such topologies, the impact of node removal—whether random or targeted—tends to be more evenly distributed across the system [60]. This stands in contrast to scale-free networks, which, while highly resilient to random failures, are disproportionately vulnerable to targeted attacks on high-degree hubs [61]. In random networks, where most node degrees are concentrated around the average degree, the structure is practical but remains susceptible to random disruptions. Similarly, in the case of the Beirut network, system efficiency tends to decline under repeated random node removals, particularly when structurally significant nodes are impacted.
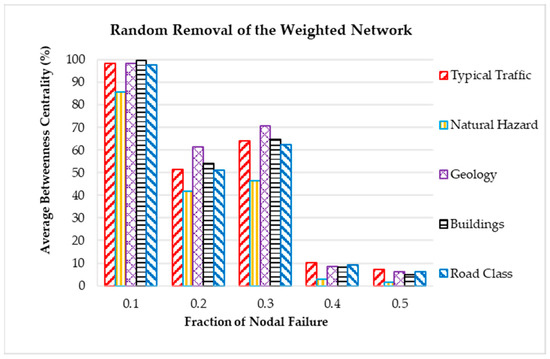
Figure 7.
Random nodal removal effects on the weighted network scenarios.
The study evaluates critical network nodes and their redundancies to analyze the system’s performance under different removal modes. Figure 8 illustrates the extent of disrupted links resulting from both random and targeted removal modes. The simulation results of both undisturbed and disturbed components highlighted that network performance was primarily influenced by traffic, road classification, and buildings scenarios. The comparison was based on disrupted links in the random failure removal mode over those in the targeted failure removal mode. The analysis of network traffic scenarios revealed that targeted events could result in over a 30% increase in failed links compared to random events. In road class and building scenarios, the decline persisted until the fourth removal. After that, the trend deviated, indicating the deterioration of the most highly connected intersections; however, the ratios remained lower than those in the random failure mode. Conversely, the remaining two scenarios indicated an increase in disrupted links in the random failure mode compared to the targeted one. This suggests that the weighted geology and natural hazard scenarios were not closely associated with the most connected nodes and links in the network.
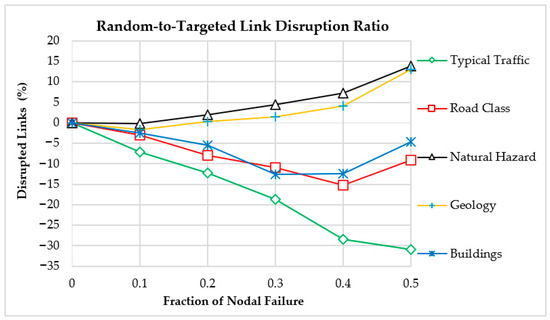
Figure 8.
Comparative disruption of links under random and targeted failures.
Spatial network analysis usually assumes that transportation happens via the shortest accessible paths. However, people can experience longer routes in real networks for different subjective choices. For this reason, determining the redundant routes in a disruptive event is necessary. Alternative paths should be found between the OD matrices for a certain length quota beyond the shortest routes. In this manner, network robustness interrelated to the redundancy index can reveal the extent of additional weighted path length through OD pairs using a specified redundancy coefficient. For instance, if a 5% coefficient is applied and the redundancy output is equal to “RI = 4”, four times more route lengths exist on redundant paths than on the shortest path alone. The paths obtained will increase as the redundancy coefficient rises, making the analysis more computationally intensive. In emergency and evacuation situations, time is deemed critical. In this study, the percentages of redundant nodes reachable to vital centers were computed under the targeted removal mode of top-weighted network properties across different scenarios. The results revealed that the network was shut down after disrupting only 40% of its components. Notably, the second removal fraction depicted the weakness in reaching less than half of the city’s available hospitals and critical emergency centers, with only a 44% chance of reaching 13 destinations.
The average redundancy loss was assessed following each removed fraction in the weighted network. The average redundancy decreased to half its overall performance after only 20% of nodal removal. Accordingly, after evaluating the network performance and efficiency measures through different classified weighted scenarios, the critical redundant street nodes and intersections were generated and mapped as in Figure 9a. The criterion of critical nodes was mainly based on the average redundancy indices from these nodes to the available hospitals. The vulnerable key nodes were all over Beirut. However, most of the clustered nodes were located along the primary roads in the center and extending toward the capital’s west side. Such points possessed low redundancy and constituted around 25% of all the network components. Correspondingly, the remaining nodes were divided into 70% with moderate and 5% with high redundancy levels, respectively. This reflects the need to focus on these exposed areas, which are more susceptible in the case of disasters (Figure 9b).
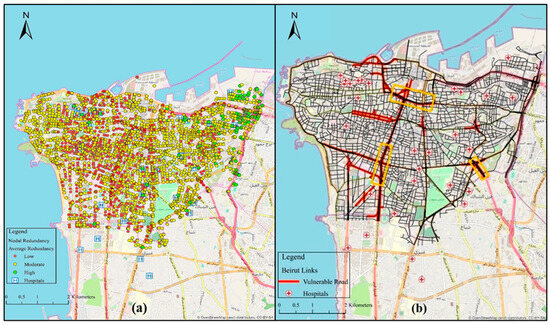
Figure 9.
Network resilience and critical components: (a) nodal average redundancy of Beirut intersections to the accessible hospitals and (b) major vulnerable links and intersections.
6. Conclusions
This paper evaluates the vulnerability and criticality of the Beirut transportation network and proposes a predictive methodology to assess its operational resilience under extreme events. By integrating GIS-based spatial data with network theory, the proposed method quantifies structural vulnerabilities and functional capacities, providing targeted guidance to inform strategies for enhancing network resilience.
Engineering resilience is evaluated using centrality and redundancy metrics through quantitative and statistical modeling. The results indicate low redundancy and high sensitivity to even minor disruptions, leading to a rapid decline in overall system performance. Despite some central segments exhibiting moderate robustness, the findings suggest a lack of structurally or functionally resilient components capable of absorbing external stressors. Notably, the Beirut transportation network responds similarly to both random and targeted failure scenarios, a pattern indicative of increased vulnerability. Such findings classify the network as highly vulnerable, underscoring the critical need to understand and address the vulnerability of lifeline infrastructure for disaster preparedness, response planning, and risk mitigation.
Future research should focus on developing adaptive, dynamic vulnerability assessment methods that incorporate real-time data and account for evolving geotechnical, environmental, climatic, and socio-economic conditions. This integration with spatial-network modeling can improve the predictive capacity and operational responsiveness of transportation resilience frameworks. Identifying critical network components and classifying their risk levels will further support effective emergency routing and evacuation planning. Advancing these goals requires close collaboration among infrastructure agencies, urban planners, and emergency management authorities to enable proactive risk reduction, critical asset protection, and the long-term sustainability of urban lifeline systems.
Author Contributions
Conceptualization, Francesco Rouhana and Dima Jawad; methodology, Francesco Rouhana; software, Francesco Rouhana; validation, Francesco Rouhana and Dima Jawad; formal analysis, Francesco Rouhana; investigation, Francesco Rouhana; resources, Dima Jawad; data curation, Francesco Rouhana; writing—original draft, Francesco Rouhana; writing—review and editing, Francesco Rouhana and Dima Jawad; visualization, Francesco Rouhana; supervision, Dima Jawad. All authors have read and agreed to the published version of the manuscript.
Funding
This research received no external funding.
Data Availability Statement
Some or all data, models, or code that support the findings of this study are available from the corresponding author upon reasonable request.
Conflicts of Interest
The authors declare no conflicts of interest.
References
- Mottahedi, A.; Sereshki, F.; Ataei, M.; Qarahasanlou, A.N.; Barabadi, A. The Resilience of Critical Infrastructure Systems: A Systematic Literature Review. Energies 2021, 14, 1517. [Google Scholar] [CrossRef]
- Chowdhury, S.; Ren, Z.; Rouhana, F.; Wang, J.; Zhu, J. Exploring Sustainability in Resource Management: Implementation of a Water–Energy–Human Nexus Framework at a University Campus. J. Constr. Eng. Manag. 2024, 150, 10. [Google Scholar] [CrossRef]
- Rouhana, F.; Zhu, J.; Bagtzoglou, A.C.; Burton, C.G. Analyzing Structural Inequalities in Natural Hazard-Induced Power Outages: A Spatial-Statistical Approach. Int. J. Disaster Risk Reduct. 2025, 105, 105184. [Google Scholar] [CrossRef]
- Valencia Londoño, P.A.; Valencia Londoño, D. Persistent Vulnerability after Disaster Risk Reduction (DRR) Response: The Case of Salgar, Colombia. Sustainability 2024, 16, 4394. [Google Scholar] [CrossRef]
- Cutter, S.L. Urban Risks and Resilience. In Urban Informatics; Shi, W., Goodchild, M.F., Batty, M., Kwan, M.P., Zhang, A., Eds.; The Urban Book Series; Springer: Singapore, 2021. [Google Scholar] [CrossRef]
- Rouhana, F.; Zhu, J. Examining Rural-Urban Disparity in Disaster Impact and Recovery: Case of Tropical Storm Isaias. In Computing in Civil Engineering 2023: Resilience, Safety, and Sustainability—Selected Papers from the ASCE International Conference on Computing in Civil Engineering 2023; American Society of Civil Engineers (ASCE): Reston, VA, USA, 2024; pp. 219–227. [Google Scholar] [CrossRef]
- United Nations Office for Disaster Risk Reduction (UNDRR). Forensic Insights for Future Resilience: Learning from Past Disasters; UNDRR: Geneva, Switzerland, 2024; Available online: https://www.undrr.org/gar/gar2024-special-report (accessed on 28 April 2025).
- Rouhana, F.; Zhu, J.; Bagtzoglou, A.C.; Burton, C.G. Examining Rural–Urban Vulnerability Inequality in Extreme Weather-Related Power Outages: Case of Tropical Storm Isaias. Nat. Hazards Rev. 2025, 26, 03024003. [Google Scholar] [CrossRef]
- Park, H.J.; Song, S.M.; Kim, D.H.; Lee, S.O. Socioeconomic Impact on Urban Resilience against Flood Damage. Appl. Sci. 2024, 14, 7882. [Google Scholar] [CrossRef]
- UNDRR. Sendai Framework for Disaster Risk Reduction 2015–2030. 2015. Available online: https://www.unisdr.org/files/43291_sendaiframeworkfordrren.pdf (accessed on 25 April 2025).
- United Nations Department of Economic and Social Affairs (UN DESA). The Sustainable Development Goals Report 2024; UN DESA: New York, NY, USA, 2024; Available online: https://unstats.un.org/sdgs/report/2024/ (accessed on 16 April 2025).
- Farooq, A.; Xie, M.; Stoilova, S.; Ahmad, F.; Guo, M.; Williams, E.J.; Issa, A.M. Transportation Planning through GIS and Multicriteria Analysis: Case Study of Beijing and Xiongan. J. Adv. Transp. 2018, 2018, 1–11. [Google Scholar] [CrossRef]
- Ntafloukas, K.; Pasquale, L.; Martinez-Pastor, B.; McCrum, D.P. A Vulnerability Assessment Approach for Transportation Networks Subjected to Cyber–Physical Attacks. Future Internet 2023, 15, 100. [Google Scholar] [CrossRef]
- Wassmer, J.; Merz, B.; Marwan, N. Resilience of Transportation Infrastructure Networks to Road Failures. Chaos 2024, 34, 1. [Google Scholar] [CrossRef]
- Aydin, N.Y.; Duzgun, H.S.; Wenzel, F.; Heinimann, H.R. Integration of Stress Testing with Graph Theory to Assess the Resilience of Urban Road Networks under Seismic Hazards. Nat. Hazards 2018, 91, 37–68. [Google Scholar] [CrossRef]
- Ding, J.; Wang, Y.; Li, C. A Dual-Layer Complex Network-Based Quantitative Flood Vulnerability Assessment Method of Transportation Systems. Land 2024, 13, 753. [Google Scholar] [CrossRef]
- Rezvani, S.M.H.S.; Silva, M.J.F.; de Almeida, N.M. Urban Resilience Index for Critical Infrastructure: A Scenario-Based Approach to Disaster Risk Reduction in Road Networks. Sustainability 2024, 16, 4143. [Google Scholar] [CrossRef]
- Huijer, C.; Harajli, M.; Sadek, S. Re-Evaluation and Updating of the Seismic Hazard of Lebanon. J. Seismol. 2016, 20, 233–250. [Google Scholar] [CrossRef]
- Bruneau, M.; Chang, S.E.; Eguchi, R.T.; Lee, G.C.; O’Rourke, T.D.; Reinhorn, A.M.; Shinozuka, M.; Tierney, K.; Wallace, W.A.; von Winterfeldt, D. A Framework to Quantitatively Assess and Enhance the Seismic Resilience of Communities. Earthq. Spectra 2003, 19, 733–752. [Google Scholar] [CrossRef]
- Poulin, C.; Kane, M.B. Infrastructure Resilience Curves: Performance Measures and Summary Metrics. Reliab. Eng. Syst. Saf. 2021, 219, 107926. [Google Scholar] [CrossRef]
- Mentges, A.; Halekotte, L.; Schneider, M.; Demmer, T.; Lichte, D. A Resilience Glossary Shaped by Context: Reviewing Resilience-Related Terms for Critical Infrastructures. Int. J. Disaster Risk Reduct. 2023, 94, 103893. [Google Scholar] [CrossRef]
- Najarian, M.; Lim, G.J. Design and Assessment Methodology for System Resilience Metrics. Risk Anal. 2019, 39, 1885–1898. [Google Scholar] [CrossRef]
- Ayyub, B.M. Systems Resilience for Multihazard Environments: Definition, Metrics, and Valuation for Decision Making. Risk Anal. 2014, 34, 340–355. [Google Scholar] [CrossRef]
- Bruneau, M.; Reinhorn, A. Exploring the Concept of Seismic Resilience for Acute Care Facilities. Earthq. Spectra 2007, 23, 41–62. [Google Scholar] [CrossRef]
- Cimellaro, G.P.; Reinhorn, A.M.; Bruneau, M. Framework for Analytical Quantification of Disaster Resilience. Eng. Struct. 2010, 32, 3639–3649. [Google Scholar] [CrossRef]
- Liu, Y.; McNeil, S.; Hackl, J.; Adey, B.T. Prioritizing Transportation Network Recovery Using a Resilience Measure. Sustain. Resil. Infrastruct. 2022, 7, 70–81. [Google Scholar] [CrossRef]
- Nicolosi, V.; Augeri, M.; D’Apuzzo, M.; Evangelisti, A.; Santilli, D. A Probabilistic Approach to the Evaluation of Seismic Resilience in Road Asset Management. Int. J. Disaster Risk Sci. 2022, 13, 114–124. [Google Scholar] [CrossRef]
- Akbarzadeh, M.; Memarmontazerin, S.; Derrible, S.; Salehi Reihani, S.F. The Role of Travel Demand and Network Centrality on the Connectivity and Resilience of an Urban Street System. Transportation 2019, 46, 1127–1141. [Google Scholar] [CrossRef]
- Wang, D.; Xue, Y.; Zhang, Q.; Niu, M. Scale-Free and Small-World Properties of a Special Hierarchical Network. Fractals 2019, 27, 1950010. [Google Scholar] [CrossRef]
- Zhenwu, S.; Xianyu, T.; Huiyu, L.; Hui, L.; Jie, L.; Xunguo, L. Quantitative Study on the Waterlogging Resilience of Road Transportation System Based on the Validity View of System Functions. J. Eng. Sci. Technol. Rev. 2019, 12, 117–125. [Google Scholar] [CrossRef]
- Ganin, A.A.; Kitsak, M.; Marchese, D.; Keisler, J.M.; Seager, T.; Linkov, I. Resilience and Efficiency in Transportation Networks. Sci. Adv. 2017, 3, e1701079. [Google Scholar] [CrossRef]
- Janić, M. Modelling the Resilience of Rail Passenger Transport Networks Affected by Large-Scale Disruptive Events: The Case of HSR (High-Speed Rail). Transportation 2018, 45, 1101–1137. [Google Scholar] [CrossRef]
- Cerqueti, R.; Ferraro, G.; Iovanella, A. Measuring Network Resilience through Connection Patterns. Reliab. Eng. Syst. Saf. 2019, 188, 320–329. [Google Scholar] [CrossRef]
- Garrison, W.L.; Marble, D.F. Factor-Analytic Study of the Connectivity of a Transportation Network. Pap. Reg. Sci. 1964, 12, 231–238. [Google Scholar] [CrossRef]
- Testa, A.C.; Furtado, M.N.; Alipour, A. Resilience of Coastal Transportation Networks Faced with Extreme Climatic Events. Transp. Res. Rec. 2015, 2532, 29–36. [Google Scholar] [CrossRef]
- Albert, R.; Barabási, A.L. Statistical Mechanics of Complex Networks. Rev. Mod. Phys. 2002, 74, 47–97. [Google Scholar] [CrossRef]
- Dueñas-Osorio, L.; Craig, J.I.; Goodno, B.J.; Bostrom, A. Interdependent Response of Networked Systems. J. Infrastruct. Syst. 2007, 13, 185–194. [Google Scholar] [CrossRef]
- Liu, W.; Li, X.; Liu, T.; Liu, B. Approximating Betweenness Centrality to Identify Key Nodes in a Weighted Urban Complex Transportation Network. J. Adv. Transp. 2019, 2019, 9024745. [Google Scholar] [CrossRef]
- Freeman, L.C. A Set of Measures of Centrality Based on Betweenness. Sociometry 1977, 40, 35–41. [Google Scholar] [CrossRef]
- Reggiani, A.; Nijkamp, P.; Lanzi, D. Transport Resilience and Vulnerability: The Role of Connectivity. Transp. Res. Part A Policy Pract. 2015, 81, 4–15. [Google Scholar] [CrossRef]
- Allen, E.; Costello, S.B.; Henning, T.F.P.; Chamorro, A.; Echaveguren, T. Integration of Resilience and Risk to Natural Hazards into Transportation Asset Management of Road Networks: A Systematic Review. Struct. Infrastruct. Eng. 2023, 19, 2238281. [Google Scholar] [CrossRef]
- Serdar, M.Z.; Koç, M.; Al-Ghamdi, S.G. Urban Transportation Networks Resilience: Indicators, Disturbances, and Assessment Methods. Sustain. Cities Soc. 2022, 76, 103452. [Google Scholar] [CrossRef]
- Ahmadzai, F.; Rao, K.M.L.; Ulfat, S. Assessment and Modelling of Urban Road Networks Using Integrated Graph of Natural Road Network (a GIS-Based Approach). J. Urban Manag. 2019, 8, 109–125. [Google Scholar] [CrossRef]
- Candelieri, A.; Galuzzi, B.G.; Giordani, I.; Archetti, F. Vulnerability of Public Transportation Networks Against Directed Attacks and Cascading Failures. Public Transp. 2019, 11, 27–49. [Google Scholar] [CrossRef]
- Ahmed, M.A.; Sadri, A.M.; Mehrabi, A.; Azizinamini, A. Identifying Topological Credentials of Physical Infrastructure Components to Enhance Transportation Network Resilience: Case of Florida Bridges. J. Transp. Eng. Part A Syst. 2022, 148, 04022071. [Google Scholar] [CrossRef]
- Chatterjee, A.; Manohar, M.; Ramadurai, G. Statistical Analysis of Bus Networks in India. PLoS ONE 2016, 11, e0168478. [Google Scholar] [CrossRef] [PubMed]
- Li, M.; Han, J. Complex Network Theory in Urban Traffic Network. Atlantis Press 2017, 175, 860–864. [Google Scholar] [CrossRef][Green Version]
- De Bona, A.A.; de Oliveira Rosa, M.; Ono Fonseca, K.V.; Lüders, R. A Reduced Model for Complex Network Analysis of Public Transportation Systems. Phys. A Stat. Mech. Appl. 2021, 567, 125715. [Google Scholar] [CrossRef]
- Zhang, D.-M.; Du, F.; Huang, H.; Zhang, F.; Ayyub, B.M.; Beer, M. Resiliency Assessment of Urban Rail Transit Networks: Shanghai Metro as an Example. Saf. Sci. 2018, 106, 230–243. [Google Scholar] [CrossRef]
- Wu, C.; Kim, I. Analyzing the Structural Properties of Bike-Sharing Networks: Evidence from the United States, Canada, and China. Transp. Res. Part A Policy Pract. 2020, 140, 52–71. [Google Scholar] [CrossRef]
- Sevtsuk, A.; Mekonnen, M. Urban Network Analysis: A New Toolbox for ArcGIS. Rev. Int. Géomatique 2012, 22, 287–305. [Google Scholar] [CrossRef]
- Porta, S.; Crucitti, P.; Latora, V. The Network Analysis of Urban Streets: A Dual Approach. Phys. A Stat. Mech. Appl. 2006, 369, 853–866. [Google Scholar] [CrossRef]
- Salameh, C.; Guillier, B.; Harb, J.; Cornou, C.; Bard, P.Y.; Voisin, C.; Mariscal, A. Seismic Response of Beirut (Lebanon) Buildings: Instrumental Results from Ambient Vibrations. Bull. Earthq. Eng. 2016, 14, 2705–2730. [Google Scholar] [CrossRef]
- Du, Y.; Xie, M.; Jia, J. Stepped Settlement: A Possible Mechanism for Translational Landslides. Catena 2020, 187, 104365. [Google Scholar] [CrossRef]
- Chen, D.; Yin, S.; Long, W.; Zhang, Y.; Yang, Y. Heterogeneous Information Phase Space Reconstruction and Stability Prediction of Filling Body-Surrounding Rock Combination. Int. J. Miner. Metall. Mater. 2024, 31, 1500–1511. [Google Scholar] [CrossRef]
- Lai, X.P.; Shan, P.F.; Cai, M.F.; Liu, J.; Zhang, Y. Comprehensive Evaluation of High-Steep Slope Stability and Optimal High-Steep Slope Design by 3D Physical Modeling. Int. J. Miner. Metall. Mater. 2015, 22, 1–11. [Google Scholar] [CrossRef]
- Barthélemy, M. Spatial Networks. Phys. Rep. 2011, 499, 1–101. [Google Scholar] [CrossRef]
- Rouhana, F.; Jawad, D. Transportation Network Resilience against Failures: GIS-Based Assessment of Network Topology Role. Int. J. Disaster Resil. Built Environ. 2021, 12, 357–370. [Google Scholar] [CrossRef]
- Salameh, C.; Bard, P.Y.; Guillier, B.; Harb, J.; Cornou, C.; Gérard, J.; Almakari, M. Using Ambient Vibration Measurements for Risk Assessment at an Urban Scale: From Numerical Proof of Concept to Beirut Case Study (Lebanon). Earth Planets Space 2017, 69, 1. [Google Scholar] [CrossRef]
- Watts, D.J.; Strogatz, S.H. Collective Dynamics of ‘Small-World’ Networks. Nature 1998, 393, 440–442. [Google Scholar] [CrossRef]
- Holme, P.; Kim, B.J.; Yoon, C.N.; Han, S.K. Attack vulnerability of complex networks. Phys. Rev. E 2002, 65, 056109. [Google Scholar] [CrossRef]
Disclaimer/Publisher’s Note: The statements, opinions and data contained in all publications are solely those of the individual author(s) and contributor(s) and not of MDPI and/or the editor(s). MDPI and/or the editor(s) disclaim responsibility for any injury to people or property resulting from any ideas, methods, instructions or products referred to in the content. |
© 2025 by the authors. Published by MDPI on behalf of the International Society for Photogrammetry and Remote Sensing. Licensee MDPI, Basel, Switzerland. This article is an open access article distributed under the terms and conditions of the Creative Commons Attribution (CC BY) license (https://creativecommons.org/licenses/by/4.0/).