

AutoGEEval: A Multimodal and Automated Evaluation Framework for Geospatial Code Generation on GEE with Large Language Models

 , ,
, ,  , ,
, ,  , and
, and
Abstract
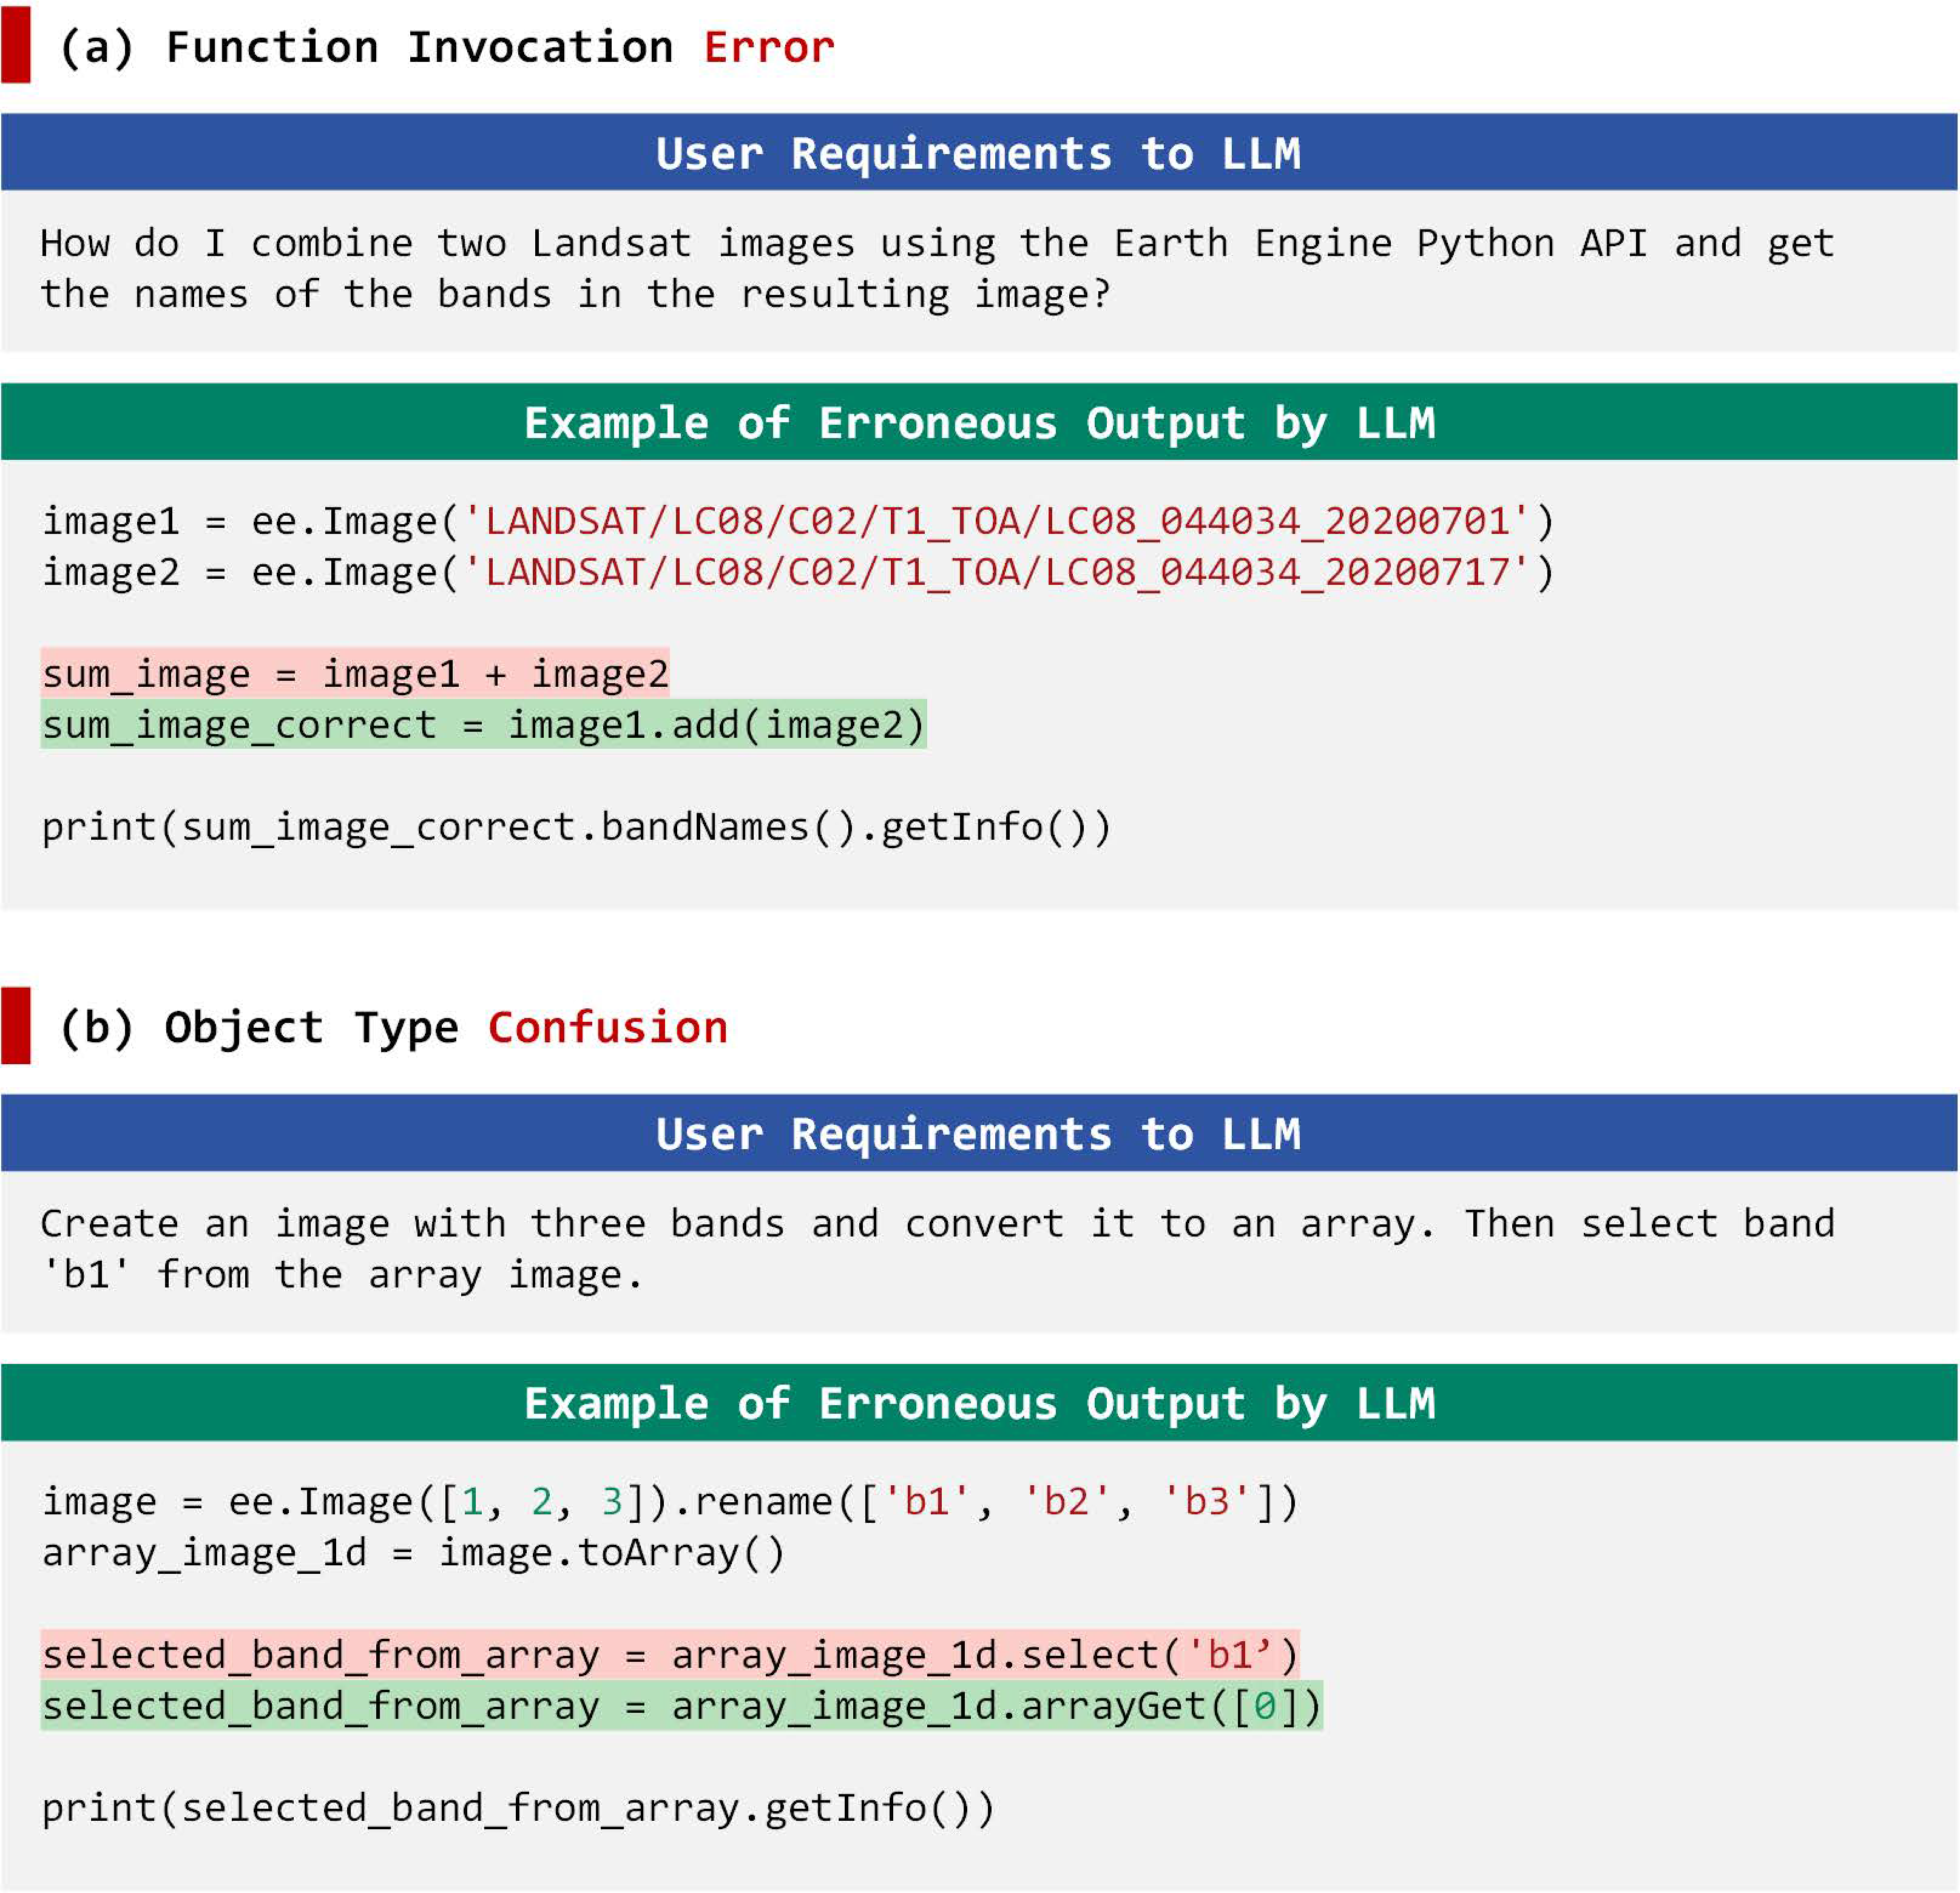
1. Introduction
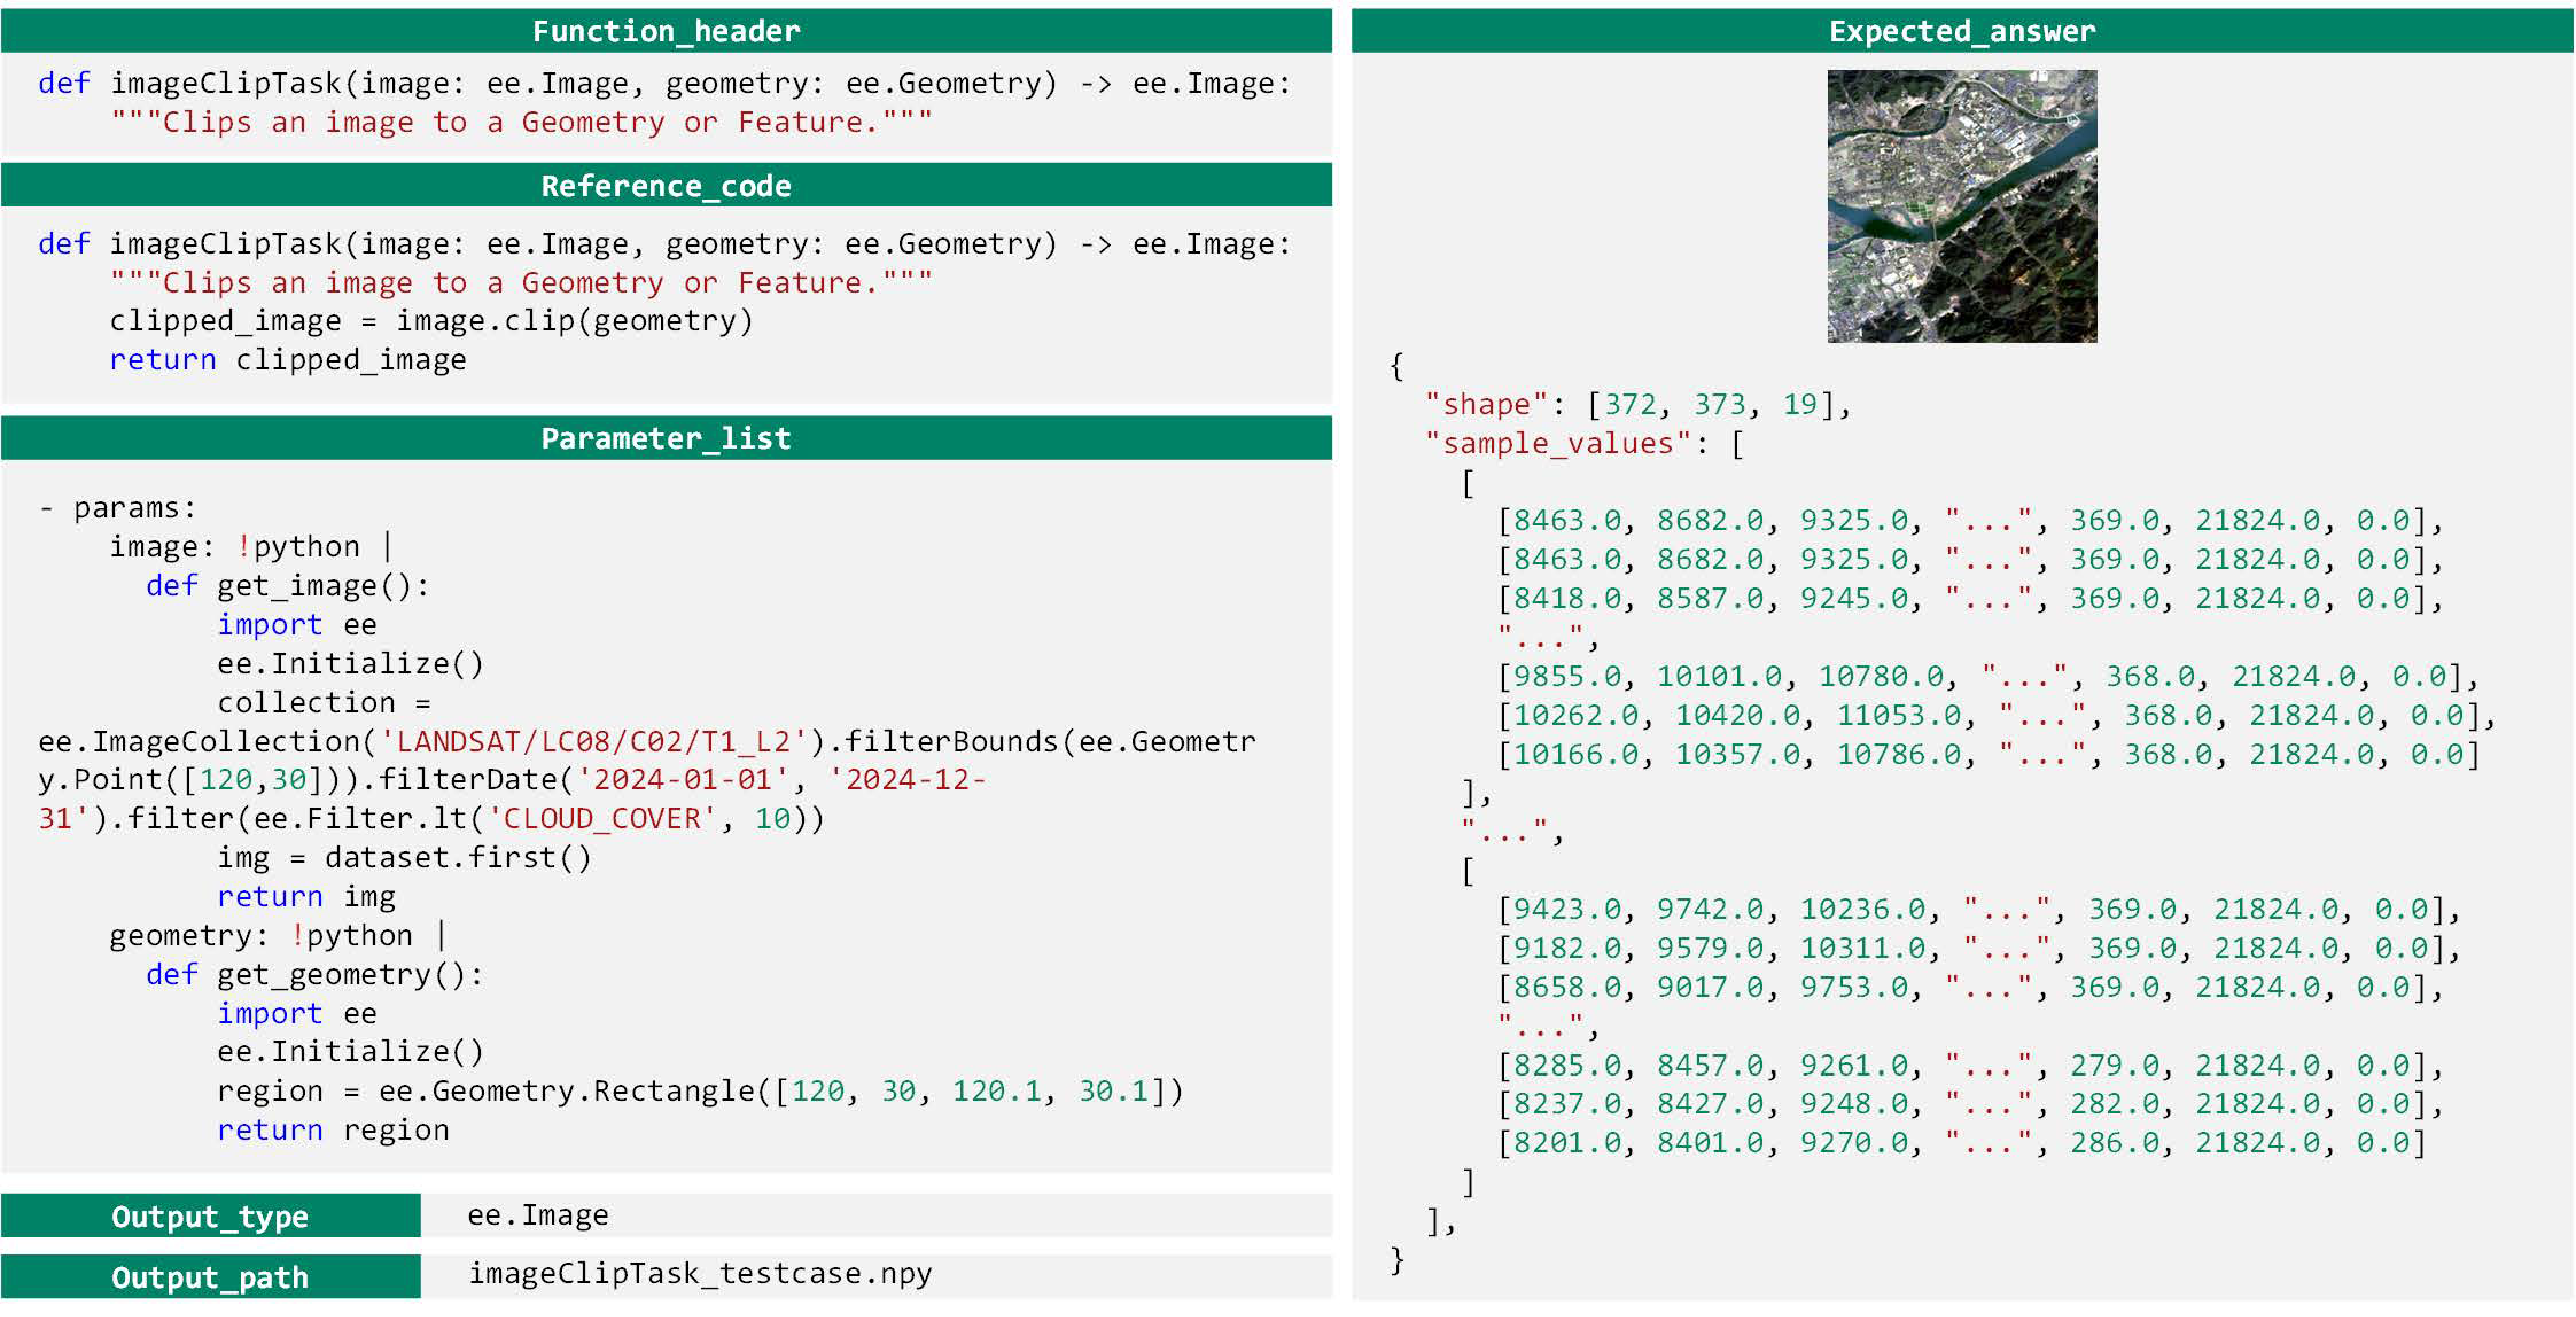
- We design, implement, and open-source AutoGEEval, the first automated evaluation framework for geospatial code generation on GEE using LLMs. The framework supports end-to-end automation of test execution, result verification, and error type analysis across multimodal data types at the unit level.
- We construct and release AutoGEEval-Bench, a geospatial code benchmark comprising 1325 unit-level test cases spanning 26 distinct GEE data types.
- We conduct a comprehensive evaluation of 18 representative LLMs across four categories—including GPT-4o, DeepSeek-R1, Qwen2.5-Coder, and GeoCode-GPT—by measuring execution pass rates for geospatial code generation tasks. In addition, we analyze model accuracy, resource consumption, execution efficiency, and error type distributions, providing insights into current limitations and future optimization directions.
2. AutoGEEval-Bench
2.1. Task Definition
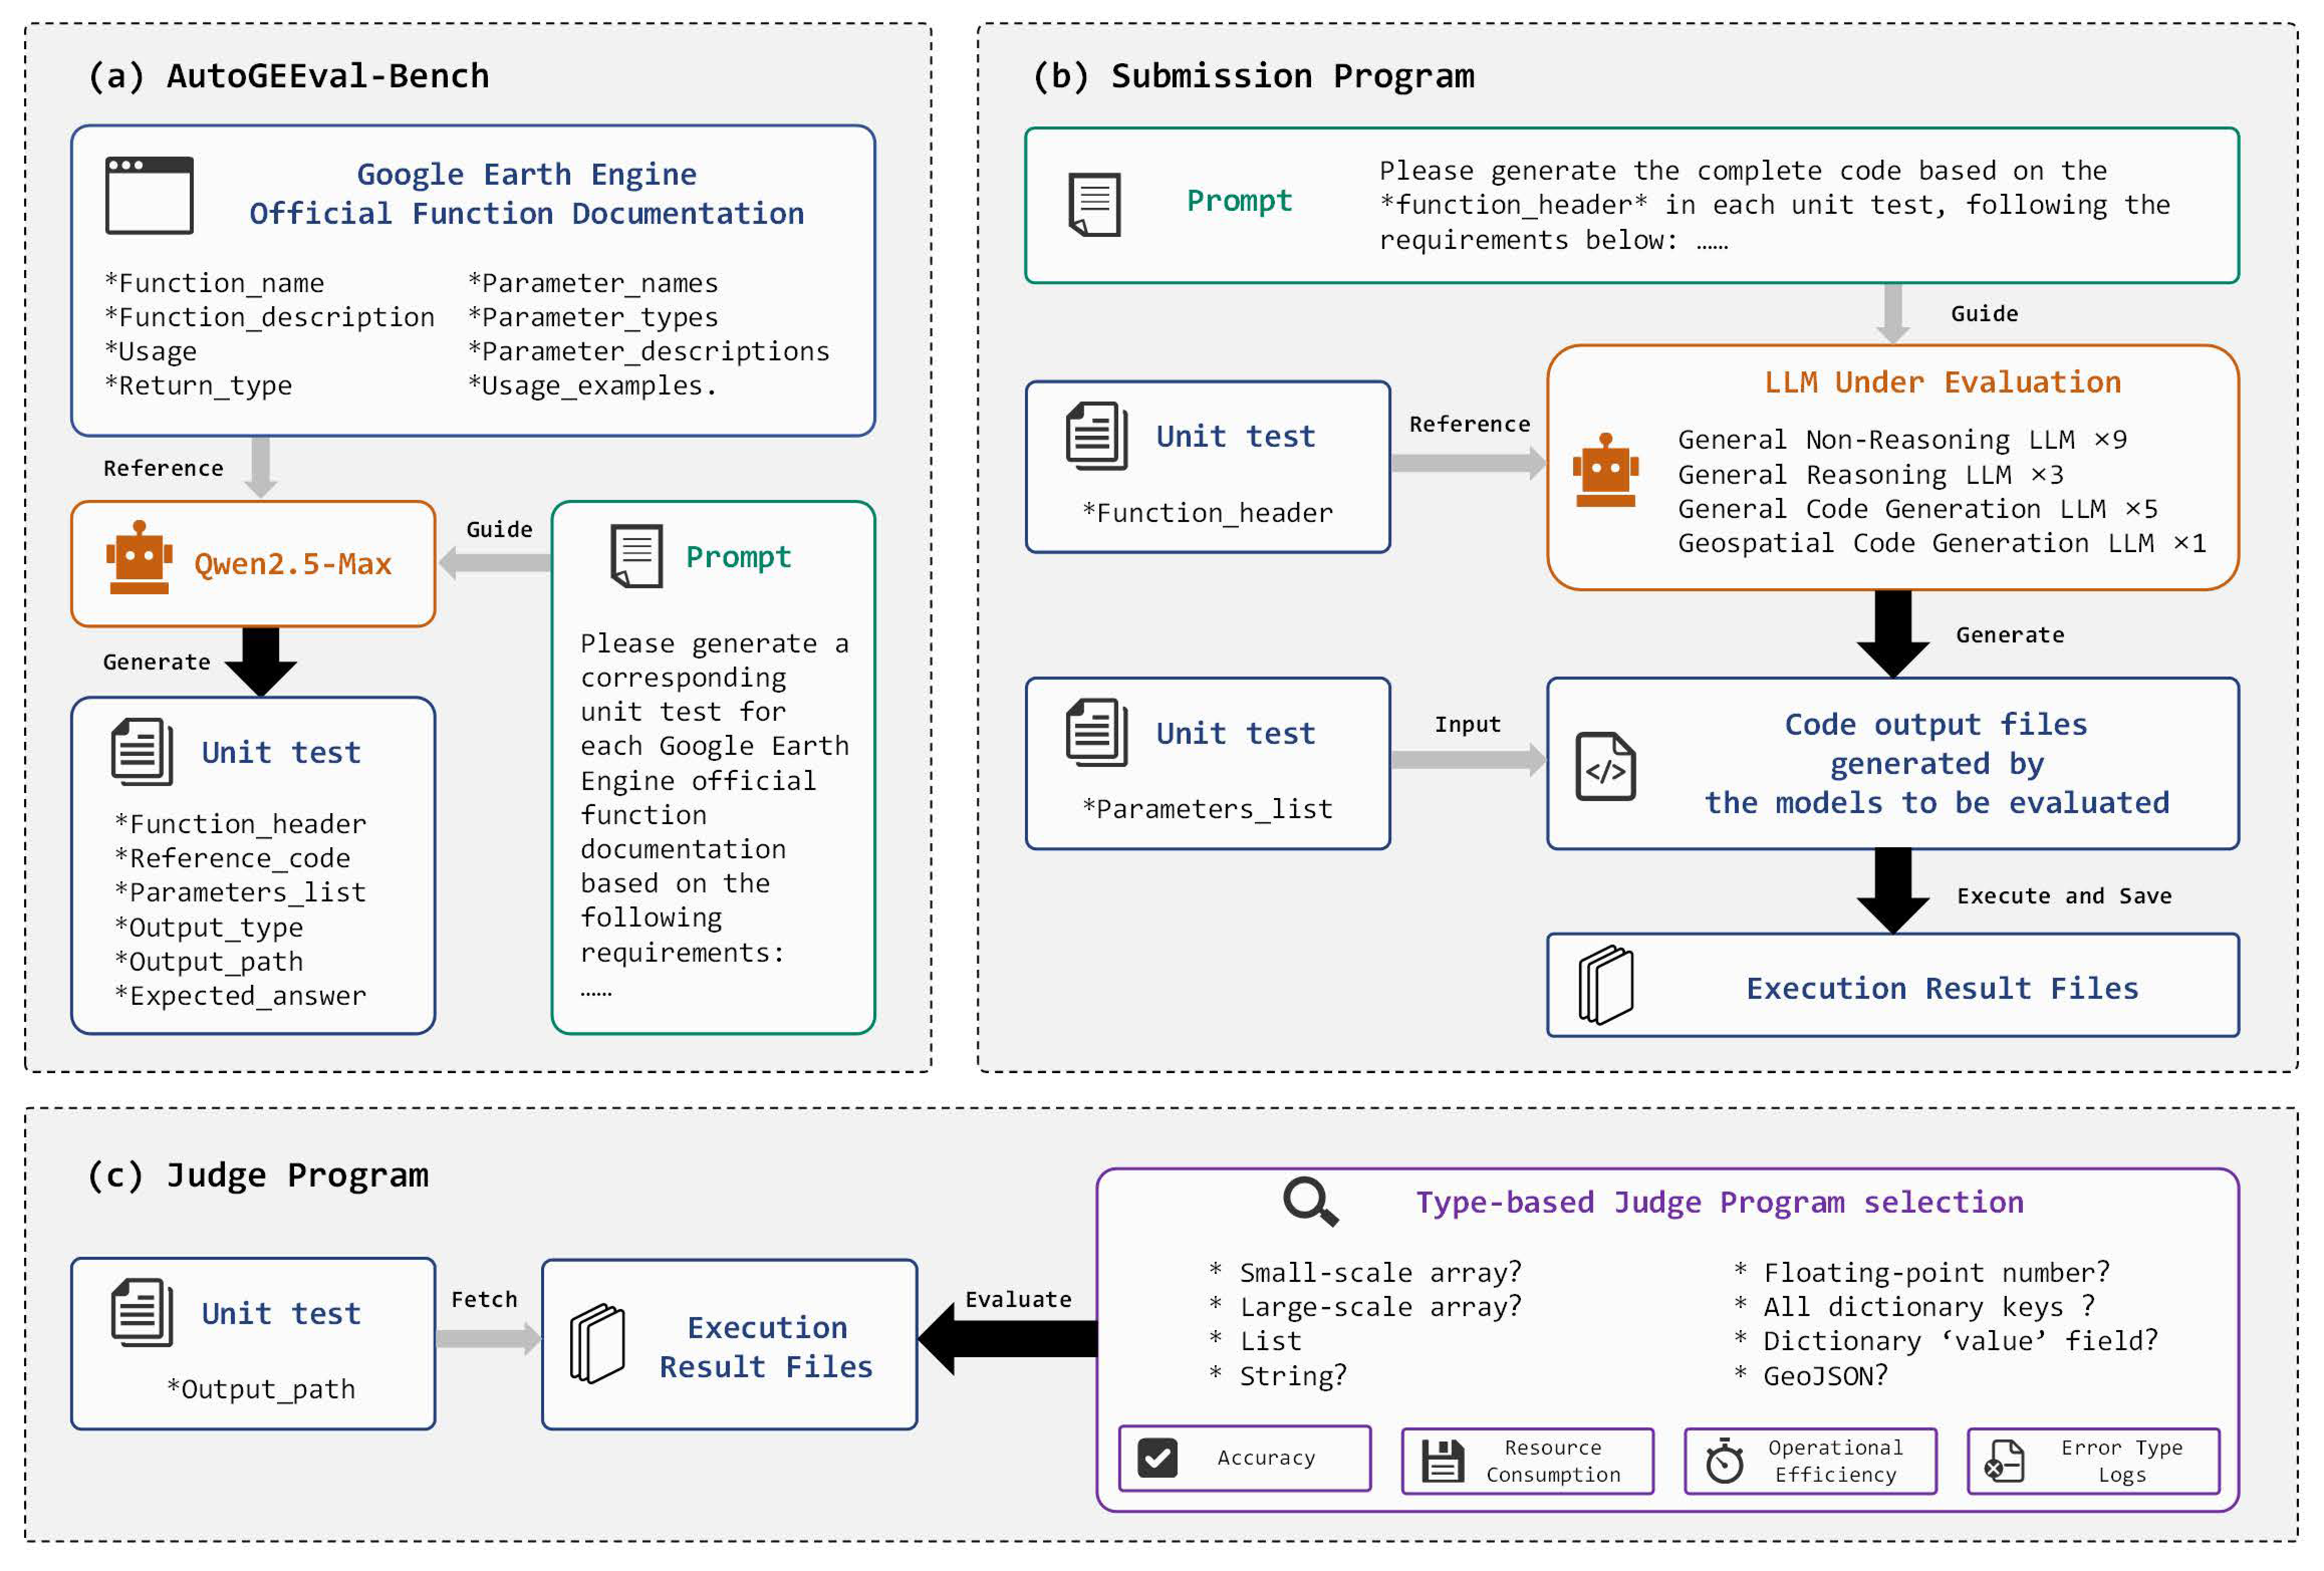
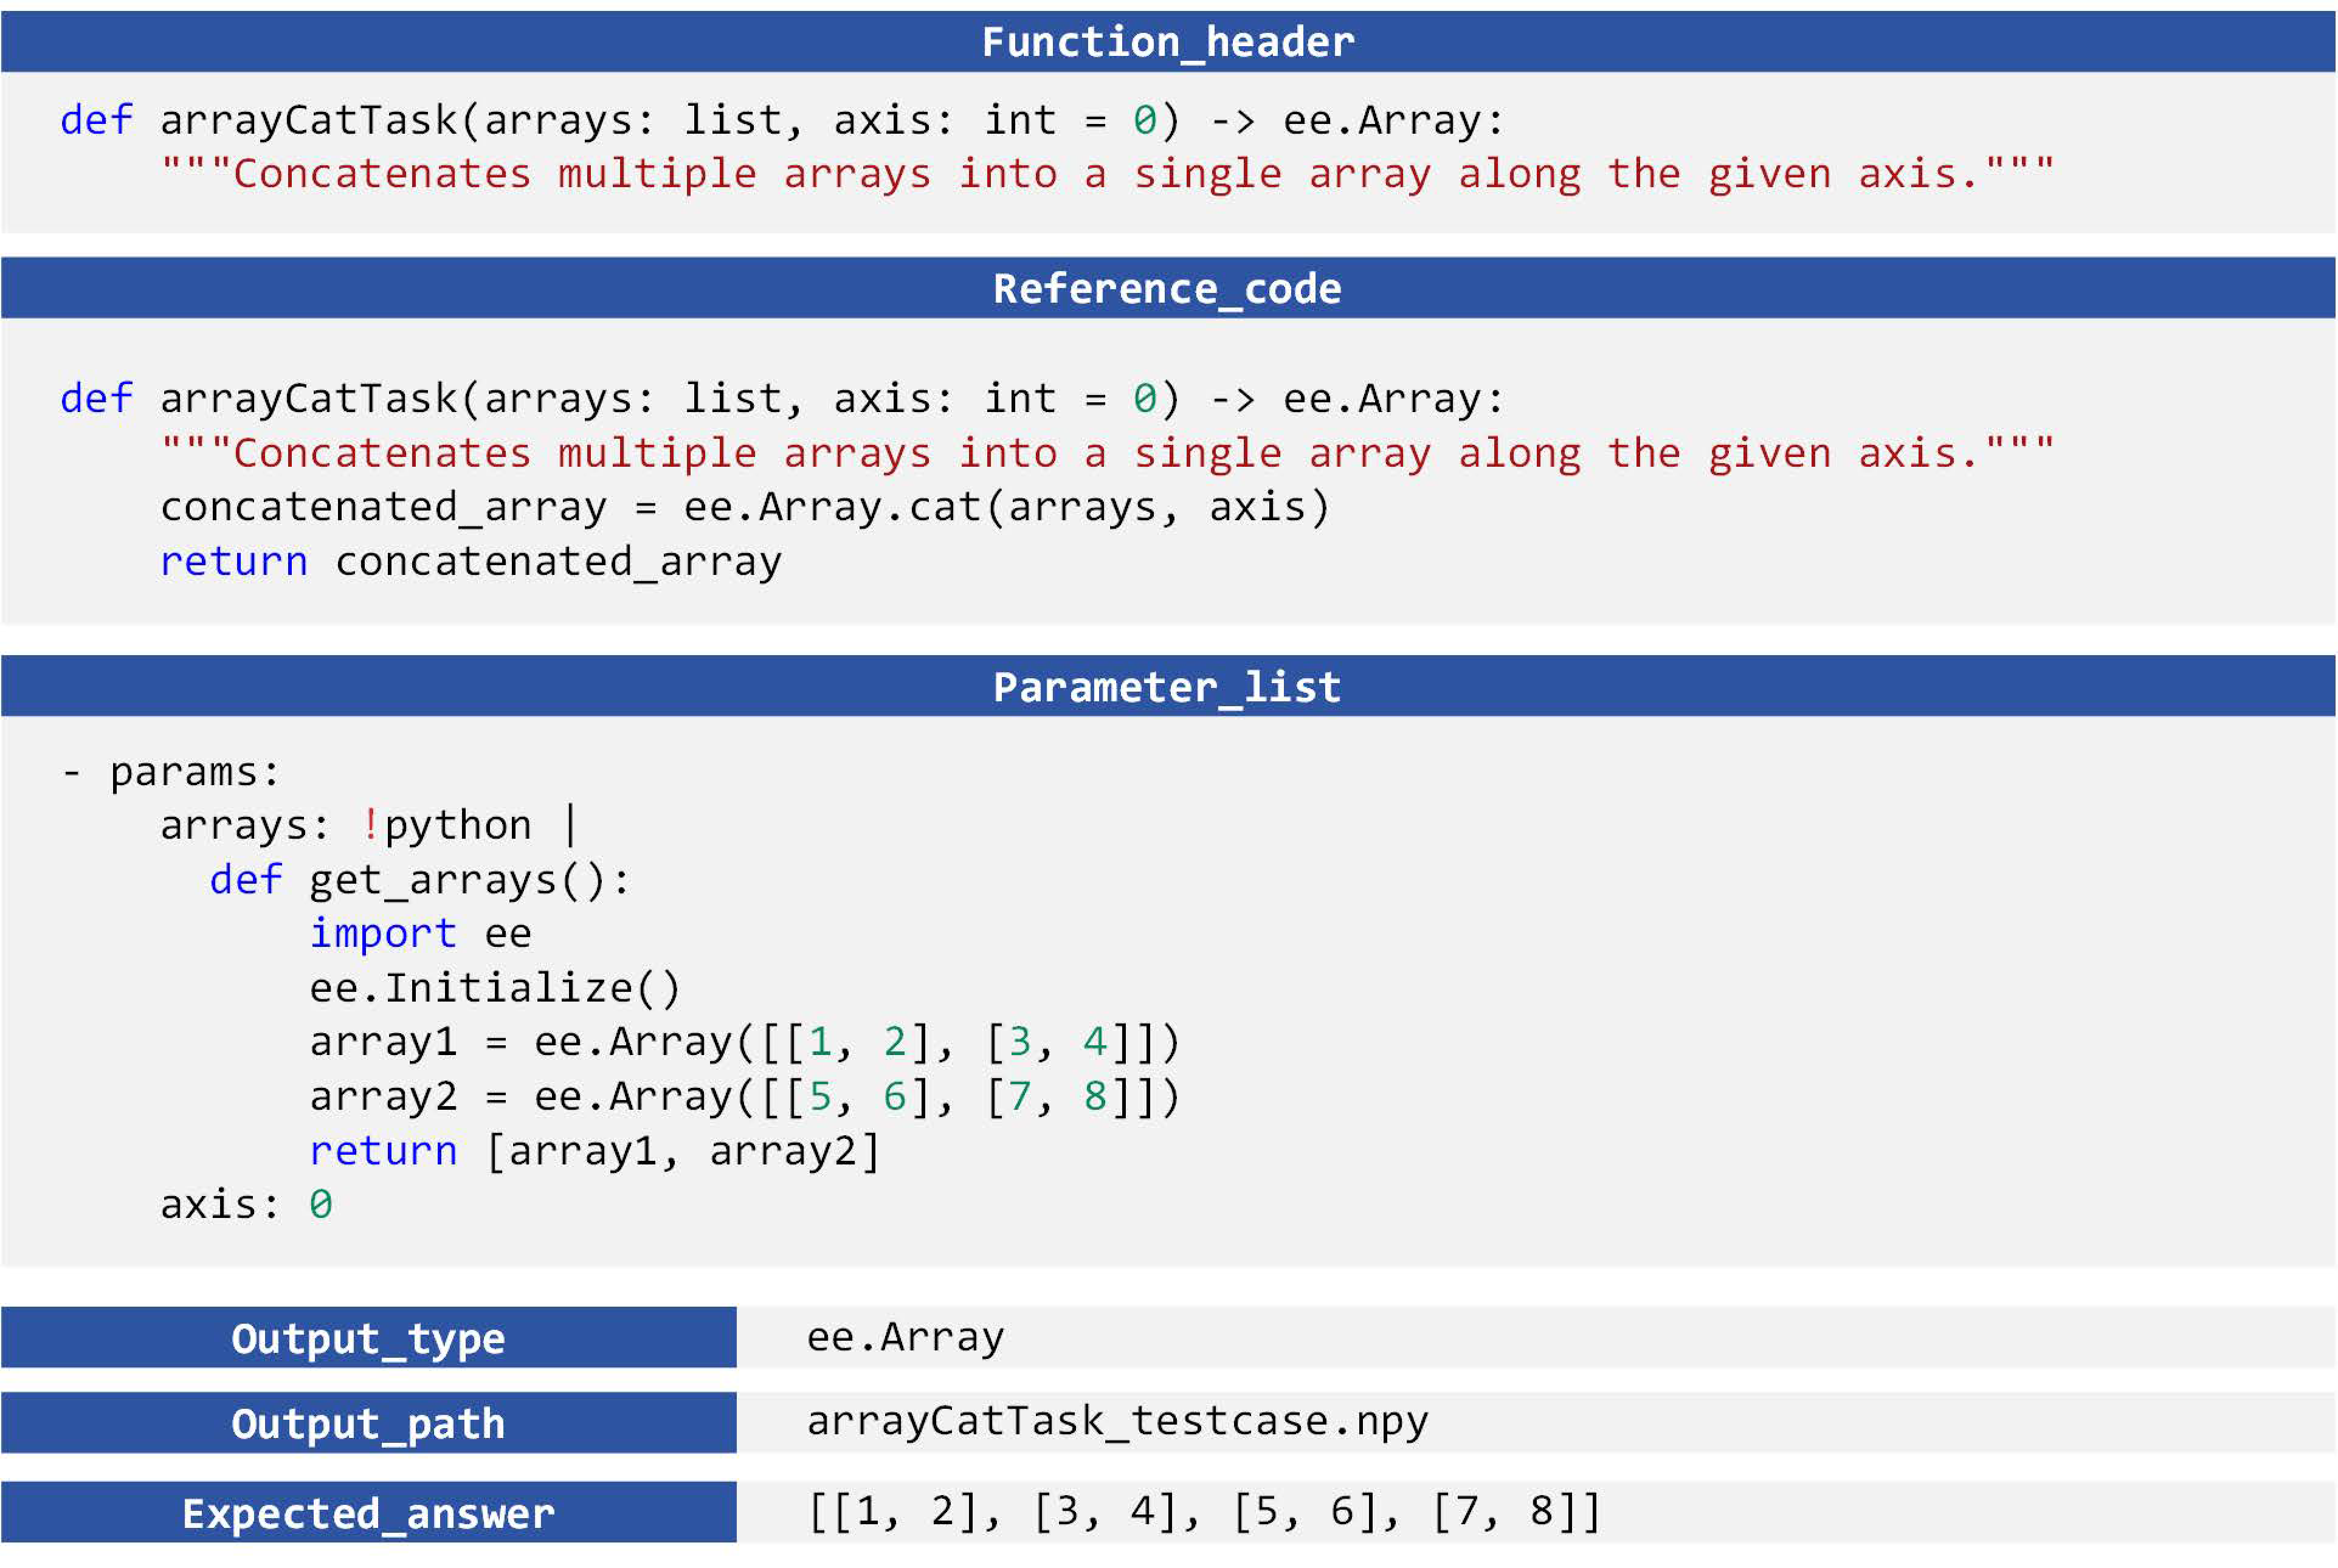
2.2. Structural Design
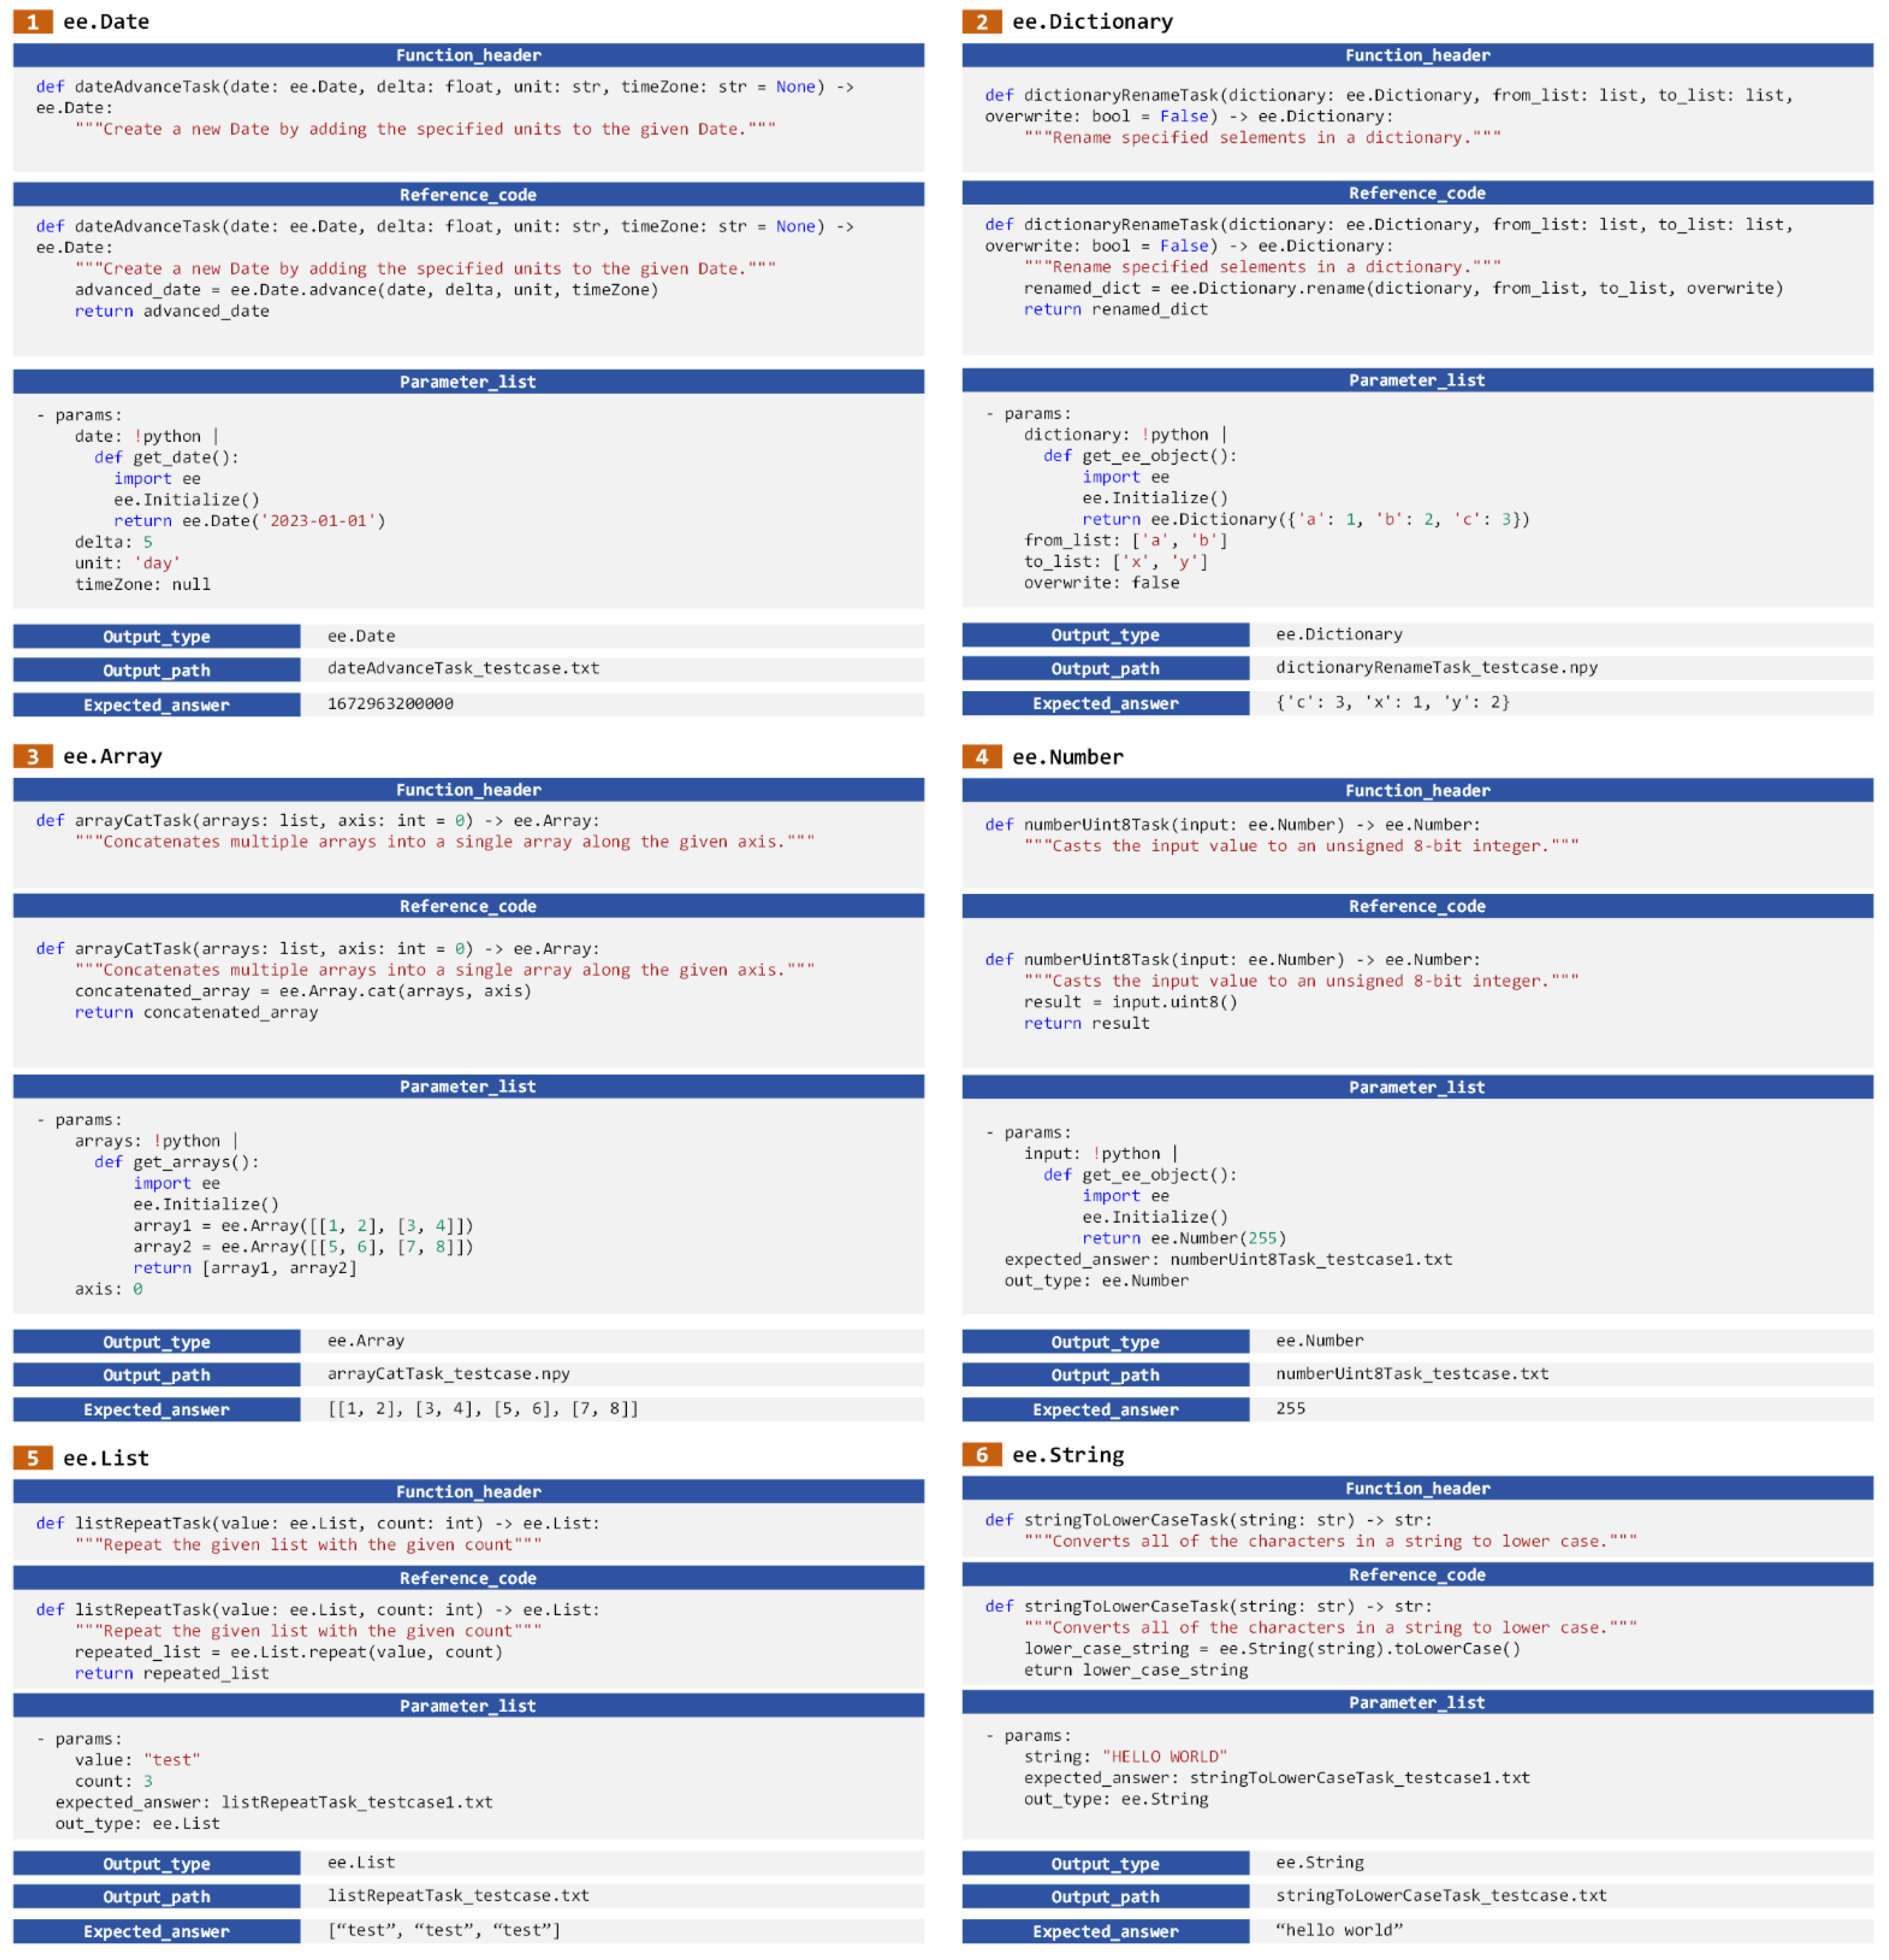
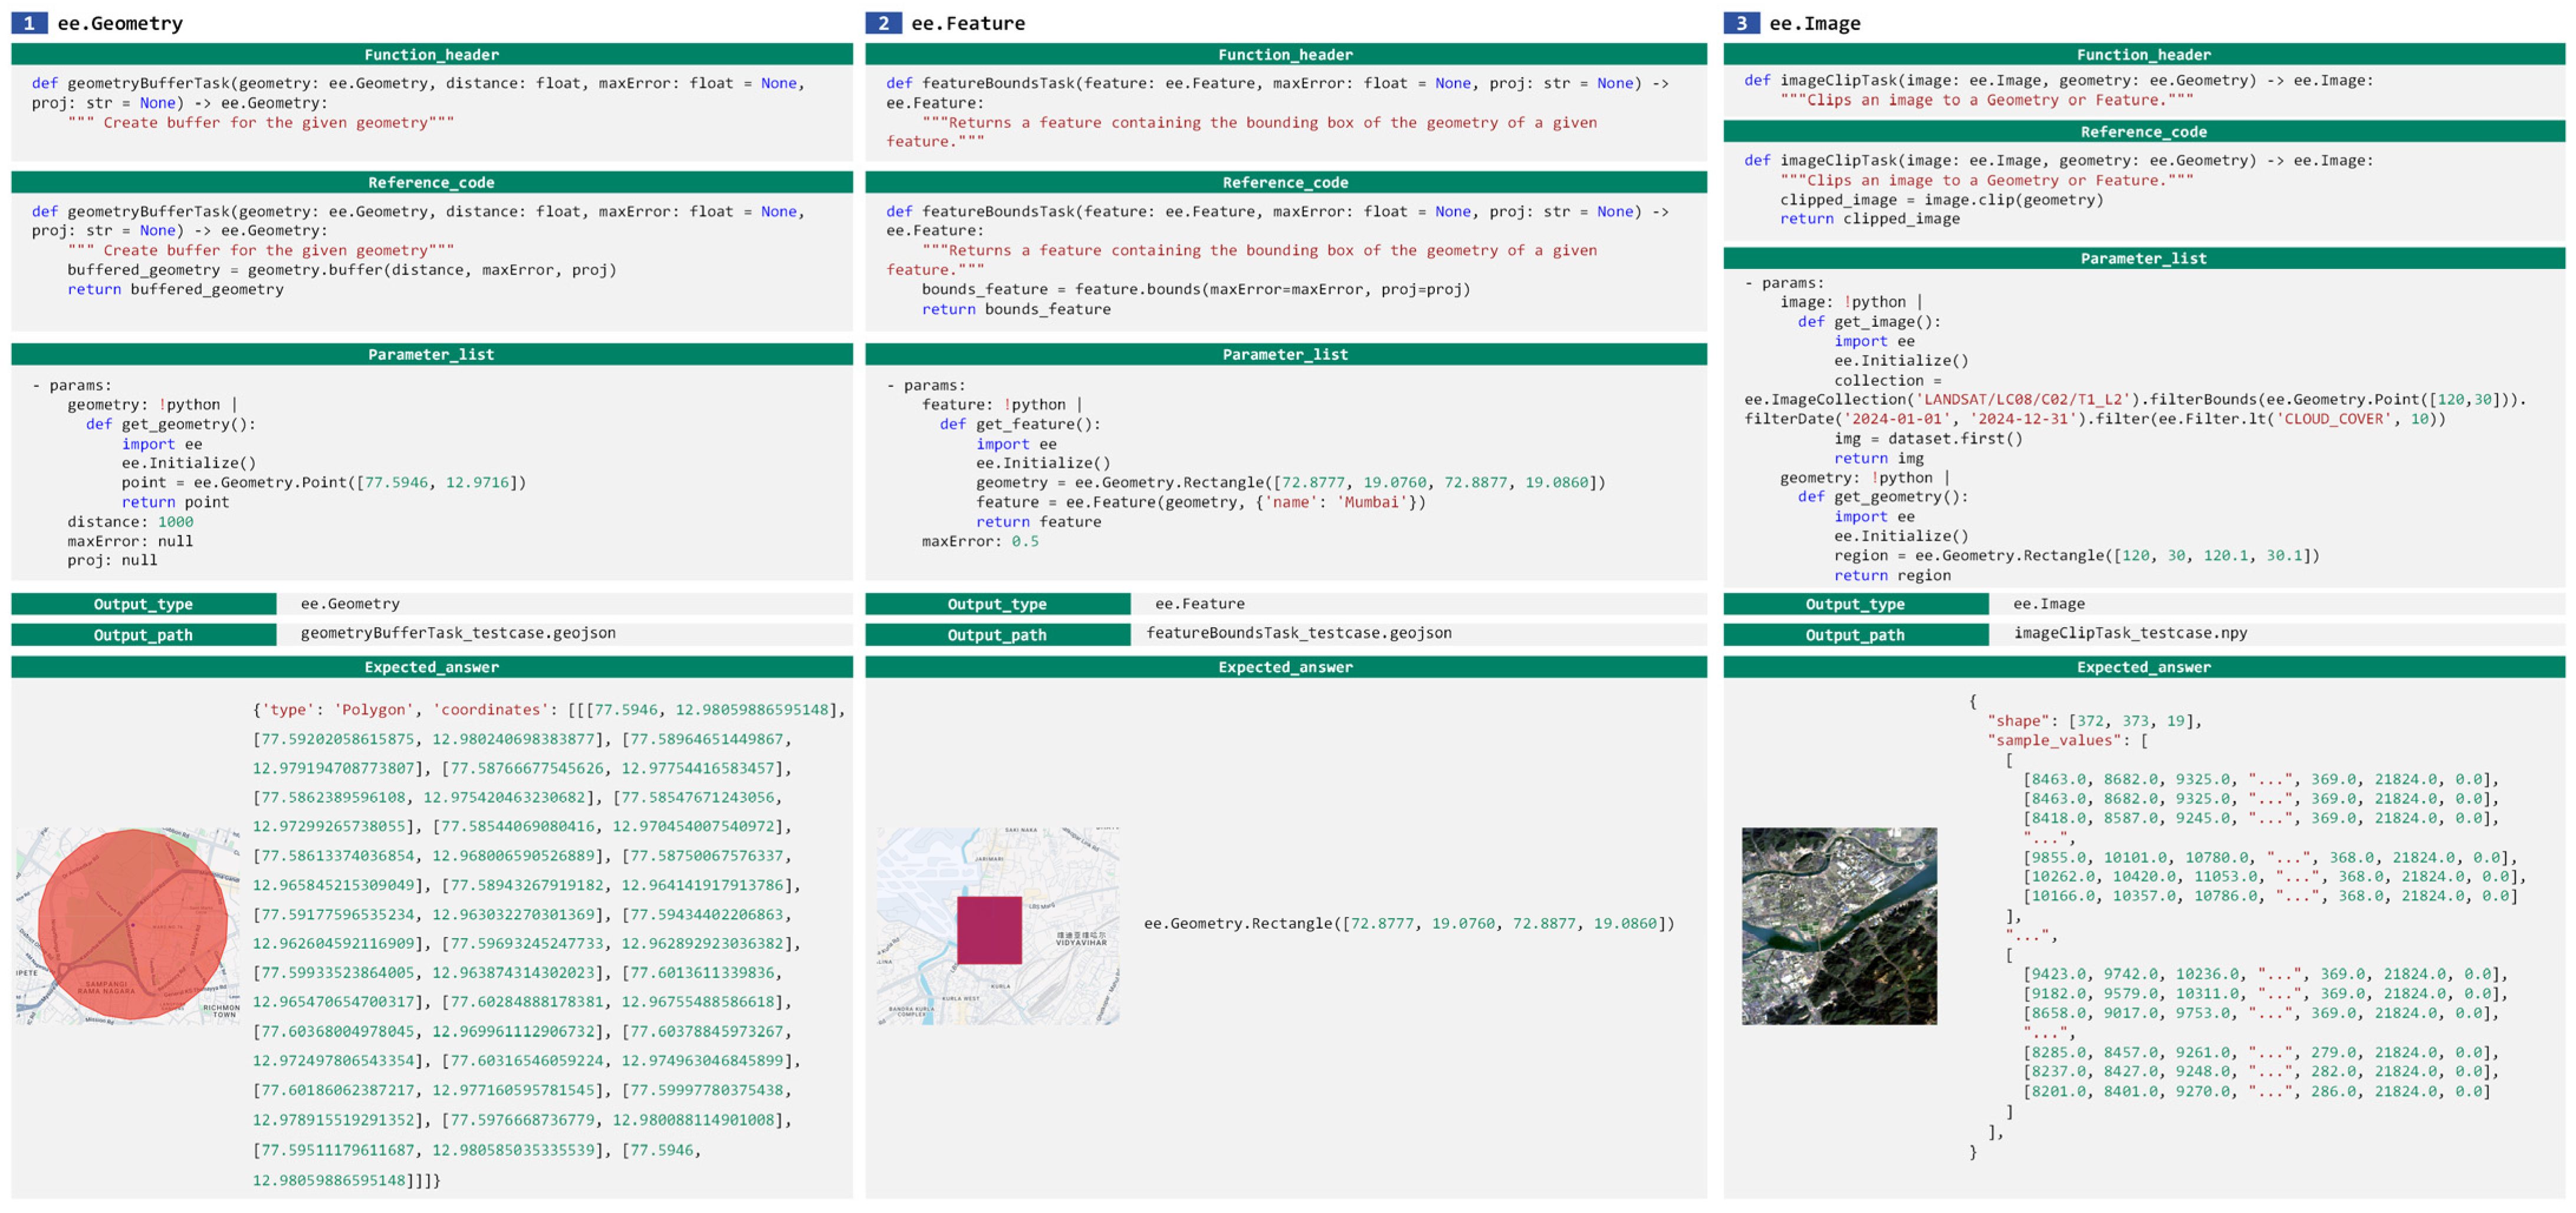
- : Function declaration, including the ‘def’ statement, function name, parameter list, and a natural language description of the function’s purpose. It serves as the semantic prompt to guide the language model in generating the complete function body.
- : Reference code snippet, representing the intended logic of the function. It is generated by Qwen2.5-Max based on a predefined prompt and is executed by human experts to obtain the standard answer. During the testing phase, this component is completely hidden from the model, which must independently complete a functionally equivalent implementation based solely on .
- Parameter list, specifying the concrete values to be injected into the function during testing, thereby constructing a runnable execution environment.
- : Output type, indicating the expected data type returned by the function, used to enforce format constraints on the model’s output. Examples include numeric values, Boolean values, dictionaries, or layer objects.
- : Output path, specifying where the execution result of the generated code will be stored. The testing system retrieves the model’s output from this path.
- : Expected answer, the correct output obtained by executing the reference code with the given parameters. It serves as the ground-truth reference for evaluating the accuracy of the model’s output.
2.3. Construction Methodology
2.4. Construction Results
3. Submission and Judge Programs
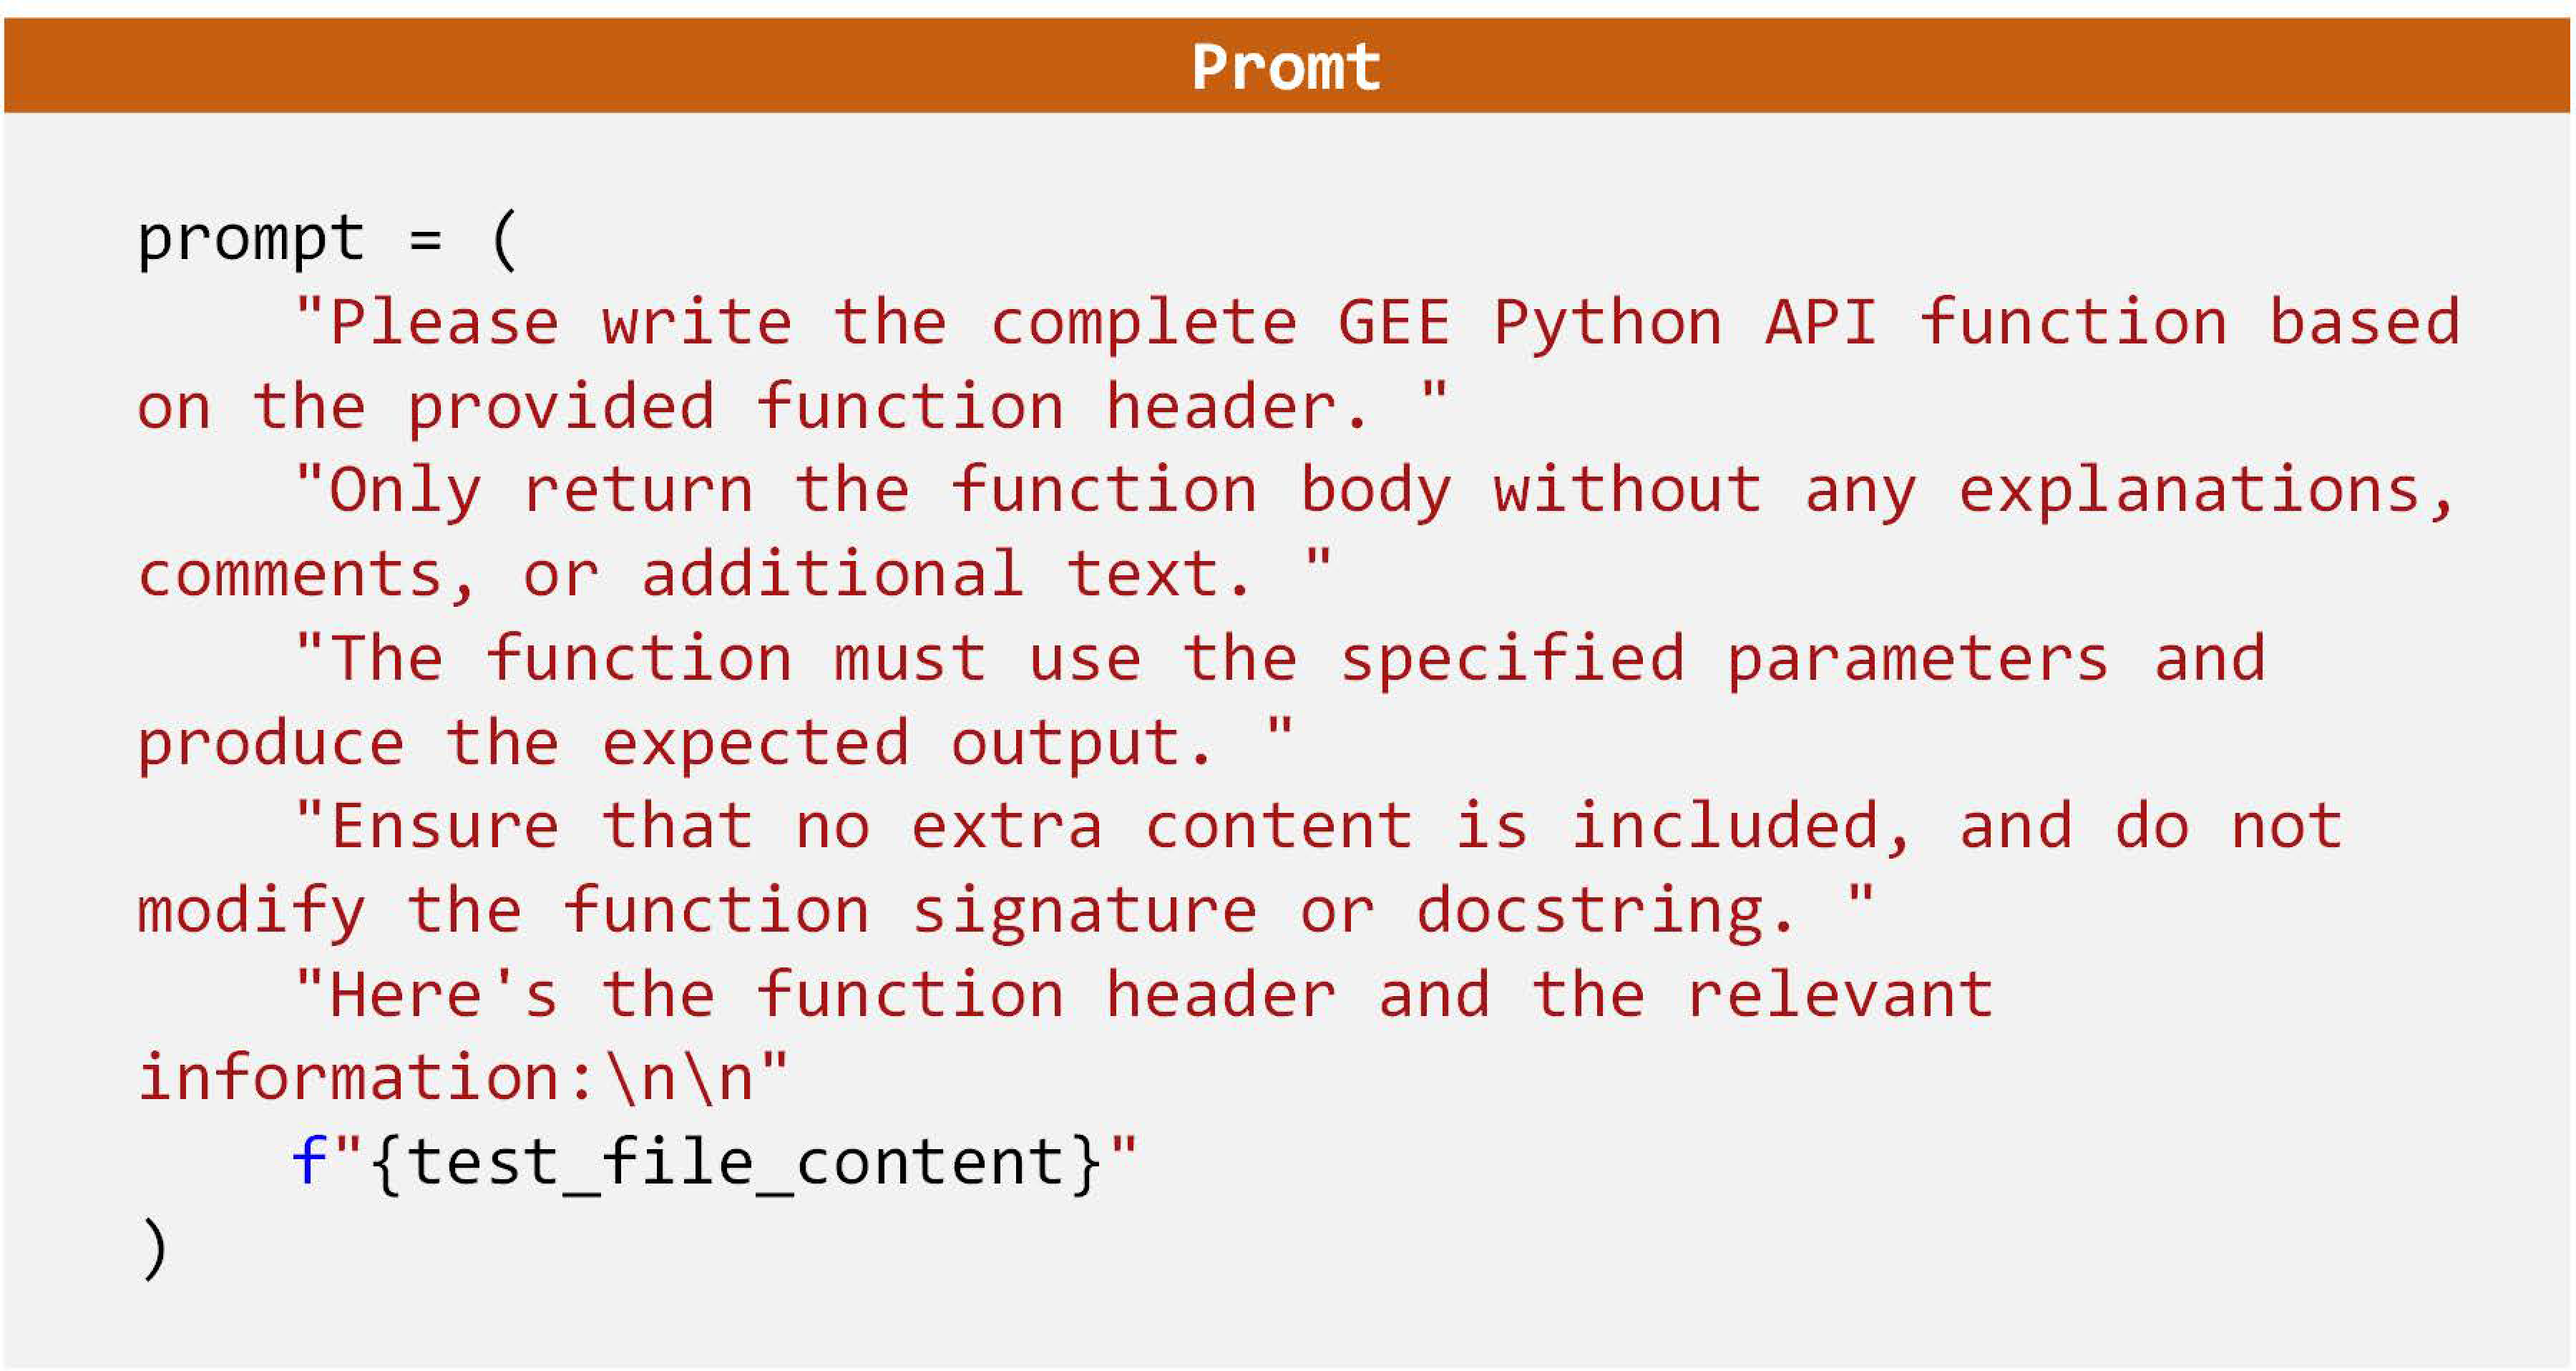
3.1. Submission Program
3.2. Judge Program
4. Experiments
4.1. Evaluated Models
4.2. Experimental Setup
4.3. Evaluation Metrics
4.3.1. Accuracy Metrics
4.3.2. Image Metrics
4.3.3. Resource Consumption Metrics
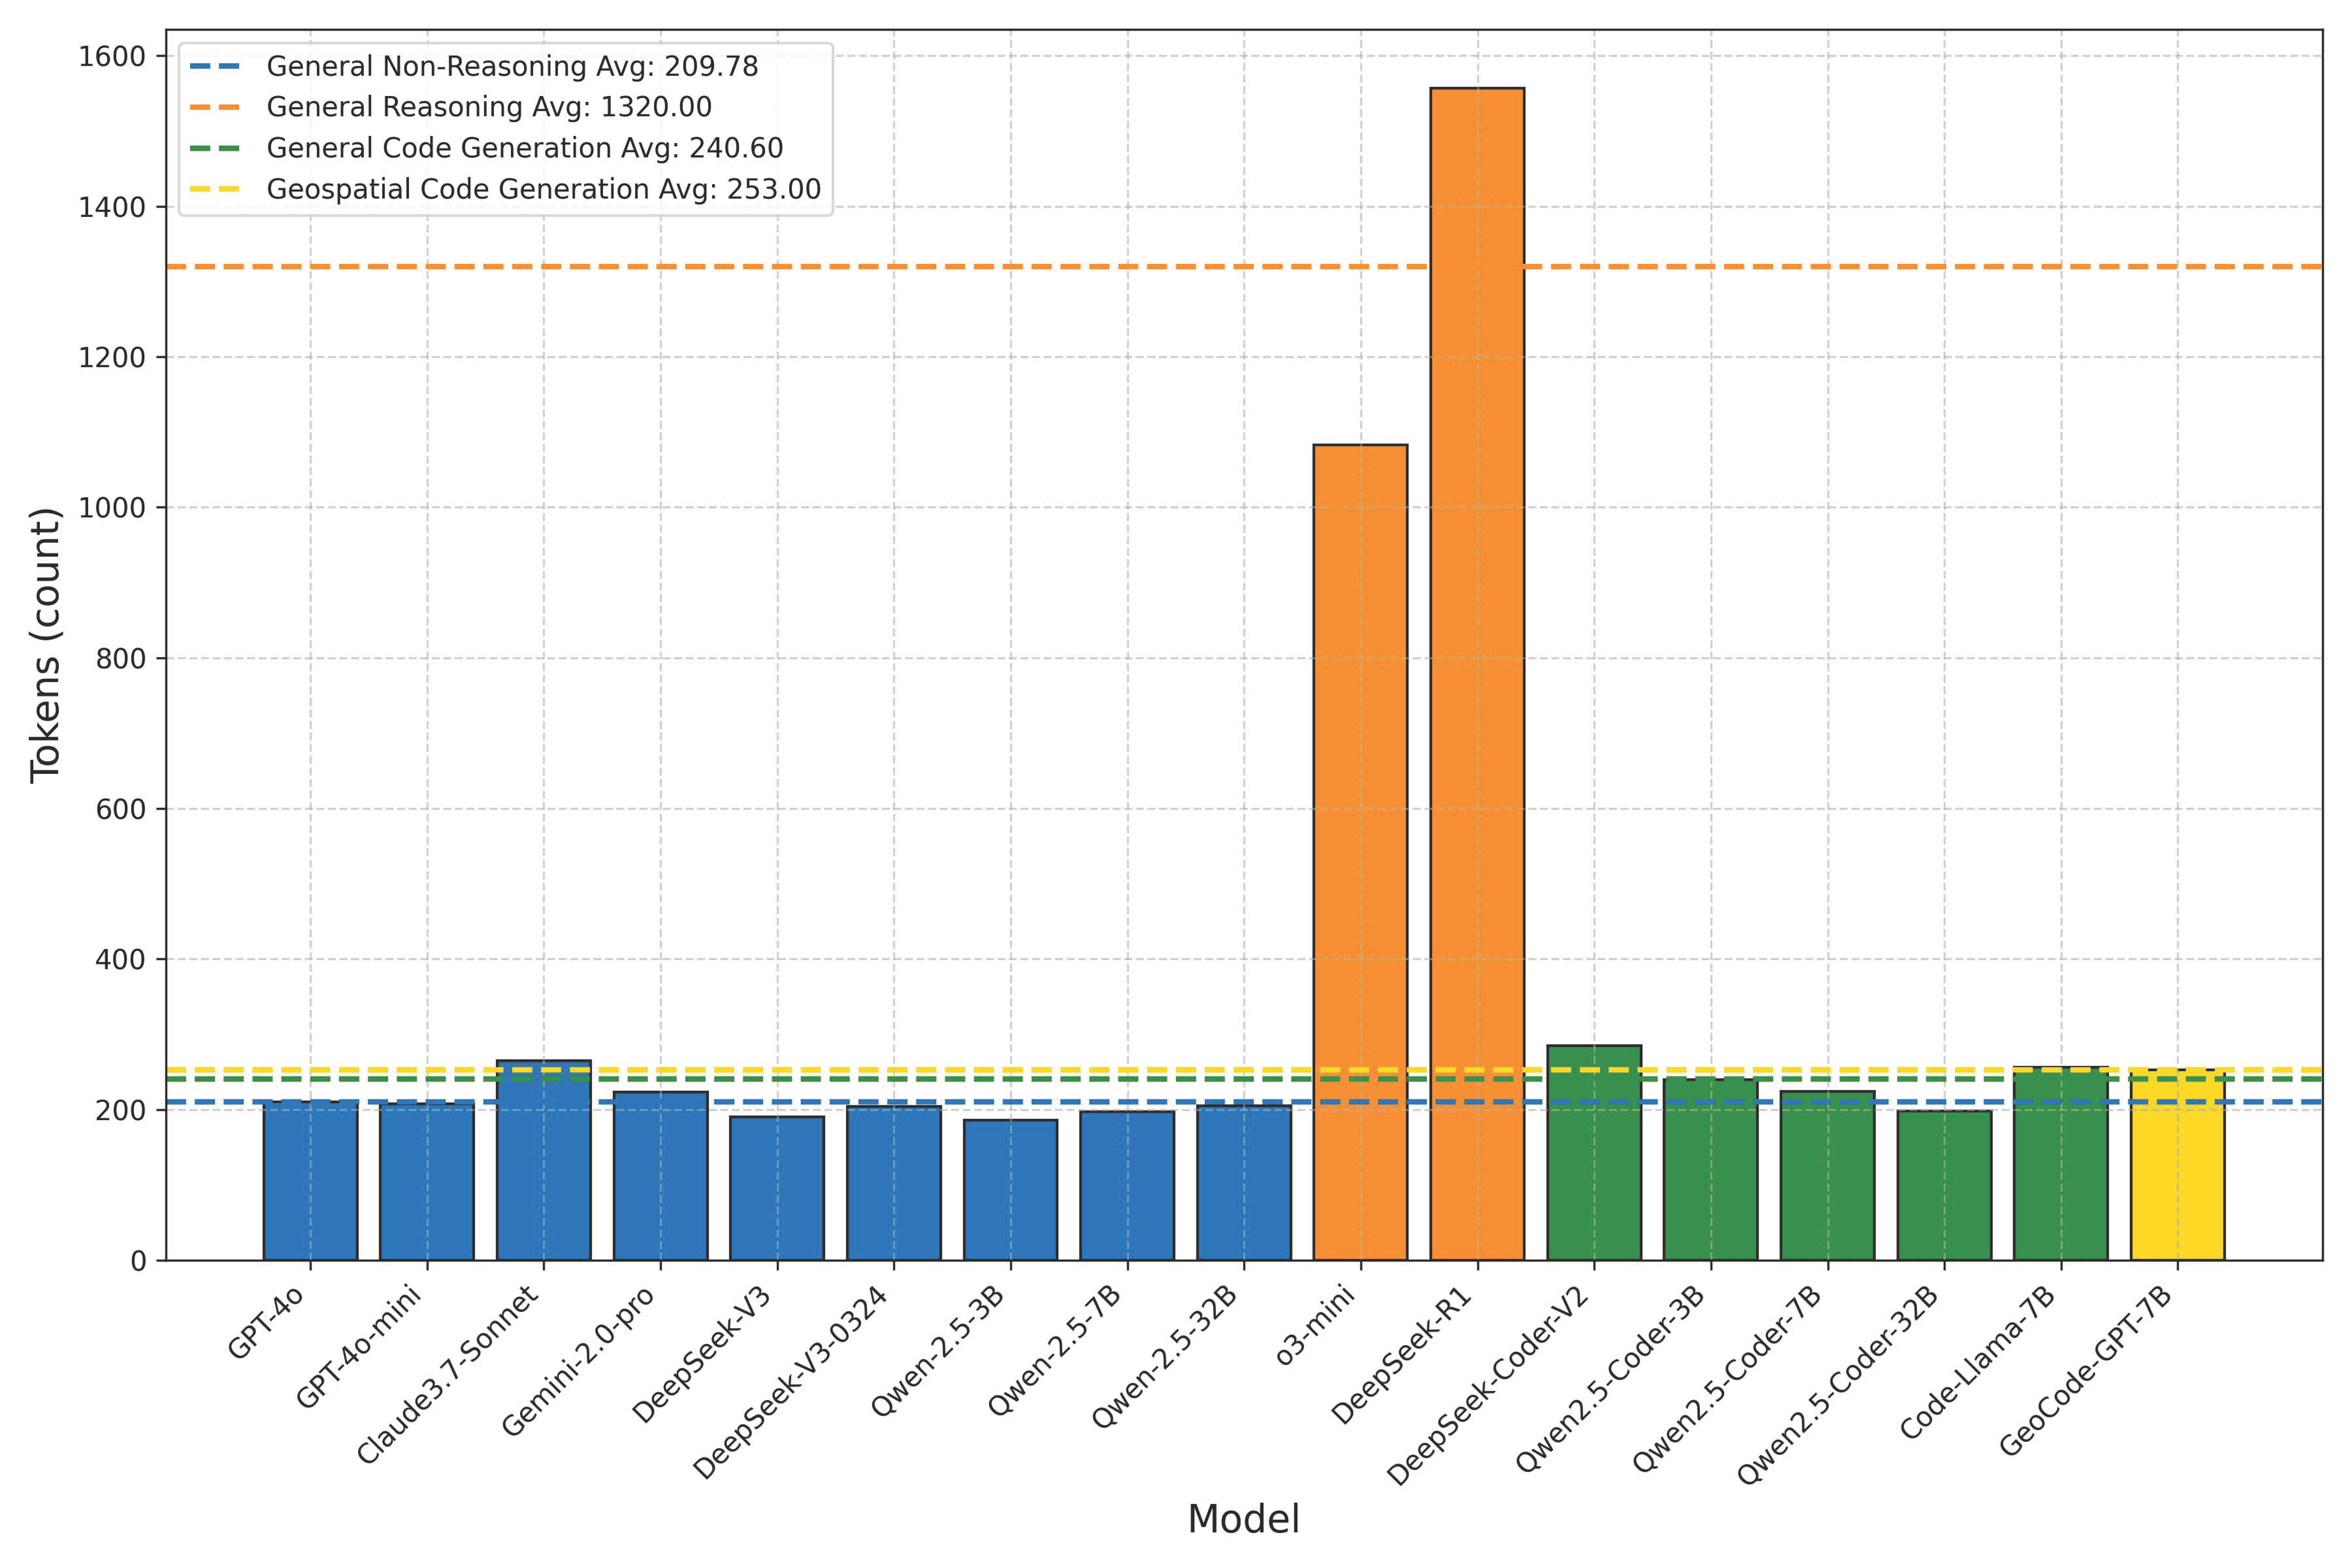
- Token Consumption (Tok.): Refers to the average number of tokens required to complete each unit test case. For locally deployed models, this metric reflects hardware resource usage; for commercial models, token consumption directly correlates with monetary cost. Most mainstream APIs charge based on the number of tokens processed (typically per 1 million tokens), and pricing varies significantly across models. As of April 2025, GPT-4 Turbo is priced at USD 10.00/1M tokens, Claude 3 Opus at USD 15.00/1M tokens, DeepSeek-Coder at USD 0.60/1M tokens, and Qwen2-72B at USD 0.80/1M tokens. Therefore, token usage is a critical indicator of both inference cost and model accessibility.
- Inference Time (In.T): Refers to the average response time (in seconds) required by the model to generate each test case. This metric reflects latency and response efficiency, both of which directly impact user experience.
- Code Lines (Co.L): Measures the number of core executable lines of code generated by the model, excluding comments, natural language explanations, and auxiliary prompts. Compared to token count, code line count provides a more accurate assessment of the model’s actual code generation capability, filtering out token inflation caused by unnecessary text in the reasoning process.
4.3.4. Operational Efficiency Metrics
- Inference Efficiency (In.T-E): Inference efficiency refers to the average accuracy achieved by a model per unit time, calculated as the ratio of accuracy to average inference time (in seconds). This metric evaluates the model’s ability to balance response speed and output quality. The shorter the inference time, the higher the accuracy achieved per unit time, indicating a more efficient utilization of computational resources and better interactive performance.
- Token Efficiency (Tok.-E): Token efficiency measures the accuracy achieved per unit of token consumption, calculated as the ratio of accuracy to the average number of tokens used. This metric reflects the economic efficiency of the generation process and effectively supports cross-model comparisons in terms of cost–performance.
- Code Line Efficiency (Co.L-E): Code line efficiency refers to the accuracy achieved per line of core executable code, emphasizing the structural compactness and effectiveness of the generated logic. Unlike tokens, code lines exclude natural language explanations and prompt-related content, offering a more direct reflection of the model’s ability to produce high-quality, executable code for geospatial tasks. This metric is of particular value to developers, especially when evaluating code generation efficiency in practical engineering deployments.
4.3.5. Rank
4.3.6. Error Type
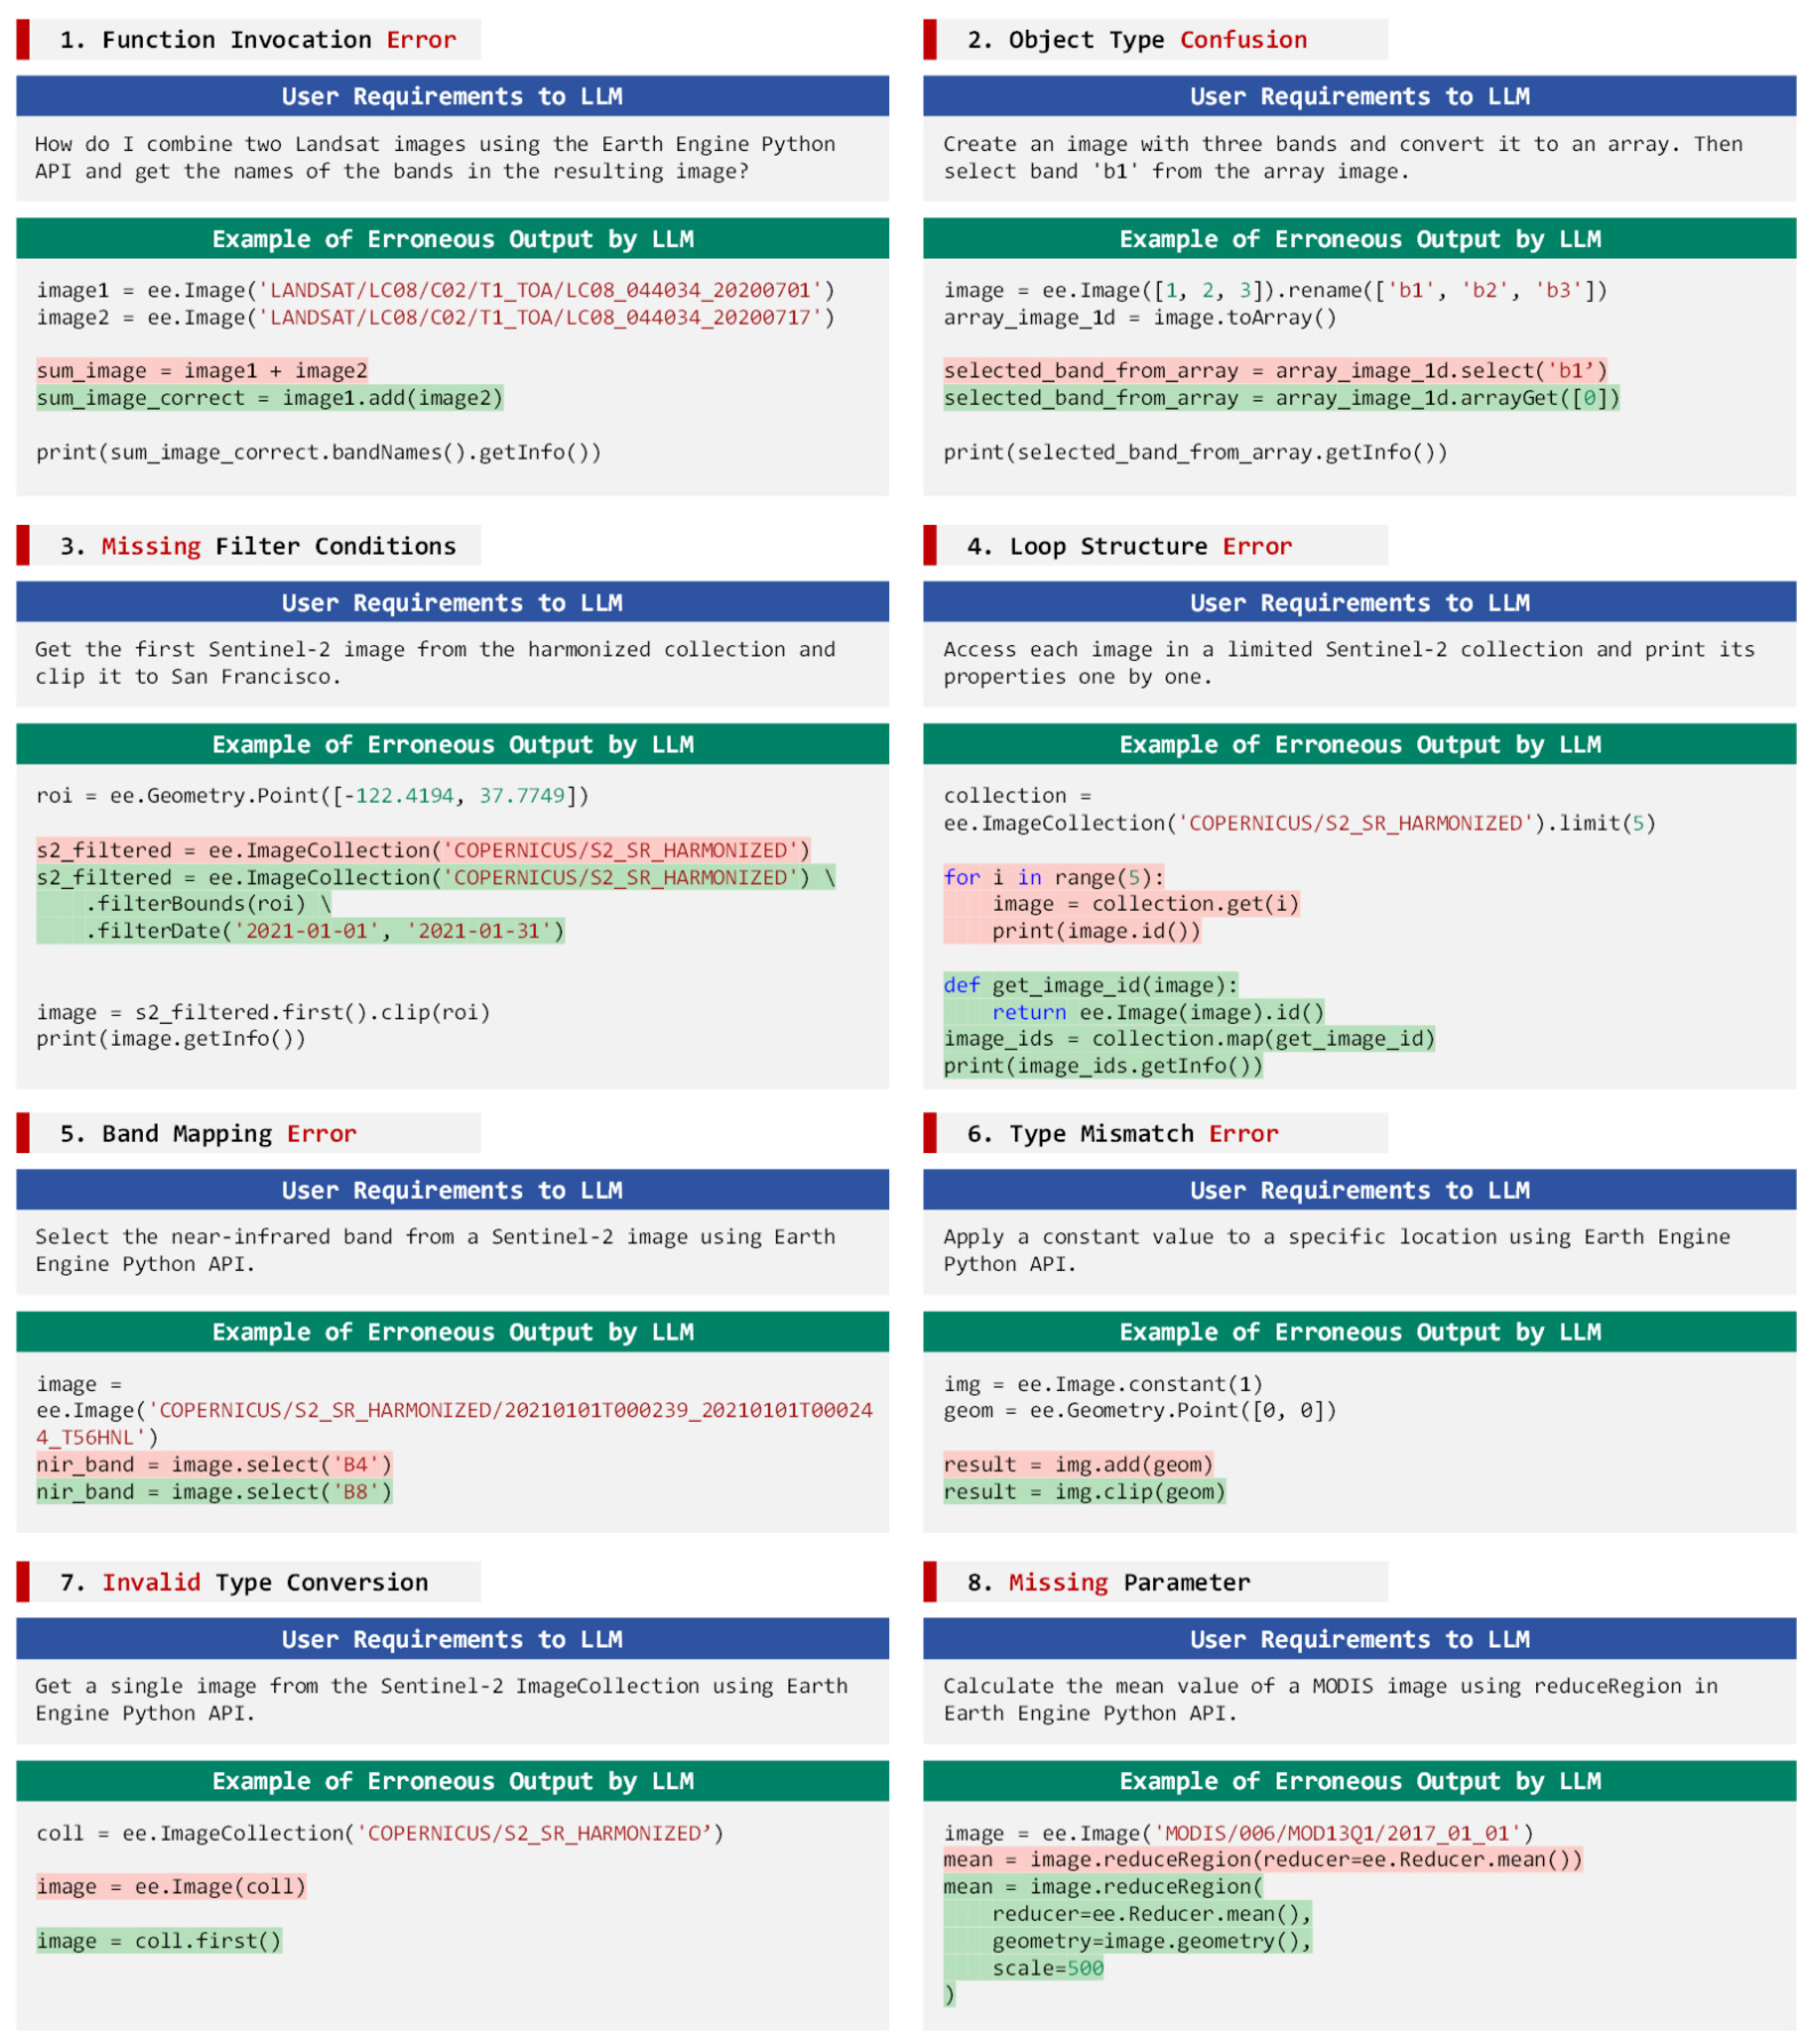
- Syntax Errors: These refer to issues in the syntactic structure of the code that prevent successful compilation, such as missing parentheses, misspellings, or missing module imports. Such errors are typically flagged in the GEE console as ‘SyntaxError’.
- Parameter Errors: These occur when the code is syntactically correct but fails to execute due to incorrect or missing parameters. Parameters often involve references to built-in datasets, band names, or other domain-specific knowledge in geosciences. Common error messages include phrases like “xxx has no attribute xx”, “xxx not found”, or prompts indicating missing required arguments. These errors often arise during parameter concatenation or variable assignment.
- Invalid Answers: These refer to cases where the code executes successfully, but the output is inconsistent with the expected answer or the returned data type does not match the predefined specification.
- Runtime Errors: Timeouts often result from infinite loops or large datasets, causing the computation to exceed 180 s and be terminated by the testing framework. These errors are usually due to logical flaws, such as incorrect conditionals or abnormal loops. On the GEE platform, they are displayed as “timeout 180 s”.
- Network Errors: These occur when the GEE system returns an Internal Server Error, persisting after three retries under stable network conditions. Such errors are caused by Google server rate limits or backend timeouts, not by model code syntax or logic. On the GEE platform, these are displayed as HTTP 500 errors, while client errors are shown as HTTP 400 codes.
5. Results
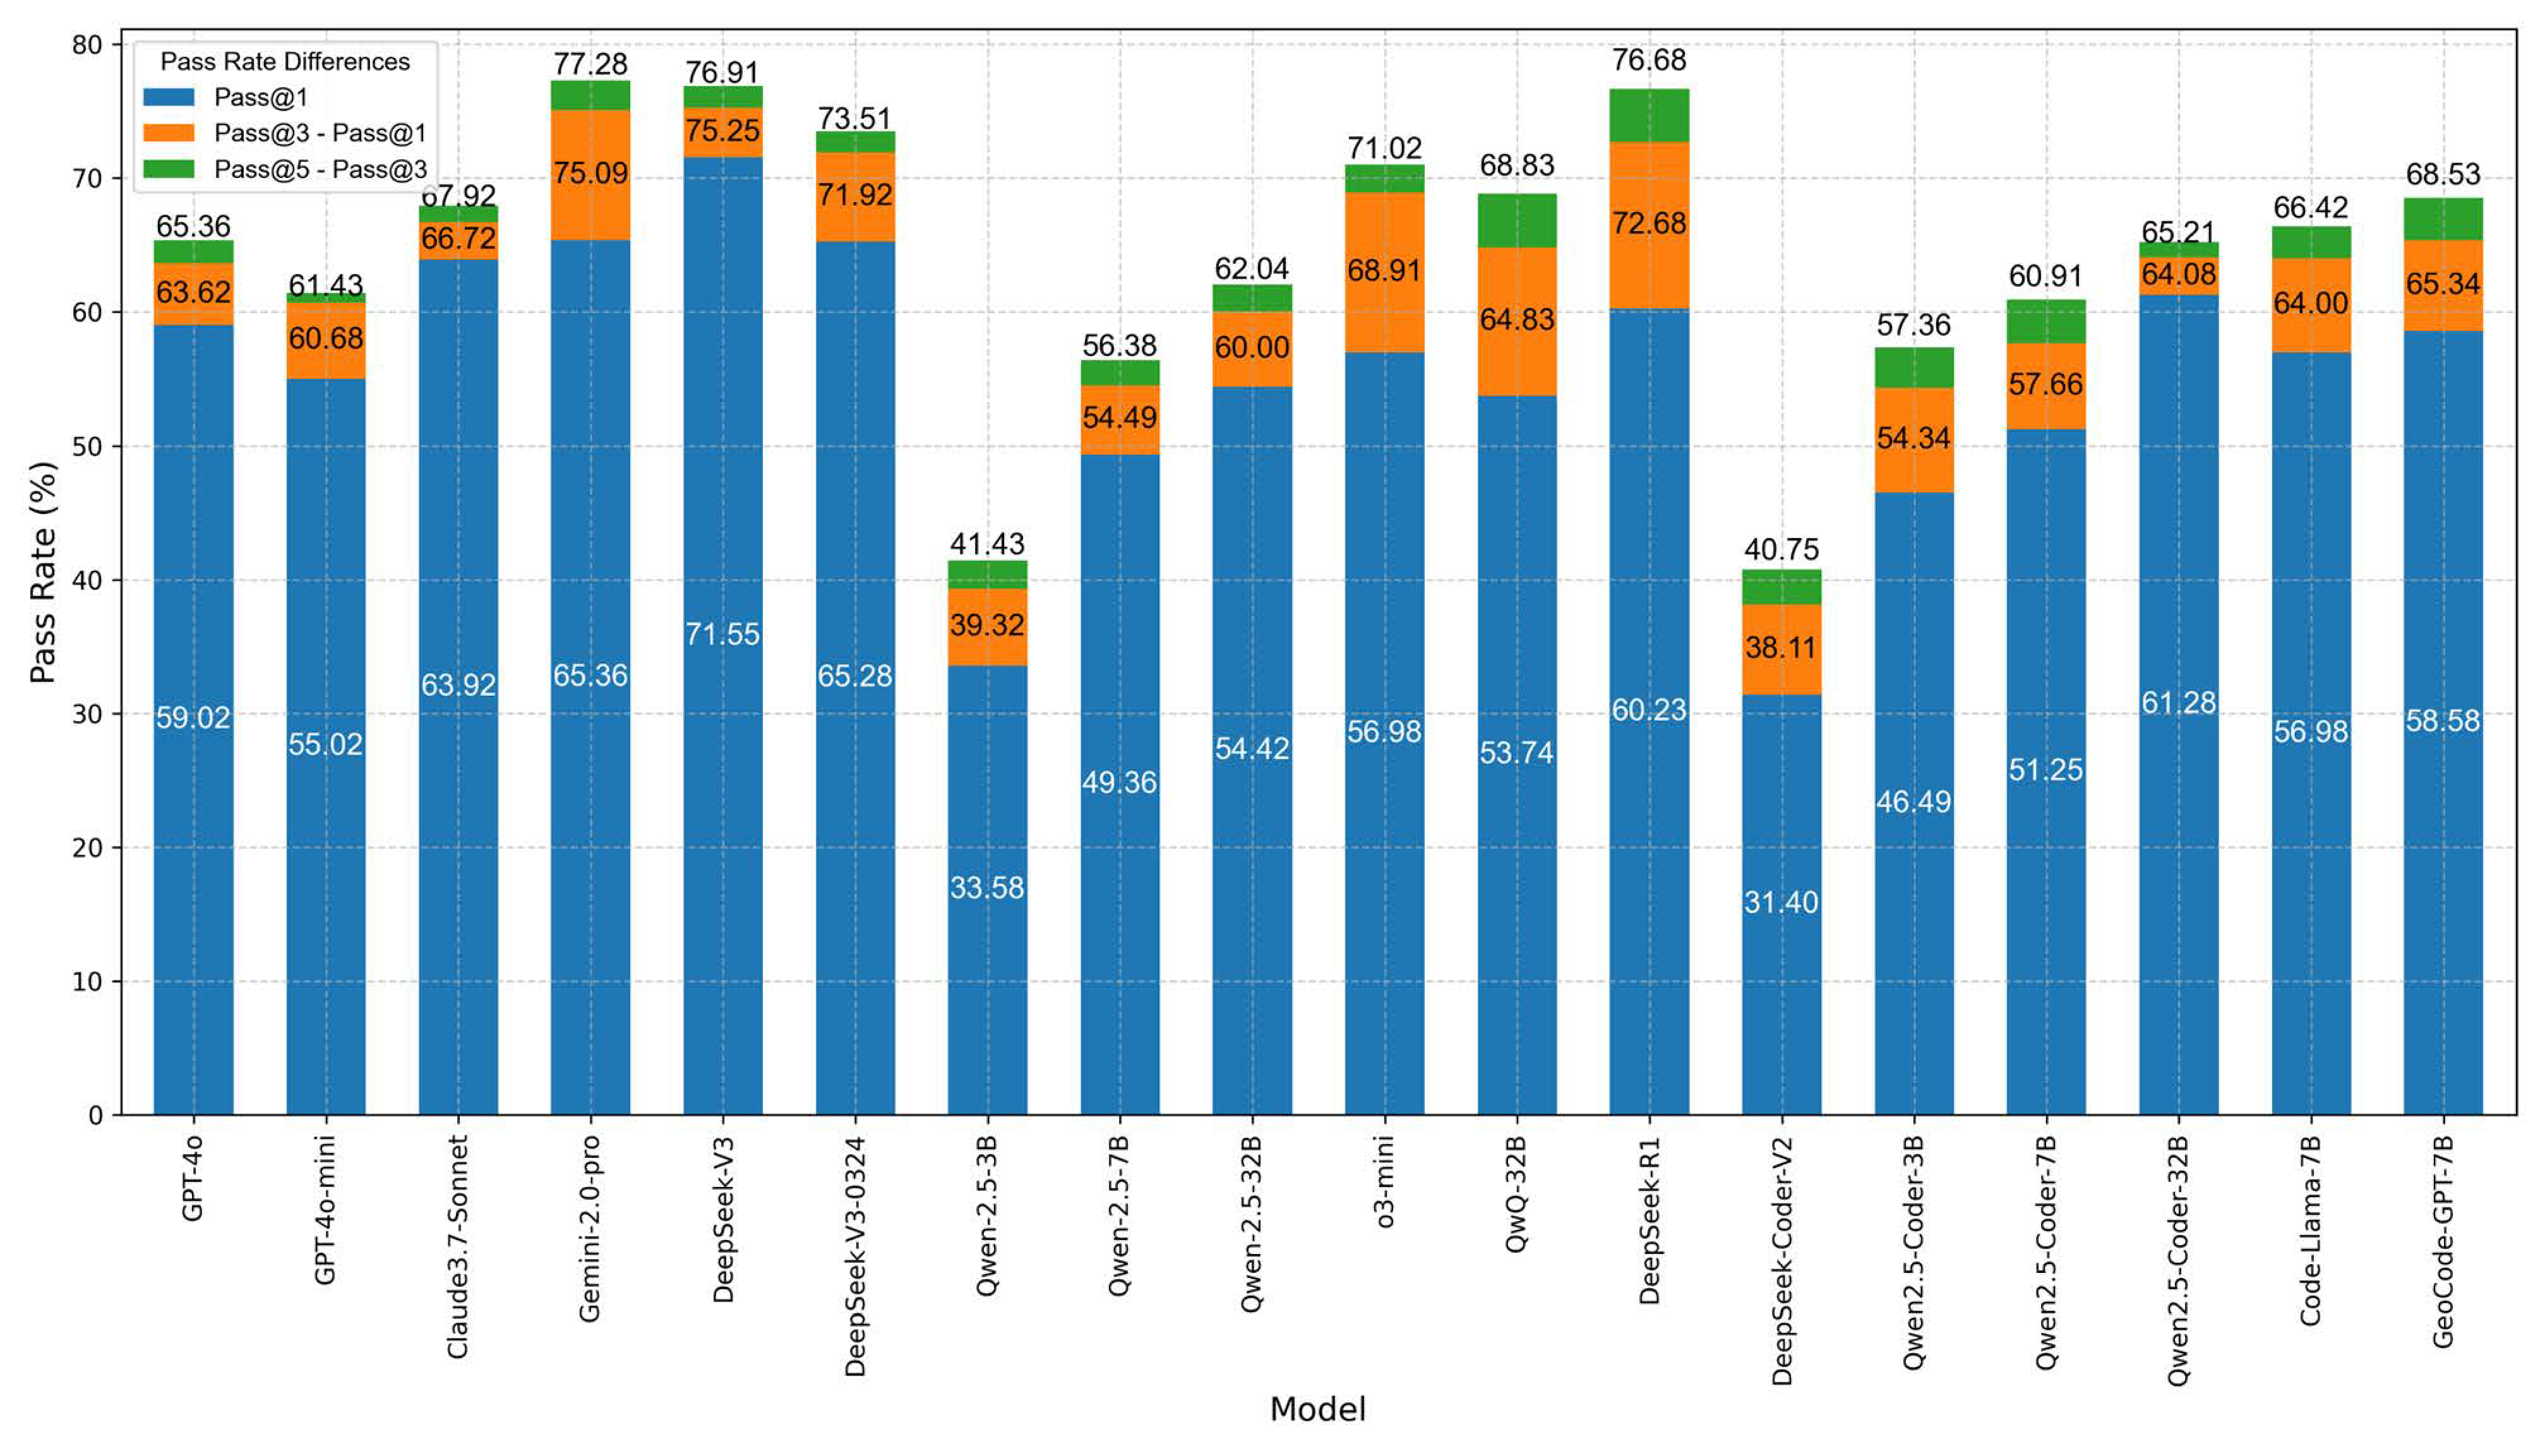
5.1. Accuracy
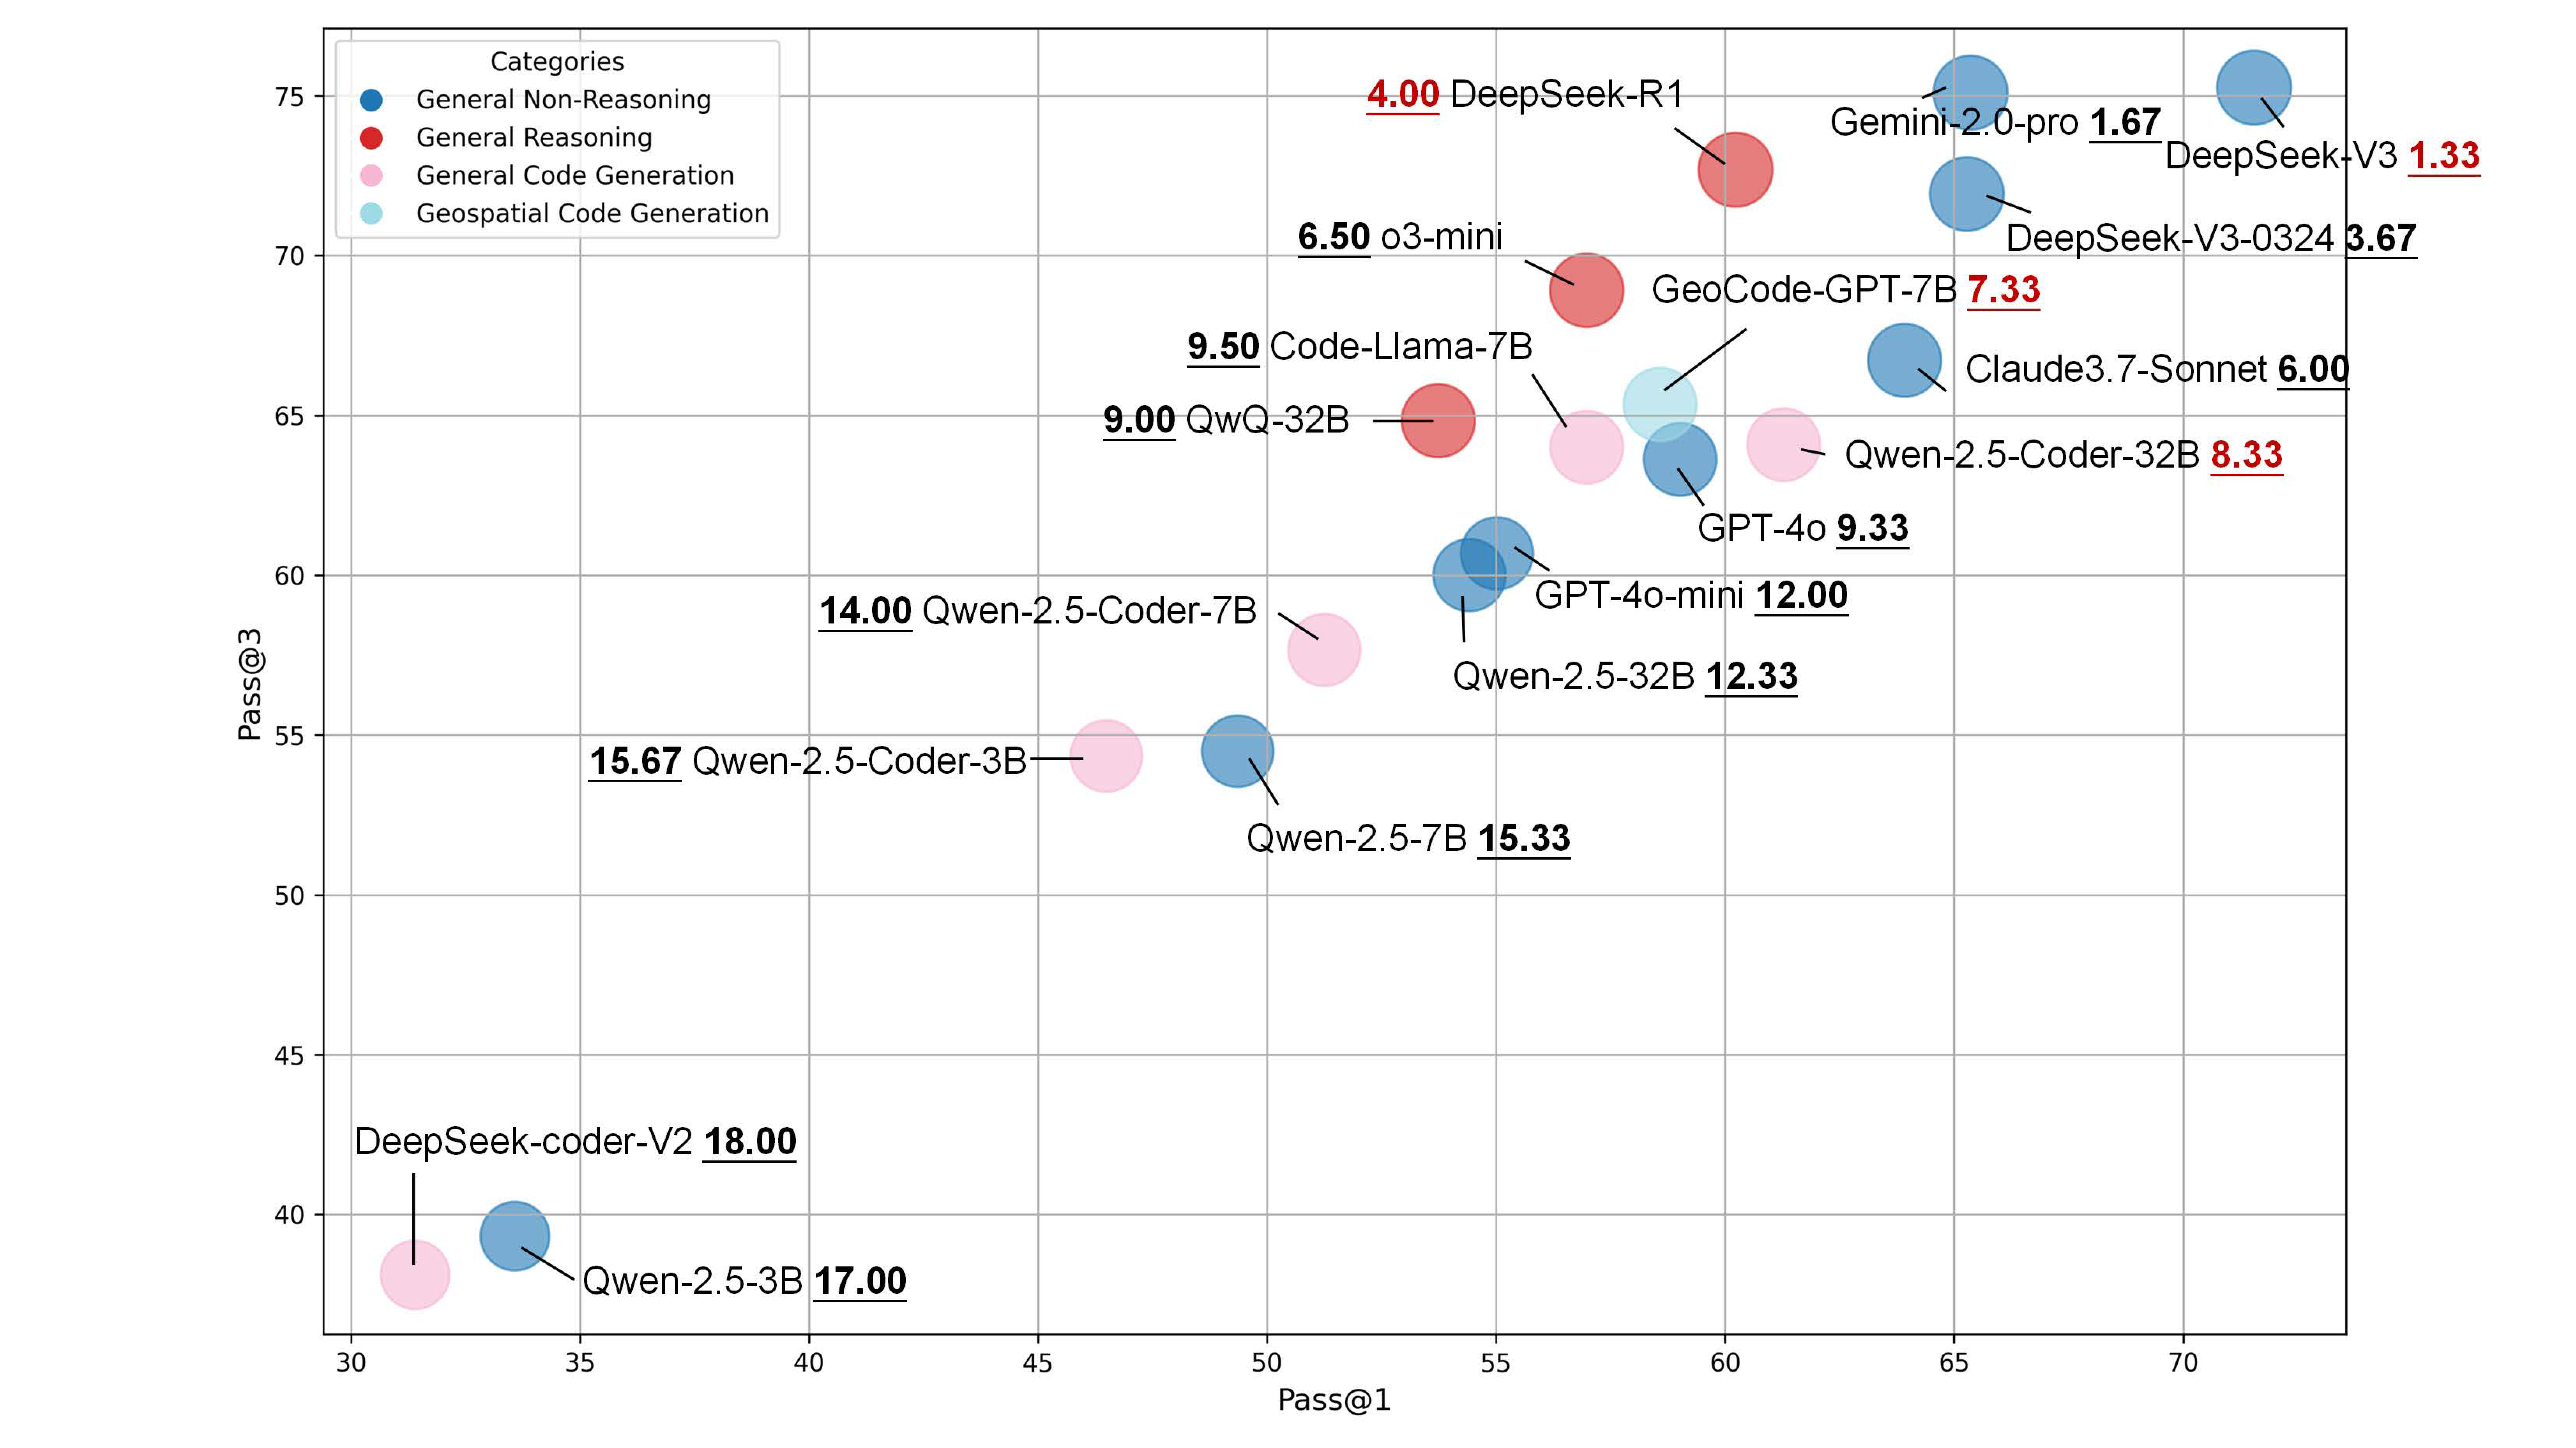
- Model performance ranking: The dark blue bubbles, representing general-purpose non-reasoning models, generally occupy higher ranks, outperforming the red general-purpose reasoning models and pink general-purpose code generation models. The light blue bubble representing the geospatial code generation model GeoCode-GPT is positioned in the upper-middle tier, with an average rank of 7.33 among the 18 evaluated models.
- Performance variation within the DeepSeek family: DeepSeek-V3 (average rank 1.33), DeepSeek-V3-0324 (average rank 3.67), and DeepSeek-R1 (average rank 4.00) all rank among the top-performing models, demonstrating strong performance. However, DeepSeek-Coder-V2 performs poorly, ranking last (average rank 18.00), indicating that it lacks sufficient capability for GEE code generation tasks.
- Inconsistent performance across model versions: Surprisingly, DeepSeek-V3-0324, an optimized version of DeepSeek-V3, performs worse in GEE code generation, suggesting that later updates may not have specifically targeted improvements in this domain, potentially leading to performance degradation.
- Performance of different parameter versions within the same model: Significant differences are observed across parameter configurations of the same model. For instance, Qwen-2.5-Coder-32B (average rank 8.33) outperforms its 7B (rank 14.00) and 3B (rank 15.67) variants. Similarly, within the Qwen-2.5 family, the 32B version (rank 12.33) ranks notably higher than the 7B (rank 15.33) and 3B (rank 17.00) versions. In addition, GPT-4o (rank 9.33) also outperforms GPT-4o-mini (rank 12.00).
- Performance gain of GeoCode-GPT-7B: GeoCode-GPT-7B (average rank 7.33) outperforms its base model Code-Llama-7B (rank 9.50), indicating effective fine-tuning for GEE code generation tasks. However, the improvement is modest, possibly due to GeoCode-GPT’s training covering a broad range of geospatial code types (e.g., ARCPY, GDAL), thus diluting its specialization in the GEE-specific domain.
- Category-wise performance analysis: Among the categories, the best-performing general-purpose non-reasoning LLM is DeepSeek-V3 (rank 1.33), the top general-purpose reasoning model is DeepSeek-R1 (rank 4.00), and the best general-purpose code generation model is Qwen-2.5-Coder-32B (rank 8.33).
- Underwhelming performance of the GPT series: The GPT series shows relatively weak performance. Specifically, GPT-4o (rank 9.33) and GPT-4o-mini (rank 12.00) are both outperformed by models from the DeepSeek, Claude, and Gemini families, as well as by GeoCode-GPT-7B. Even the GPT-series reasoning model o3-mini only marginally surpasses GeoCode-GPT-7B by less than one rank.
5.2. Resource Consumption
5.3. Operational Efficiency
5.4. Error Type Logs
6. Discussion
7. Conclusions
7.1. Significance and Contributions
7.2. Limitations and Future Work
Author Contributions
Funding
Data Availability Statement
Conflicts of Interest
Appendix A
Appendix B
References
- Li, Y.; Choi, D.; Chung, J.; Kushman, N.; Schrittwieser, J.; Leblond, R.; Eccles, T.; Keeling, J.; Gimeno, F.; Dal Lago, A. Competition-level code generation with alphacode. Science 2022, 378, 1092–1097. [Google Scholar] [CrossRef] [PubMed]
- Popat, S.; Starkey, L. Learning to code or coding to learn? A systematic review. Comput. Educ. 2019, 128, 365–376. [Google Scholar] [CrossRef]
- Bonner, A.J.; Kifer, M. An overview of transaction logic. Theor. Comput. Sci. 1994, 133, 205–265. [Google Scholar] [CrossRef]
- Jiang, J.; Wang, F.; Shen, J.; Kim, S.; Kim, S. A survey on large language models for code generation. arXiv 2024, arXiv:2406.00515. [Google Scholar]
- Wang, J.; Chen, Y. A review on code generation with llms: Application and evaluation. In Proceedings of the 2023 IEEE International Conference on Medical Artificial Intelligence (MedAI), Beijing, China, 18–19 November 2023; pp. 284–289. [Google Scholar]
- Guo, D.; Zhu, Q.; Yang, D.; Xie, Z.; Dong, K.; Zhang, W.; Chen, G.; Bi, X.; Wu, Y.; Li, Y.K. DeepSeek-Coder: When the Large Language Model Meets Programming—The Rise of Code Intelligence. arXiv 2024, arXiv:2401.14196. [Google Scholar]
- Hui, B.; Yang, J.; Cui, Z.; Yang, J.; Liu, D.; Zhang, L.; Liu, T.; Zhang, J.; Yu, B.; Lu, K. Qwen2. 5-coder technical report. arXiv 2024, arXiv:2409.12186. [Google Scholar]
- Roziere, B.; Gehring, J.; Gloeckle, F.; Sootla, S.; Gat, I.; Tan, X.E.; Adi, Y.; Liu, J.; Sauvestre, R.; Remez, T. Code llama: Open foundation models for code. arXiv 2023, arXiv:2308.12950. [Google Scholar]
- Rahman, M.M.; Kundu, A. Code Hallucination. arXiv 2024, arXiv:2407.04831. [Google Scholar]
- Li, D.; Murr, L. HumanEval on Latest GPT Models—2024. arXiv 2024, arXiv:2402.14852. [Google Scholar]
- Yu, Z.; Zhao, Y.; Cohan, A.; Zhang, X.-P. HumanEval Pro and MBPP Pro: Evaluating Large Language Models on Self-invoking Code Generation. arXiv 2024, arXiv:2412.21199. [Google Scholar]
- Jain, N.; Han, K.; Gu, A.; Li, W.-D.; Yan, F.; Zhang, T.; Wang, S.; Solar-Lezama, A.; Sen, K.; Stoica, I. Livecodebench: Holistic and contamination free evaluation of large language models for code. arXiv 2024, arXiv:2403.07974. [Google Scholar]
- Evtikhiev, M.; Bogomolov, E.; Sokolov, Y.; Bryksin, T. Out of the bleu: How should we assess quality of the code generation models? J. Syst. Softw. 2023, 203, 111741. [Google Scholar] [CrossRef]
- Liu, J.; Xie, S.; Wang, J.; Wei, Y.; Ding, Y.; Zhang, L. Evaluating language models for efficient code generation. arXiv 2024, arXiv:2408.06450. [Google Scholar]
- Zhou, S.; Alon, U.; Agarwal, S.; Neubig, G. Codebertscore: Evaluating code generation with pretrained models of code. arXiv 2023, arXiv:2302.05527. [Google Scholar]
- Capolupo, A.; Monterisi, C.; Caporusso, G.; Tarantino, E. Extracting land cover data using GEE: A review of the classification indices. In Proceedings of the Computational Science and Its Applications—ICCSA 2020, Cagliari, Italy, 1–4 July 2020; pp. 782–796. [Google Scholar]
- Tamiminia, H.; Salehi, B.; Mahdianpari, M.; Quackenbush, L.; Adeli, S.; Brisco, B. Google Earth Engine for geo-big data applications: A meta-analysis and systematic review. ISPRS J. Photogramm. Remote Sens. 2020, 164, 152–170. [Google Scholar] [CrossRef]
- Ratti, C.; Wang, Y.; Ishii, H.; Piper, B.; Frenchman, D. Tangible User Interfaces (TUIs): A novel paradigm for GIS. Trans. GIS 2004, 8, 407–421. [Google Scholar] [CrossRef]
- Zhao, Q.; Yu, L.; Li, X.; Peng, D.; Zhang, Y.; Gong, P. Progress and trends in the application of Google Earth and Google Earth Engine. Remote Sens. 2021, 13, 3778. [Google Scholar] [CrossRef]
- Mutanga, O.; Kumar, L. Google earth engine applications. Remote Sens. 2019, 11, 591. [Google Scholar] [CrossRef]
- Hou, S.; Shen, Z.; Zhao, A.; Liang, J.; Gui, Z.; Guan, X.; Li, R.; Wu, H. GeoCode-GPT: A large language model for geospatial code generation. Int. J. Appl. Earth Obs. Geoinf. 2025, 104456. [Google Scholar] [CrossRef]
- Hou, S.; Liang, J.; Zhao, A.; Wu, H. GEE-OPs: An operator knowledge base for geospatial code generation on the Google Earth Engine platform powered by large language models. Geo-Spat. Inf. Sci. 2025, 1–22. [Google Scholar] [CrossRef]
- Yang, L.; Driscol, J.; Sarigai, S.; Wu, Q.; Chen, H.; Lippitt, C.D. Google Earth Engine and artificial intelligence (AI): A comprehensive review. Remote Sens. 2022, 14, 3253. [Google Scholar] [CrossRef]
- Hou, S.; Shen, Z.; Liang, J.; Zhao, A.; Gui, Z.; Li, R.; Wu, H. Can large language models generate geospatial code? arXiv 2024, arXiv:2410.09738. [Google Scholar]
- Gramacki, P.; Martins, B.; Szymański, P. Evaluation of Code LLMs on Geospatial Code Generation. arXiv 2024, arXiv:2410.04617. [Google Scholar]
- Hou, S.; Jiao, H.; Shen, Z.; Liang, J.; Zhao, A.; Zhang, X.; Wang, J.; Wu, H. Chain-of-Programming (CoP): Empowering Large Language Models for Geospatial Code Generation. arXiv 2024, arXiv:2411.10753. [Google Scholar] [CrossRef]
- Shuyang, H.; Anqi, Z.; Jianyuan, L.; Zhangxiao, S.; Huayi, W. Geo-FuB: A method for constructing an Operator-Function knowledge base for geospatial code generation with large language models. Knowl.-Based Syst. 2025, 319, 113624. [Google Scholar] [CrossRef]
- Hurst, A.; Lerer, A.; Goucher, A.P.; Perelman, A.; Ramesh, A.; Clark, A.; Ostrow, A.J.; Welihinda, A.; Hayes, A.; Radford, A. Gpt-4o system card. arXiv 2024, arXiv:2410.21276. [Google Scholar]
- Menick, J.; Lu, K.; Zhao, S.; Wallace, E.; Ren, H.; Hu, H.; Stathas, N.; Such, F.P. GPT-4o Mini: Advancing Cost-efficient Intelligence; Open AI: San Francisco, CA, USA, 2024. [Google Scholar]
- Anderson, I. Comparative Analysis Between Industrial Design Methodologies Versus the Scientific Method: AI: Claude 3.7 Sonnet. Preprints 2025. [Google Scholar]
- Team, G.R.; Abeyruwan, S.; Ainslie, J.; Alayrac, J.-B.; Arenas, M.G.; Armstrong, T.; Balakrishna, A.; Baruch, R.; Bauza, M.; Blokzijl, M. Gemini robotics: Bringing ai into the physical world. arXiv 2025, arXiv:2503.20020. [Google Scholar]
- Liu, A.; Feng, B.; Xue, B.; Wang, B.; Wu, B.; Lu, C.; Zhao, C.; Deng, C.; Zhang, C.; Ruan, C. Deepseek-v3 technical report. arXiv 2024, arXiv:2412.19437. [Google Scholar]
- Yang, A.; Yu, B.; Li, C.; Liu, D.; Huang, F.; Huang, H.; Jiang, J.; Tu, J.; Zhang, J.; Zhou, J. Qwen2. 5-1M Technical Report. arXiv 2025, arXiv:2501.15383. [Google Scholar]
- Arrieta, A.; Ugarte, M.; Valle, P.; Parejo, J.A.; Segura, S. o3-mini vs DeepSeek-R1: Which One is Safer? arXiv 2025, arXiv:2501.18438. [Google Scholar]
- Zheng, C.; Zhang, Z.; Zhang, B.; Lin, R.; Lu, K.; Yu, B.; Liu, D.; Zhou, J.; Lin, J. Processbench: Identifying process errors in mathematical reasoning. arXiv 2024, arXiv:2412.06559. [Google Scholar]
- Guo, D.; Yang, D.; Zhang, H.; Song, J.; Zhang, R.; Xu, R.; Zhu, Q.; Ma, S.; Wang, P.; Bi, X. Deepseek-r1: Incentivizing reasoning capability in llms via reinforcement learning. arXiv 2025, arXiv:2501.12948. [Google Scholar]
- Zhu, Q.; Guo, D.; Shao, Z.; Yang, D.; Wang, P.; Xu, R.; Wu, Y.; Li, Y.; Gao, H.; Ma, S. Deepseek-coder-v2: Breaking the barrier of closed-source models in code intelligence. arXiv 2024, arXiv:2406.11931. [Google Scholar]
- Chen, M.; Tworek, J.; Jun, H.; Yuan, Q.; Pinto, H.P.D.O.; Kaplan, J.; Edwards, H.; Burda, Y.; Joseph, N.; Brockman, G. Evaluating large language models trained on code. arXiv 2021, arXiv:2107.03374. [Google Scholar]
- Zhao, H.; Gallo, O.; Frosio, I.; Kautz, J. Loss functions for image restoration with neural networks. IEEE Trans. Comput. Imaging 2016, 3, 47–57. [Google Scholar] [CrossRef]
- Wang, Z.; Bovik, A.C.; Sheikh, H.R.; Simoncelli, E.P. Image quality assessment: From error visibility to structural similarity. IEEE Trans. Image Process. 2004, 13, 600–612. [Google Scholar] [CrossRef]
- Wang, Z.; Wu, G.; Sheikh, H.R.; Simoncelli, E.P.; Yang, E.-H.; Bovik, A.C. Quality-aware images. IEEE Trans. Image Process. 2006, 15, 1680–1689. [Google Scholar] [CrossRef]


| Output_Type | Description | Count | Percentage |
|---|---|---|---|
| ee.Array | Multi-dimensional array for numbers and pixels | 118 | 8.91% |
| ee.ArrayImage | Image constructed from multidimensional arrays | 30 | 2.26% |
| ee.Blob | Binary large object storage (e.g., files/models) | 1 | 0.08% |
| ee.BOOL | Boolean logic value (True/False) | 38 | 2.87% |
| ee.Classifier | Machine learning classifier object | 12 | 0.91% |
| ee.Clusterer | Clustering algorithm processor | 6 | 0.45% |
| ee.ConfusionMatrix | Confusion matrix of classification results | 4 | 0.30% |
| ee.Date | Date and time format data | 9 | 0.68% |
| ee.DateRange | Object representing a range of dates | 5 | 0.38% |
| ee.Dictionary | Key-value data structure | 63 | 4.75% |
| ee.Element | Fundamental unit of a geographic feature | 3 | 0.23% |
| ee.ErrorMargin | Statistical object for error margins | 1 | 0.08% |
| ee.Feature | Single feature with properties and shape | 21 | 1.58% |
| ee.FeatureCollection | Collection of geographic features | 41 | 3.09% |
| ee.Filter | Object representing data filtering conditions | 37 | 2.79% |
| ee.Geometry | Geometric shapes (point, line, polygon, etc.) | 146 | 11.02% |
| ee.Image | Single raster image data | 224 | 16.91% |
| ee.ImageCollection | Collection of image data objects | 17 | 1.28% |
| ee.Join | Method for joining datasets | 6 | 0.45% |
| ee.Kernel | Convolution kernel for spatial analysis | 22 | 1.66% |
| ee.List | Ordered list data structure | 68 | 5.13% |
| ee.Number | Numeric data | 194 | 14.64% |
| ee.PixelType | Pixel type definition | 10 | 0.75% |
| ee.Projection | Coordinate system projection information | 15 | 1.13% |
| ee.Reducer | Aggregation and reduction functions | 60 | 4.53% |
| ee.String | String-type data | 174 | 13.13% |
| Overall | Total | 1325 | 100.00% |
| GEE Data Type | Value Representation | Testing Logic |
|---|---|---|
| ee.Array | Small-scale array | Use getInfo to convert to a NumPy array and compare each element with expected_answer. |
| ee.ConfusionMatrix | ||
| ee.ArrayImage | ||
| ee.Image | Large-scale array | Download the image as a NumPy array and perform pixel-wise comparison; for large images, apply center sampling with a tolerance of 0.001. Merge all images into one and evaluate as a single image. |
| ee.ImageCollection | ||
| ee.List | List | Convert to a Python list via getInfo and compare each element. |
| ee.String | String | Convert to a Python string via getInfo and compare directly. Boolean values are also treated as strings. |
| ee.BOOL | ||
| ee.Number | Floating-point number | Convert to a Python float via getInfo and compare with the answer. |
| ee.Dictionary | All dictionary keys | Convert to a Python dictionary via getInfo and compare key-value pairs. |
| ee.Blob | ||
| ee.Reducer | ||
| ee.Filter | ||
| ee.Classifier | ||
| ee.Clusterer | ||
| ee.Pixeltype | ||
| ee.Join | ||
| ee.Kernel | ||
| ee.ErrorMargin | ||
| ee.Element | ||
| ee.Projection | ||
| ee.Date | Dictionary ‘value’ field | Use getInfo to obtain a dictionary, extract the ‘value’ field (timestamp in milliseconds) and compare numerically. |
| ee.DateRange | ||
| ee.Geometry | GeoJSON | Convert to GeoJSON using getInfo and compare geometric consistency with Shapely; for Features, extract geometry before comparison. |
| ee.Feature | ||
| ee.FeatureCollection |
| Model Type | Model Name | Developer | Size | Year |
|---|---|---|---|---|
| General Non-Reasoning | GPT-4o [28] | OpenAI | N/A | 2024 |
| GPT-4o-mini [29] | OpenAI | N/A | 2024 | |
| Claude3.7-Sonnet [30] | Anthropic | N/A | 2025 | |
| Gemini-2.0-pro [31] | N/A | 2025 | ||
| DeepSeek-V3 [32] | DeepSeek | 671B | 2024 | |
| DeepSeek-V3-0324 [32] | DeepSeek | 685B | 2025 | |
| Qwen-2.5 [33] | Alibaba | 3B, 7B, 32B | 2024 | |
| General Reasoning | o3-mini [34] | OpenAI | N/A | 2025 |
| QwQ-32B [35] | Alibaba | 32B | 2025 | |
| DeepSeek-R1 [36] | DeepSeek | 671B | 2025 | |
| General Code Generation | DeepSeek-Coder-V2 [37] | DeepSeek | 16B | 2024 |
| Qwen2.5-Coder [7] | Alibaba | 3B, 7B, 32B | 2024 | |
| Code-Llama-7B [8] | Meta | 7B | 2023 | |
| Geospatial Code Generation | GeoCode-GPT-7B [21] | Wuhan University | 7B | 2024 |
| Stages | Time Spent (hours) |
|---|---|
| AutoGEEval-Bench Construction | 35 |
| Expert Manual Revision | 50 |
| Model Inference and Code Execution | 445 |
| Evaluation of Model Responses | 270 |
| Total (All Stages) | 800 |
| Model | pass@1 (%) | pass@3 (%) | pass@5 (%) | CV | SA |
|---|---|---|---|---|---|
| General Non-Reasoning | |||||
| GPT-4o | 59.02 | 63.62 (+4.60) | 65.36 (+1.74) | 0.097 | 59.58 |
| GPT-4o-mini | 55.02 | 60.68 (+4.66) | 61.43 (+0.75) | 0.104 | 55.63 |
| Claude3.7-Sonnet | 63.92 | 66.72 (+2.80) | 67.92 (+1.20) | 0.059 | 64.14 |
| Gemini-2.0-pro | 65.36 | 75.09 (+9.73) | 77.28 (+2.19) | 0.154 | 66.95 |
| DeepSeek-V3 | 71.55 | 75.25 (+3.70) | 76.91 (+1.66) | 0.070 | 71.90 |
| DeepSeek-V3-0324 | 65.28 | 71.92 (+6.64) | 73.51 (+1.59) | 0.112 | 66.11 |
| Qwen-2.5-3B | 33.58 | 39.32 (+5.74) | 41.43 (+2.11) | 0.189 | 34.83 |
| Qwen-2.5-7B | 49.36 | 54.49 (+5.13) | 56.38 (+1.89) | 0.125 | 50.14 |
| Qwen-2.5-32B | 54.42 | 60.00 (+5.58) | 62.04 (+2.04) | 0.123 | 55.25 |
| General Reasoning | |||||
| o3-mini | 56.98 | 68.91 (+11.93) | 71.02 (+2.11) | 0.198 | 59.30 |
| QwQ-32B | 53.74 | 64.83 (+9.09) | 68.83 (+4.00) | 0.219 | 56.45 |
| DeepSeek-R1 | 60.23 | 72.68 (+12.45) | 76.68 (+4.00) | 0.215 | 63.14 |
| General Code Generation | |||||
| DeepSeek-Coder-V2 | 31.40 | 38.11 (+6.71) | 40.75 (+2.64) | 0.229 | 33.14 |
| Qwen2.5-Coder-3B | 46.49 | 54.34 (+7.85) | 57.36 (+3.02) | 0.190 | 48.22 |
| Qwen2.5-Coder-7B | 51.25 | 57.66 (+6.41) | 60.91 (+3.25) | 0.159 | 52.57 |
| Qwen2.5-Coder-32B | 61.28 | 64.08 (+2.80) | 65.21 (+1.13) | 0.060 | 61.50 |
| Code-Llama-7B | 56.98 | 64.00 (+7.02) | 66.42 (+2.42) | 0.142 | 58.15 |
| Geospatial Code Generation | |||||
| GeoCode-GPT-7B | 58.58 | 65.34 (+6.76) | 68.53 (+3.19) | 0.145 | 59.84 |
| Category | Model | pass@5 | CV | SA | P_Rank | C_Rank | S_Rank |
|---|---|---|---|---|---|---|---|
| 1 | DeepSeek-V3 | 76.91 | 0.07 | 71.9 | 2 | 3 | 1 |
| 1 | Gemini-2.0-pro | 77.28 | 0.154 | 66.95 | 1 | 11 | 2 |
| 1 | DeepSeek-V3-0324 | 73.51 | 0.112 | 66.11 | 4 | 6 | 3 |
| 1 | Claude3.7-Sonnet | 67.92 | 0.059 | 64.14 | 8 | 1 | 4 |
| 2 | DeepSeek-R1 | 76.68 | 0.215 | 63.14 | 3 | 16 | 5 |
| 3 | Qwen2.5-Coder-32B | 65.21 | 0.06 | 61.5 | 11 | 2 | 6 |
| 4 | GeoCode-GPT-7B | 68.53 | 0.145 | 59.84 | 7 | 10 | 7 |
| 1 | GPT-4o | 65.36 | 0.097 | 59.58 | 10 | 4 | 8 |
| 2 | o3-mini | 71.02 | 0.198 | 59.3 | 5 | 15 | 9 |
| 3 | Code-Llama-7B | 66.42 | 0.142 | 58.15 | 9 | 9 | 10 |
| 2 | QwQ-32B | 68.83 | 0.219 | 56.45 | 6 | 17 | 11 |
| 1 | GPT-4o-mini | 61.43 | 0.104 | 55.63 | 13 | 5 | 12 |
| 1 | Qwen-2.5-32B | 62.04 | 0.123 | 55.25 | 12 | 7 | 13 |
| 3 | Qwen2.5-Coder-7B | 60.91 | 0.159 | 52.57 | 14 | 12 | 14 |
| 1 | Qwen-2.5-7B | 56.38 | 0.125 | 50.14 | 16 | 8 | 15 |
| 3 | Qwen2.5-Coder-3B | 57.36 | 0.19 | 48.22 | 15 | 14 | 16 |
| 1 | Qwen-2.5-3B | 41.43 | 0.189 | 34.83 | 17 | 13 | 17 |
| 3 | DeepSeek-Coder-V2 | 40.75 | 0.229 | 33.14 | 18 | 18 | 18 |
| Model | Inference Method | Tok. (tokens) | In.T (s) | Co.L (lines) |
|---|---|---|---|---|
| General Non-Reasoning | ||||
| GPT-4o | API call | 210 | 3.31 | 7.77 |
| GPT-4o-mini | API call | 208 | 7.63 | 5.86 |
| Claude3.7-Sonnet | API call | 265 | 11.72 | 8.98 |
| Gemini-2.0-pro | API call | 223 | 24.55 | 5.2 |
| DeepSeek-V3 | API call | 190 | 8.87 | 4.86 |
| DeepSeek-V3-0324 | API call | 204 | 16.32 | 6.82 |
| Qwen-2.5-3B | Local deployment | 186 | 2.58 | 4.12 |
| Qwen-2.5-7B | Local deployment | 197 | 3.88 | 6.28 |
| Qwen-2.5-32B | API call | 205 | 5.63 | 6.6 |
| General Reasoning | ||||
| o3-mini | API call | 1083 | 7.40 | 6.93 |
| QwQ-32B | API call | N/A | 44.68 | 5.64 |
| DeepSeek-R1 | API call | 1557 | 78.30 | 5.32 |
| General Code Generation | ||||
| DeepSeek-Coder-V2 | Local deployment | 285 | 8.39 | 10.06 |
| Qwen2.5-Coder-3B | Local deployment | 240 | 2.51 | 9.11 |
| Qwen2.5-Coder-7B | Local deployment | 224 | 3.76 | 7.06 |
| Qwen2.5-Coder-32B | API call | 198 | 5.50 | 5.79 |
| Code-Llama-7B | Local deployment | 256 | 3.05 | 3.58 |
| Geospatial Code Generation | ||||
| GeoCode-GPT-7B | Local deployment | 253 | 4.05 | 11.79 |
| Model | Inference Method | Tok.-E | In.T-E | Co.L-E |
|---|---|---|---|---|
| General Non-Reasoning | ||||
| GPT-4o | API call | 0.311 | 19.746 | 7.77 |
| GPT-4o-mini | API call | 0.295 | 8.052 | 5.86 |
| Claude3.7-Sonnet | API call | 0.256 | 5.796 | 8.98 |
| Gemini-2.0-pro | API call | 0.347 | 3.148 | 5.2 |
| DeepSeek-V3 | API call | 0.405 | 8.670 | 4.86 |
| DeepSeek-V3-0324 | API call | 0.360 | 4.504 | 6.82 |
| Qwen-2.5-3B | Local deployment | 0.223 | 16.060 | 4.12 |
| Qwen-2.5-7B | Local deployment | 0.286 | 14.530 | 6.28 |
| Qwen-2.5-32B | API call | 0.303 | 11.019 | 6.6 |
| General Reasoning | ||||
| o3-mini | API call | 0.066 | 9.597 | 6.93 |
| QwQ-32B | API call | N/A | 1.541 | 5.64 |
| DeepSeek-R1 | API call | 0.049 | 0.979 | 5.32 |
| General Code Generation | ||||
| DeepSeek-Coder-V2 | Local deployment | 0.143 | 8.39 | 10.06 |
| Qwen2.5-Coder-3B | Local deployment | 0.239 | 2.51 | 9.11 |
| Qwen2.5-Coder-7B | Local deployment | 0.272 | 3.76 | 7.06 |
| Qwen2.5-Coder-32B | API call | 0.329 | 5.50 | 5.79 |
| Code-Llama-7B | Local deployment | 0.259 | 3.05 | 3.58 |
| Geospatial Code Generation | ||||
| GeoCode-GPT-7B | Local deployment | 0.271 | 4.05 | 11.79 |
| Category | Model | T_Rank | I_Rank | Co_Rank | E_Rank | S_Rank | P_Rank | Total_Rank |
|---|---|---|---|---|---|---|---|---|
| 1 | DeepSeek-V3 | 1 | 11 | 2 | 1 | 1 | 2 | 1 |
| 1 | Gemini-2.0-pro | 3 | 16 | 3 | 4 | 2 | 1 | 2 |
| 1 | DeepSeek-V3-0324 | 2 | 15 | 7 | 6 | 3 | 4 | 3 |
| 3 | Code-Llama-7B | 11 | 2 | 1 | 1 | 10 | 9 | 4 |
| 3 | Qwen2.5-Coder-32B | 4 | 8 | 6 | 3 | 6 | 11 | 4 |
| 1 | GPT-4o | 5 | 3 | 14 | 5 | 8 | 10 | 6 |
| 2 | DeepSeek-R1 | 17 | 18 | 4 | 15 | 5 | 3 | 6 |
| 4 | GeoCode-GPT-7B | 10 | 4 | 17 | 13 | 7 | 7 | 8 |
| 2 | o3-mini | 16 | 10 | 9 | 14 | 9 | 5 | 9 |
| 1 | Claude3.7-Sonnet | 12 | 13 | 15 | 17 | 4 | 8 | 10 |
| 1 | Qwen-2.5-32B | 6 | 9 | 11 | 7 | 13 | 12 | 11 |
| 1 | GPT-4o-mini | 7 | 12 | 8 | 8 | 12 | 13 | 12 |
| 2 | QwQ-32B | 18 | 17 | 5 | 16 | 11 | 6 | 12 |
| 3 | Qwen2.5-Coder-7B | 9 | 5 | 13 | 9 | 14 | 14 | 14 |
| 1 | Qwen-2.5-7B | 8 | 7 | 12 | 10 | 15 | 16 | 15 |
| 3 | Qwen2.5-Coder-3B | 13 | 1 | 16 | 11 | 16 | 15 | 16 |
| 1 | Qwen-2.5-3B | 14 | 6 | 10 | 12 | 17 | 17 | 17 |
| 3 | DeepSeek-Coder-V2 | 15 | 14 | 18 | 18 | 18 | 18 | 18 |
| Model | Parameter Error (%) | Invalid Answer (%) | Syntax Error (%) | Runtime Error (%) | Network Error (%) |
|---|---|---|---|---|---|
| General Non-Reasoning | |||||
| GPT-4o | 72.21 | 26.58 | 1.02 | 0.19 | 0.00 |
| GPT-4o-mini | 75.88 | 22.29 | 1.49 | 0.30 | 0.04 |
| Claude3.7-Sonnet | 65.81 | 31.92 | 1.76 | 0.22 | 0.29 |
| Gemini-2.0-pro | 55.71 | 37.15 | 7.01 | 0.02 | 0.11 |
| DeepSeek-V3 | 72.75 | 26.29 | 0.37 | 0.14 | 0.45 |
| DeepSeek-V3-0324 | 79.40 | 19.86 | 0.43 | 0.08 | 0.23 |
| Qwen-2.5-3B | 83.72 | 8.38 | 7.90 | 0.00 | 0.00 |
| Qwen-2.5-7B | 83.44 | 12.60 | 3.96 | 0.00 | 0.00 |
| Qwen-2.5-32B | 78.47 | 18.65 | 2.75 | 0.11 | 0.02 |
| General Reasoning | |||||
| o3-mini | 67.79 | 30.02 | 1.84 | 0.09 | 0.26 |
| QwQ-32B | 85.68 | 13.01 | 1.11 | 0.01 | 0.19 |
| DeepSeek-R1 | 85.04 | 14.62 | 0.19 | 0.00 | 0.15 |
| General Code Generation | |||||
| DeepSeek-Coder-V2 | 84.47 | 10.62 | 4.78 | 0.00 | 0.13 |
| Qwen2.5-Coder-3B | 75.26 | 12.54 | 12.20 | 0.00 | 0.00 |
| Qwen2.5-Coder-7B | 84.76 | 14.42 | 0.63 | 0.03 | 0.16 |
| Qwen2.5-Coder-32B | 79.19 | 19.96 | 0.43 | 0.19 | 0.23 |
| Code-Llama-7B | 80.01 | 18.47 | 1.37 | 0.01 | 0.14 |
| Geospatial Code Generation | |||||
| GeoCode-GPT-7B | 77.21 | 9.54 | 13.14 | 0.03 | 0.08 |
Disclaimer/Publisher’s Note: The statements, opinions and data contained in all publications are solely those of the individual author(s) and contributor(s) and not of MDPI and/or the editor(s). MDPI and/or the editor(s) disclaim responsibility for any injury to people or property resulting from any ideas, methods, instructions or products referred to in the content. |
© 2025 by the authors. Published by MDPI on behalf of the International Society for Photogrammetry and Remote Sensing. Licensee MDPI, Basel, Switzerland. This article is an open access article distributed under the terms and conditions of the Creative Commons Attribution (CC BY) license (https://creativecommons.org/licenses/by/4.0/).
Share and Cite
Wu, H.; Shen, Z.; Hou, S.; Liang, J.; Jiao, H.; Qing, Y.; Zhang, X.; Li, X.; Gui, Z.; Guan, X.; et al. AutoGEEval: A Multimodal and Automated Evaluation Framework for Geospatial Code Generation on GEE with Large Language Models. ISPRS Int. J. Geo-Inf. 2025, 14, 256. https://doi.org/10.3390/ijgi14070256
Wu H, Shen Z, Hou S, Liang J, Jiao H, Qing Y, Zhang X, Li X, Gui Z, Guan X, et al. AutoGEEval: A Multimodal and Automated Evaluation Framework for Geospatial Code Generation on GEE with Large Language Models. ISPRS International Journal of Geo-Information. 2025; 14(7):256. https://doi.org/10.3390/ijgi14070256
Chicago/Turabian StyleWu, Huayi, Zhangxiao Shen, Shuyang Hou, Jianyuan Liang, Haoyue Jiao, Yaxian Qing, Xiaopu Zhang, Xu Li, Zhipeng Gui, Xuefeng Guan, and et al. 2025. "AutoGEEval: A Multimodal and Automated Evaluation Framework for Geospatial Code Generation on GEE with Large Language Models" ISPRS International Journal of Geo-Information 14, no. 7: 256. https://doi.org/10.3390/ijgi14070256
APA StyleWu, H., Shen, Z., Hou, S., Liang, J., Jiao, H., Qing, Y., Zhang, X., Li, X., Gui, Z., Guan, X., & Xiang, L. (2025). AutoGEEval: A Multimodal and Automated Evaluation Framework for Geospatial Code Generation on GEE with Large Language Models. ISPRS International Journal of Geo-Information, 14(7), 256. https://doi.org/10.3390/ijgi14070256