Article

Representing the Spatiotemporal State Evolution of Geographic Entities as a Multi-Level Graph

School of Remote Sensing and Information Engineering, Wuhan University, No. 129 Luoyu Road, Wuhan 430079, China
*
Author to whom correspondence should be addressed.
ISPRS Int. J. Geo-Inf. 2025, 14(7), 252; https://doi.org/10.3390/ijgi14070252 (registering DOI)
Submission received: 28 April 2025 / Revised: 19 June 2025 / Accepted: 26 June 2025 / Published: 28 June 2025

Abstract

The geographic knowledge graph offers a structured framework for mining and discovering spatiotemporal knowledge, which is of great significance for understanding geographic dynamics. However, existing geographic knowledge graphs still encounter significant challenges in comprehensive expression of spatiotemporal elements and understanding the intricate relationships and dynamic evolution among geographic entities, space, and time. Therefore, a Spatiotemporal Evolution Hierarchical Representation Graph (STEHRG) is proposed, which consists of three layers: a spatiotemporal ontology layer, a spatiotemporal evolution layer, and a feature situation layer. The STEHRG characterizes the multidimensional state transitions of spatiotemporal entities across various scales and abstraction levels, enabling a comprehensive representation of geographic spatiotemporal evolution. Additionally, this paper introduces a graph data structure-based approach for managing the state features of spatiotemporal entities and their lifecycle dependencies. Finally, through comparative experiments with existing knowledge graphs (GeoKG, GEKG, and STOKG), the results indicate that the STEHRG has significant advantages in accuracy, completeness, and reproducibility.

1. Introduction

Geographic spatiotemporal data is a crucial source of information for building Digital Earth, serving as the foundation for spatial analysis and modeling. These data contain rich geographical knowledge, providing crucial support for a deeper understanding of geographical phenomena [1,2]. With the continuous development of collection technologies such as sensors and GIS, geographic data with spatiotemporal characteristics is showing geometric growth [3,4,5]. The rapid accumulation of geographic data has led to greater challenges in processing and interpretation [6,7]. Therefore, how to effectively use geographic spatiotemporal data to characterize and analyze spatiotemporal processes has become a current research focus, which is of great significance for understanding complex geographic phenomena and the intelligent application of spatiotemporal data [8,9,10].
Geospatial–temporal processes fundamentally represent the evolution of geographic entities over extended time scales. They involve highly complex and dynamic interactions among geographic entities, space, and time. For example, throughout its century-long development, Wuhan University’s name, campus location, and organizational structure have been comprehensively influenced by events such as relocation, reconstruction, and the merging of multiple campuses. It is challenging to accurately represent Wuhan University’s geospatial–temporal process. In recent years, knowledge graphs have received widespread attention due to their structured framework and semantic networks that can effectively convey complex relationships and patterns in spatiotemporal data [11,12]. Many researchers have introduced it into the field of geographic science to construct geographic knowledge graphs that express the hierarchical and attribute relationships of geographic entities. This approach enhances the ability to represent temporal information and provides new perspectives and innovative tools for the field [13]. However, for the representation of geographic spatiotemporal, geographic knowledge graph models mainly focus on characterizing static attributes and simple temporal relationships of entities, events, and other elements. These models overlook the interaction mechanisms between events and geographic entities, failing to adequately capture the dynamic impact of events on these entities. For example, heavy rainfall causes a rise in river water levels, which subsequently alters the river’s channel and morphology—such causal relationships are difficult to accurately represent in existing models. Furthermore, these models face two fundamental limitations: (1) they lack capability for continuous dynamic tracking of spatiotemporal features and (2) they fail to provide efficient solutions for redundant storage and query optimization of spatiotemporal attributes. These constraints collectively hinder comprehensive analysis of spatiotemporal evolutionary processes.
To address the aforementioned issues, this paper proposes a new Spatiotemporal Evolution Hierarchical Representation Graph (STEHRG). The STEHRG systematically describes the evolutionary process of geographic objects in time and space through a multi-level structure. The STEHRG consists of the following three layers: the spatiotemporal ontology layer, the spatiotemporal evolution layer, and the feature situation layer. The spatiotemporal ontology layer provides the semantic foundation by defining spatiotemporal entities, events, attributes, their relations, and the intrinsic characteristics of spatiotemporal features. The spatiotemporal evolution layer introduces the concept of a finite state machine (FSM) to represent the evolutionary process of entities and extends the event representation model to capture the relationships between events and entities, thereby providing a deeper insight into event characteristics and their interactions with entities. The feature situation layer is responsible for continuously tracking and capturing the dynamic evolution of spatiotemporal features. A feature evolution chain is designed to manage the lifecycle of entity spatiotemporal attributes and solve the problem of redundant retrieval of spatiotemporal attributes. Finally, the proposed model is applied to the spatiotemporal evolution data of Wuhan University (WHU), the Nanjing Presidential Palace Attraction (NJPPA), as well as large-scale spatiotemporal data of vessels. The performance of the STEHRG is compared with similar models such as the geographic knowledge representation model (GeoKG) [14,15], the geographic evolutionary knowledge graph (GEKG) [16], and the spatiotemporal object knowledge graph (STOKG) [17]. Experimental results, evaluated using metrics including completeness, accuracy, and redundancy, demonstrate that the proposed model outperforms existing models in both structural design and knowledge representation capabilities.
The remainder of this paper is organized as follows: Section 2 reviews the relevant technologies of graph knowledge and analyzes the limitations of existing studies. Section 3 explains the fundamental concepts and structure of the STEHRG. Section 4, Section 5 and Section 6 present the experimental findings through three cases. Section 6 also discusses and analyzes the experimental results, and Section 7 concludes the paper.

2. Related Work and Problem Analysis

2.1. Related Work

In recent years, many studies have attempted to construct spatiotemporal knowledge graphs to express the spatiotemporal evolutionary relationships between geographic entities and events. They can be divided into two categories: temporal knowledge graphs and event graphs.
(1) Temporal knowledge graph. It focuses on adding timestamps or time intervals to annotate entities and state changes in the knowledge graph. When time dependency exists, the state and characteristics of entities at various times can be easily determined [18]. For example, Tanon et al. [19] developed the Yet Another Great Ontology (YAGO) model, which incorporates a temporal dimension into entity attributes by adding start and end times to indicate the validity of those attributes within a specific time range. However, the YAGO model has limitations in addressing complex temporal interactions and characterizing entity changes, providing only basic temporal information. Related organizations [20,21] developed a semantic knowledge base DBpedia based on Wikipedia, which captures relevant information about objects at specific times, tracks changes in knowledge over time, analyzes dynamic changes and development trends [22]. The geographic knowledge representation model (GeoKG) by Zhang et al. [14] comprises the following six interrelated components: location, time, attributes, state, change, and relationship. By incorporating specific temporal information and the overall characteristics of different states, the model effectively captures the states of geographic entities at various times and their temporal changes [15]. He et al. [23] proposed a geo-scene knowledge representation framework for expressing the representation and intrinsic relationships of geographic scenes. Mao et al. [24] proposed a spatiotemporal process-based conceptual model of urban waterlogging emergency ontology and explored the construction of its knowledge graph through key technologies like knowledge extraction, fusion, and storage. Zhu et al. [25] proposed a GKG adaptive representation model that considers complex spatiotemporal features and relationships. This model adaptively represents geological knowledge based on the spatiotemporal correlation of different types of geological knowledge under the constraint of a unified spatiotemporal ontology. The spatiotemporal knowledge graph is effective for recording and describing the temporal correlation in between and simple spatiotemporal information about geographic entities. However, it has certain limitations in capturing changes in entities and their causal relationships, which limits in-depth research on geographic spatiotemporal processes [17].
(2) Event graph. Events are important knowledge in the real world [26]. Events influence the spatiotemporal changes in some geographical objects, in addition to indicating changes in the objects’ spatiotemporal characteristics [27]. Accordingly, academicians and research organizations have started to consider event elements in the creation of spatiotemporal knowledge graphs. They propose the graphs with additional depth and dimensions to better capture the causal and dependent relationships, as well as the dynamic changes in geographic entities over time [28]. For example, regarding the spatiotemporal evolution of geology and geographic entities, Zheng et al. [16] proposed a Geographic Evolutionary Knowledge Graph (GEKG) consisting of time, geographic entities, geographic attributes, geographic events, and geographic activities. GEKG expresses events by recording the participants of the event. It focuses on describing the long-term evolutionary process of geological entities and events in a spatiotemporal context. Zhao et al. [17] proposed the spatiotemporal object knowledge graph (STOKG), consisting of an object concept layer, a spatiotemporal object layer, and a dynamic version layer. STOKG records events as components of geographic entities. STOKG understands the dynamic evolution of spatiotemporal objects from both geographical and semantic perspectives. Wang et al. [29] designed an event data model based on spatiotemporal entities, that supports multidimensional, multi-level, and all-round expression and analysis of events from the perspectives of individual participants, groups, and macro perspectives. Han et al. [30] proposed a grid-enhanced geographic knowledge graph (AugGKG), which achieves complex multi-objective spatiotemporal queries by discretizing and normalizing spatiotemporal data. The AugGKG only records the attribute information of events in the knowledge graph, such as location and time information.

2.2. Problem Analysis

Due to the complexity of spatiotemporal evolution and the simplifications in existing models, geographic knowledge graphs perform inadequately in complex geographic spatiotemporal processes [31,32,33]. There remain several problems:
(1) The geospatial–temporal process refers to the long-term evolution of geographic entities and their associated events. Existing models enhance spatiotemporal representation by improving the characterization of temporal progression and enriching the related elements of events within this process. However, the relationships between events and entities are complex, involving diverse interaction patterns and causal links. Current models’ event representations fail to fully capture the effects events have on entities. For example, in the case of Wuhan University’s relocation, the change in address reflects the impact of the relocation event on entity attributes. Yet, when querying the “relocation event” based on the GEKG model, only the involved entities and event timing are retrievable, without information about how the event affected the entity’s specific attributes. This highlights that existing models still require improvement in representing the complex evolutionary processes of spatiotemporal entities.
(2) Existing knowledge graphs achieve phased representation of spatiotemporal information by storing the states of entities at different time points. However, during period queries, these models often result in spatiotemporal features of the same entity appearing repeatedly across multiple snapshots. For example, when querying the historical names of Beijing over the past 500 years, the model will retrieve all status nodes of Beijing during that period through time queries and return all name attributes corresponding to each status. This redundancy not only increases system overhead but also imposes cognitive burdens on users. The root cause of this issue lies in the model’s lack of continuous tracking of the evolution of spatiotemporal features and temporal management, making it difficult to effectively avoid repeated retrieval of spatiotemporal attributes.

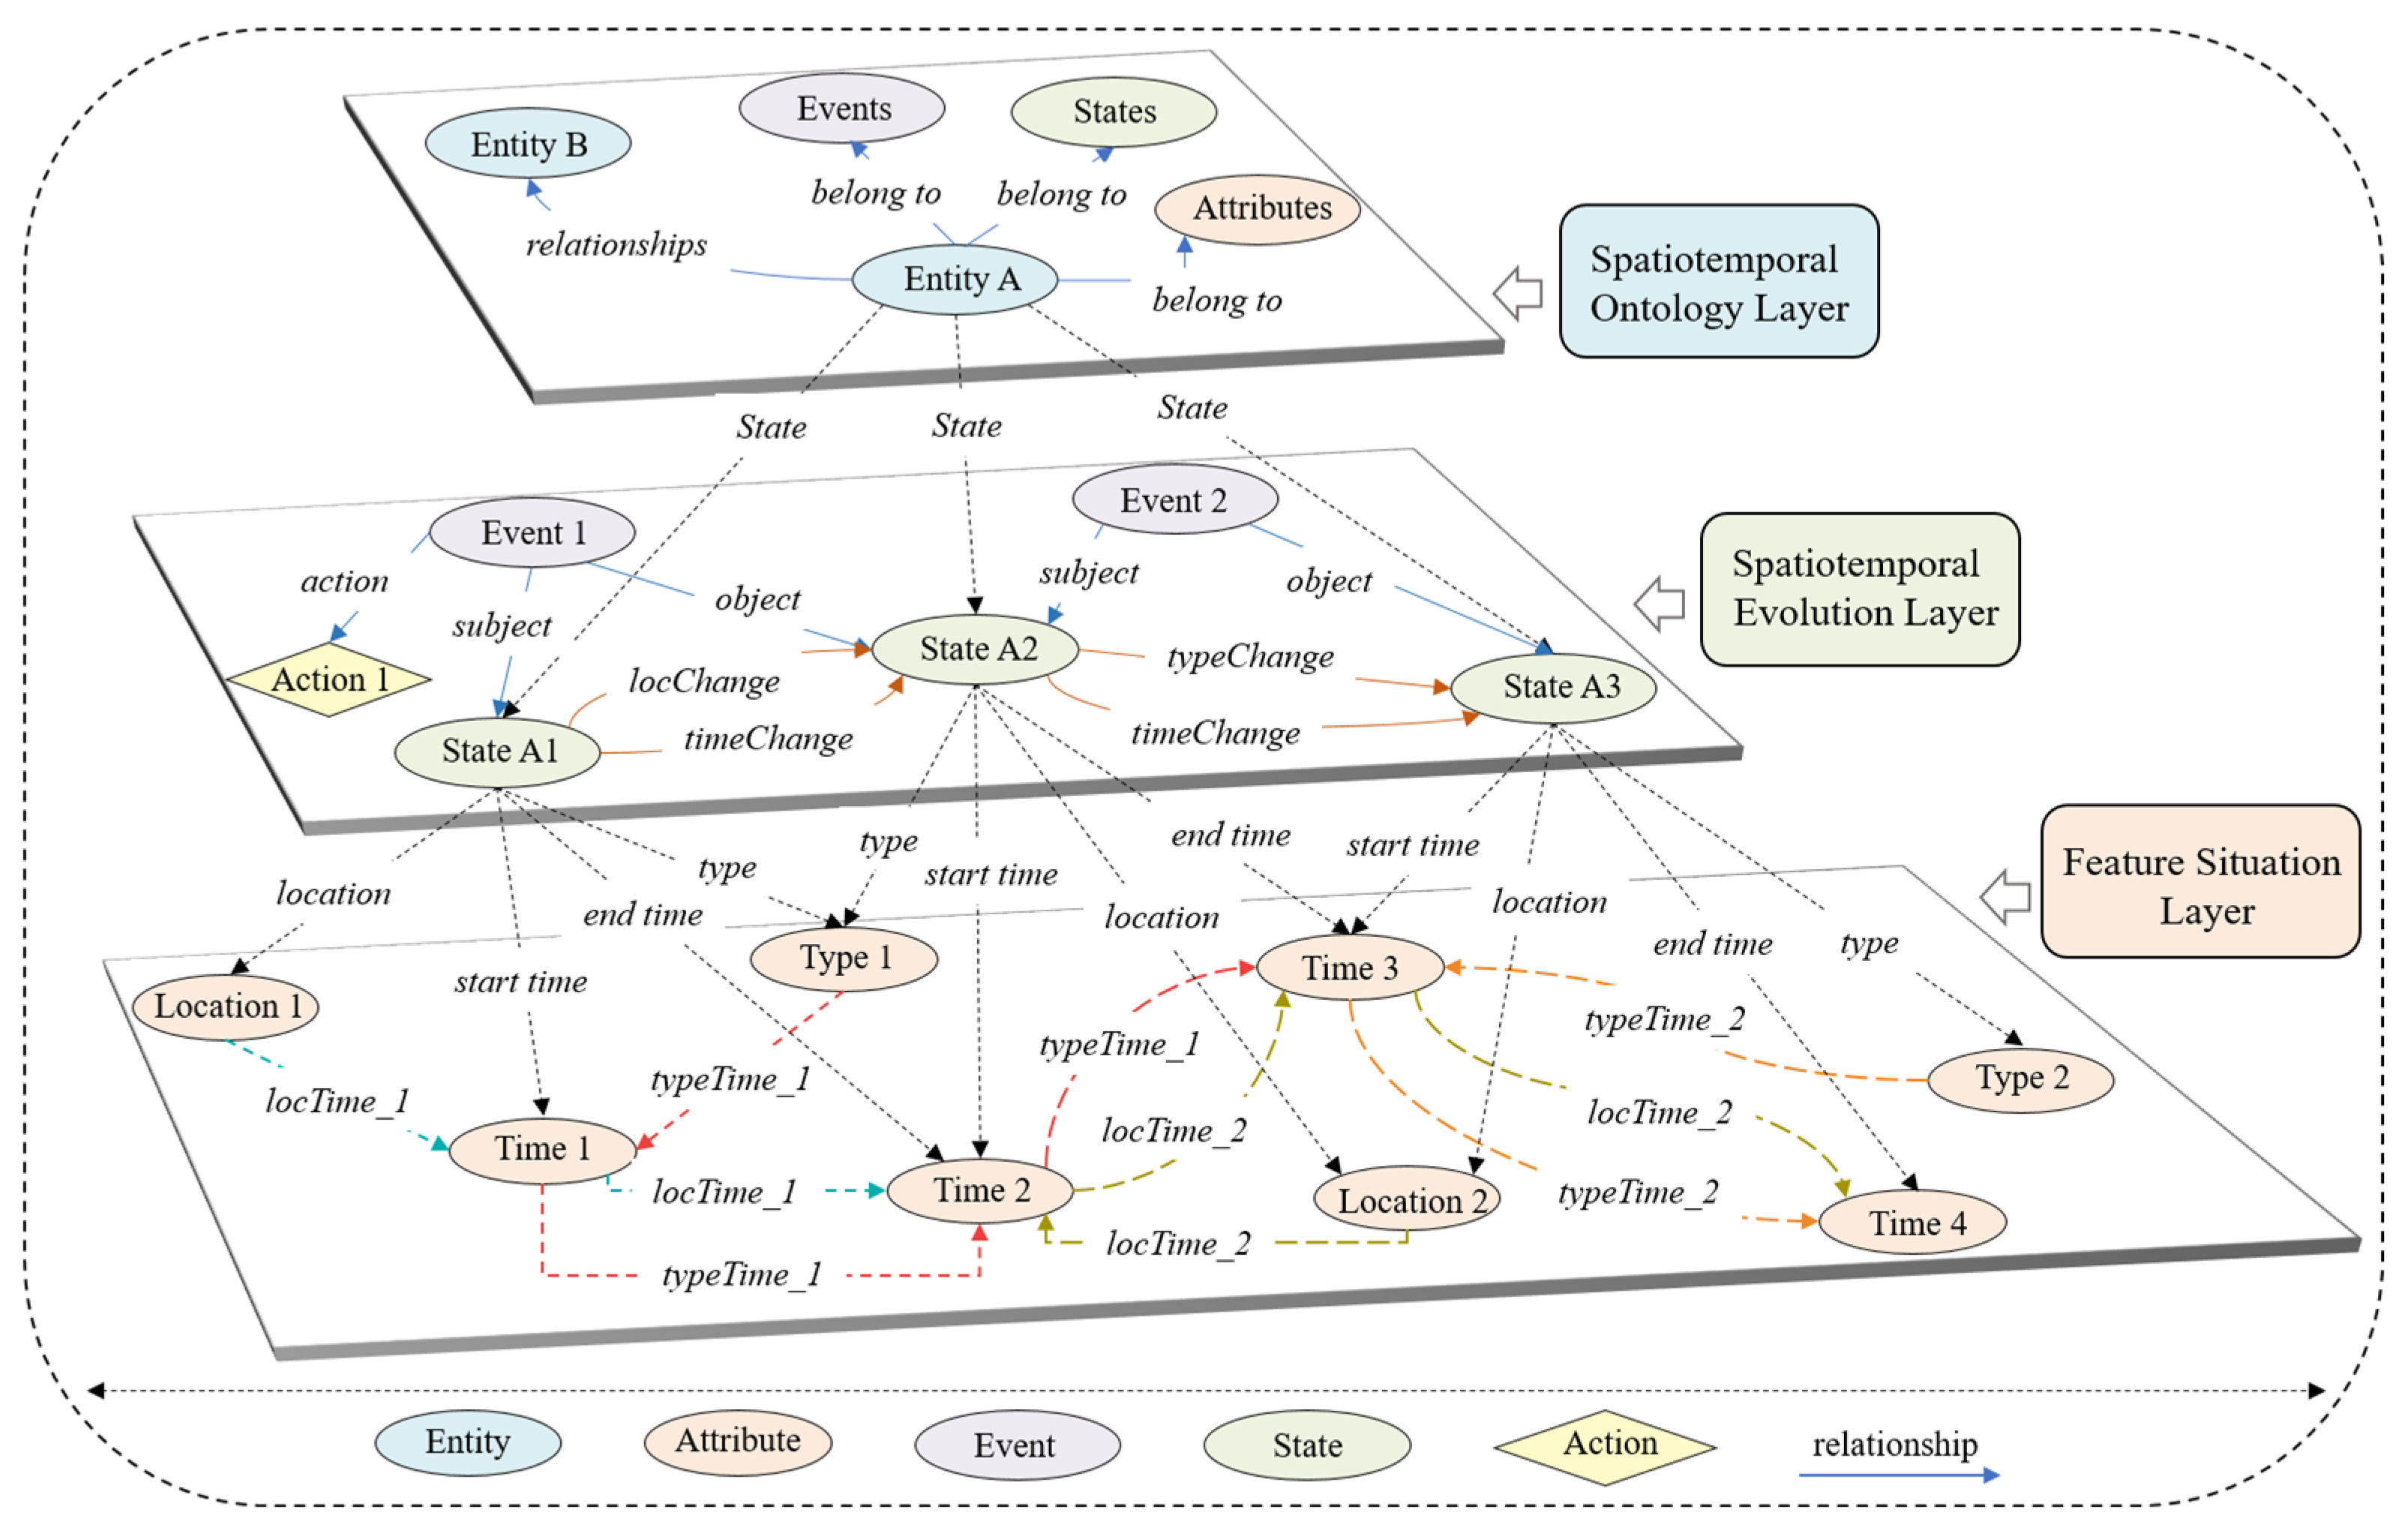
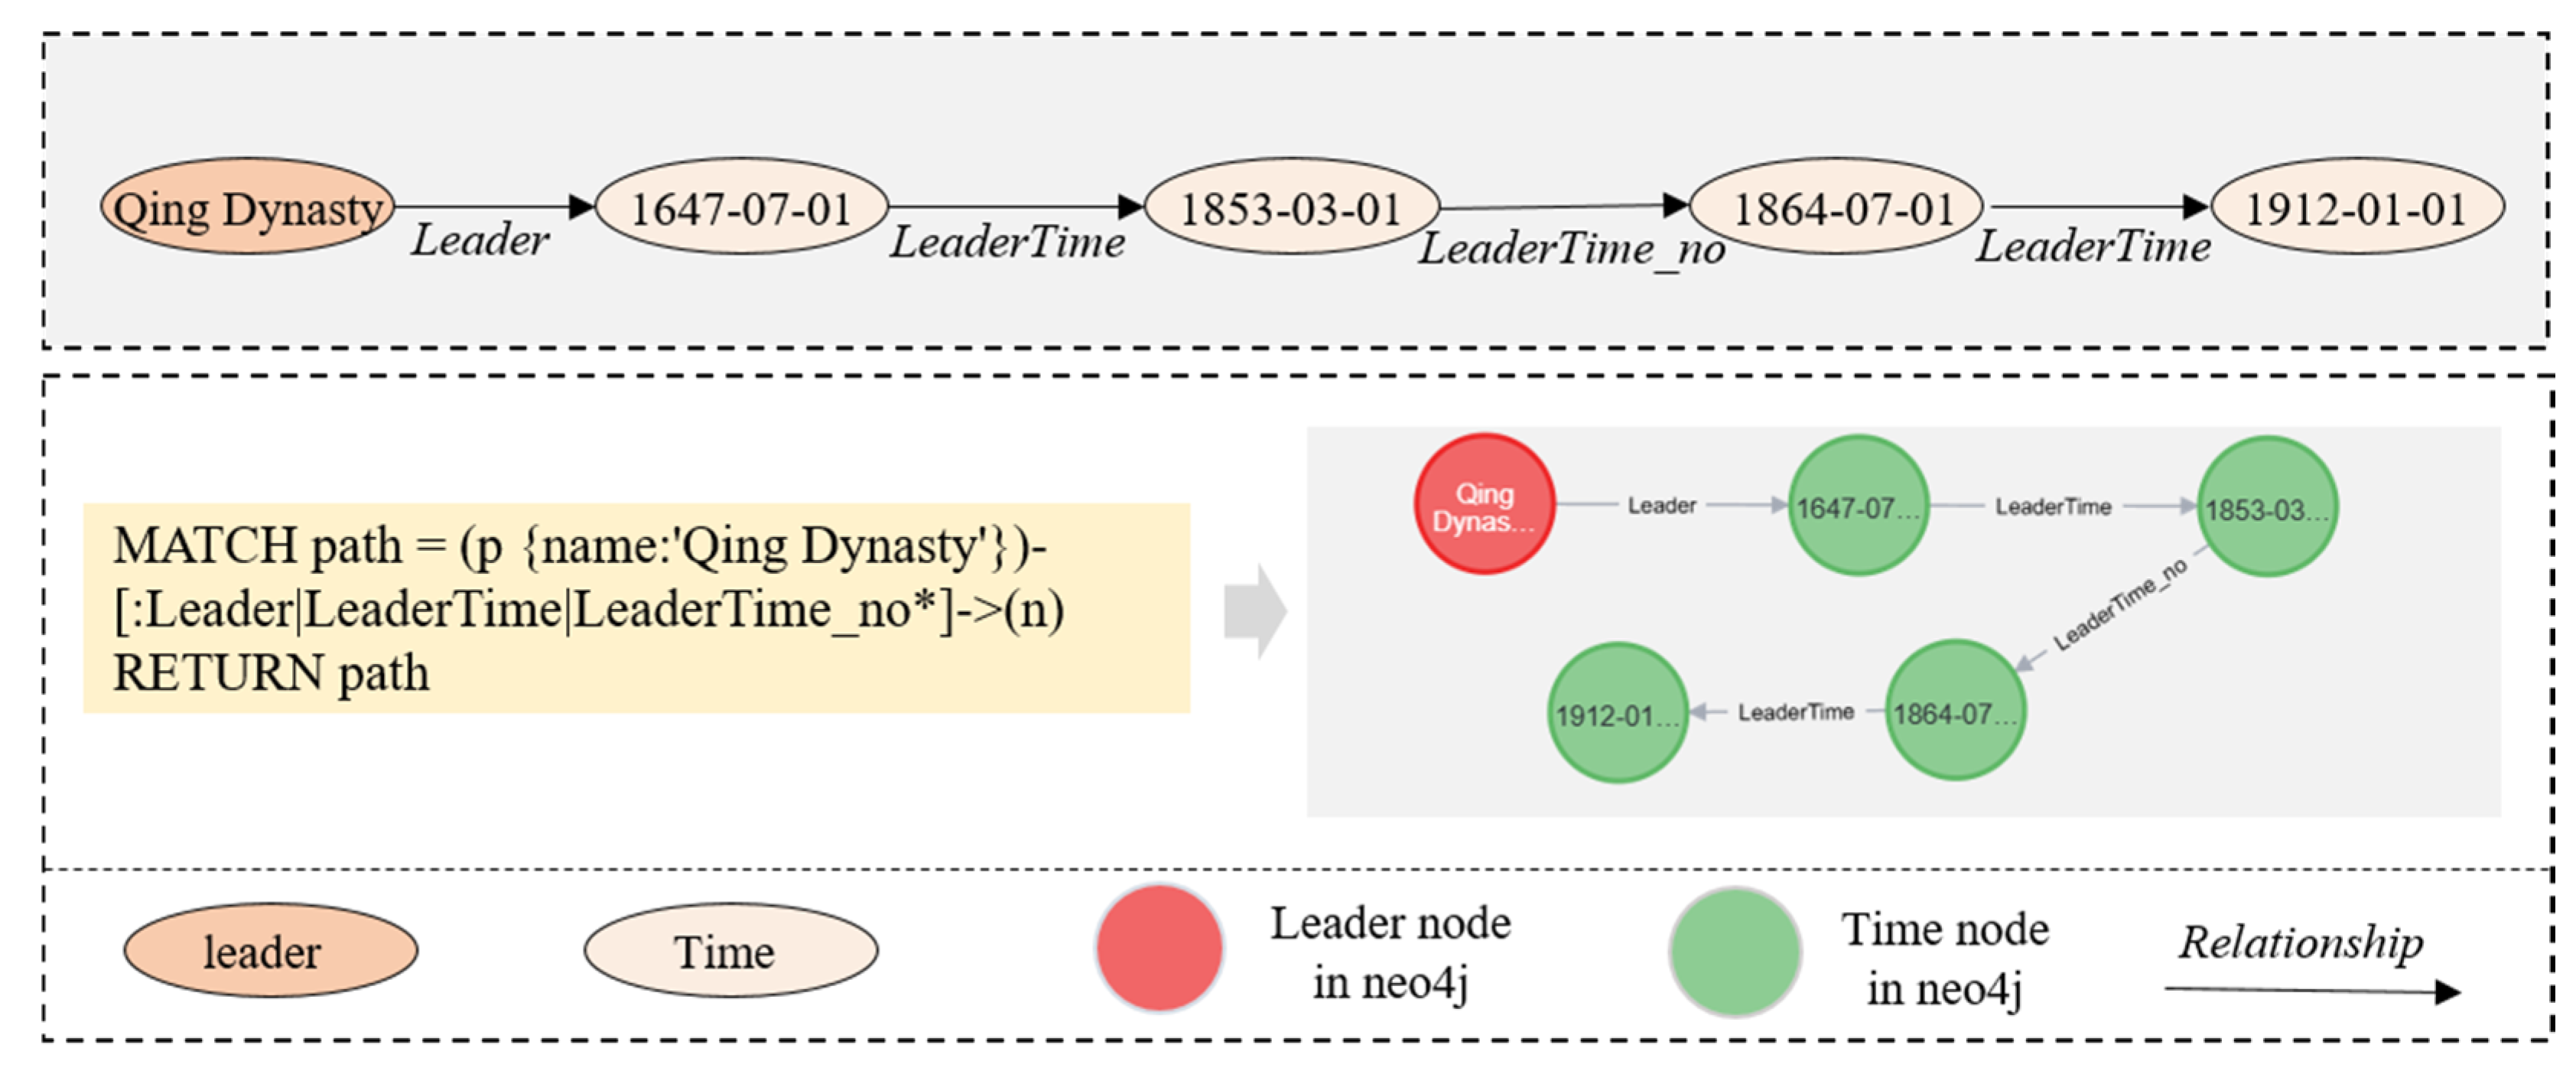
3. Spatiotemporal Evolution Hierarchical Representation Graph (STEHRG)

The structure of the STEHRG, as shown in Figure 1, consists of a spatiotemporal ontology layer, a spatiotemporal evolution layer, and a feature situation layer.
(1) The spatiotemporal ontology layer abstracts the entities of the real world into objects with spatiotemporal characteristics (such as events, processes, states, and features). It also defines and integrates the basic relationships between spatiotemporal elements, providing a basic framework for the spatiotemporal evolution and specific event analysis of the lower level.
(2) The spatiotemporal evolution layer analyzes the lifecycle of entities, focusing on the transformation processes between states and the spatiotemporal events that trigger these changes. It details how entities evolve over time and space.
(3) The feature situation layer captures the dynamic changes in features by compiling state characteristics from the entity’s lifecycle, including their evolving situational information over time.
The fundamental elements of spatiotemporal objects and the reference graph’s structure can be expressed as follows:
STEHRG = { < L o , L e , L f > }
where L o is the spatiotemporal ontology layer, L e is the spatiotemporal evolution layer and L f is the feature situation layer.

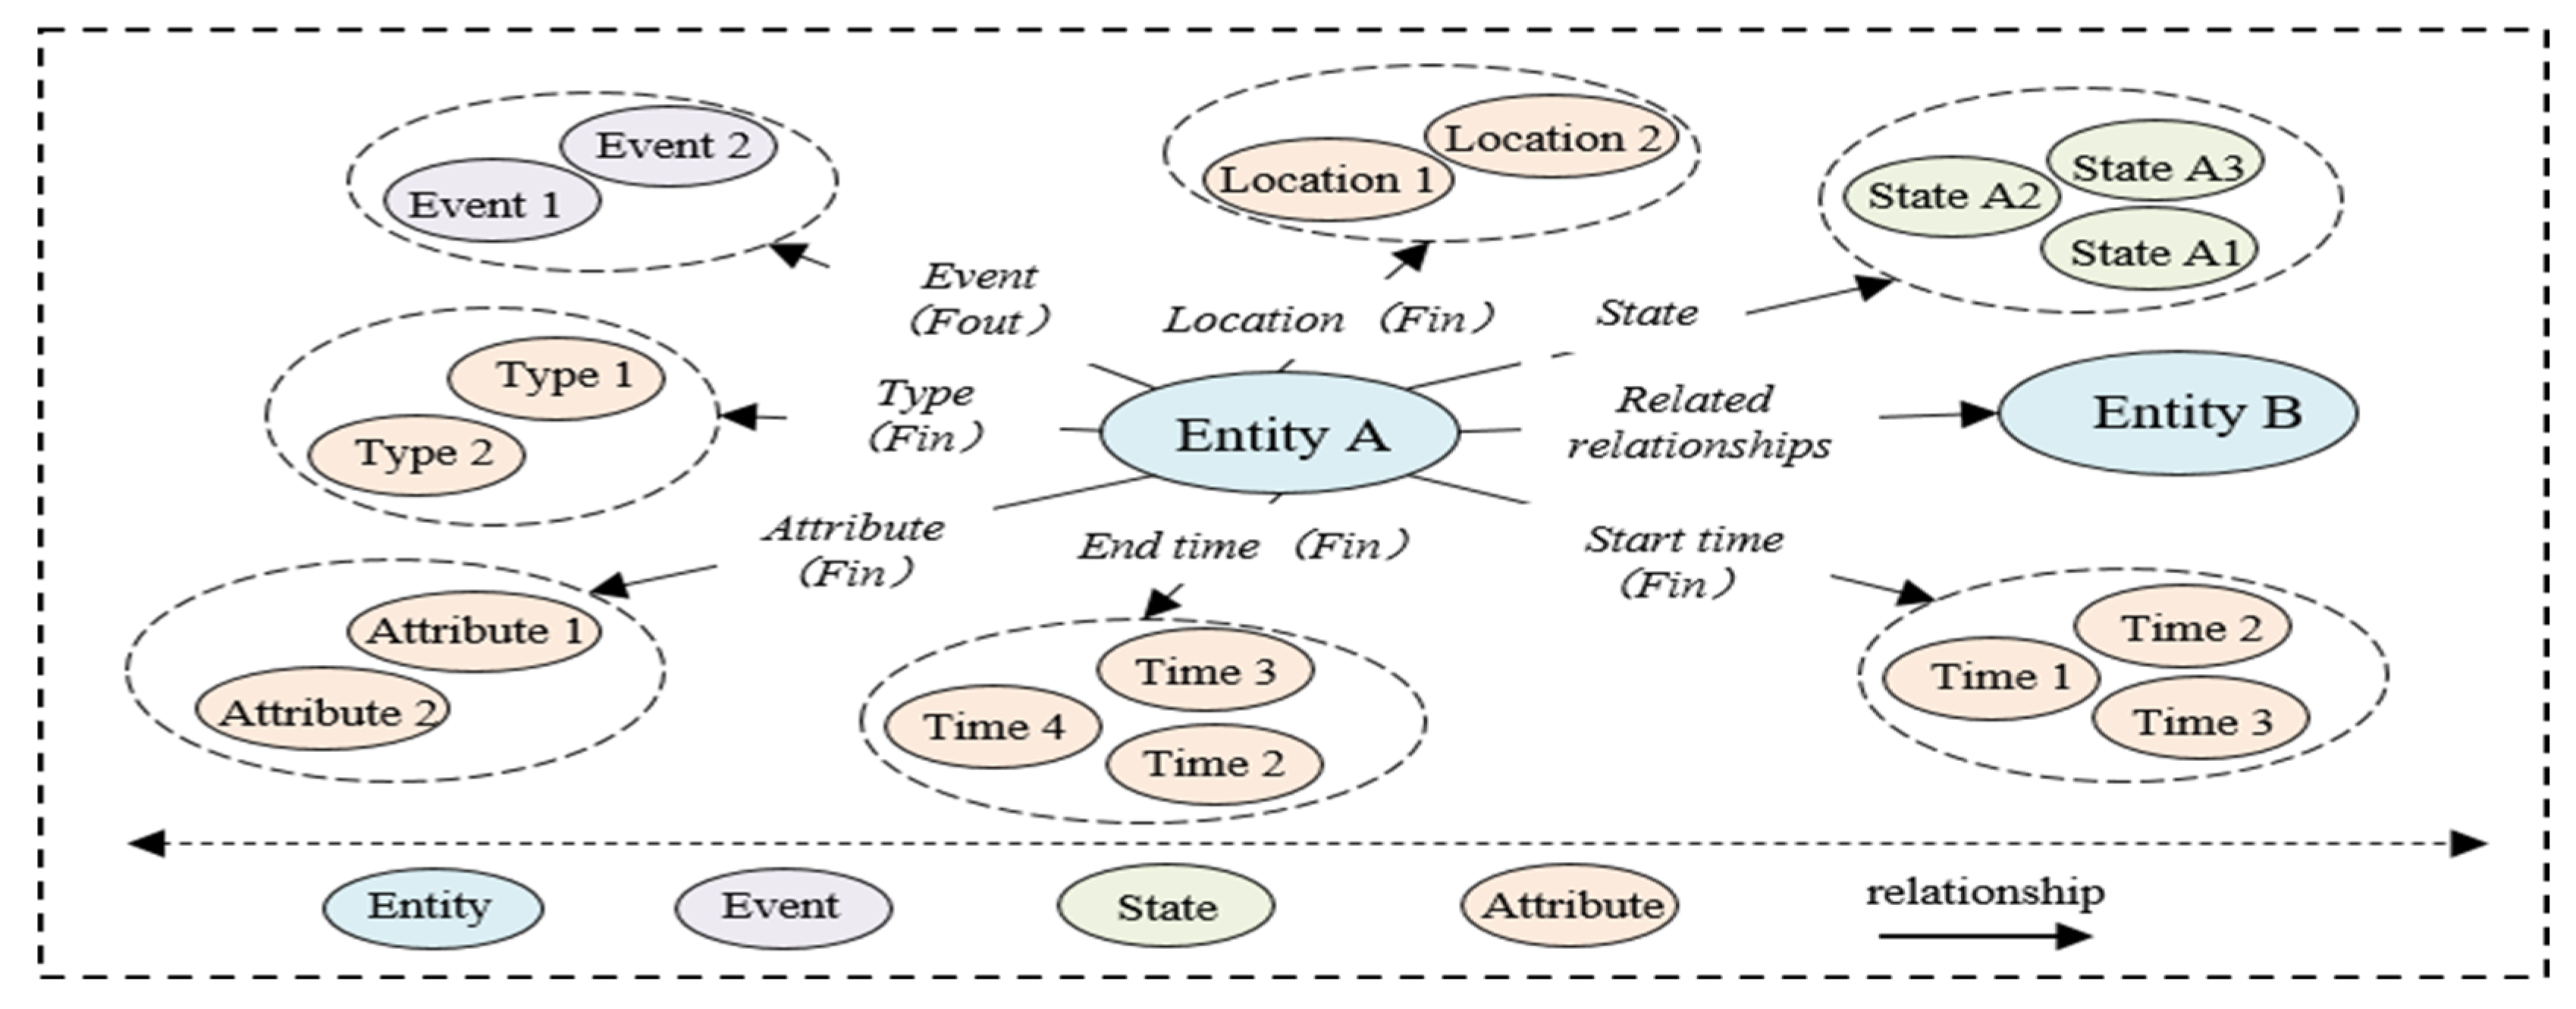
3.1. The Spatiotemporal Ontology Layer

The spatiotemporal ontology layer represents the features, events, and interactions involved in the evolution of entity objects from a macro perspective, constructing a structured model containing relevant information.
To capture the geographic information of features, Lü et al. [9] combined geographic semantics, location, shape, evolutionary processes, inter-element relationships, and attributes. Huang et al. [34] expanded this model by incorporating representation information based on processes, states, and relationships. The STEHRG introduces a classification method. This method categorizes external features as relational and behavioral, while internal features encompass the temporal, spatial, semantic, and attribute features of entity objects.
Temporal features are crucial in understanding the evolution of geographic objects. They highlight aspects such as the beginning and ending times related to the condition of these objects at specific times or intervals. These characteristics illuminate attributes like the speed and periodicity of the objects’ evolution, emphasizing the dimension of ‘when’. Additionally, they also provide information on the duration or time span of evolution or an event’s occurrence. Spatial features, including geographic position and geometric form, describe the location of objects on the Earth’s surface, emphasizing the dimension of ‘where objects exist in time and space. The attributes of geographic objects are described by attribute features. These can include supplementary information and fundamental features that help determine the attributes a certain feature possesses. Semantic features enable precise identification and categorization of a feature by defining its properties, roles, and significance to address inquiries about its identity and type. Relational features refer to static or structural associations between spatiotemporal entities and other entities. Behavioral features of entities describe spatiotemporal activity patterns such as island erosion, water pollution diffusion, and building deformation, thereby indicating the potential behaviors and functions of the geographic entity.
The structure of an entity can be defined as follows:
E n t i t y n = ( F i n , F o u t )
F i n = ( T s n , T e n , S p n , S e n , A r n )
F o u t = { R e l n , B e h n }
where F i n denotes the intrinsic features, F o u t represents the extrinsic features, T s n T = { T 1 , T 2 , , T n } is the start time, T e n T = { T 1 , T 2 , , T n } is the end time, S p n = { S p 1 , S p 2 , , S p n } denotes the geographical features, A r n = { A r 1 , A r 2 , , A r n } represents the attribute features, and S e n = { S e 1 , S e 2 , , S e n } denotes the semantic features. R e l n represents relational features. B e h n represents the behavioral features of entities.
The spatiotemporal ontology layer’s structure can be defined as follows:
L o = E n t i t y i , R i j , E n t i t y j
where R i j denotes the relationships between the entities E n t i t y i and E n t i t y j . During entity A’s spatiotemporal evolution, Figure 2 depicts a layer L o that contains aspects including the temporal, geographic, attribute, semantic, behavioral, and relational properties.
The spatiotemporal ontology layer is constructed to reflect real-world circumstances and requirements. If project objectives necessitate processing spatiotemporal information, it is essential to build and maintain an accurate spatiotemporal ontology layer. However, if the focus is elsewhere, resources can be redirected by streamlining the design and ignoring the spatiotemporal ontology layer.

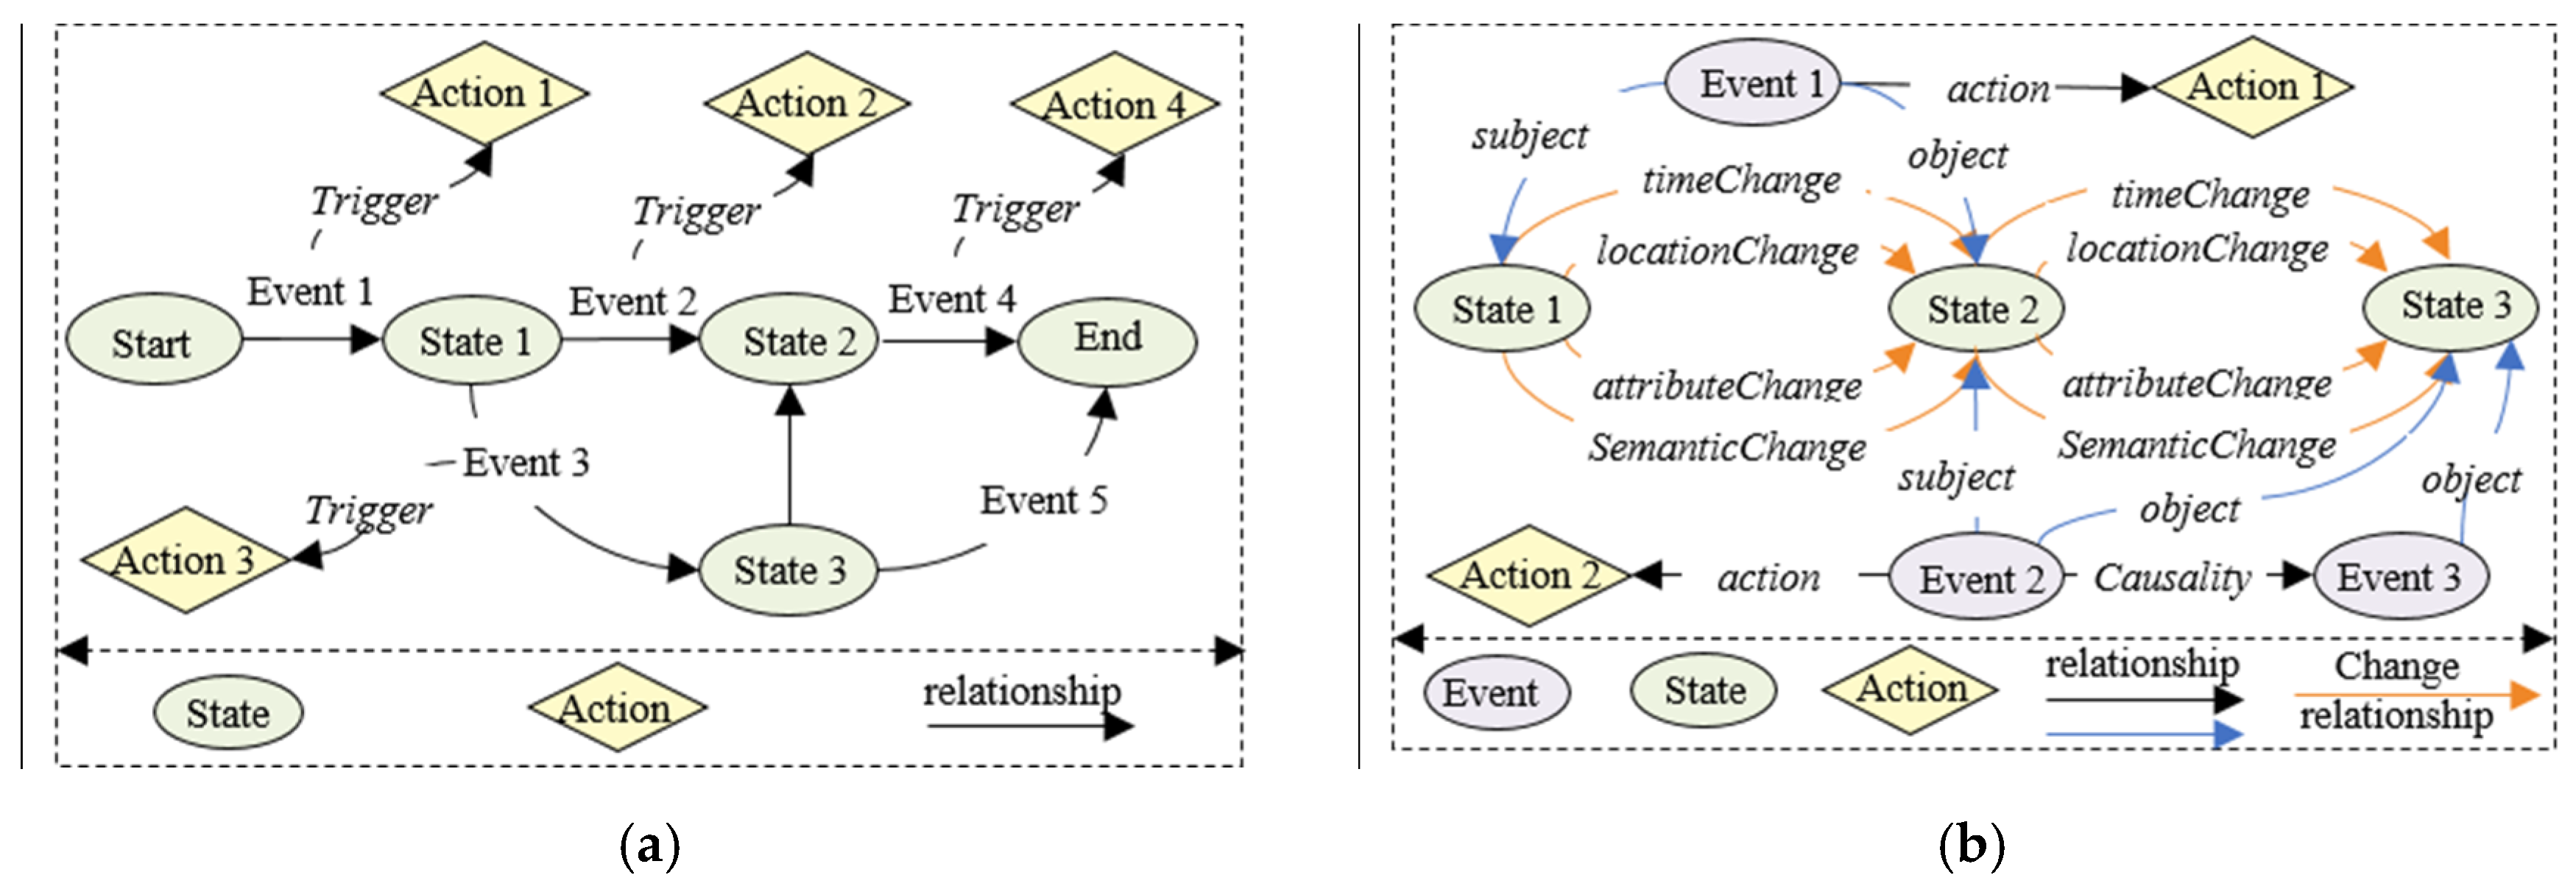
3.2. The Spatiotemporal Evolution Layer

The spatiotemporal evolution layer describes and analyzes changes in geographic entities over time and space. Its primary goal is to represent state transitions from multiple dimensions, emphasizing the processes of state change and the spatiotemporal events that trigger them. This approach enhances our understanding of the evolution of physical objects across various spatiotemporal states.

3.2.1. Explanation of the State Transition Process’s Characteristics

The Finite State Machine (FSM) is a mathematical model that explains how a system behaves and transitions between states throughout its lifecycle. It defines various states, identifies actions and events leading to state transitions, and outlines the relationships between state sequences. FSM provides a structured framework for analyzing the dynamic changes in a system. As shown in Figure 3a, the system begins in the initial state and transitions to state 1 when action 1 under event 1 is triggered. This process is comparable to the spatiotemporal evolution that real-world physical objects go through. Over time, entities undergo state changes as a result of various events. For example, continental plates exhibit gradual displacement under persistent geological forces, where accumulated boundary stresses (event) may initiate crustal movements (action), inducing state transitions from stability to new tectonic configurations. FSM has a rigorous mathematical foundation and flexible dynamic description ability, especially suitable for simulating systems with discrete state changes. For example, Parker et al. [35] reviewed multi-agent systems for land use/land cover change, which describe the dynamic evolution of geographic units through a state transition mechanism similar to FSM. In addition, Hu et al. [36] constructed an ecosystem dynamic simulation model based on FSM, treating ecological information as discrete events and accurately simulating the complex responses of ecosystems under different information inputs through state transitions. You et al. [37] used FSM to define the combustion state and transition rules of trees in forest fires, simulate the state changes triggered by factors such as temperature and humidity, and achieve dynamic simulation of fire spread.
Thus, the concept of FSM serves as the foundation of the spatiotemporal evolution layer, representing the occurrence of events and state transitions in the process of entity evolution through finite states and transition conditions. First, on the basis of the time dimension, spatiotemporal objects are split into objects with distinct states. The states of spatiotemporal objects are regarded as states in FSMs. The interactions between spatiotemporal objects are therefore considered as transition events between states. They mimic the relationships and event-triggering interactions between spatiotemporal objects. This provides an organized way to explain the spatiotemporal objects’ history.

3.2.2. Structured Expression of Spatiotemporal State Transition

In spatiotemporal evolution, the primary criterion for distinguishing states is the changes in time and the internal properties of the object. These internal property changes at different time points depict how objects transition between states. Since the spatiotemporal entity state refers to an object’s state at a specific moment, the state structure of the object at that time is defined as follows:
S t a t e 1 , S t a t e 2 , , S t a t e i E n t i t y i
S t a t e i = ( T s i , T e i , S p i , S e i , A r i )
where S t a t e i is an entity object’s state at a specific point in time, T s i is the start time, T e i is the end time, S p i denotes the geographical features, A r i represents the attribute features, and S e i denotes the semantic features. Therefore, the spatiotemporal state transition process of objects can be expressed as:
S e v o i j = ( S t a t e i , R e v o i j , S t a t e j )
where S e v o i j is the multidimensional evolution relationship between two states S t a t e i and S t a t e j .
The transition of spatiotemporal objects between states is often accompanied by characteristic modifications across several dimensions, including time, geometry, attributes, and semantics. For example, the predecessor of Wuhan University, “Ziqiang Institute,” relocated in 1902 to Wuchang Dongchangkou and was renamed “Foreign Languages Institute”. The change in location from the original site to Wuchang Dongchangkou constitutes a change in spatial position, a geographical characteristic change. The change in the school’s name from “Ziqiang Institute” to “Foreign Languages Institute” is an attribute characteristic change. These changes reflect the variations that spatiotemporal objects undergo throughout their lifetimes. The evolution layer of spatiotemporal processes provides a comprehensive characterization of feature changes from the following four dimensions: time, space, attributes, and semantics. This framework captures the feature changes in spatiotemporal objects during state transitions, expressed as follows:
R e v o n = ( S a n , S v n , T a n , T v n )
T R n , S p R n , A r R n , S e R n R e ν o n R n
where R e v o n denotes the changing relationships, S a n is the source target feature name, S v n is the source target feature value, T a n is the target feature name, T v n is the target feature value, T R n is the temporal dimension change, S p R n is the spatial dimension change, A r R n is the attribute dimension change, and S e R n is the semantic dimension change. R n is the evolutionary relationship including the changing relationships R e v o n and other potential relationships that have not yet been fully considered and revealed.
The fundamental building blocks that link and drive the evolution of spatiotemporal objects are called events. In order to express the various elements involved in an event and their related information, the evolution layer of spatiotemporal processes adds time, space, and other related information to the triplet <entity, relationship, entity>. This increases the spatiotemporal evolutionary process’s capacity for information expression. An event’s structure can be expressed as follows:
E v e n t i = ( T s i , T e i , E s i , A c i , E o i , S p i , C a i )
where T s i is the start time of the event, T e i is the end time of the event. If the event is an instantaneous event, T s i and T e i are equal, indicating the exact time when the event occurred. E s i denotes the subjects associated with the event (the subjects where the event occurred), A c i is a representation of an entity’s action, referring to actual changes or behaviors of a geographic entity, such as movement or state transitions. Some events involve no action and only describe or monitor a condition—like ongoing weather or policy announcements—without changes to location or state. E o i represents the objects affected by the event or the impacted entity objects, S p i is the event’s geographical context and indicates the event’s location, and C a i denotes the impacted characteristics.
Therefore, the definition of the spatiotemporal evolution layer is as follows:
L e = ( S t a t e n , E v e n t n , R n )
The spatiotemporal evolution layer can characterize the state transition process and feature changes in entities. Additionally, it characterizes the driving factors of entity changes. This was ascertained from the research mentioned above on the state transition process and state feature changes in spatiotemporal objects. Figure 3b shows a schematic of the spatiotemporal evolution layer.

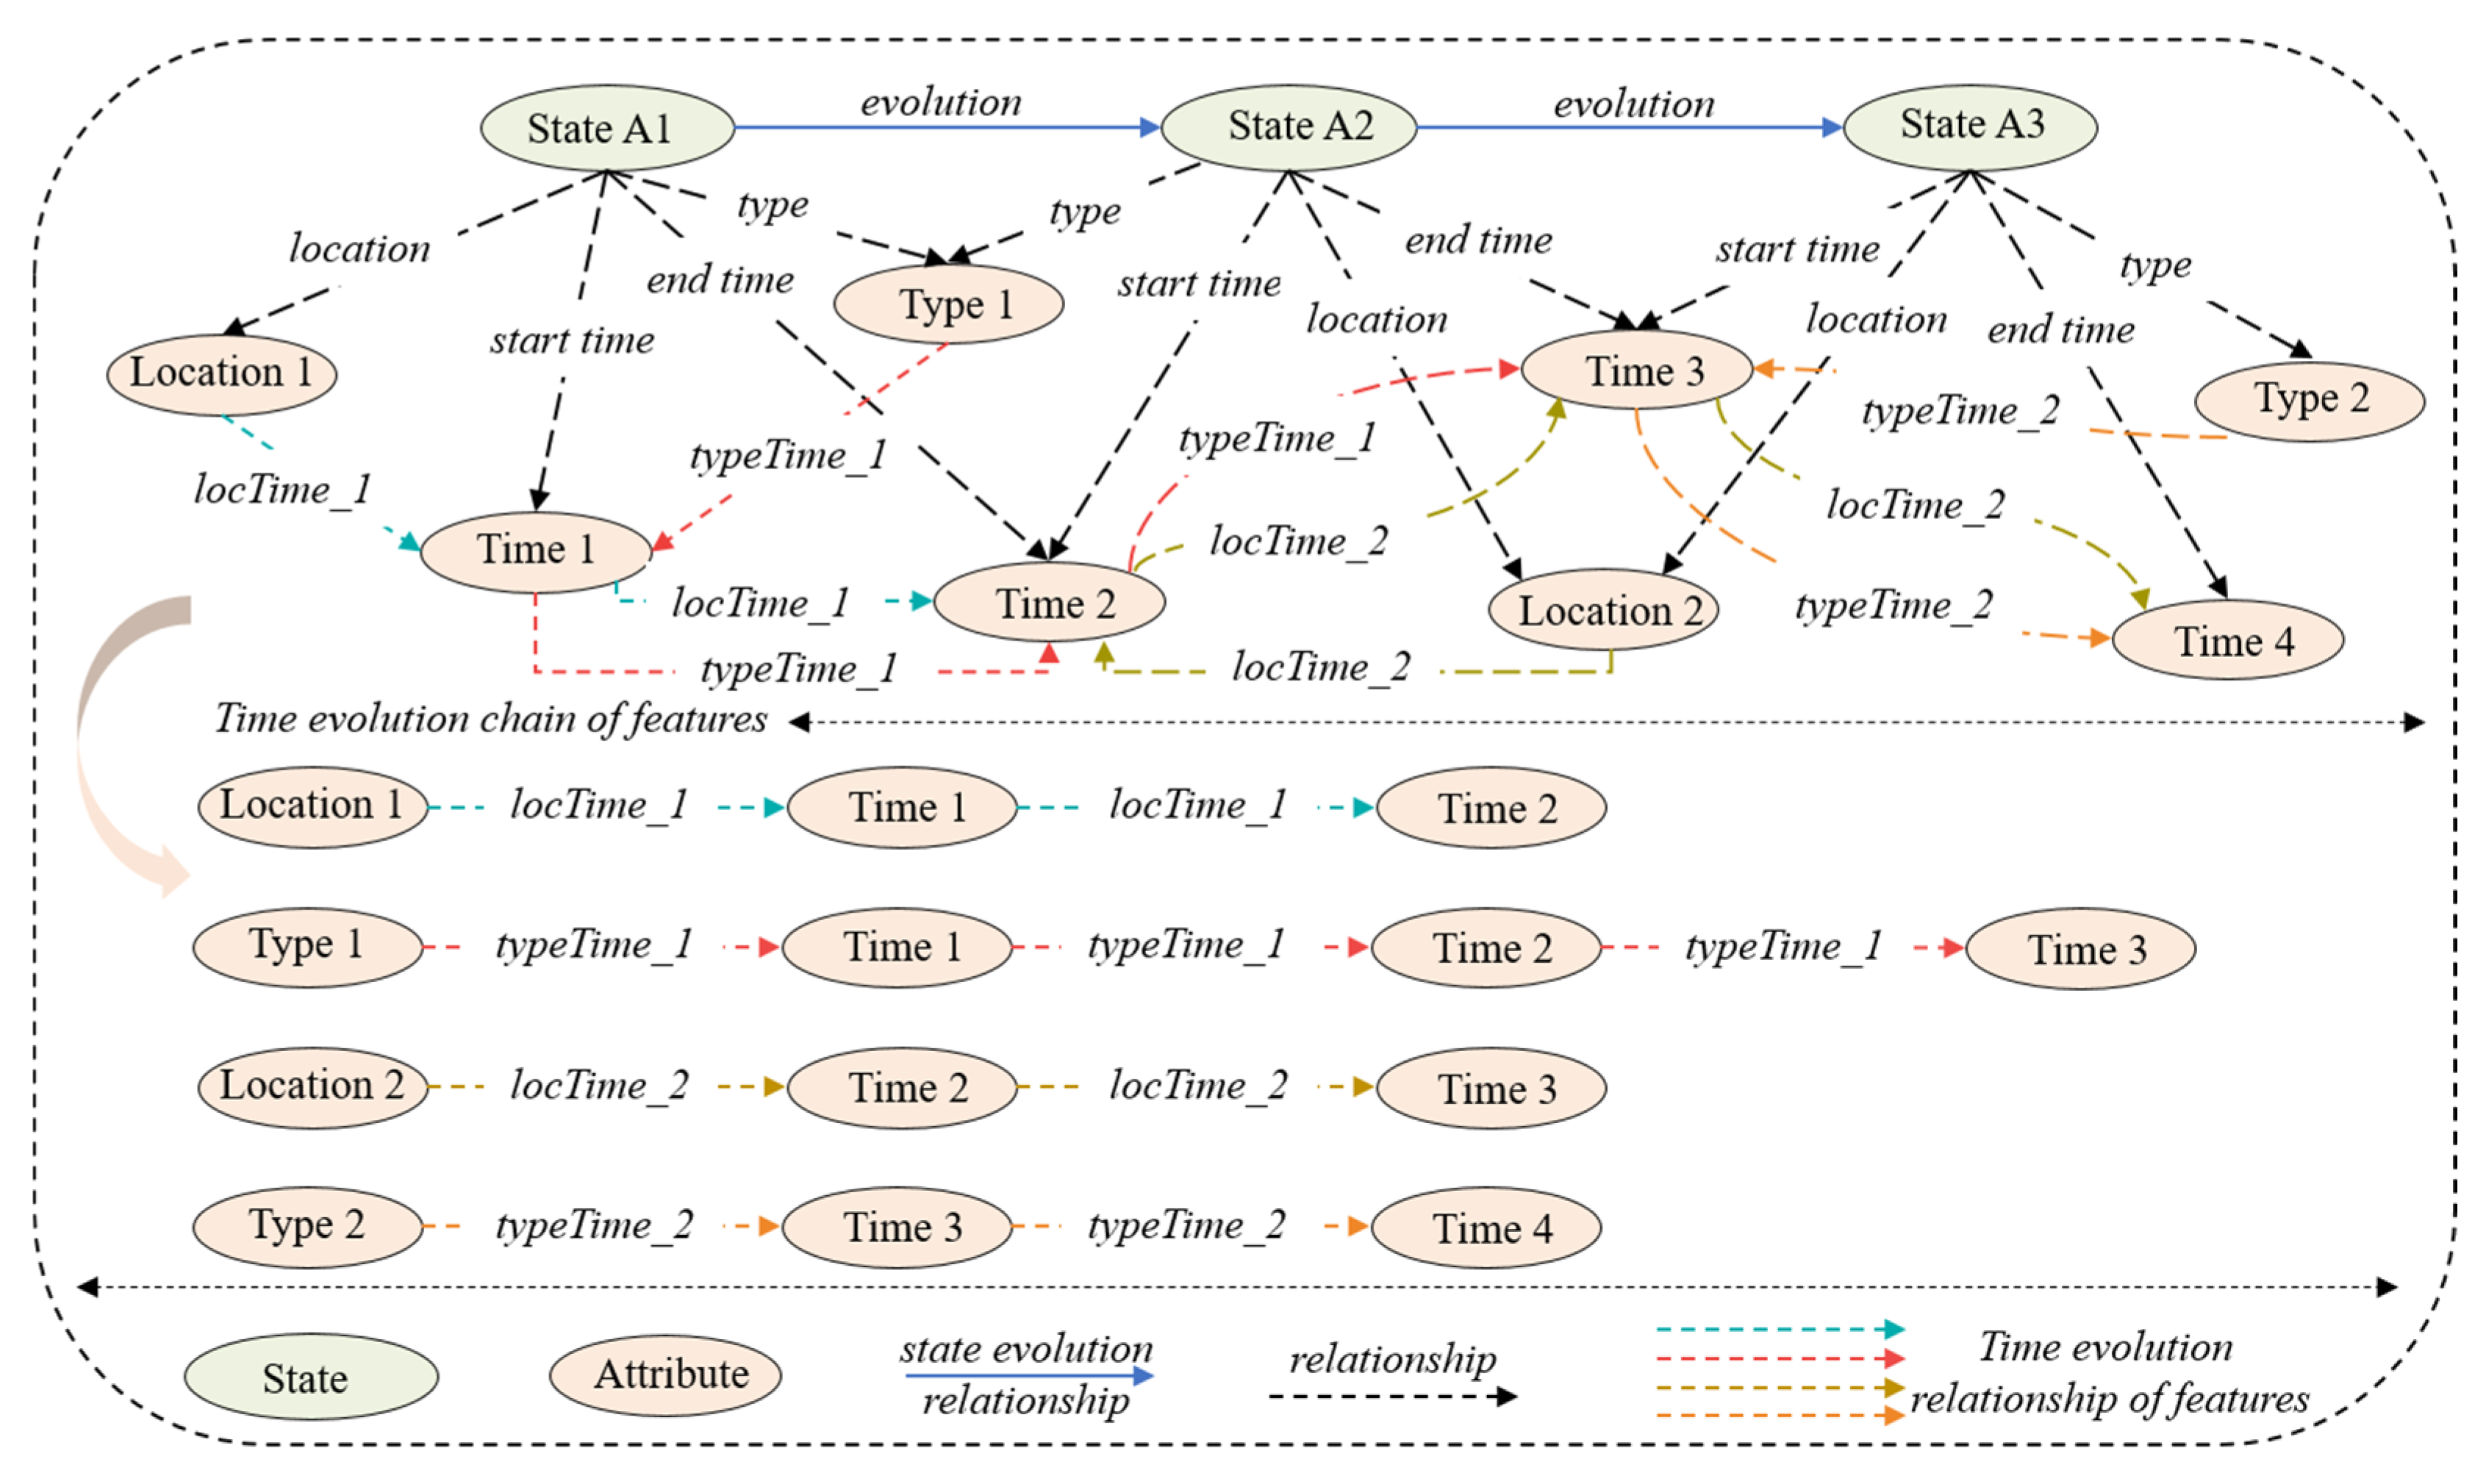
3.3. Feature Situation Layer with Time Dependency

The feature situation layer integrates state characteristics with situational information that evolves over time. Capturing and evaluating dynamic features is challenging due to traditional graph designs, which often focus on static connections between nodes and edges, neglecting temporal dynamics in spatiotemporal evolution. To address this, we present a time-dependent feature representation method. This method incorporates the dynamics of time into the graph structure to create a time evolution chain of state features. A time evolution chain shows the intricate relationships between the nodes of features in the current feature set that are a part of the entity object lifecycle. It can be formalized as follows for a time evolution chain:
W a l k i = ( F e i , R i , T i , R i , T i + 1 , R i , T i + 2 , )
F e i { F e 1 , F e 2 , , F e n } , T { T 1 , T 2 , , T n }
where W a l k i is the time evolution chain of the feature, T i is the time node where the feature exists, R i is the feature’s time correlation relationship, and F e i is the feature node. A feature situation layer can be created using this approach. Formally, the feature situation layer L f is expressed as:
L f = ( F e n , W a l k n ) , F e n = { F e 1 , F e 2 , , F e n } , W a l k n = { W a l k 1 , W a l k 2 , , W a l k n }
Figure 4 shows the created feature situation layer, and its four state feature evolution chains. Both states A1 and A2 share the same type 1 characteristic. State A1 has start and end times of time 1 and time 2, respectively. State A2 has start and end times of time 2 and time 3, respectively. Thus, constructing the type 1 time evolution chain <type 1, typeTime 1, time 1, typeTime 1, time 2, typeTime 1, time 3> can help characterize type 1 existence stage in the state A1 and state A2 lifecycles. The lifecycle of type1 is represented by time nodes located in the time evolution chain of type1. This method uses temporal information to globally express and analyze how a feature changes over time, aiding the understanding of its dynamic evolution. Additionally, they allow rapid extraction and analysis of the time evolution chain and feature evolution. This is for certain time points or time ranges.
For example, as illustrated in Figure 5, the NJPPA was governed by the Qing Dynasty during two distinct periods: from July 1647 to March 1853, and from July 1864 to January 1912. This temporal evolution of leader is effectively represented through a time-based relational graph. By executing relationship queries such as the one shown (MATCH path = (p {name:‘Qing Dynasty’})-[:Leader|LeaderTime|LeaderTime_no*]->(n) RETURN path), the dynamic changes in the leader attribute over time can be retrieved and visualized, thereby clearly demonstrating the historical succession and interruptions in governance.

4. Experiment A: The Evolutionary Process of Wuhan University (WHU)

Experiment A of this study is based on WHU’s spatiotemporal evolution data. We compare the STEHRG model to existing models, including the geographic knowledge graph GeoKG [14,15], the spatiotemporal object knowledge graph STOKG [17], and the geographic evolution knowledge graph GEKG [16]. Through this comparison, we evaluate the strengths and weaknesses of the STEHRG in spatiotemporal expression.

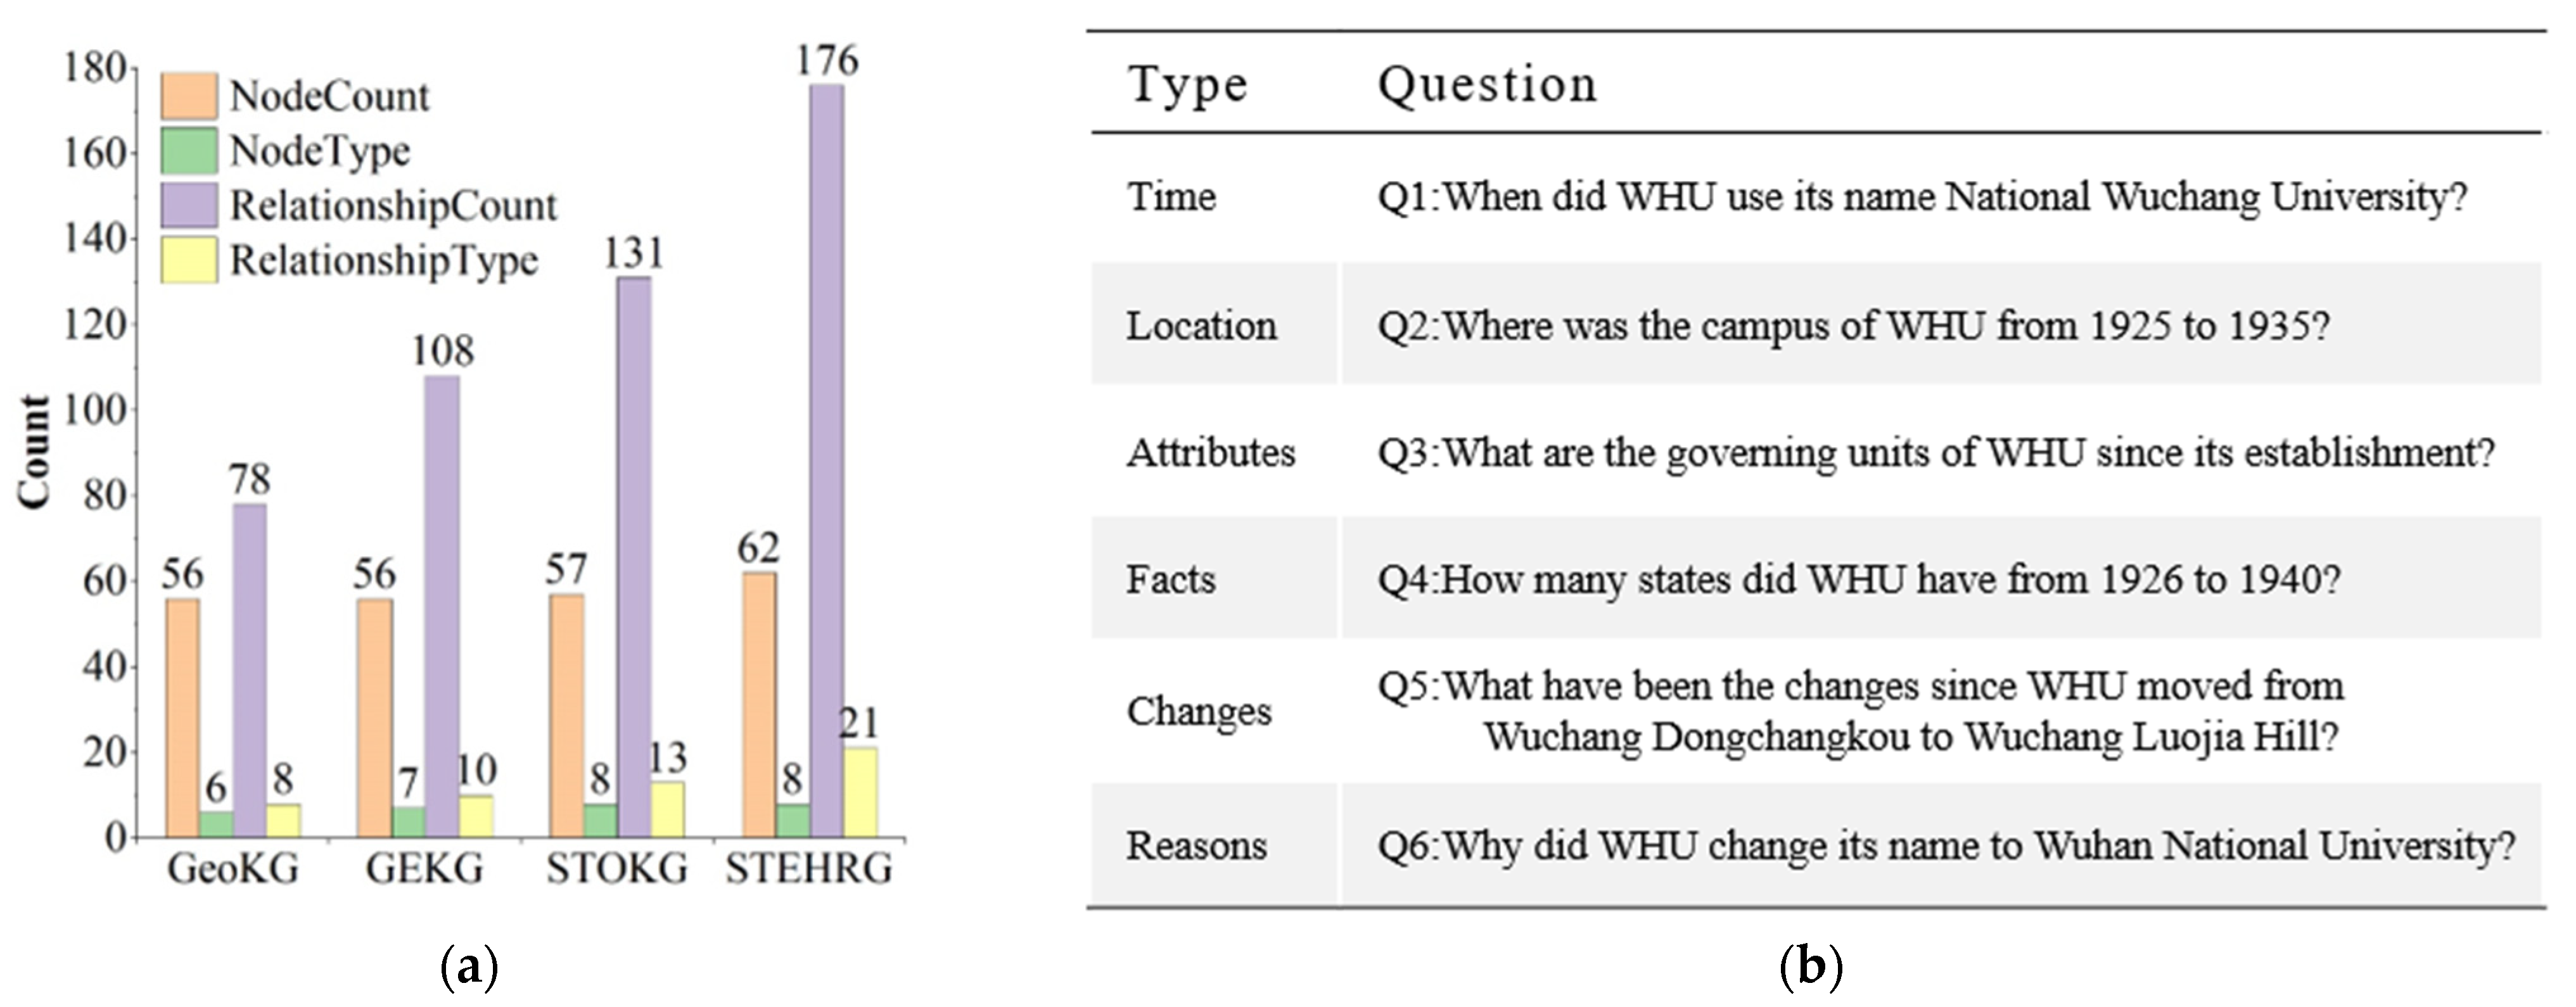
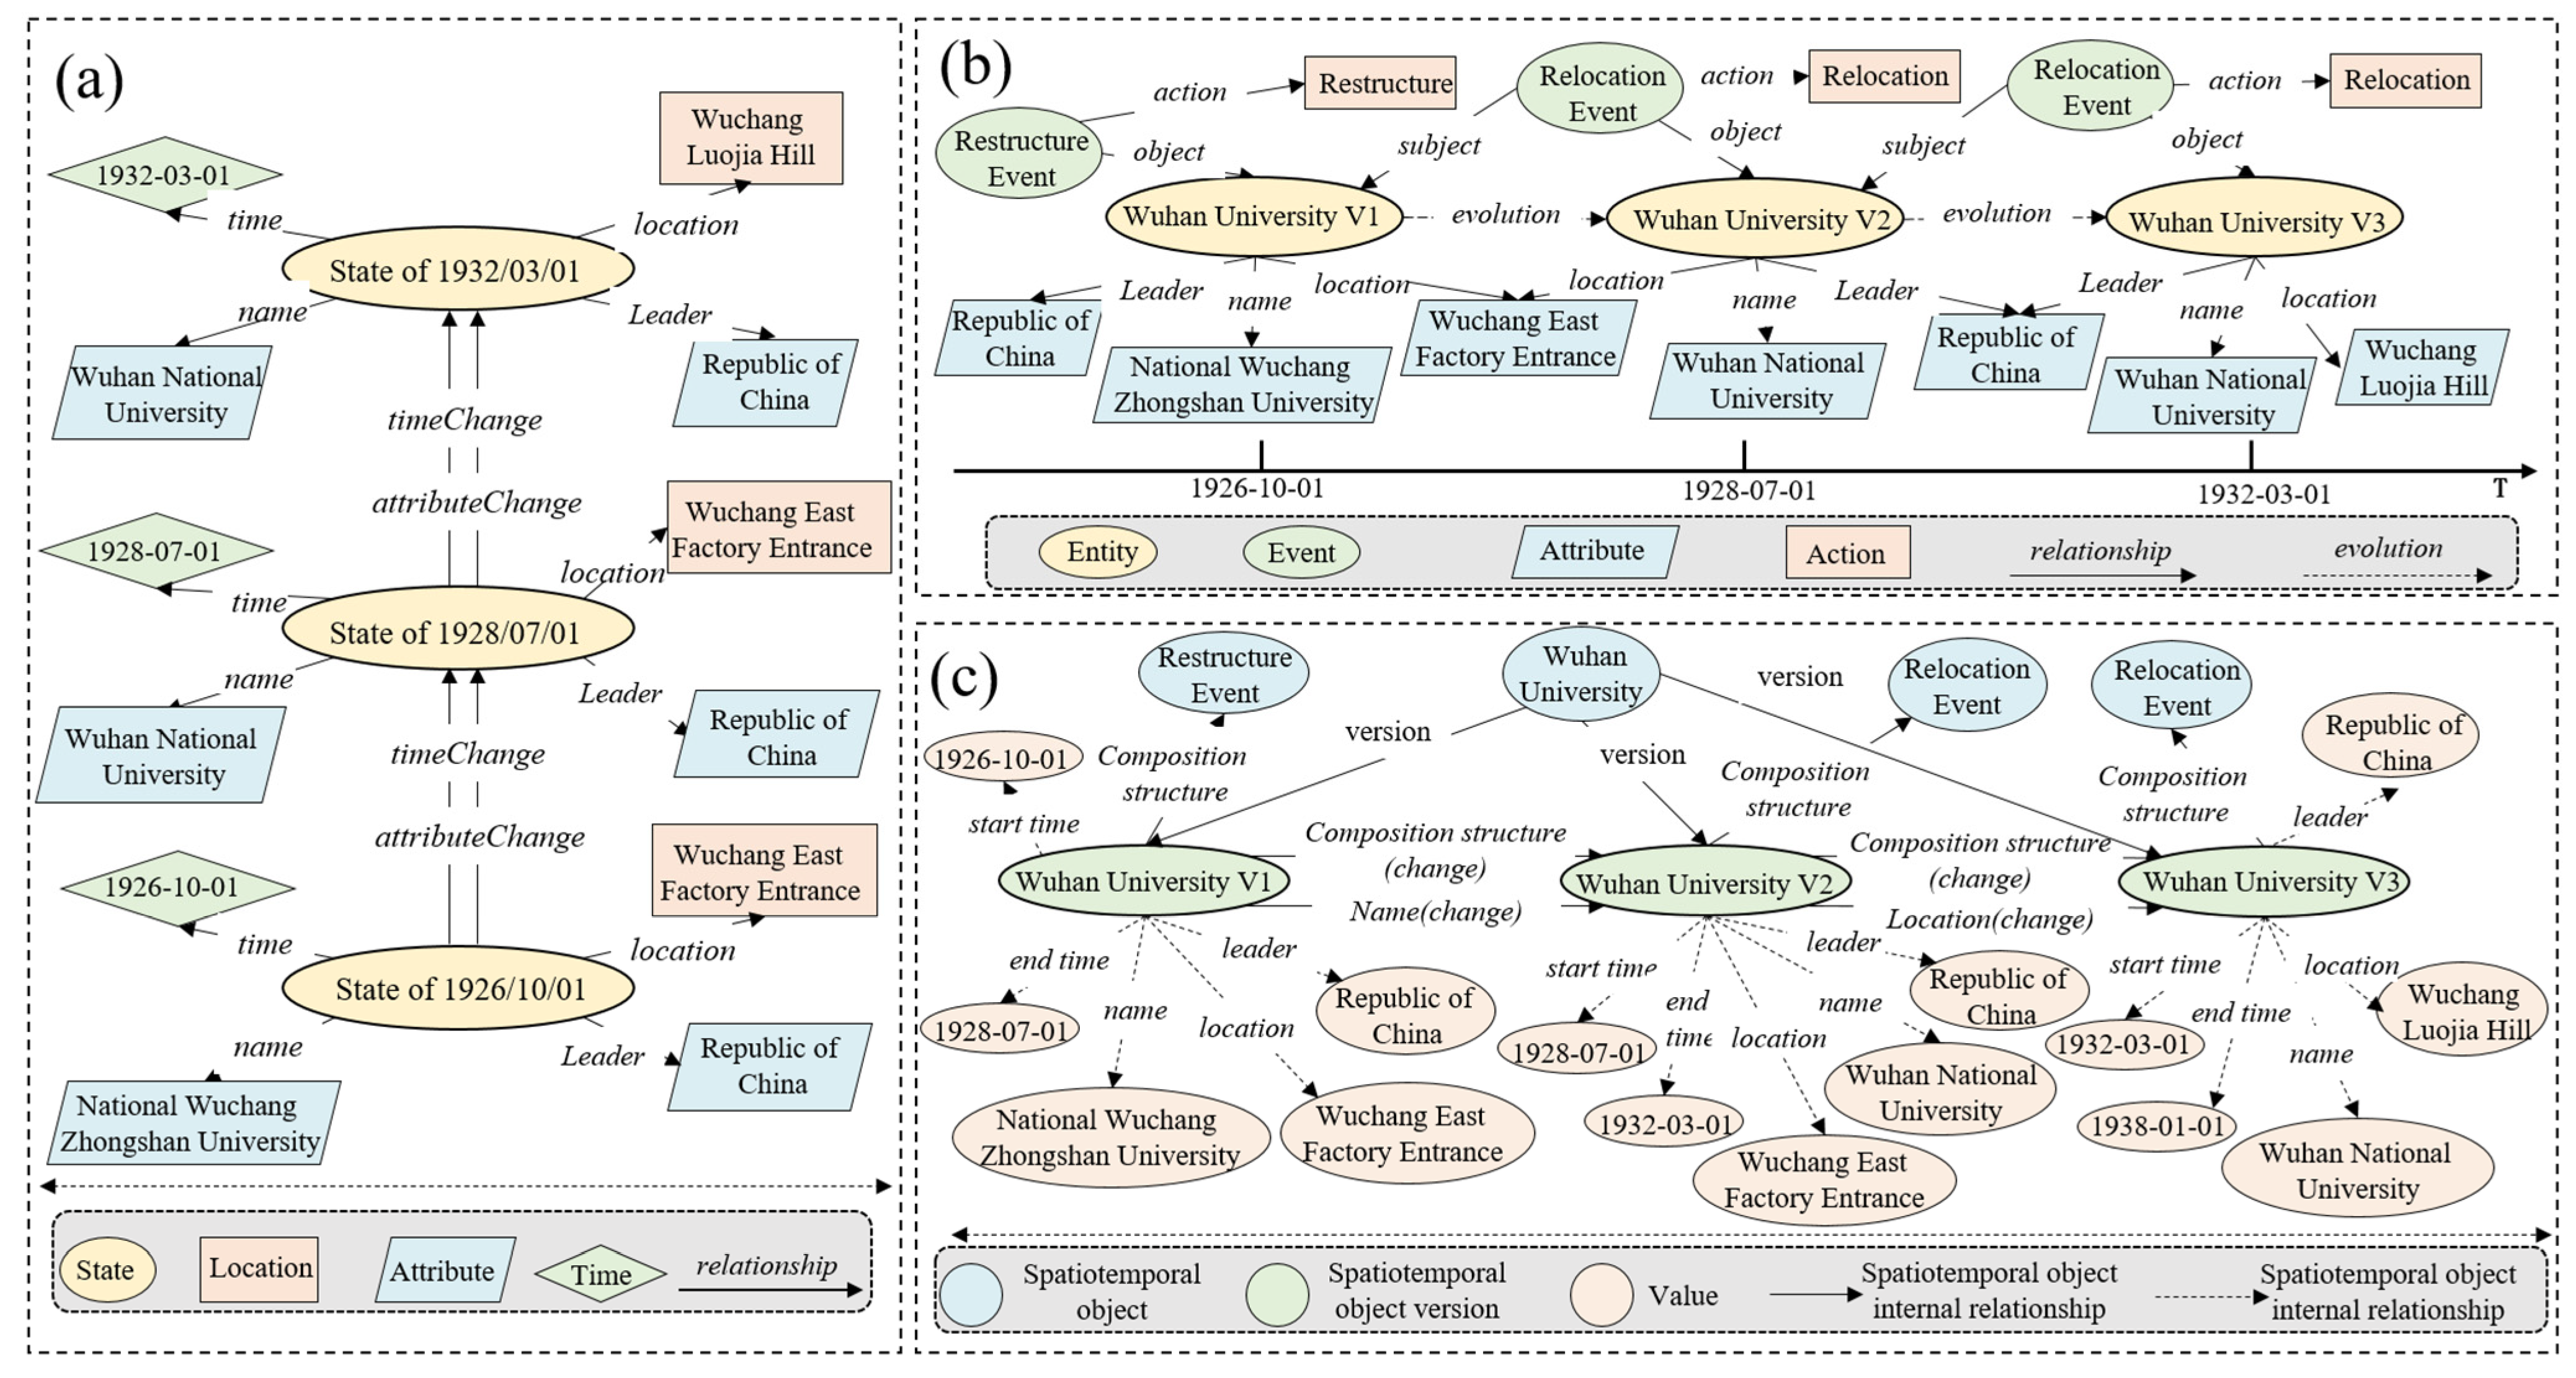
4.1. WHU Data Description

The evolution data for WHU was primarily sourced from the WHU History Museum website (http://xsg.whu.edu.cn/, accessed on 27 June 2025) and the official Wuhan University introduction (https://www.whu.edu.cn/xxgk/bnxs.htm, accessed on 27 June 2025). Based on structured data from websites and historical documents, we extracted key entities and relationships to construct an evolutionary knowledge graph of Wuhan University centered on spatiotemporal entities and their attributes of name, location, and leadership. Figure 6 displays WHU’s evolution data from 1893 to 2024, reflecting its dynamic changes and the complexity of spatiotemporal evolution.

4.2. Comparisons of Four Model Structures

Based on the above scene data from 1893 to 2024, the STEHRG and existing geographic knowledge graph models such as GeoKG, GEKG and STOKG were constructed. Figure 7a displays the statistical information for their nodes and edges. The STEHRG offers richer correlation information than the other models, enhancing node connectivity while maintaining a similar number of nodes. We present a selected subset from 1926 to 1938 to illustrate the structures of the four models. Figure 8b shows the spatiotemporal ontology layer structure of the STEHRG. Figure 8a shows the spatiotemporal process evolution layer and Figure 8c shows the feature situation layer structure of the STEHRG. The feature time evolution chain is hidden in the feature situation layer.
As shown in Figure 9a, GeoKG expresses the spatiotemporal state of objects through location, time, and attributes, effectively demonstrating changes in adjacent states. As shown in Figure 9b, GEKG defines the following six relationships: logic, semantics, evolution, time, participation, and inclusion. It features a hierarchical cubic structure that vertically links different element types and horizontally connects similar ones, with spatiotemporal differences creating evolutionary relationships. Figure 9c presents STOKG, a comprehensive spatiotemporal object knowledge graph consisting of a spatiotemporal ontology layer, spatiotemporal object layer, and dynamic version layer. It utilizes spatiotemporal objects as semantic units to represent various characteristics, including entities, locations, morphologies, associations, and attributes.

4.3. Comparison of Spatiotemporal Processes’ Expressive Capacities in WHU Case

This study posed questions to assess the appropriate organization of geographic data, referencing standard issues in the GeoKG, GEKG, and STOKG models. These questions are framed from six perspectives: time, location, attributes, facts, changes, and reasons, as illustrated in Figure 7b. Graph retrieval was performed using the Cypher language in the Neo4j database to compare the spatiotemporal expression capabilities of the four models, with results presented in Table 1. Based on these findings, we analyzed the accuracy, completeness, and repeatability of the GeoKG, GEKG, STOKG, and the STEHRG models.
(1) Accuracy is a measure of the correctness of a model’s output, that is, the consistency between the predicted results of the model and the actual results.
A c c u r a c y = A N S a c c u r a c y ÷ A N S a l l × 100 %
where A N S a c c u r a c y denotes the number of correct answers. A N S a l l denotes the total number of answers.
(2) Completeness is a measure of the degree to which a model contains all necessary information in its response, that is, whether the output completely covers the required answer or information.
C o m p l e t e n e s s = A N S n e c e s s a r y ÷ A N S a l l n e c e s s a r y × 100 %
where A N S n e c e s s a r y denotes the quantity of necessary information in answers. A N S a l l n e c e s s a r y denotes the quantity of all necessary information in answers.
(3) Repeatability is a measure of the degree to which a model answers repetitive information.
R e p e a t a b i l i t y = A N S R e p e a t a b i l i t y ÷ A N S a l l × 100 %
where A N S R e p e a t a b i l i t y denotes the number of duplicate information in answers. A N S a l l denotes the total number of answers. The accuracy shown in Figure 10a,b, completeness in Figure 10c,d, repeatability in Figure 10e,f.

5. Experiment B: The Evolutionary Process of the Nanjing Presidential Palace Attraction (NJPPA)

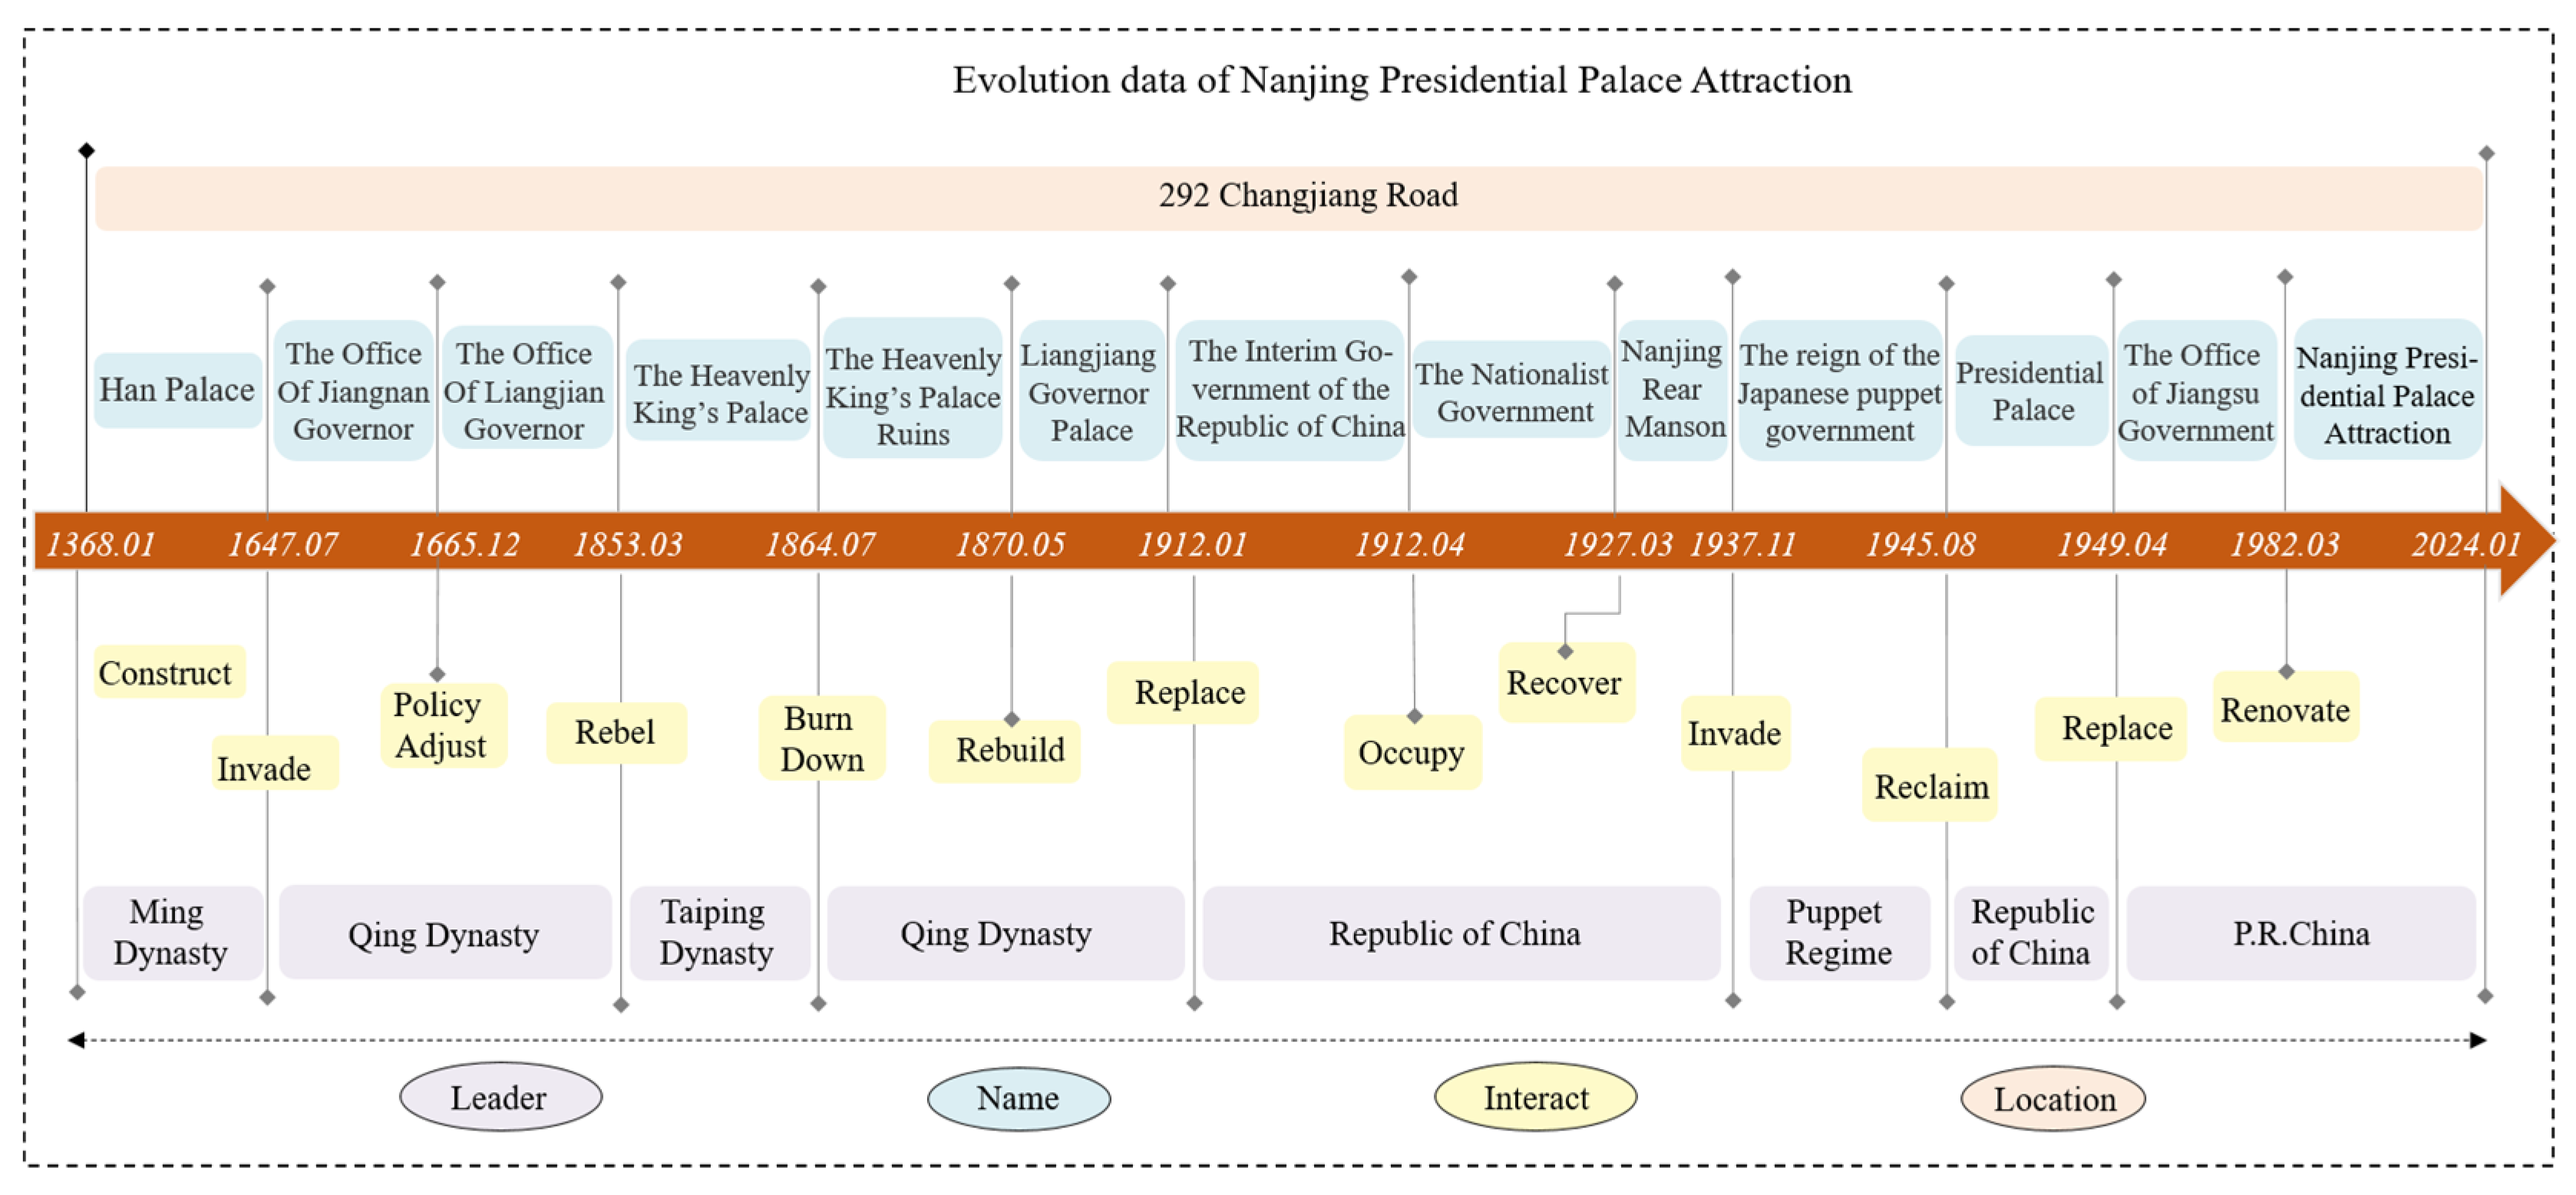
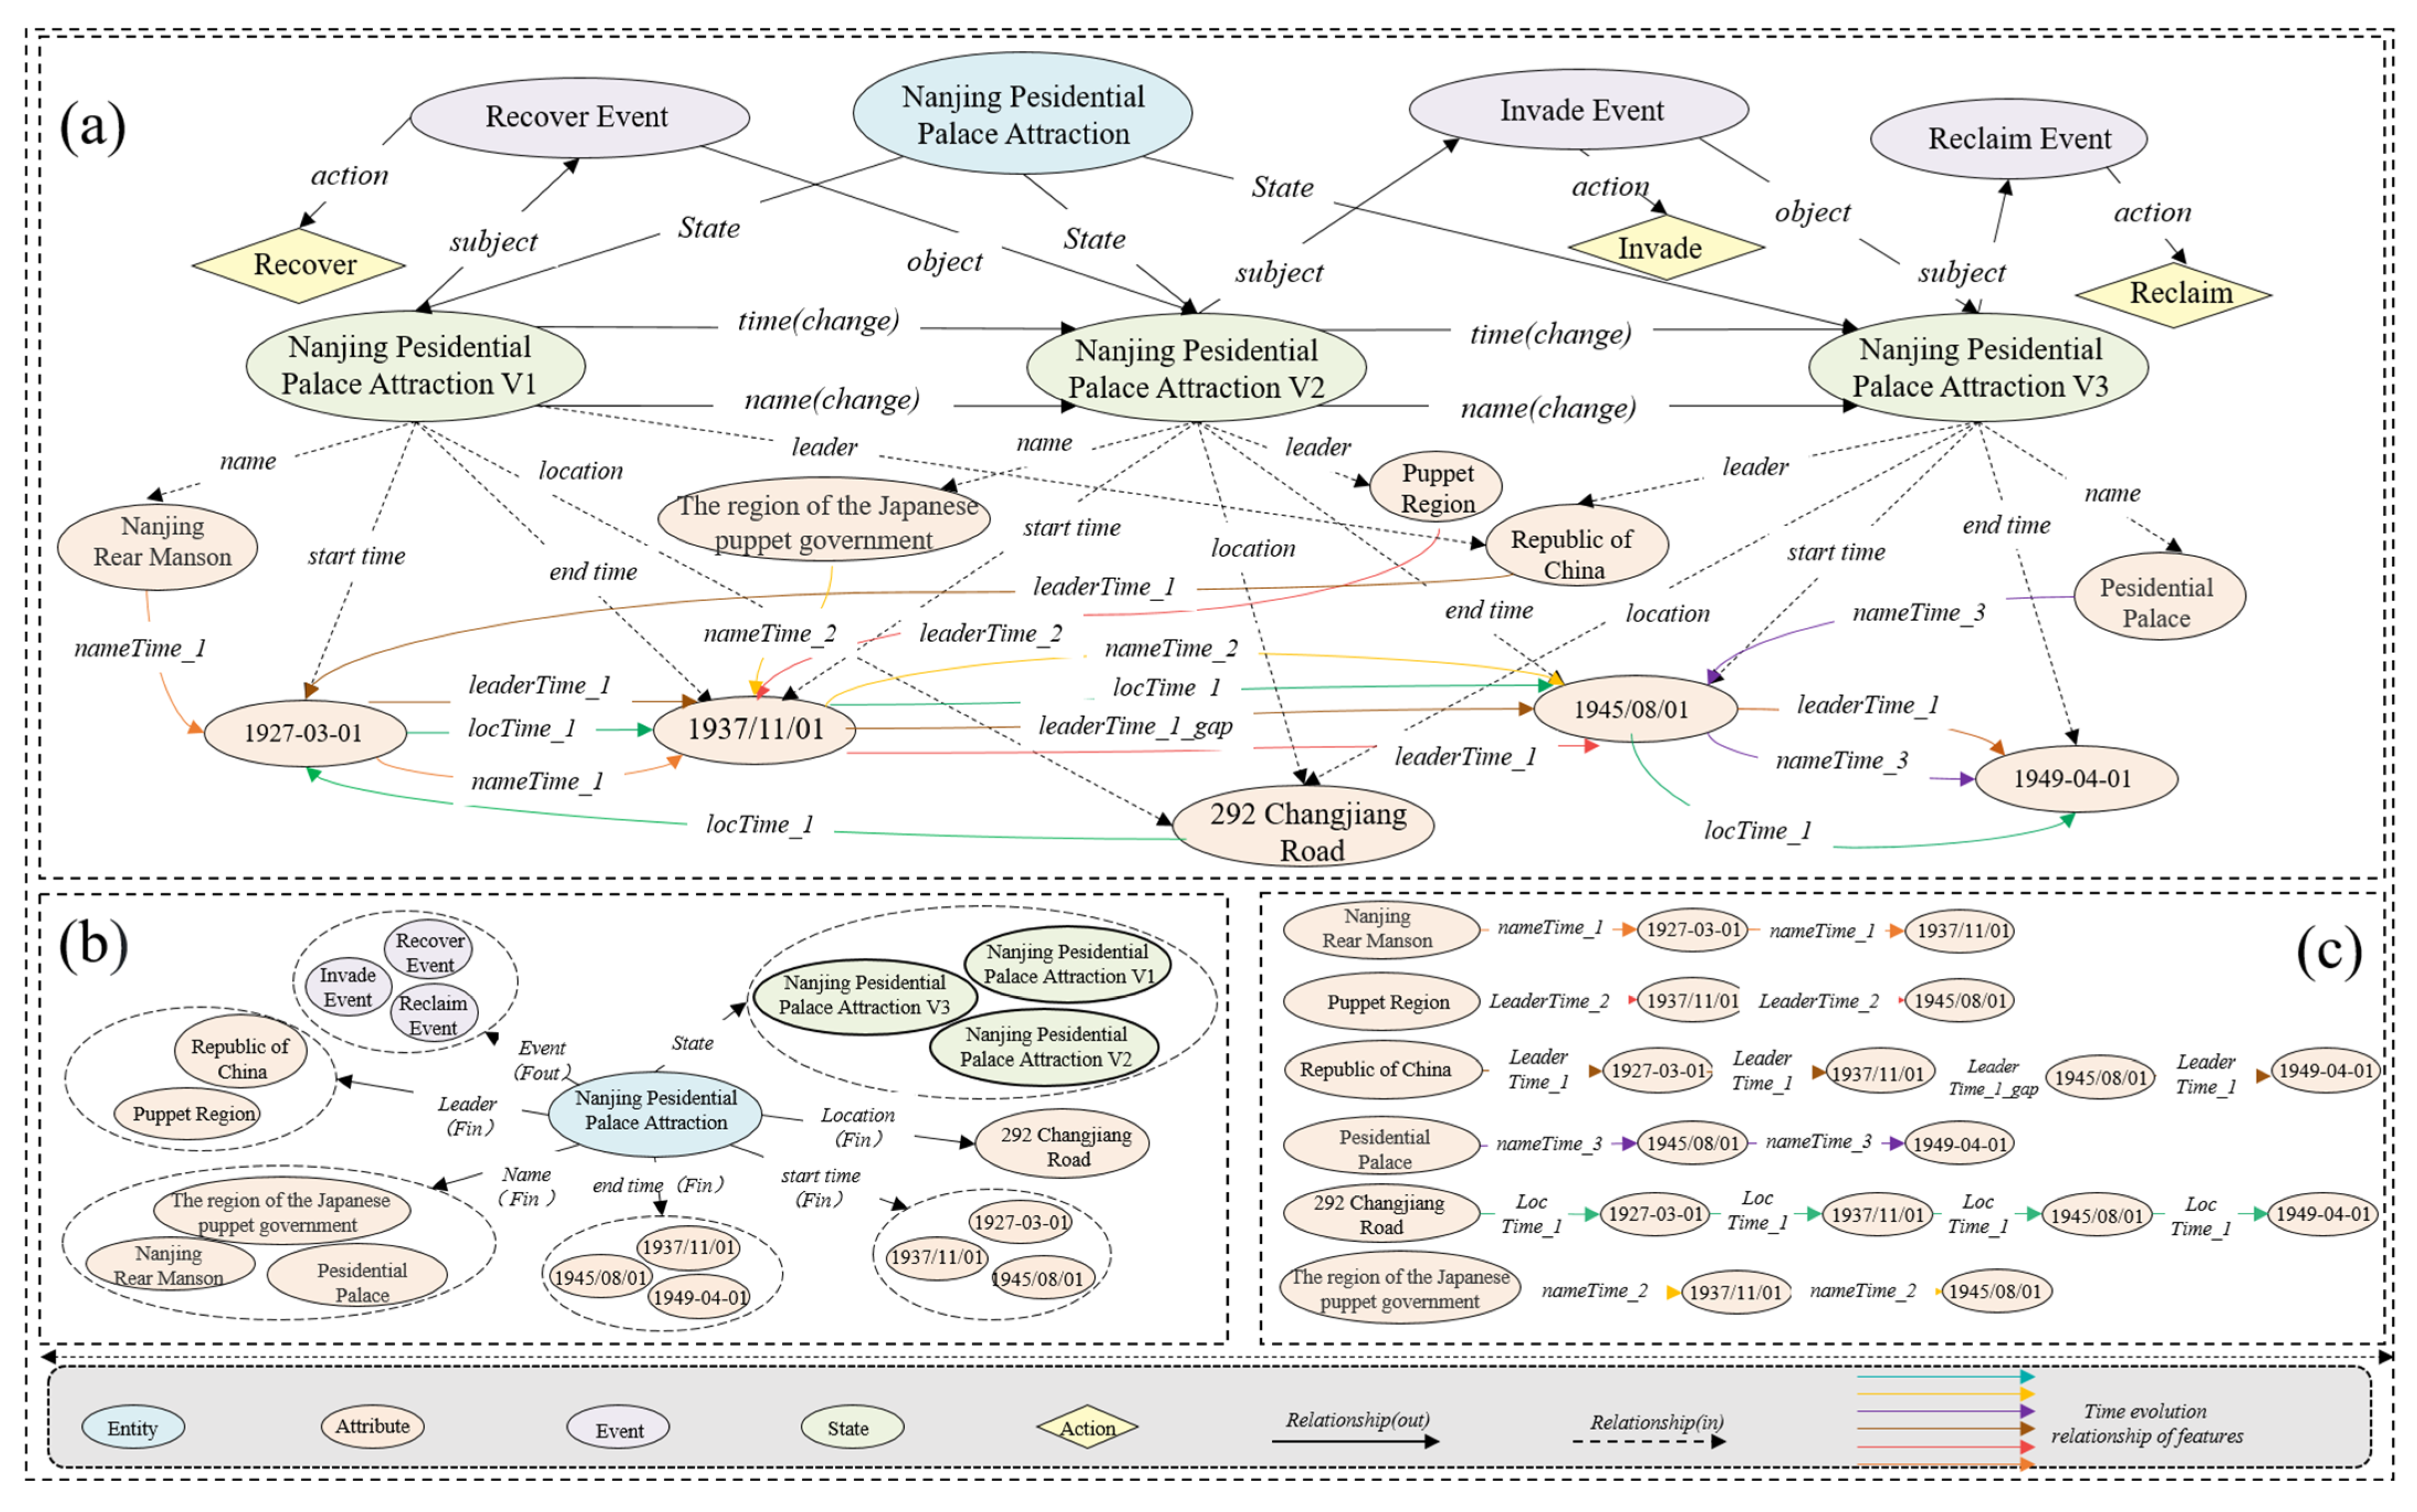
5.1. NJPPA Data Description

Experiment B used NJPPA’s spatiotemporal evolution data for the experiment, sourced from its official website (http://www.njztf.cn/maintain.html, accessed on 27 June 2025). We extracted key entities and relationships to build an evolutionary knowledge graph of NJPPA focused on spatiotemporal entities and their name, location, and leadership attributes. Figure 11 displays NJPPA’s historical data from 1368 to 2024.

5.2. Comparison of Four Model Structures in NJPPA Case

Four graph models, GeoKG, GEKG, STOKG, and STEHRG, were created using NJPPA data from 1368 to 2024, with node and edge statistics in Figure 12a. We selected data from 1927 to 1949 to illustrate the models. Figure 13b presents the spatiotemporal ontology layer of the STEHRG, while Figure 13a depicts its spatiotemporal process evolution, and Figure 13c presents the feature situation layers, where the feature time evolution chain is embedded. Figure 14a, Figure 14b, and Figure 14c display NJPPA evolutionary process models for GeoKG, GEKG, and STOKG, respectively.

5.3. Comparison of Spatiotemporal Processes’ Expressive Capacities in NJPPA Case

Experiment B posed questions from six perspectives: time, location, attributes, facts, changes, and reasons, as illustrated in Figure 12b. Graphical retrieval for each question was conducted using Cypher in the Neo4j database to compare the spatiotemporal expression capabilities of the four models, with results presented in Table 2. Based on these findings, we analyzed the accuracy, completeness, and repeatability of the GeoKG, GEKG, STOKG, and the STEHRG models, with accuracy shown in Figure 15a,b, completeness in Figure 15c,d, and repeatability in Figure 15e,f.

6. Experiment C: The Evolutionary Process of Spatiotemporal Vessel Behaviors

6.1. Data Description

Experiment C used spatiotemporal data from 188 vessels recorded between 00:00 and 24:00 on 4 June 2019, with a sampling interval of 2 h [30]. We extracted key spatiotemporal entities and relationships, including 2256 geo-entity data values, and constructed a spatiotemporal knowledge graph of vessel motion. It focuses on spatiotemporal entities and their size, geographical location, heading, and sea area attributes. The experimental data structure is shown in Table 3.

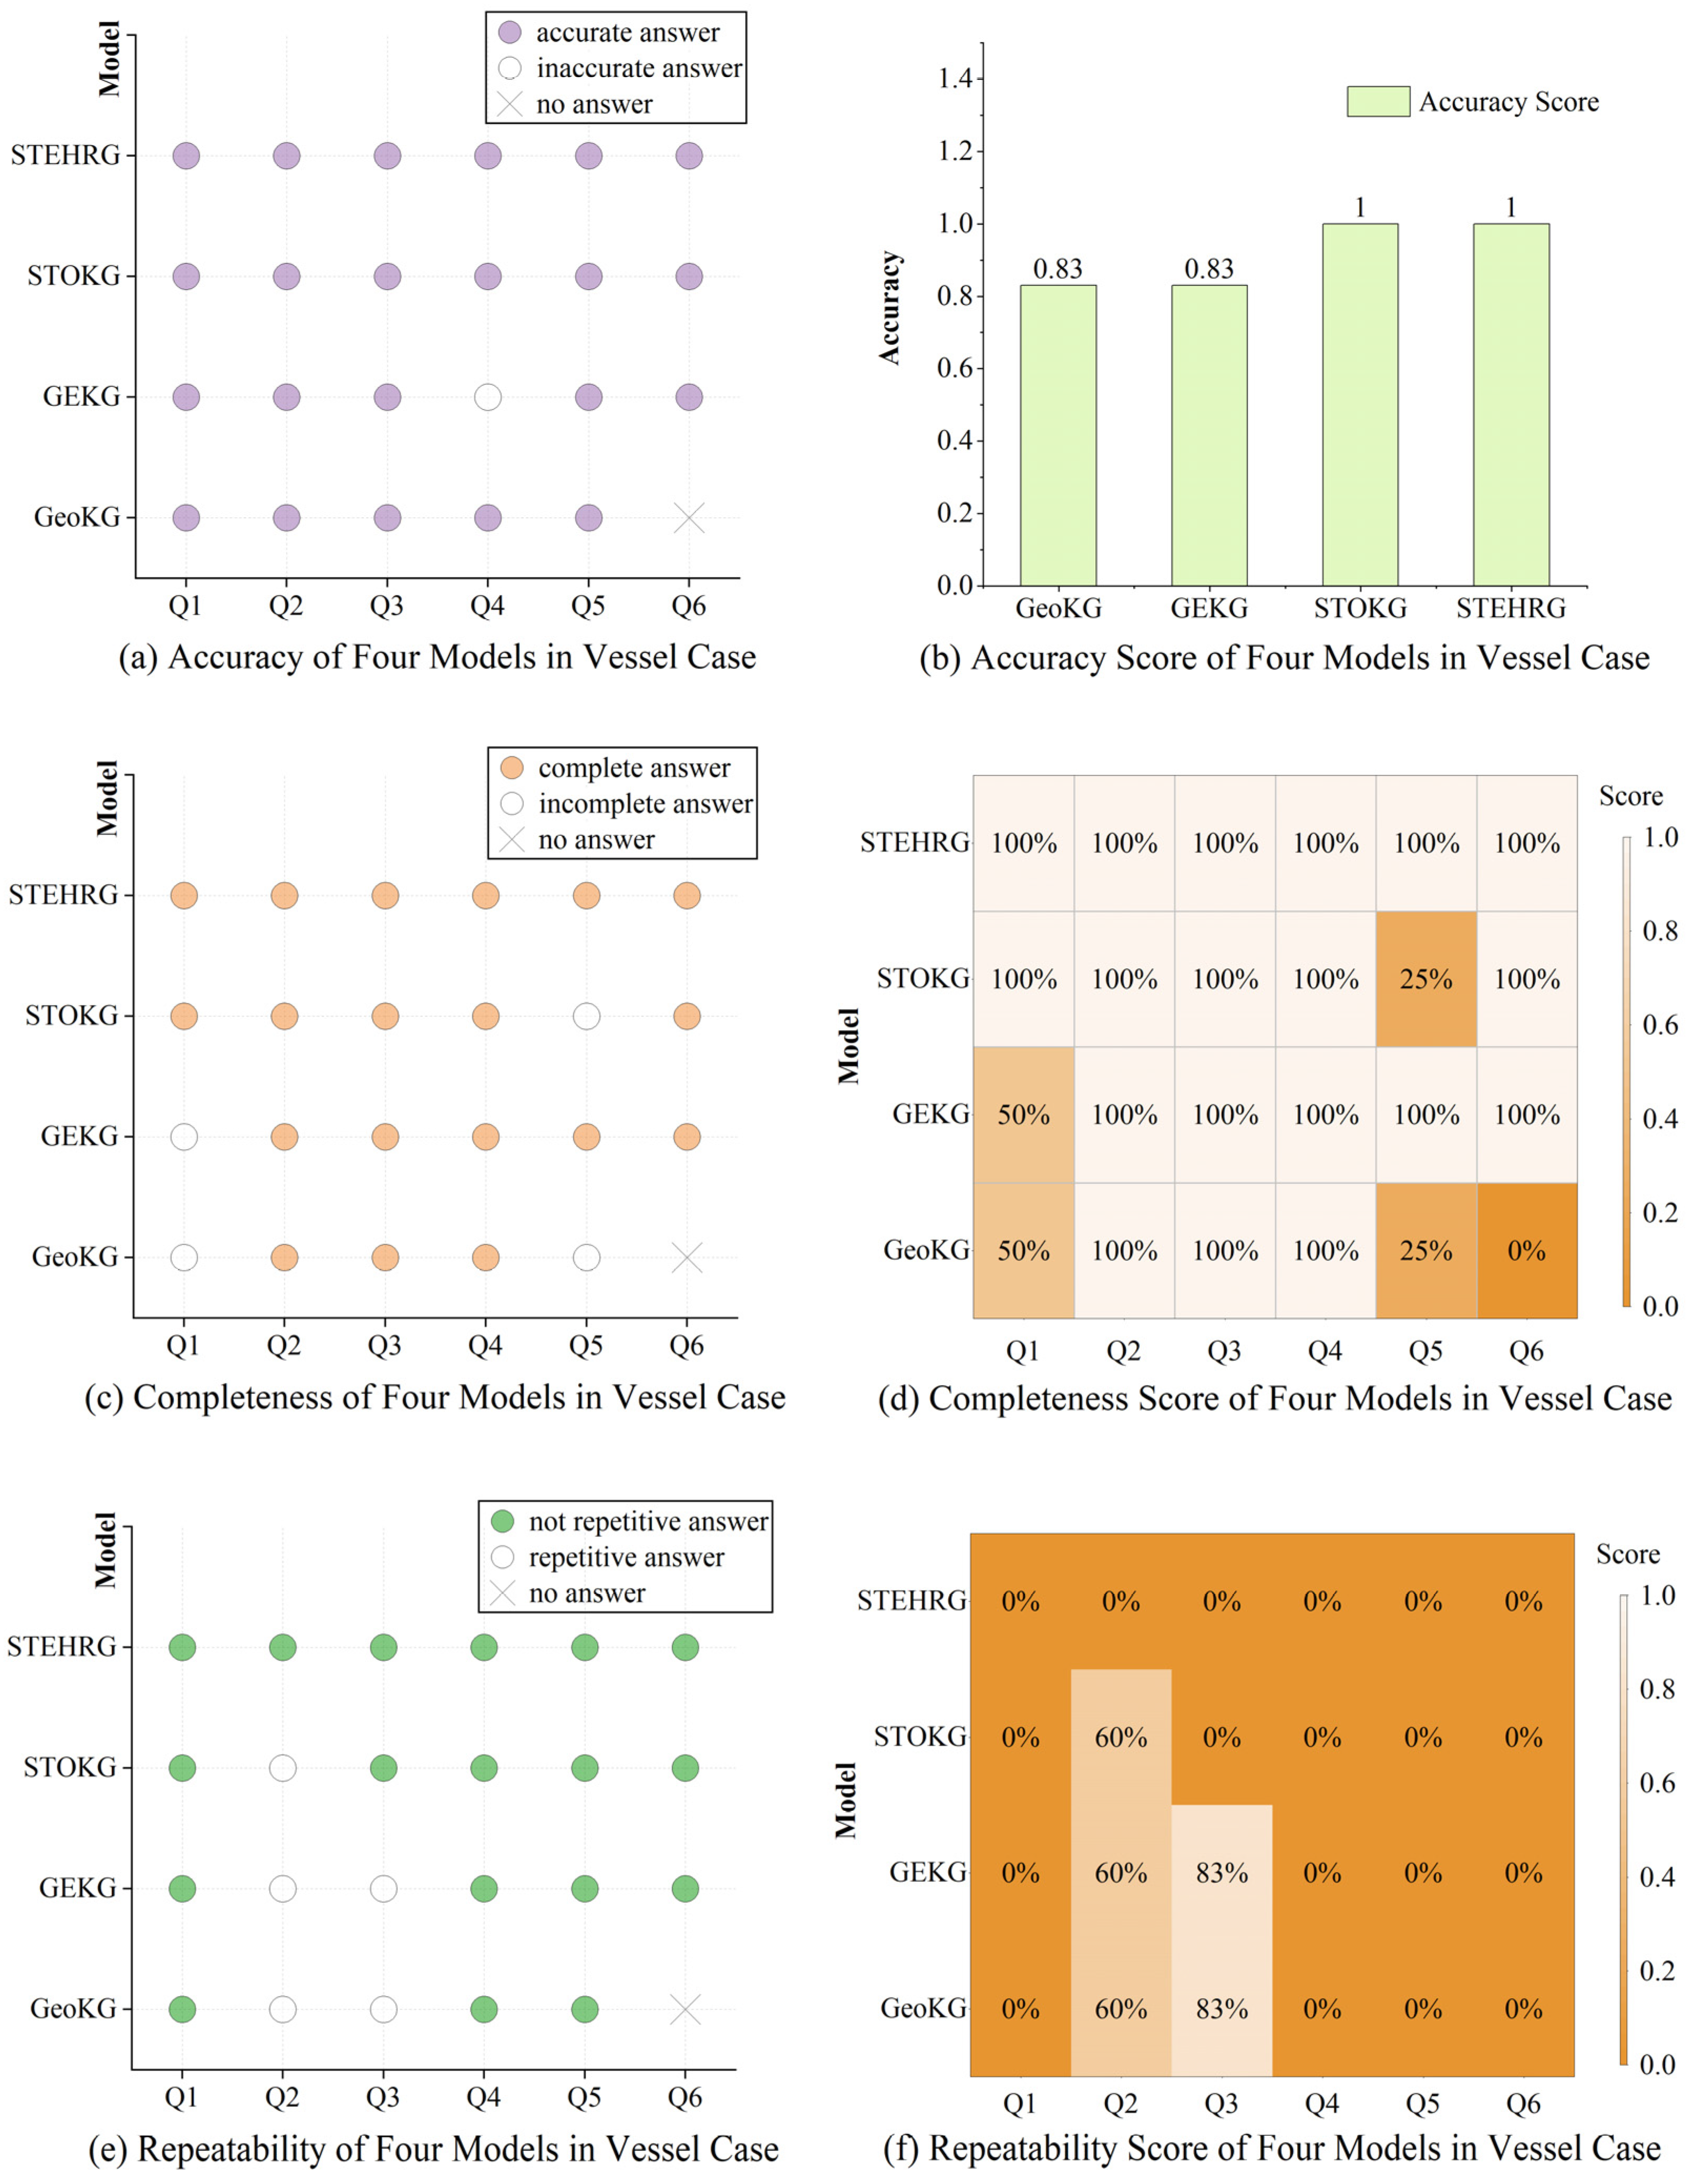
6.2. Comparison of Spatiotemporal Processes’ Expressive Capacities in Vessel Case
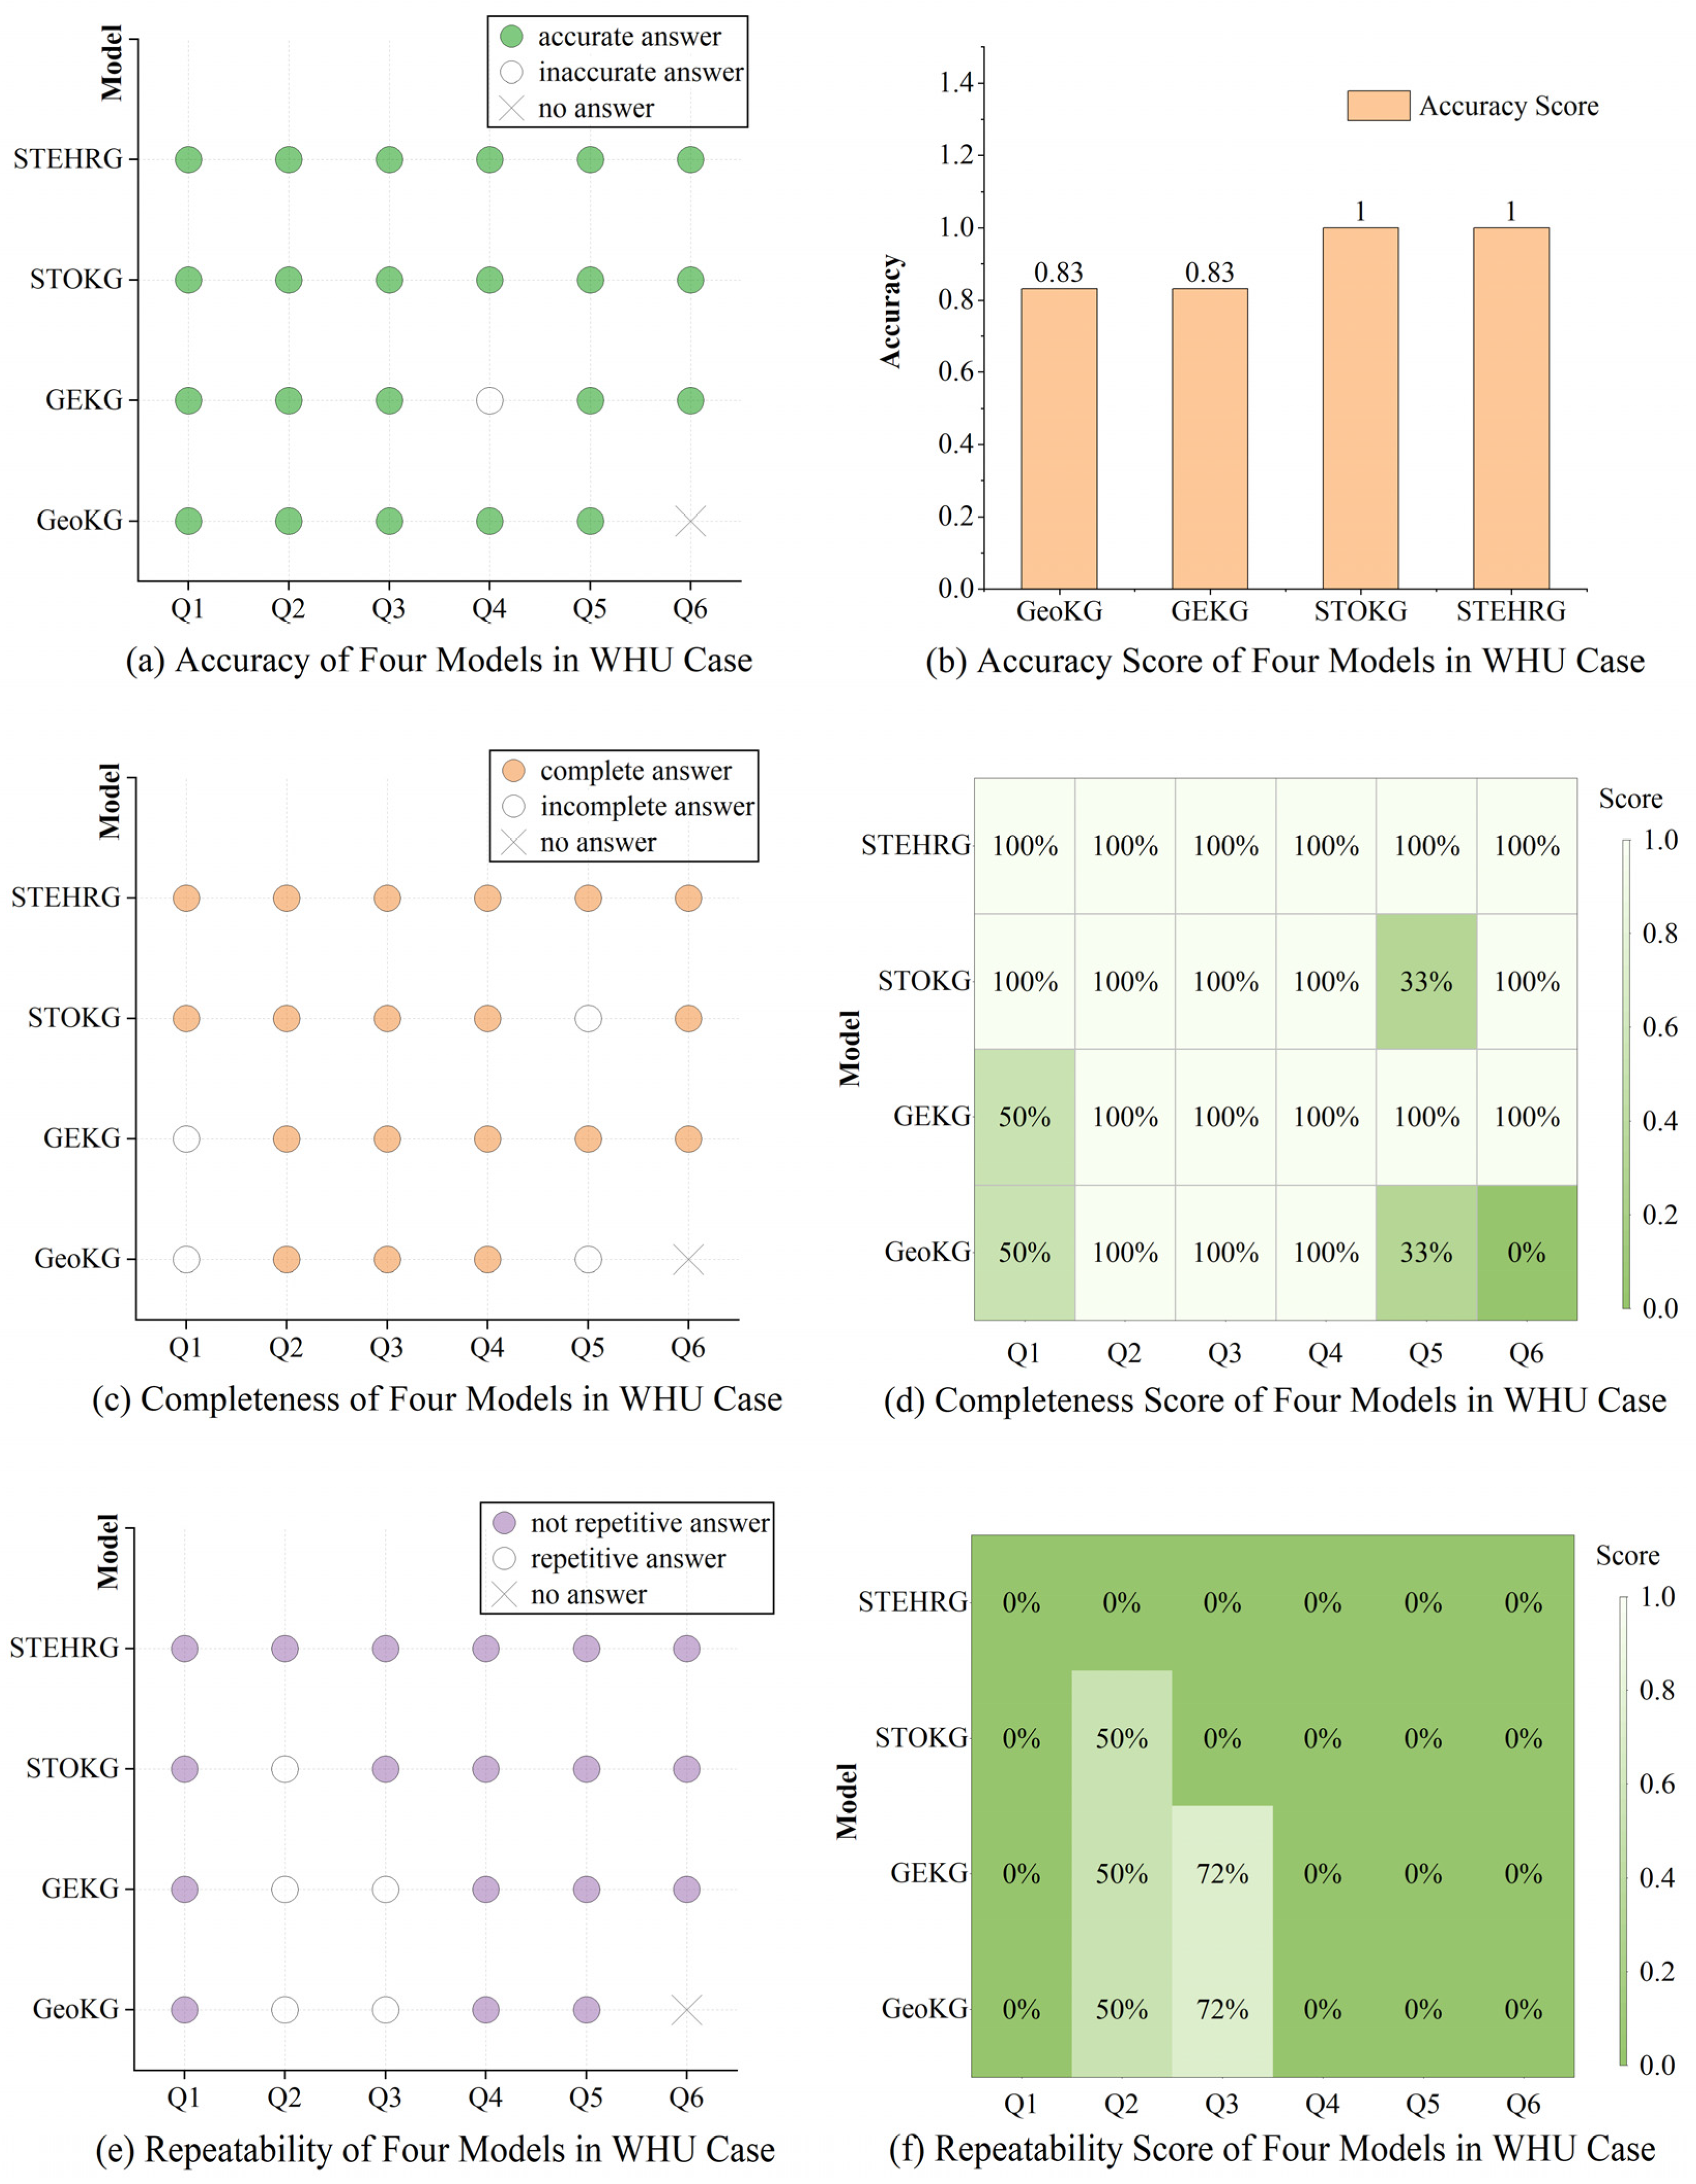
Based on the above experimental data, this paper constructs several geographic knowledge graph models, including existing models such as YAGO, GeoKG, and GEKG, as well as STEHRG. Figure 16a displays statistical information for their nodes and edges.
Experiment C posed questions from six perspectives: time, location, attributes, facts, changes, and reasons, as illustrated in Figure 16b. Graphical retrieval for each question was conducted using Cypher in the Neo4j database to compare the spatiotemporal expression capabilities of the four models, with results presented in Table 4. Based on these findings, we analyzed the accuracy, completeness, and repeatability of the GeoKG, GEKG, STOKG, and the STEHRG models, with accuracy shown in Figure 17a,b, completeness in Figure 17c,d, and repeatability in Figure 17e,f.

7. Result Analysis

Based on the data in Table 1, Table 2 and Table 4, as well as Figure 10, Figure 15 and Figure 17, this paper analyzes the accuracy, completeness, and reproducibility of the experimental results of WHU case, NJPPA case, and Vessel case.

7.1. Accuracy

In terms of accuracy, all four models deliver fully accurate results for the basic spatiotemporal fact queries Q1, Q2, and Q3. Question Q4 focuses on the ability to retrieve geographic entities’ states or versions; however, the GEKG model cannot distinguish between state nodes and geographic entity nodes, which hampers accurate tracking of entity evolution and renders the evolutionary paths ambiguous. For geographic applications, it is crucial to clearly differentiate entity nodes from state nodes and to precisely describe their relationships. Question Q5 addresses changes in geographic entities. While GeoKG and STOKG can indicate that a change has occurred, they cannot specify the exact attribute changes; the GEKG model treats all attributes at a given time as a single state and only retrieves overall attributes at two time points, resulting in outputs that do not correspond to specific changes and therefore fail to meet the query requirements. Question Q6 involves event representation, which is essential for revealing the underlying causes of state changes. GeoKG lacks the ability to represent events and thus cannot effectively answer such queries. Although GEKG and STOKG incorporate simple event structure models that allow querying event timing and participating entities, they fail to capture the functional relationships between events and entities. Compared with GEKG and STOKG, the STEHRG model produces more accurate query results.

7.2. Completeness

In terms of completeness, the STEHRG and STOKG models outperform GeoKG and GEKG. Regarding the time-related question Q1, the four models differ in their expression of the following temporal attributes: the STEHRG and STOKG cover the entire temporal range of spatiotemporal objects, whereas GeoKG and GEKG only record the start time, resulting in incomplete representations of entity life cycles. For Q5, which focuses on changes during state transitions, GEKG analyzes all attributes before and after the change, while STOKG and GeoKG only identify the types of changes. Leveraging its multidimensional evolution representation, the STEHRG can immediately identify the specific types and values of changes, thus providing more comprehensive information and demonstrating superior capability in depicting the evolutionary process. Question Q6 concerns event information retrieval. Since events are crucial for revealing the underlying causes of state changes, their representation is especially important. GeoKG lacks event representation; GEKG and STOKG only capture the occurrence time of events. In contrast, the STEHRG not only includes events and their new relationships but also explicitly models the interactions between events and entities, resulting in more complete query responses.

7.3. Repetitiveness

In terms of redundancy, the STEHRG performs significantly better than GeoKG, GEKG, and STOKG. Question Q2 retrieves location information within a specified time range, while Q3 focuses on specific features of an entity throughout its entire lifecycle. GeoKG and GEKG treat all attributes of an entity’s state at a given time as a whole; as a result, queries return attributes from all state nodes, leading to high redundancy due to repeated features across different states. For Q3, although STOKG’s object concept layer can provide spatiotemporal features spanning the entire geospatial evolution, it lacks dependence on temporal segments of features, causing repeated responses when querying within a specified time range. The STEHRG addresses this by constructing a temporal evolution chain within its feature context layer, effectively preventing redundant feature queries over time and significantly reducing redundancy in query results. Compared to other models, the STEHRG demonstrates superior performance in minimizing query redundancy.

7.4. Limitations of the STEHRG

Although the spatiotemporal geographic knowledge graph model proposed in this study demonstrates significant advantages in multi-level spatiotemporal semantic representation and dynamic evolution capabilities, several limitations remain. First, the model relies on the quality and completeness of spatiotemporal data, and uncertainties in real-world data may affect the accuracy of inference results. Secondly, while the STEHRG model maintains a similar number of nodes compared to other models, it incorporates a greater number of edges. As the data scale expands, this results in increased computational complexity, which presents a noteworthy consideration for the model’s scalability and performance. These issues warrant further consideration and improvement in future research.

8. Conclusions

This study proposes a Spatiotemporal Evolution Hierarchical Representation Graph (STEHRG), which is used to systematically represent the spatiotemporal evolutionary process of geographic entities. The main innovations include the following: (1) based on graph theory methods, the STEHRG models the spatiotemporal evolution of geographic entities at different scales and abstract levels, which can clearly reveal the spatiotemporal relationships and evolution trajectories of entities. At the same time, the model introduces the concept of finite state machine (FSM) to structurally represent the state transition process of spatiotemporal objects, further enhancing its ability to characterize dynamic evolution; (2) the mechanism for representing the relationship between events and entities is expanded, revealing in depth the correlation and interaction between the two; and (3) in response to the shortcomings of existing models in continuously tracking the evolution and avoiding duplicate retrieval, a feature evolution chain has been designed to manage the lifecycle of entity spatiotemporal features. Theoretical analysis and experimental results both indicate that the STEHRG is significantly superior to existing models such as GeoKG, GEKG, and STOKG in expressing and dynamically inferring spatiotemporal evolutionary processes, providing strong support for knowledge representation, spatiotemporal analysis, and inference of spatiotemporal processes. As spatiotemporal data expands, the STEHRG model will require efficient storage and maintenance solutions. Future research will focus on developing effective distributed storage mechanisms for complex data processing and analysis.

Author Contributions

Conceptualization, Feng Yuan and Penglin Zhang; Methodology, Feng Yuan and Penglin Zhang; Data curation, Feng Yuan, Yu Zhang, and Anni Wang; Writing—original draft, Feng Yuan; Writing—review and editing, Penglin Zhang, Qi Zhang, and Yu Zhang; Software, Feng Yuan; Validation, Yu Zhang, and Anni Wang; Supervision, Penglin Zhang. All authors have read and agreed to the published version of the manuscript.

Funding

This research was funded by the National Key Research and Development Program of China [grant 2022YFC3006305] and the National Key Research and Development Program of China [grant 2023YFF0611904].

Data Availability Statement

The experimental code and results that support the findings of this study are openly available in [figshare] at [https://figshare.com/articles/dataset/Experimental_DATA/25664760].

Conflicts of Interest

The authors declare that they have no known competing financial interests or personal relationships that could have appeared to influence the work reported in this paper.

References

  1. Ayall, T.A.; Liu, H.; Zhou, C.; Seid, A.M.; Gereme, F.B.; Abishu, H.N.; Yacob, Y.H. Graph Computing Systems and Partitioning Techniques: A Survey. IEEE Access 2022, 10, 118523–118550. [Google Scholar] [CrossRef]
  2. Yao, X.; Li, G.; Xia, J.; Ben, J.; Cao, Q.; Zhao, L.; Ma, Y.; Zhang, L.; Zhu, D. Enabling the Big Earth Observation Data via Cloud Computing and DGGS: Opportunities and Challenges. Remote Sens. 2019, 12, 62. [Google Scholar] [CrossRef]
  3. Drusch, M.; Del Bello, U.; Carlier, S.; Colin, O.; Fernandez, V.; Gascon, F.; Hoersch, B.; Isola, C.; Laberinti, P.; Martimort, P.; et al. Sentinel-2: ESA’s Optical High-Resolution Mission for GMES Operational Services. Remote Sens. Environ. 2012, 120, 25–36. [Google Scholar] [CrossRef]
  4. Chen, B.Y.; Yuan, H.; Li, Q.; Shaw, S.-L.; Lam, W.H.K.; Chen, X. Spatiotemporal data model for network time geographic analysis in the era of big data. Int. J. Geogr. Inf. Sci. 2015, 30, 1041–1071. [Google Scholar] [CrossRef]
  5. Zhu, L.; Yu, F.R.; Wang, Y.; Ning, B.; Tang, T. Big Data Analytics in Intelligent Transportation Systems: A Survey. IEEE Trans. Intell. Transp. Syst. 2019, 20, 383–398. [Google Scholar] [CrossRef]
  6. Lin, H.; Chen, M.; Lu, G.; Zhu, Q.; Gong, J.; You, X.; Wen, Y.; Xu, B.; Hu, M. Virtual Geographic Environments (VGEs): A New Generation of Geographic Analysis Tool. Earth-Sci. Rev. 2013, 126, 74–84. [Google Scholar] [CrossRef]
  7. Hao, X.; Ji, Z.; Li, X.; Yin, L.; Liu, L.; Sun, M.; Liu, Q.; Yang, R. Construction and Application of a Knowledge Graph. Remote Sens. 2021, 13, 2511. [Google Scholar] [CrossRef]
  8. Kaplan, G.; Avdan, U. Monthly Analysis of Wetlands Dynamics Using Remote Sensing Data. ISPRS Int. J. Geo-Inf. 2018, 7, 411. [Google Scholar] [CrossRef]
  9. Lü, G.; Batty, M.; Strobl, J.; Lin, H.; Zhu, A.X.; Chen, M. Reflections and speculations on the progress in Geographic Information Systems (GIS): A geographic perspective. Int. J. Geogr. Inf. Sci. 2018, 33, 346–367. [Google Scholar] [CrossRef]
  10. Lin, H.; You, L.; Hu, C.; Chen, M. Prospect of Geo-Knowledge Engineering in the Era of Spatio-Temporal Big Data. Geomat. Inf. Sci. Wuhan Univ. 2018, 43, 2205–2211. [Google Scholar] [CrossRef]
  11. Del Mondo, G.; Rodríguez, M.A.; Claramunt, C.; Bravo, L.; Thibaud, R. Modeling consistency of spatio-temporal graphs. Data Knowl. Eng. 2013, 84, 59–80. [Google Scholar] [CrossRef]
  12. He, Y.; Sheng, Y.; Hofer, B.; Huang, Y.; Qin, J. Processes and events in the centre: A dynamic data model for representing spatial change. Int. J. Digit. Earth 2022, 15, 276–295. [Google Scholar] [CrossRef]
  13. Del Mondo, G.; Peng, P.; Gensel, J.; Claramunt, C.; Lu, F. Leveraging Spatio-Temporal Graphs and Knowledge Graphs: Perspectives in the Field of Maritime Transportation. ISPRS Int. J. Geo-Inf. 2021, 10, 541. [Google Scholar] [CrossRef]
  14. Wang, S.; Zhang, X.; Ye, P.; Du, M.; Lu, Y.; Xue, H. Geographic Knowledge Graph (GeoKG): A Formalized Geographic Knowledge Representation. ISPRS Int. J. Geo-Inf. 2019, 8, 184. [Google Scholar] [CrossRef]
  15. Zhang, X.; Huang, Y.; Zhang, C.; Ye, P. Geoscience Knowledge Graph (GeoKG): Development, construction and challenges. Trans. GIS 2022, 26, 2480–2494. [Google Scholar] [CrossRef]
  16. Zheng, K.; Xie, M.H.; Zhang, J.B.; Xie, J.; Xia, S.H. A knowledge representation model based on the geographic spatiotemporal process. Int. J. Geogr. Inf. Sci. 2021, 36, 674–691. [Google Scholar] [CrossRef]
  17. Zhao, X.; Cao, Y.; Wang, J.; Fan, X.; Chen, M. A hierarchical spatio-temporal object knowledge graph model for dynamic scene representation. Trans. GIS 2023, 27, 1992–2016. [Google Scholar] [CrossRef]
  18. Park, N.; Liu, F.; Mehta, P.; Cristofor, D.; Faloutsos, C.; Dong, Y. EvoKG: Jointly Modeling Event Time and Network Structure for Reasoning over Temporal Knowledge Graphs. In Proceedings of the Fifteenth ACM International Conference on Web Search and Data Mining, Temple, Arizona, 15 February 2022. [Google Scholar] [CrossRef]
  19. Tanon, T.P.; Weikum, G.; Suchanek, F. YAGO 4: A Reason-able Knowledge Base. In Proceedings of the Semantic Web: 17th International Conference, ESWC 2020, Heraklion, Greece, 31 May–4 June 2020; pp. 583–596. [Google Scholar]
  20. Vrandečić, D.; Krötzsch, M. Wikidata: A free collaborative knowledgebase. Commun. ACM 2014, 57, 78–85. [Google Scholar] [CrossRef]
  21. Lehmann, J.; Isele, R.; Jakob, M.; Jentzsch, A.; Kontokostas, D.; Mendes, P.N.; Hellmann, S.; Morsey, M.; van Kleef, P.; Auer, S.; et al. DBpedia—A large-scale, multilingual knowledge base extracted from Wikipedia. Semant. Web 2015, 6, 167–195. [Google Scholar] [CrossRef]
  22. Tasnim, M.; Collarana, D.; Graux, D.; Orlandi, F.; Vidal, M.E. Summarizing Entity Temporal Evolution in Knowledge Graphs. In Proceedings of the 5th Workshop on Managing the Evolution and Preservation of the Data Web, San Francisco, CA, 13 May 2019. [Google Scholar]
  23. He, Y.; Huang, Y.; Sheng, Y.; Su, X.; Zhou, S.; Lei, S.; Wang, X.; Xia, Y.; Chen, Y.; Shen, Z.; et al. SceneKG: A Geo-Scene Based Spatiotemporal Knowledge Representation Framework Considering Geo-Processes. Trans. GIS 2024, 29, e13270. [Google Scholar] [CrossRef]
  24. Mao, W.; Shen, J.; Su, Q.; Liu, S.; Pirasteh, S.; Ishii, K. A Method for Constructing an Urban Waterlogging Emergency Knowledge Graph Based on Spatiotemporal Processes. ISPRS Int. J. Geo-Inf. 2024, 13, 349. [Google Scholar] [CrossRef]
  25. Zhu, Y.; Sun, K.; Wang, S.; Zhou, C.; Lu, F.; Lv, H.; Qiu, Q.; Wang, X.; Qi, Y. An adaptive representation model for geoscience knowledge graphs considering complex spatiotemporal features and relationships. Sci. China Earth Sci. 2023, 66, 2563–2578. [Google Scholar] [CrossRef]
  26. Guan, S.; Cheng, X.; Bai, L.; Zhang, F.; Li, Z.; Zeng, Y.; Jin, X.; Guo, J. What is Event Knowledge Graph: A Survey. IEEE Trans. Knowl. Data Eng. 2022, 35, 7569–7589. [Google Scholar] [CrossRef]
  27. Li, X.; Yang, J.; Guan, X.; Wu, H. An Event-driven Spatiotemporal Data Model (E-ST) Supporting Dynamic Expression and Simulation of Geographic Processes. Trans. GIS 2014, 18, 76–96. [Google Scholar] [CrossRef]
  28. Liu, W.; Li, X.; Rahn, D.A. Storm event representation and analysis based on a directed spatiotemporal graph model. Int. J. Geogr. Inf. Sci. 2015, 30, 948–969. [Google Scholar] [CrossRef]
  29. Wang, M.; Zhang, J.; Cao, Y.; Li, S.; Chen, M. A Study on a Spatiotemporal Entity-Based Event Data Model. ISPRS Int. J. Geo-Inf. 2024, 13, 360. [Google Scholar] [CrossRef]
  30. Han, B.; Qu, T.; Tong, X.; Wang, H.; Liu, H.; Huo, Y.; Cheng, C. AugGKG: A grid-augmented geographic knowledge graph representation and spatio-temporal query model. Int. J. Digit. Earth 2023, 16, 4934–4957. [Google Scholar] [CrossRef]
  31. Zhao, X.; Zhang, J.; Cao, Y.; Yang, F.; Yang, Z.; Fan, X. Spatio-temporal knowledge embedding method considering the lifecycle of geographical entities. Int. J. Appl. Earth Obs. Geoinf. 2024, 131, 103967. [Google Scholar] [CrossRef]
  32. Yan, B. Geographic Knowledge Graph Summarization; IOS Press: Amsterdam, The Netherlands, 2019. [Google Scholar]
  33. Qiu, Q.; Li, H.; Hu, X.; Tian, M.; Ma, K.; Zhu, Y.; Sun, K.; Li, W.; Wang, S.; Xie, Z. A Knowledge-Guided Spatio-Temporal Correlation Measure Considering Rules and Dependency Syntax for Knowledge Graph Adaptive Representation. Trans. GIS 2024, 29, e13288. [Google Scholar] [CrossRef]
  34. Huang, Y.; Yuan, M.; Sheng, Y.; Min, X.; Cao, Y. Using Geographic Ontologies and Geo-Characterization to Represent Geographic Scenarios. ISPRS Int. J. Geo-Inf. 2019, 8, 566. [Google Scholar] [CrossRef]
  35. Parker, D.C.; Manson, S.M.; Janssen, M.A.; Hoffmann, M.J.; Deadman, P. Multi-Agent Systems for the Simulation of Land-Use and Land-Cover Change: A Review. Ann. Assoc. Am. Geogr. 2008, 93, 314–337. [Google Scholar] [CrossRef]
  36. Hu, D.; Du, X.; Li, L.; Sun, Y.; Zhang, J.; Bai, F. Robust stability mechanism of an artificial ecosystem based on biological mutations and synergies driven by ecological information. Ecol. Model. 2016, 319, 208–217. [Google Scholar] [CrossRef]
  37. You, J.; Huai, Y.; Nie, X.; Chen, Y. Real-time 3D visualization of forest fire spread based on tree morphology and finite state machine. Comput. Graph. 2022, 103, 109–120. [Google Scholar] [CrossRef]
Figure 1. Spatiotemporal Evolution Hierarchical Representation Graph (STEHRG).
Ijgi 14 00252 g001
Figure 2. Spatiotemporal ontology layer.
Ijgi 14 00252 g002
Figure 3. (a) FSM state transition diagram. (b) Spatiotemporal evolution layer.
Ijgi 14 00252 g003
Figure 4. Feature situation layer and feature evolution chains.
Ijgi 14 00252 g004
Figure 5. Query diagram of attribute time evolution chain.
Ijgi 14 00252 g005
Figure 6. Evolution data for WHU.
Ijgi 14 00252 g006
Figure 7. (a) Node and edge statistics for four models in WHU case. (b) Six question types regarding the WHU evolutionary process.
Ijgi 14 00252 g007
Figure 8. Geographic knowledge representation framework in the STEHRG with WHU experimental data. (a) The STEHRG structure. (b) Spatiotemporal ontology layer of the STEHRG. (c) Feature evolution chains.
Ijgi 14 00252 g008
Figure 9. Existing geographic knowledge representation framework with WHU experimental data. (a) GeoKG; (b) GEKG; (c) STOKG.
Ijgi 14 00252 g009
Figure 10. Comparisons of GeoKG, GEKG, STOKG and the STEHRG in terms of accuracy, completeness and repeatability in WHU case. (a) Accuracy; (b) accuracy score; (c) completeness; (d) completeness score; (e) repeatability; (f) repeatability score.
Ijgi 14 00252 g010
Figure 11. Evolution data for NJPPA.
Ijgi 14 00252 g011
Figure 12. (a) Node and edge statistics for four models in NJPPA case. (b) Six question types regarding the NJPPA evolutionary process.
Ijgi 14 00252 g012
Figure 13. Geographic knowledge representation framework in the STEHRG with NJPPA experimental data. (a) The STEHRG structure. (b) Spatiotemporal ontology layer of the STEHRG. (c) Feature evolution chains.
Ijgi 14 00252 g013
Figure 14. Existing geographic knowledge representation framework with NJPPA experimental data. (a) GeoKG; (b) GEKG; (c) STOKG.
Ijgi 14 00252 g014
Figure 15. Comparisons of GeoKG, GEKG, STOKG and the STEHRG in terms of accuracy, completeness and repeatability in NJPPA case. (a) Accuracy; (b) accuracy score; (c) completeness; (d) completeness score; (e) repeatability; (f) repeatability score.
Ijgi 14 00252 g015
Figure 16. (a) Node and edge statistics for four models in vessel cases. (b) Six question types regarding the vessel case.
Ijgi 14 00252 g016
Figure 17. Comparisons of GeoKG, GEKG, STOKG and the STEHRG in terms of accuracy, completeness and repeatability in Vessel case. (a) Accuracy; (b) accuracy score; (c) completeness; (d) completeness score; (e) repeatability; (f) repeatability score.
Ijgi 14 00252 g017
Table 1. The search results for the questions raised in Figure 7b are displayed in bold, and the following content explains each answer in WHU case.
QuestionResults
GeoKGGEKGSTOKGSTEHRG
Q1: When did WHU use its name National Wuchang University?1925/01
<National Wuchang University, State_of_1925/01 >
1925-01-01
<WHU V5, 1925-01-01, National Wuchang University >
1925-01-01, 1926-10-01
<WHU V5, End_time, 1926-10-01 >
<WHU V5, Start_time, 1925-01-01 >
1925-01-01, 1926-10-01
<WHU V5, End_time, 1926-10-01>
<WHU V5, Start_time, 1925-01-01>
Q2: Where was the campus of WHU from 1925 to 1935?Wuchang Dongchangkou
<WHU, 1925-01-01, Wuchang Dongchangkou>
Wuchang Dongchangkou
<WHU, 1926-10-01, Wuchang Dongchangkou>
Wuchang Dongchangkou
<WHU, 1928-07-01, Wuchang Dongchangkou>
Wuchang Luojia Hill
<WHU, 1932-03-01, Wuchang Luojia Hill>
Wuchang Dongchangkou
<WHU V5, 1925-01-01, Location, Wuchang Dongchangkou>
Wuchang Dongchangkou
<WHU V6, 1926-10-01, Location, Wuchang Dongchangkou>
Wuchang Dongchangkou
<WHU V7, 1928-07-01, Location, Wuchang Dongchangkou>
Wuchang Luojia Hill
<WHU V8, 1932-03-01, Location, Wuchang Luojia Hill>
Wuchang Dongchangkou
<WHU V5, 1925-01-01, Location, Wuchang Dongchangkou>
Wuchang Dongchangkou
<WHU V6, 1926-10-01, Location, Wuchang Dongchangkou>
Wuchang Dongchangkou
<WHU V7, 1928-07-01, Location, Wuchang Dongchangkou>
Wuchang Luojia Hill
<WHU V8, 1932-03-01, Location, Wuchang Luojia Hill>
Wuchang Dongchangkou
<Location, Wuchang Dongchangkou>
Wuchang Luojia Hill
<Location, Wuchang Luojia Hill>
Q3: What are the governing units of WHU since its establishment?• <WHU, State_of_1893/01, Qing government>
• <WHU, State_of_1902/10, Qing government>
• <WHU, State_of_1913/07, Republic of China>
• <WHU, State_of_1923/09, Republic of China >
• <WHU, State_of_1925/01, Republic of China >
• <WHU, State_of_1926/10, Republic of China >
• <WHU, State_of_1928/07, Republic of China >
• <WHU, State_of_1932/03, Republic of China >
• <WHU, State_of_1938/01, Republic of China >
• <WHU, State_of_1946/01, Republic of China >
• <WHU, State_of_1949/08, China >
• <WHU V1, Qing government>
• <WHU V2, Qing government>
• <WHU V3, Republic of China>
• <WHU V4, Republic of China>
• <WHU V5, Republic of China>
• <WHU V6, Republic of China>
• <WHU V7, Republic of China>
• <WHU V8, Republic of China>
• <WHU V9, Republic of China>
• <WHU V10, Republic of China>
• <WHU V11, China>
Qing government
<WHU, Leader, Qing government>
Republic of China
<WHU, Leader, Republic of China >
China
<WHU, Leader, China>
Qing government
<WHU, Leader, Qing government>
Republic of China
<WHU, Leader, Republic of China >
China
<WHU, Leader, China>
Q4: How many states did WHU have from 1926 to 1940?State_of_1926/10
<State_of_1926/10, State, WHU >
State_of_1928/07
<State_of_1928/07, State, WHU >
State_of_1932/03
<State_of_1932/03, State, WHU >
State_of_1938/01
<State_of_1938/01, State, WHU >
Wuhan University V6
<WHU V6,1926-10-01>
Wuhan University V7
<WHU V7,1928-07-01>
Wuhan University V8
<WHU V8,1932-03-01>
Wuhan University V9
<WHU V9,1938-01-01>
Wuhan University V6
<WHU, version, WHU V6>
Wuhan University V7
<WHU, version, WHU V7>
Wuhan University V8
<WHU, version, WHU V8>
Wuhan University V9
<WHU, version, WHU V9>
Wuhan University V6
<WHU, State, WHU V6>
Wuhan University V7
<WHU, State, WHU V7>
Wuhan University V8
<WHU, State, WHU V8>
Wuhan University V9
<WHU, State, WHU V9>
Q5: What have been the changes since WHU moved from Wuchang Dongchangkou to Wuchang Luojia Hill?Location_Change
<State_of_1928/07, Location_Change, State_of_1932/03>
Time_Change
<State_of_1928/07, Time_Change, State_of_1932/03>
1928-07-01, Time_Change, 1932-03-01
Wuchang Dongchangkou, Location_Change, Wuchang Luojia Hill
<WHU V7, Time, 1928-07-01, Leader, Republic of China, Name, Wuhan National University, Location, Wuchang Dongchangkou>
<WHU V8, Time, 1932-03-01, Leader, Republic of China, Name, Wuhan National University, Location, Wuchang Luojia Hill>
Location_Change
<WHU V7, Location_Change, WHU V8>
Time_Change
<WHU V7, Time_Change, WHU V8>
Wuchang Dongchangkou, Location_Change, Wuchang Luojia Hill
<WHU V7, Location_Change {Vo: “ Wuchang Dongchangkou”, Vt: “Wuchang Luojia Hill”, Vname: “Location”}, WHU V8 >
1928-07-01, Time_Change, 1932-03-01
<WHU V7, Time_Change {Vo: “1928-07-01”, Vt: “1932-03-01”, Vname: “Time”}, WHU V8 >
Q6: Why did WHU change its name to Wuhan National University?• /Restructure Event,1928-07-01
<Restructure Event, Action, Restructure, Time, 1928-07-01>
Restructure Event, 1928-07-01
<Restructure Event, Action, Restructure, Time, 1928-07-01>
Restructure Event, 1928-07-01
<Restructure Event, Action, Restructure, Time, 1928-07-01, Name, National Wuchang Zhongshan University, Wuhan National University >
Note: WHU is Wuhan University.
Table 2. The search results for the questions raised in Figure 12b are displayed in bold, and the following content explains each answer in NJPPA. case.
QuestionResults
GeoKGGEKGSTOKGSTEHRG
Q1: When did the NJPPA use its name the Nationalist Government?1927/04
<The Nationalist Government, State_of_1927/04>
1927-04-01
<NJPPA V9, 1927-04-01, The Nationalist Government>
1927-04-01, 1937-12-01
<NJPPA V9, End_time, 1937-12-01>
<NJPPA V9, Start_time, 1927-04-01>
1927-04-01, 1937-12-01
<NJPPA V9, End_time, 1937-12-01>
<NJPPA V9, Start_time, 1927-04-01>
Q2: Where was the address of the NJPPA from 1912 to 1927 during the Republic of China period?292 Changjiang Road
<1 January 1912, 292 Changjiang Road>
292 Changjiang Road
<1 April 1912, 292 Changjiang Road >
292 Changjiang Road
< 1 April 1927, 292 Changjiang Road >
292 Changjiang Road
<NJPPA V7, 292 Changjiang Road>
292 Changjiang Road
<NJPPA V8, 292 Changjiang Road >
292 Changjiang Road
< NJPPA V9, 292 Changjiang Road >
292 Changjiang Road
<NJPPA V7, 292 Changjiang Road>
292 Changjiang Road
<NJPPA V8, 292 Changjiang Road >
292 Changjiang Road
<NJPPA V9, 292 Changjiang Road >
292 Changjiang Road
<Location, 292 Changjiang Road>
Q3: What are the governing units of NJPPA since its establishment?• <State_of_1368/01, Ming Dynasty>
• <State_of_1647/01, Qing Dynasty>
• <State_of_1665/07, Qing Dynasty>
• <State_of_1853/03, Taiping Dynasty>
• <State_of_1864/01, Qing Dynasty>
• <State_of_1870/01, Qing Dynasty>
• <State_of_1912/01, Republic of China>
• <State_of_1912/04, Republic of China>
• <State_of_1927/04, Republic of China>
• <State_of_1937/12, Puppet Regime>
• <State_of_1946/05, Republic of China>
• <State_of_1949/04, P.R.China>
• <State_of_1982/01, P.R.China>
• <NJPPA V1, Ming Dynasty>
• <NJPPA V2, Qing Dynasty >
• <NJPPA V3, Qing Dynasty >
• <NJPPA V4, Taiping Dynasty >
• <NJPPA V5, Qing Dynasty >
• <NJPPA V6, Qing Dynasty >
• <NJPPA V7, Republic of China >
• <NJPPA V8, Republic of China >
• <NJPPA V9, Republic of China >
• <NJPPA V10, Puppet Regime >
• <NJPPA V11, Republic of China >
• <NJPPA V12, P.R.China >
• <NJPPA V13, P.R.China >
Ming Dynasty
<NJPPA, Leader, Ming Dynasty>
Qing Dynasty
<NJPPA, Leader, Qing Dynasty>
Taiping Dynasty
<NJPPA, Leader, Taiping Dynasty>
Republic of China
<NJPPA, Leader, Republic of China>
Puppet Regime
<NJPPA, Leader, Puppet Regime>
P.R.China
<NJPPA, Leader, P.R.China>
Ming Dynasty
<NJPPA, Leader, Ming Dynasty>
Qing Dynasty
<NJPPA, Leader, Qing Dynasty>
Taiping Dynasty
<NJPPA, Leader, Taiping Dynasty>
Republic of China
<NJPPA, Leader, Republic of China>
Puppet Regime
<NJPPA, Leader, Puppet Regime>
P.R.China
<NJPPA, Leader, P.R.China>
Q4: How many states did NJPPA have from 1926 to 1946State_of_1927/04
<State_of_1927/04, State, NJPPA>
State_of_1937/12
<State_of_1937/12, State, NJPPA >
State_of_1946/05
<State_of_1946/05, State, NJPPA>
NJPPA V9
<NJPPA V9, 1927-04-01>
NJPPA V10
<NJPPA V10, 1937-12-01>
NJPPA V11
<NJPPA V11, 1946-05-01>
NJPPA V9
<NJPPA, version, NJPPA V9>
NJPPA V10
<NJPPA, version, NJPPA V10>
NJPPA V11
<NJPPA, version, NJPPA V11>
NJPPA V9
<NJPPA, State, NJPPA V9>
NJPPA V10
<NJPPA, State, NJPPA V10>
NJPPA V11
<NJPPA, State, NJPPA V11>
Q5: What changes have occurred in the renaming of NJPPA from the Office of Liangjiang Governor to the Interim Government of the Repub-lic of China?Attribute_Change
<State_of_1870/01, Attribute_Change, State_of_1912/01>
Time_Change
<State_of_1870/01, Time_Change, State_of_1912/01>
1870-05-01, Time_Change, 1912-01-01
Qing Dynasty, Attribute_Change, Republic of China
<NJPPA V6, Time, 1870-05-01, Leader, Qing Dynasty, Location, 292 Changjiang Road, Name, The Office of Liangjiang Governor>
<NJPPA V7, Time, 1912-01-01, Leader, Republic of China, Location, 292 Changjiang Road, Name, The Interim Government of the Republic of China>
Attribute_Change
<NJPPA V6, Attribute_Change, NJPPA V7 >
Time_Change
<NJPPA V6, Time_Change, NJPPA V7 >
The Office of Liangjiang Governor, Name_Change, The Interim Government of the Republic of China
<NJPPA V6, Name_Change {Vo: “The Office of Liangjiang Governor”, Vname: “Name”, Vt: “The Interim Government of the Republic of China”} NJPPA V7 >
1870-05-01, Time_Change, 1912-01-01
<NJPPA V6, Time_Change {Vo: “1870-05-01”,Vname: “Time”, Vt: “1912-01-01”}, NJPPA V7>
Qing Dynasty, Leader_Change, Republic of China
<NJPPA V6, Leader_Change {Vo: “Qing Dynasty”, Vt: “Republic of China”, Vname: “Leader”}, NJPPA V7>
Q6: Why did NJPPA change its name to The Nationalist Government?• /Recover Event, 1927-04-01
<Recover Event, Action, Recover, 1927-04-01>
Recover Event, 1927-04-01
<Recover Event, Action, Recover, Time, 1927-04-01>
Recover Event, 1927-04-01
<Recover Event, Action, Recover, Time, 1927-04-01, Name, The Nationalist Government, Nanjing Rear Manson>
Note: NJPPA is Nanjing Presidential Palace Attraction.
Table 3. Structure of experimental datasets.
DataData1Data2Data2256
Name462810245477002300477024900
Classshipshipship
Time4 June 2019 01:16:004 June 2019 00:50:004 June 2019 00:12:00
Length17172.2143.19
Width427.522.82
Heading347.517.270.7
Sea areaSouth China SeaEastern China SeaPhilippine Sea
Longitude111.109924121.656105137.889830
Latitude20.20731731.33914434.204080
Table 4. The search results for the questions raised in Figure 16b are displayed in bold, and the following content explains each answer in Vessel case.
QuestionResults
GeoKGGEKGSTOKGSTEHRG
Q1: When did entity “477089200” have a heading of 228.5?20:00
<477089200, State_of_20:00, Heading:228.5>
20:00
<477089200, State_of_20:00-21:00, Heading:228.5>
20:00,22:00
<4477089200, 477089200_V10, Heading:228.5, starttime: 20:00:00, endtime: 22:00:00>
20:00,22:00
<4477089200, 477089200_V10, Heading:228.5, starttime: 20:00:00, endtime: 22:00:00>
Q2: Which sea areas did entity “477752300” transit through between 8 AM and 4 PM?Eastern China Sea
<477752300, State_of_8:00, Eastern China Sea>
Eastern China Sea
<477752300, State_of_10:00, Eastern China Sea>
Eastern China Sea
<477752300, State_of_12:00, Eastern China Sea>
Yellow Sea
<477752300, State_of_14:00, Yellow Sea>
Yellow Sea
<477752300, State_of_16:00, Yellow Sea>
Eastern China Sea
<477752300_V4, 8:00, Eastern China Sea>
Eastern China Sea
<477752300_V5, 10:00, Eastern China Sea>
Eastern China Sea
<477752300_V6, 12:00, Eastern China Sea>
Yellow Sea
<477752300_V7, 14:00, Yellow Sea>
Yellow Sea
<477752300_V8, 16:00,Yellow Sea>
Eastern China Sea
<477752300, 477752300_V4, Eastern China Sea>
Eastern China Sea
<477752300, 477752300_V5, Eastern China Sea>
Eastern China Sea
<477752300, 477752300_V6, Eastern China Sea>
Yellow Sea
<477752300, 477752300_V7, Yellow Sea>
Yellow Sea
<477752300, 477752300_V8, Yellow Sea>
Yellow Sea
<seaarea, Yellow Sea>
Eastern China Sea
<seaarea, Eastern China Sea>
Q3: Which sea areas did entity “477752300” pass through during the entire voyage?• <477752300, State_of_0:00, Eastern China Sea>
• <477752300, State_of_2:00, Eastern China Sea>
• <477752300, State_of_4:00, Eastern China Sea>
• <477752300, State_of_6:00, Eastern China Sea>
• <477752300, State_of_8:00, Eastern China Sea>
• <477752300, State_of_10:00, Eastern China Sea>
• <477752300, State_of_12:00, Eastern China Sea>
• <477752300, State_of_14:00, Yellow Sea>
• <477752300, State_of_16:00, Yellow Sea>
• <477752300, State_of_18:00, Yellow Sea>
• <477752300, State_of_20:00, Yellow Sea>
• <477752300, State_of_22:00, Yellow Sea>
• <477752300, 477752300_V0, 0:00, Eastern China Sea>
• <477752300, 477752300_V1, 2:00, Eastern China Sea>
• <477752300, 477752300_V2, 4:00, Eastern China Sea>
• <477752300, 477752300_V3, 6:00, Eastern China Sea>
• <477752300, 477752300_V4, 8:00, Eastern China Sea>
• <477752300, 477752300_V5,10:00, Eastern ChinaSea>
• <477752300, 477752300_V6,12:00, Eastern China Sea>
• <477752300, 477752300_V7, 14:00, Yellow Sea>
• <477752300, 477752300_V8, 16:00, Yellow Sea>
• <477752300, 477752300_V9, 18:00, Yellow Sea>
• <477752300, 477752300_V10, 20:00, Yellow Sea>
• <477752300, 477752300_V11, 22:00, Yellow Sea>
Yellow Sea
<477752300, Yellow Sea>
Eastern China Sea
<477752300, Eastern China Sea>
Yellow Sea
<477752300, Yellow Sea>
Eastern China Sea
<477752300, Eastern China Sea>
Q4: How many states did entity “477089200” have between 8 AM and 12 AM?State_of_12:00
<477089200, state, State_of_12:00>
State_of_10:00
<477089200, state, State_of_10:00>
State_of_8:00
<477089200, state, State_of_8:00>
477089200_V4
<477089200_V4>
477089200_V5
<477089200_V5>
477089200_V6
<477089200_V6>
477089200_V4
<477089200, state, 477089200_V4>
477089200_V5
<477089200, state, 477089200_V5>
477089200_V6
<477089200, state, 477089200_V6>
477089200_V4
<477089200, state, 477089200_V4>
477089200_V5
<477089200, state, 477089200_V5>
477089200_V6
<477089200, state, 477089200_V6>
Q5: What changes occurred to entity “477752300” between 12 PM and 2 PM?Time_Change
<477752300, State_of_12:00, Time_Change, State_of_14:00>
Location_Change
<477752300, State_of_12:00, Location_Change, State_of_ 14:00>
Attribute_Change
<477752300, State_of_12:00, Attribute_Change, State_of_ 14:00>
12:00,Time_Change, 14:00
Eastern China Sea, Attribute _Change, Yellow Sea
357.5, Attribute_Change, 355.5
(122.40972;32.99262),Location_Change, (122.39326;33.30427)
<time:12:00:00, hending:357.5, seaarea:Eastern China Sea, size:(length:261.1 m; width:32.25 m), location:(122.40972;32.99262)>
<time:14:00:00, hending:355.5, seaarea:Yellow Sea, size:(length:261.1 m; width:32.25 m), location: (122.39326;33.30427)>
12:00,Time_Change,14:00
<477752300_V6, Time_Change {‘Vo’: ‘14:00:00’, ‘Vt’: ‘16:00:00’, ‘Vname’: ‘Time’}, 477752300_V7>
Eastern China Sea, Location_Change, Yellow Sea
<477752300_V6, Attribute_Change {‘Vo’: ‘Eastern China Sea’, ‘Vname’: ‘Seaarea’, ‘Vt’: ‘Yellow Sea’}, 477752300_V7>
(122.40972;32.99262), Location_Change, (22.39326;33.30427).
<477752300_V6, Location_Change {‘Vo’: ‘(122.40972;32.99262)’, ‘Vt’: ‘(122.39326;33.30427)’, ‘Vname’: ‘Location’}, 477752300_V7>
357.5, Attribute_Change, 355.5
< 477752300_V6, Attribute_Change {‘Vo’: ‘357.5’, ‘Vname’: ‘Heading’, ‘Vt’: ‘355.5’}, 477752300_V7>
Q6: Why did the heading of entity “477967300” change between 5 PM and 6 PM?-Earthquake Event, 17:46
<Earthquake, Earthquake Event, 17:46>
Earthquake Event, 17:46
<Earthquake, Earthquake Event, 17:46>
Earthquake Event, 17:46
<Earthquake Event, Action, Earthquake, 17:46, Heading, 11.2, 19.1 >
Disclaimer/Publisher’s Note: The statements, opinions and data contained in all publications are solely those of the individual author(s) and contributor(s) and not of MDPI and/or the editor(s). MDPI and/or the editor(s) disclaim responsibility for any injury to people or property resulting from any ideas, methods, instructions or products referred to in the content.

