


Rural Local Landscape Perception Evaluation: Integrating Street View Images and Machine Learning
Abstract
1. Introduction
2. Research Design
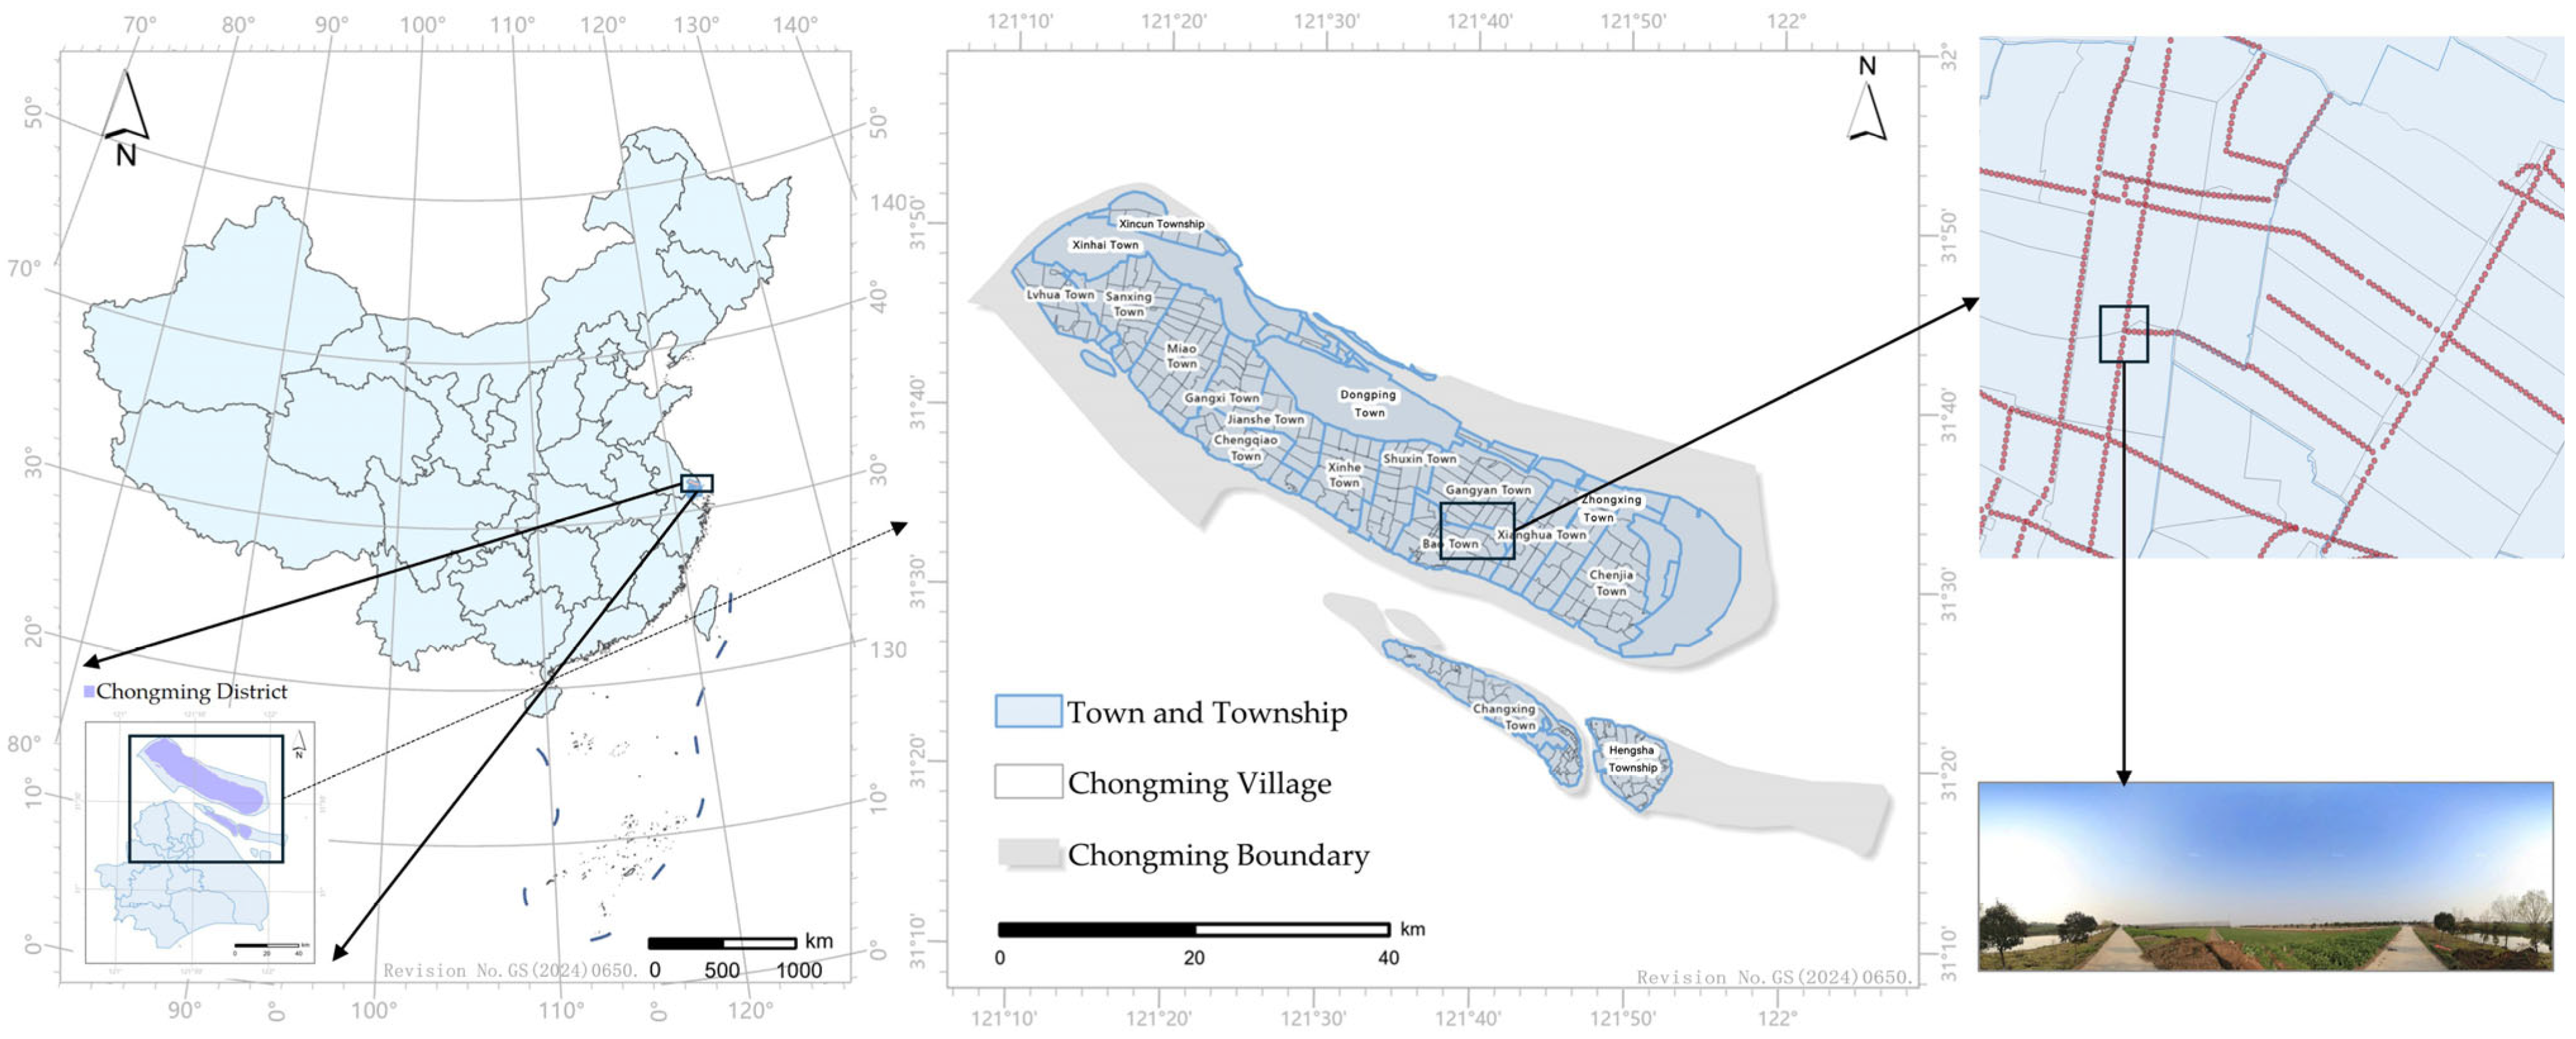
2.1. Study Area
2.2. Data Sources
2.3. Research Methods
2.3.1. Landscape Color Perception Method
2.3.2. Landscape Style Perception Method
- (1)
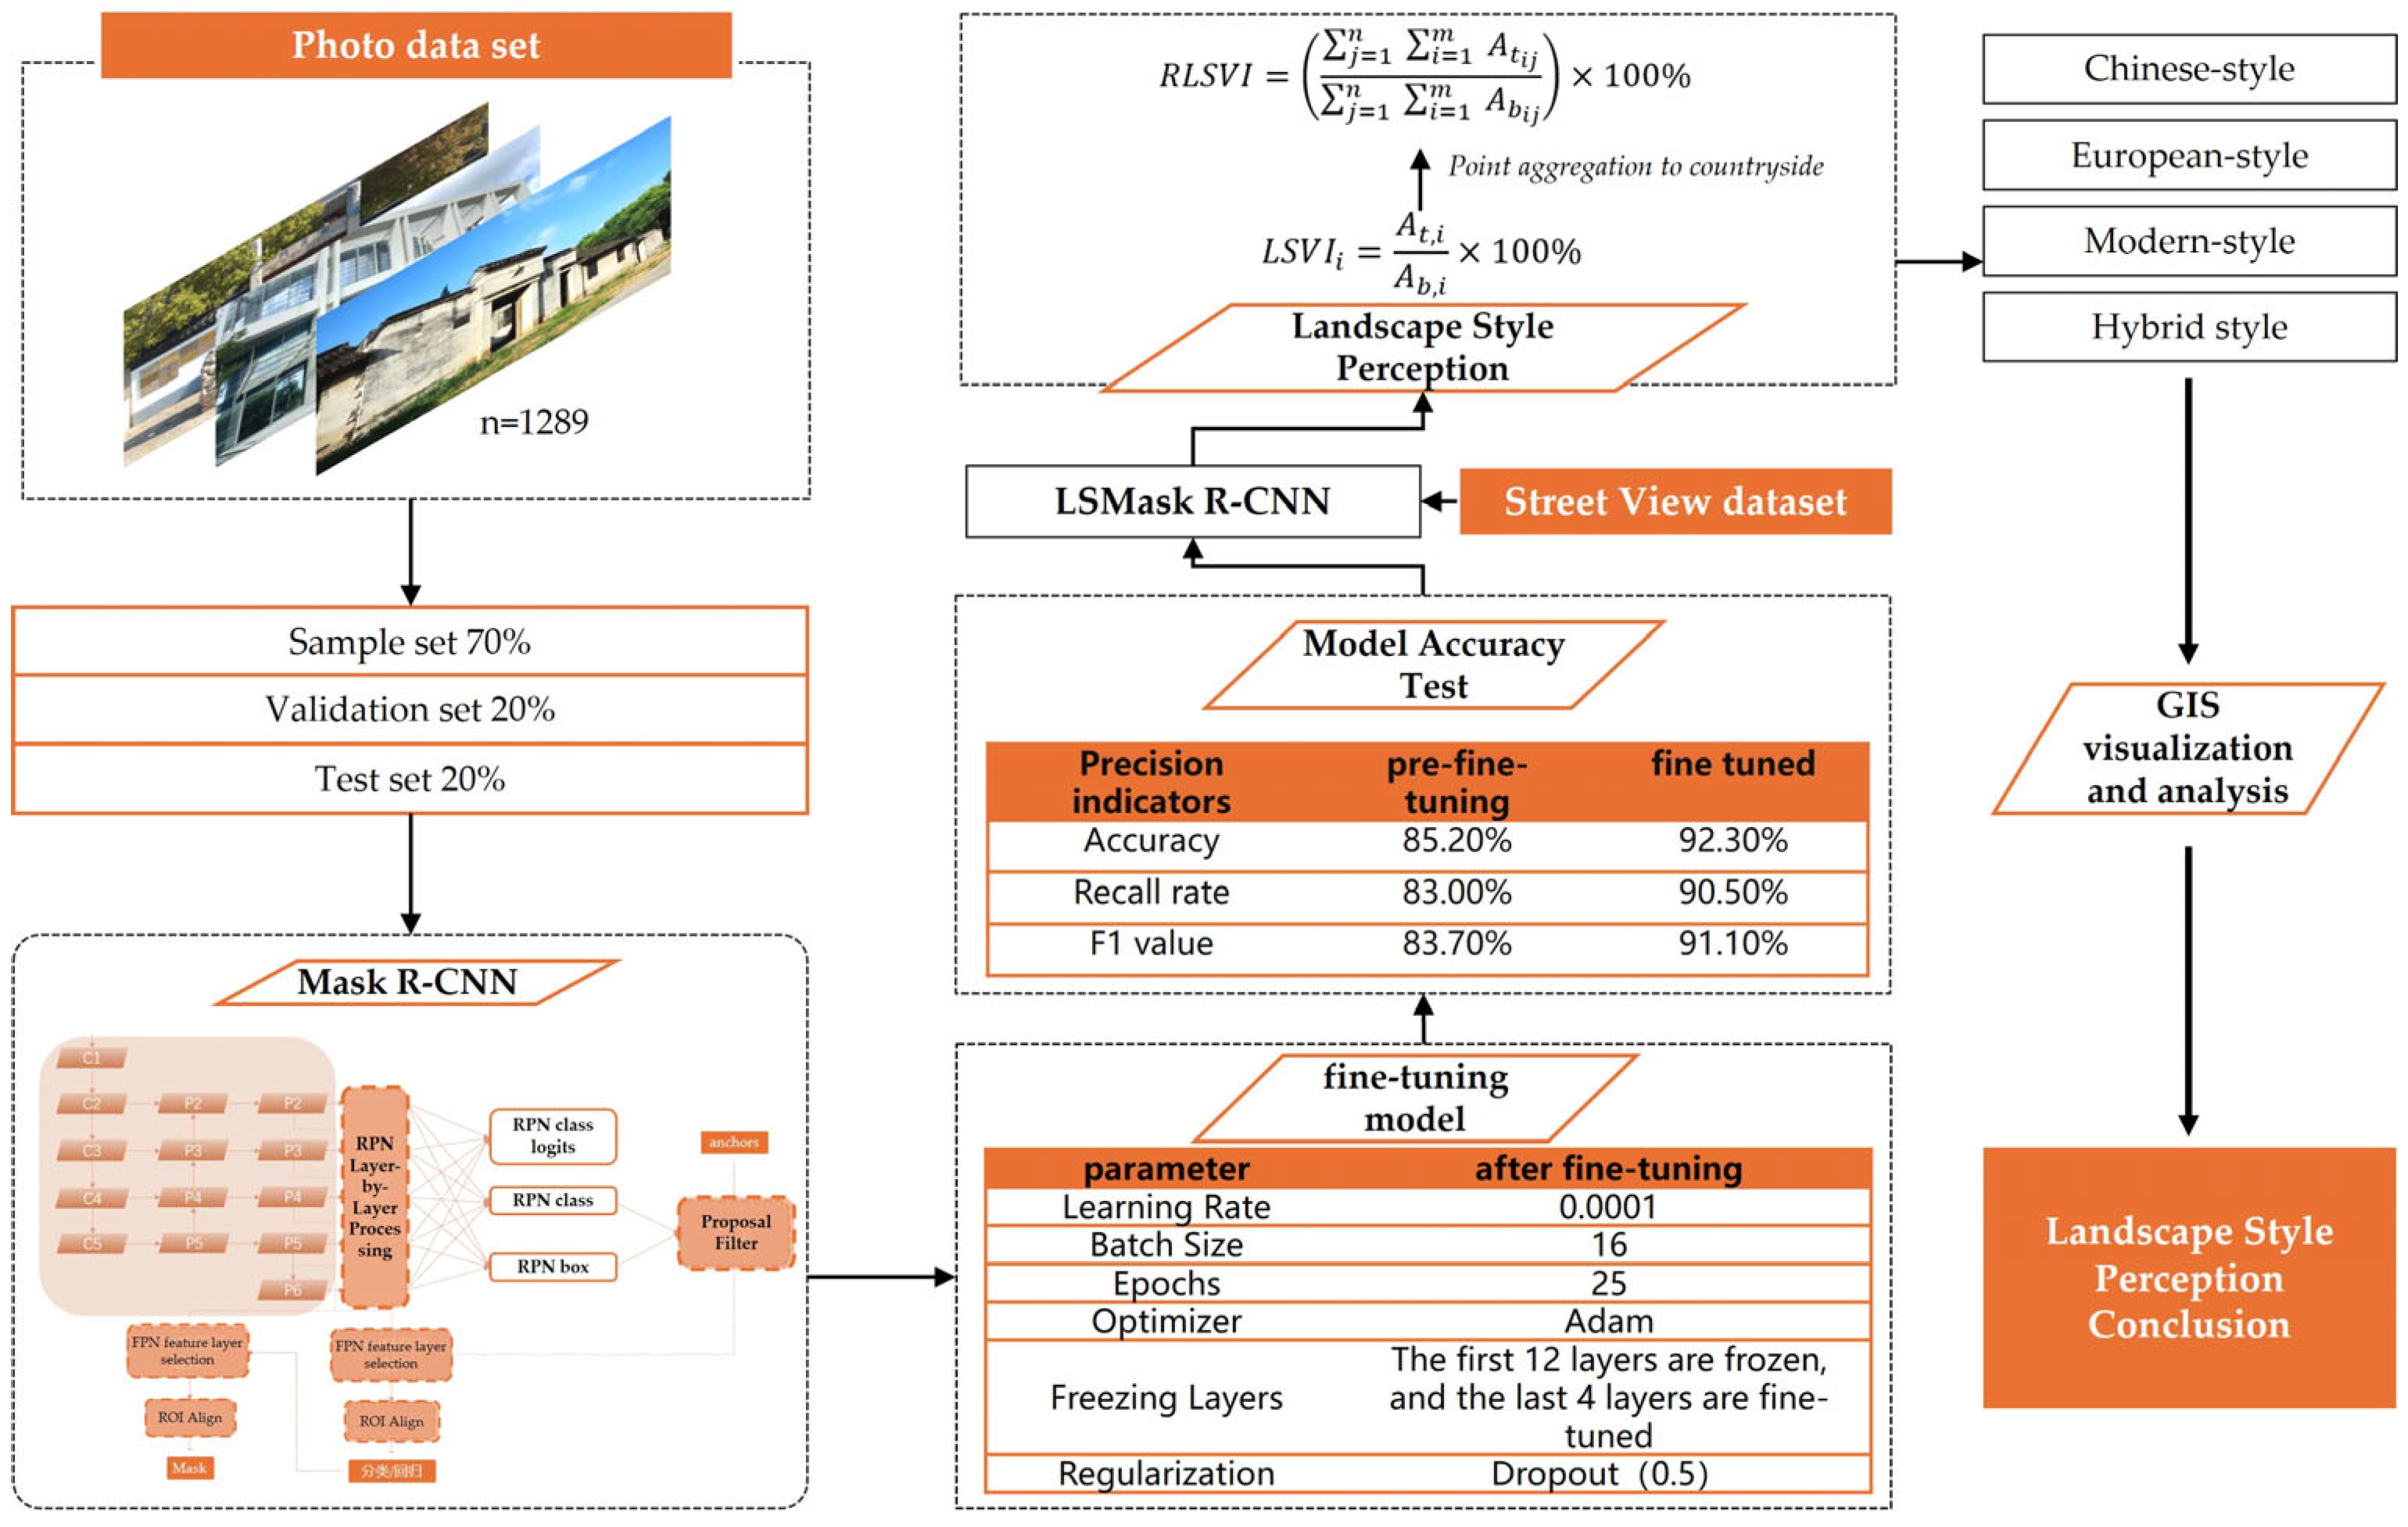
- Classification and annotation. The Labelbox platform was used to manually classify and label buildings and landscape pieces in street view images according to European, Chinese, modern, and hybrid styles. 70% of the dataset was used as the model training sample set, 20% was the verification set of the adjusted and optimized model, and 10% was the test set to evaluate the performance of the model.
- (2)
- Model fine-tuning. The existing Mask R-CNN model was used for transfer learning. The large-scale dataset pre-trained model was taken as the starting point, and the annotated street view image dataset was fine-tuned to construct Landscape Style Mask R-CNN (LSMask R-CNN). The key hyperparameters in the fine-tuning process are shown in Table 2. The comparison of model accuracy before and after fine-tuning is shown in Table 3, indicating that the fine-tuned model was better able to learn landscape style characteristics.
- (3)
- Landscape style perception. The experiment used the trained LSMask R-CNN model to identify the style of Street View images at the sampling points, extract the landscape pixel region at each sampling point, and calculate the proportion of each style. This represented the visual proportion of different landscape styles at each sample point in the image. It was defined as Landscape Style View Index (LSVI) and calculated as follows:
- (4)
- Model validation. To ensure the robustness of style classification, the manually labeled dataset was randomly split into 70% training, 20% validation, and 10% testing sets. Model performance was evaluated using standard classification metrics, including accuracy, precision, recall, and F1-score (Table 3). The results show that the fine-tuned LSMask R-CNN significantly outperformed the pre-trained baseline model across all metrics, indicating its strong generalization ability and effectiveness in capturing diverse rural architectural styles.
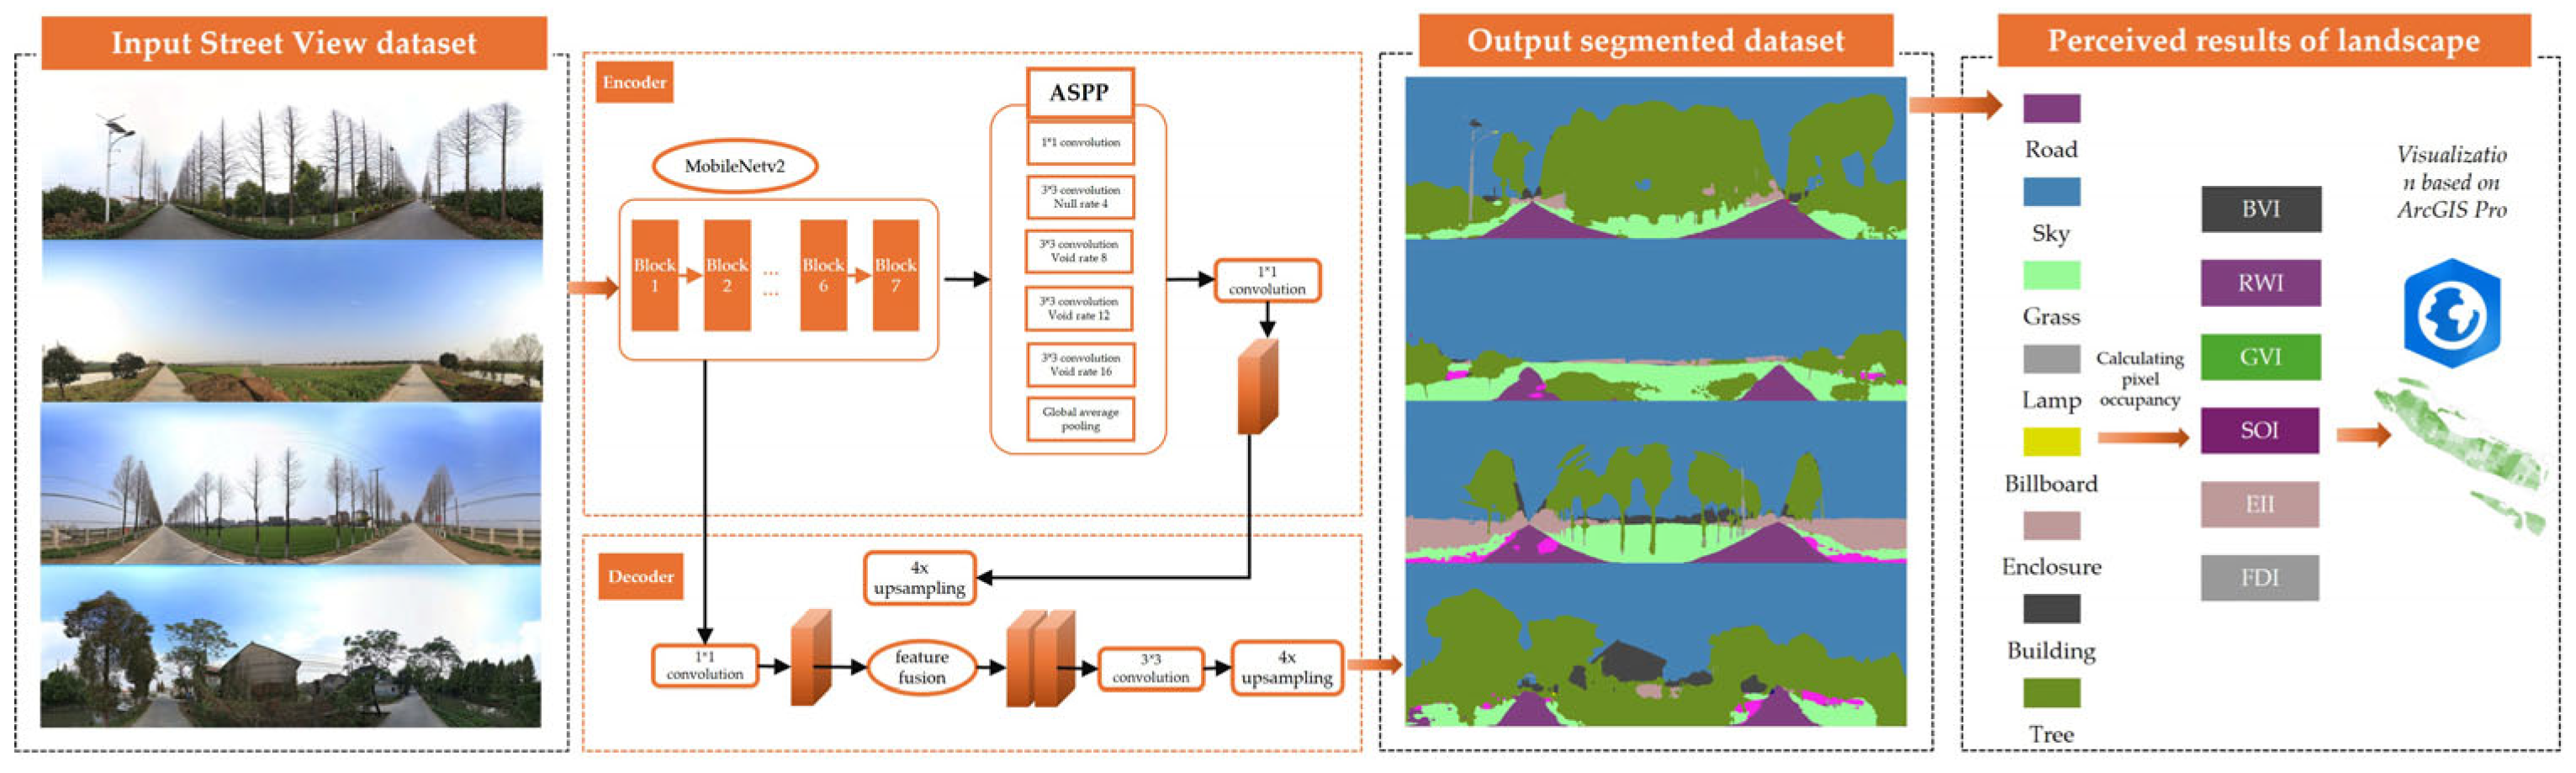
2.3.3. Landscape Element Perception Method
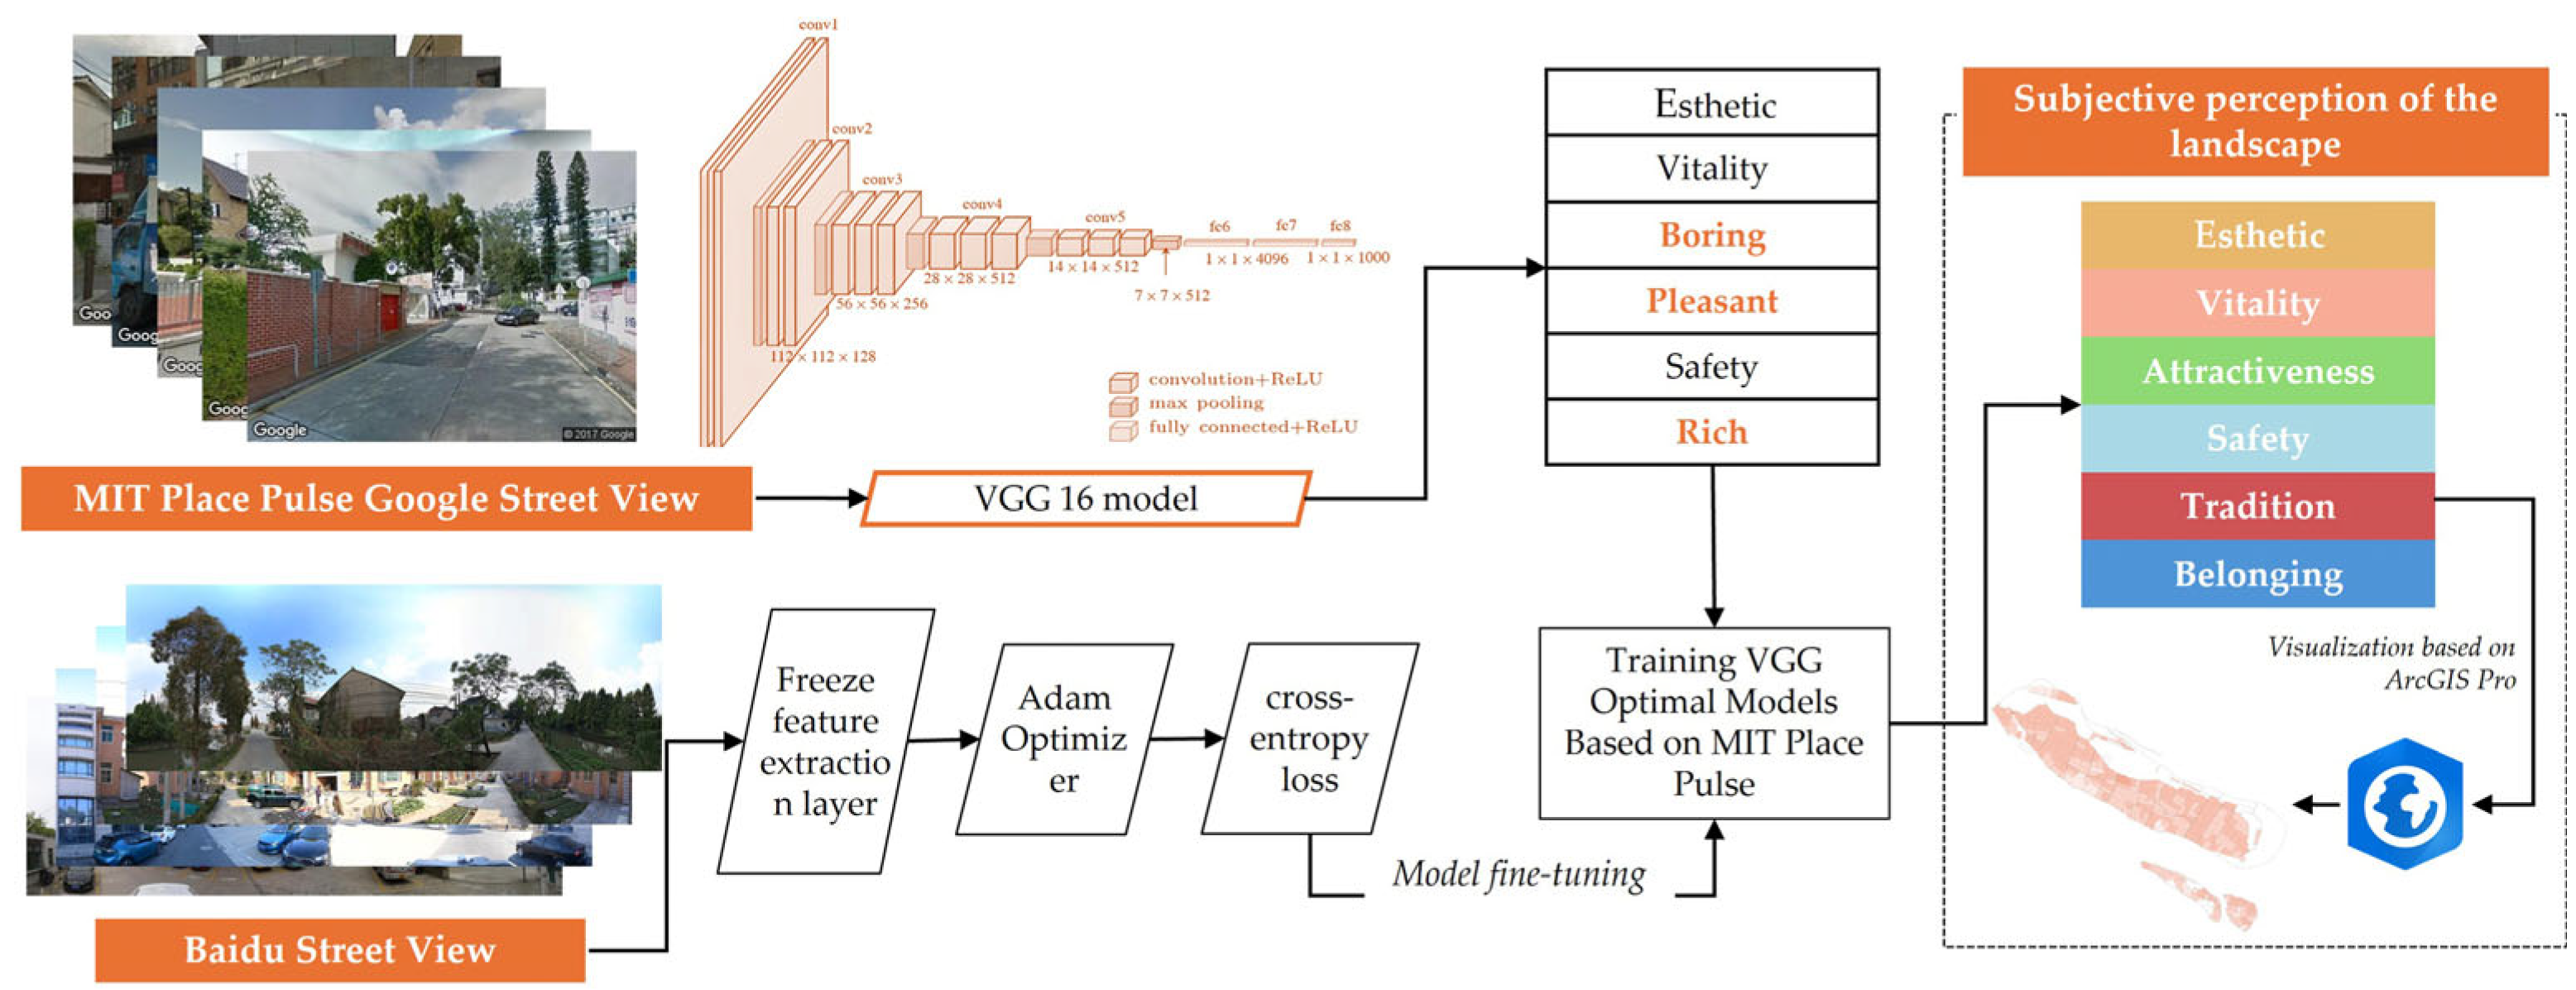
2.3.4. Landscape Subjective Perception Method
- (1)
- Model fine-tuning. Using 2700 Street View images to complete feature extraction pre-training, the fully connected classification layer was adjusted to six label categories. The labels of esthetic, attractiveness, vitality, and safety in the MIT dataset were mapped to the corresponding perceptual labels, and traditions and belonging were also added. Next, the pre-trained feature extraction function was frozen, the classification layer was adjusted, and the model was optimized with a small learning rate to adapt to the new perceptual classification task. The accuracy, precision, recall, and F1 score of each perception index of the model after centralized fine-tuning were verified to range from 78.45% to 87.3% (Table 4), indicating that the transfer learning and fine-tuning model had good applicability for subjective perception classification [20].
- (2)
- Perceptual label prediction. We conducted a perception label prediction of rural Street View images. The prediction results were distributed to villages according to latitude and longitude through the administrative boundary aggregation method, and the distribution proportion of each village in the six perception label categories was calculated. The perception proportion was calculated as follows:
- (3)
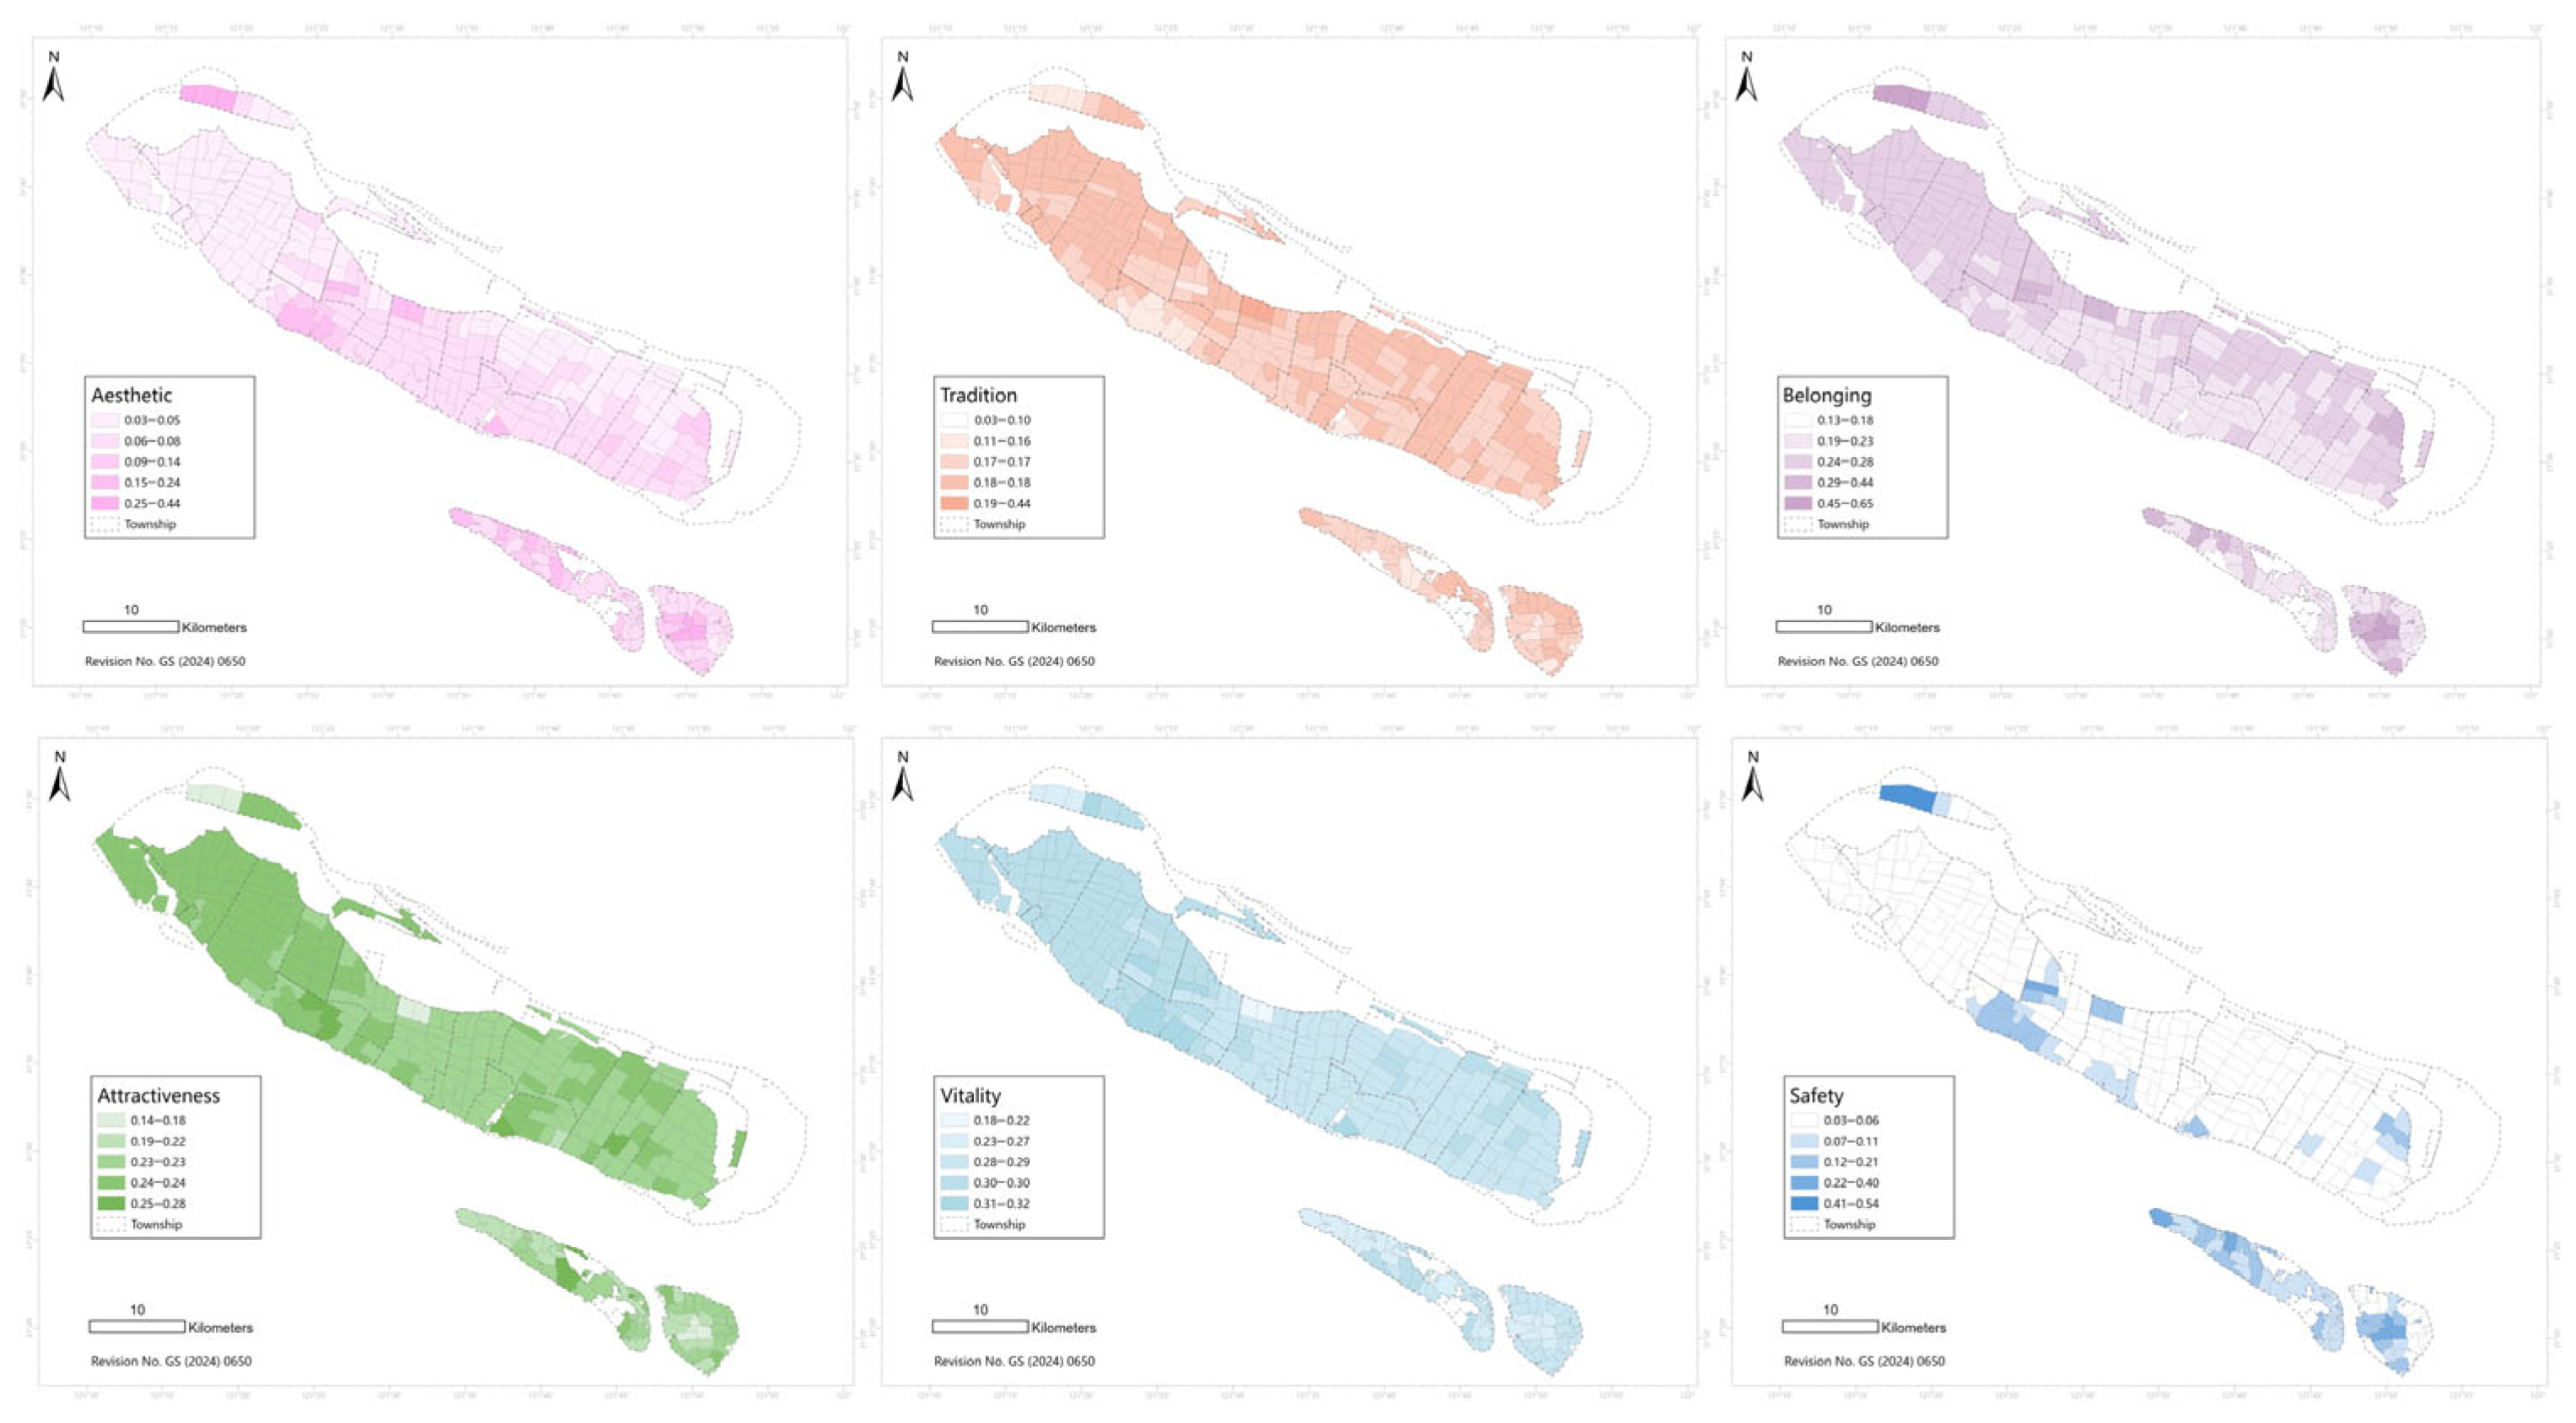
- Indicator visualization. According to the rural perception distribution results, the spatial distribution characteristics of the six rural perception indicator types were generated.
- (4)
- Model validation. For the subjective perception classification task, 2700 Street View images were divided into 70% training, 15% validation, and 15% testing subsets. Model performance was evaluated using accuracy, precision, recall, F1-score, and R2 across six perception labels (Table 4). The results indicate that the model has a generally stable predictive performance, with relatively lower scores for tradition and vitality, likely due to subjective variability and limited training samples in those categories.
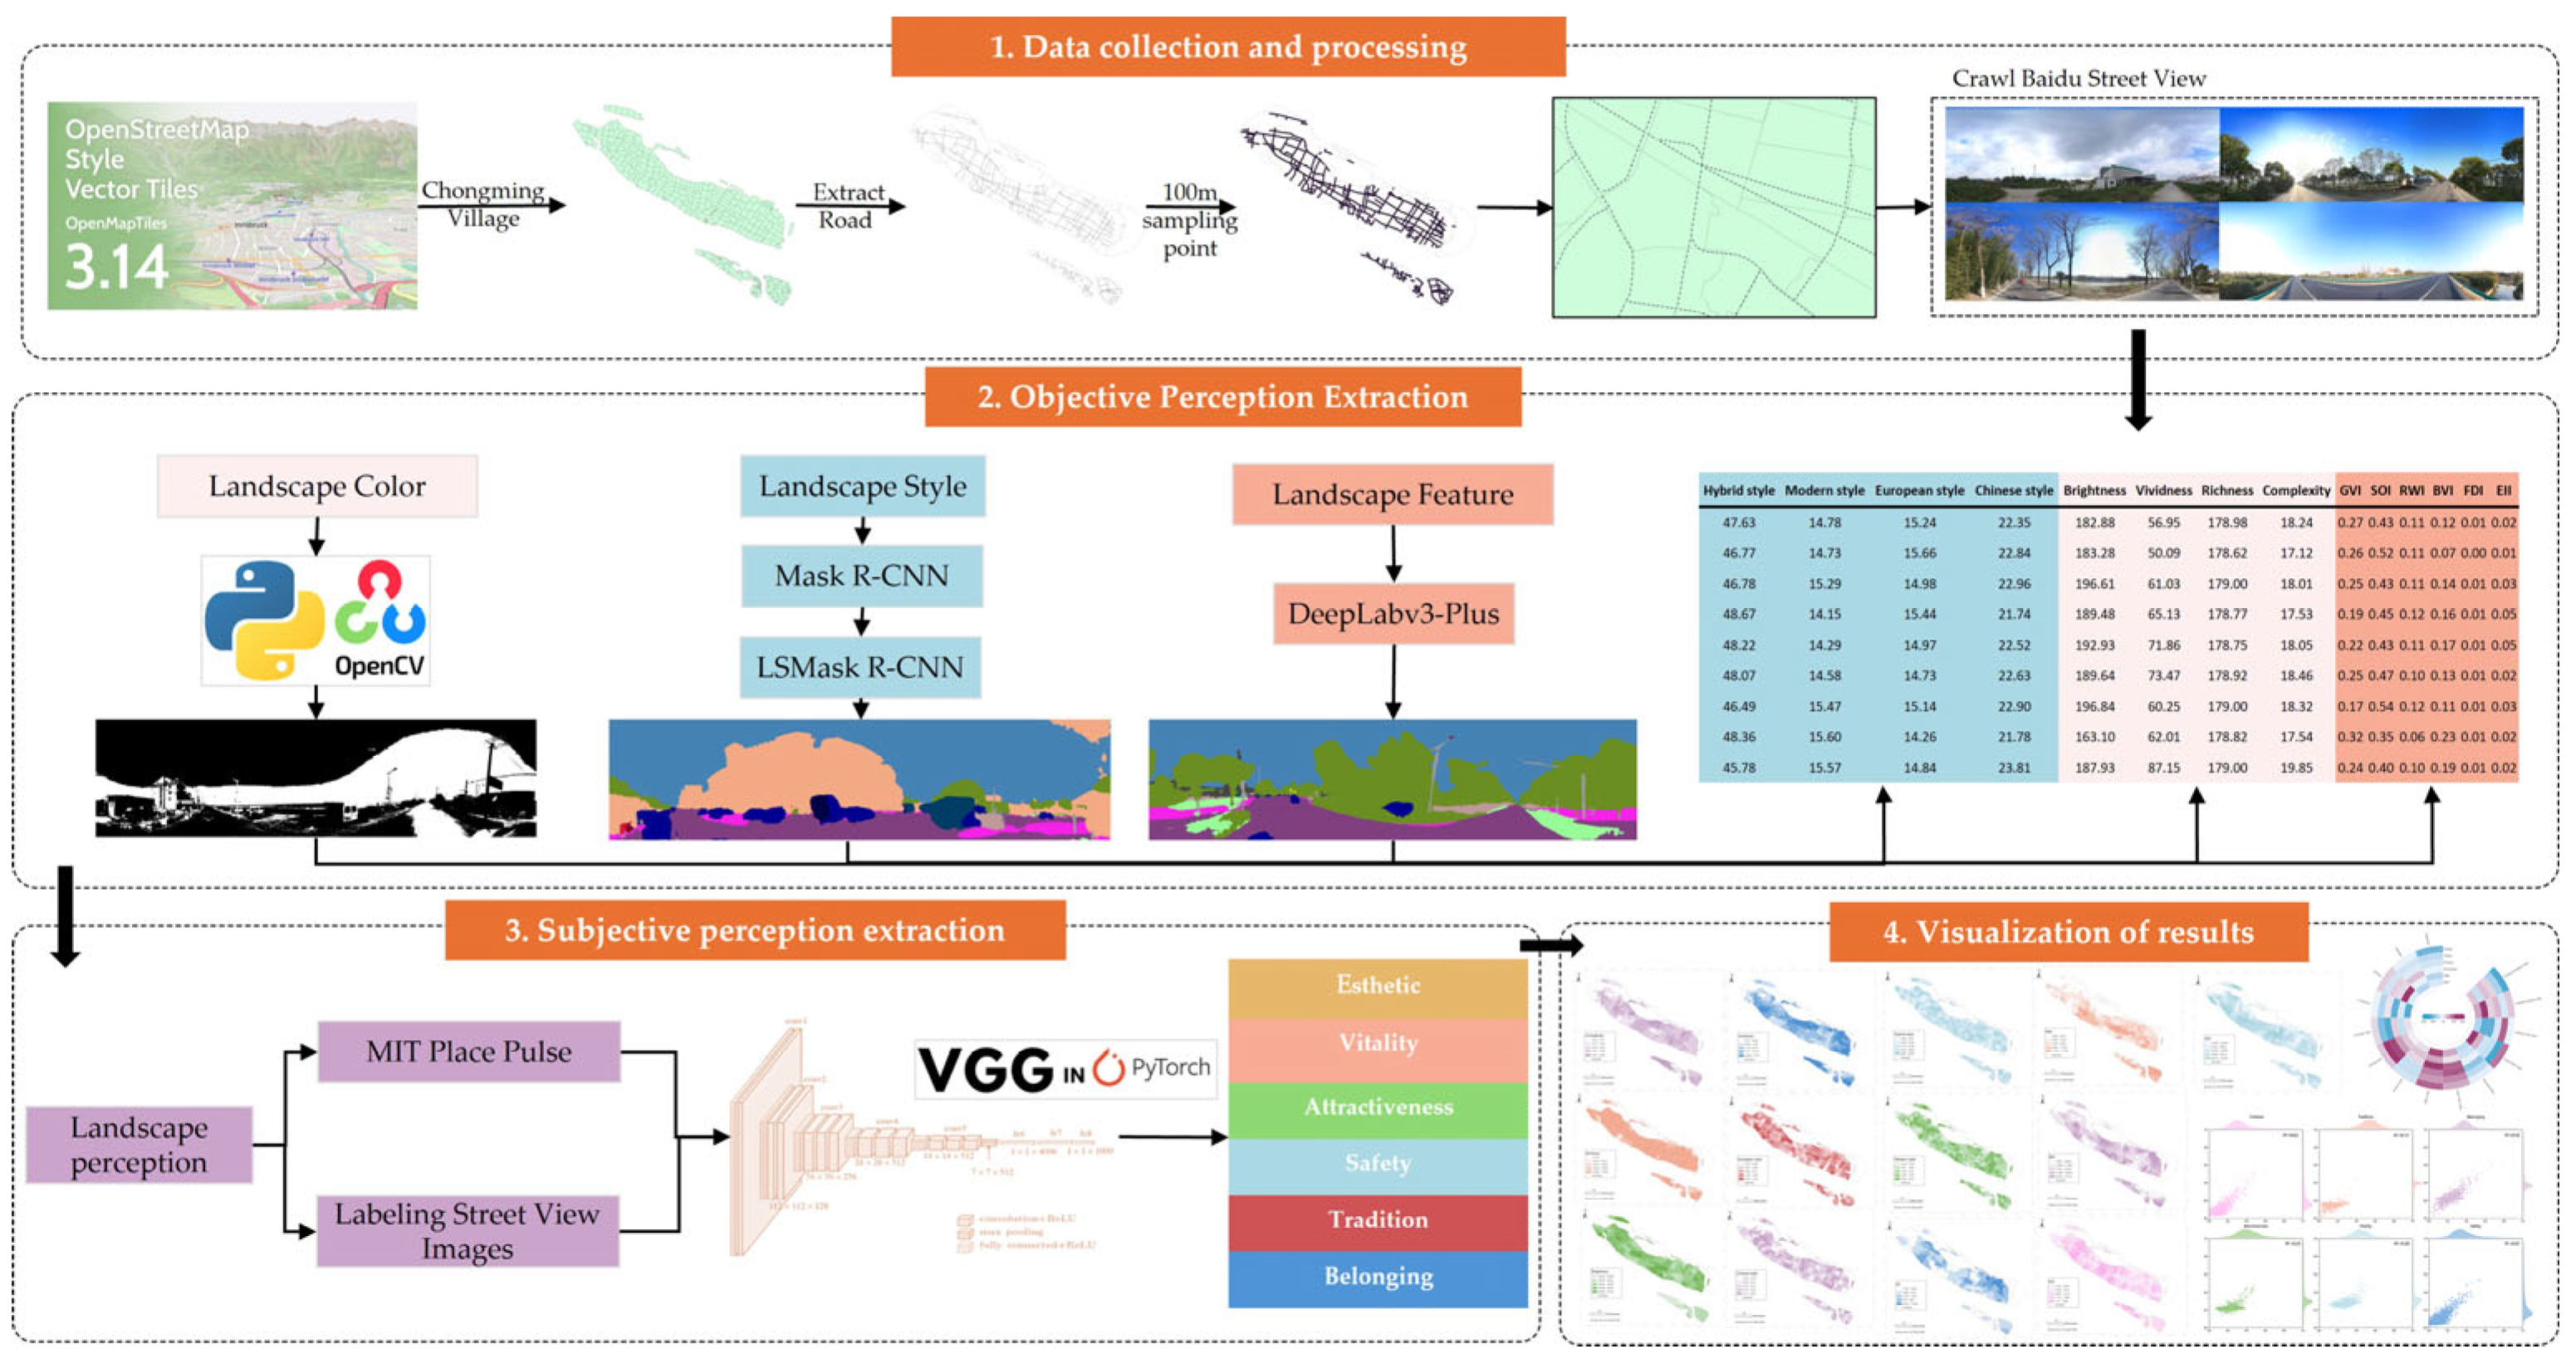
2.4. Technical Process
- (1)
- We collected 360° Street View image data from Chongming District in Shanghai, and performed unified coding, formatting, and data cleaning to ensure consistent data quality. Four color indicators were extracted, and four style classification labels were created to establish an objective database of perceptual indicators.
- (2)
- Key parameters of streetscape images were extracted, and distribution maps of generated landscape styles were identified, alongside the extraction of six landscape element indicators for quality checking and spatial aggregation.
- (3)
- By combining the MIT Place Pulse dataset with Chongming Rural Streetscape data, experiments were conducted to train six types of subjective perception models and evaluate their performance.
- (4)
- The experiment generated a spatial distribution map of landscape perception, performed correlation analysis between objective perception and subjective perceptions, and synthesized the results to propose optimization suggestions.
3. Experimental Process and Analysis of Results
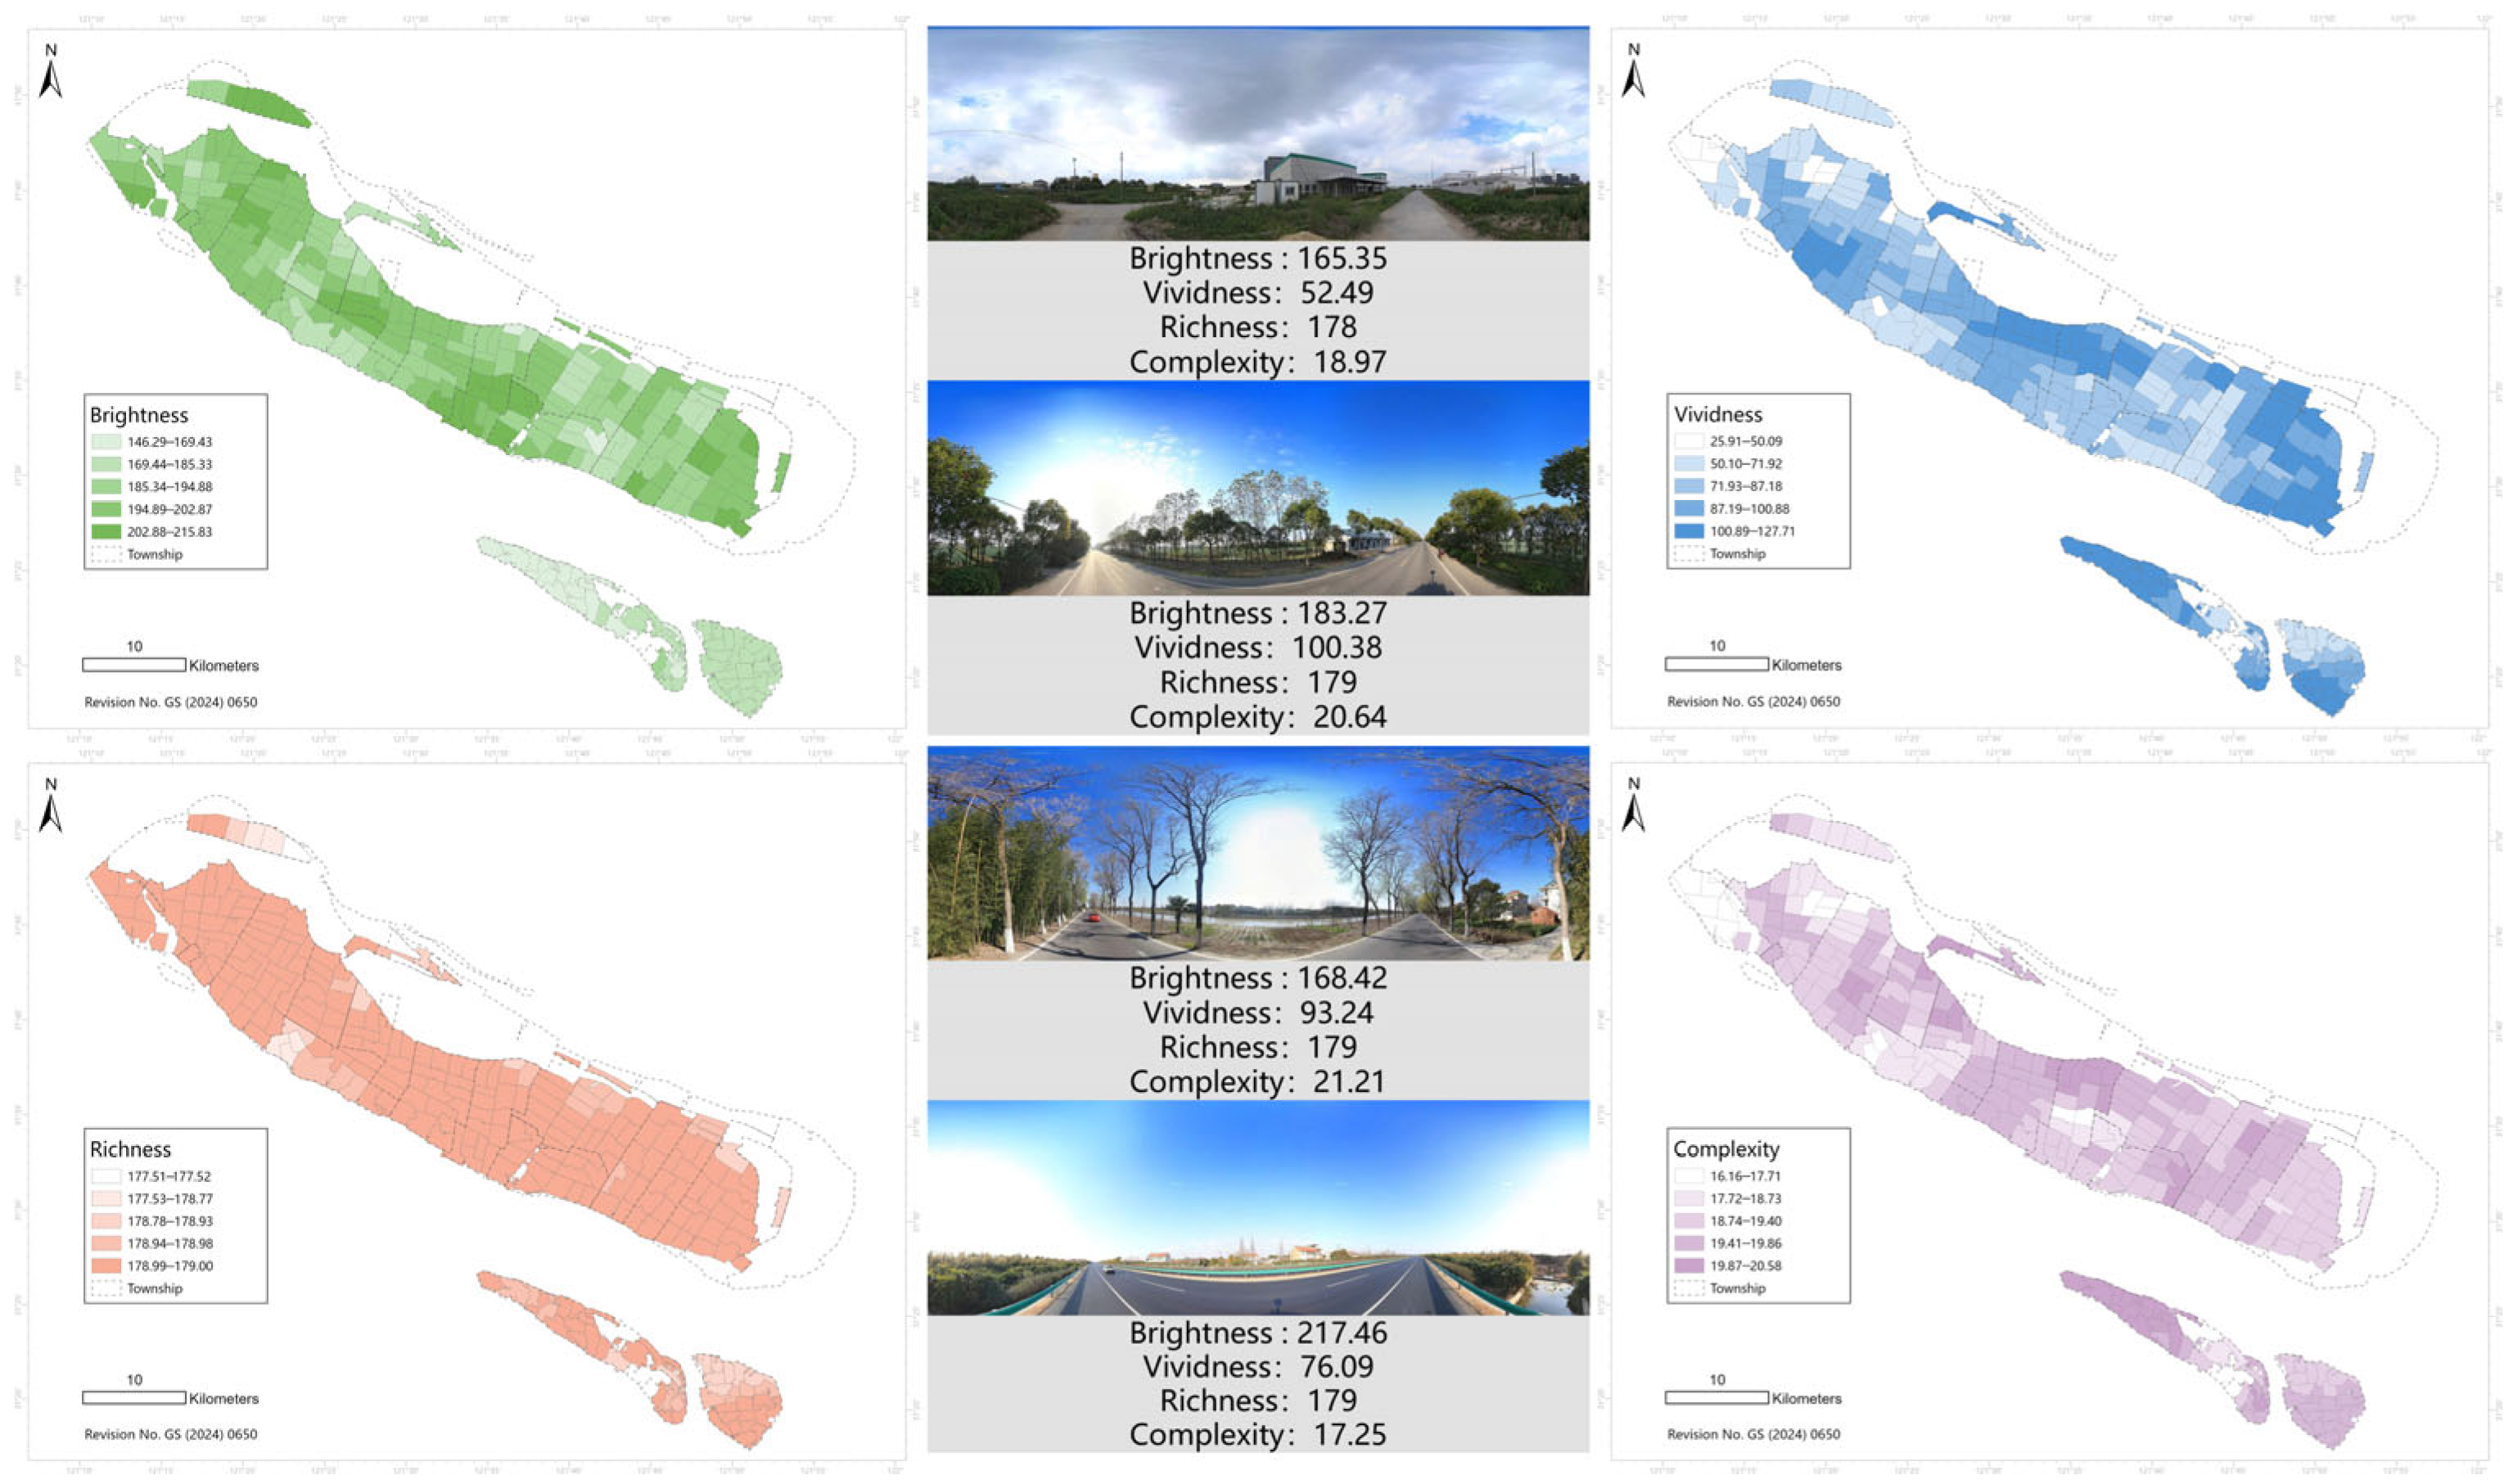
3.1. Landscape Color Perception Analysis
3.2. Landscape Style Perception Analysis
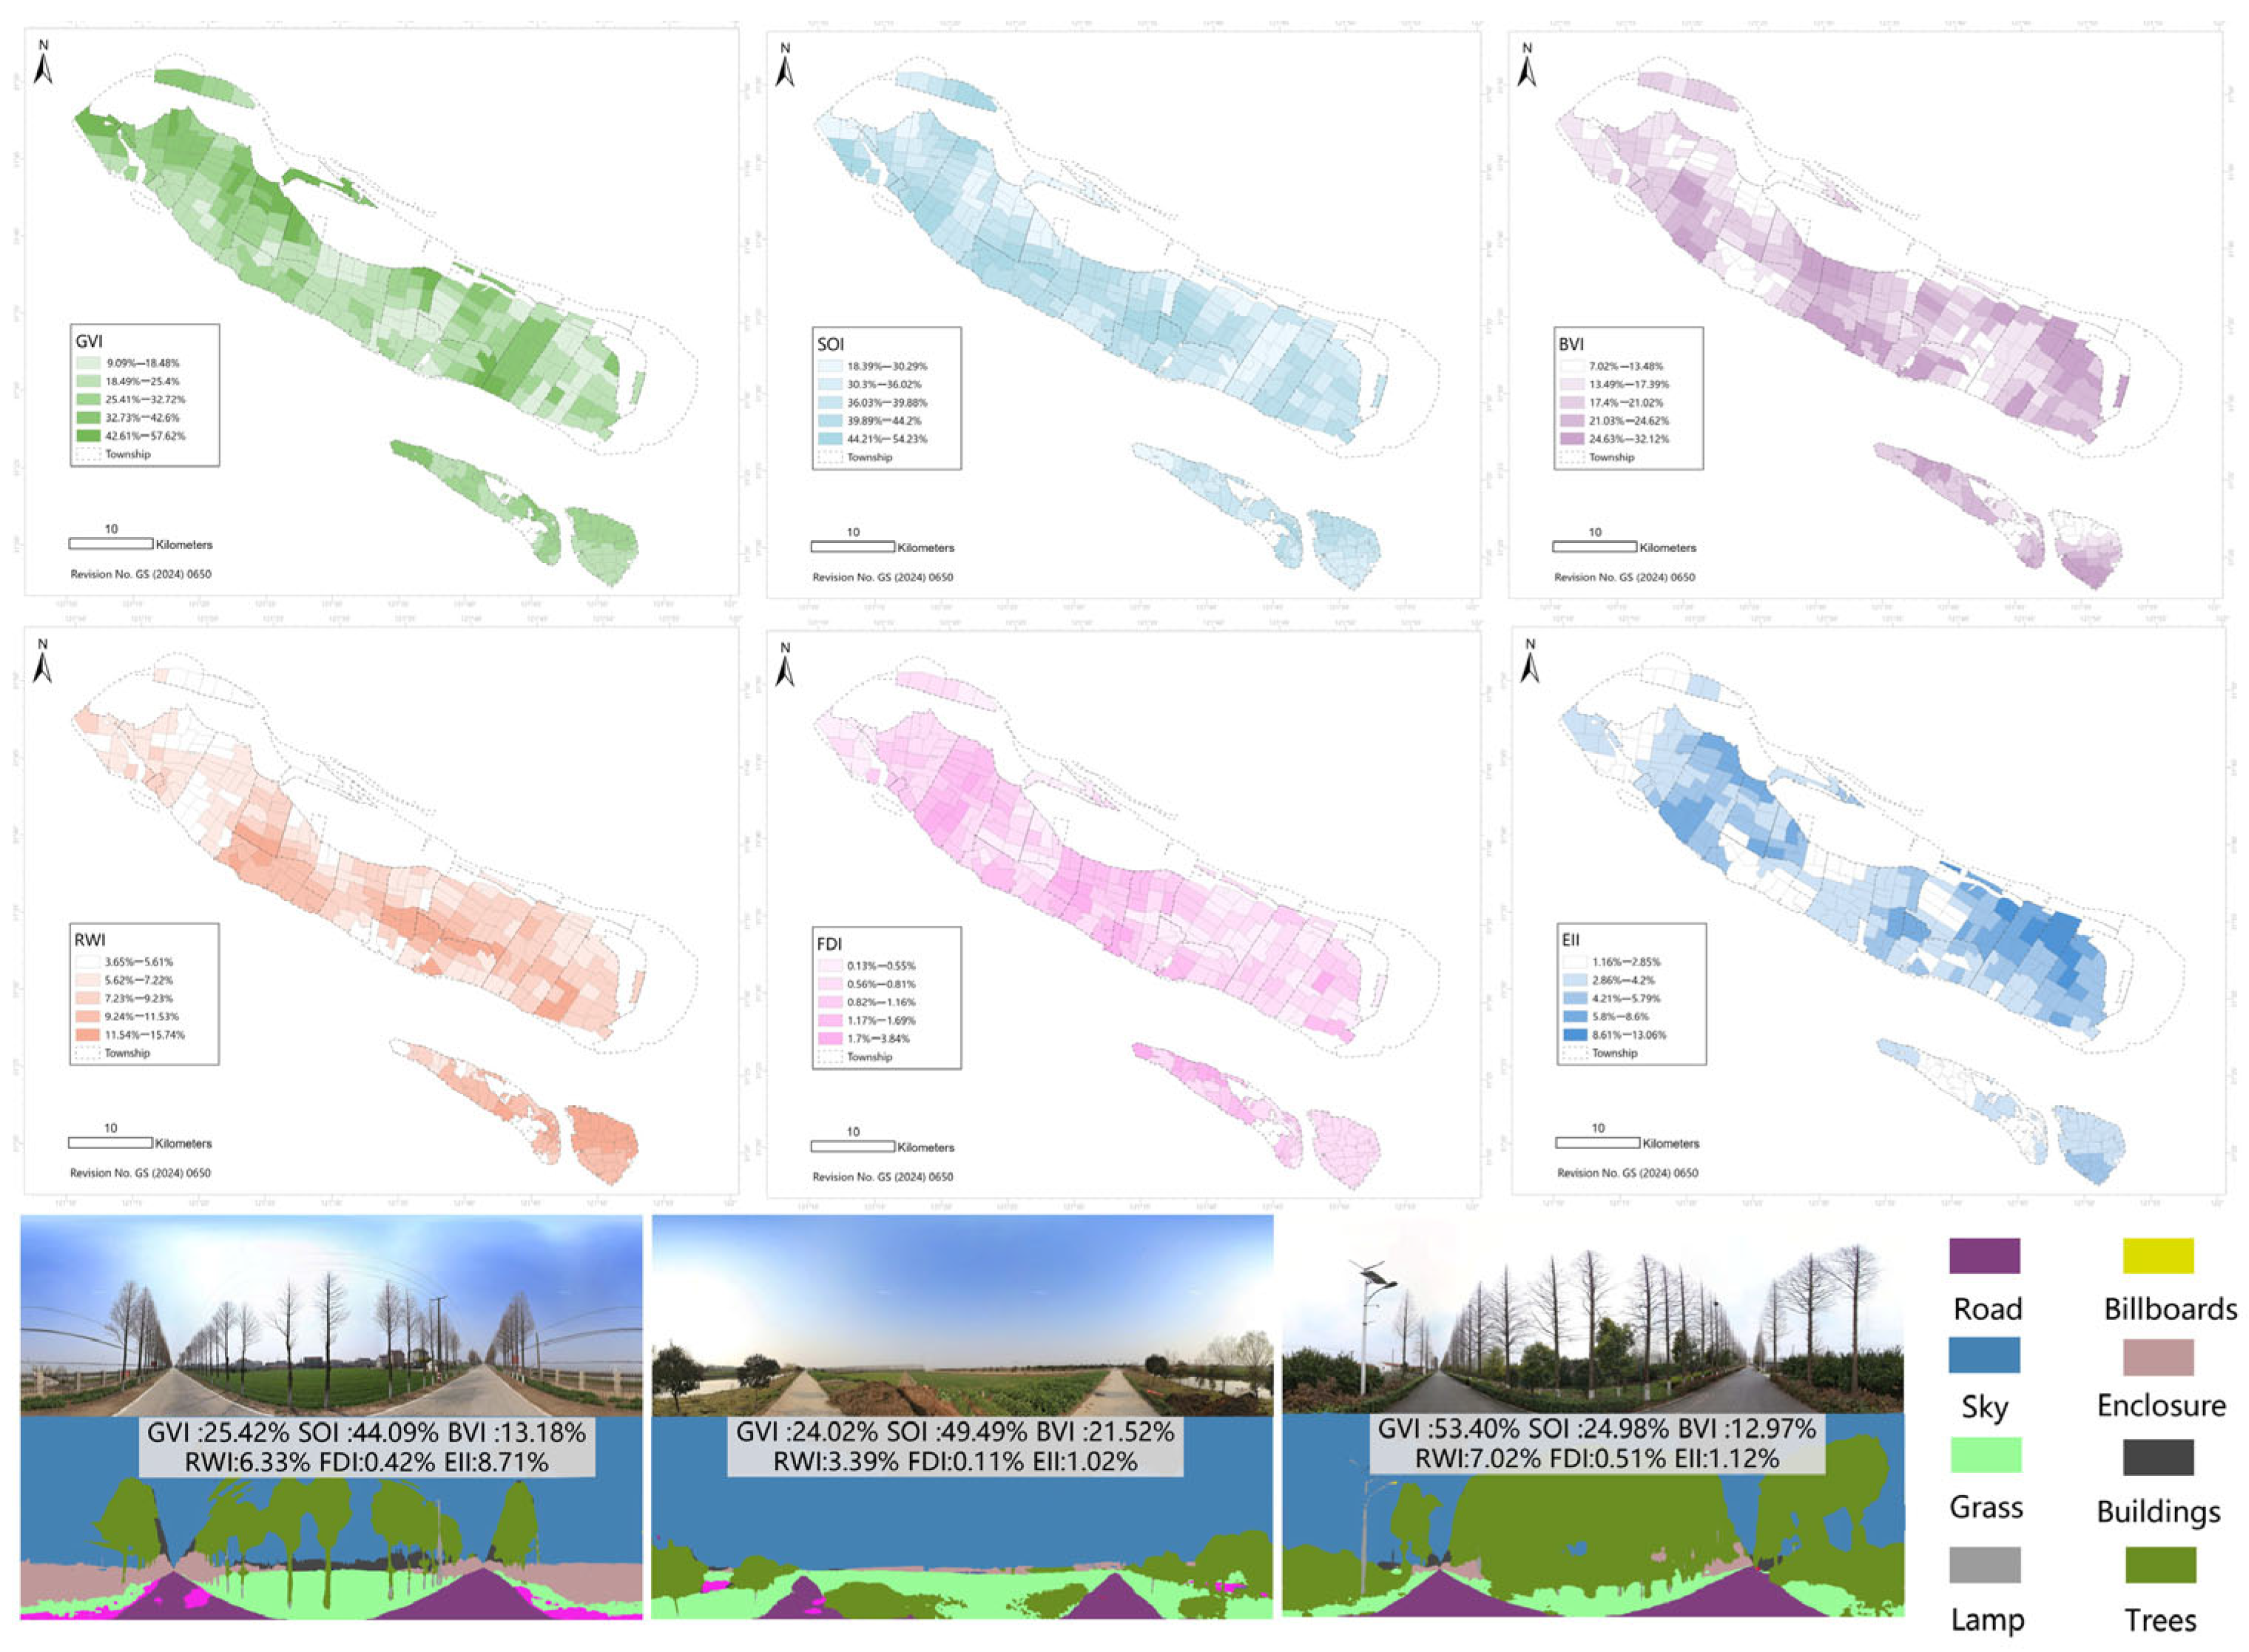
3.3. Landscape Element Perception Analysis
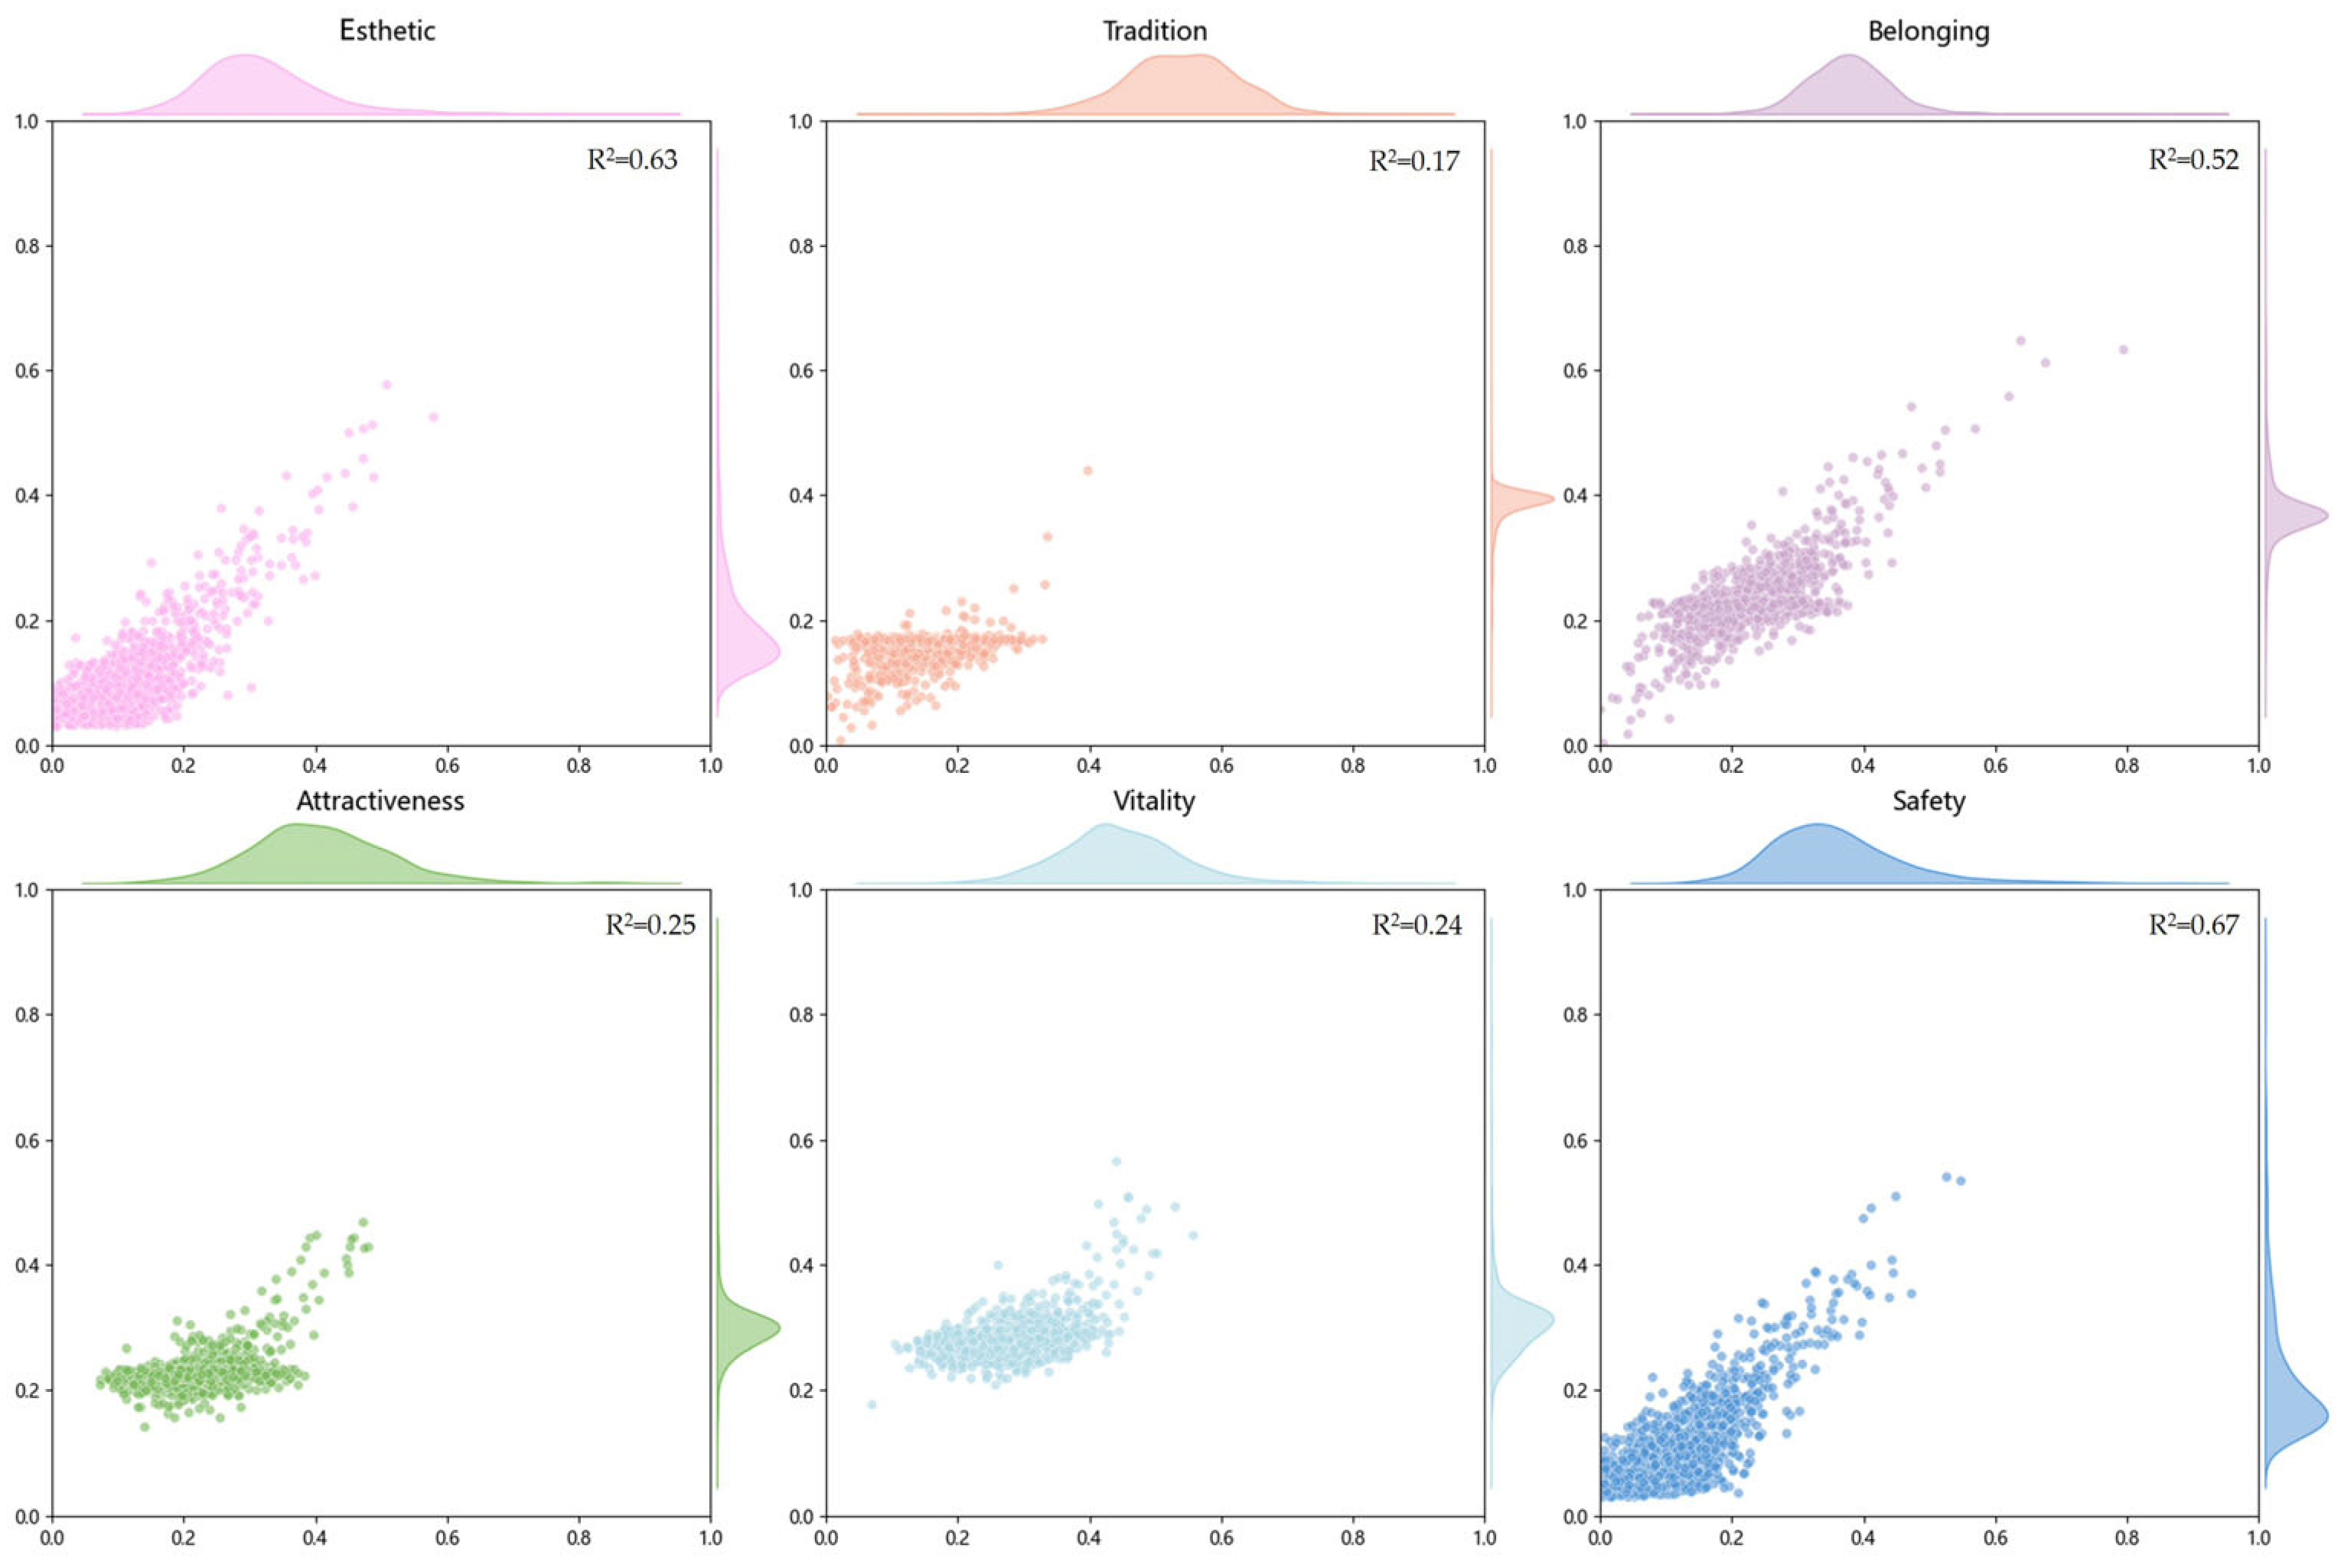
3.4. Landscape Subjective Perception Analysis
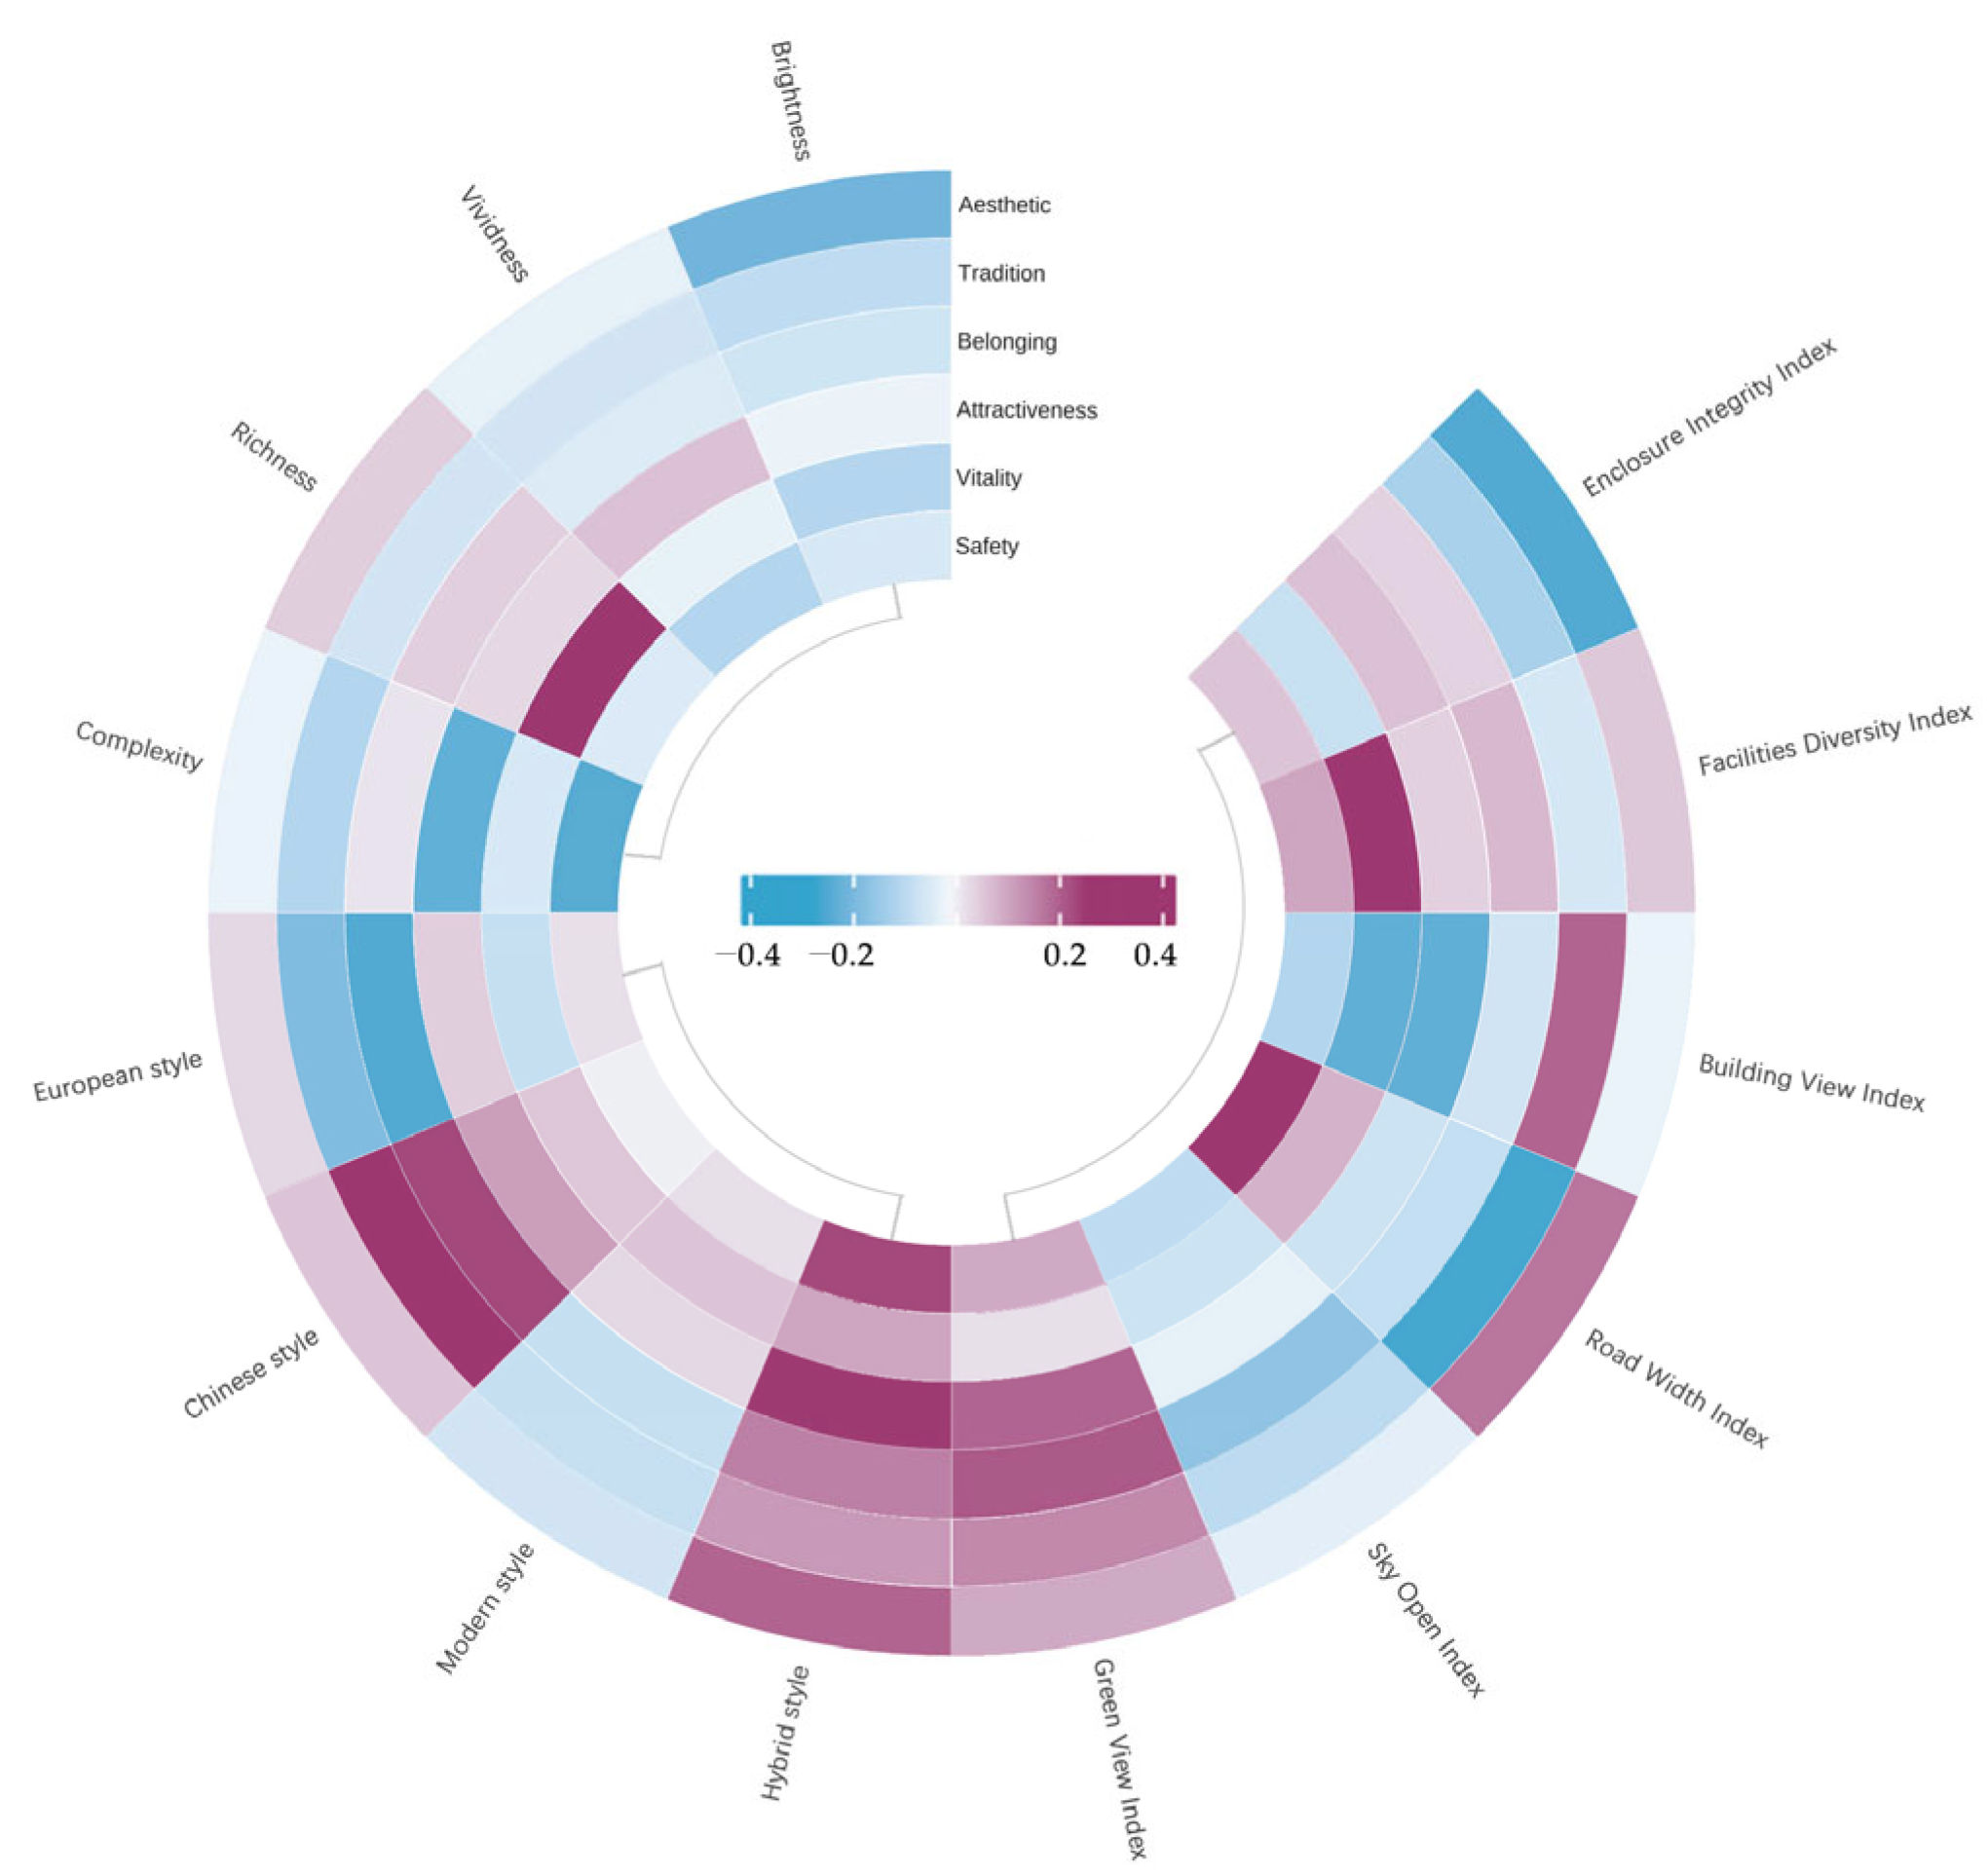
3.5. Correlation Analysis
- (1)
- Esthetic perception demonstrates a strong positive correlation with hybrid landscape styles and RWI. In recent years, Chongming has integrated modern design elements into traditional rural landscapes, enabling a simultaneous appreciation of cultural heritage and contemporary innovation. Many rural villages have also expanded main roads and enhanced green roadside layers, contributing to continuous and visually appealing landscape corridors. Conversely, esthetic perception shows a strong negative correlation with brightness and EII. Chongming’s characteristic low-brightness palette—dominated by green vegetation, blue waterways, and gray-tiled traditional architecture—is often disrupted by high-brightness features, such as neon signage and glass curtain walls, which clash with the natural rural setting. Additionally, dense building clusters and high enclosure walls obstruct scenic views, fragment public spaces, reduce spatial transparency, and exacerbate discomfort during the humid summer season by intensifying a sense of confinement and visual dissonance.
- (2)
- Tradition exhibits a strong positive correlation with Chinese-style architecture and BVI. Traditional villages in Chongming are often organized around familial settlements, characterized by architectural layouts that create continuous and enclosed street and alley interfaces. For example, Caopeng Village (Sanxing Town) integrates features, such as moon gates and curved corridors from Jiangnan garden design, enriching the spatial narrative with classical Chinese esthetic elements. Conversely, tradition shows a strong negative correlation with European-style architecture and RWI. Traditional Chongming architecture primarily employs a muted palette of black, white, and gray, with elements including pitched roofs and wooden lattice windows contributing to the iconic “white walls and black tiles” appearance of the Jiangnan region. However, the introduction of European-style features, such as Roman columns and iron railings, disrupts this traditional esthetic. Additionally, the traditional layout of the rural road—narrow paths interwoven with residential plots—typically maintains a height-to-width ratio of 1:0.8 to 1:1.2, offering an intimate and human-scale environment. Road widening efforts that expand these paths beyond 5 m lower this ratio to below 1:0.5, diminishing the enclosed feeling of traditional streets and alleys.
- (3)
- Belonging is strongly positively correlated with Chinese-style architecture and GVI. The visual identity of Jiangnan water towns—characterized by white walls, gray roofs, traditional floral windows, and wooden frames—harmonizes with surrounding natural features, such as farmlands and rivers, fostering a cohesive and historically resonant landscape. For example, the boxwood nurseries in Yuanyi Village (Gangyan Town), blue-tiled buildings, reinforce cultural memory and enhance residents’ sense of identity. Long-term engagement in agricultural activities further deepens attachment to the rural ecosystem, including farmlands, vegetable plots, and trees. Conversely, belonging is negatively correlated with European-style and SVI. Architectural elements, such as Roman column facade and red pitched roofs—exemplified by French-style homestays in Xianqiao Village, Shuxin Town—conflict with the traditional visual language of coexisting houses and fields. Additionally, modern village developments that lack mature tree coverage tend to increase sky visibility, thereby diminishing enclosure and weakening the villagers’ emotional connection to the local landscape.
- (4)
- Attractiveness exhibits a strong positive correlation with hybrid landscape styles and GVI. The integration of natural environments with modern amenities allows rural areas to retain their green esthetic while catering to urban recreational demands. For example, Yingdong Village in Chenjia Town has successfully blended agricultural activities with diverse tourism functions, such as vacation homestays, exhibition halls, and restaurants, forming a multifunctional rural tourism destination. In contrast, attractiveness is negatively correlated with color complexity and BVI. While Chongming’s traditional dwellings typically feature simple light gray tones, the excessive use of more saturated colors, such as beige, brick red, and brown, undermines overall visual harmony. Furthermore, the construction of buildings exceeding three stories disrupts the traditionally horizontal village skyline and pastoral character, making the environment appear more urbanized and less appealing to those seeking rural charm.
- (5)
- Vitality is positively correlated with color richness and FDI. The introduction of vibrant vegetation and art sculptures significantly enhances spatial liveliness in traditional villages. For instance, Qianwei Village in Shuxin Town has developed the “Flower Island on the Sea” resort area, incorporating seasonal blooms, interactive workshops, and flower corridors to attract tourists for leisure and hands-on experiences. The integration of planting, processing, and tourism forms a complete “planting + processing + experience” industry chain, injecting sustained vitality into the rural setting. Conversely, vitality is negatively correlated with BVI. In areas where building density exceeds 35%, the traditional hierarchical pattern of “house-field-forest” is disrupted. This not only reduces the availability of public activity spaces but also diminishes long-standing ecological interactions between villagers and their environment.
- (6)
- Safety was found to be positively correlated with hybrid styles and RWI, indicating that wider roads and the integration of multiple architectural styles are perceived as safer by villagers accustomed to modern lifestyles. In contrast, a negative correlation with color complexity suggests that overly varied and uncoordinated colors reduce visual order, leading to a decreased sense of comfort and security in rural environments.
4. Discussion
4.1. Development Proposal
- (1)
- To address the issue of relatively high comprehensive landscape color indices in Chongming, a rural color database should be established through oblique photography and remote sensing image collection. It should then be integrated into the national land spatial planning system to achieve the visualization of color approval. Additionally, in conjunction with the Five Beauties Co-construction Implementation Plan of Chongming District, the specific technical parameters should be further refined to complete the color spectrum system planning for each village, including the “primary color + secondary color + accent color” scheme [23]. Finally, a control model that combines rigid control (strict enforcement of planning) with flexible guidance (dynamic adjustment) should be implemented.
- (2)
- In response to the issue of mixed and scattered landscape styles in Chongming, based on the Shanghai Suburban Rural Landscape Planning and Design Guidelines, which propose shaping the “Shanghai-style Jiangnan” landscape as the foundation, a specialized landscape style plan was developed. This involved retaining several valuable and relatively intact Chinese-style neighborhoods and buildings, gradually expanding to surrounding areas, and establishing protection control zones (i.e., reinforcing Chinese-style elements), partial renovation zones (incorporating multiple styles in smaller proportions), and moderate renewal zones (allowing the independent construction of other styles in specific areas) [24]. Different styles are reflected through modifications to site elements such as color, materials, style, and scale, including white-walled, black-tiled Chinese-style buildings, Chinese-style window lattices, and the use of blue tiles and blue bricks.
- (3)
- To address the issues of low view index for landscape elements and significant regional differences, firstly, the layout is organized as “one ring, multiple belts, and multiple points,” with parks and green spaces serving as green points, roadside green belts as green lines, and large parks as green areas. This approach strengthens the development of rural industrial zones, street parks, and roadside and vertical greening. Second, alley widths are controlled within 8–12 m, and dilapidated pergolas and shade structures are removed to enhance the openness of the sky in the area. Moreover, the rural building density is controlled below 35%, with public activity spaces increased through the integration of local culture and commercial space development. Then, rural main roads are equipped with dedicated non-motorized vehicle lanes, and secondary roads are provided with sidewalks no less than 1.5 m wide. In addition, a specialized facility planning scheme is compiled for the entire district with a 500 m facility service radius, and functional small-scale structures with local characteristics are systematically added. Finally, the use of alleys and public spaces remove overly oppressive and obstructive walls, as well as dilapidated facilities in streets, alleys, and public spaces, thereby balancing the enclosure and openness of the site [4,6].
- (4)
- To resolve the problem of low subjective perception results and significant disparities in their distribution across various landscape dimensions, it is recommended that each village adopt outstanding measures from beautiful rural villages and rural revitalization demonstration village initiatives to beautify the water, forest, farmland, and residential spaces of the rural area. The historical culture, intangible cultural heritage, and folk customs of each township should also be explored and then translated into landscape elements with a traditional feel to stimulate villagers’ sense of identity and belonging. Local cultural and tourism resources should be combined, with modern living, recreational functions and facilities, and diverse cultural activities added to enhance the attractiveness and vitality of resources. Security systems and transportation system planning should also be improved to enhance environmental comfort and safety [6,16].
- (5)
- In response to the complex positive and negative relationships between the objective and subjective perceptions of landscape elements, extensive field research should first be conducted to extract the objective texture characteristics and landscape cultural symbols (such as architectural colors, styles, and facility designs) of each village, establishing a quantifiable morphological gene bank [23]. Second, for different groups such as tourists and residents, perception databases should be designed, perception mapping tables should be established, thresholds for beauty and belonging should be quantified, and village-level perception archives that dynamically link characteristic symbols with psychological perception indicators should be created. Finally, the aforementioned specialized plans for rural landscape color, style, greening, and small-scale features should be integrated to establish a perception-based intelligent control system that integrates landscape color, style, elements, and the subjective “six senses.” For example, after inputting the database and archives of Chongming Horticultural Village, a color spectrum for nursery auxiliary colors (light green) and accent colors (light brown) could be generated, and reference materials could be provided for signage and lighting fixtures with boxwood-shaped designs [24].
4.2. Limitations
- (1)
- This research, while novel, is not without limitations. Although the coverage of Baidu Street View image data is relatively comprehensive in urban and well-developed areas, the analysis may be biased in less developed areas or areas where Street View data are lacking. Meanwhile, the study does not consider the impact of individual cultural background, age, gender, and other factors on perception results. Future research should combine field research, satellite remote sensing, and UAV aerial photography, 3D Gauss [25], diffusion modeling [26], eye tracking [27], and other technologies to collect multi-type and high-precision data that capture the subtle perceptual differences in individual esthetics, emotions, and other aspects, to improve the timeliness of data and the comprehensiveness of research results.
- (2)
- Although the machine learning used in this study can provide high-precision analytical results, its complexity may limit its popularization by researchers with non-technical backgrounds. In the future, a simplified model structure or user-friendly analytical tools should be developed for use by researchers lacking computer science and machine learning expertise. In the later stage, multi-region research can be carried out to optimize the methods and indicators and to improve the universality of the model.
5. Conclusions
- (1)
- The RLLPEM, which covers 20 subjective and objective integration indicators across four dimensions, can comprehensively extract landscape issues in rural areas from the perspective of both residents and visitors, comprehensively improve the accuracy of perception analysis in complex rural scenarios, promote the widespread application of landscape perception results in rural planning practices, help guide rural planners in creating environments that satisfy the public and bring them physical and mental pleasure, and assist decision-makers in making wise decisions [16].
- (2)
- The RLLPEM was applied to evaluate the rural landscape of Chongming, Shanghai. The results indicated that color perception exhibits distinct regional heterogeneity alongside certain universal patterns. Landscape style perception was found to be generally balanced yet spatially dispersed. Visual landscape elements displayed notably complex distribution characteristics. Moreover, subjective perception showed considerable regional variation, with consistently low scores across all evaluated indices. Faced with the significant differences in landscape perception content across different rural areas, systematic specialized planning will be required in the future to coordinate and balance the proportions of various elements [6].
- (3)
- The correlation analysis between objective perception and subjective perception of landscape shows that 14 objective perception indicators of landscape color, style and elements have nonlinear positive and negative differential effects on six subjective perception elements of landscape, consistent with the findings of other relevant studies [6,20]. This reveals the significant effect of the objective perception of rural landscapes on subjective perception [6].
Author Contributions
Funding
Data Availability Statement
Conflicts of Interest
References
- Dadashpoor, H.; Malekzadeh, N.; Saeidshirvan, S. A typology of metropolitan spatial structure: A systematic review. Environ. Dev. Sustain. 2023, 25, 13667–13693. [Google Scholar] [CrossRef]
- Pan, Y.; Hong, L.P. Out of the plight of “passive ubanization” by midwestern metropolitan suburban areas in China. Urban Planning Forum 2013, 4, 42–48. [Google Scholar]
- Zhou, Z.Z. Landscape changes in a rural area in China. Landsc. Urban Plan. 2000, 47, 33–38. [Google Scholar]
- Gong, S.U.; Zhang, L.; Pang, J. The spatial–temporal evolution of the trade-offs and synergy between the suburban rural landscape’s production–living–ecological functions: A case study of Jiashan in the Yangtze River Delta eco-green integrated development demonstration zone, China. Sustainability 2024, 16, 7439. [Google Scholar] [CrossRef]
- Ge, D.Z.; Lu, Y.Q. Rural spatial governance for territorial spatial planning in China: Mechanisms and path. Acta Geogr. Sin. 2021, 76, 1422–1437. [Google Scholar]
- Hu, Y.K.; Zhang, T.L.; Wang, L.; He, J. Measurement and spatial distribution of perception in urban blocks from the perspective of landscape service. Landsc. Archit. 2022, 29, 45–52. [Google Scholar]
- Wright, J. Terrae Incognitae: The place of the imagination in geography. Ann. Assoc. Am. Geogr. 2008, 37, 1–15. [Google Scholar] [CrossRef]
- Tang, S.Y.; Yin, X.M. Study on the Effect of travel writings on the placeness of tourist destination: A case study of Qufu. Areal Res. Dev. 2014, 33, 111–116. [Google Scholar]
- Zeng, G.J.; Liu, M.; Liu, B.; Cai, X.M. Research on the process of trans-local food culture production: Based on the perspective of symbolic authenticity. Geogr. Res. 2013, 32, 2366–2376. [Google Scholar]
- Oakes, T.; Schein, L. Trans-Local China: Linkages, Identities, and the Reimagining of Space; Routledge: New York, NY, USA, 2006. [Google Scholar]
- Tuan, Y.F. Space and Place: The Perspective of Experience; University of Minnesota Press: Minneapolis, MN, USA, 1977. [Google Scholar]
- Appleton, J. The Experience of Landscape; Wiley-Blackwell: New York, NY, USA, 1975. [Google Scholar]
- Steiner, F.R.; Young, G.H.; Zube, E.H. Ecological Planning: Linking Ecology with Land Use; Island Press: New York, NY, USA, 2000. [Google Scholar]
- Cao, Y.H.; Yang, P.F.; Xu, M.; Li, M.; Li, Y.; Guo, R.Z. A novel method of urban landscape perception based on the biological vision process. Landsc. Urban Plan. 2025, 254, 105246. [Google Scholar] [CrossRef]
- Darby, W.J. Landscape and Identity: Geographies of Nation and Class in England; Routledge: New York, NY, USA, 2020. [Google Scholar]
- Wang, L.; Zhang, B. Comparative study of landscape character assessment and historic landscape characterisation and its inspiration to China. Landsc. Archit. 2018, 25, 87–92. [Google Scholar]
- Yao, X.J.; Wu, C.C. The scenic beauty features and the ascension paths of beautiful rural landscape in the north of Anhui Province. J. Anhui Agric. Univ. 2017, 44, 1032–1037. [Google Scholar]
- Wang, X.C.; Luo, C.X.; Cai, W.T.; Jin, H.X. Progress of chinese rural landscape characteristic system research in recent 20 years. Chin. Landsc. Archit. 2022, 38, 44–49. [Google Scholar]
- Liu, S.Y.; Song, X.F.; Wang, L. Visual perception characteristics and influence factors of rural landscapes: An example of the Longpu rice terraces in the Ziquejie of Hunan province. J. Northwest For. Univ. 2024, 39, 242–249. [Google Scholar]
- Xu, M.; Luo, T.; Wang, Z. Urbanization diverges residents’ landscape preferences but towards a more natural landscape: Case to complement landsenses ecology from the lens of landscape perception. Int. J. Sustain. Dev. World Ecol. 2020, 27, 250–260. [Google Scholar] [CrossRef]
- Wu, X.; Lai, I.K.W. The use of 360-degree virtual tours to promote mountain walking tourism: Stimulus-organism-response model. Inf. Technol. Tour. 2022, 24, 85–107. [Google Scholar] [CrossRef]
- Muhammad, M.A.; Heung, S.K. An explainable artificial intelligence-based approach for reliable damage detection in polymer composite structures using deep learning. Polym. Compos. 2025, 46, 1536–1551. [Google Scholar]
- Zhang, L.Y. Research on Perception of Traditional Cityscape Characteristics Based on Multi-Source Urban Big Data; China University of Mining and Technology: Beijing, China, 2020. [Google Scholar]
- Naik, N.; Philipoom, J.; Raskar, R.; Hidalgo, C. Street score-predicting the perceived safety of one million streetscapes. In Proceedings of the IEEE Computer Vision and Pattern Recognition, Columbus, OH, USA, 23–28 June 2014; pp. 779–785. [Google Scholar]
- Croitoru, F.; Hondru, V.; Ionescu, R.T.; Shah, M. Diffusion models in vision: A survey. IEEE Trans. Pattern Anal. Mach. Intell. 2023, 45, 10850–10869. [Google Scholar] [CrossRef] [PubMed]
- Chen, L.Z.; Hu, Y.; Zhang, Y.; Ge, Y.Y.; Zhang, H.Y. Frequency-importance gaussian splatting for real-time lightweight radiance field rendering. Multimed. Tools Appl. 2024, 83, 8377–83401. [Google Scholar] [CrossRef]
- Yu, W.T.; Zhu, H.; Zhang, S.Y. Sustainable development and tourists’ satisfaction in historical districts influencing factors and features. J. Resour. Ecol. 2021, 12, 669–681. [Google Scholar]


| Dataset | Source | Application Indicator |
|---|---|---|
| Baidu Street View 360° panoramic picture | Baidu Street View Application Programming Interface (https://lbsyun.baidu.com/ accessed on 10 January 2025), with a sampling period of 2024. Sampling points were set at 100 m intervals. Points without available pictures were skipped, and those with incomplete or inaccessible images were excluded. A total of 2700 valid sampling points and corresponding street view images were retained. | Landscape color: brightness, vividness, richness, complexity. Landscape style: European style, Chinese style, modern style, hybrid style. Landscape elements: green view index (GVI), sky open index (SOI), road width index (RWI), building view index (BVI), facility diversity index (FDI), enclosure integrity index (EII). |
| MIT Place Pulse | Papers with code (https://paperswithcode.com/dataset/place-pulse-2-0 accessed on 16 January 2025) | Subjective perception: esthetic, tradition, belonging, attractiveness, vitality, safety. |
| Road data | OpenStreetMap (https://www.openstreetmap.org/ accessed on 12 January 2025) | / |
| Administrative boundary data | Standard Map Service System of the Ministry of Natural Resources, Map No. GS (2024) 0650 | / |
| Parameter | Instructions | Fine-Tuned Value |
|---|---|---|
| Learning Rate | Control the step size of each parameter update: over-learning will lead to unstable training, under-learning will lead to slow convergence. | 0.0001 |
| Batch Size | The number of samples used during each training, smaller batch sizes are suitable for fine adjustment, larger batch sizes speed up training. | 16 |
| Epochs | The number of training rounds determines the total number of training times for the model. | 25 |
| Optimizer | Controlling the model weight updating mode and selecting a suitable optimizer speeds up the training process. | Adam |
| Freezing Layers | Freeze the early layers of the model to maintain its general feature extraction capabilities and fine-tune later layers only. | Freeze the first 12 layers and fine-tune the last 4 layers |
| Regularization | Techniques to prevent overfitting and help model generalization. | Dropout (0.5) |
| Precision Index | Pre-Fine Tuning Model (%) | Fine-Tuned Model (%) |
|---|---|---|
| Accuracy | 83.26 | 95.45 |
| Precision | 81.20 | 94.35 |
| Recall | 87.05 | 92.33 |
| F1 Score | 81.25 | 90.58 |
| Perception Labeling | Accuracy (%) | Precision (%) | Recall (%) | F1 Score (%) |
|---|---|---|---|---|
| Esthetic | 86.12 | 87.30 | 85.45 | 86.50 |
| Tradition | 78.95 | 78.45 | 80.12 | 79.05 |
| Belonging | 80.45 | 79.80 | 81.35 | 80.50 |
| Attractiveness | 83.01 | 83.60 | 81.70 | 82.80 |
| Vitality | 81.80 | 80.60 | 82.90 | 81.75 |
| Safety | 83.30 | 84.90 | 82.65 | 83.75 |
| Index | Max | Min | Mean | Histogram |
|---|---|---|---|---|
| Brightness | 215.83 | 146.29 | 190.96 |  |
| Vividness | 127.71 | 25.91 | 85.96 |  |
| Richness | 179 | 177.52 | 178.98 |  |
| Complexity | 20.58 | 16.16 | 19.23 |  |
| Index | Max (%) | Min (%) | Mean (%) | Histogram |
|---|---|---|---|---|
| European style | 17.02 | 12.5 | 14.99 |  |
| Chinese style | 24.91 | 20.39 | 22.53 |  |
| Modern style | 16.25 | 13.29 | 14.94 |  |
| Hybrid style | 50.49 | 44.46 | 47.54 |  |
| Index | Max (%) | Min (%) | Mean (%) | Histogram |
|---|---|---|---|---|
| GVI | 57.62 | 9.09 | 27.16 |  |
| SOI | 54.23 | 18.39 | 37.74 |  |
| BVI | 32.12 | 7.02 | 19.3 |  |
| RWI | 15.74 | 3.65 | 10.5 |  |
| FDI | 3.84 | 0.13 | 0.88 |  |
| EII | 13.06 | 1.16 | 4.24 |  |
| Index | Max | Min | Mean | Histogram |
|---|---|---|---|---|
| Esthetic | 0.44 | 0.03 | 0.06 |  |
| Tradition | 0.44 | 0.10 | 0.17 |  |
| Belonging | 0.65 | 0.13 | 0.24 |  |
| Attractiveness | 0.28 | 0.14 | 0.23 |  |
| Vitality | 0.32 | 0.18 | 0.22 |  |
| Safety | 0.54 | 0.03 | 0.07 |  |
Disclaimer/Publisher’s Note: The statements, opinions and data contained in all publications are solely those of the individual author(s) and contributor(s) and not of MDPI and/or the editor(s). MDPI and/or the editor(s) disclaim responsibility for any injury to people or property resulting from any ideas, methods, instructions or products referred to in the content. |
© 2025 by the authors. Published by MDPI on behalf of the International Society for Photogrammetry and Remote Sensing. Licensee MDPI, Basel, Switzerland. This article is an open access article distributed under the terms and conditions of the Creative Commons Attribution (CC BY) license (https://creativecommons.org/licenses/by/4.0/).
Share and Cite
Gong, S.; Zhang, L.; Zhang, J.; Duan, Y. Rural Local Landscape Perception Evaluation: Integrating Street View Images and Machine Learning. ISPRS Int. J. Geo-Inf. 2025, 14, 251. https://doi.org/10.3390/ijgi14070251
Gong S, Zhang L, Zhang J, Duan Y. Rural Local Landscape Perception Evaluation: Integrating Street View Images and Machine Learning. ISPRS International Journal of Geo-Information. 2025; 14(7):251. https://doi.org/10.3390/ijgi14070251
Chicago/Turabian StyleGong, Suning, Lin Zhang, Jie Zhang, and Yuxi Duan. 2025. "Rural Local Landscape Perception Evaluation: Integrating Street View Images and Machine Learning" ISPRS International Journal of Geo-Information 14, no. 7: 251. https://doi.org/10.3390/ijgi14070251
APA StyleGong, S., Zhang, L., Zhang, J., & Duan, Y. (2025). Rural Local Landscape Perception Evaluation: Integrating Street View Images and Machine Learning. ISPRS International Journal of Geo-Information, 14(7), 251. https://doi.org/10.3390/ijgi14070251