Article

Assessing Accessibility and Equity in Childcare Facilities Through 2SFCA: Insights from Housing Types in Seongbuk-gu, Seoul

Department of Architecture, Korea University, Seoul 02841, Republic of Korea
*
Author to whom correspondence should be addressed.
ISPRS Int. J. Geo-Inf. 2025, 14(7), 247; https://doi.org/10.3390/ijgi14070247
Submission received: 17 May 2025 / Revised: 19 June 2025 / Accepted: 23 June 2025 / Published: 26 June 2025

Abstract

The creation of child-friendly communities has become a key goal in sustainable global development. However, South Korea continues to experience a shortage of childcare facilities, resulting in gaps in the public care system and a growing reliance on private educational resources. Ensuring spatial spaces and implementing rational planning for children’s spaces have become critical tasks in building child-friendly cities. This study analyzed the accessibility of childcare facilities by housing type in Seongbuk-gu, Seoul, using the two-step floating catchment area (2SFCA) method, focusing on children residing in the district. It also evaluated whether these facilities were spatially and equally distributed. The findings are as follows. First, the overall accessibility to childcare facilities in Seongbuk-gu is limited, with significant disparities in accessibility depending on housing type. Second, the spatial equity assessment revealed high inequality indices for most facilities, particularly for those in apartment areas, which showed relatively higher levels of inequality. In conclusion, childcare facilities in Seongbuk-gu require substantial improvements in terms of both accessibility and equity. This study provides a policy framework for creating child-friendly communities and promoting equal access to care services for children by analyzing the spatial accessibility and equity of childcare facilities.

1. Introduction

According to the United Nations Declaration of the Rights of the Child [1], children require legal protection and rights guarantees because of their physical and mental immaturity, underscoring the importance of their welfare rights. The United Nations’ Sustainable Development Goals (SDGs) emphasize the pivotal role of creating child-friendly cities based on safety, inclusivity, and accessibility. Universal accessibility to children’s spaces is regarded as a core welfare right from the perspective of social equity. Studies have proposed practical strategies for creating child-friendly cities [2,3,4,5]. Research highlights the importance of children’s spaces and calls for rational planning of various types of children’s spaces, considering accessibility and equity in child-friendly urban planning [6,7,8].
The provision of childcare facilities is a critical component of planning child-friendly communities and a key indicator of urban infrastructure [9]. Access to children’s spaces is essential for addressing care gaps in communities and establishing a care service system [10,11,12]. Parents require a safe and high-quality childcare environment for raising children, and there is an urgent need for an adequate and uninterrupted provision of childcare facilities [13,14]. In South Korea, the proportion of dual-income households reached 46.1% in 2022, increasing the societal demand for childcare services [15]. Traditionally centered on family-based care, childcare responsibility is shifting toward joint accountability between the state and local communities, highlighting the resolution of gaps in childcare as a major social issue. A shortage of childcare facilities may result in career discontinuity for women in dual-income families or increased financial pressure due to rising childcare costs. Furthermore, in the case of elementary school children, the absence of adequate after-school supervision may raise significant safety issues when children are left alone without parental care [8,16,17,18].
Communities are crucial spatial units for creating child-friendly cities and play an ideal role in supporting children’s daily activities. Variations in the provision of children’s spaces across regions may arise because of differences in demand [18,19,20]. In South Korea, differences in infrastructure occur depending on housing type within communities, a social phenomenon considerably affecting children [21]. Despite being a critical issue for children and caregivers, the limited provision of childcare facilities based on housing type has received little attention, particularly in low-rise residential areas characterized by small-scale individual lots. Small-scale areas have the advantage of reflecting differences in spatial accessibility more effectively, identifying the most underserved spatial units. There has been insufficient discussion on the specific degree of unequal accessibility to childcare spaces across regions, and there are insufficient comparative analyses of the differences in equity patterns across various spatial scales and types.
From a spatial welfare perspective, equal access to childcare spaces is important. Accessibility to childcare spaces is closely related to population and spatial distribution, and there is a substantial imbalance in the allocation of children’s space resources [7]. Consideration of spatial accessibility and equity in childcare facilities is essential because spatial accessibility demonstrates the correlation between the arrangement of childcare facilities and service efficiency [1,22]. Accessibility, introduced by Walter Hansen in 1959, is defined as the relative ease of reaching a facility based on factors such as distance, time, and cost [7,23,24,25,26,27]. This implies the need for promoting equality, diversity, and social inclusion [28]. Spatial accessibility is crucial in policymaking in various fields, including urban areas, transportation planning, and geography [29,30]. It has been widely applied in studies on healthcare facilities [31,32,33,34,35,36,37,38,39,40,41], children’s spaces, and public facilities [7,42,43,44,45]. Measurements of spatial accessibility include the kernel density, gravity model, container, nearest distance methods, and the 2SFCA method, which is a representative approach [40,46,47]. There has been a rapid increase in place-based accessibility measurement cases for evaluating urban service provision or justifying social inequality issues. The development of place-based accessibility theory is centered on the 2SFCA method [48,49,50]. Spatial equity refers to the concept that individuals are treated equally, regardless of personal characteristics such as race, gender, income, or class [51,52,53]. That is, everyone has equal access and rights to publicly distributed resources, and fair accessibility should be ensured by measuring the rationality of the distribution of public services [54,55,56,57]. Studies have evaluated urban spatial service delivery and examined location-based accessibility in the context of social inequality. Representative methods for measuring spatial equity include analysis of variance (ANOVA), Spearman correlation, Lorenz curve, Gini coefficient, and bivariate local Moran’s I [58,59,60]. Some studies that analyzed spatial equity based on the spatial accessibility of childcare facilities suggest there is inequality in the spatial accessibility of childcare facilities due to socioeconomic factors. Neighborhoods with higher socioeconomic status enjoy improved childcare accessibility, but public funding is insufficient to cover equal access across all neighborhoods [61,62,63]. Market-oriented early childhood education institutions are not evenly distributed according to demand, indicating that residential location based on parental income and occupation leads to educational inequality [64].
This study addresses the following research question: Does a gap in spatial equity based on accessibility to childcare facilities exist according to housing type? Although factors such as socioeconomic status and parental income affect the accessibility of childcare facilities, the influence of housing type in the physical environment is also an important factor. Infrastructure level, which depends on whether an area consists of high-density or low-density housing, also has an effect on children with limited mobility [65]. It is important to measure spatial equity from various perspectives and factors. By (i) identifying areas where childcare facilities are either oversupplied or undersupplied and (ii) examining whether unequal gaps in facility accessibility occur based on residential types, this study aims to bridge the gap between low-rise residential areas and apartment areas.
This study focused on Seongbuk-gu in Seoul, analyzing the child population in infancy, early childhood, and elementary school in 294 childcare facilities.

2. Materials and Methods
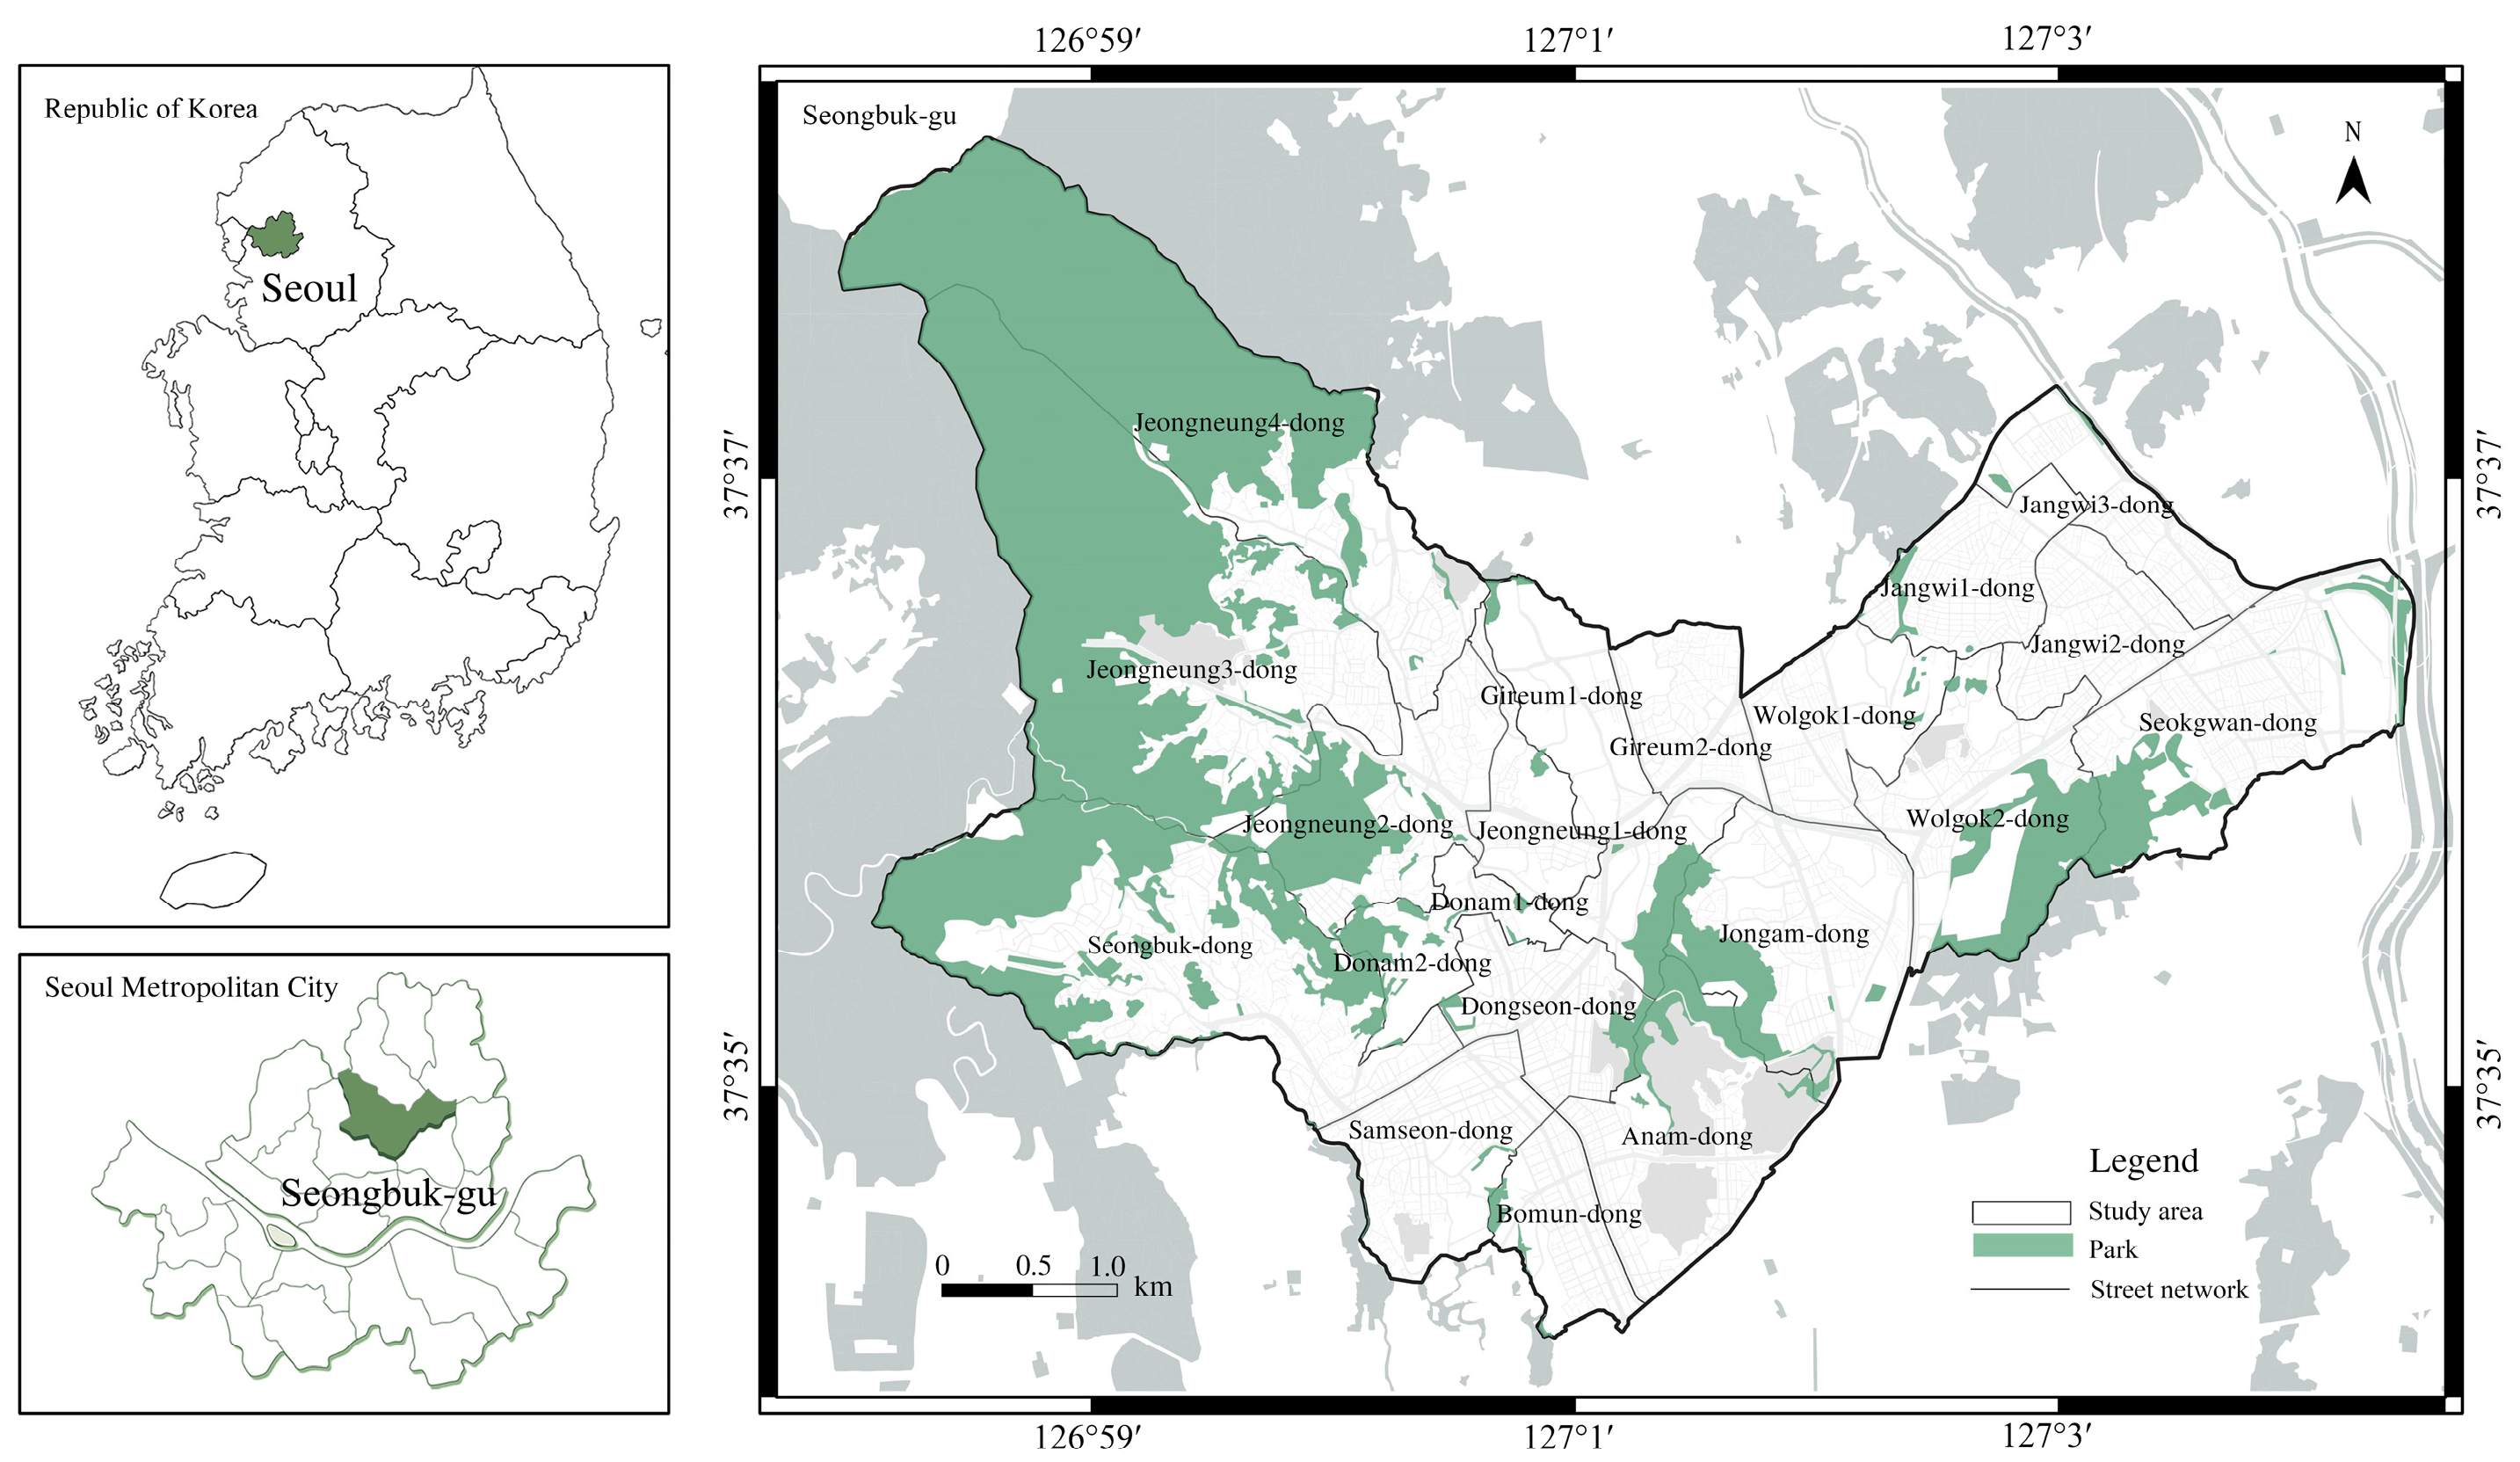
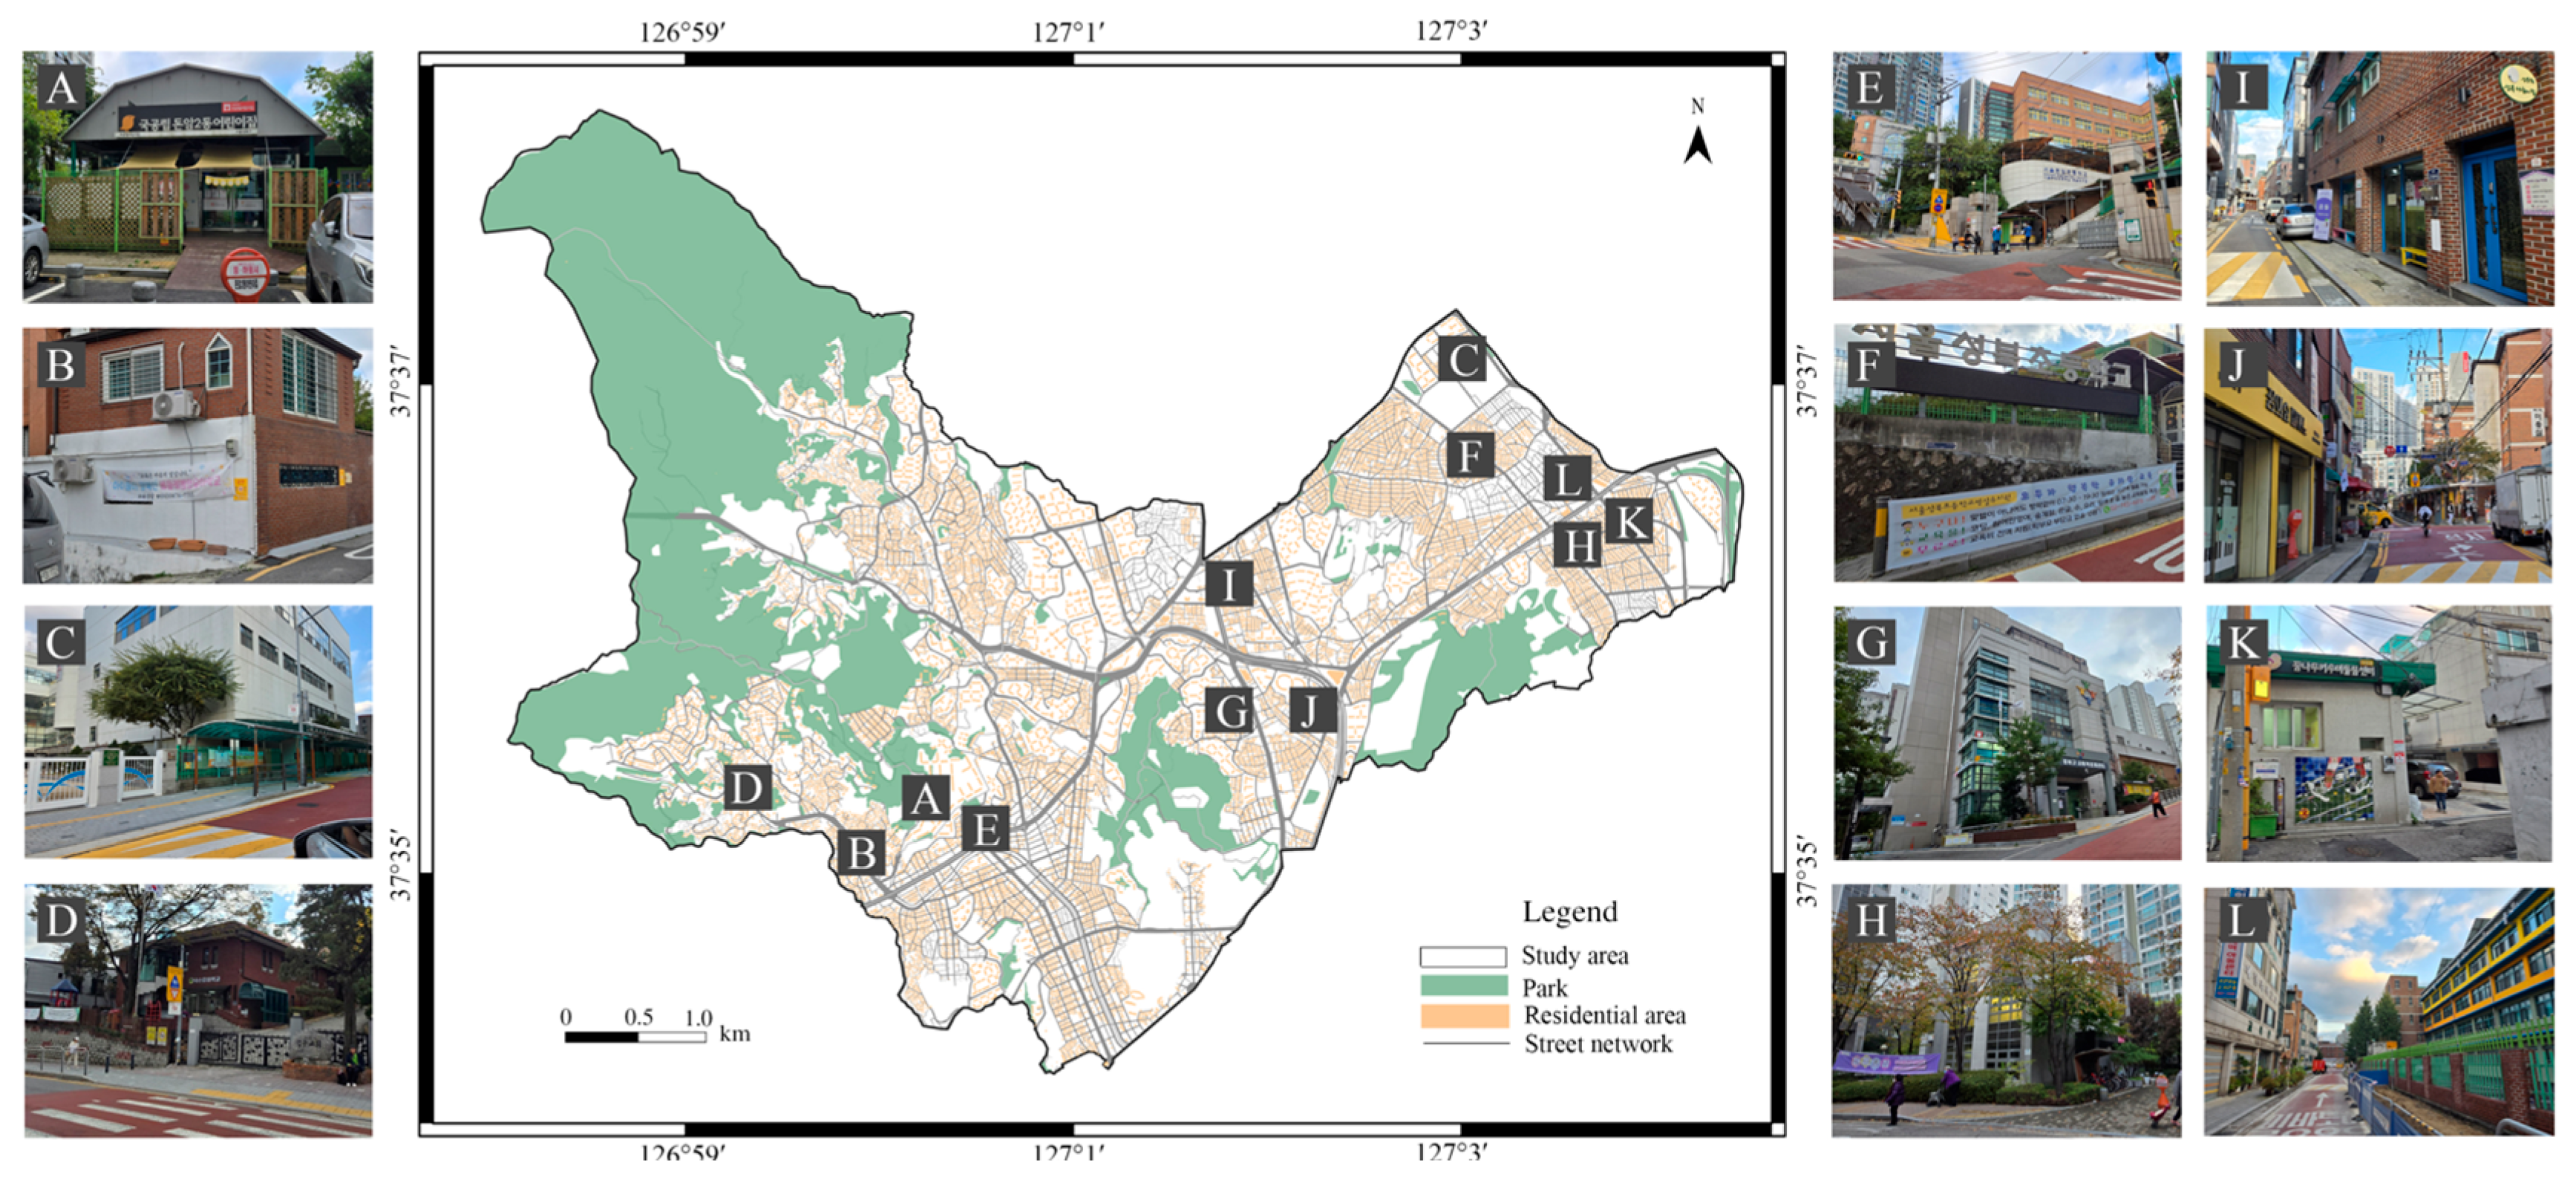
2.1. Study Area

Seongbuk-gu is an autonomous district in Seoul, South Korea’s capital, which serves as a link between the city’s central and northeastern regions. It spans an area of 24.58 km2 and has a population of approximately 430,000. In 2013, Seongbuk-gu became the first district in South Korea certified as a UNICEF Child-Friendly City. Seongbuk-gu comprises 20 neighborhoods with a well-developed road network. It features a mix of residential areas, including apartments, multi-family housing, and single-family homes. A park is located at the northwest boundary of the district (Figure 1) [66,67].

2.2. Data Sources and Processing

2.2.1. Population and Road Data

The child population in Seongbuk-gu was assessed using 100 m × 100 m grid-based population statistics from the Geocoding Database provided by the National Geographic Information Institute. Seongbuk-gu consists of 2654 grids with a total child population of 27,994. The child population was categorized into infancy and early childhood (ages 1–7) and elementary school (ages 8–13). The results showed 11,086 children in infancy and early childhood and 16,908 children in elementary school. Regarding housing type, 17,947 children (64.1%) resided in apartments, while 10,047 (35.9%) lived in low-rise residential areas (Table 1). For road data, the 2021 Seongbuk-gu transportation network GIS database and network road data were sourced from the KTDB National Transportation Database.

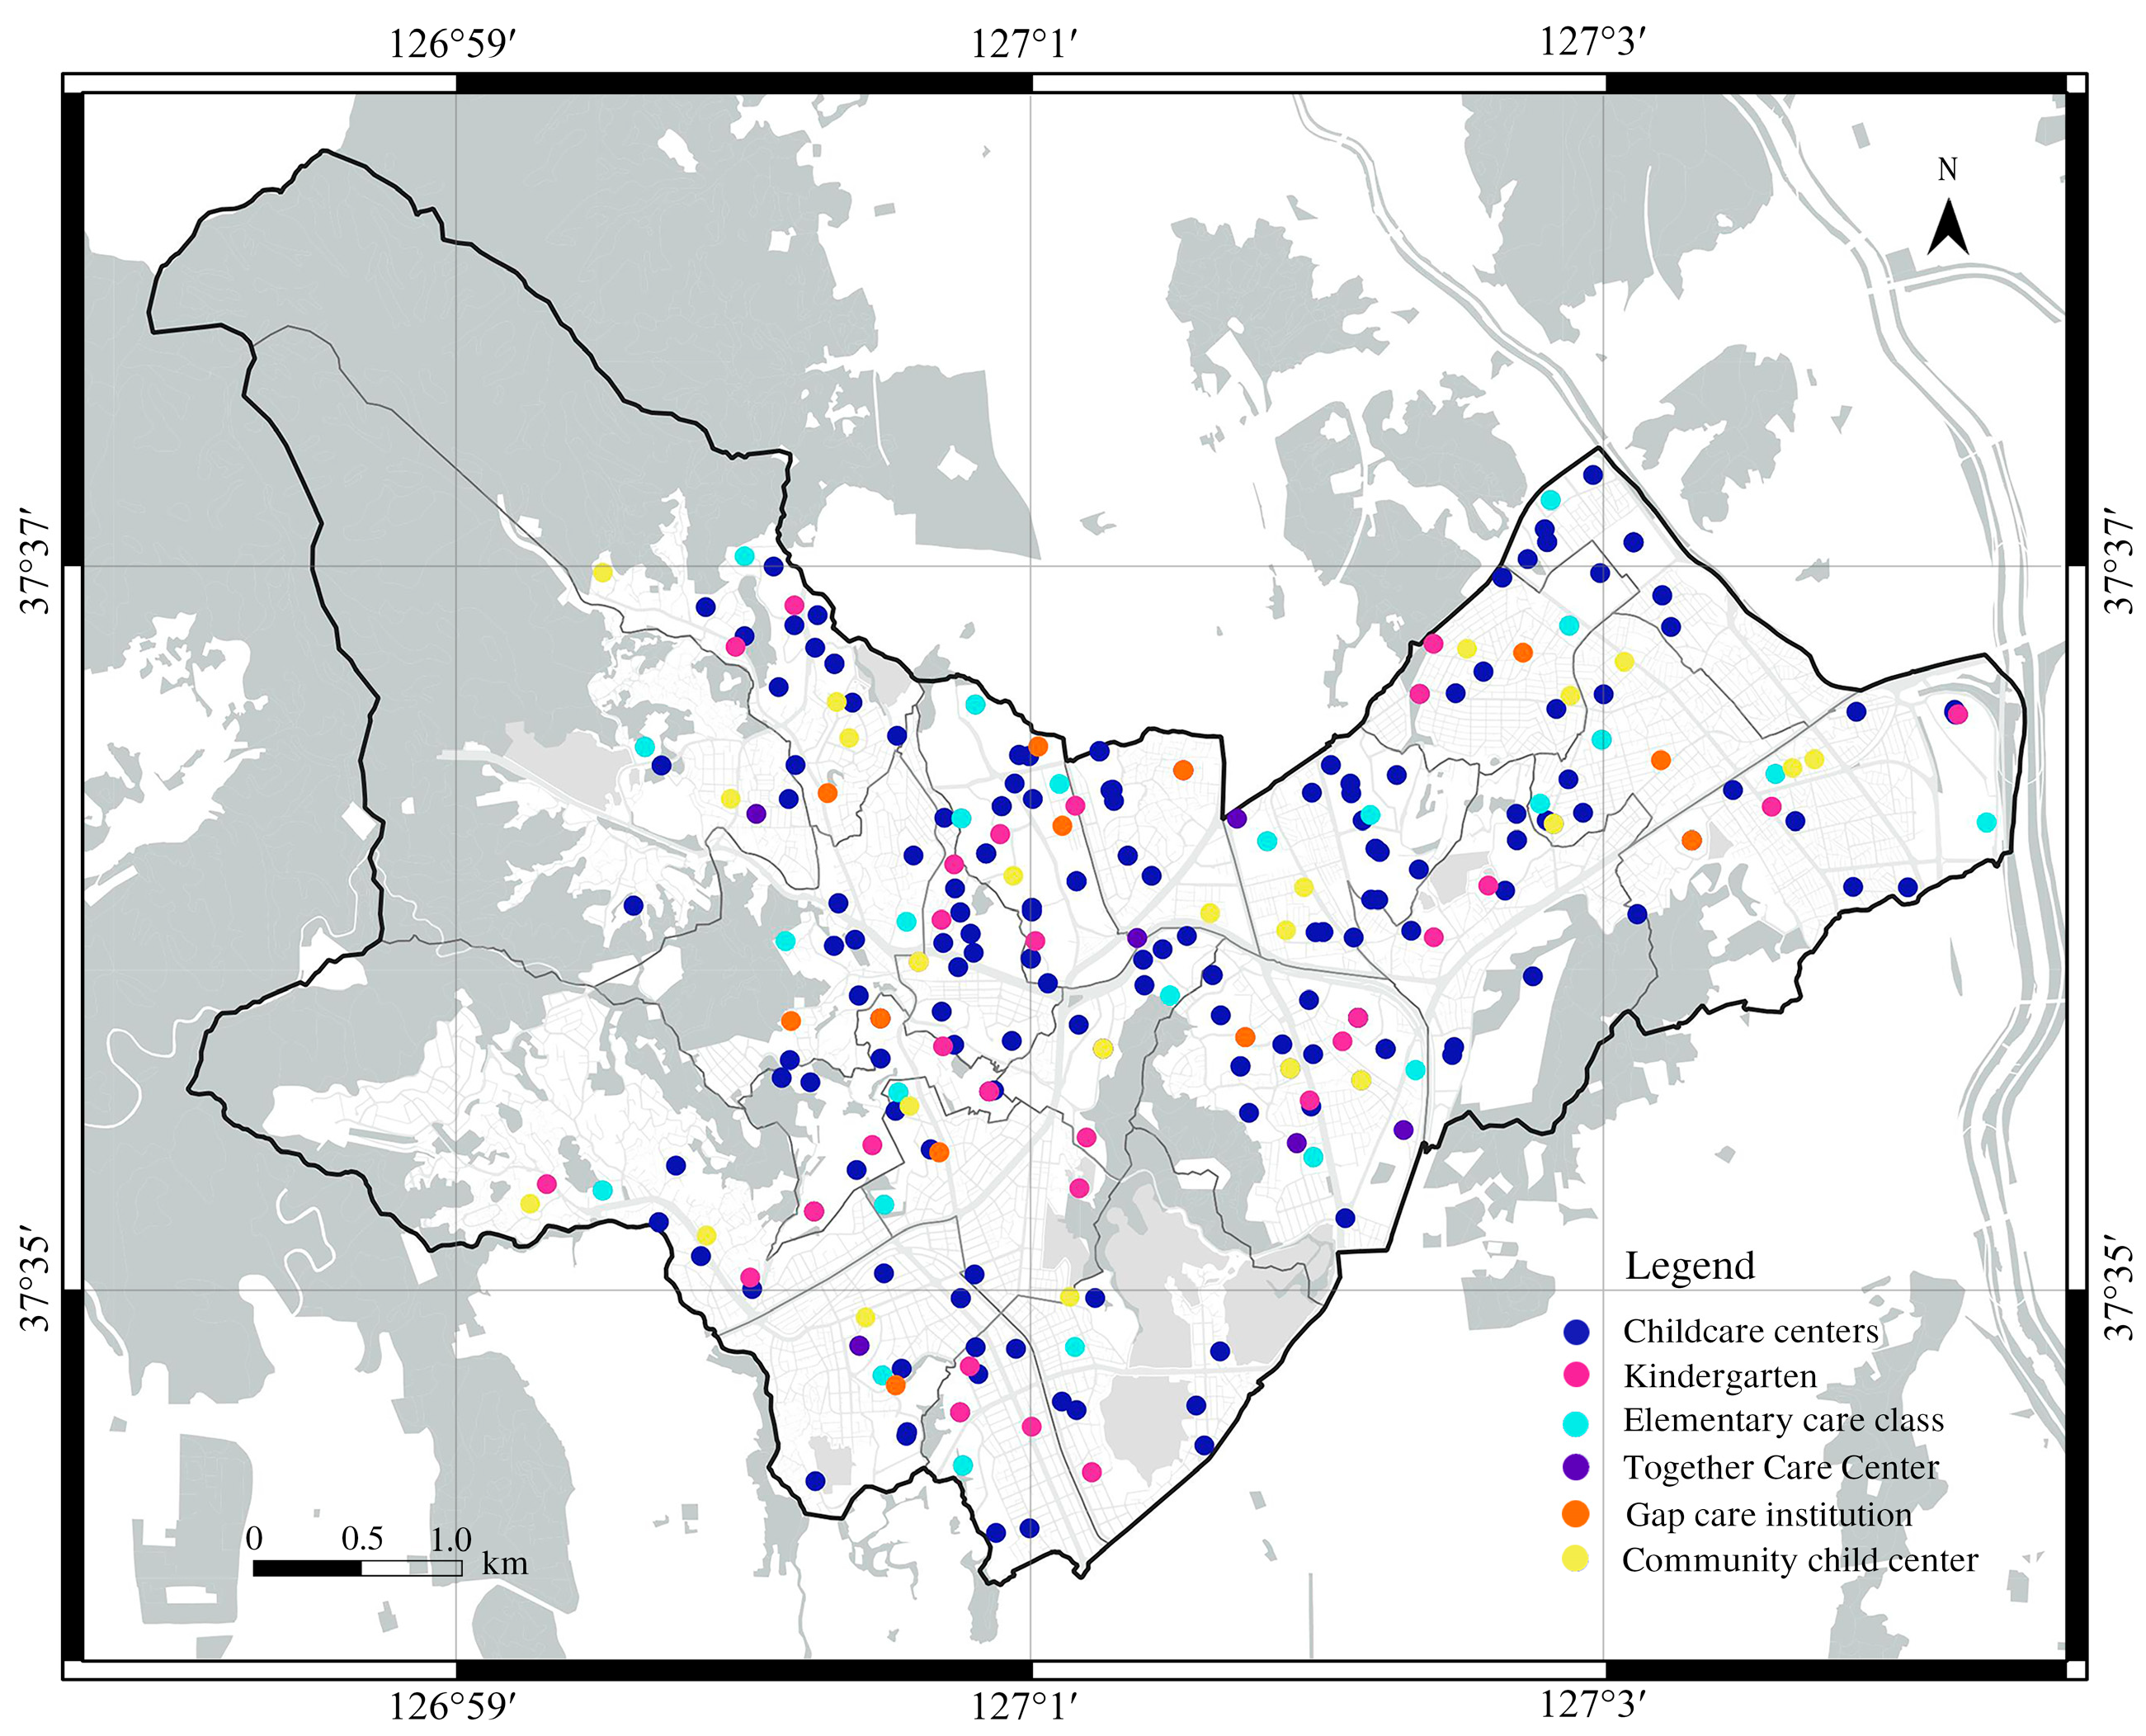
2.2.2. Childcare Facilities Data

In South Korea, various types of childcare facilities are established by the central and Seoul Metropolitan governments. Representative facilities for infancy and early childhood (ages 1–7) include childcare centers and kindergartens, whereas those for elementary school years (ages 8–13) include elementary-care classes, care centers, gap care institutions, and community child centers (Table 2).
Based on data from the Seoul Open Data Plaza and Seongbuk-gu Office, data on childcare facilities in Seongbuk-gu were constructed, and facility names and addresses were geocoded to identify their geographical coordinates. Seongbuk-gu had 182 childcare centers, including home-based, public, private, and workplace childcare centers, with individual capacities for 13–143 children. There were 46 kindergartens, accommodating 10–240 children each. Elementary-care classes were set up at 24 locations. In addition, 12 care centers, 7 gap care institutions, and 23 community child centers were included in the analysis (Figure 2).
The minimum distance standards for each facility were calculated according to the national minimum standards for basic living infrastructure set by the Ministry of Land, Infrastructure, and Transport in 2018. The minimum distance standard for childcare centers was set at 250 m, corresponding to a 5 min walk. For kindergartens, elementary-care classes, care centers, and gap care institutions, the minimum distance was 500 m. Community child centers were set a minimum distance of 750 m, based on the walk standard of 10–15 min (Table 3).

2.2.3. Distribution Data by Housing Type

Housing types in Seongbuk-gu were analyzed by categorizing them into apartments and low-rise residential areas (Figure 3). Apartment areas were defined as regions with residential buildings that had five or more floors. Low-rise residential areas were defined as areas within general residential zones comprising single-family homes, with residential buildings having a floor area of 660 m2 or less, no more than four stories, and up to 19 households (including single houses, multi-family houses, and multi-unit apartment buildings) [68]. Based on the analysis of the building usage status in Seongbuk-gu, 39.2% of the total residential area comprised apartments, whereas 60.8% comprised low-rise residential areas (Table 4).

2.3. Method

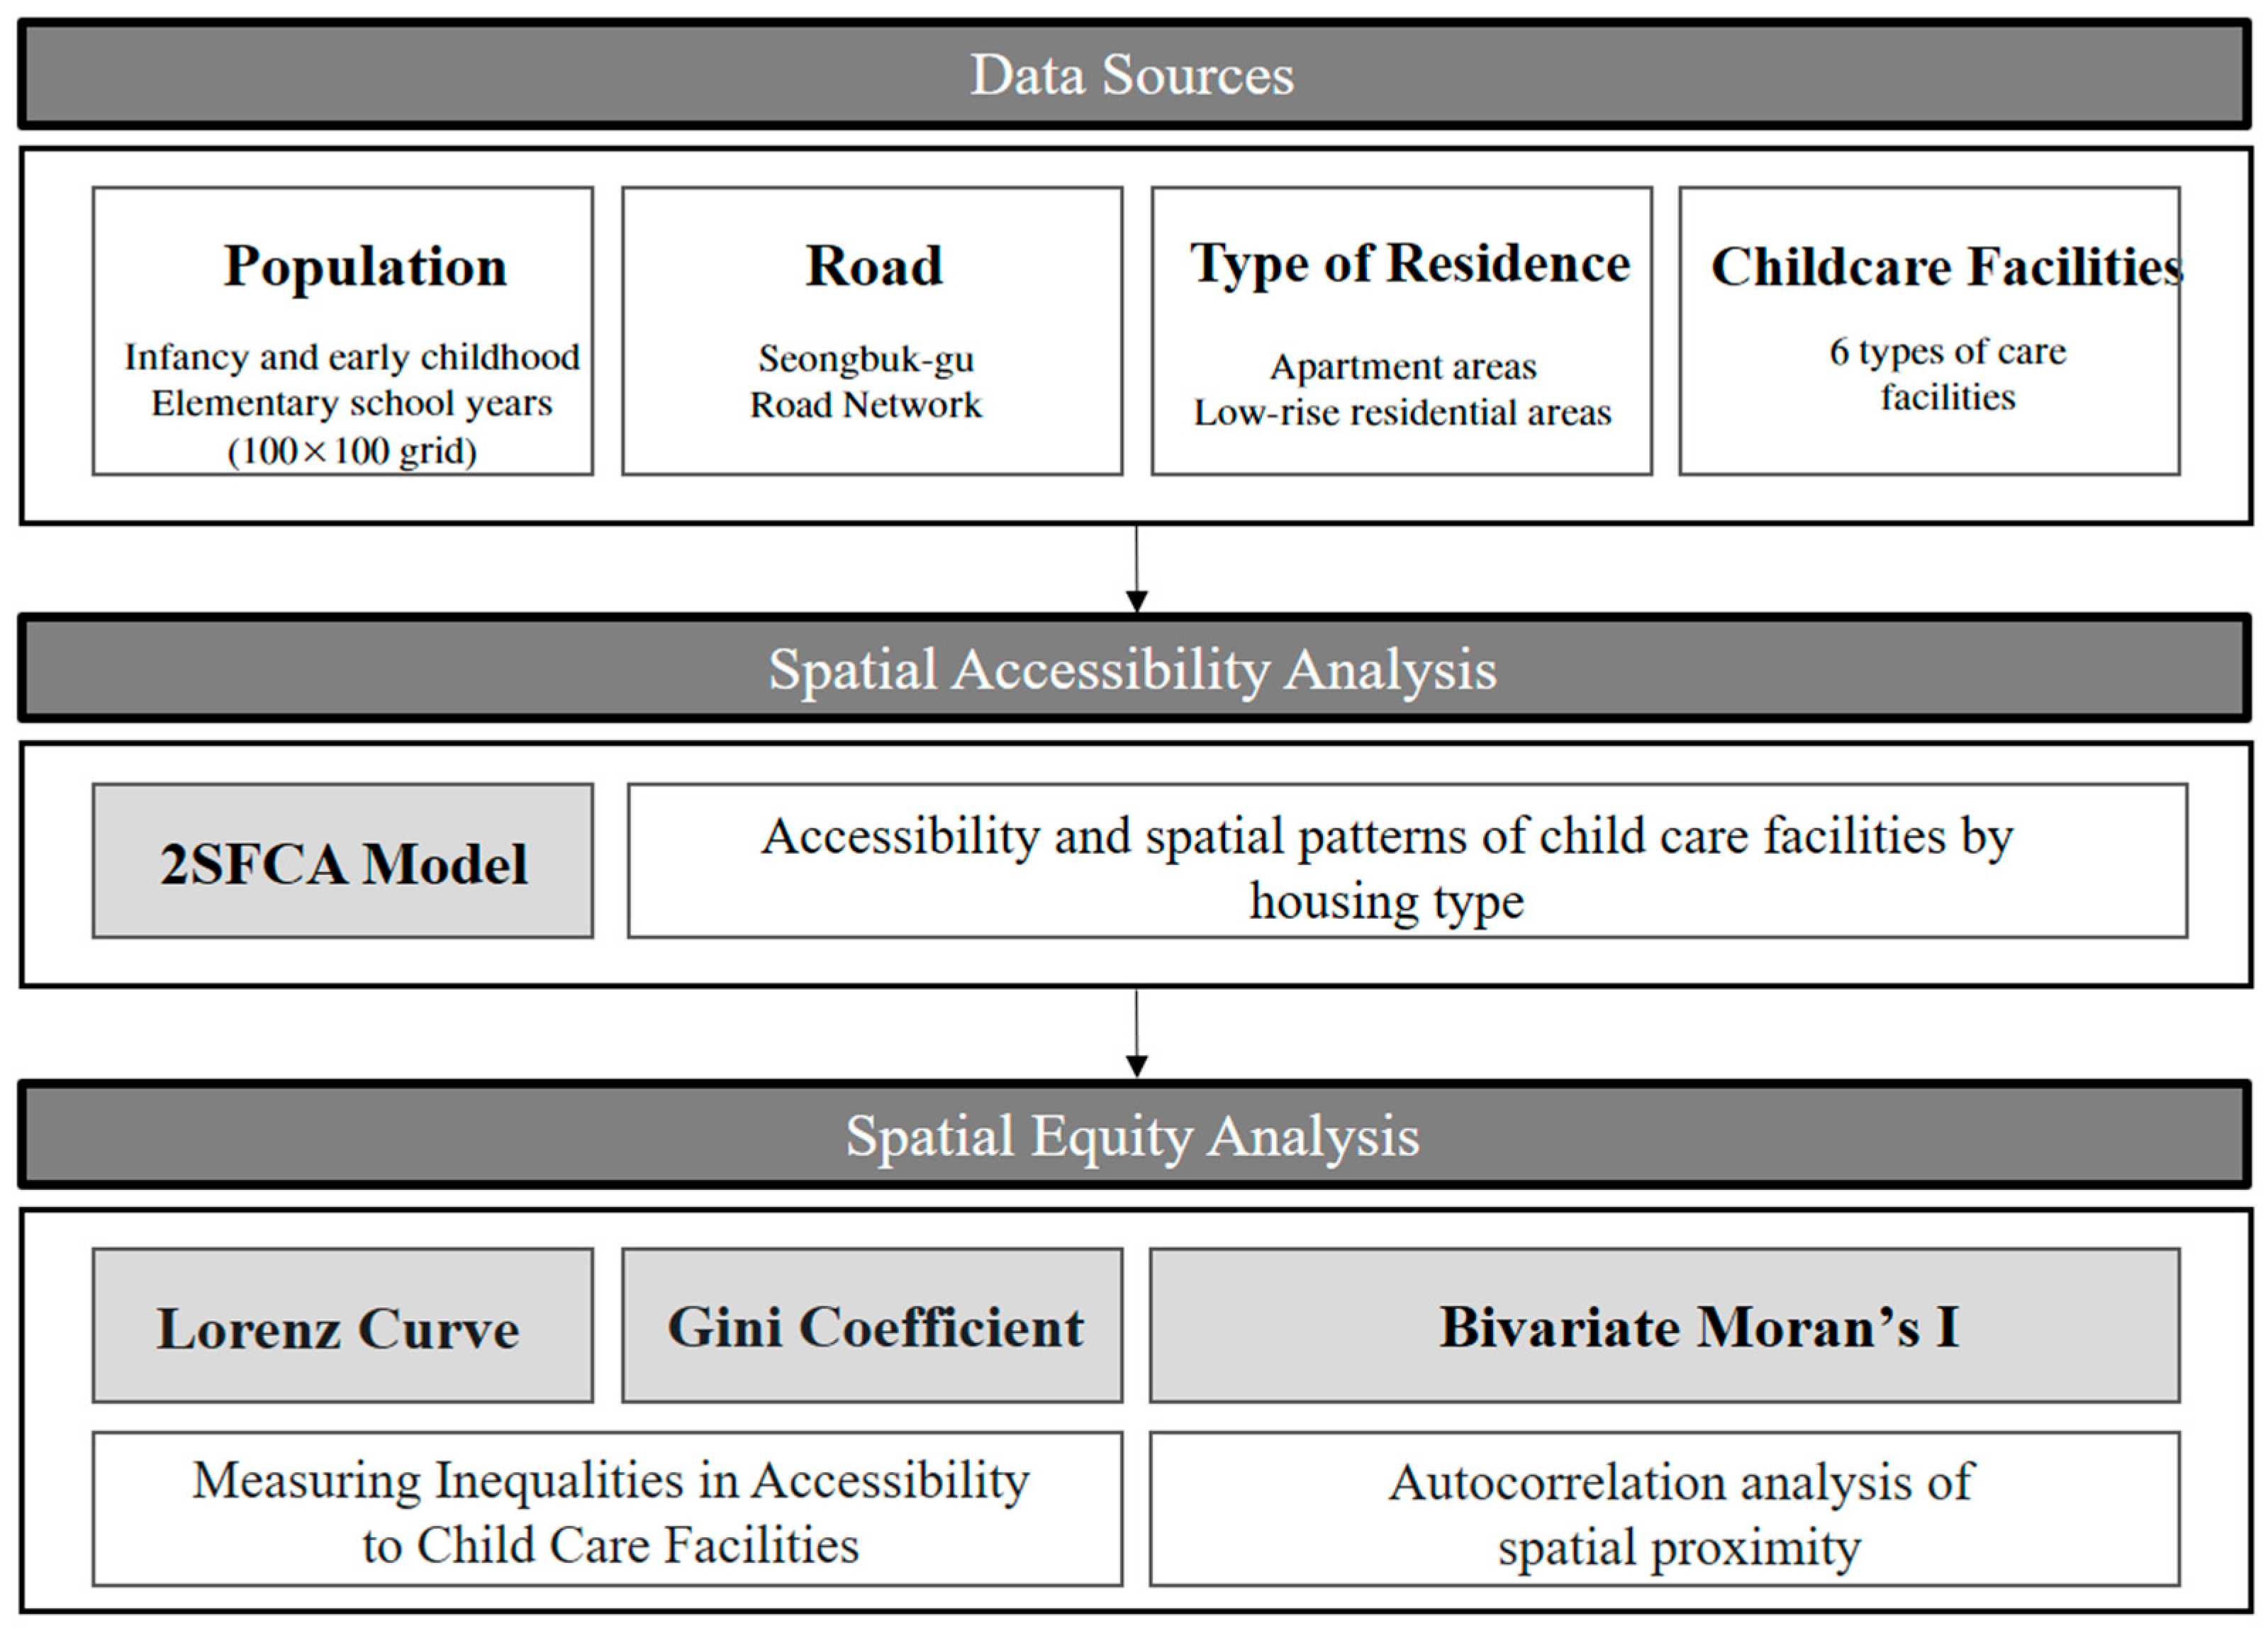
2.3.1. Research Design

First, the distribution status of the child population and childcare facilities by housing type in Seongbuk-gu was identified. Second, the gap in accessibility to childcare facilities was derived using the 2SFCA method. Third, the results of accessibility to childcare facilities and spatial equity according to population density were analyzed using the Gini index and Lorenz curve. Spatial correlation and clustering were identified using the bivariate spatial autocorrelation method. Finally, an efficient supply plan that could minimize inequality in the supply of childcare facilities in Seongbuk-gu was proposed (Figure 4).

2.3.2. Childcare Facilities Accessibility Assessment

The 2SFCA method measures accessibility based on a gravity model that considers both the spatial range of public service facilities and the spatial range that users can access [48]. It presumes equal access within the catchment area, incorporates facility radii that influence analysis, and minimally reflects distance decay. The analysis was conducted in two steps.
First, we computed the supply–demand ratio (supply capacity relative to the number of users) for each service facility (supply site). Next, we analyzed the capacity of each facility within the reachable distance of users, where A i is the spatial accessibility to location i ; S j is the supply capacity for facility j ; P k is the population size of location k ; d i j is the travel cost from location i to location j . Here, P k is the population of census tract center k within the catchment area; S j is the supply capacity of facility j ; d k j is the travel cost from location k to location j ; and d 0 is the critical travel time for each facility site j , which represents the critical distance from the facility to the demand center within the catchment area.
The index R j for Step 1 was calculated as the sum of the child population in the 100 m × 100 m grid cells within a 250–750 m buffer, depending on each facility’s criteria. The available distance and travel time for users to reach the facility were based on walking time. The critical distance is the spatial limit within which the service is available; in this study, the network distance was used. Demand within a critical distance is typically based on administrative or census boundaries; this study used the population center of a 100 m × 100 m grid [69].
R j = S j k d k j d 0 P k
In Step (2), the value is the sum of the provider-to-demand ratios R j from Step (1), which corresponds to the final spatial accessibility of each region. The second stage calculates the sum Ai of the Step (1) indices for all facilities within each demand center’s buffer radius.
A i = j d i j d 0 R j
The analysis tool used was the geographic information analysis program QGIS version 3.34. To normalize the accessibility values of childcare facilities regarding demand and supply, the areas were classified into six categories using the natural breaks method to assess the level of accessibility. The six categories are Inaccessible (I), Very High (VH), High (H), Medium (M), Low (L), and Very Low (VL). A lower PPR value in the 2SFCA analysis indicates a region with poor accessibility. Among these categories, “I” means that there are no facilities within the 100 m × 100 m grid or no child population within the radius of the childcare facility. The greater the supply relative to demand, the better the accessibility to childcare facilities. Conversely, when supply is insufficient to meet demand, accessibility to childcare facilities is considered poor.

2.3.3. Evaluation of Equity in the Demand and Supply of Childcare Facilities

The spatial equity of childcare facilities in Seongbuk-gu was evaluated using the Gini coefficient and Lorenz curve, these being the most suitable indicators for measuring societal inequality. The Lorenz curve represents income distribution among a population as a cumulative distribution function. The Gini coefficient is a statistical index used to indicate the degree of inequality, which was analyzed based on the cumulative proportion of the child population and accessibility to the six types of childcare facilities. The results were derived by excluding I regions from the accessibility results. The Gini coefficient was calculated using Equations (3) and (4), where G denotes the Gini coefficient; Sk is the area under the Lorentz curve; Xk is the cumulative percentage on the horizontal axis; and Yk is the cumulative percentage on the vertical axis [43]. The Gini coefficient is used to indicate the degree of inequality in a distribution and is expressed as a value between zero and one. A Gini coefficient value close to 1 indicates a high level of inequality, while 0 represents perfect equality, and −1 indicates complete inequality [70]. Generally, a Gini coefficient below 0.2 represents perfect equality in distribution; 0.2–0.3 is relatively equal; 0.3–0.4 indicates moderate inequality; 0.4–0.5 indicates significant imbalance; and a value above 0.5 represents severe inequality [71].
G = 0.5 k = 1 S k 1 2 = 2 × ( 0.5 k = 1 n S k )
k = 1 n S k = k = 1 n X k X k 1 × Y k + Y k 1 × 1 2
Next, Bivariate Moran’s I analysis was conducted using GeoDa version 1.22 to identify the spatial clustering of childcare facilities in Seongbuk-gu. The variables for the child population and accessibility values for each facility were set, and the spatial correlation and impact of adjacency on each variable were measured. The bivariate spatial autocorrelation analysis (Bivariate Moran’s I) equation is given in Equation (5). If the values of a specific area and the weighted average of the surrounding areas are similar, this indicates a positive spatial autocorrelation (+). In contrast, if they are dissimilar, this indicates a negative spatial autocorrelation (−), where n is the number of observation units, and Wij is the weight between units i and j. If i and j are neighbors, the value is 1; otherwise, it is 0. xi represents the value of variable X for the target area; xj represents the value of variable X for the neighboring area; and −x represents the overall mean of variable X. The formula for Bivariate Moran’s I LISA analysis is shown in Equation (6) [72].
B i v a r i a t e   M o r a n s   I = n S o × Σ i Σ j W i j x i X ¯ Y i Y ¯ Σ i y i Y ¯ 2
B i v a r i a t e   L I S A : I i = n x i X ¯ Σ i y i Y ¯ 2 j w i j y i Y ¯
The results of the Bivariate Local Moran’s I analysis were classified into four types based on the spatial relationship between the target area and its neighboring areas [73] (Table 5).

3. Results

3.1. Childcare Facilities Service Capacity and Population Demand

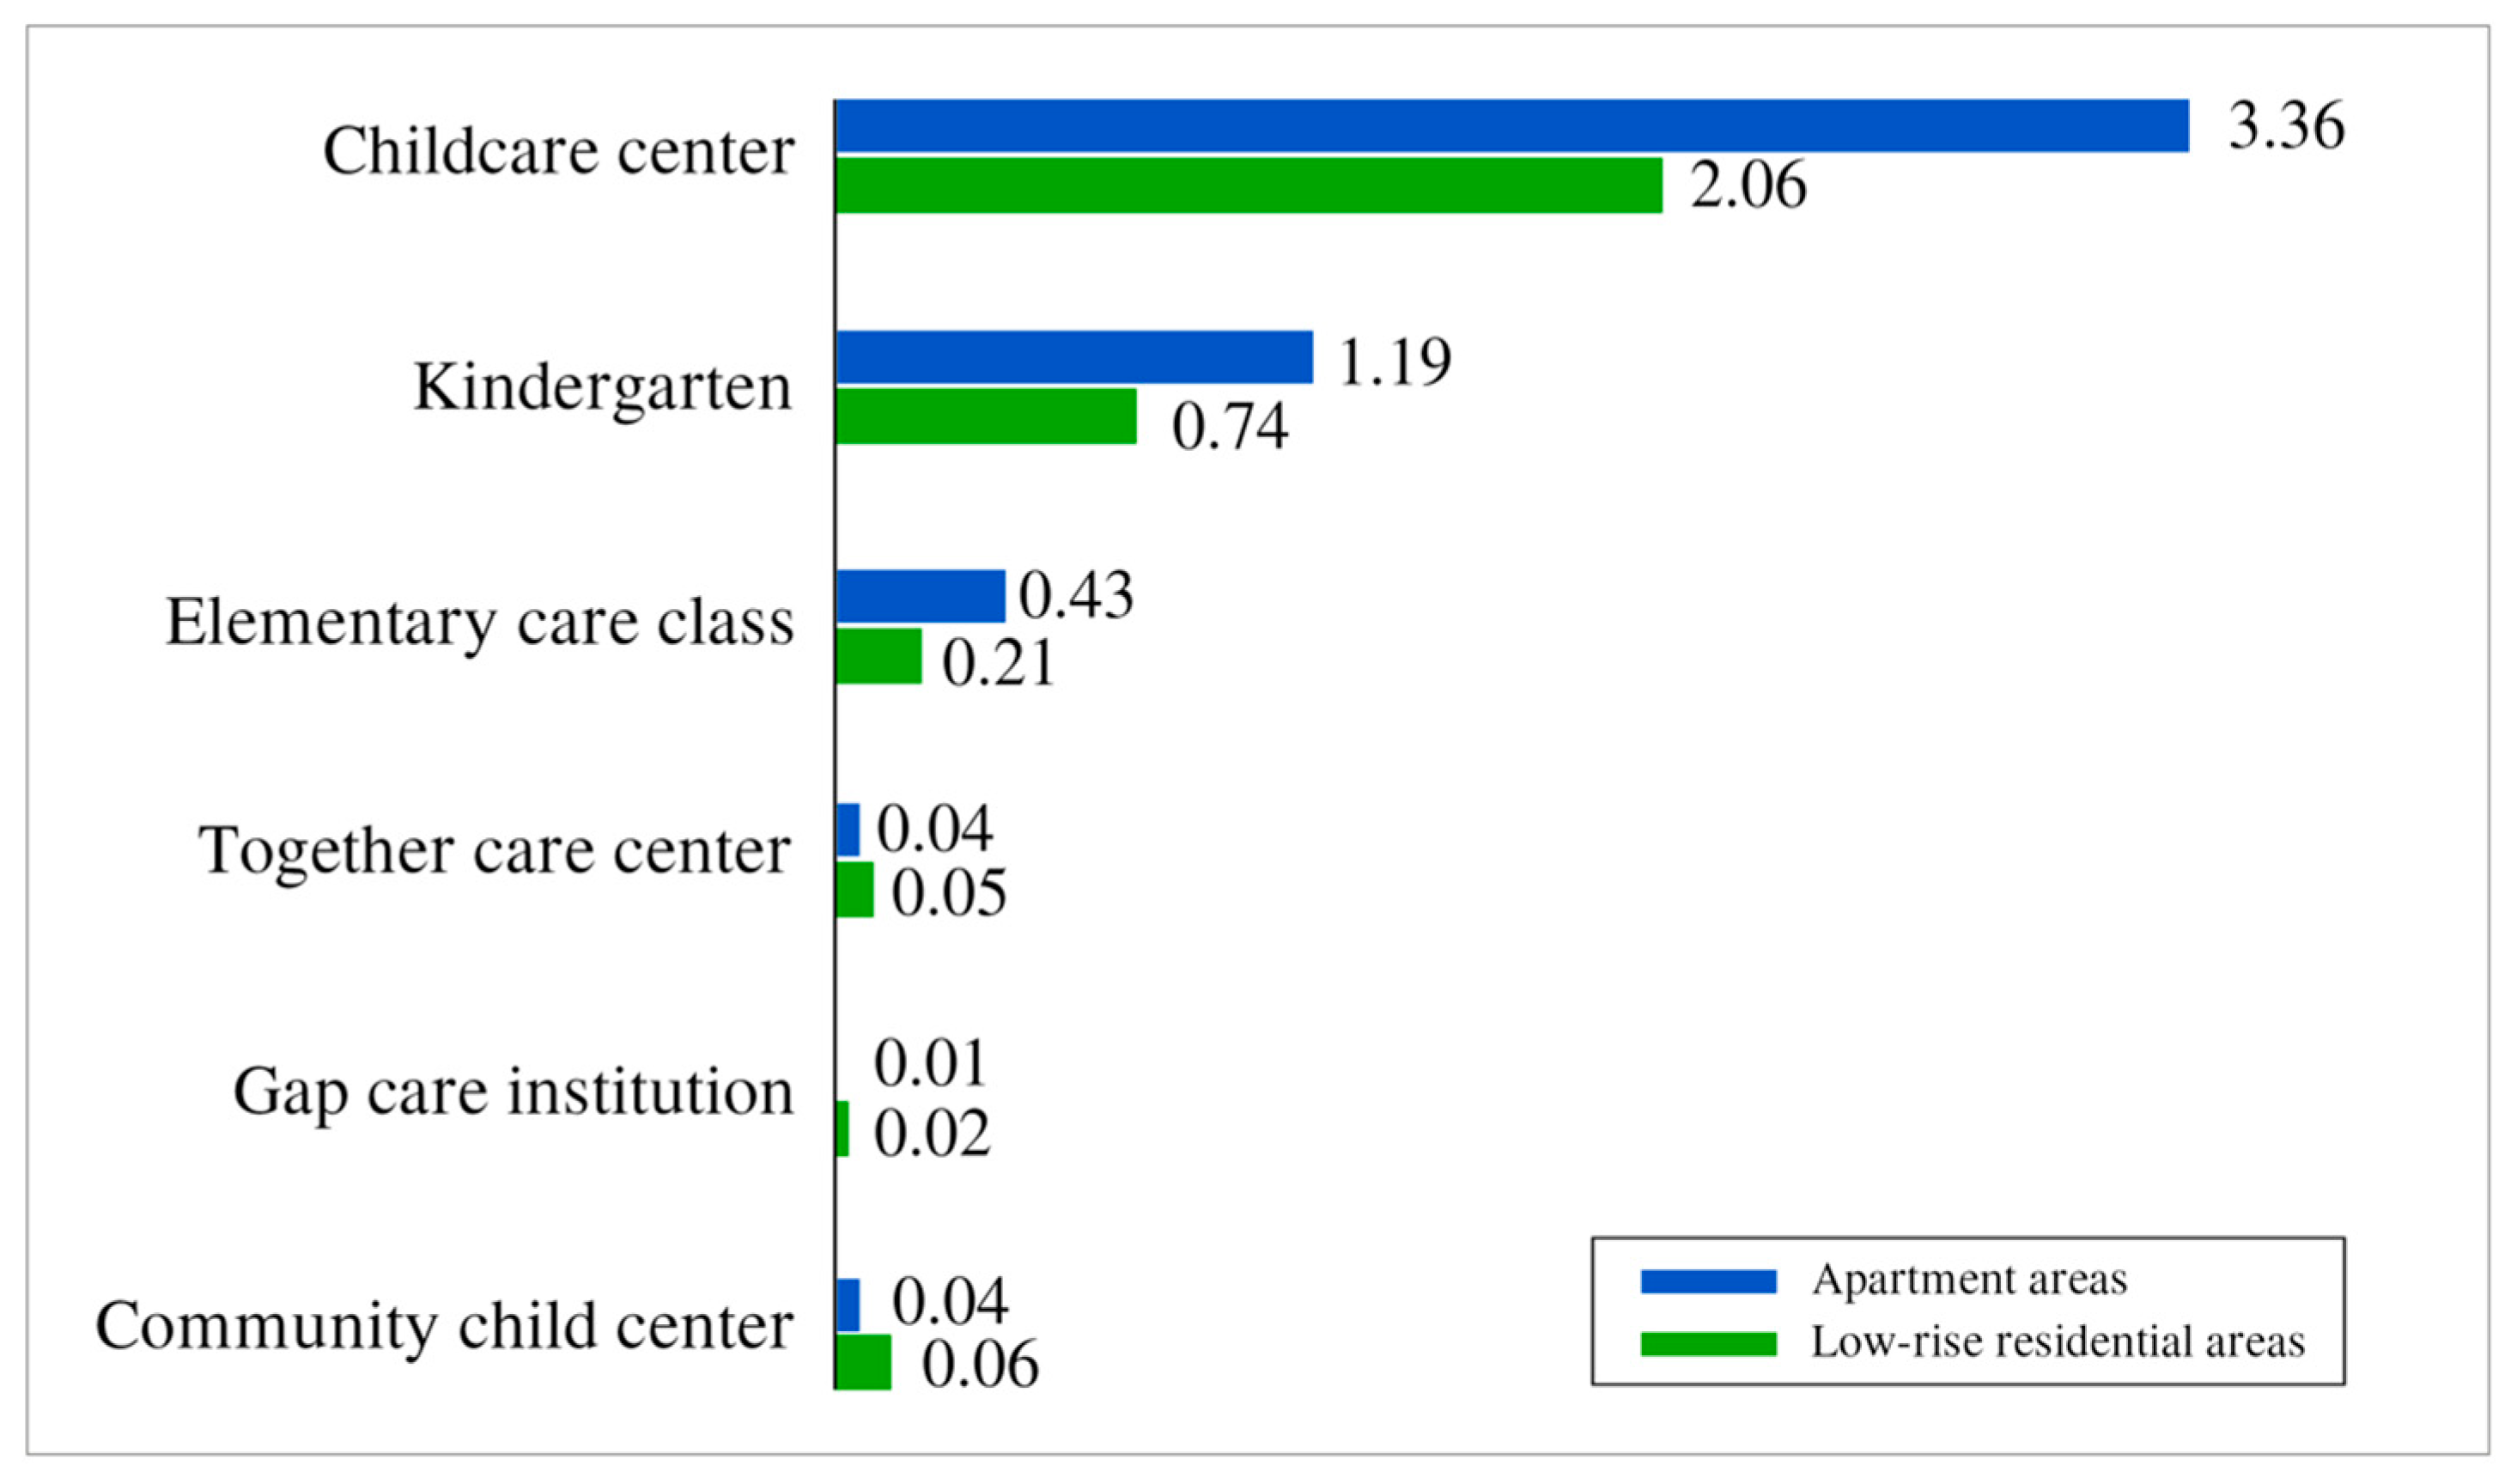
3.1.1. Characteristics of Childcare Facilities Supply

When examining the supply characteristics of childcare facilities by housing type, 34 more childcare centers were found in apartment areas compared to low-rise residential areas. In contrast, kindergartens, elementary-care classes, care centers, gap care institutions, and community child centers were more concentrated in low-rise residential areas than in apartment areas (Table 6). According to the “Regulations on Standards for Housing Construction Standards”, apartment areas with 500 or more units must include childcare facilities, resulting in a larger supply in apartment areas compared to low-rise residential areas. Elementary-care classes, located within elementary schools, are required to be provided at a rate of one class for every two neighborhood residential units in older urban districts such as Seoul. Community child centers are provided in compliance with the Child Welfare Act; however, other facilities lack legal installation requirements and are supplied based on Seoul’s supply policy, creating a substantial shortage of facilities.

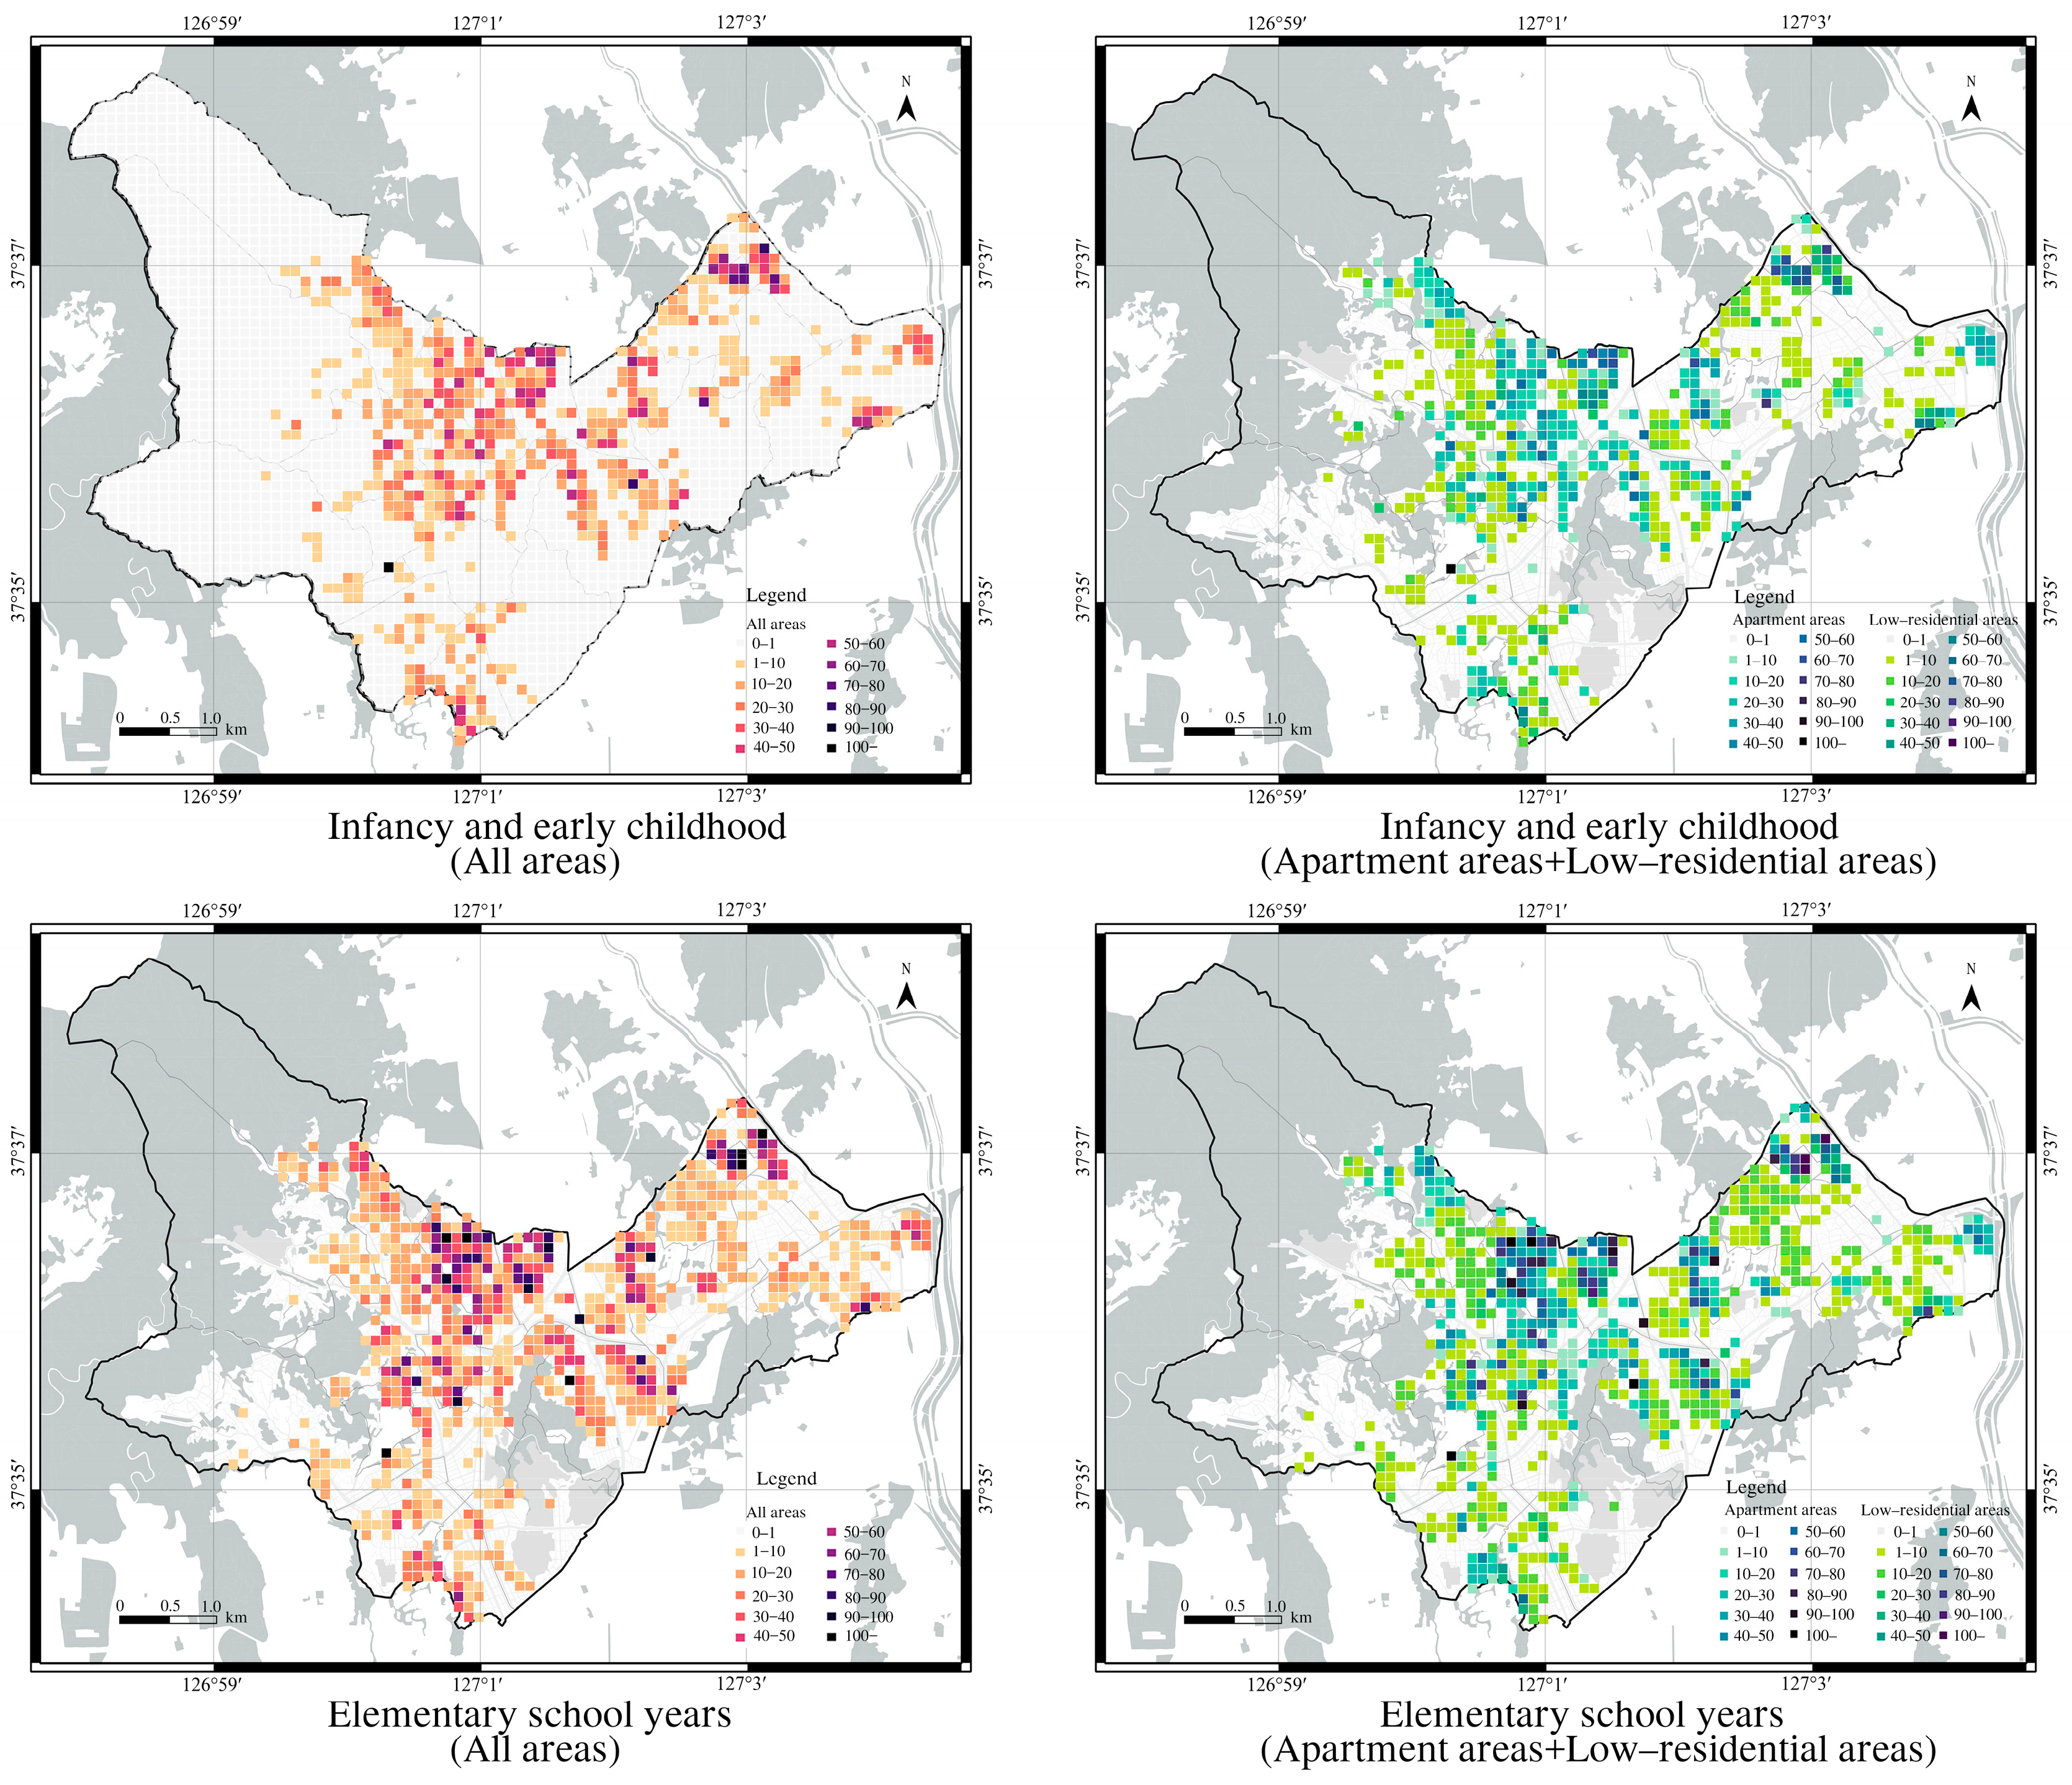
3.1.2. Characteristics of Child Population Distribution by Housing Type

This study examined the characteristics of the child population distribution by housing type in Seongbuk-gu and identified the scale of demand for childcare facilities. Grid-based characteristics showed that for the 11,086 children in infancy and early childhood, 78.15% of the areas (2074 locations) had no infancy or early childhood population, 20.57% (546 locations) had a population of 1–50, and 1.28% (34 locations) had more than 50 children. Most areas with more than 50 infants and young children were located in regions with large apartment areas. For the 16,908 elementary school years children, 73.69% of the areas (1930 locations) had no elementary school years population, 23.41% (613 locations) had a population of 1–50 children, and 2.9% (76 locations) had more than 50 children. As with infancy and early childhood, large apartment areas were concentrated in regions with more than 100 elementary schools (Figure 5).
When separated by housing type, apartment areas had a higher proportion of the population in elementary school years than in infancy and early childhood. Additionally, many areas (87.42% for infancy and early childhood and 85.61% for elementary school) had no children. In low-rise residential areas, 86.32% of infancy and early childhood areas and 81.5% of elementary school areas had no child population, and many regions had low child populations (Table 7).

3.2. Childcare Facilities Accessibility Analysis

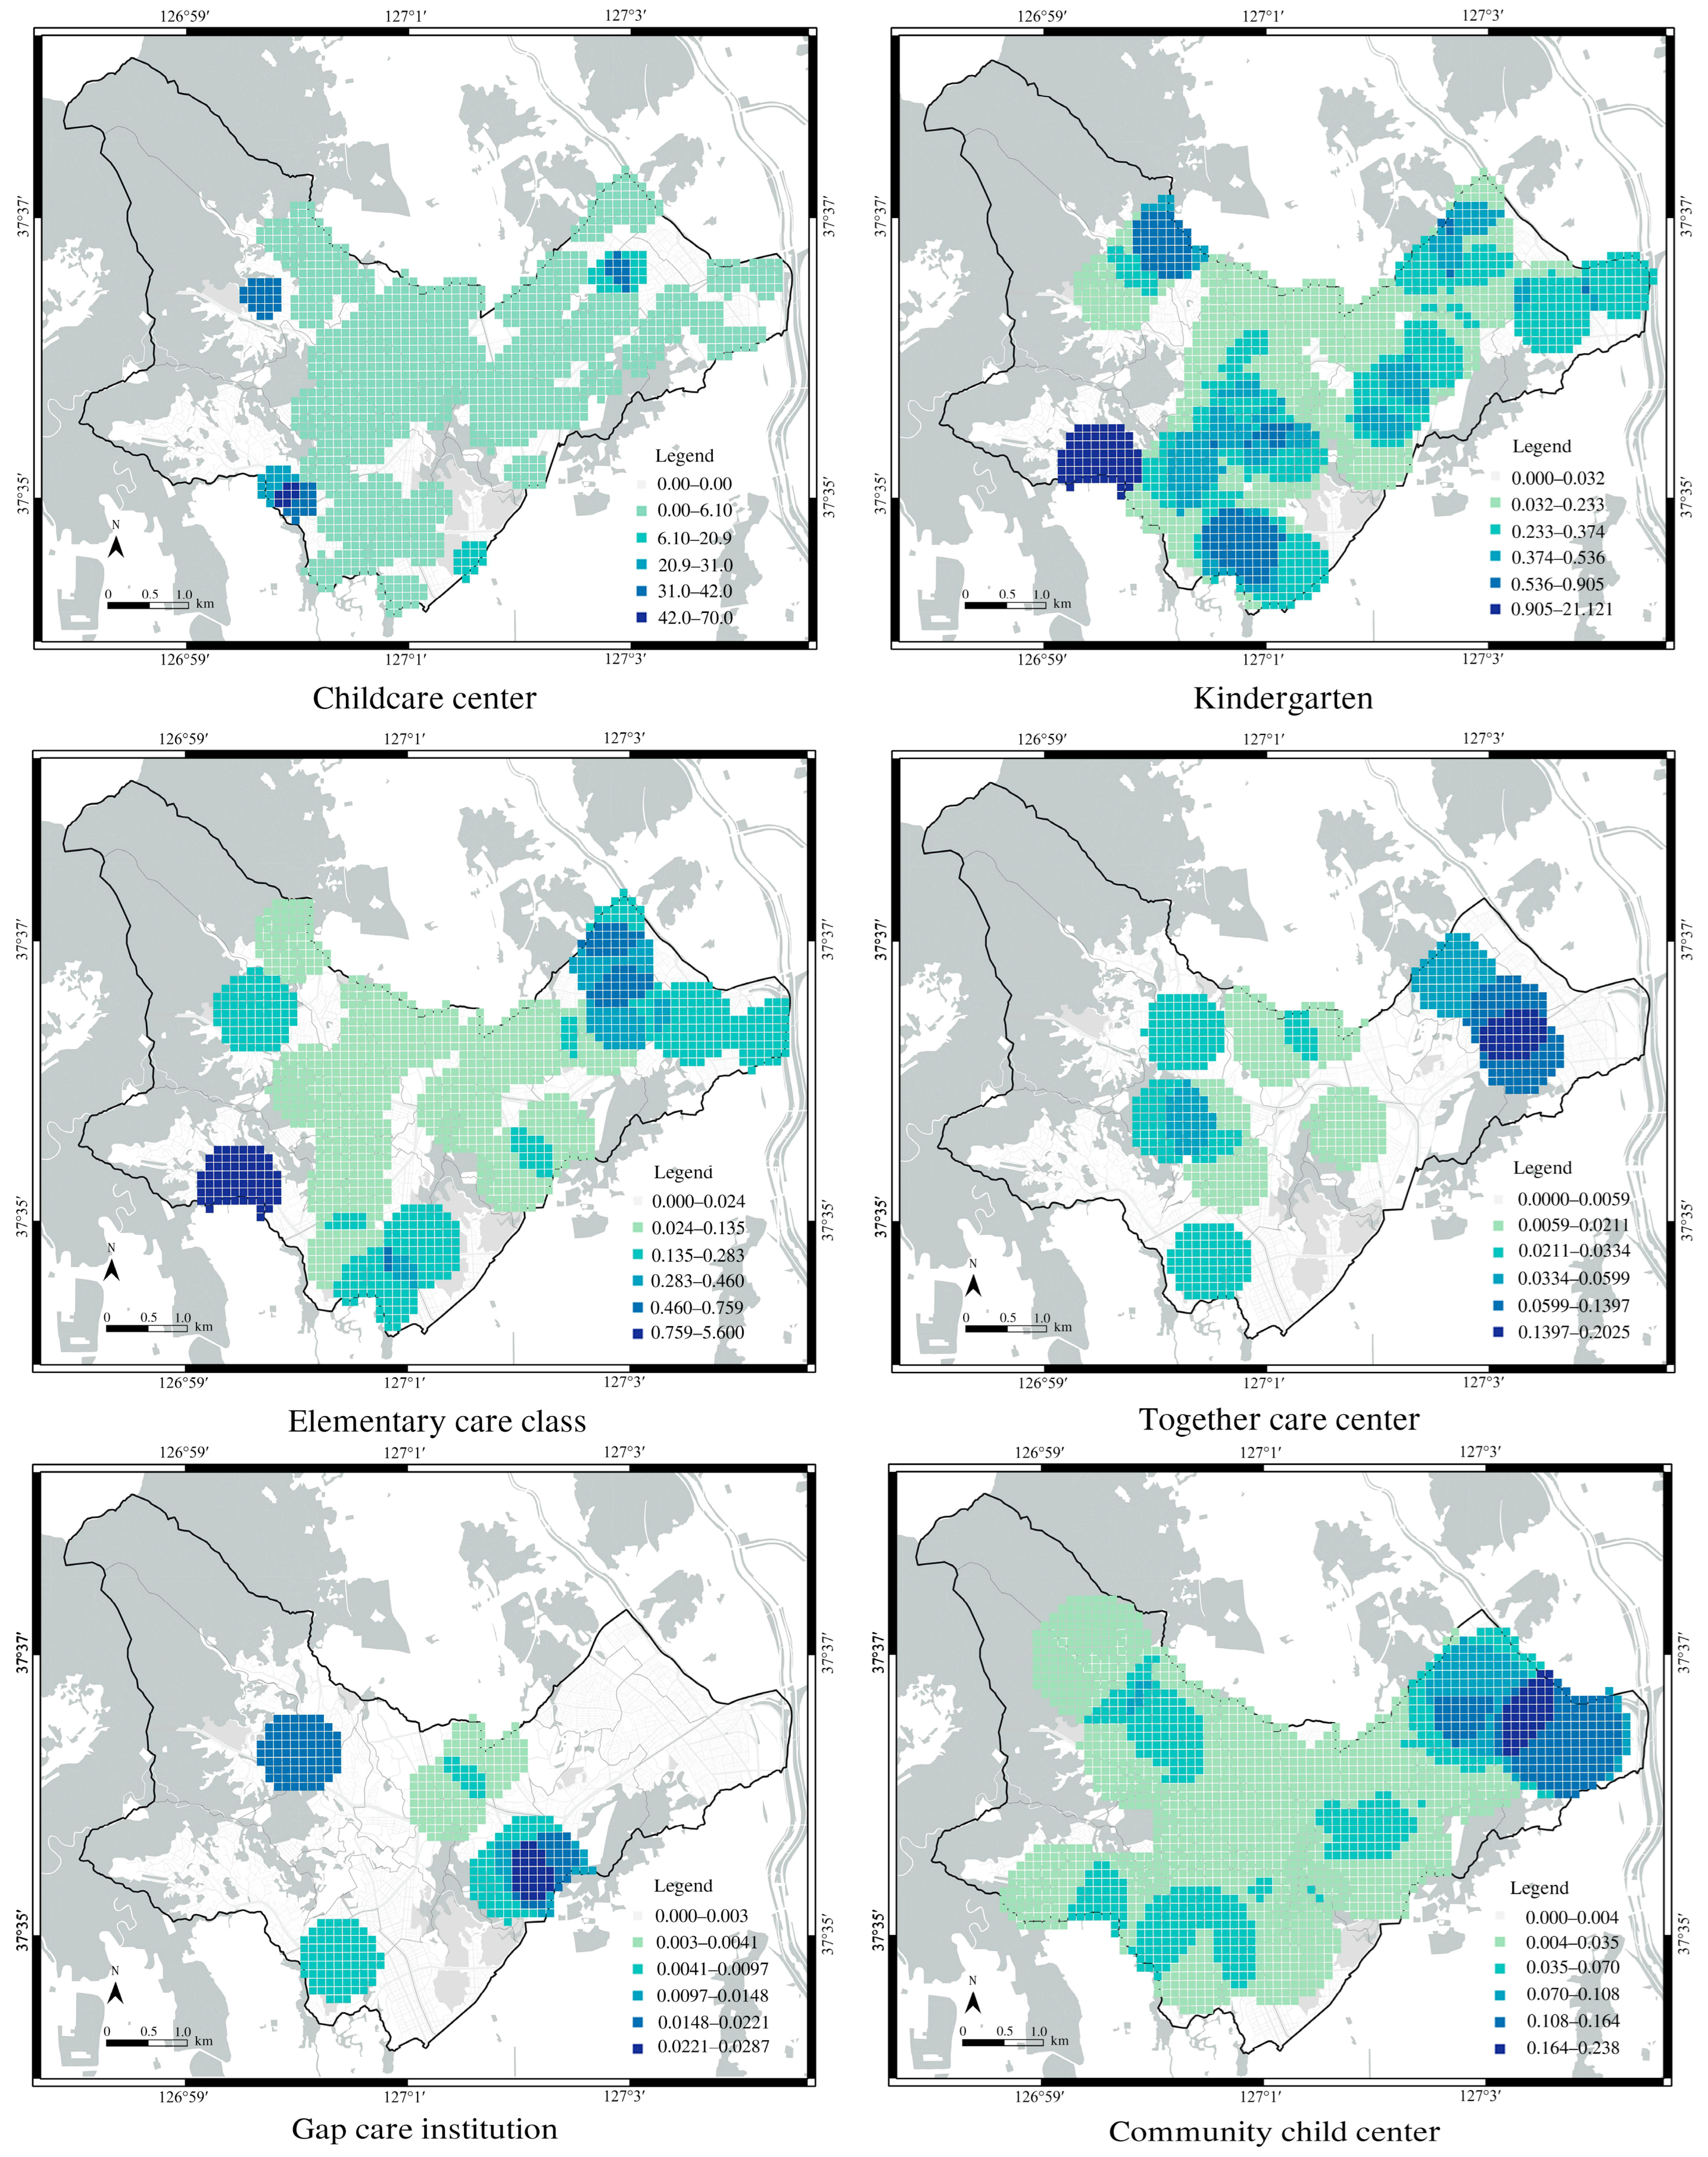
3.2.1. Spatial Accessibility Characteristics of Childcare Facilities by Child Type

The spatial accessibility of childcare facilities by child type was analyzed by categorizing the 2SFCA results into six levels (Table 8, Figure 6). For infancy and early childhood, excluding I areas, the average accessibility values for childcare centers and kindergartens were 0.542 and 0.215, respectively, with childcare centers showing better accessibility than kindergartens. I areas for childcare centers accounted for 50.79% of the total, while the combined areas of VL and L, which had the worst accessibility, accounted for 45.33%. For kindergartens, I areas accounted for 42.84%, whereas the combined VL and L areas, which had the worst accessibility, accounted for 43.75%. For elementary school years, excluding I areas, the average accessibility values for elementary-care classes, care centers, gap care institutions, and community child centers were 0.077, 0.020, 0.007, and 0.021, respectively.
Among them, gap care institutions had the worst accessibility. I areas for elementary-care classes were 49.66%, whereas the combined VL and L areas, which had the worst accessibility, accounted for 32.63%. For care centers, I areas accounted for 73.02%, with the combined VL and L areas accounting for 18.69%. Gap care institutions had the highest proportion of I areas (84.59%), whereas community child centers had a relatively low proportion of I areas (30.75%) compared with other centers and institutions. The combined VL and L areas for community child centers were 46.46%. I areas were classified in this study as regions that were difficult to measure because accessibility results could not be derived due to the absence of child populations or childcare facilities within the grid. The proportion of areas in Seongbuk-gu where accessibility values for childcare facilities could not be derived was high, and the proportions were significantly higher for care centers and gap care institutions. This phenomenon is judged to have a high likelihood of biased results being derived toward specific areas where facilities are currently concentrated when analyzing equity based on accessibility result values.

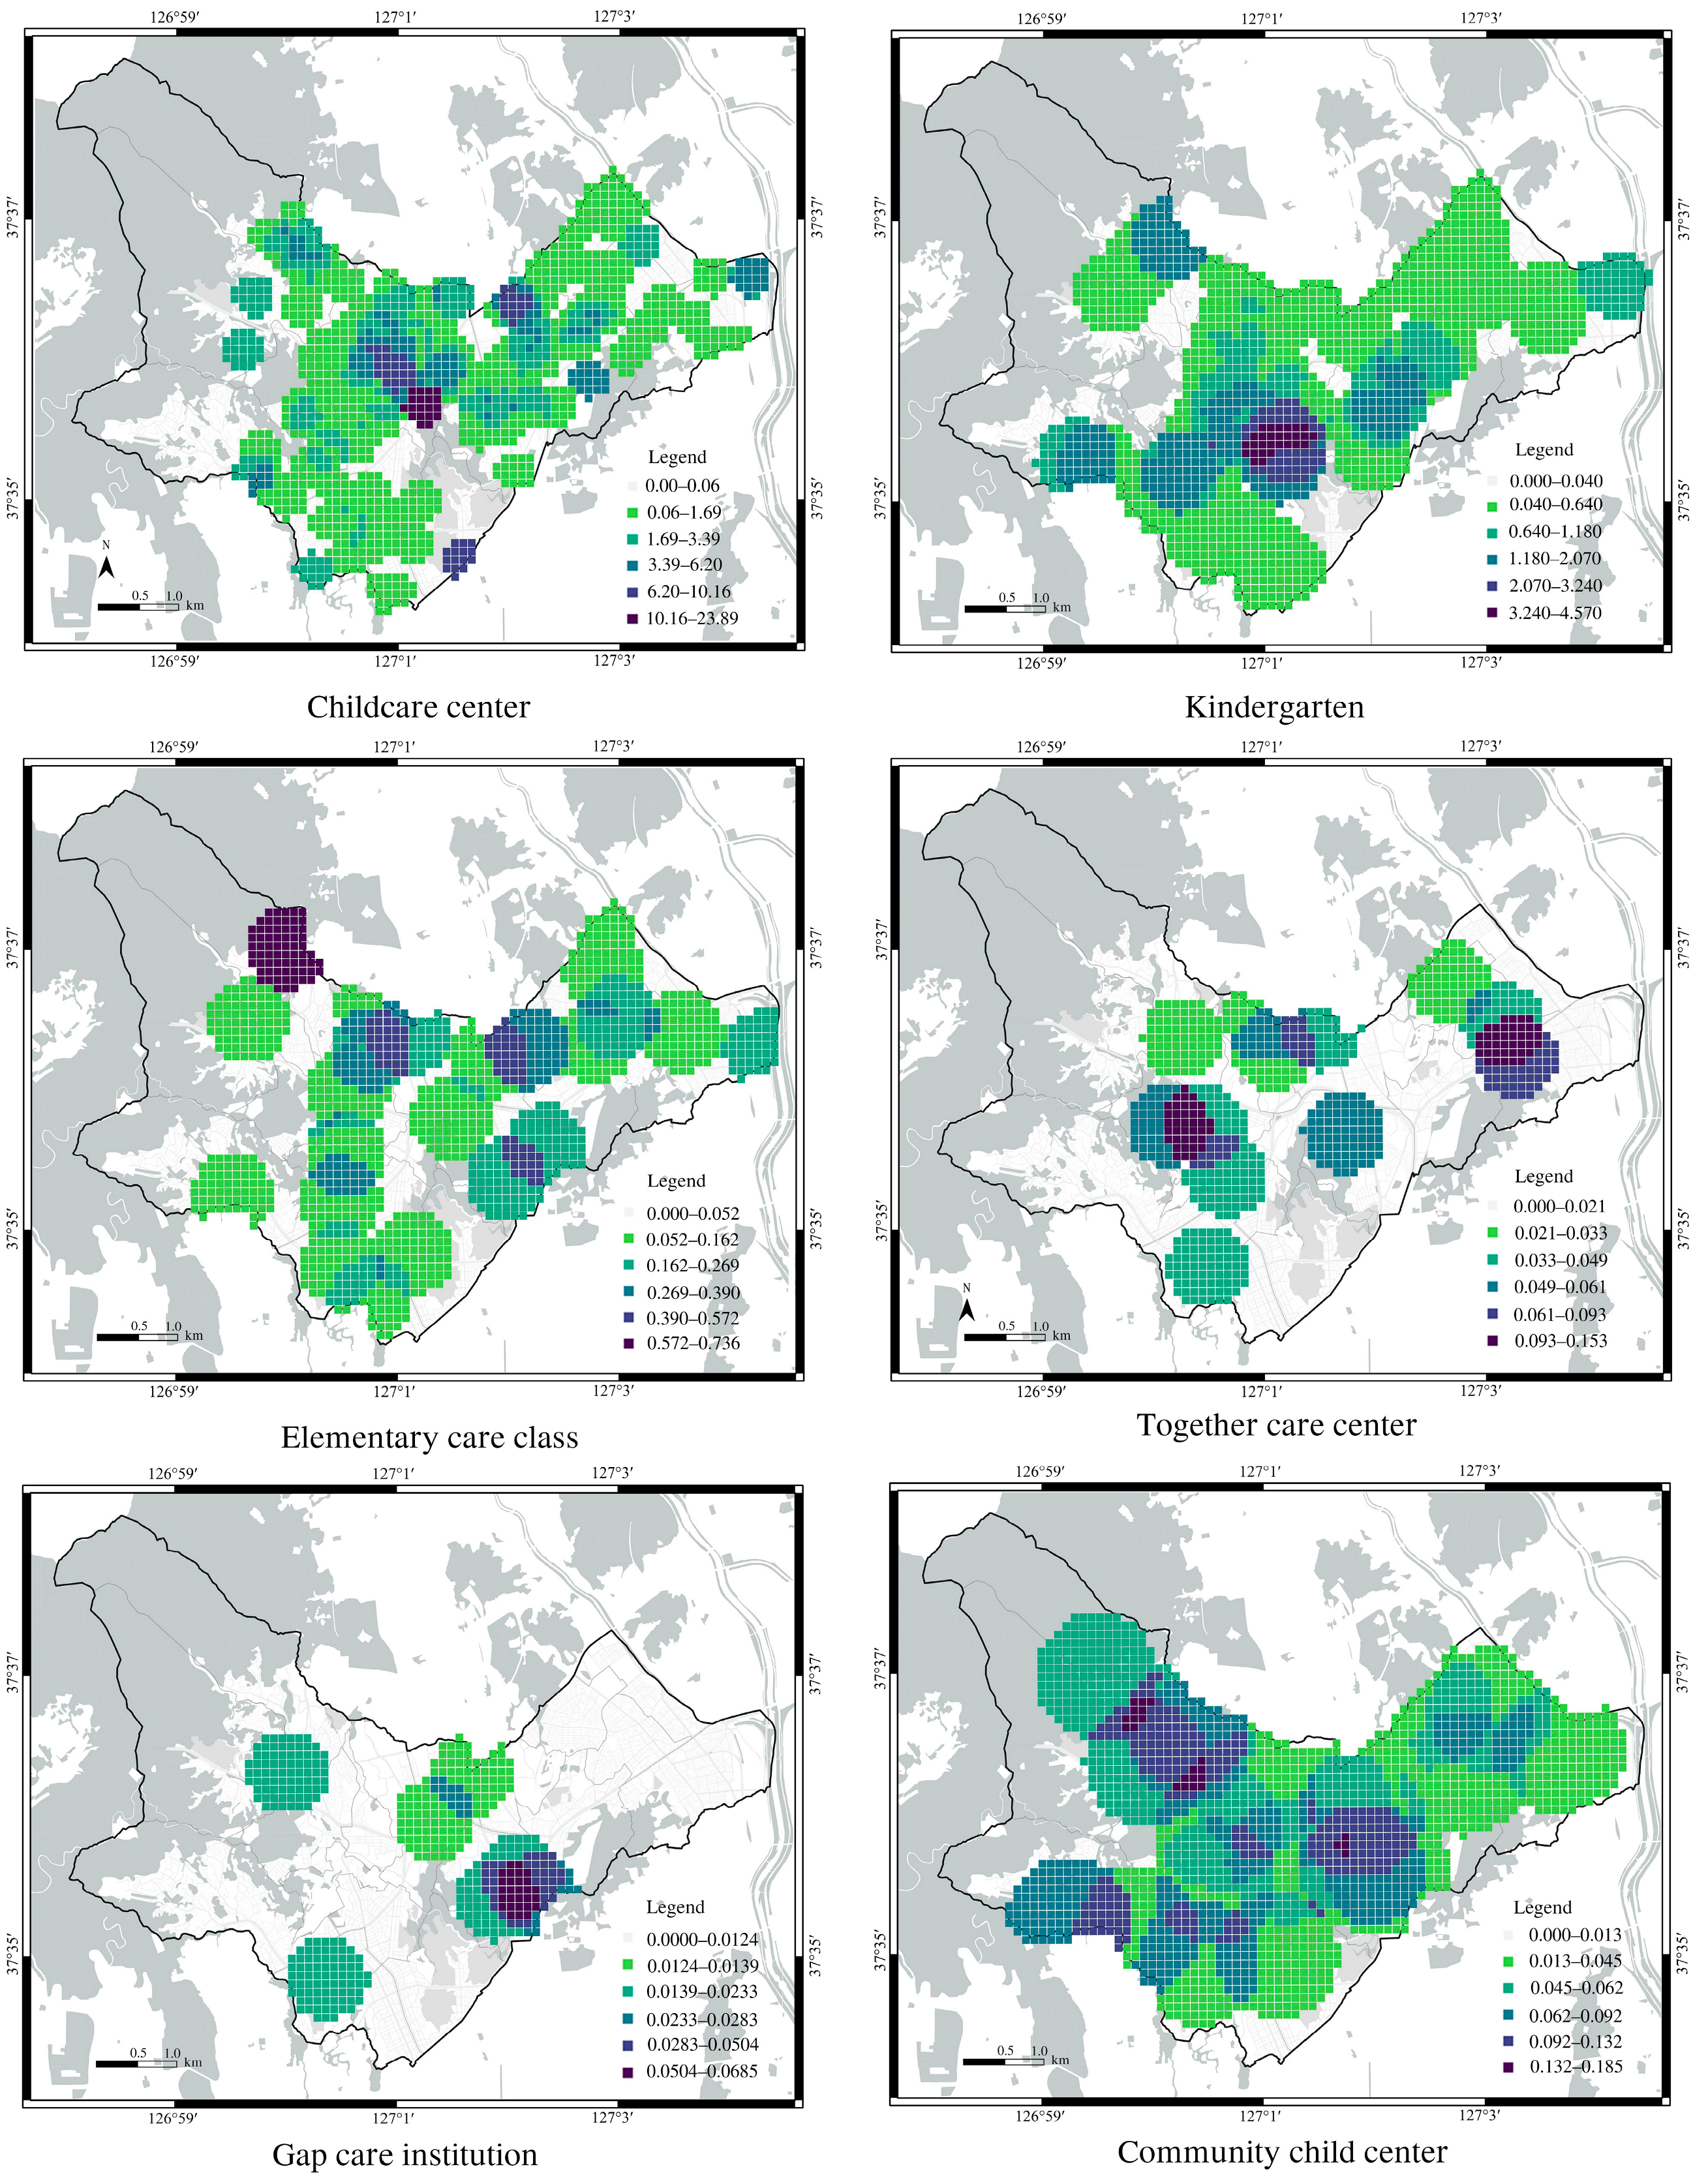
3.2.2. Differences in Spatial Accessibility to Childcare Facilities by Housing Type

An analysis of the differences in spatial accessibility of childcare facilities by housing type, excluding I areas, revealed that the average accessibility values for childcare centers in apartment areas and low-rise residential areas were 3.36 and 2.06, respectively, indicating that accessibility in low-rise residential areas was relatively worse than in apartment areas. The accessibility results for childcare centers in apartment areas, when categorized into six levels, ranged from 0 to 70.000, with 53.62% of the areas classified as I and 42.65% as mostly I. In low-rise residential areas, the accessibility values ranged from 1 to 23.885, and excluding the 50.79% of I areas where accessibility was difficult to measure, the combined VL and L areas accounted for 41.79%.
Compared to the overall average for childcare centers, both apartment and low-rise residential areas had relatively high accessibility. For kindergartens, the average accessibility values were 1.19 in apartment areas and 0.74 in low-rise residential areas, excluding the I areas. In apartment areas, 43.71% were classified as I, and 41.22% were in the most inaccessible VL and L regions. In low-rise residential areas, 42.84% were in I areas, whereas 43.10% were in the most inaccessible VL and L regions. Similar to childcare centers, kindergartens in low-rise residential areas were found to have relatively worse accessibility than those in apartment areas. Additionally, when compared with the overall average accessibility of kindergartens, both apartment and low-rise residential areas showed higher values (Figure 7).
For elementary-care classes, the apartment areas had an average accessibility of 0.433 and low-rise residential areas 0.218, indicating that both regions had low accessibility. In apartment areas, 49.66% were classified as I areas, and 42.05% of the areas were in the most inaccessible VL and L regions. In low-rise residential areas, 49.66% were I areas, and 39.19% were VL and L areas. Accessibility in both apartment and low-rise residential areas and the overall average were low for elementary-care classes. For care centers, the average accessibility value in apartment areas was 0.044, whereas in low-rise residential areas, it was 0.052. For gap care institutions, the average accessibility values were 0.011 and 0.025 in apartment and low-rise residential areas, respectively. The average accessibility of community child centers was 0.044 in apartment areas and 0.061 in low-rise residential areas. This means that the total average value for childcare facilities for elementary school years and the average accessibility by housing type were very low and poor (Figure 8 and Figure 9).

3.3. Spatial Equity and Spatial Correlation Analysis Results

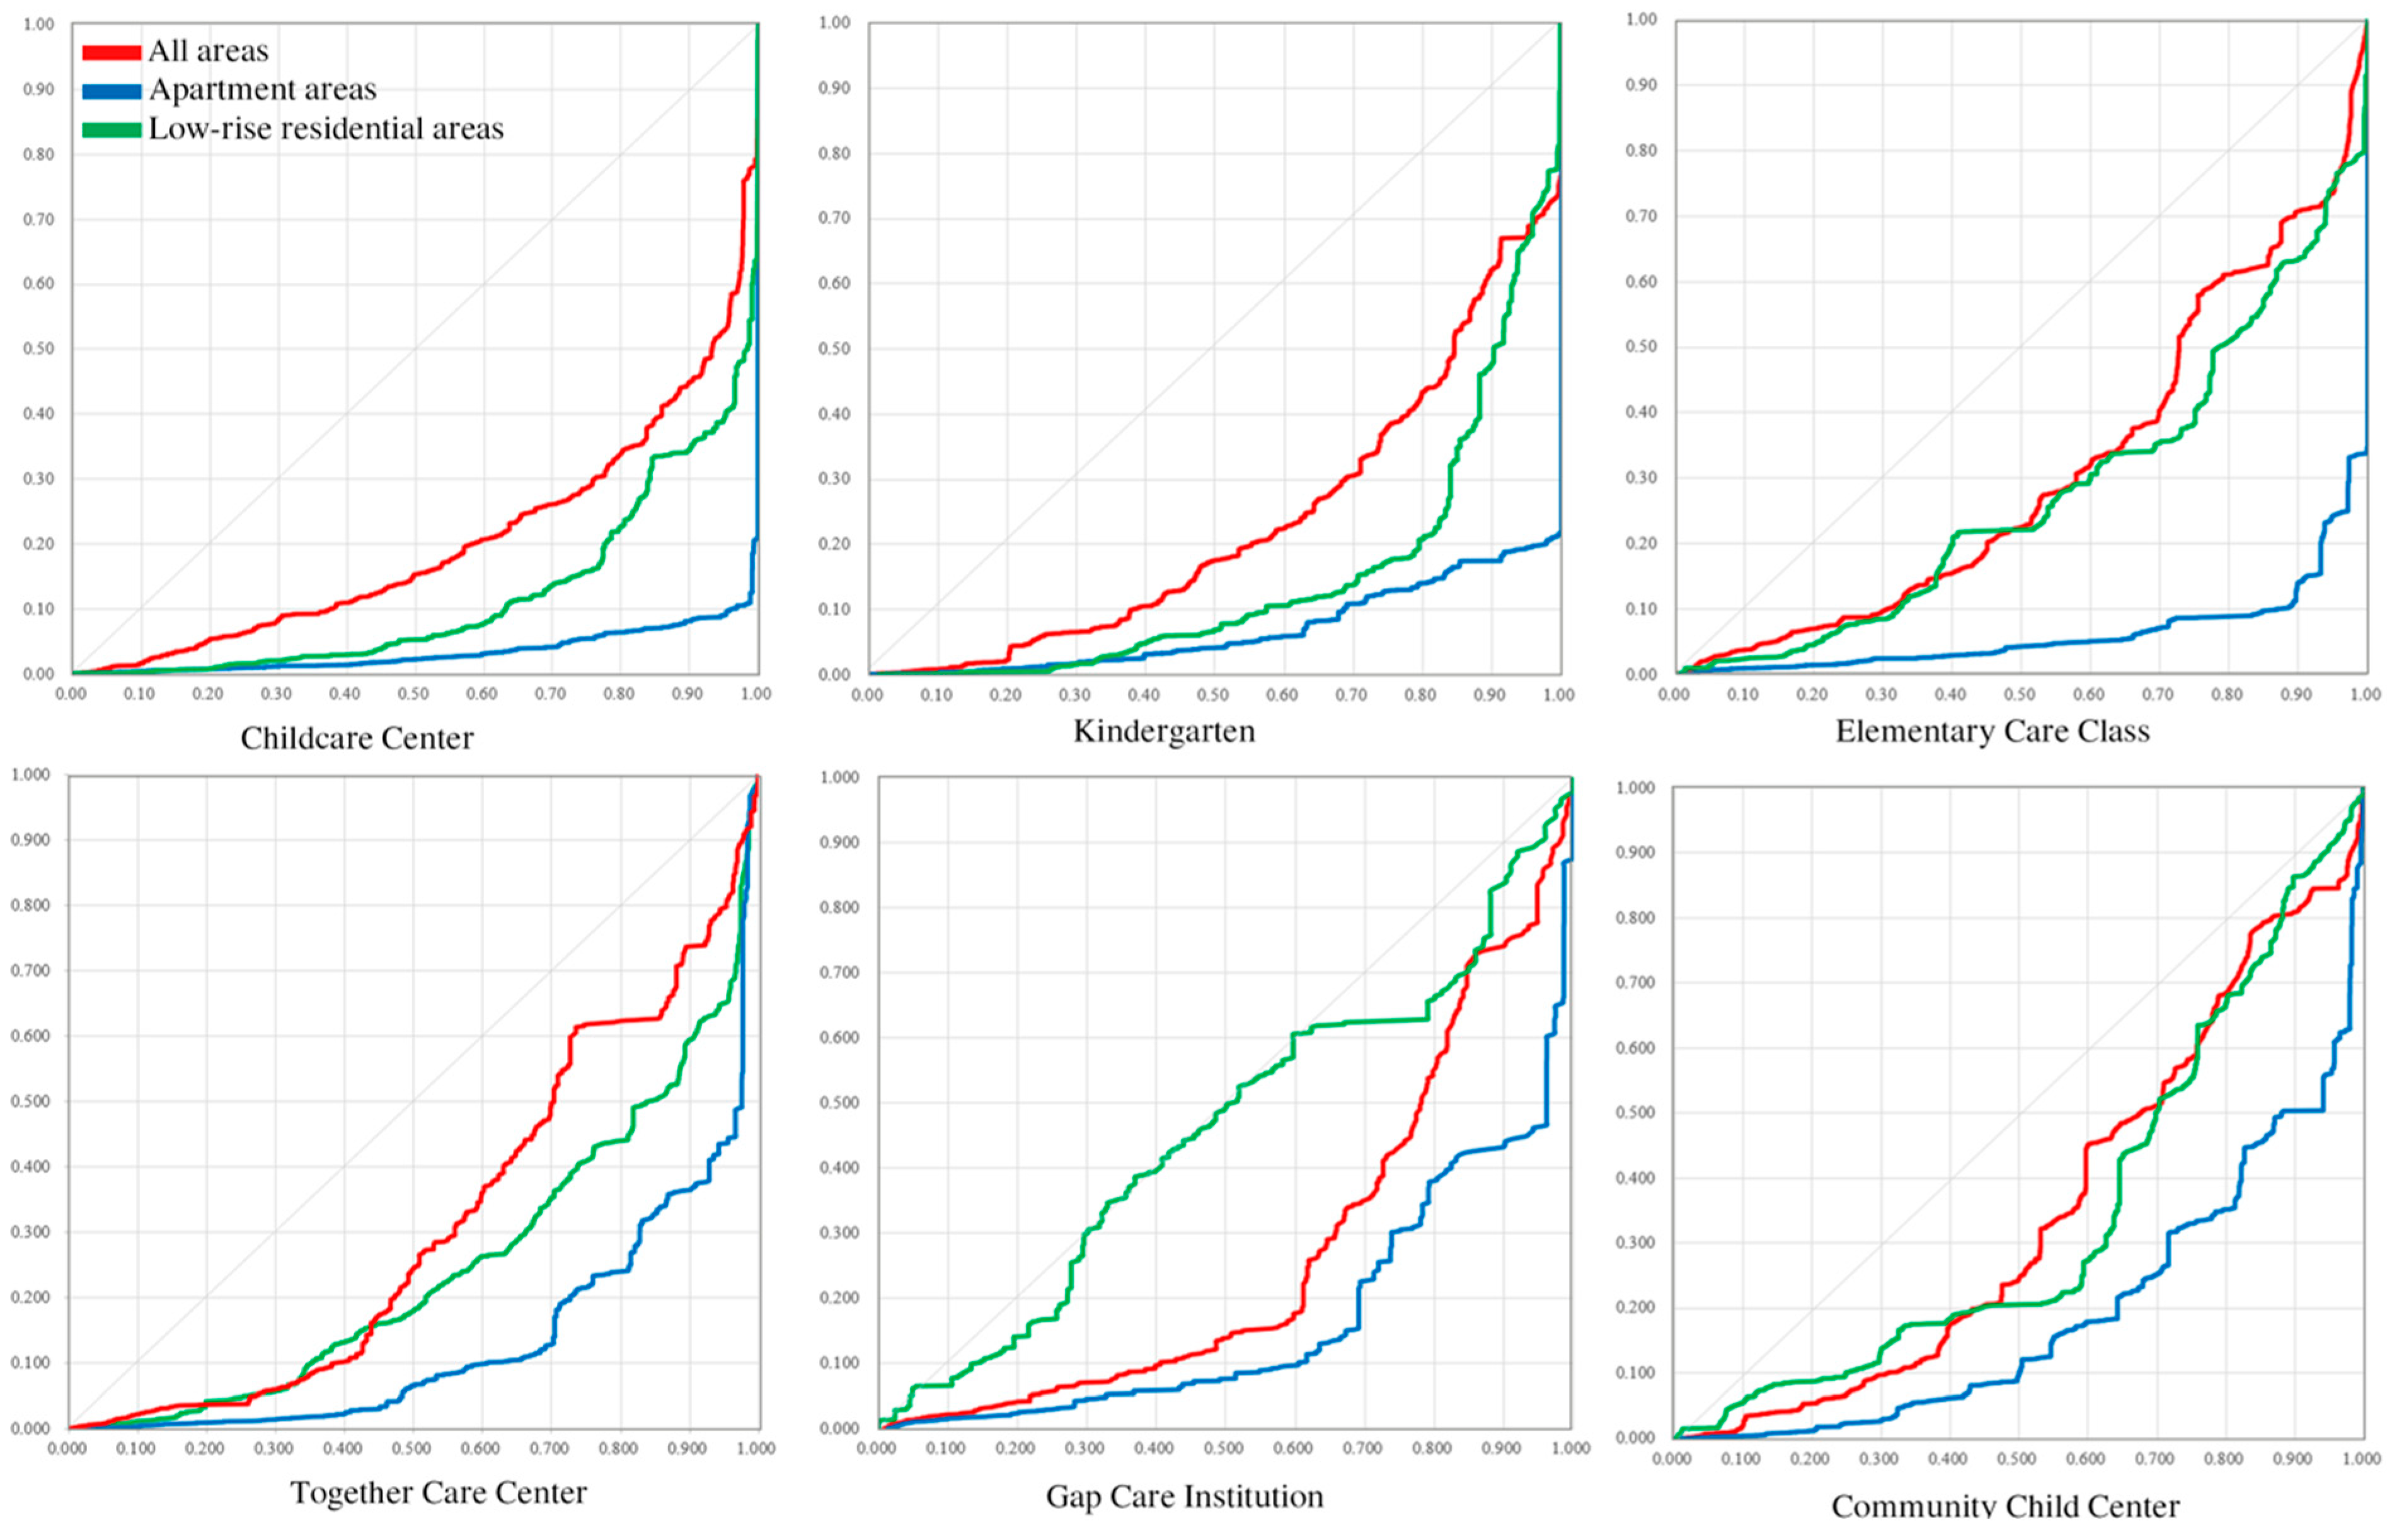
3.3.1. Childcare Facilities Equity Analysis Results

An analysis of the spatial equity of childcare facilities in Seongbuk-gu revealed significant discrepancies. When analyzing childcare centers by area and housing type, all results fell below the 45-degree line, indicating that accessibility was unequally distributed (Figure 10).
The Gini coefficient values were 0.55 for the entire region, 0.854 for apartment areas, and 0.658 for low-rise residential areas, indicating a high degree of inequality. The Gini coefficient for apartment areas was 0.196, which was higher than that for low-rise residential areas, indicating that the degree of inequality was more significant in apartment areas. Similarly, for kindergartens, the Lorenz curve was below the 45-degree line, with Gini coefficient values of 0.5 for the entire region, 0.823 for apartment areas, and 0.612 for low-rise residential areas. These results indicate that the degree of inequity was high, with a more unequal distribution of accessibility in apartment areas than in low-rise residential areas.
The analysis of childcare facilities for elementary school years, including elementary-care classes, care centers, gap care institutions, and community child centers, revealed that all facilities had Lorenz curves below the 45-degree line, indicating an unequal distribution of accessibility. With elementary-care classes and community child centers, the overall Gini coefficient suggests a relatively more equal distribution.
However, when analyzed by housing type, the inequality index was found to be higher in apartment areas. For care centers and gap care institutions, the Gini coefficient values derived from the overall facilities ranged between 0.4 and 0.5, indicating a significant imbalance, with higher inequality indices observed in apartment areas. These findings indicate a shortage of childcare facilities in apartment areas relative to the child population, highlighting a social imbalance in childcare facilities provision (Table 9).
The analysis of Gini coefficients by housing type revealed a discrepancy between apartment areas and low-rise residential areas. Contrary to the expectation that low-rise residential areas would exhibit lower equity in facility accessibility, the higher inequity values observed in apartment areas could be attributed to the relatively high child density in these areas. To verify this, we first calculated the average number of children in all 100 m × 100 m grid cells containing infancy and early childhood and elementary school years populations. As a result, the average number of infancy and early childhood populations was 20, while that of elementary school years population was 23. Based on these fixed child population figures, an equity analysis of access to childcare facilities was conducted. The results demonstrate that, in most cases, apartment areas with a high concentration of children recorded poorer equity in terms of childcare facilities when supply was limited (Table 10). Moreover, the child population was found to have a significant impact, with noticeable polarization in accessibility. This suggests that the methods based on optimized approaches with fixed populations exhibit distinct differences. Therefore, accessibility analysis using the 2SFCA method was confirmed to be an efficient approach for measuring demand and supply.

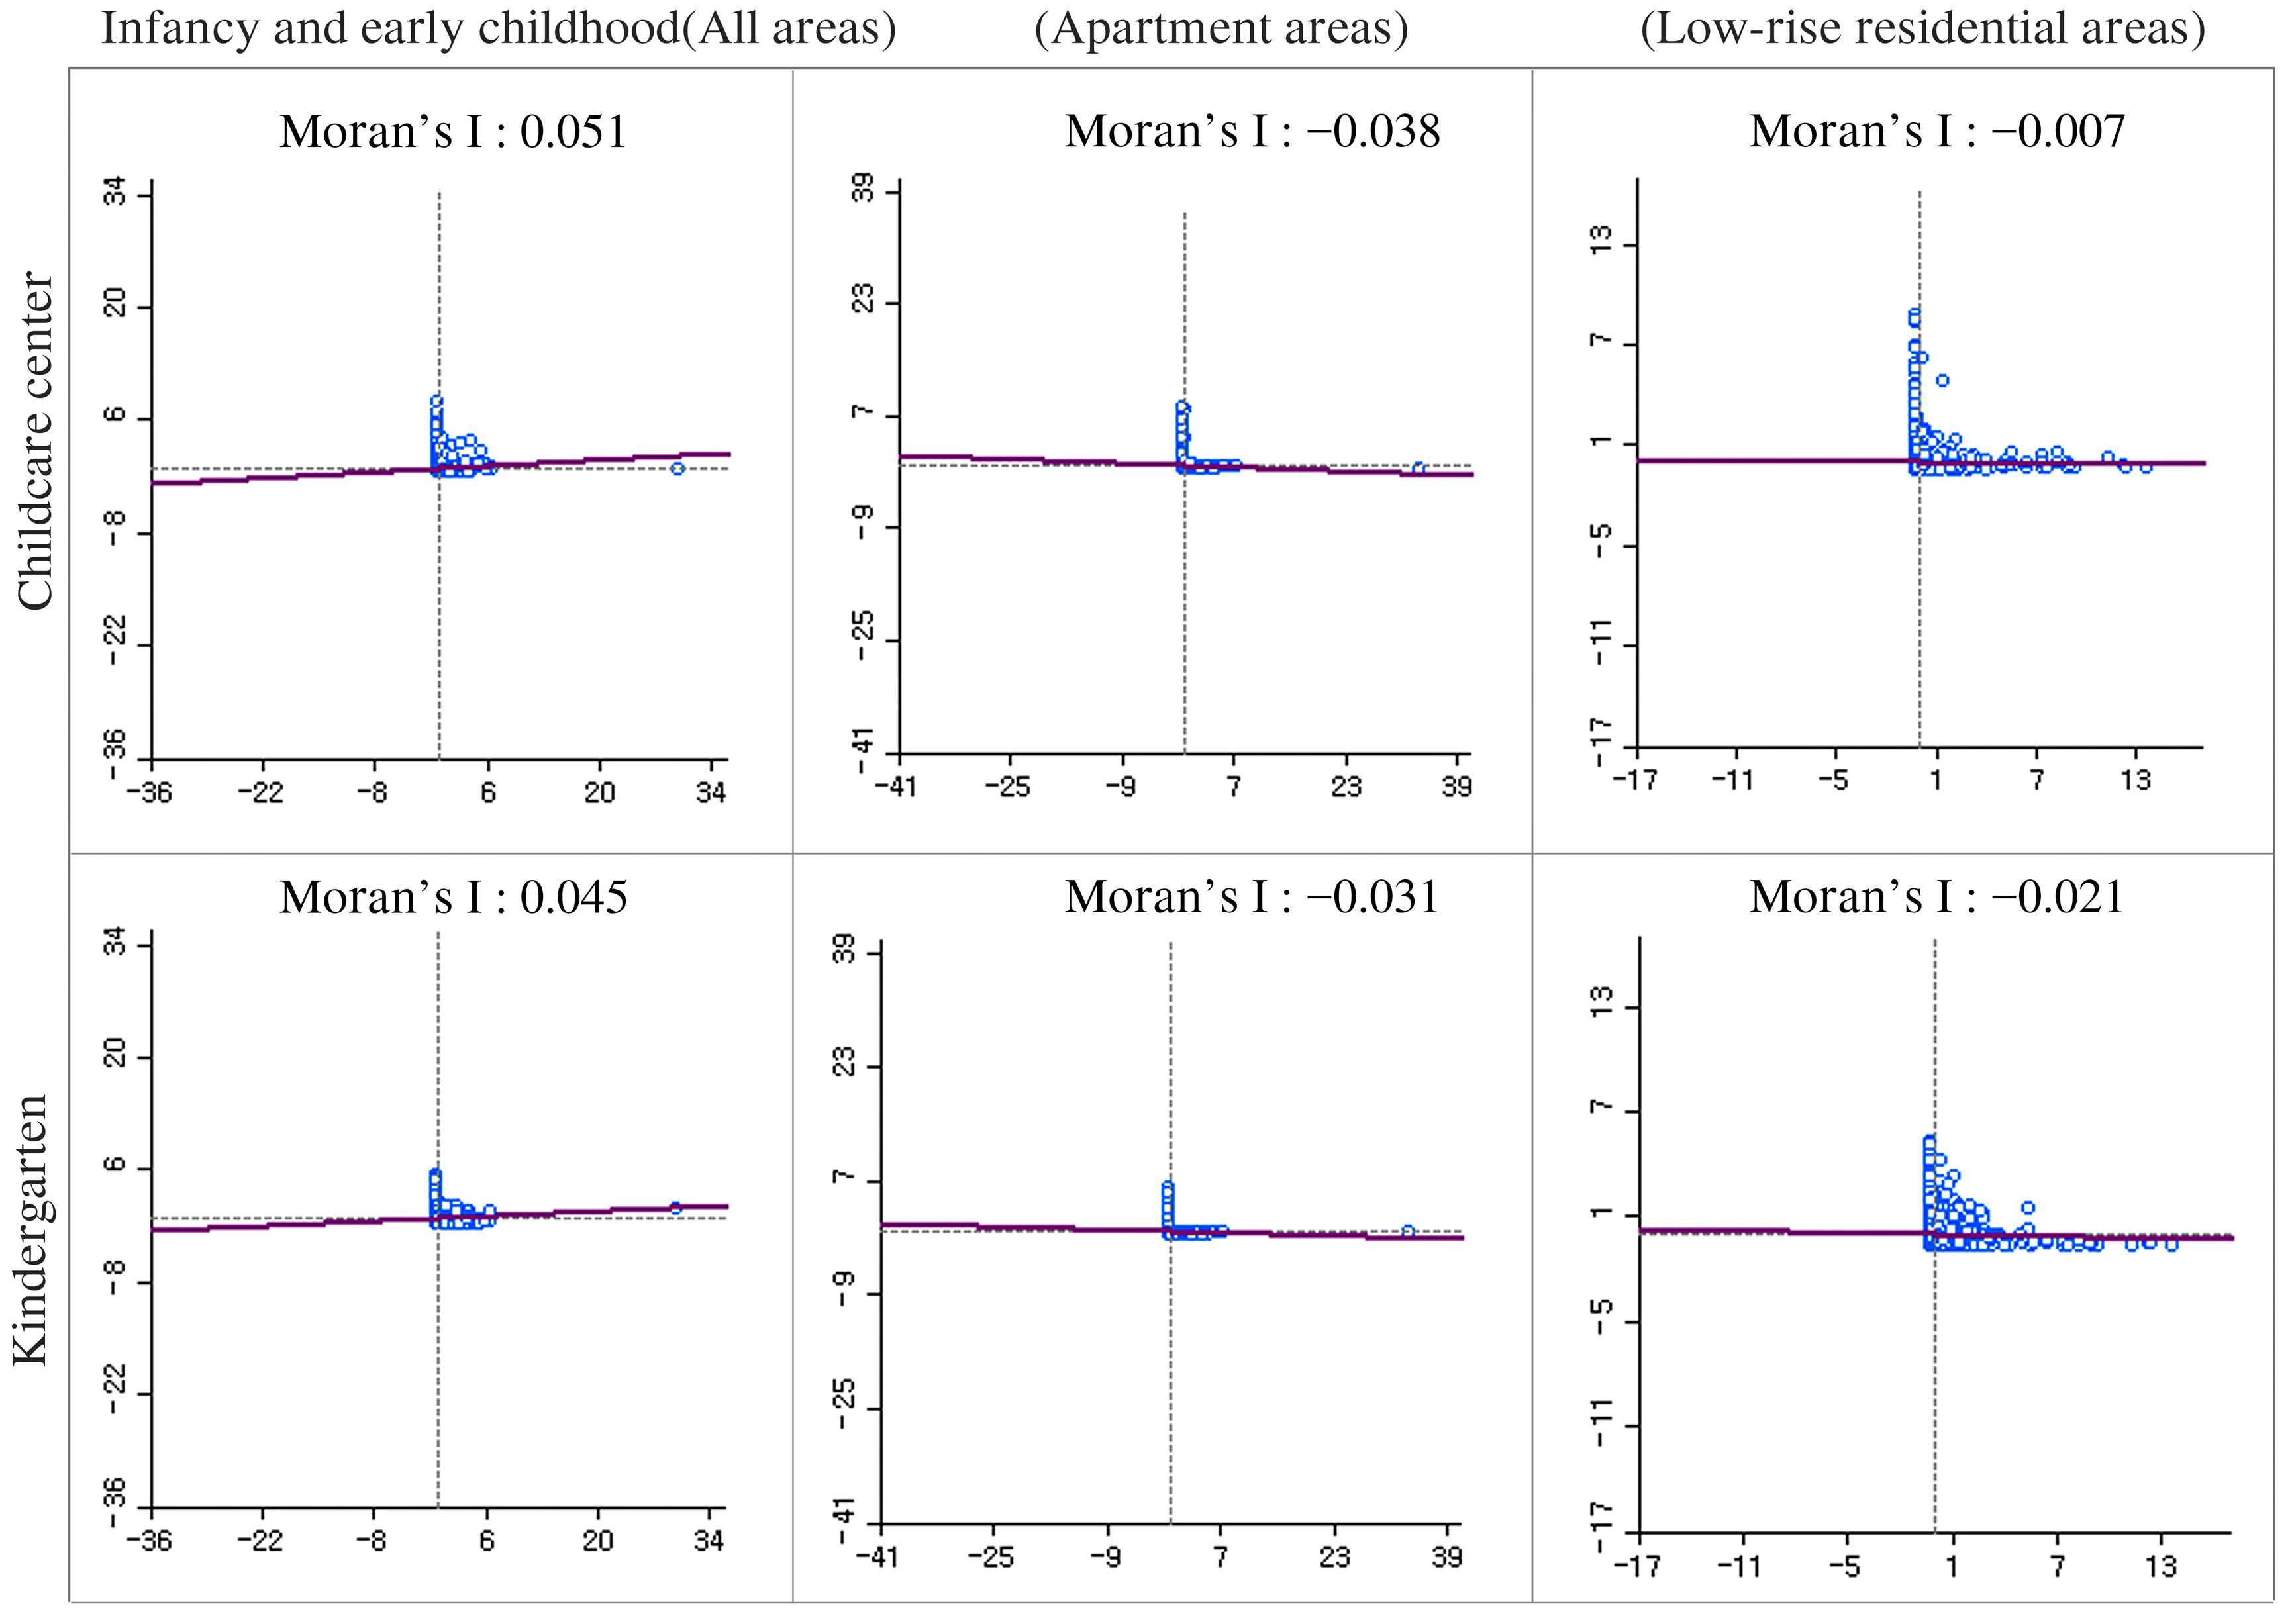
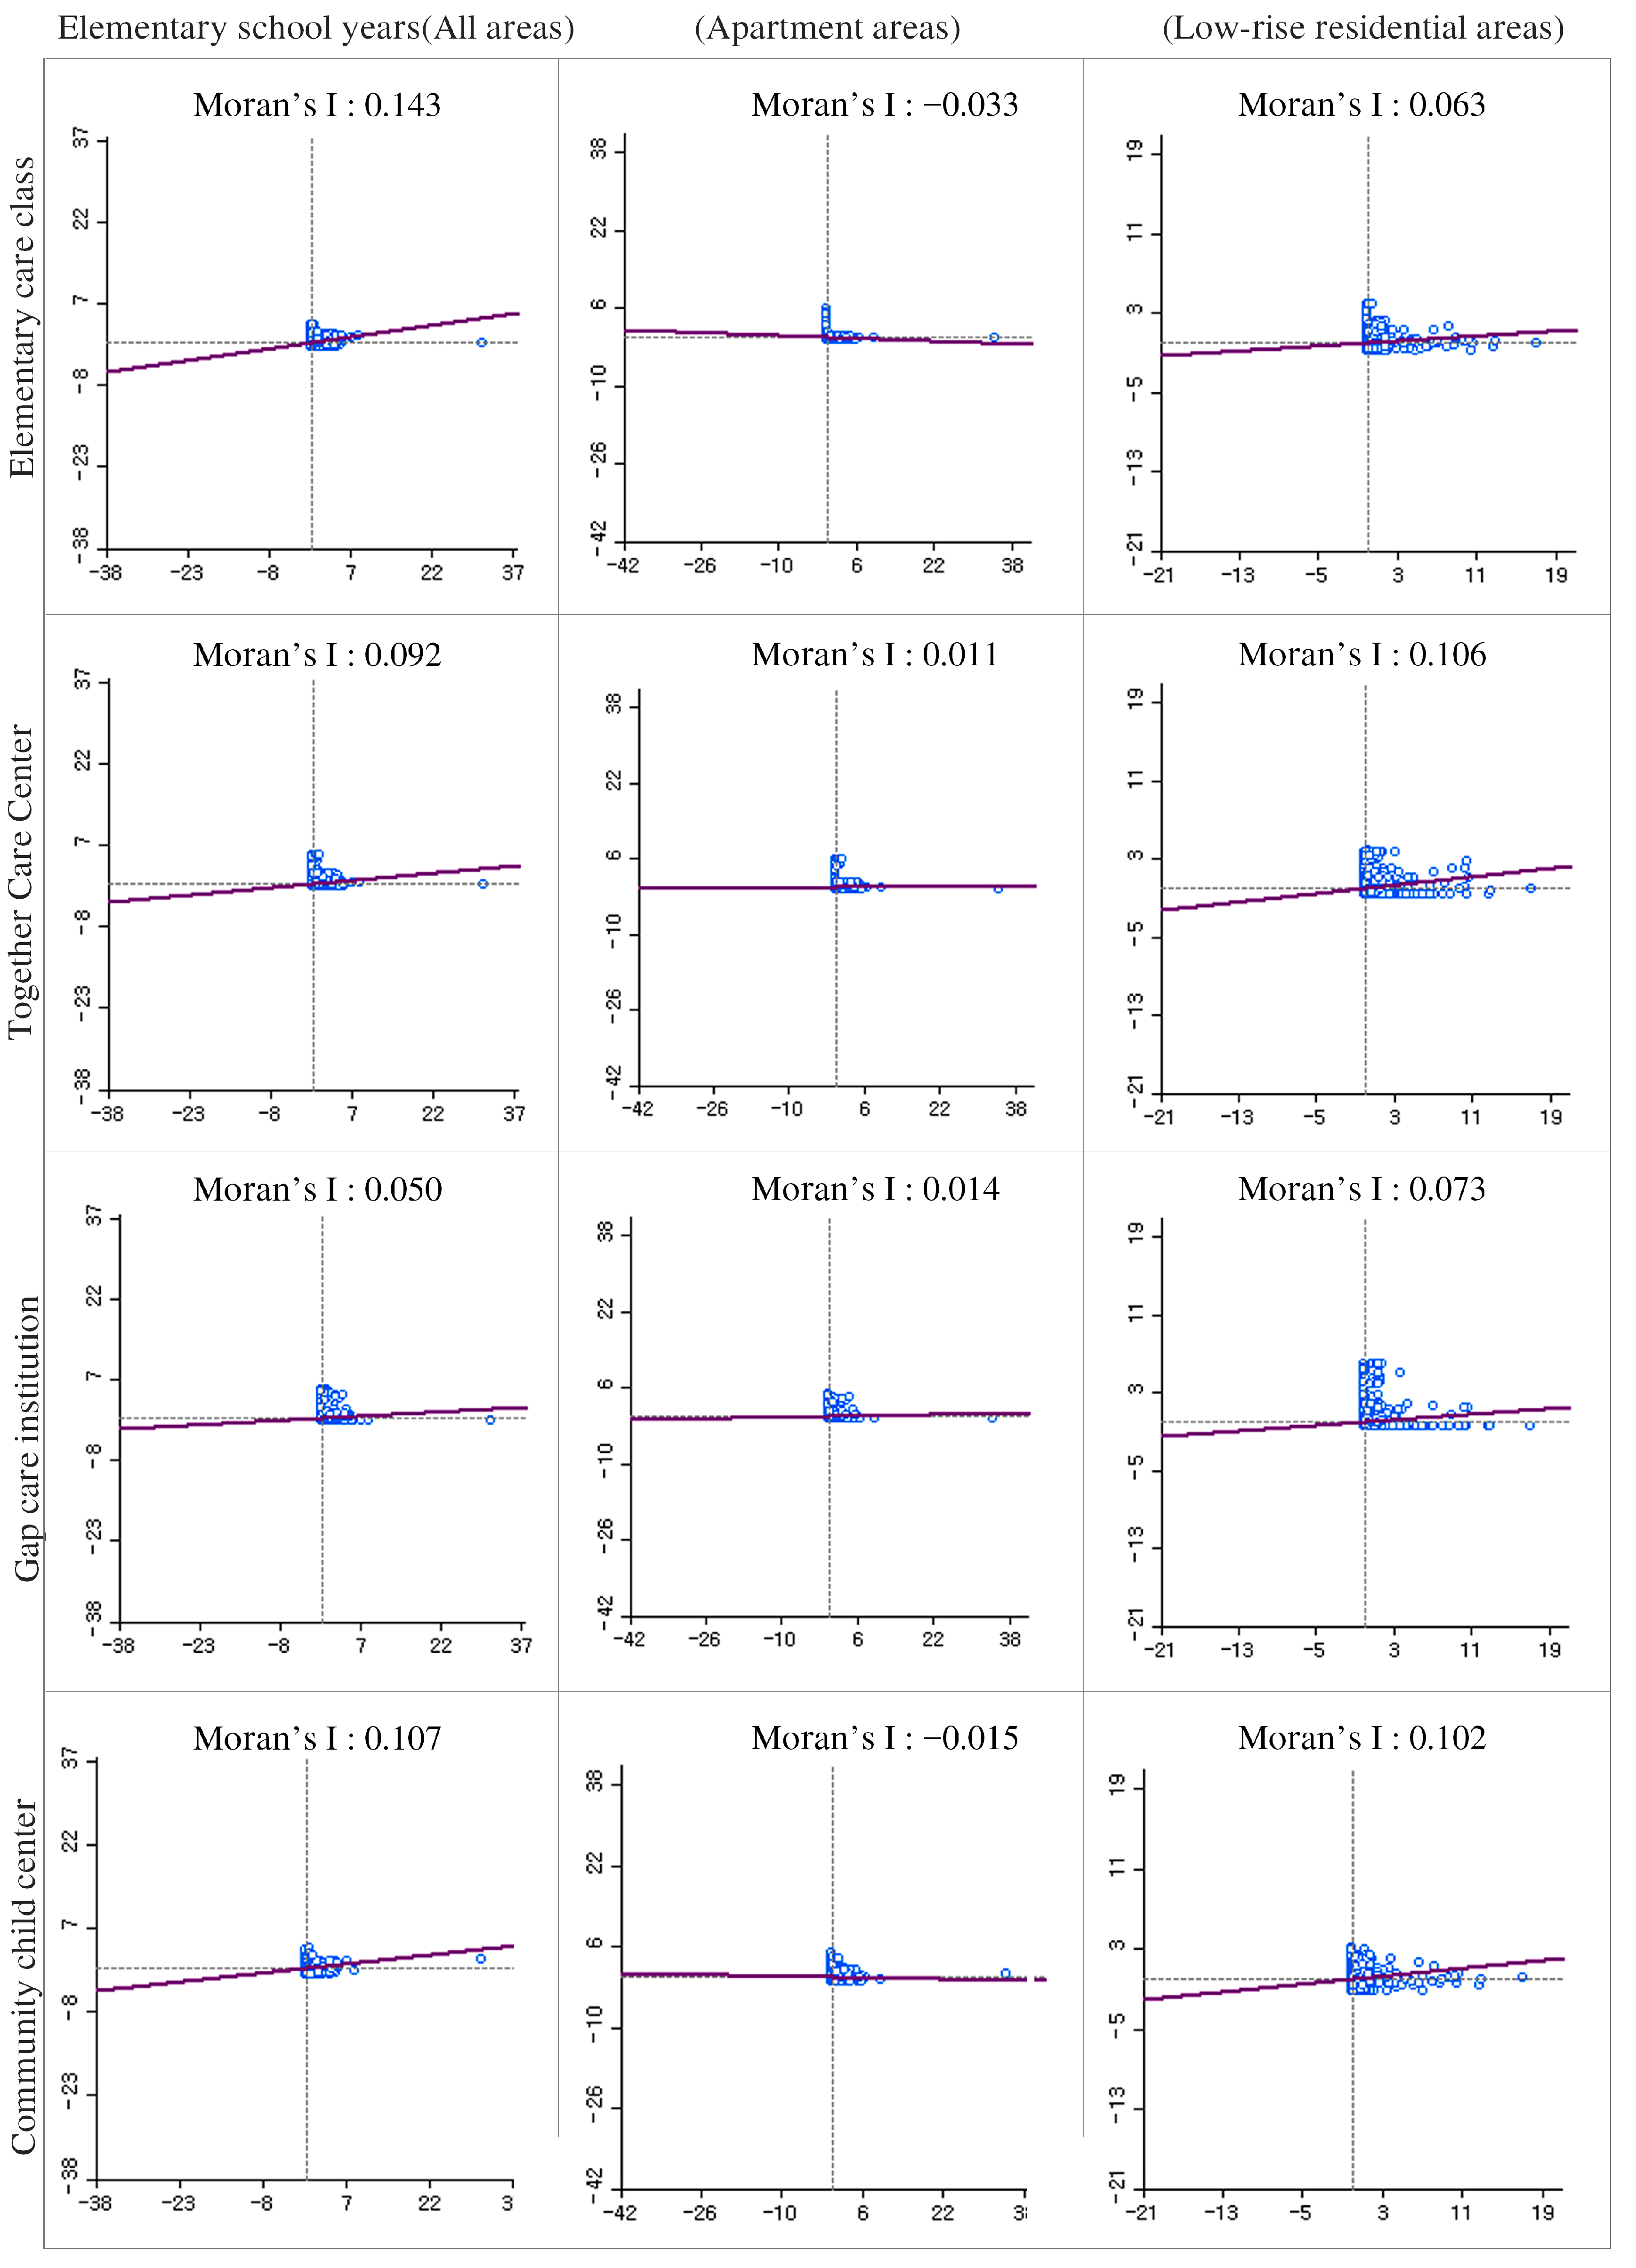
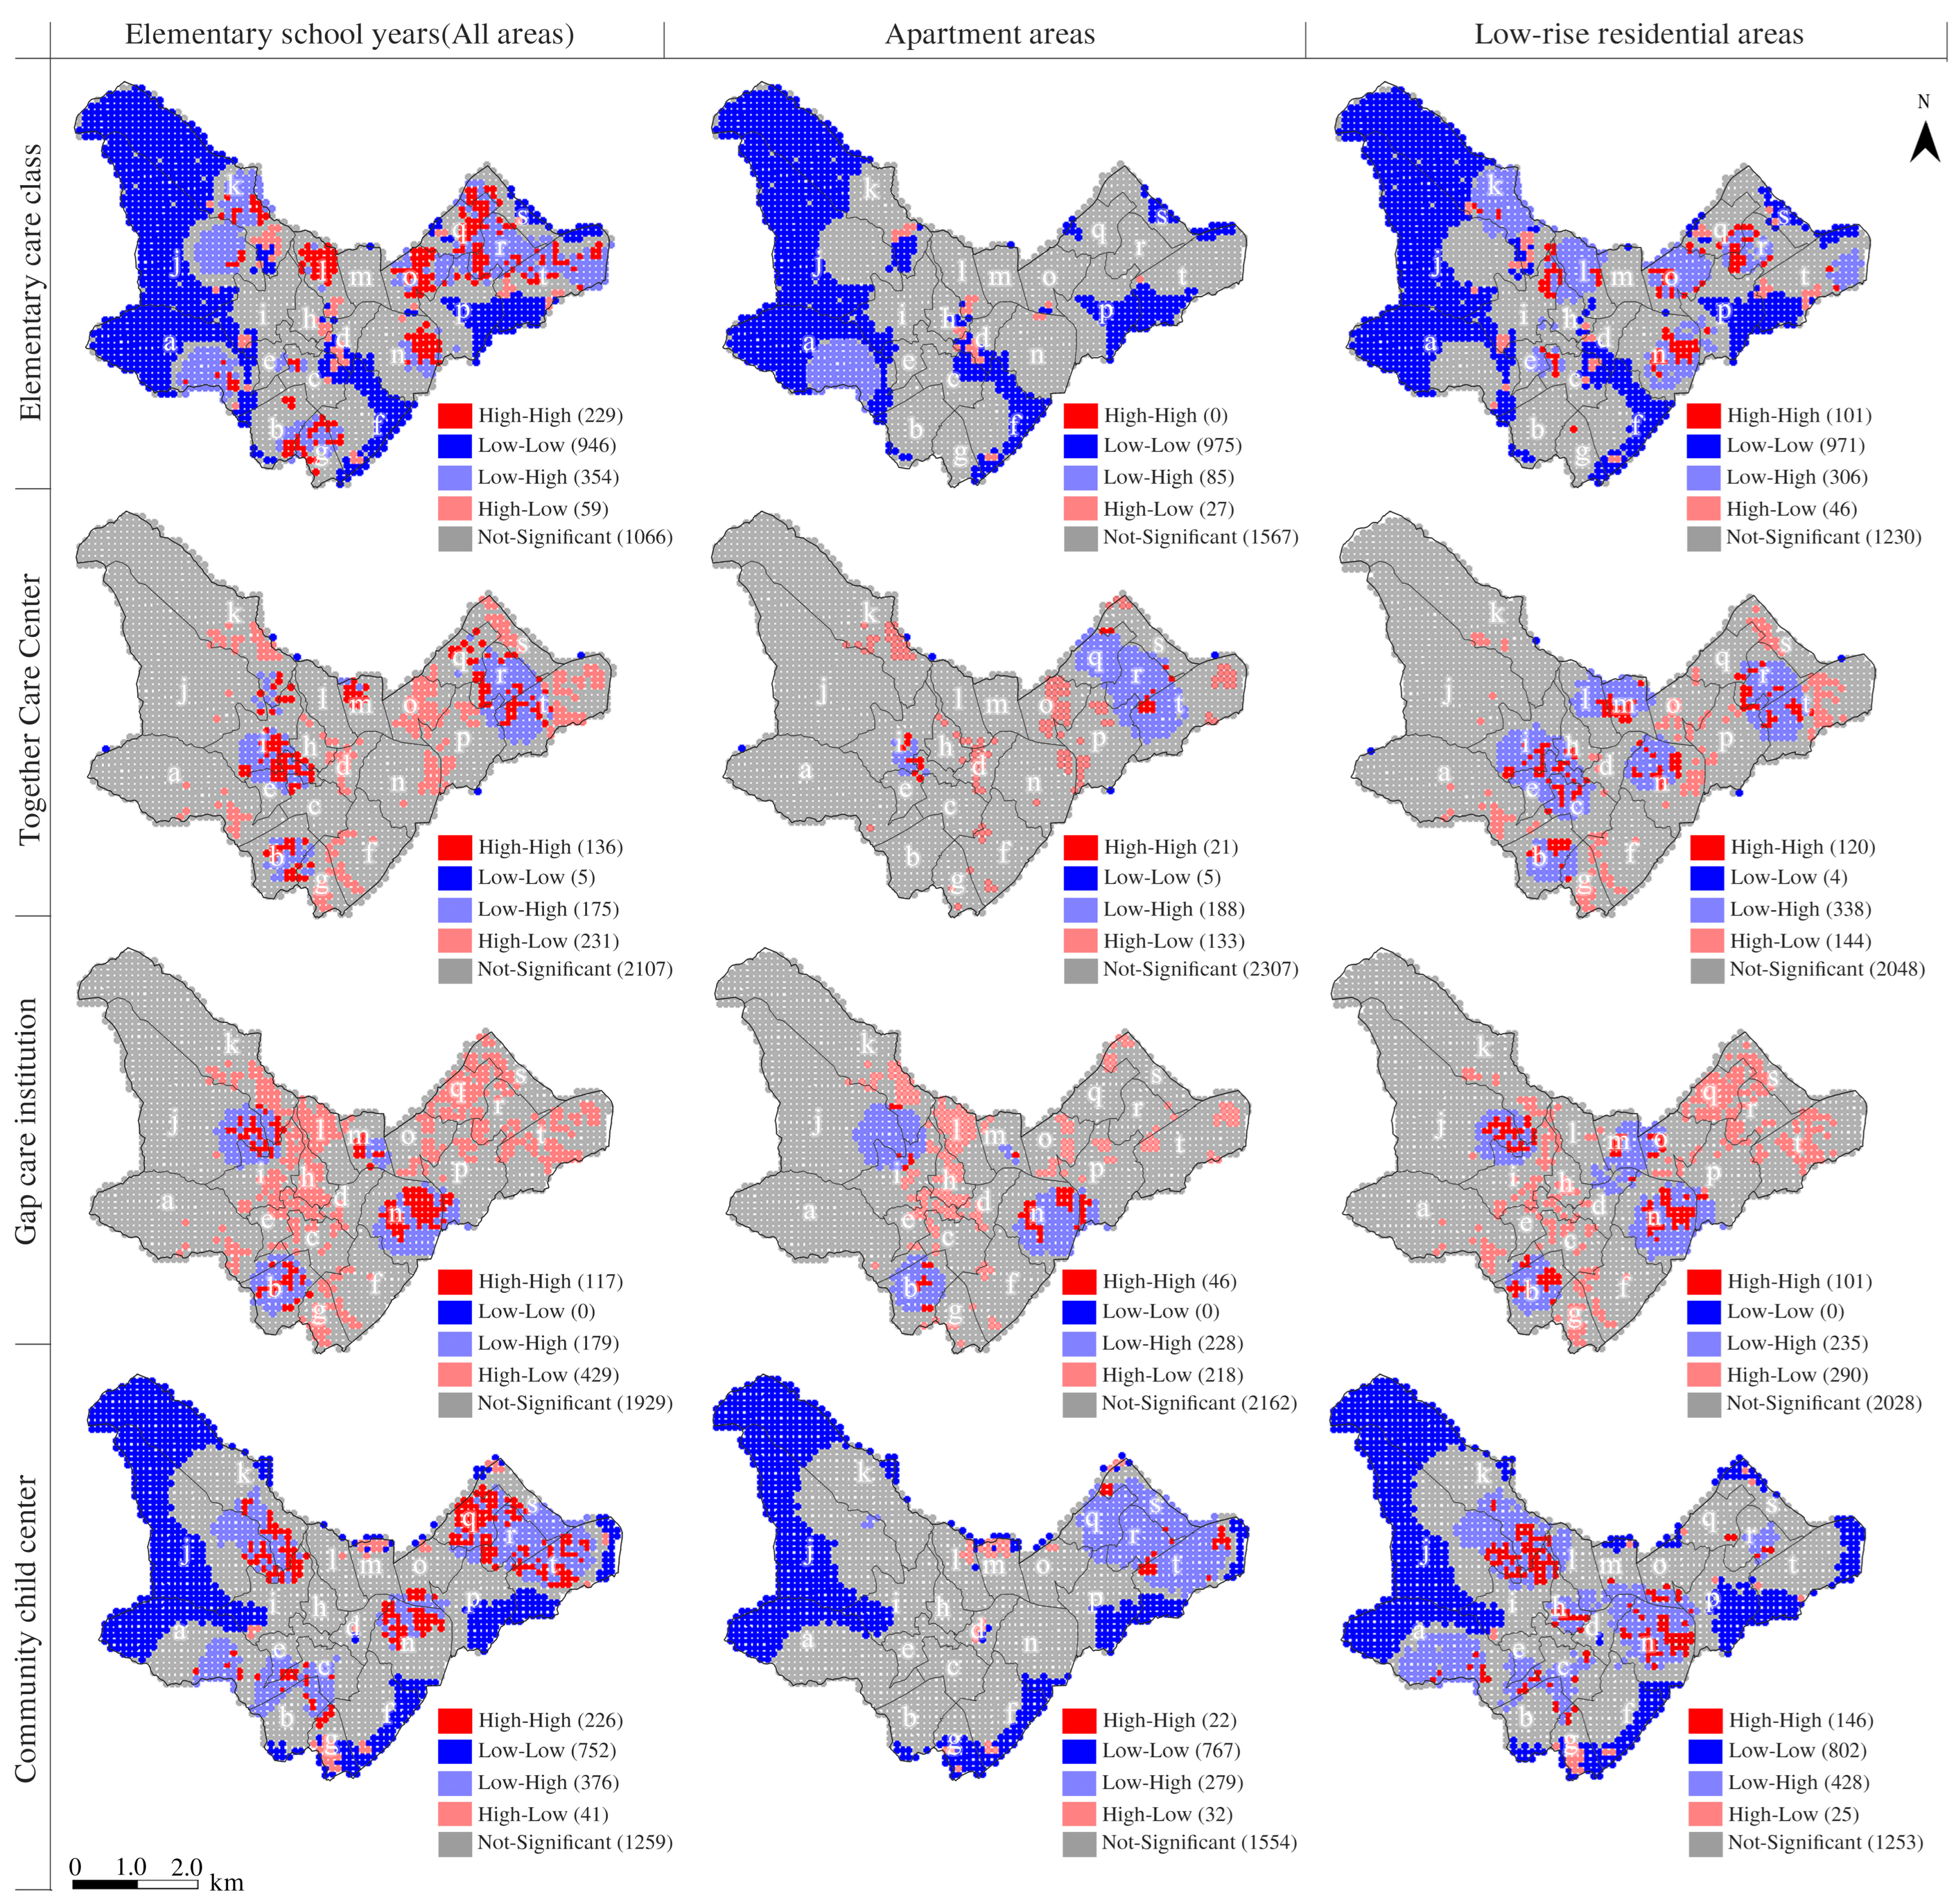
3.3.2. Results of Spatial Correlation Analysis of Childcare Facilities

A bivariate spatial autocorrelation analysis of childcare facilities in Seongbuk-gu revealed that all facilities had positive autocorrelation values across the entire study area. When classified by housing type, negative autocorrelation values were observed in apartment and low-rise residential areas for childcare centers and kindergartens, as well as in apartment areas for elementary-care classes and community child centers. A correlation analysis of childcare facilities and the total child population in Seongbuk-gu showed positive autocorrelation values, indicating that similar values were located near one another. When the analysis was applied using population data classified by housing type, negative autocorrelation values were observed for childcare centers, kindergartens, elementary-care classes, and community child centers (Table 11). The Bivariate Local Moran’s I LISA results for childcare facilities in Seongbuk-gu, with a significance level of 0.05, indicate that when analyzing childcare centers, 86% of the regions displayed positive spatial correlation rather than negative spatial correlation. Areas with lower values demonstrated significantly higher positive correlations. Apartment and low-rise residential areas recorded a high number of regions with positive spatial correlations at lower values (Figure 11 and Figure 12).
Seongbuk-gu regions such as Seongbuk-dong (a), Jeongneung3-dong (j), and Jangwi3-dong (s) exhibited high positive correlations. In contrast, areas with low correlation values were mostly identified as green spaces and their surroundings. In kindergartens, areas with positive spatial correlation values were found to be higher, accounting for 78%, compared to those with negative spatial correlations. High positive correlations were found in Jeongneung4-dong (k), Dongseon-dong (c), and Jongam-dong (n) areas. Regarding housing types, it was found that while there were no high–high clusters in apartment areas, many high–high clusters were concentrated in low-rise residential areas. Elementary-care classes showed a high proportion of regions (73%) with positive spatial correlation values compared to negative ones, and high–high clusters were identified in most areas of Seongbuk-gu. This phenomenon was observed in most areas of Seongbuk-gu, including Seongbuk-dong (a), Bomun-dong (g), Samseon-dong (b), and Dongseon-dong (c). Together, care centers and gap care institutions exhibited high negative spatial correlation values; however, high–high clusters were widely distributed in several areas, including Samseon-dong (b), Dongseon-dong (c), Jangwi1,2,3-dong (q, r, s), and Seokkwan-dong (t). Community child centers exhibited a high positive spatial correlation, with high–high clusters found in regions such as Jeongneung2,3,4-dong (i, j, k), Wolgok1-dong (o), Jangwi1,2-dong (q, r), and Seokgwan-dong (t) (Figure 13 and Figure 14). Summarizing the results of the Bivariate Local Moran’s I LISA analysis for Seongbuk-gu, most childcare facilities were distributed in high–high clusters with strong positive correlation values. In addition, these facilities exhibited more pronounced spatial clustering in low-rise residential areas than in apartment areas.

4. Discussion

4.1. Characteristics of Childcare Facilities Provision by Housing Type

There is a shortage of childcare services relative to the potential demand; shortages are more pronounced in cases where care is costly or requires special assistance [16]. Analysis of the distribution characteristics of childcare facilities by housing type in Seongbuk-gu revealed that kindergartens, elementary-care classes, care centers, gap care institutions, and community child centers, excluding childcare centers, were more concentrated in low-rise residential areas than in apartment areas. Childcare centers and kindergartens for infants and early childhood populations were distributed throughout the community, whereas facilities for elementary school years populations, such as elementary-care classes, were lacking. Therefore, the childcare and care market may face difficulties in responding quickly to an increase in the number of children, necessitating the establishment of a meticulous supply strategy. Accordingly, three key points of discussion are presented.
First, a systematic analysis of the current state of childcare facility locations provided by the public sector is essential. In Seongbuk-gu, no standards for the appropriate supply of childcare facilities have been established based on housing type. Although detailed criteria exist for individual facilities, there must be more consistent and integrated supply standards at the community-wide level. Some facilities in low-rise residential areas prioritize the ease of public institution installation over the convenience of child accessibility. In Seongbuk-gu, many facilities were located on steep slopes and remote alleys, highlighting the regional characteristics that reduce children’s accessibility. Examining specific cases of facility locations, the facilities marked as (A) and (C) (Figure 15) within apartment areas indicated good accessibility for children residing in apartments. This is inconvenient for children from outside areas. Additionally, Facility (B) located within a low-rise residential areas is situated on a slope, and Facility (D) is located in a remote part of the neighborhood, resulting in very poor physical accessibility. Although elementary care classes (E, F) are generally located within low-rise residential areas, they show relatively good accessibility. Together care centers (G, H) are also situated within apartment areas, providing relatively good accessibility. However, gap care institutions and community child centers (I, J, K, and L) are located in parts of commercial buildings within low-rise residential areas, showing a poor environment with low accessibility and recognition.
Second, it is necessary to explore ways to expand facilities for specific groups, so that they are accessible to a broader range of social classes. Among childcare facilities for infancy and early childhood populations, the number of childcare centers closing was increasing (Figure 16) [74], similar to the rising demand for elementary-care classes. Considering that existing childcare centers were well positioned within communities, one solution for addressing the shortage of facilities could be to repurpose existing childcare facilities or to actively utilize vacant land within the community.
Third, urgent measures are required to address the supply of childcare facilities for the elementary school years populations. In comparison to the facilities for infants and young children, there is a greater need to increase and improve the availability of childcare options for elementary-school-aged children. There are limitations to providing childcare facilities for elementary school years populations in existing apartment areas in the public sector. Discussions on facility supply are needed through resident representative meetings in apartment areas, and legal standards for the mandatory installation of ancillary welfare facilities have not been established in existing apartment areas, resulting in limited supply. South Korea implemented a legal standard in 2020, requiring the installation of multi-purpose childcare facilities in residential complexes with more than 500 units. However, this regulation only applies to newly built apartments, making it difficult to meet the current demand at the required pace. When comparing the population density of children in Seongbuk-gu, despite the higher population in elementary school years compared to infancy and early childhood children, there is a considerable lack of available facilities. This suggests that elementary school children’s rights have been neglected and highlights the need for additional measures from the public sector. Owing to the shortage of childcare facilities during elementary school years, many children in Korea use private education after school hours, implying that private education institutions perform both educational and caregiving functions.

4.2. Improving the Spatial Accessibility and Equity of Childcare Facilities by Housing Type

Variations in the supply of children’s spaces across regions may arise because of differences in demand. According to Blumenberg, Yao, and Wander [18], Cui et al. [7], and Fuller and Liang [75], the most significant factor influencing supply is demand, specifically population. This study confirmed that the impact of the child population on the accessibility of childcare facilities is significant, based on actual demand and supply. The distribution of childcare facilities affects both the area of concern and the spatial relationships with neighboring areas, and the analysis confirmed differences in regional clustering. Based on these findings, three key points of discussion are presented to improve spatial accessibility and equity of childcare facilities by housing type.
First, spatial equity requires an approach based on the analysis of various factors, such as demand (including population density), housing type, and distribution of existing childcare facilities, to build a supply system. When examining the overall spatial equity of childcare facilities in Seongbuk-gu by housing type, the apartment areas showed a relatively higher degree of imbalance. This is attributed to the child population being relatively concentrated in apartment areas, leading to a higher demand for childcare facilities than the limited supply, which causes an equity issue. This demonstrates the polarization between accessibility and equity. In other words, only by first considering the spatial accessibility of facilities and then reviewing the equity aspect can we clearly understand the overall supply of childcare facilities to the community.
Second, owing to the varying levels of inequality by housing type and contradicting the accessibility results, adopting a supply strategy that considers accessibility as well as equity is essential. Accessibility analysis by housing type revealed that low-rise residential areas had worse accessibility than apartment areas. While there are many childcare centers in apartment areas, kindergartens, elementary-care classes, care centers, gap care institutions, and community childcare centers are more often distributed in low-rise residential areas. The higher average accessibility value in apartment areas is influenced by the density of child populations within the critical distance of each facility. Although many childcare facilities are located in low-rise residential areas, most are situated near apartments, meaning that children in apartments can also be accommodated.
Third, as spatial clustering differences emerge according to housing type, it is necessary to establish detailed criteria for facility supply. Most childcare facilities are found in high–high clusters with high positive correlation values, and spatial clustering is more evident in low-rise residential areas than in apartment areas. This is a result of a phenomenon wherein the facility supply is predominantly concentrated in low-rise residential areas, reflecting local characteristics. Therefore, it is necessary to explore supply solutions considering the spatial equity of apartment areas.

5. Conclusions

The 2SFCA method is important, in that it analyzes spatial accessibility based solely on location, considering supply and demand points at a specific scale without accounting for individual movement behaviors or mobility [7]. This study analyzed the spatial accessibility of childcare facilities in Seongbuk-gu, Seoul, based on the 2SFCA method and evaluated spatial equity based on this analysis. The key finding shows that despite the need for all children to have equal access to childcare facilities, significant differences in spatial accessibility exist by region. Most childcare facilities are unevenly distributed in terms of spatial equity, with significant differences in accessibility depending on housing type. Analysis by housing type revealed that childcare facilities are relatively scarce in low-rise residential areas, which particularly affects children with limited mobility. As mentioned in Blumenberg et al. [18] and Cui et al. [7], this study confirms that the child population, which has the most significant impact on the supply of childcare facilities, is closely related. Similarly, regarding accessibility based on actual demand and supply, the number of children emerged as a significant influencing factor. Rational planning and management strategies for childcare facilities can improve spatial equity. As all children must have access to facility services, a planned approach to supply and demand is necessary.
This study proposes several policy recommendations to enhance the spatial equity of childcare facilities. First, a supply strategy that considers both spatial accessibility and equity is required. Population changes and regional spatial demands should be identified in more detail to develop a supply strategy that considers spatial accessibility and equity. Beyond the expansion of individual facilities, a comprehensive infrastructure should be established to strengthen connections between childcare facilities at the community level. Second, improvements are required in the distribution and clustering of childcare facilities. Legal and institutional measures should be implemented to supply facilities to low-rise residential areas. Unlike apartment areas, low-rise residential areas lack clear criteria for installing childcare facilities, which leads to insufficient investment and support for public infrastructure. To address this, a strategy should be developed to supply facilities densely, considering local characteristics, in coordination with small-scale residential development projects, such as street housing redevelopment projects. Third, a comprehensive childcare facilities plan should be established, being closely related to the community, and a continuous management system should be established. There is an urgent need to create a strategy for supplying facilities to necessary locations, not just where it is convenient for the public sector to supply facilities. Accessibility should consider not only distance but also population density and supply characteristics (equity), which calls for actively utilizing unused spaces in the community. In a situation where demand is rapidly changing, the supply standards for basic community infrastructure, which are currently fragmented, can lead to sustainability issues and create disparities in spatial welfare. Finally, a mixed-care facility model that can serve children of various age groups should be introduced. By efficiently using the limited land and budget, more integrated childcare facilities can be built to improve spatial efficiency and address equity issues between regions.
This study divided the analysis into two scenarios to examine the importance of the accessibility analysis method and confirmed that the spatial distribution of childcare facilities is closely related to the child population. The findings of this study are significant, in that they accentuate the importance of childcare spaces, which have been neglected in existing public service facilities, and highlight the right of children to equally enjoy the physical spaces of the community. However, the analysis was limited to Seongbuk-gu, Seoul, and there is a limitation, in that the distance reduction factors were not reflected in the accessibility analysis [48]. There is also a limitation in that walking ease (e.g., slope) was not reflected in the accessibility analysis. Walking was the sole mode of calculating travel costs, thereby excluding other transportation options [57,76]. As emphasized by Jansson et al. [77], an approach that considers both social and physical aspects for creating child-friendly environments is necessary. Therefore, future research should comprehensively analyze the differences in accessibility to childcare facilities by housing type in relation to children’s social characteristics and explore various strategies for achieving spatial welfare.

Author Contributions

Conceptualization, Sunju Kang and Gunwon Lee; Methodology, Sunju Kang and Gunwon Lee; Software, Sunju Kang; Validation, Sunju Kang and Gunwon Lee; Formal analysis, Sunju Kang; Investigation, Sunju Kang; Resources, Gunwon Lee; Data curation, Sunju Kang; Writing—Original draft preparation, Sunju Kang; Writing—Review and editing, Sunju Kang and Gunwon Lee; Visualization, Sunju Kang and Gunwon Lee; Supervision, Gunwon Lee. All authors have read and agreed to the published version of the manuscript.

Funding

This research received no external funding.

Data Availability Statement

All data generated or analyzed during this study are included in this published article.

Conflicts of Interest

The authors declare no conflicts of interest.

References

  1. Hansen, W.G. How Accessibility Shapes Land Use. J. Am. Plan. Assoc. 1959, 25, 73–76. [Google Scholar] [CrossRef]
  2. Kingston, B.; Wridt, P.; Chawla, L.; Van Vliet, W.; Brink, L. Creating Child-Friendly Cities: The Case of Denver, USA. Proc. Inst. Civ. Eng. Munic. Eng. 2007, 160, 97–102. [Google Scholar] [CrossRef]
  3. Nam, H.; Nam, S.I. Child-Friendly City Policies in the Republic of Korea. Child. Youth Serv. Rev. 2018, 94, 545–556. [Google Scholar] [CrossRef]
  4. Nordström, M. Children’s Views on Child-Friendly Environments in Different Geographical, Cultural, and Social Neighbourhoods. Urban Stud. 2010, 47, 514–528. [Google Scholar] [CrossRef]
  5. Shadkam, A.; Moos, M. Keeping Young Families in the Centre: A Pathways Approach to Child-Friendly Urban Design. J. Urban Des. 2021, 26, 699–724. [Google Scholar] [CrossRef]
  6. Aerts, J. Shaping Urbanization for Children: A Handbook on Child-Responsive Urban Planning; UNICEF: New York, NY, USA, 2018; Volume 3, Available online: https://www.unicef.org/reports/shaping-urbanization-children (accessed on 10 December 2024).
  7. Cui, Y.; Wang, Q.; Zha, G.; Dang, Y.; Duan, X.; Wang, L.; Luo, M. Evaluation of the Accessibility of Children’s Spaces at the Community Scale: The Case Study of Hangzhou. ISPRS Int. J. Geo-Inf. 2024, 13, 55. [Google Scholar] [CrossRef]
  8. Yoo, D.-U.; Lee, S. Neighborhood Sustainability Measure for Preschool Children Based on Proximity to Major Service Amenities. Sustainability 2020, 12, 1712. [Google Scholar] [CrossRef]
  9. Xiao, Y. Study on the Spatial Distribution and Utilization of Children’s Public Service Facilities in Foshan City Based on Big Data. In Proceedings of the Information Technology and Mechatronics Engineering Conference (ITOEC), Chongqing, China, 15–17 September 2023; pp. 1457–1461. [Google Scholar] [CrossRef]
  10. Kwon, E.-K.; Yoon, C.-J. A Study on the Spatial Distribution of Elementary After-School Care Facilities: Focused on Daegu Metropolitan. Youth Facil. Environ. 2024, 22, 2539. Available online: https://www.earticle.net/Article/A443184 (accessed on 15 December 2024).
  11. Lee, J. An Analysis of Infrastructure Supply for Childcare Centers and Kindergartens in the Era of Low Birth Rates. Childcare Policy Forum 2023, 78, 36–48. [Google Scholar]
  12. Ryou, B.; Gim, J. A Study on the Physical Accessibility of Child Care Service Facilities: Focused on the Vulnerable Residential Area. Korean J. Soc. Welf. Stud. 2022, 53, 177–205. [Google Scholar] [CrossRef]
  13. Altintas, E.; Sullivan, O. Fifty Years of Change Updated: Cross-National Gender Convergence in Housework. Demogr. Res. 2016, 35, 455–470. [Google Scholar] [CrossRef]
  14. Boesch, T.; Grunewald, R.; Chandler, S. Pandemic Pushes Mothers of Young Children Out of the Labor Force; Federal Reserve Bank of Minneapolis: Minneapolis, MN, USA, 2021; Available online: https://www.minneapolisfed.org/article/2021/pandemic-pushes-mothers-of-young-children-out-of-the-labor-force (accessed on 10 January 2025).
  15. Choi, Y. Public Discourse on the Public Nature of Childcare Services and Related Issues; Presented at the Childcare Policy Forum of the Presidential Committee on Aging Society and Population Policy: Seoul, Republic of Korea, 2022; Available online: https://youtu.be/RYR5dGVTfW8?si=dHuGuRLEvDOj3iq1 (accessed on 2 January 2025).
  16. Jang, S.J.; Song, D.; Baek, K. A Critical Analysis of Elementary Care Policy: Focusing on Experiences of After-school Cooperative Childcare Participants. Crit. Soc. Welf. Policy 2019, 62, 251–287. [Google Scholar] [CrossRef]
  17. Kim, S.; Choi, Y. Supply of Elementary After-school Care Services and Women’s Labor Market Participation. Korean J. Fam. Soc. Work. 2024, 71, 141–172. [Google Scholar] [CrossRef]
  18. Blumenberg, E.; Yao, Z.; Wander, M. Variation in Child Care Access across Neighborhood Types: A Two-Step Floating Catchment Area (2SFCA) Approach. Appl. Geogr. 2023, 158, 103054. [Google Scholar] [CrossRef]
  19. Breunig, R.; Weiss, A.; Yamauchi, C.; Gong, X.; Mercante, J. Child Care Availability, Quality and Affordability: Are Local Problems Related to Labour Supply? Econ. Rec. 2011, 87, 109–124. [Google Scholar] [CrossRef]
  20. Chevalier, A.; Viitanen, T.K. The Causality between Female Labour Force Participation and the Availability of Childcare. Appl. Econ. Lett. 2002, 9, 915–918. [Google Scholar] [CrossRef]
  21. Yeom, C.-H.; Kang, H.-M.; Park, Y.-N. A Study on Business Model and Support Measures for Creating and Operating Child-Friendly Residential Spaces: Focusing on Small-Scale Public Rental Housing; Architectural & Urban Research Institute: Sejong-si, Republic of Korea, 2022; Available online: https://www.auri.re.kr/publicationFileDirect.es?bid=research&list_no=1931&seq=1 (accessed on 10 December 2024).
  22. Chen, Z.; Liu, Q.; Li, M.; Xu, D. A New Strategy for Planning Urban Park Green Spaces by Considering Their Spatial Accessibility and Distributional Equity. Forests 2024, 15, 570. [Google Scholar] [CrossRef]
  23. Jang, K.M.; Kim, J.; Lee, H.-Y.; Cho, H.; Kim, Y. Urban Green Accessibility Index: A Measure of Pedestrian-Centered Accessibility to Every Green Point in an Urban Area. ISPRS Int. J. Geo-Inf. 2020, 9, 586. [Google Scholar] [CrossRef]
  24. Lee, J.; Miller, H.J. Analyzing Collective Accessibility Using Average Space-Time Prisms. Transp. Res. Part D Transp. Environ. 2019, 69, 250–264. [Google Scholar] [CrossRef]
  25. Wang, R.; Wang, Y.; Li, N. Revealing Disaster Dynamics and Disparities in Urban Facility Accessibility Using an Improved Utilization-Based Metric. Cities 2024, 144, 104636. [Google Scholar] [CrossRef]
  26. Zhu, H.; Li, J.; Yuan, Z.; Li, J. Bibliometric Analysis of Spatial Accessibility from 1999–2022. Sustainability 2023, 15, 13399. [Google Scholar] [CrossRef]
  27. Weng, M.; Ding, N.; Li, J.; Jin, X.; Xiao, H.; He, Z.; Su, S. The 15-Minute Walkable Neighborhoods: Measurement, Social Inequalities, and Implications for Building Healthy Communities in Urban China. J. Transp. Health 2019, 13, 259–273. [Google Scholar] [CrossRef]
  28. Mostafavi, F.; Piroozi, B.; Mosquera, P.; Majdzadeh, R.; Moradi, G. Assessing Horizontal Equity in Health Care Utilization in Iran: A Decomposition Analysis. BMC Public Health 2020, 20, 914. [Google Scholar] [CrossRef]
  29. Chen, Z.; Yeh, A.G.-O. Accessibility Inequality and Income Disparity in Urban China: A Case Study of Guangzhou. Ann. Am. Assoc. Geogr. 2020, 109, 121–141. [Google Scholar] [CrossRef]
  30. Geurs, K.T.; van Wee, B. Accessibility Evaluation of Land-Use and Transport Strategies: Review and Research Directions. J. Transp. Geogr. 2004, 12, 127–140. [Google Scholar] [CrossRef]
  31. Hamid, J.A.; Juni, M.H.; Manaf, R.A.; Ismail, S.N.S.; Lim, P.Y. Spatial Accessibility of Primary Care in the Dual Public–Private Health System in Rural Areas, Malaysia. Int. J. Environ. Res. Public Health 2023, 20, 3147. [Google Scholar] [CrossRef]
  32. Xing, L.; Chen, Q.; Liu, Y.; He, H. Evaluating the Accessibility and Equity of Urban Health Resources Based on Multi-Source Big Data in High-Density City. Sustain. Cities Soc. 2024, 100, 105049. [Google Scholar] [CrossRef]
  33. Xu, H.; Zhao, J.; Yu, X. A Community-Oriented Accessibility Index of Public Health Service Facilities: A Case Study of Wuchang District, Wuhan, China. Sustainability 2023, 15, 10870. [Google Scholar] [CrossRef]
  34. Liu, B.; Qiu, N.; Zhang, T. Accessibility of Elderly Care Facilities Based on Social Stratification: A Case Study in Tianjin, China. Sustainability 2023, 15, 1507. [Google Scholar] [CrossRef]
  35. Liu, L.; Lyu, H.; Zhao, Y.; Zhou, D. An Improved Two-Step Floating Catchment Area (2SFCA) Method for Measuring Spatial Accessibility to Elderly Care Facilities in Xi’an, China. Int. J. Environ. Res. Public Health 2022, 19, 11465. [Google Scholar] [CrossRef]
  36. Liu, L.; Zhao, Y.; Lyu, H.; Chen, S.; Tu, Y.; Huang, S. Spatial Accessibility and Equity Evaluation of Medical Facilities Based on Improved 2SFCA: A Case Study in Xi’an, China. Int. J. Environ. Res. Public Health 2023, 20, 2076. [Google Scholar] [CrossRef] [PubMed]
  37. Chen, P.; Jian, I.Y.; Zhang, L.; Siu, K.W.M.; Liu, J.; Liu, Z.; Chen, X. Towards a Smart Healthy City: A Generalised Flow-Based 2SFCA Method for Incorporating Actual Mobility Data in Healthcare Accessibility Evaluation. Travel Behav. Soc. 2024, 34, 100706. [Google Scholar] [CrossRef]
  38. Li, Z.; Fan, Z.; Song, Y.; Chai, Y. Assessing Equity in Park Accessibility Using a Travel Behavior-Based G2SFCA Method in Nanjing, China. J. Transp. Geogr. 2021, 96, 103179. [Google Scholar] [CrossRef]
  39. Li, L.; Du, Q.; Ren, F.; Ma, X. Assessing Spatial Accessibility to Hierarchical Urban Parks by Multi-Types of Travel Distance in Shenzhen, China. Int. J. Environ. Res. Public Health 2019, 16, 1038. [Google Scholar] [CrossRef] [PubMed]
  40. Pei, Z.; Guo, P.; Chen, Q.; Li, J.; Liu, Z.; Sun, Y.; Zhang, X. An Improved Multi-Mode Two-Step Floating Catchment Area Method for Measuring Accessibility of Urban Parks in Tianjin, China. Sustainability 2022, 14, 11592. [Google Scholar] [CrossRef]
  41. Rong, P.; Zheng, Z.; Alimohammadi, A. A User-Based Approach for Assessing Spatial Equity of Attractiveness and Accessibility to Alternative Urban Parks. Geo-Spat. Inf. Sci. 2024, 27, 487–504. [Google Scholar] [CrossRef]
  42. Fransen, K.; Neutens, T.; De Maeyer, P.; Deruyter, G. A Commuter-Based Two-Step Floating Catchment Area Method for Measuring Spatial Accessibility of Daycare Centers. Health Place 2015, 32, 65–73. [Google Scholar] [CrossRef]
  43. Ryu, Y.; Kim, K. Assessment of Spatial Equity in Accessibility to Public Sports Facilities in Seoul: Focusing on Spatial Analysis. J. Korean Soc. Sports Sci. 2023, 62, 363–376. Available online: https://www.scribd.com/document/695222305/ (accessed on 10 December 2024).
  44. Song, L.; Kong, X.; Cheng, P. Supply-Demand Matching Assessment of the Public Service Facilities in 15-Minute Community Life Circle Based on Residents’ Behaviors. Cities 2024, 144, 104637. [Google Scholar] [CrossRef]
  45. Dong, J.; Wang, Y.; Yang, Y.; Luo, X.; Wang, L. A Multi-Level Framework for Assessing the Spatial Equity of Urban Public Space towards SDG 11.7.1: A Case Study in Beijing. Appl. Geogr. 2023, 161, 103142. [Google Scholar] [CrossRef]
  46. Guo, Y.; Chan, C.H.; Yip, P.S.F. Spatial Variation in Accessibility of Libraries in Hong Kong. Libr. Inf. Sci. Res. 2017, 39, 319–329. [Google Scholar] [CrossRef]
  47. Li, Y.; Lin, Y.; Geertman, S.; Hooimeijer, P.; Xu, W. Accessibility-Based Equity of Public Facilities: A Case Study in Xiamen, China. Appl. Spat. Anal. Policy 2021, 14, 947–968. [Google Scholar] [CrossRef]
  48. Luo, W.; Wang, F. Measures of Spatial Accessibility to Health Care in a GIS Environment: Synthesis and a Case Study in the Chicago Region. Environ. Plan. B Plan. Des. 2003, 30, 865–884. [Google Scholar] [CrossRef] [PubMed]
  49. Luo, W.; Whippo, T. Variable Catchment Sizes for the Two-Step Floating Catchment Area (2SFCA) Method: A Commuter-Based Two-Step Floating Catchment Area Method for Measuring Spatial Accessibility of Daycare Centers. Health Place 2012, 18, 789–795. [Google Scholar] [CrossRef] [PubMed]
  50. Shao, Y.; Luo, W. Supply-Demand Adjusted Two-Steps Floating Catchment Area (SDA-2SFCA) Model for Measuring Spatial Access to Health Care. Soc. Sci. Med. 2022, 296, 114727. [Google Scholar] [CrossRef]
  51. Chin, M.H.; King, P.T.; Jones, R.G.; Jones, B.; Ameratunga, S.N.; Muramatsu, N.; Derrett, S. Lessons for Achieving Health Equity: Comparing Aotearoa/New Zealand and the United States. Health Policy 2018, 122, 837–853. [Google Scholar] [CrossRef]
  52. Dadashpoor, H.; Rostami, F.; Alizadeh, B. Is Inequality in the Distribution of Urban Facilities Inequitable? Exploring a Method for Identifying Spatial Inequity in an Iranian City. Cities 2016, 52, 159–172. [Google Scholar] [CrossRef]
  53. Rong, P.; Zheng, Z.; Kwan, M.-P.; Qin, Y. Evaluation of the Spatial Equity of Medical Facilities Based on Improved Potential Model and Map Service API: A Case Study in Zhengzhou, China. Appl. Geogr. 2020, 119, 102192. [Google Scholar] [CrossRef]
  54. Castanho, R.; Loures, L.; Fernandez, J.; Pozo, L. Identifying Critical Factors for Success in Cross Border Cooperation (CBC) Development Projects. Habitat Int. 2018, 72, 92–99. [Google Scholar] [CrossRef]
  55. Long, H.; Tu, S.; Ge, D.; Li, T.; Liu, Y. The Allocation and Management of Critical Resources in Rural China under Restructuring: Problems and Prospects. J. Rural. Stud. 2016, 47, 392–412. [Google Scholar] [CrossRef]
  56. Naranjo Gómez, J.; Loures, L.; Castanho, R.; Cabezas, J.; Panagopoulos, T. Assessing the Feasibility of GIS Multimethod Approach to Ascertain Territorial Accessibility to Hemodynamics Rooms in Spain Mainland. Habitat Int. 2018, 71, 22–28. [Google Scholar] [CrossRef]
  57. Yu, P.; Chen, Y.; Xu, Q.; Zhang, S.; Yung, E.H.K.; Chan, E.H.W. Embedding of Spatial Equity in a Rapidly Urbanising Area: Walkability and Air Pollution Exposure. Cities 2022, 131, 103942. [Google Scholar] [CrossRef]
  58. Lucas, K.; van Wee, B.; Maat, K. A Method to Evaluate Equitable Accessibility: Combining Ethical Theories and Accessibility-Based Approaches. Transportation 2016, 43, 473–490. [Google Scholar] [CrossRef]
  59. Mu, L.; Xing, L.; Jing, Y.; Hu, Q. Spatial Optimization of Park Green Spaces by an Improved Two-Step Optimization Model from the Perspective of Maximizing Accessibility Equity. Land 2023, 12, 948. [Google Scholar] [CrossRef]
  60. Wang, Y.; Liu, Y.; Xing, L.; Zhang, Z. An Improved Accessibility-Based Model to Evaluate Educational Equity: A Case Study in the City of Wuhan. ISPRS Int. J. Geo-Inf. 2021, 10, 458. [Google Scholar] [CrossRef]
  61. Pennerstorfer, A.; Pennerstorfer, D.; Neumayr, M. Unequal Access to Childcare in Cities: Is Equal Public Funding Sufficient? Urban Stud. 2025, 62, 647–664. [Google Scholar] [CrossRef]
  62. Pennerstorfer, A.; Pennerstorfer, D. How Small Are Small Markets? Local Market Size for Child Care Services. Reg. Sci. Urban Econ. 2019, 77, 340–355. [Google Scholar] [CrossRef]
  63. Pennerstorfer, A.; Pennerstorfer, D. Inequalities in Spatial Accessibility of Childcare: The Role of Non-Profit Providers. J. Soc. Policy 2021, 50, 122–147. [Google Scholar] [CrossRef]
  64. Lee, J.; Jang, Y.J. Equal Access to Early Childhood Education in South Korea Using the Geographic Information System. Int. J. Early Years Educ. 2017, 25, 171–189. [Google Scholar] [CrossRef]
  65. Kang, H.; Kang, J.; Kim, N.; Yoon, J.; Han, S.; Choi, I.; Lee, S.; Lee, J.; Cho, S.; Kwon, M.; et al. Building Spatial Model for Safety Nets for Childcare: Fostering Healthy Child Development in Neighborhoods; Architecture and Urban Research Institute, Cooperative Research Series 24-24-01; National Research Council for Economics, Humanities and Social Sciences: Sejong, Republic of Korea, 2024. [Google Scholar]
  66. Smart Seoul Map. Seoul Public Spatial Information Portal; Modified by the Author. Available online: https://map.seoul.go.kr/global/ (accessed on 5 March 2025).
  67. Seongbuk-gu Office. Official Website of Seongbuk-gu; Modified by the Author. Available online: https://www.sb.go.kr/www/contents.do?key=5962 (accessed on 5 March 2025).
  68. Seoul Institute. Current Status and Improvement Directions for Low-Rise Residential Areas in Seoul; Seoul Institute: Seoul, Republic of Korea, 2016; Available online: https://www.si.re.kr/node/57461 (accessed on 17 January 2025).
  69. Neutens, T. Accessibility, Equity and Health Care: Review and Research Directions for Transport Geographers. J. Transp. Geogr. 2015, 43, 14–27. [Google Scholar] [CrossRef]
  70. Seo, I.; Woo, C.; Ki, Y. Analysis of Regional Happiness Inequality Levels Using the Gini Coefficient. J. Local Adm. Stud. 2016, 30, 109–137. [Google Scholar] [CrossRef]
  71. Park, R.K. An Analysis of Degree of Cargo Concentration at Korean Ports Using the Gini Coefficient and Lorenz Curve. J. Korea Trade 2002, 27, 285–304. [Google Scholar]
  72. Mishra, P.S.; Sinha, D.; Kumar, P.; Srivastava, S. Spatial Inequalities in Skilled Birth Attendance in India: A Spatial-Regional Model Approach. BMC Public Health 2022, 22, 79. [Google Scholar] [CrossRef] [PubMed]
  73. Anselin, L. Local Indicators of Spatial Association—LISA. Geogr. Anal. 1995, 27, 93–184. [Google Scholar] [CrossRef]
  74. Seoul Open Data Plaza. Seongbuk-gu Childcare Center Information; Modified by the Author. Available online: https://data.seoul.go.kr (accessed on 17 November 2024).
  75. Fuller, B.; Liang, X. The Unfair Search for Child Care: Working Moms, Poverty, and the Unequal Supply of Preschools across America; Harvard University: Cambridge, MA, USA, 1993. Available online: https://eric.ed.gov/?id=ED363430 (accessed on 1 December 2024).
  76. Liang, H.; Yan, Q.; Yan, Y.; Zhang, Q. Using an Improved 3SFCA Method to Assess Inequities Associated with Multimodal Accessibility to Green Spaces Based on Mismatches Between Supply and Demand in the Metropolitan of Shanghai, China. Sustain. Cities Soc. 2023, 91, 104456. [Google Scholar] [CrossRef]
  77. Jansson, M.; Herbert, E.; Zalar, A.; Johansson, M. Child-Friendly Environments—What, How and by Whom? Sustainability 2022, 14, 4852. [Google Scholar] [CrossRef]
Figure 1. The study area includes Seongbuk-gu, located in Seoul Metropolitan City, Republic of Korea (Source: Smart Seoul Map and the official website of Seongbuk-gu, 2025; modified by the author).
Ijgi 14 00247 g001
Figure 2. Childcare facilities.
Ijgi 14 00247 g002
Figure 3. Distribution data by housing type.
Ijgi 14 00247 g003
Figure 4. Research framework.
Ijgi 14 00247 g004
Figure 5. Child population distribution.
Ijgi 14 00247 g005
Figure 6. Map of accessibility results for childcare facilities by all areas.
Ijgi 14 00247 g006
Figure 7. Average spatial accessibility of childcare facilities by housing type.
Ijgi 14 00247 g007
Figure 8. Map of accessibility results for childcare facilities by apartment areas.
Ijgi 14 00247 g008
Figure 9. Map of accessibility results for childcare facilities by low-rise residential areas.
Ijgi 14 00247 g009
Figure 10. Lorenz curve result graph.
Ijgi 14 00247 g010
Figure 11. Bivariate Moran’s I results (infancy and early childhood).
Ijgi 14 00247 g011
Figure 12. Bivariate Moran’s I results (elementary school years).
Ijgi 14 00247 g012
Figure 13. Bivariate Moran’s I LISA results (infancy and early childhood): a: Seongbuk-dong, b: Samseon-dong, c: Dongseon-dong, d: Donam1-dong, e: Donam2-dong, f: Anam-dong, g: Bomun-dong, h: Jeongneung1-dong, i: Jeongneung2-dong, j: Jeongneung3-dong, k: Jeongneung4-dong, l: Gireum1-dong, m: Gireum2-dong, n: Jongam-dong, o: Wolgok1-dong, p: Wolgok2-dong, q: Jangwi1-dong, r: Jangwi2-dong, s: Jangwi3-dong, t: Seokgwan-dong.
Ijgi 14 00247 g013
Figure 14. Bivariate Moran’s I LISA results (elementary school years): a: Seongbuk-dong, b: Samseon-dong, c: Dongseon-dong, d: Donam1-dong, e: Donam2-dong, f: Anam-dong, g: Bomun-dong, h: Jeongneung1-dong, i: Jeongneung2-dong, j: Jeongneung3-dong, k: Jeongneung4-dong, l: Gireum1-dong, m: Gireum2-dong, n: Jongam-dong, o: Wolgok1-dong, p: Wolgok2-dong, q: Jangwi1-dong, r: Jangwi2-dong, s: Jangwi3-dong, t: Seokgwan-dong.
Ijgi 14 00247 g014
Figure 15. Childcare facility supply by housing type (Source: Photo taken directly by the author).
Ijgi 14 00247 g015
Figure 16. The number of closed childcare centers in Seongbuk-gu by year (Source: Seoul Open Data Plaza, 2024; modified by the author).
Ijgi 14 00247 g016
Table 1. Child population distribution by type of residence (as of 2024).
DivisionTotal
Population
Apartment
Population
Low-Rise Residential Population
Infancy and early childhood11,08670834003
Elementary school years16,90810,8646044
Total27,99417,94710,047
Unit: Children.
Table 2. Types of infancy, early childhood, and elementary school years care facilities.
DivisionFacility NameAffiliation DepartmentLocation
Infancy and
early childhood
Childcare centerMinistry of Health and WelfareCommunity
KindergartenMinistry of EducationCommunity
Elementary school yearsElementary-care classMinistry of EducationSchool
Together care centerMinistry of Health and WelfareCommunity
Gap care institutionCommunity
Community child centerLocal governmentCommunity
Table 3. Distribution status of childcare facilities (as of April 2024).
DivisionFacility NameSpecific FacilitiesLocations
(Units)
CapacityMinimum
Standard
(Minutes)
Distance
Conversion
(m)
Minimum
(People)
Maximum
(People)
Infancy and early childhoodChildcare centersHome-based4413205250
Public8816120
Private3321143
Workplace647100
Cooperative21930
Etc.93099
KindergartenPublic (single-family)350835~10500
Public (annexed)131960
Private (corporate)1623174
Private (signed)1410240
Elementary school yearsElementary-care classPublic 242816710~15500
Together care center-12203510~15500
Gap care institution-7101010~15500
Community child center-23364910~15750
Table 4. Seongbuk-gu housing type area.
DivisionArea (m2)Ratio (%)
Apartment area360,471.4839.2
Low-rise residential area559,031.7660.8
Total919,503.24100.0
Table 5. Types of Bivariate Local Moran’s I.
ClassificationTypeMeaning
Positive spatial correlationH-H (High–High)Areas with high values tend to have neighboring areas with high values
L-L (Low–Low)Areas with low values tend to have neighboring areas with low values
Negative spatial correlationH-L (High–Low)Areas with high values tend to have neighboring areas with low values
L-H (Low–High) Areas with low values tend to have neighboring areas with high values
Table 6. Status of childcare facilities supply.
DivisionChildcare CenterKindergartenElementary-Care ClassTogether Care CenterGap Care InstitutionCommunity Child Center
Apartment areas108 (59.3%)16 (34.8%)7 (29.1%)3 (25%)2 (28.5%)7 (28.5%)
Low-rise
residential areas
74 (40.7%)30 (65.2%)17 (70.9%)9 (75%)5 (71.5%)16 (71.5%)
All areas182462412723
Units (%).
Table 7. Child population distribution (based on the number of grids).
Child PopulationInfancy and
Early Childhood
Elementary School Years
Apartment AreasLow-Rise Residential AreasApartment AreasLow-Rise Residential Areas
Areas with no population87.42%
(2320 grid)
86.32%
(2291 grid)
85.61%
(2272 grid)
81.50%
(2163 grid)
Areas with a population distribution of 1–50 children11.83%
(314 grid)
13.13%
(350 grid)
12.40%
(329 grid)
17.75%
(471 grid)
Areas with a population distribution of more than 50 children0.75%
(20 grid)
0.49%
(13 grid)
2.0%
(53 grid)
0.75%
(20 grid)
Table 8. Results on accessibility to childcare facilities by child age.
DivisionInfancy and Early ChildhoodElementary School Years
Childcare CenterKindergartenElementary-Care ClassTogether Care CenterGap Care InstitutionCommunity Child Center
RangeResultRangeResultRangeResultRangeResultRangeResultRangeResult
I0.000–0.0241348
(50.79)
0.000–0.0241137
(42.84)
0.000–0.0191318
(49.66)
0.000–0.0041938
(73.02)
0.000–0.0022245
(84.59)
0.000–0.002816
(30.75)
VL0.024–0.463866
(32.63)
0.024–0.155790
(29.77)
0.019–0.047353
(13.30)
0.004–0.012191
(7.2)
0.002–0.00361
(2.30)
0.002–0.016686
(25.85)
L0.463–1.173337
(12.70)
0.155–0.287371
(13.98)
0.047–0.087513
(19.33)
0.012–0.018305
(11.49)
0.003–0.006121
(4.56)
0.016–0.025547
(20.61)
M1.173–2.58169
(2.60)
0.287–0.580287
(10.81)
0.087–0.119296
(11.15)
0.018–0.03195
(3.58)
0.006–0.01198
(3.69)
0.025–0.034448
(16.88)
H2.581–4.03717
(0.64)
0.580–0.9201
(0.04)
0.119–0.154105
(3.96)
0.031–0.04546
(1.73)
0.011–0.01597
(3.65)
0.034–0.043114
(4.30)
VH4.037–5.44417
(0.64)
0.920–1.21468
(2.56)
0.154–0.21869
(2.60)
0.045–0.07279
(2.98)
0.015–0.02032
(1.21)
0.043–0.06343
(1.62)
Unit: locations (%).
Table 9. Gini coefficient results.
DivisionChildcare CenterKindergartenElementary-Care ClassTogether Care CenterGap Care InstitutionCommunity Child Center
All areas0.5500.5000.3440.4510.4260.305
Apartment areas0.8540.8230.7920.6230.5230.544
Low-rise residential areas0.6580.6120.4070.3570.0850.305
Table 10. Gini coefficient results when applying a fixed population.
DivisionChildcare CenterKindergartenElementary-Care ClassTogether Care CenterGap Care InstitutionCommunity Child Center
All areas0.5510.4040.2450.2880.3210.221
Apartment areas0.5710.5050.5620.5150.4630.518
Low-rise residential areas0.6190.4270.3240.3420.1650.066
Table 11. Bivariate Moran’s I results.
DivisionChildcare CenterKindergartenElementary-Care ClassTogether Care CenterGap Care InstitutionCommunity Child Center
All areas0.0510.0450.1430.0920.0500.107
Apartment areas−0.038−0.031−0.0330.0110.014−0.015
Low-rise residential areas−0.007−0.0210.0630.1060.0730.102
Disclaimer/Publisher’s Note: The statements, opinions and data contained in all publications are solely those of the individual author(s) and contributor(s) and not of MDPI and/or the editor(s). MDPI and/or the editor(s) disclaim responsibility for any injury to people or property resulting from any ideas, methods, instructions or products referred to in the content.

