Article

PCA-GWO-KELM Optimization Gait Recognition Indoor Fusion Localization Method

1
School of Information and Communication, Guilin University of Electronic Technology, Guilin 541004, China
2
Guangxi Key Laboratory of Precision Navigation Technology and Application, Guilin University of Electronic Technology, Guilin 541004, China
3
International Joint Research Laboratory of Spatio-Temporal Information and Intelligent Location Services, Guilin University of Electronic Technology, Guilin 541004, China
4
GUET-Nanning E-Tech Research Institute Co., Ltd., Nanning 530031, China
5
Department of Science and Engineering, Guilin University, Guilin 541006, China
6
Center for Advanced Industrial Technology, University Malaysia Pahang Al Sultan Abdullah, Pekan 26600, Malaysia
*
Author to whom correspondence should be addressed.
ISPRS Int. J. Geo-Inf. 2025, 14(7), 246; https://doi.org/10.3390/ijgi14070246
Submission received: 21 April 2025 / Revised: 21 June 2025 / Accepted: 22 June 2025 / Published: 26 June 2025
(This article belongs to the Special Issue Indoor Mobile Mapping and Location-Based Knowledge Services)

Abstract

Location-based services have important economic and social values. The positioning accuracy and cost have a crucial impact on the quality, promotion, and market competitiveness of location services. Dead reckoning can provide accurate location information in a short time. However, it suffers from motion pattern diversity and cumulative error. To address these issues, we propose a PCA-GWO-KELM optimization gait recognition indoor fusion localization method. In this method, 30-dimensional motion features for different motion patterns are extracted from inertial measurement units. Then, constructing PCA-GWO-KELM optimization gait recognition algorithms to obtain important features, the model parameters of the kernel-limit learning machine are optimized by the gray wolf optimization algorithm. Meanwhile, adaptive upper thresholds and adaptive dynamic time thresholds are constructed to void pseudo peaks and valleys. Finally, fusion localization is achieved by combining with acoustic localization. Comprehensive experiments have been conducted using different devices in two different scenarios. Experimental results demonstrated that the proposed method can effectively recognize motion patterns and mitigate cumulative error. It achieves higher localization performance and universality than state-of-the-art methods.

1. Introduction

Location-based services have significant commercial and economic value, and they have been widely used in navigation and guidance services for public places such as smart homes, logistics and warehousing, medical health, public transportation, shopping malls, exhibition halls, etc. In outdoor environments, GPS can provide precise location information in all-weather days [1,2]. However, GPS signal cannot permeate indoor environments due to building obstructions [3]. Therefore, how to provide robust positioning in indoor environments has become the key challenge.
Researchers have developed a series of indoor positioning technologies including infrared [4], Bluetooth (BT) [5], Wireless Fidelity (Wi-Fi) [6], Radio Frequency Identification (RFID) [7], and ultra-wideband (UWB) [8]. In these technologies, Wi-Fi, infrared, and BT have good positioning performance within a short distance range. And RFID and UWB have high costs with infrastructure installation. Dead reckoning (DR) has high positioning performance over a period of time and a low cost, and it cannot be affected by external environmental interference [9]. In acoustic positioning, pseudo-ultrasound is not affected by human behavior and has high positioning accuracy with the frequency range of 16–20 kHz. At the same time, many indoor venues are already equipped with complete loudspeaker broadcast systems, which can be modified to broadcast positioning signals, minimizing the deployment cost of positioning [10]. Therefore, DR and acoustic localization are promising techniques for indoor positioning.
Dead reckoning utilizes inertial measurement unit (IMU) data to estimate the target’s position. It is a relative localization technique that estimates the position of the target at the next moment based on the current position [11]. Thio et al. [12] proposed a gait detection method based on sine wave approximation of acceleration signals. The method provides consecutive and real-time full-step information in the form of fractions. Wu et al. [13] used a generalized likelihood ratio multi-threshold detection algorithm for gait detection, which can adaptively adjust the thresholds. It estimates the acceleration and angular velocity of the inertial sensors by great likelihood and uses the generalized likelihood to obtain the corresponding threshold ratios, thus counting the number of steps. Niu et al. [14] proposed to use the Kalman filtering algorithm combined with dynamic thresholding to determine the number of pedestrian steps. However, as the walking time increases, PDR produces a cumulative error. To solve this problem, researchers have proposed many solutions [13,15]. Zhao et al. [16] presented a three-step constrained step size estimation model based on the Weinberg model [17]. Yu et al. [18] designed an adaptive step-size estimation algorithm that changes the linear estimating equation using only one parameter to provide accurate step-size information. Huang et al. [19] utilized triple data fusion of magnetometers, accelerometers, and gyroscopes for heading angle estimation.
Acoustic localization determines the target by extracting angle and time features from the acoustic signal. The main methods of acoustic localization include Time of Arrival (TOA), Time Difference of Arrival (TDOA), and Angle of Arrival (AOA) [20]. Mandal et al. [21] proposed the Beep system for the first time to design a cell phone-compatible low-frequency-band acoustic signal. Khyzhniak et al. [22] used TDOA to process sound source signals acquired by microphones for localization in two dimensions. Urazghildiiev et al. [23] utilized maximum likelihood estimation for acoustic localization using combined AOA/TDOA estimation. Liu et al. [24] proposed combining inertial measurement units and acoustic sensor data to improve the indoor localization accuracy of smartphones. Wang et al. [25] presented a fast and accurate joint CHAN-Taylor three-bit localization algorithm. Zhu et al. [26] proposed a new low-cost, easily usable system based on the TDOA algorithm that can localize objects using only a smartphone. Zhang et al. [27] designed an asynchronous acoustic localization system based on a smartphone. The system utilizes the acoustic signals collected by the cell phone to calculate the real-time TDOA between nodes.
Under complex and changing indoor environments, a single source positioning method often fails to achieve accurate positioning [28]. Acoustic localization can be performed using existing microphones and loudspeakers with high accuracy. However, acoustic localization is subject to unexpected errors from environmental interference [27]. Wang et al. [29] designed an adaptive robust traceless Kalman filter to effectively deal with unknown system noise and observation roughness in acoustic navigation. Klee et al. [30] constructed an extended Kalman filter model to directly update sound source position estimates, providing a fundamental framework for dynamic filtering in acoustic localization. The diversity and complexity of targets’ motion make it difficult to achieve accurate positioning in dead reckoning [31,32].
To address these issues, we propose a multiple motion pattern navigation and localization method. The proposed method effectively reduces the cumulative error of dead reckoning and the outliers of acoustic localization [33]. The core contributions of this paper are summarized as follows:
PCA-GWO-KELM motion pattern recognition: We propose the Principal Component Analysis and Gray Wolf Optimization with Kernel Extreme Learning Machine (PCA-GWO-KELM) motion mode recognition method. The PCA-GWO-KELM method can extract effective features from 30 motion features of original data and infer the importance of each feature in the motion posture from the effective features, thus estimating the motion mode with higher accuracy. This proposed method can effectively solve the inaccurate positioning caused by motion patterns.
Dynamic adaptive double threshold gait detection: A double dynamic adaptive threshold method for peaks and valleys detection is proposed. This method constructs an adaptive acceleration upper threshold and an adaptive dynamic time threshold. Both thresholds can be adjusted according to different motion states, effectively filtering out numerous pseudo peaks. As a result, it enhances the accuracy of gait detection and reduces the cumulative error in localization.
Robust motion posture recognition fusion localization: A multiple-motion-mode recognition fusion localization system is proposed. Particle filtering is used to achieve acoustic and IMU positioning to solve the challenges of different motion modes and low positioning accuracy. It can achieve accurate positioning of different motion postures. Localization performance is improved in different scenarios and motion modes.
The remainder of this paper is structured as follows: Section 2 provides an overview of related works. Section 3 introduces the proposed methodology in detail. Section 4 presents the experimental results for the proposed method. Finally, Section 5 states the conclusion of this article.

2. Related Works

In recent years, researchers have conducted extensive research on the recognition of various movement states. Luo et al. [34] designed a deep learning model-assisted PDR algorithm using a combined model of a trained convolutional neural network and a long-short-term machine (CNN-LSTM) neural network to identify complex movement patterns of pedestrians. Zhang et al. [35] used Wavelet-CNN to process microelectromechanical system (MEMS) sensor data and identify multiple complex human activities. Chen et al. [36] employed the K-Nearest Neighbor (KNN) algorithm to recognize motion states, including going up stairs, going downstairs, and walking horizontally. Experimental results show that KNN achieves more than a 95% recognition rate for all three states. Khalili et al. [37] presented a Support Vector Machine (SVM) and the Decision Tree (DT) combined classification algorithm to identify different movement patterns and walking speeds, with an accuracy of 97.03% and 97.67% for females and males, respectively. Although these classification models can all be used to recognize different motion patterns, their recognition accuracy mainly depends on the applicability of the motion features. To obtain high recognition accuracy, we must consider the extraction and selection of features. Gu et al. [38] proposed a deep learning method based on stacked denoising self-encoders. The method can automatically extract the data features, which facilitates the recognition of different motion patterns related to indoor positioning and reduces the workload of designing and selecting motion features. Klein et al. [39] designed a new Gradient Boosting (GB) classifier for feature selection. The 111 features used in the classification problem were evaluated, and 12 significant features were extracted to recognize and classify four cell phone postures.
It is common to use multi-information fusion positioning techniques to obtain positioning results with higher positioning accuracy and robustness. Guo et al. [40] proposed a low-cost, two-step signal detection, data-driven PDR localization algorithm and utilized an acoustic measurement compensation method to improve localization performance. Song et al. [41] combined acoustic localization without infrastructure with PDR and validated the plausibility of the PDR results through acoustic constraints. Wang et al. [42] introduced a fusion localization system for large-area scenes. To eliminate the cumulative error of PDR, the system utilizes a Hamming distance-based acoustic localization algorithm to assist PDR with position updating. Wei et al. [43] presented an efficient closed-loop mechanism based on WIFI and PDR, which can achieve sub-meter localization accuracy. Wu et al. [44] designed a magnetic field matching and PDR based localization accuracy enhancement method with strong robustness. Naheem et al. [45] introduced an indoor pedestrian tracking system with UWB and PDR fusion. This system not only reduces the cumulative error of PDR but also decreases the influence of UWB by indoor non-visual distance. Jin et al. [46] utilized particle filtering (PF) combined with low-power Bluetooth and PDR for fusion localization. The method reduces the cumulative error of PDR and the fluctuation of BLE received signal strength to provide more stable and accurate localization results. Wu et al. [47] proposed a novel indoor localization method fusing RFID, PDR, and geomagnetism.
Inspired by existing research efforts, we propose a method for improved dead reckoning based on motion pattern recognition, fused with CHAN-Taylor acoustic localization (MPR-IPDR-CT). The method uses the pedestrian’s motion states as a priori conditions for the dead reckoning positioning process to improve the positioning reliability. Then, gait detection is performed according to the multi-pattern recognition results, which effectively improves the positioning accuracy. Finally, fine estimates are obtained by fusing the acoustic estimates.

3. Materials and Methodology

An overview of the robust motion posture recognition localization method is introduced in Section 3.1. Section 3.2 describes the PCA-GWO-KELM model. Double dynamic adaptive threshold gait detection is discussed in Section 3.3. Section 3.4 depicts an adaptive step length estimation model. A method for heading estimation is introduced in Section 3.5. Finally, a robust motion posture recognition localization system is demonstrated in Section 3.6.

3.1. Overview

In this section, we introduce the localization and navigation method of double threshold gait detection and multi-pattern recognition, which includes the PCA-GWO-KELM motion pattern recognition model, double dynamic adaptive threshold gait detection, acoustic estimation, and motion posture recognition localization. The overall localization and navigation framework is shown in Figure 1.
The PCA-GWO-KELM motion pattern recognition method extracts important features from 30 motion features of the raw data and infers the importance of each feature in the motion model to determine the motion state of the target. A dual adaptive threshold-based gait detection method is proposed to realize the step number of the moving target. In acoustic estimation, a smartphone is used to receive acoustic signals. Two weighted least squares are used to achieve the location of the target. Finally, MPR-IPDR and acoustic estimation are fused by particle filtering.

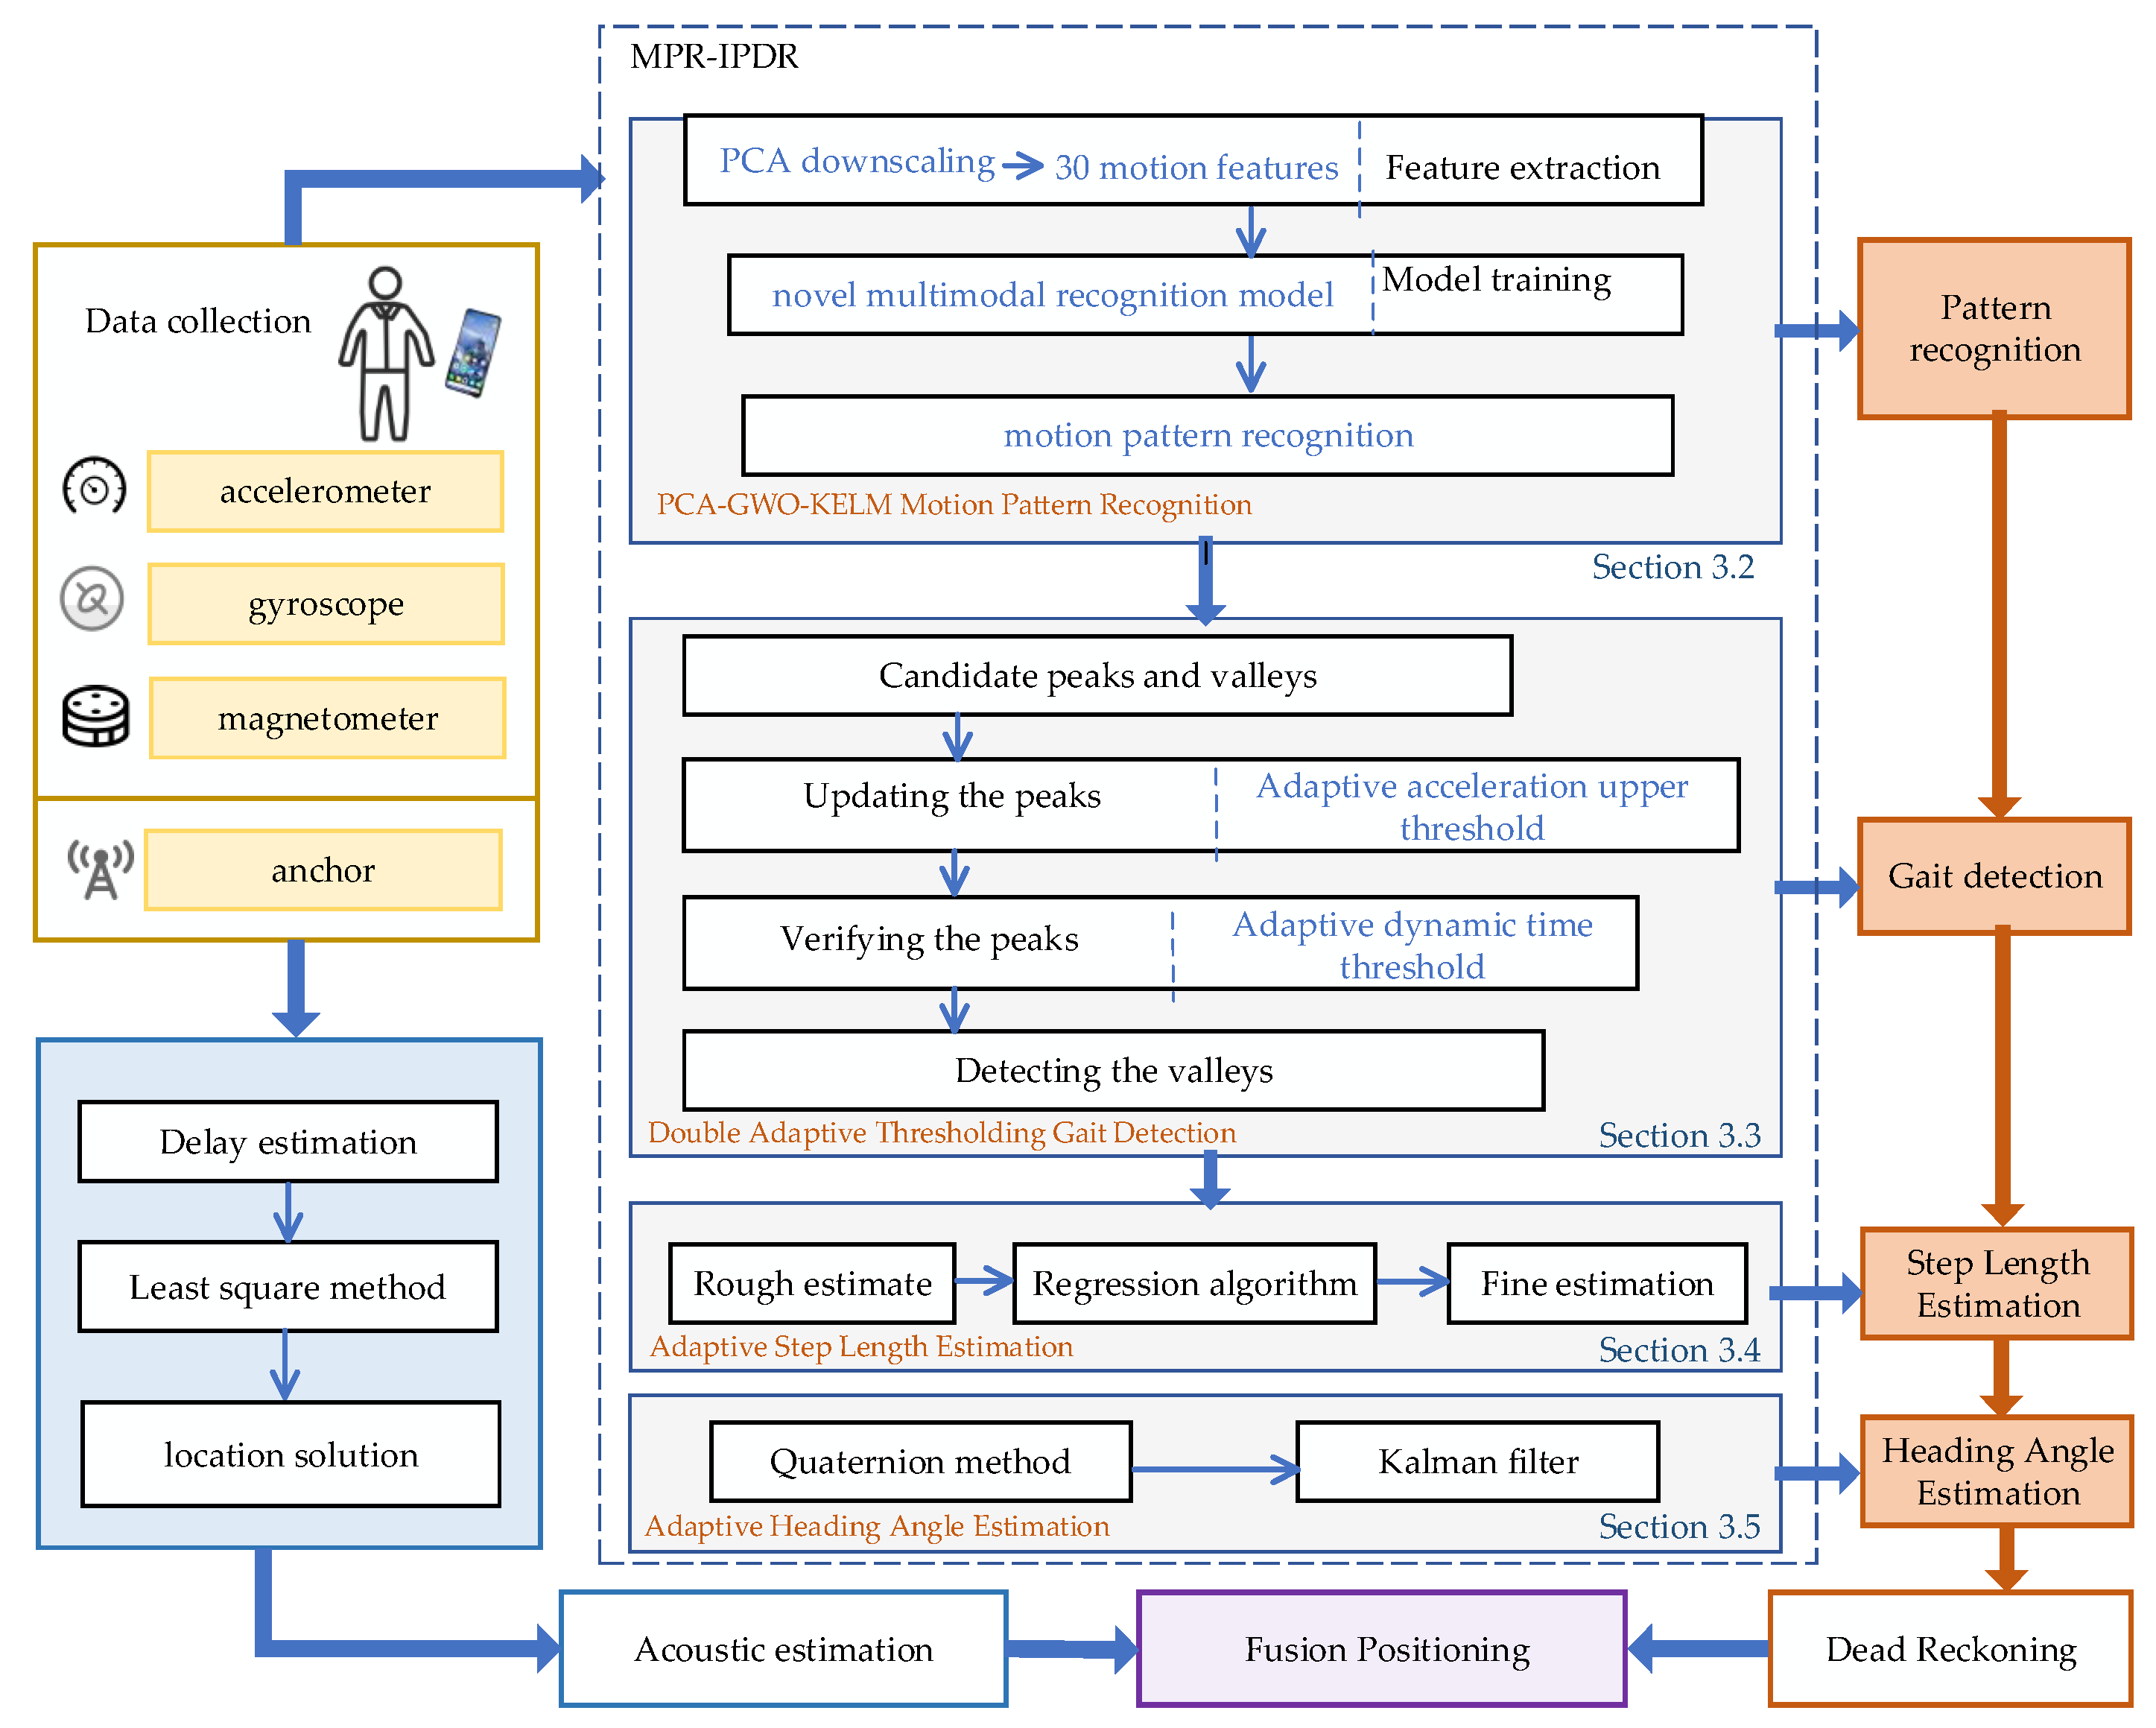
3.2. PCA-GWO-KELM Motion Pattern Recognition

The motion characteristics are extremely related to the complex and diverse target motion postures [
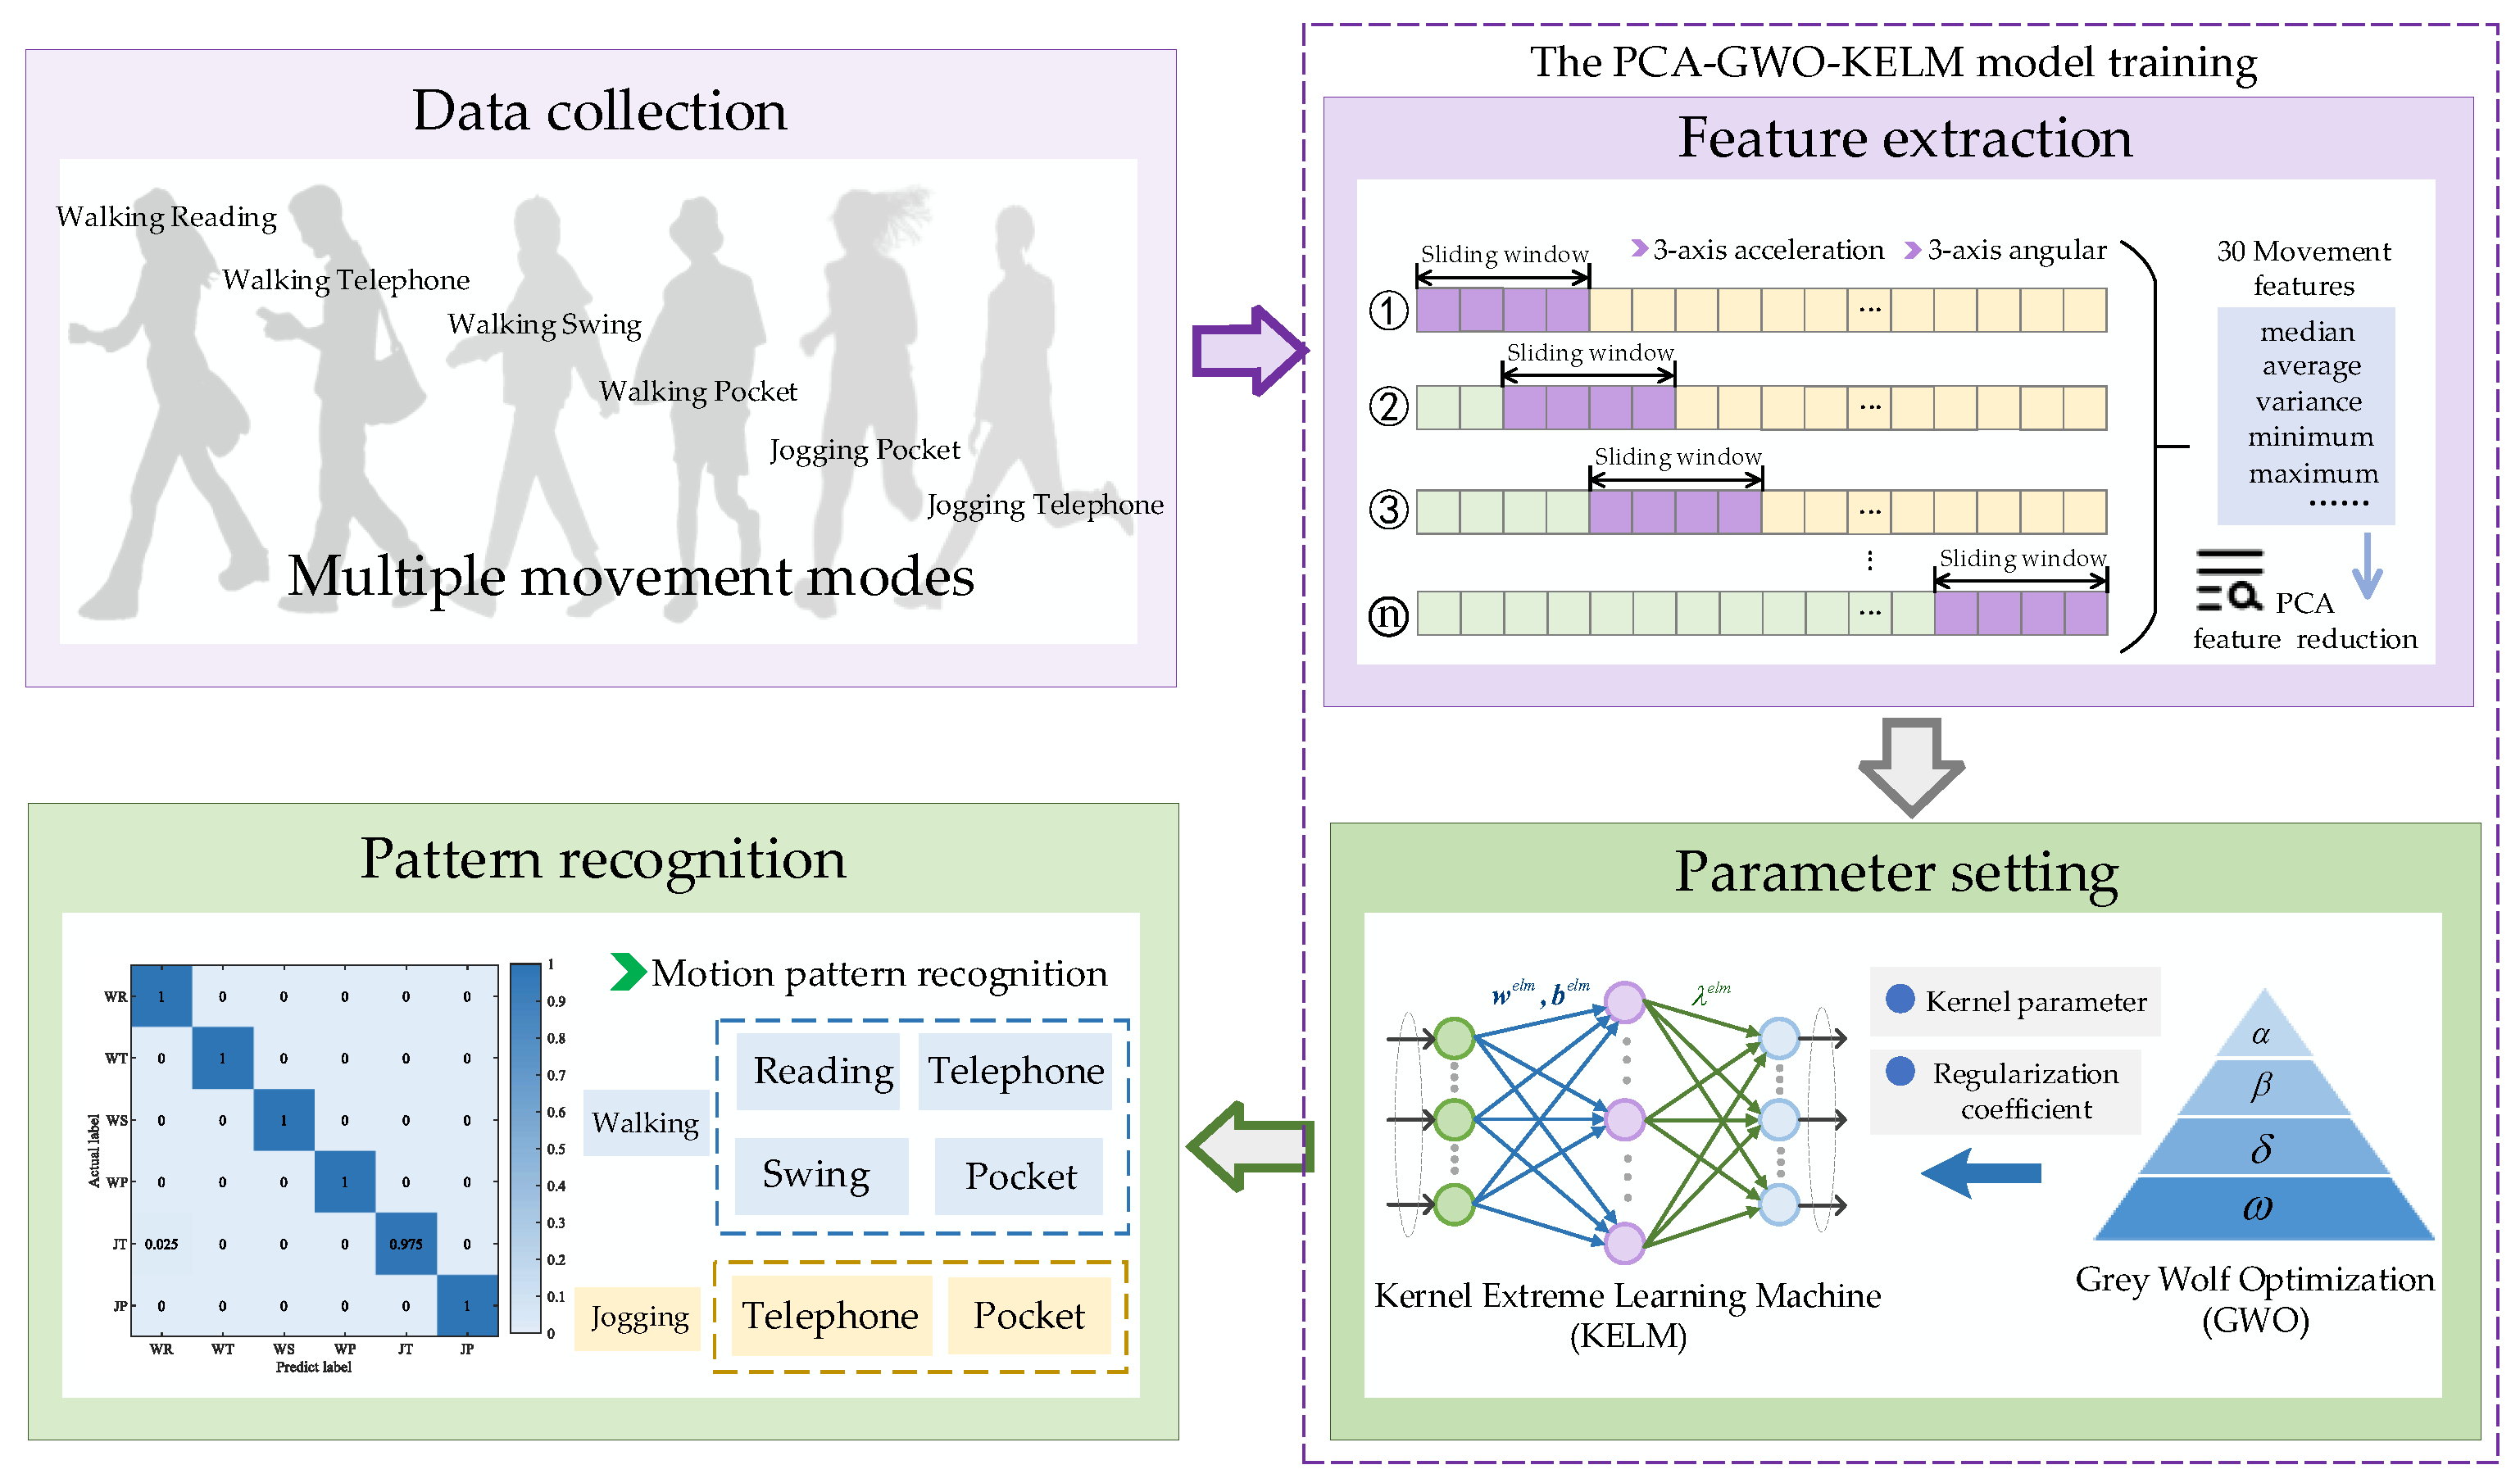
48]. Therefore, how to accurately obtain the target motion characteristics plays a key role in navigation and positioning. The PCA-GWO-KELM motion posture recognition model is proposed in Figure 2. It mainly includes three stages: data acquisition, feature extraction, and motion mode recognition.
There are differences in acceleration and angular velocity for different motion states during the motion process. This article focuses on collecting three-dimensional motion acceleration and angular velocity data.
Firstly, the original data from accelerators and gyroscopes need to be standardized, which can ensure that all variables have a mean of 0 and a standard deviation of 1, putting them on an equal scale and eliminating the influence of different units. Different features have different importance for motion posture. Sixty-dimensional motion features, including mean, variance, maximum, minimum, energy values, etc., will be obtained from the standardized original accelerators and gyroscope data, which are denoted as x . In this paper, we set a data length of 2 s as the sliding window length, and the length of each step is 0.5 s, which results in a 50% data overlap. When the acceleration or angular velocity modulus sequence meets the requirements, the sequence is intercepted, after which the specified window length is slid backward. Repeat the above steps in this way to segment the IMU data to obtain more sample data.
The variable x j ( j = 1 , 2 , ) needs to be standardized by the formula
x i j * = x i j μ j σ j
where x i j is the i -th sample of the j -th variable, μ j is the mean of each variable x j , and σ j is the standard deviation.
The covariance matrix C of the standardized data is calculated. The element c i j of the covariance matrix C is given by
c i j = 1 n 1 k = 1 n x k i * x k j *
where c i i is the variance of the i -th variable, and c i i ( i j ) is the covariance between the i -th and j -th variables. And k is the number of principal components selected.
The next step is to find the eigenvalues λ 1 λ 2 λ p and corresponding eigenvectors e 1 , e 2 , , e p of the covariance matrix C .
This is accomplished by solving the following equation:
C e i = λ i e i i = 1 , 2 , , p
The eigenvalues represent the amount of variance explained by the corresponding principal components, and the eigenvectors define the directions of the principal components in the original variable space. Each eigenvector is normalized to have a length of 1, that is, e i = 1 . p is the number of variables in the original dataset, and subsequent operations such as calculating the covariance matrix are centered around these p variables.
The principal components are ranked according to the magnitudes of their corresponding eigenvalues. Usually, only the first k principal components ( k < p ) are selected, where k is determined based on the amount of variance explained. A common criterion is to choose k such that the cumulative proportion of variance explained by the first k principal component P C i is given by
P C i = j = 1 p e i j x j *
where e i j is the j -th element of the i -th eigenvector e i .
The original data are projected onto the selected principal components. For each sample x i = ( x i 1 , x i 2 , , x i p ) , its projection onto the k -dimensional principal component space is expressed as x i d a t a = ( x i 1 , x i 2 , , x i k ) , where x i j = l = 1 p e j l x i l * for j = 1 , 2 , , k .
This projection transforms the original high-dimensional data into a low-dimensional space, retaining the most important information of the original data. Subsequently, the reduced dimensional motion features are used as the input for PCA-GWO-KELM as the motion postures. In this paper, the input layer dimension of the PCA-GWO-KELM algorithm is the number of features after PCA dimensionality reduction and is set to 10. The hidden layer dimension is 60 and the output layer dimension is 6.
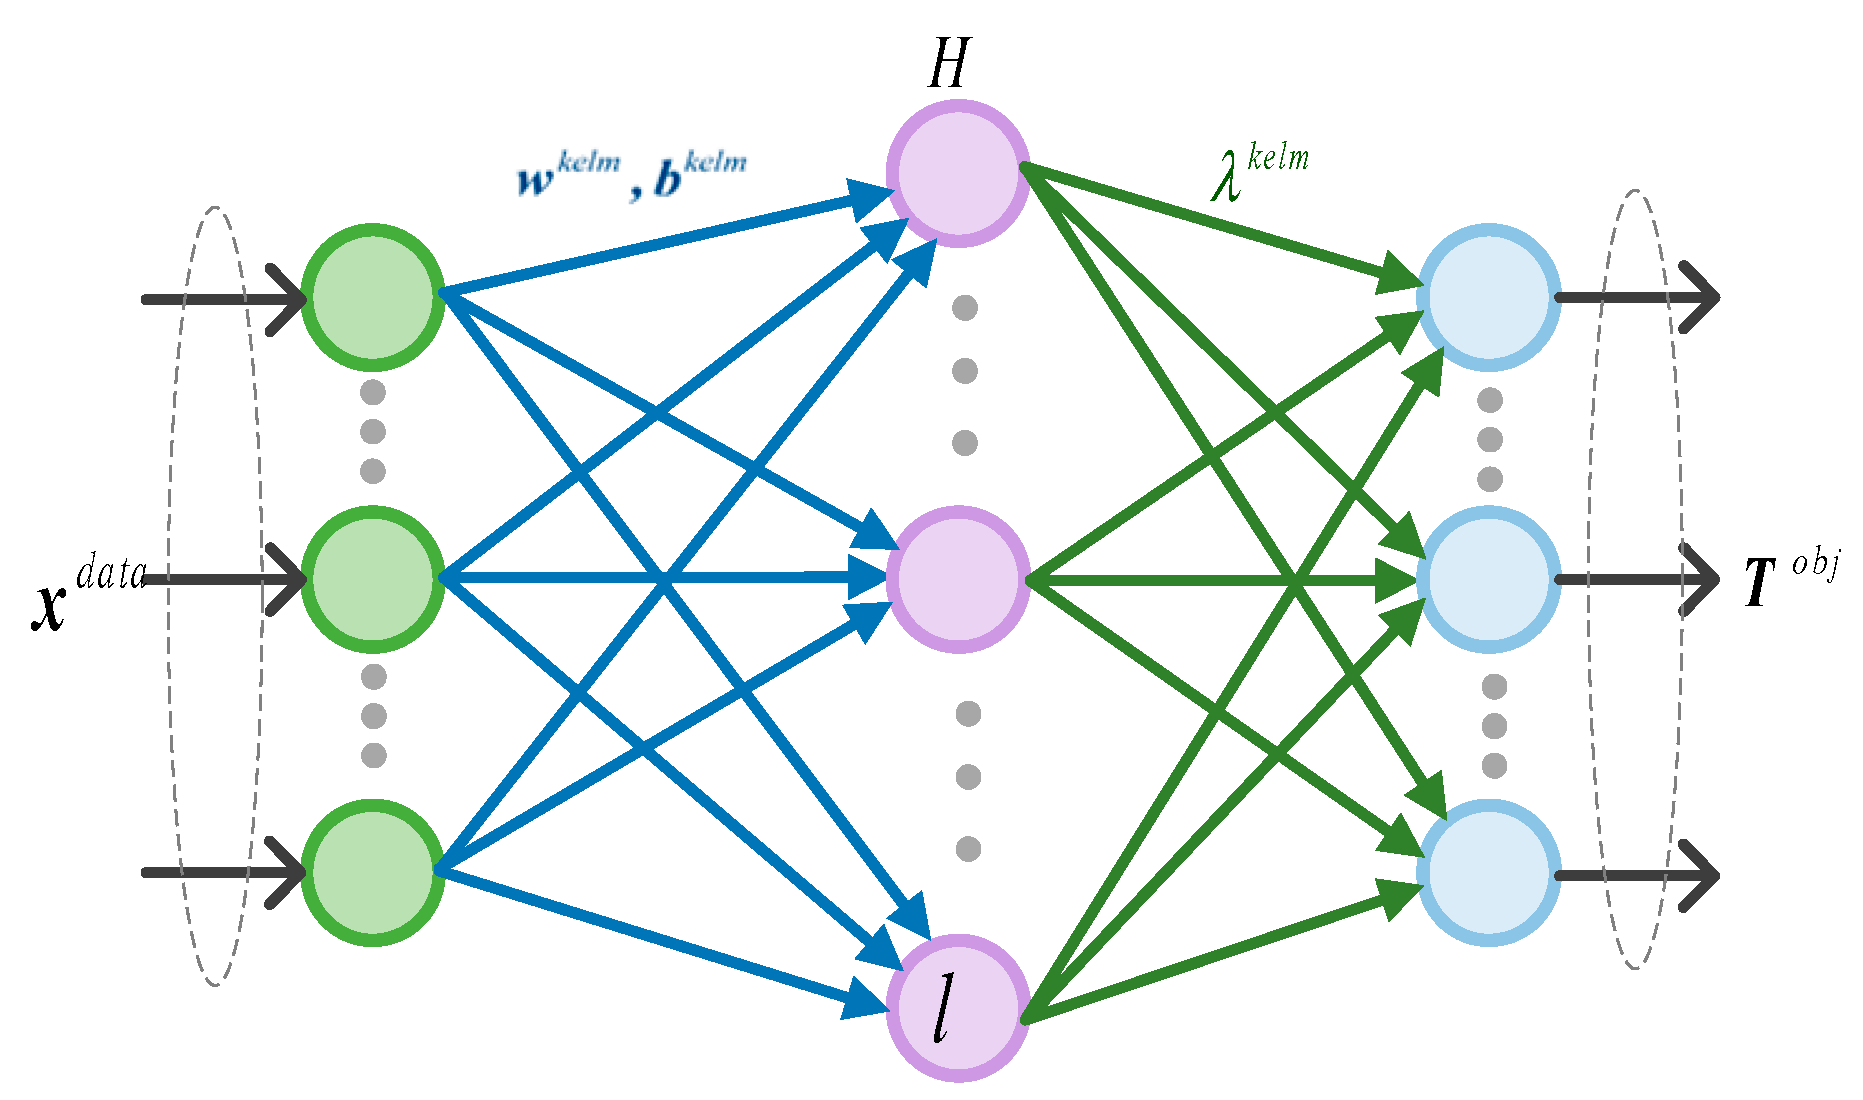
Figure 3 shows kernel extreme learning machine model. Suppose the input dataset x d a t a is represented as follows:
x d a t a = x 11 d a t a x 12 d a t a x 1 n d a t a x 21 d a t a x 22 d a t a x 2 n d a t a x s 1 d a t a x s 2 d a t a x s n d a t a s × n
The output of the hidden layer H is expressed as
H = h ( x 1 ) h ( x 2 ) h ( x n ) = i = 1 s g ( w 1 i k e l m x i 1 d a t a + b 1 k e l m ) i = 1 s g ( w 1 i k e l m x i 2 d a t a + b 1 k e l m ) i = 1 s g ( w 1 i k e l m x i n d a t a + b 1 k e l m ) i = 1 s g ( w 2 i k e l m x i 1 d a t a + b 2 k e l m ) i = 1 s g ( w 2 i k e l m x i 2 d a t a + b 2 k e l m ) i = 1 s g ( w 2 i k e l m x i n d a t a + b 2 k e l m ) i = 1 s g ( w l i k e l m x i 1 d a t a + b l k e l m ) i = 1 s g ( w l i k e l m x i 2 d a t a + b l k e l m ) i = 1 s g ( w l i k e l m x i n d a t a + b l k e l m ) l × n
where g ( · ) represents the activation function of the hidden layer node. w k e l m , b k e l m are the weight vectors and thresholds connecting the implicit and input layers, respectively, which can be expressed as
w k e l m = w 11 k e l m w 12 k e l m w 1 s k e l m w 21 k e l m w 22 k e l m w 2 s k e l m w l1 k e l m w l2 k e l m w l s k e l m l × s
b k e l m = b 1 kelm b 2 kelm b l kelm l × 1 T
where l denotes the number of nodes in the hidden layer and s denotes the number of nodes in the input layer.
We design a loss function L o s s k e l m . Assuming the target matrix of the training data is denoted by T o b j , and the output of the KELM model can be represented by O k e l m , the loss function L o s s k e l m is expressed as follows:
L o s s k e l m ( λ k l e m ) = O k e l m T o b j 2 = H λ k l e m T o b j 2
where T o b j is the target matrix of the training data, O k e l m is the predict output, and λ k e l m is the connection weight value between the hidden layer and the output layer.
To prevent model overfitting and ensure matrix inverse stability, regularization coefficients C are added to optimize connection weight λ k e l m . The update loss function L o s s k e l m is as follows:
L o s s k e l m ( λ k e l m ) = 1 2 H λ k e l m T o b j 2 2 + 1 2 C λ k e l m 2 2
where 1 2 C λ k e l m 2 2 is the L2 regularization penalty.
To achieve the optimization predicted value, it become the optimization question for searching the minimum loss function L o s s k e l m ( λ k e l m ) .
Expanding Equation (10), we obtain
L o s s k e l m ( λ k e l m ) = 1 2 ( H λ k e l m T o b j ) T ( H λ k e l m T o b j ) + 1 2 C ( λ k e l m ) T λ k e l m
Differentiating Equation (11),
L o s s k e l m ( λ k e l m ) λ k e l m = H T ( H λ k e l m T o b j ) + 1 2 C λ k e l m
The optimization value of Equation (12) is achieved as below:
λ opt kelm = H T ( H T H + I C ) 1 T o b j
Then, the output of KELM is shown as follows:
O k e l m = H λ k e l m = H H T H T H + I C 1 T o b j = K ( x , x 1 ) K ( x , x n ) n × 1 T Ω k e l m + I C 1 T o b j
where Ω k e l m is the kernel function in the KELM model, which is expressed as
Ω k e l m = H H T = h ( x i ) h ( x j ) = K ( x i , x j )
From Equation (14), the kernel function parameters Ω k e l m and regularization coefficients C are the key factors affecting the prediction performance. The gray wolf optimization (GWO) method is used to optimize the two parameters due to its effectiveness and strong global search ability.
Firstly, a population of N gray wolves is randomly initialized within the search space. The position of each wolf i is initialized as follows:
x i j = x jmin + r 1 ( x jmax x jmin )
where x jmin and x jmax are the lower and upper bounds of the j-th variable, respectively, and r 1 is a random number uniformly distributed in the range [0, 1].
Each wolf has the individual fitness function and can be expressed as
R M S E k e l m = 1 N n = 1 N n O i k e l m ϕ ( x i data , P i ( Ω k e l m , C ) ) 2 2
where N denotes the number of training samples, and ϕ ( x i data , p i ) is the predicted value of the model containing x i data and p i .
The gray wolf algorithm is set with a population size of 50 and a maximum number of iterations of 60. The lower boundary of the wolf pack search space is 1, and the upper boundary is 20. Gray wolves encircle their prey during the hunting process. This behavior is modeled by updating the position of each wolf towards the prey. Wolves α w o l f , β w o l f , δ w o l f , and wolf ω w o l f are identified. Individual gray wolves are positionally updated as follows:
D α = R 1 W α ( μ ) W ( μ ) D β = R 2 W β ( μ ) W ( μ ) D δ = R 3 W δ ( μ ) W ( μ )
where D α , D β , and D δ denote the distances between α w o l f , β w o l f , and δ w o l f with the target solution, respectively. W α ( μ ) , W β ( μ ) , and W δ ( μ ) denote the positions of α w o l f , β w o l f , and δ w o l f at the μ th iteration. W ( μ ) denotes the specific position of the current target solution.
Then, the three new candidate positions W 1 w o l f , W 2 w o l f , and W 3 w o l f for each wolf based on the position of wolves α w o l f , β w o l f , and δ w o l f is calculated as below:
W 1 w o l f = W α ( μ ) S 1 × D α W 2 w o l f = W β ( μ ) S 2 × D β W 3 w o l f = W δ ( μ ) S 3 × D δ
where S 1 , S 2 , and S 3 are coefficient vectors.
Finally, the new position of the wolf at the nest iteration is updated as the average of the three candidate positions:
W ( μ + 1 ) = W 1 + W 2 + W 3 3
When the search approaches the end, this makes the wolves approach the optimal solution more accurately. This position represents kernel function parameters Ω k e l m and regularization coefficients C of the optimized KELM.
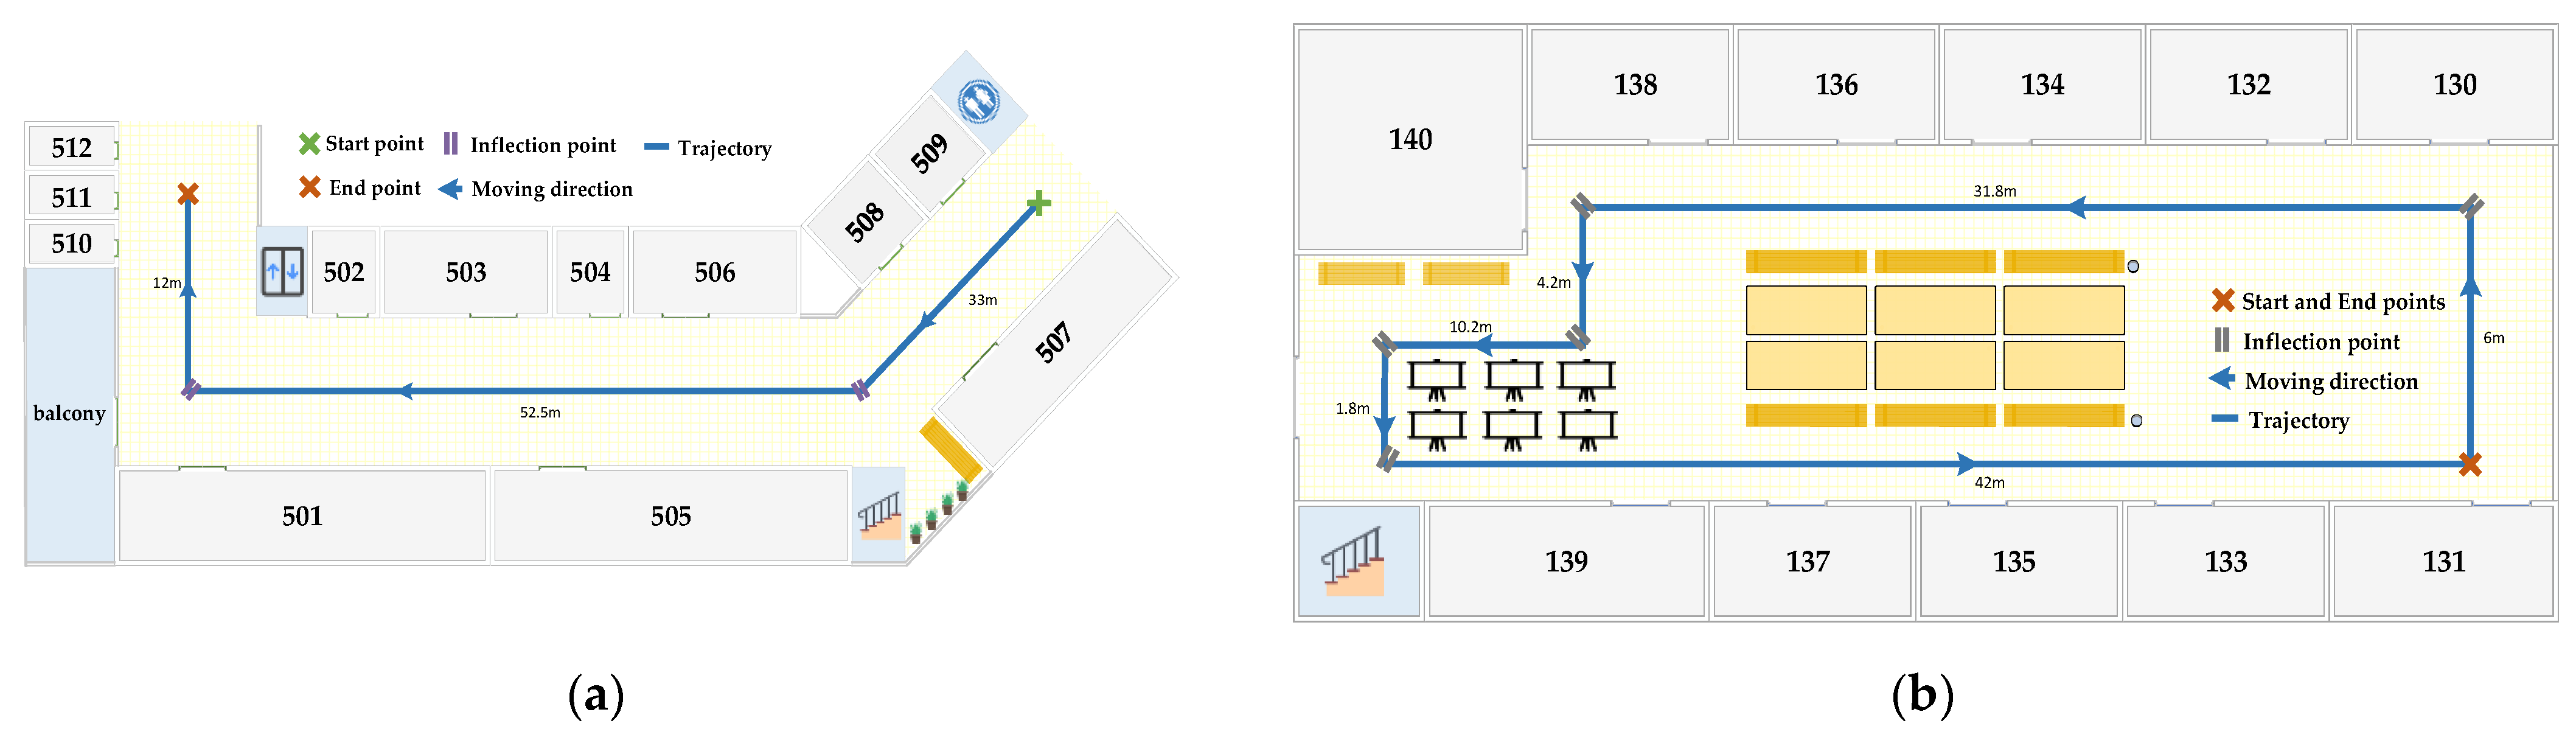
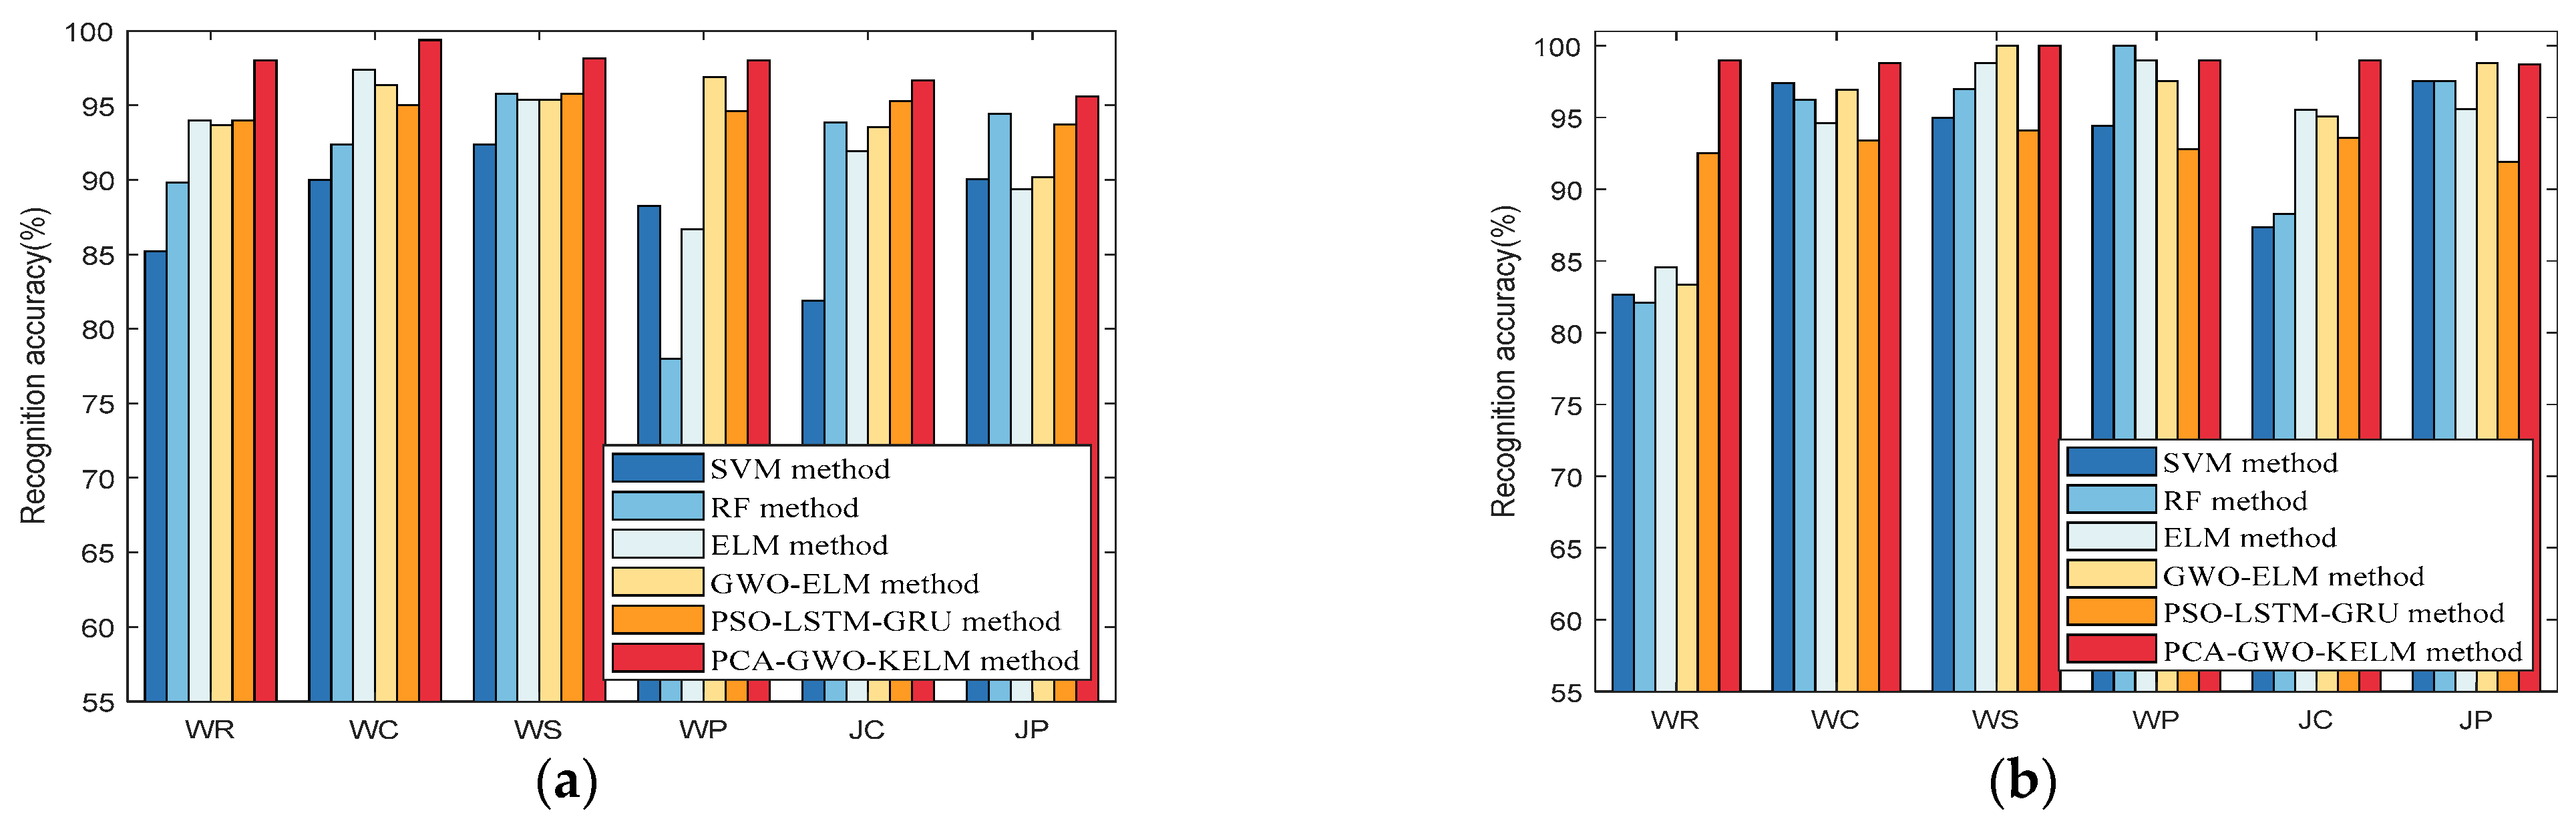
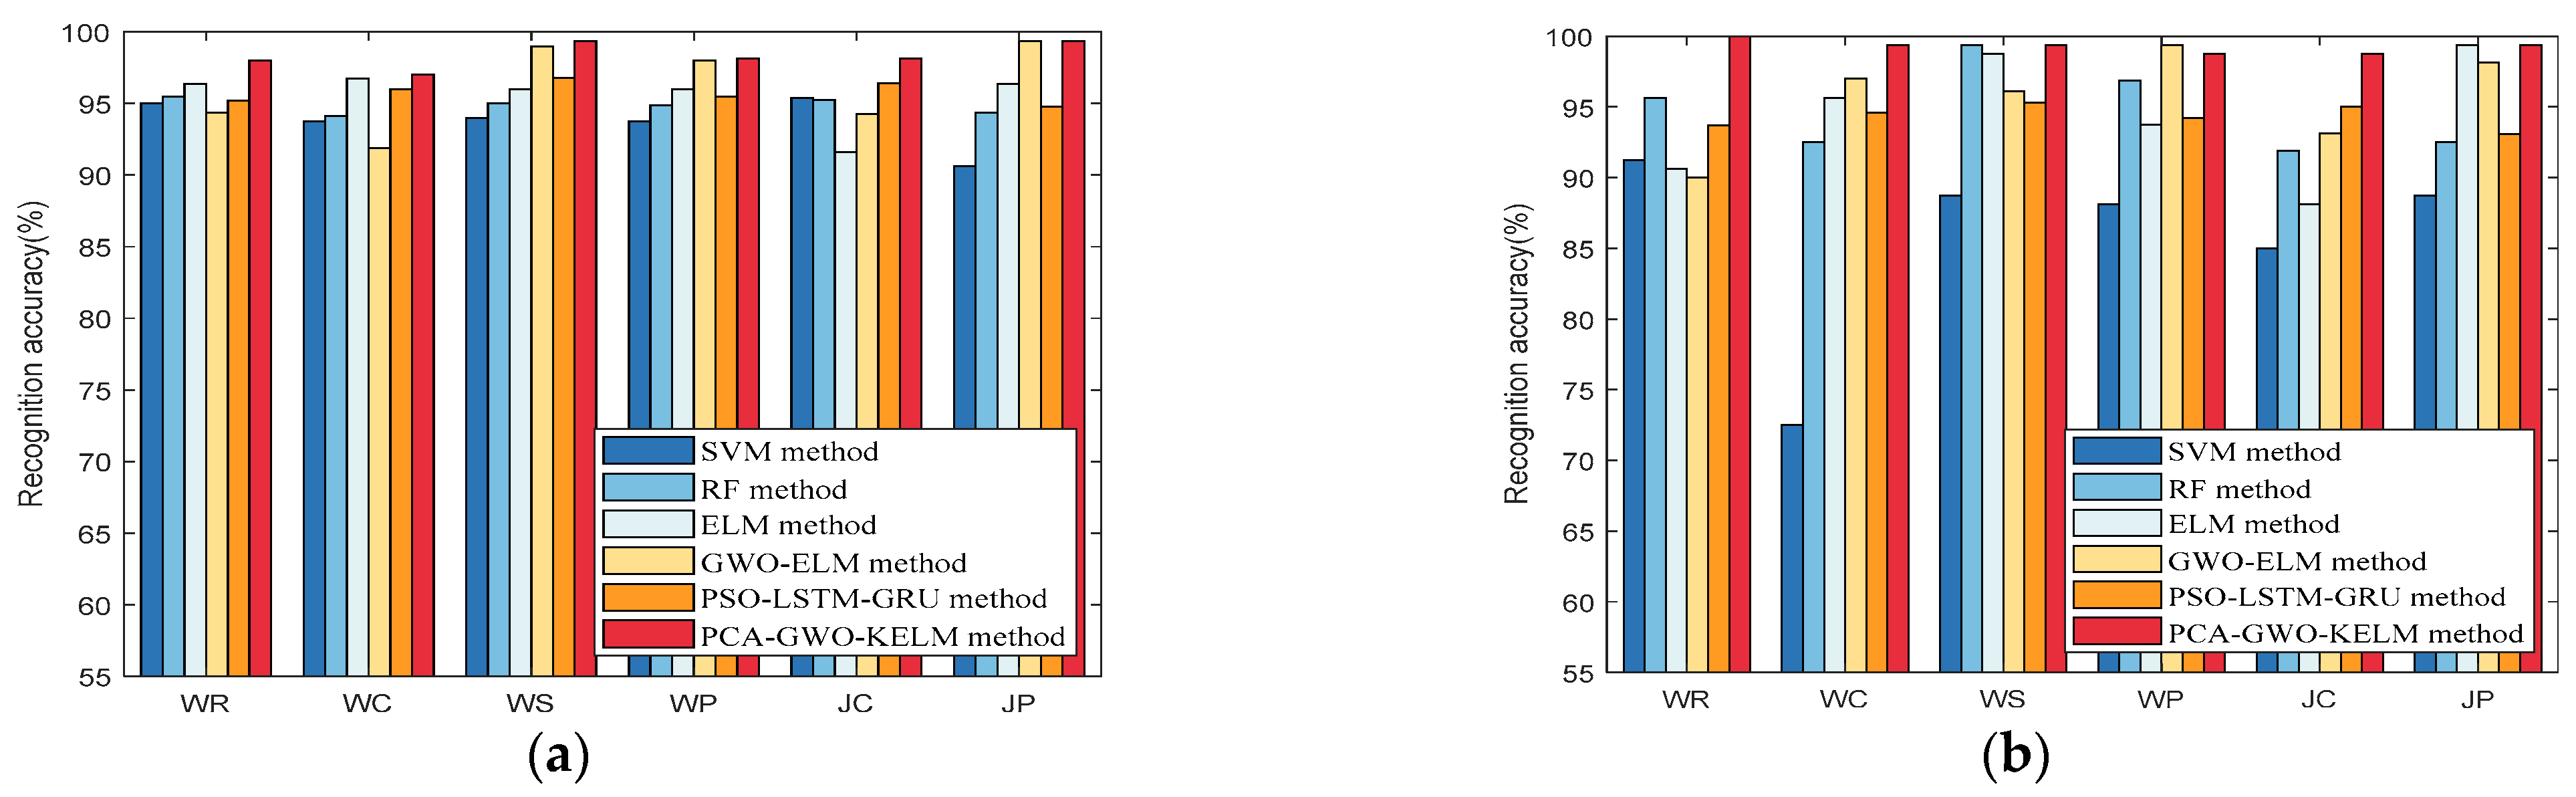
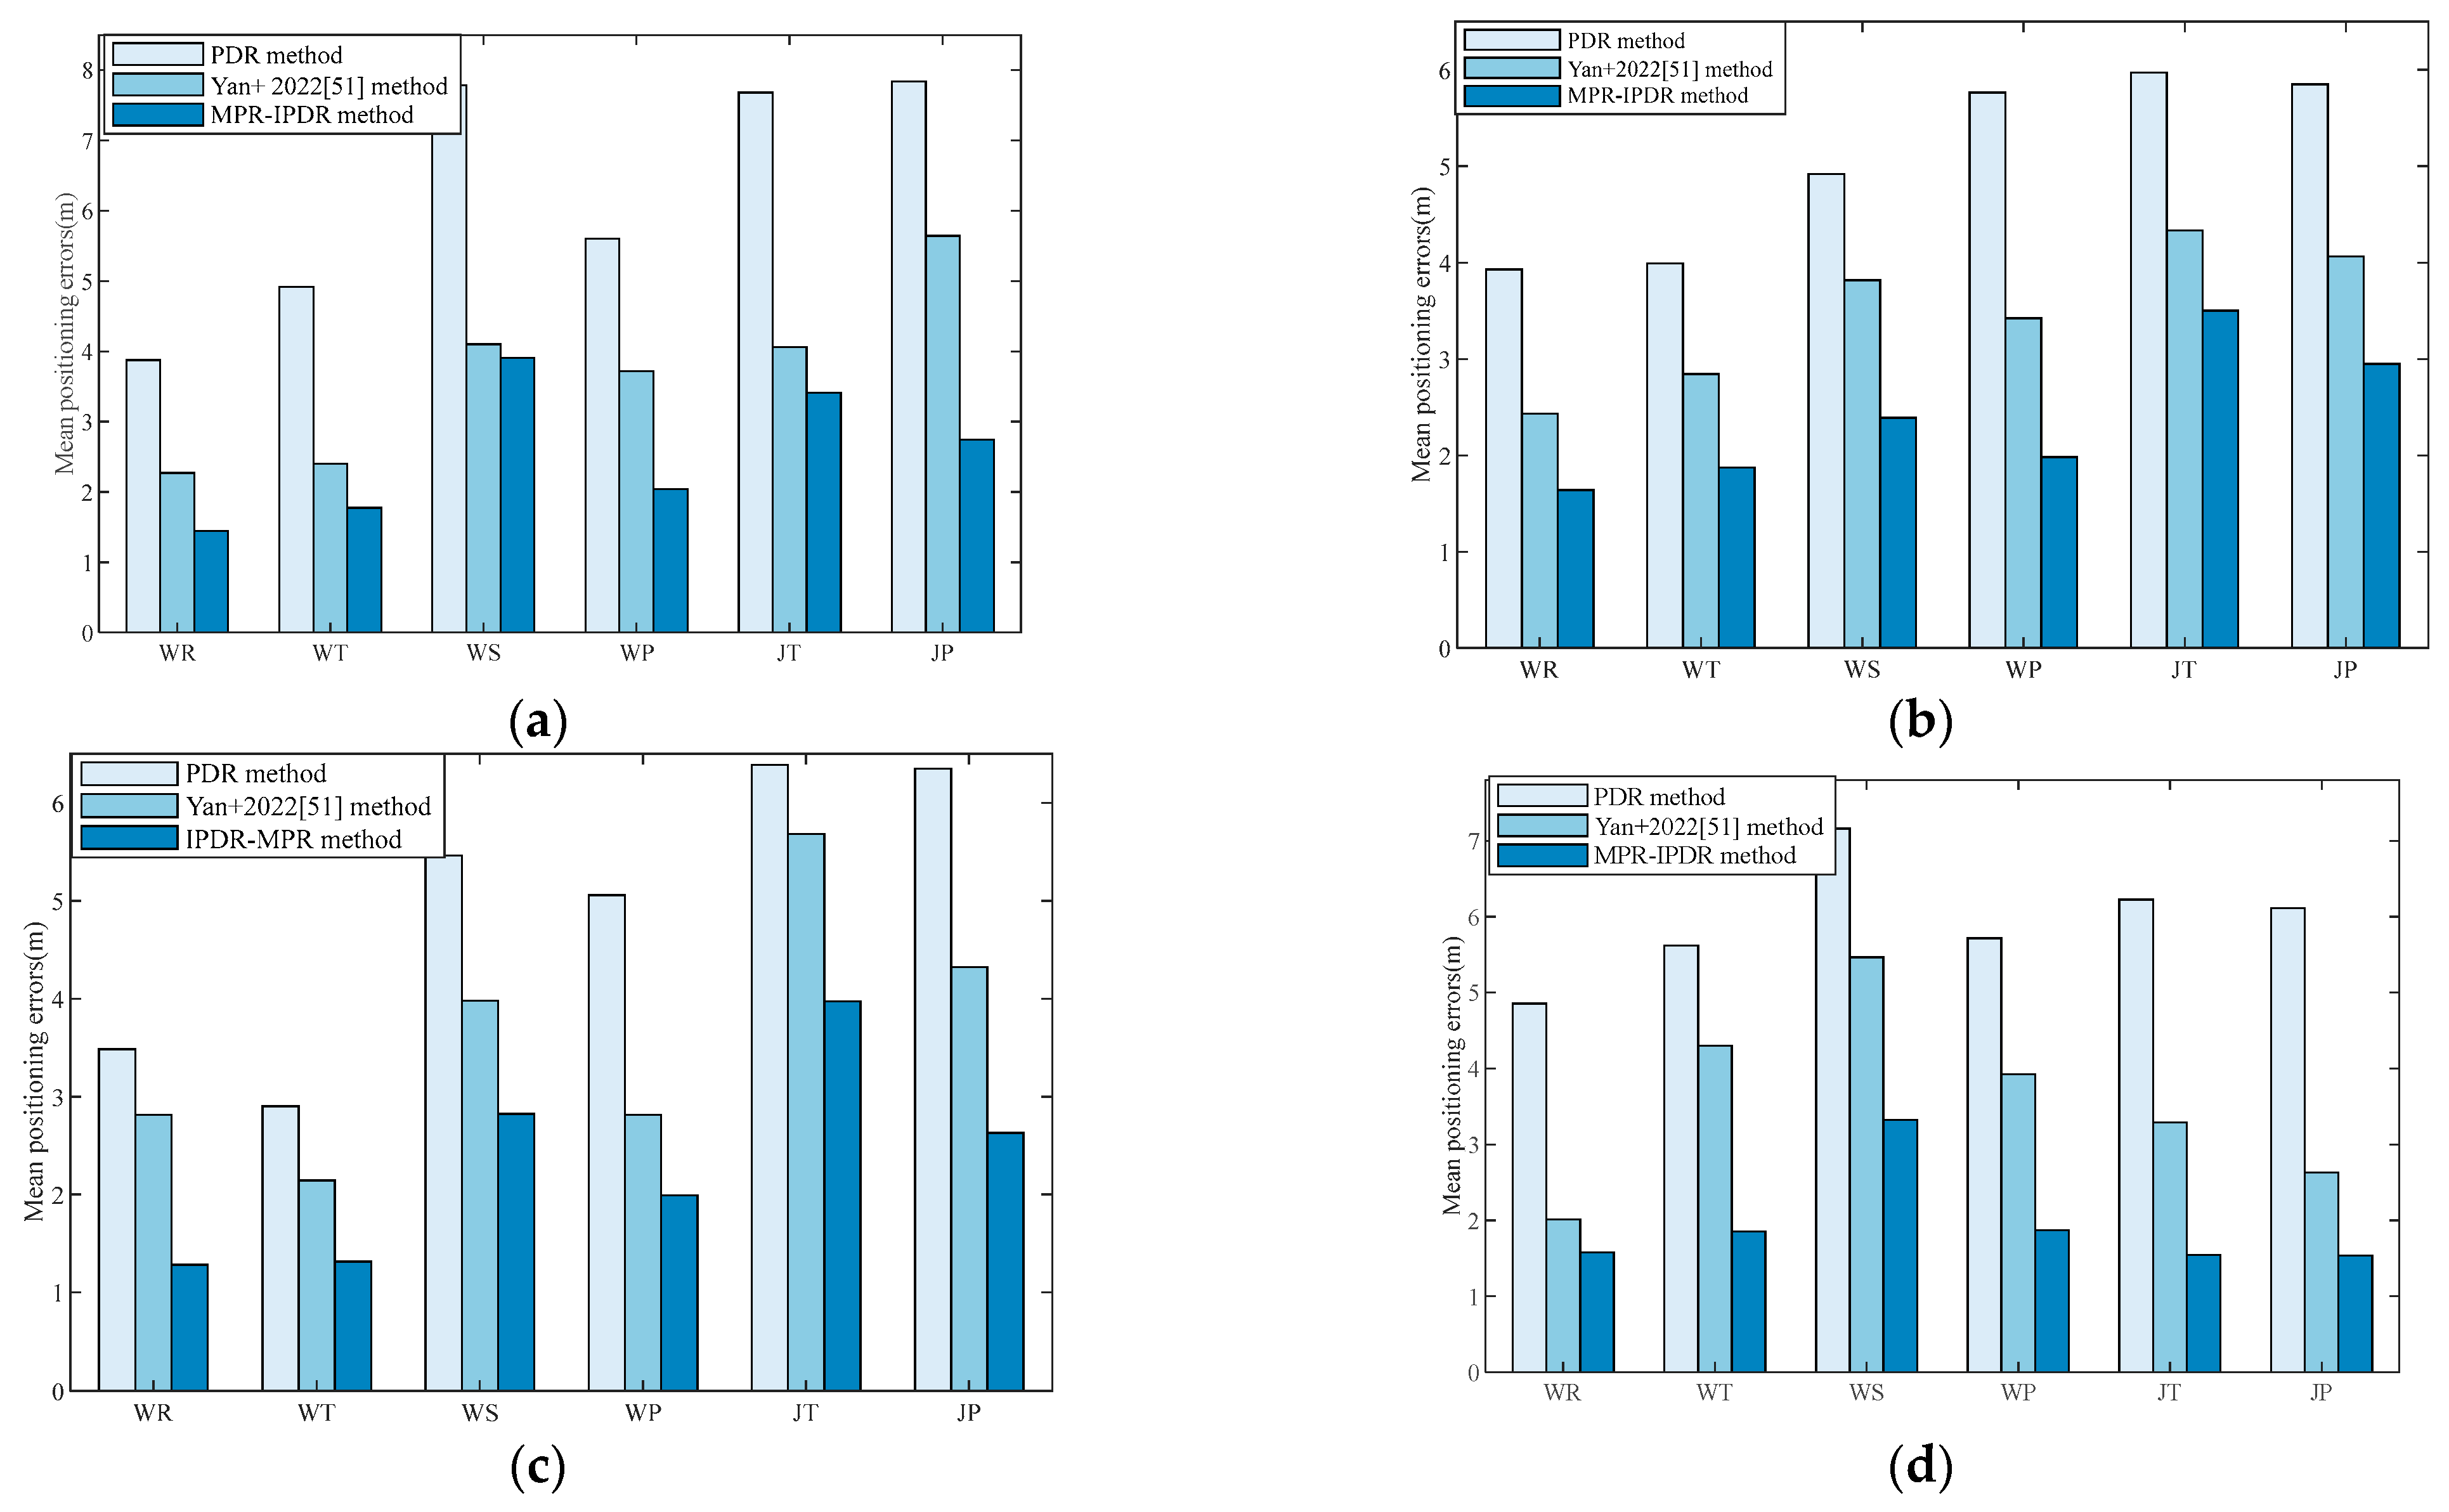
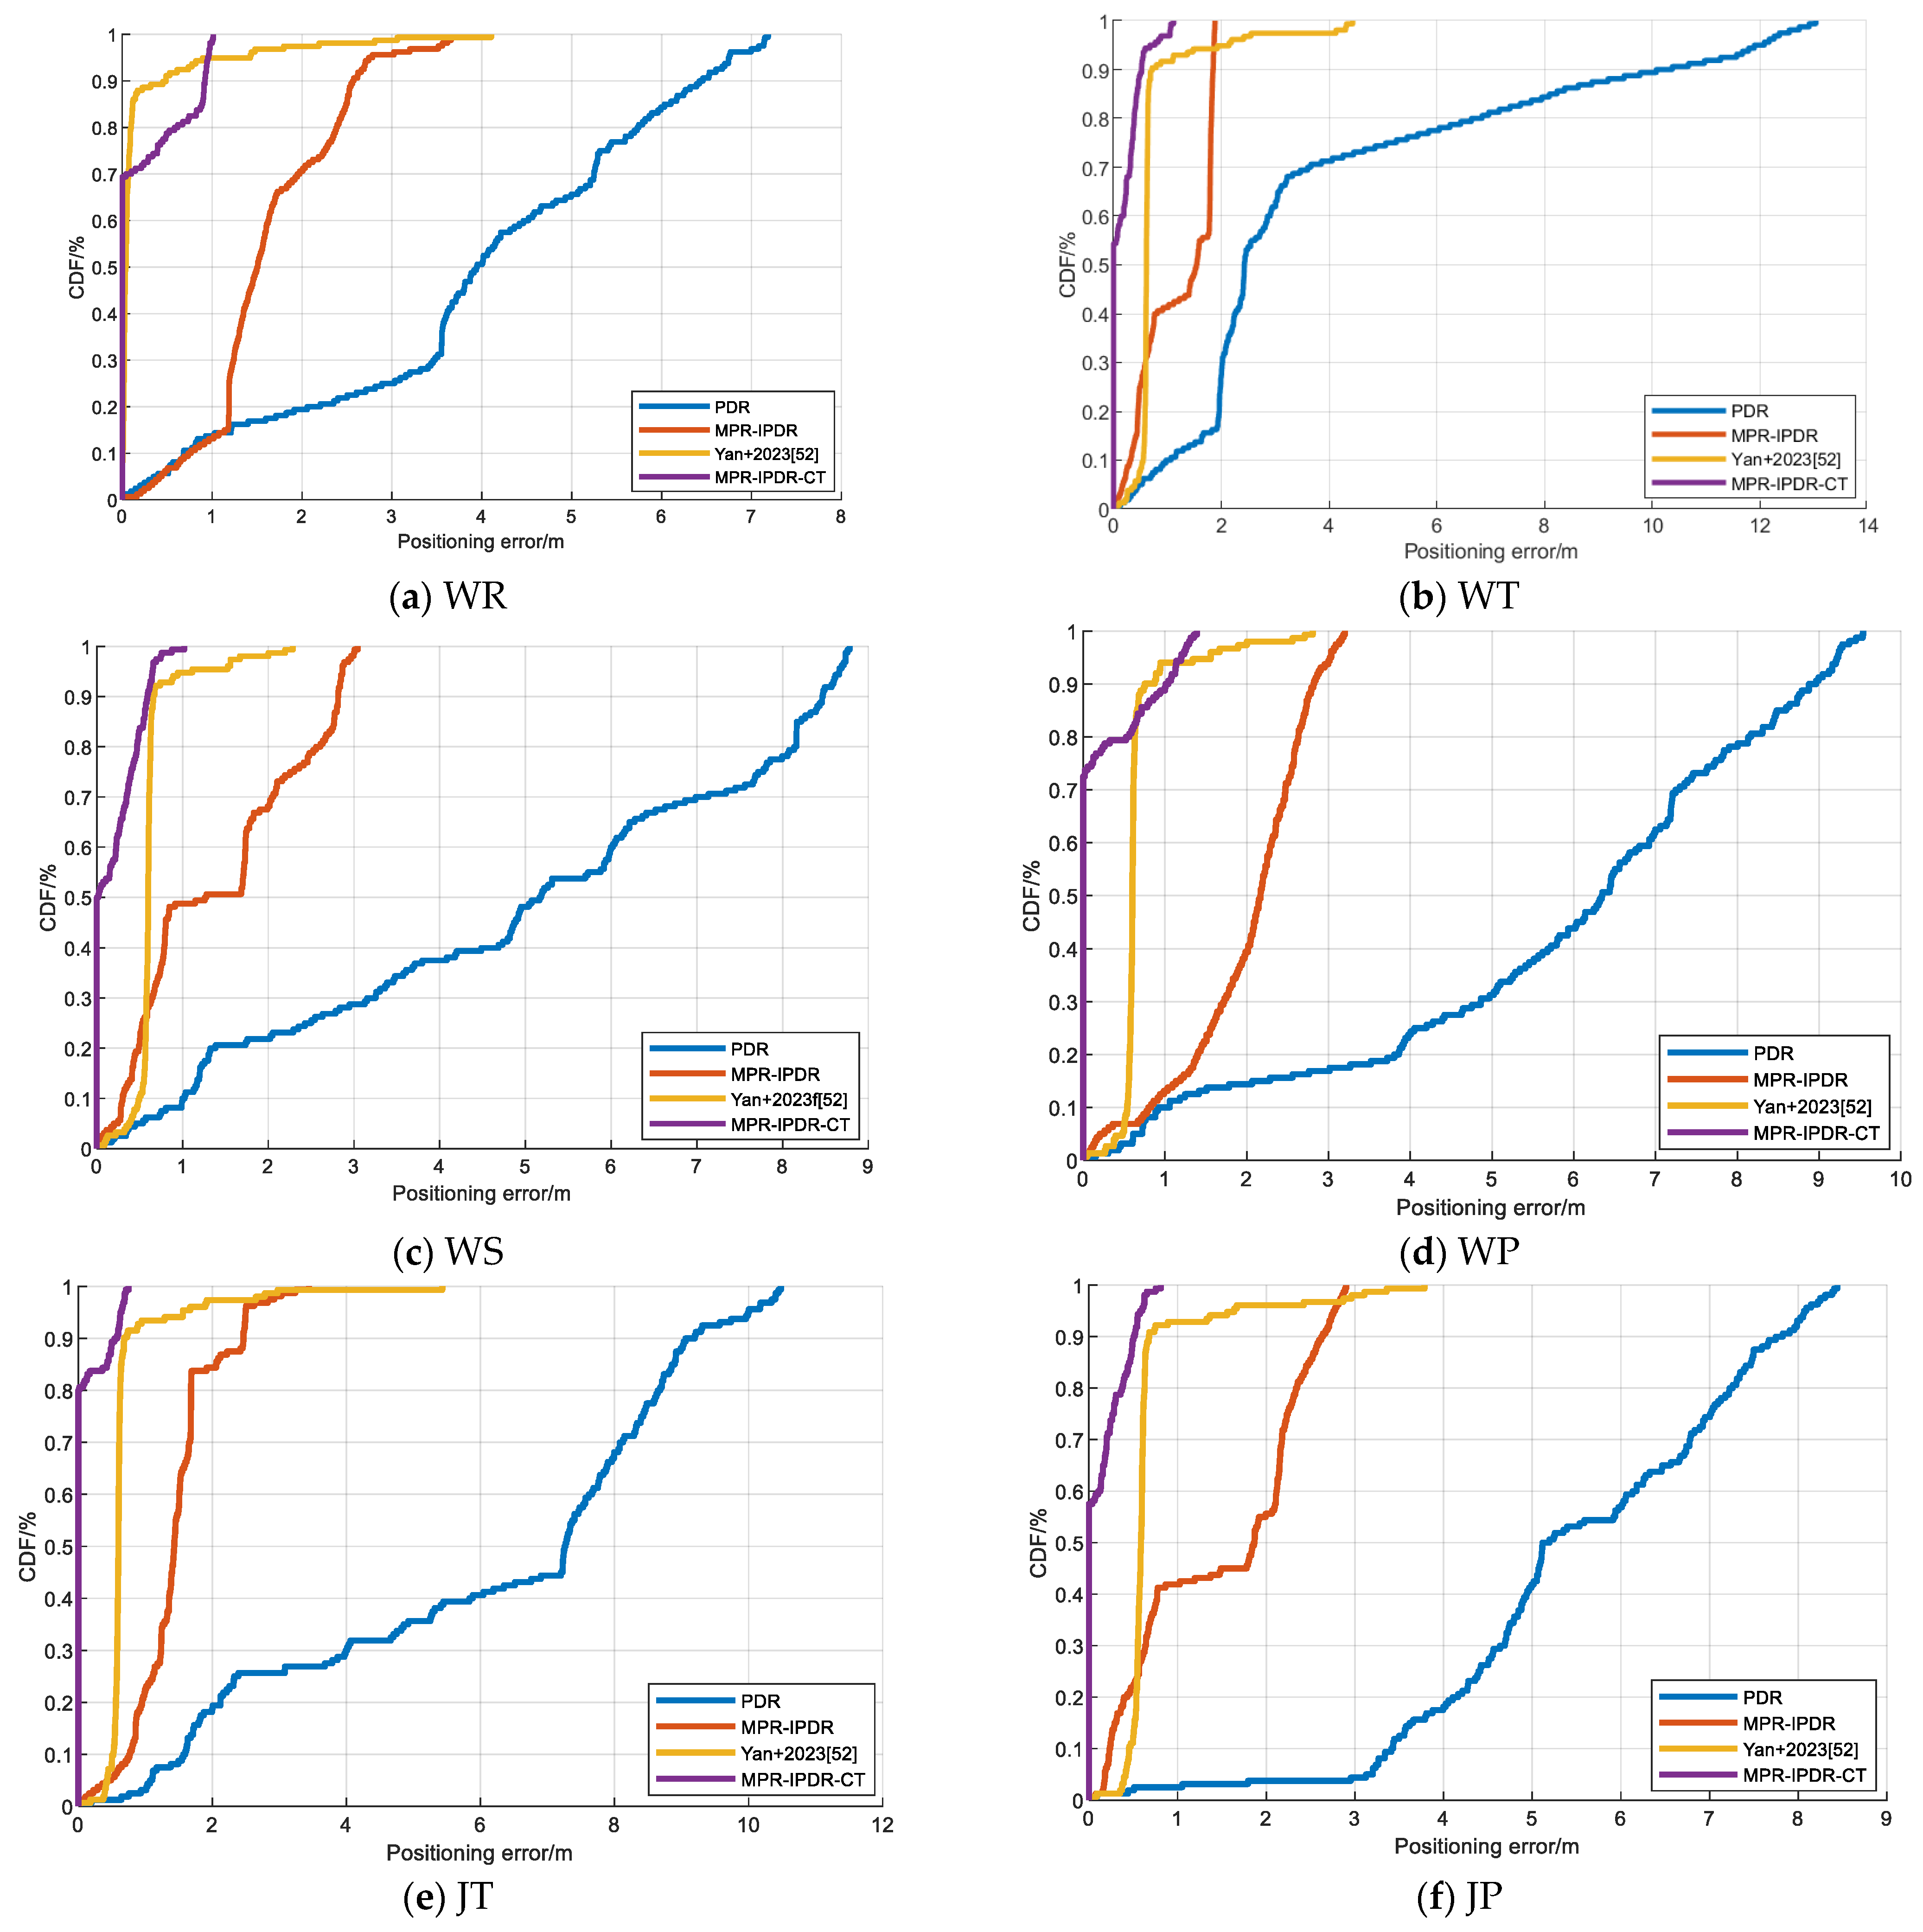
To validate the recognition accuracy of the proposed PCA-GWO-KELM model, experiments have been carried out in two separate experimental paths with six different motion modes, including walking and reading (WR), walking and telephoning (WT), walking and swinging (WS), walking and pocketing (WP), jogging and telephoning (JT), and jogging and pocketing (JP). WR mode refers to when a pedestrian is walking at normal speed with their phone steadily placed in front of their chest. WT mode refers to the situation where a pedestrian is walking at normal speed with their phone held to their ear to answer a call. WS mode refers to the state where a pedestrian’s phone swings at random while walking at normal speed. WP mode refers to the situation where pedestrians place their mobile phones in the side pockets of their pants while walking at normal speed. JT mode refers to the situation where a pedestrian answers a call with their phone held to their ear while running. JP mode refers to the situation where a pedestrian’s phone is placed in the side pocket of their pants while running. The device used in this experiment is Mate60 Pro cell phone. These two planned experimental paths are two indoor straight corridors with a building length of 24 m and 97.2 m, respectively.
Figure 4 presents the accuracy of the proposed PCA-GWO-KELM model in multiple movement model recognition. Results have demonstrated that the accuracy of the motion pattern recognition for WR, WT, WS, WP, JT, and JP modes are, respectively, 100%, 100%, 100%, 100%, 97.50%, and 100% on the 24 m path. And the recognition rates for WR, WT, WS, WP, JT, and JP modes are, respectively, 100%, 99.38%, 98.15%, 100%, 95.68%, and 92.60% on the 97.2 m path. The PCA-GWO-KELM model achieves a high recognition rate of motion pattern under different scenes.

3.3. Double Adaptive Threshold Gait Detection

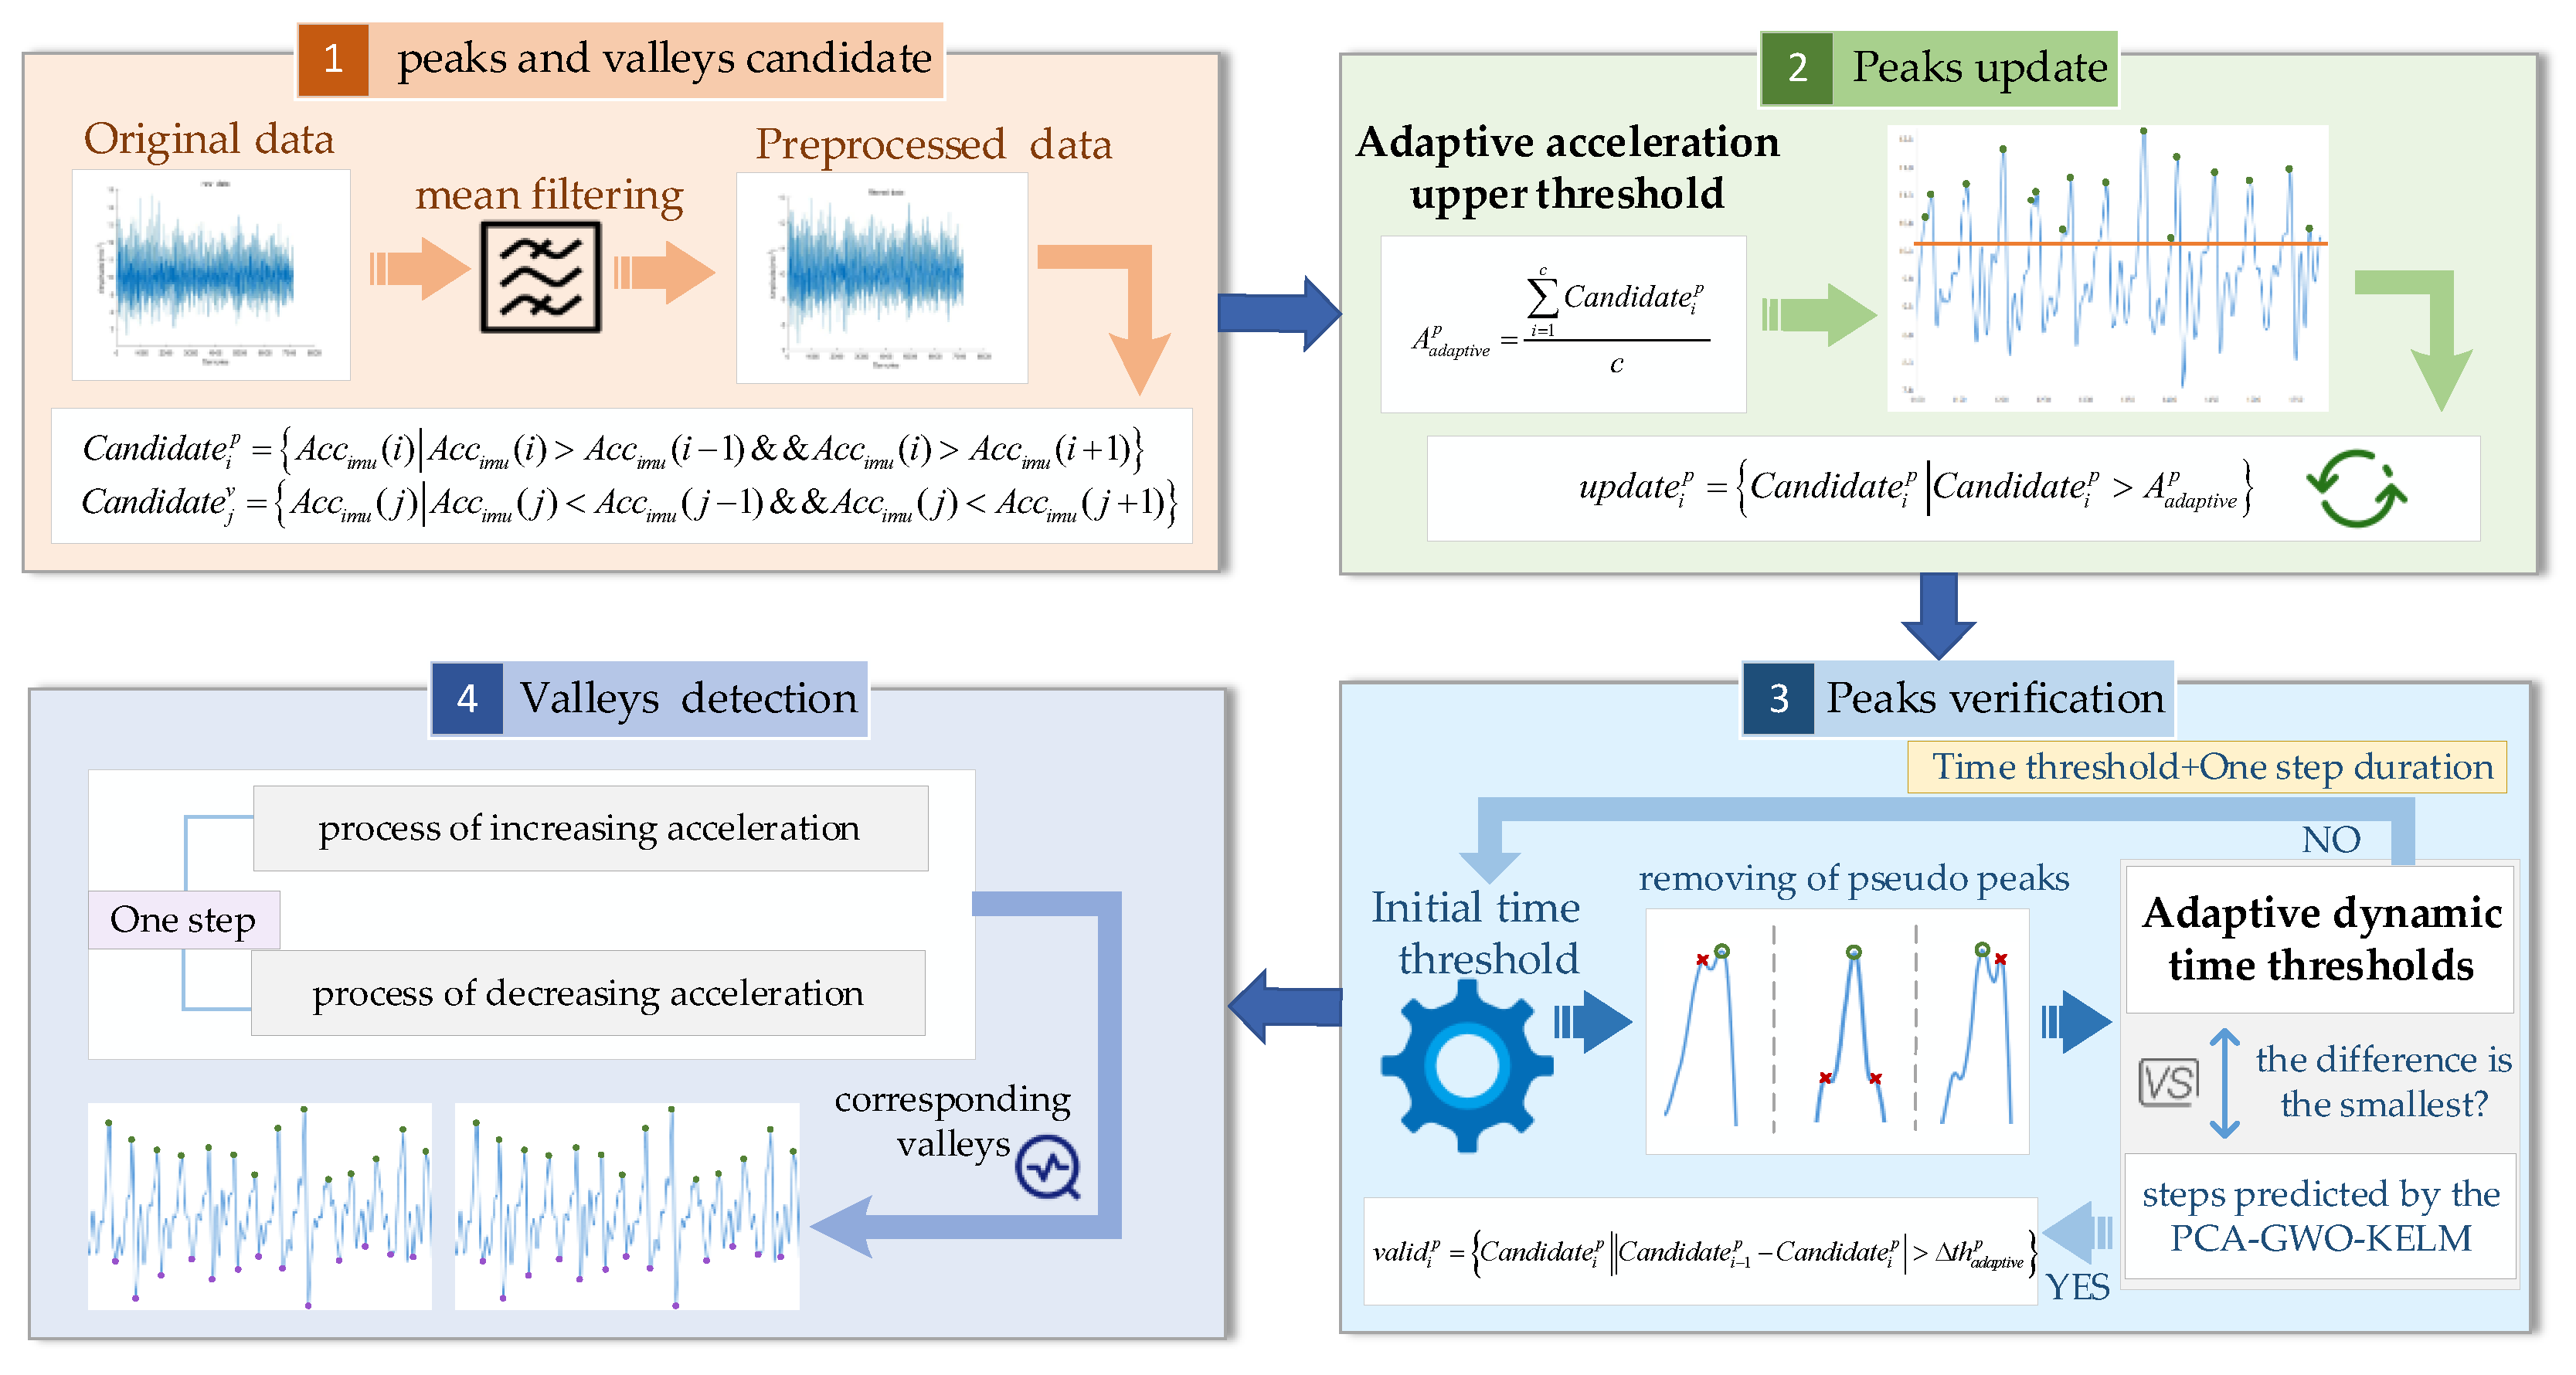
Accurate gait detection can achieve good positioning performance. We propose a double adaptive threshold gait detection method, shown in Figure 5. The proposed gait detection method includes peak and valley candidates, peak update, peak verification, and valley detection.
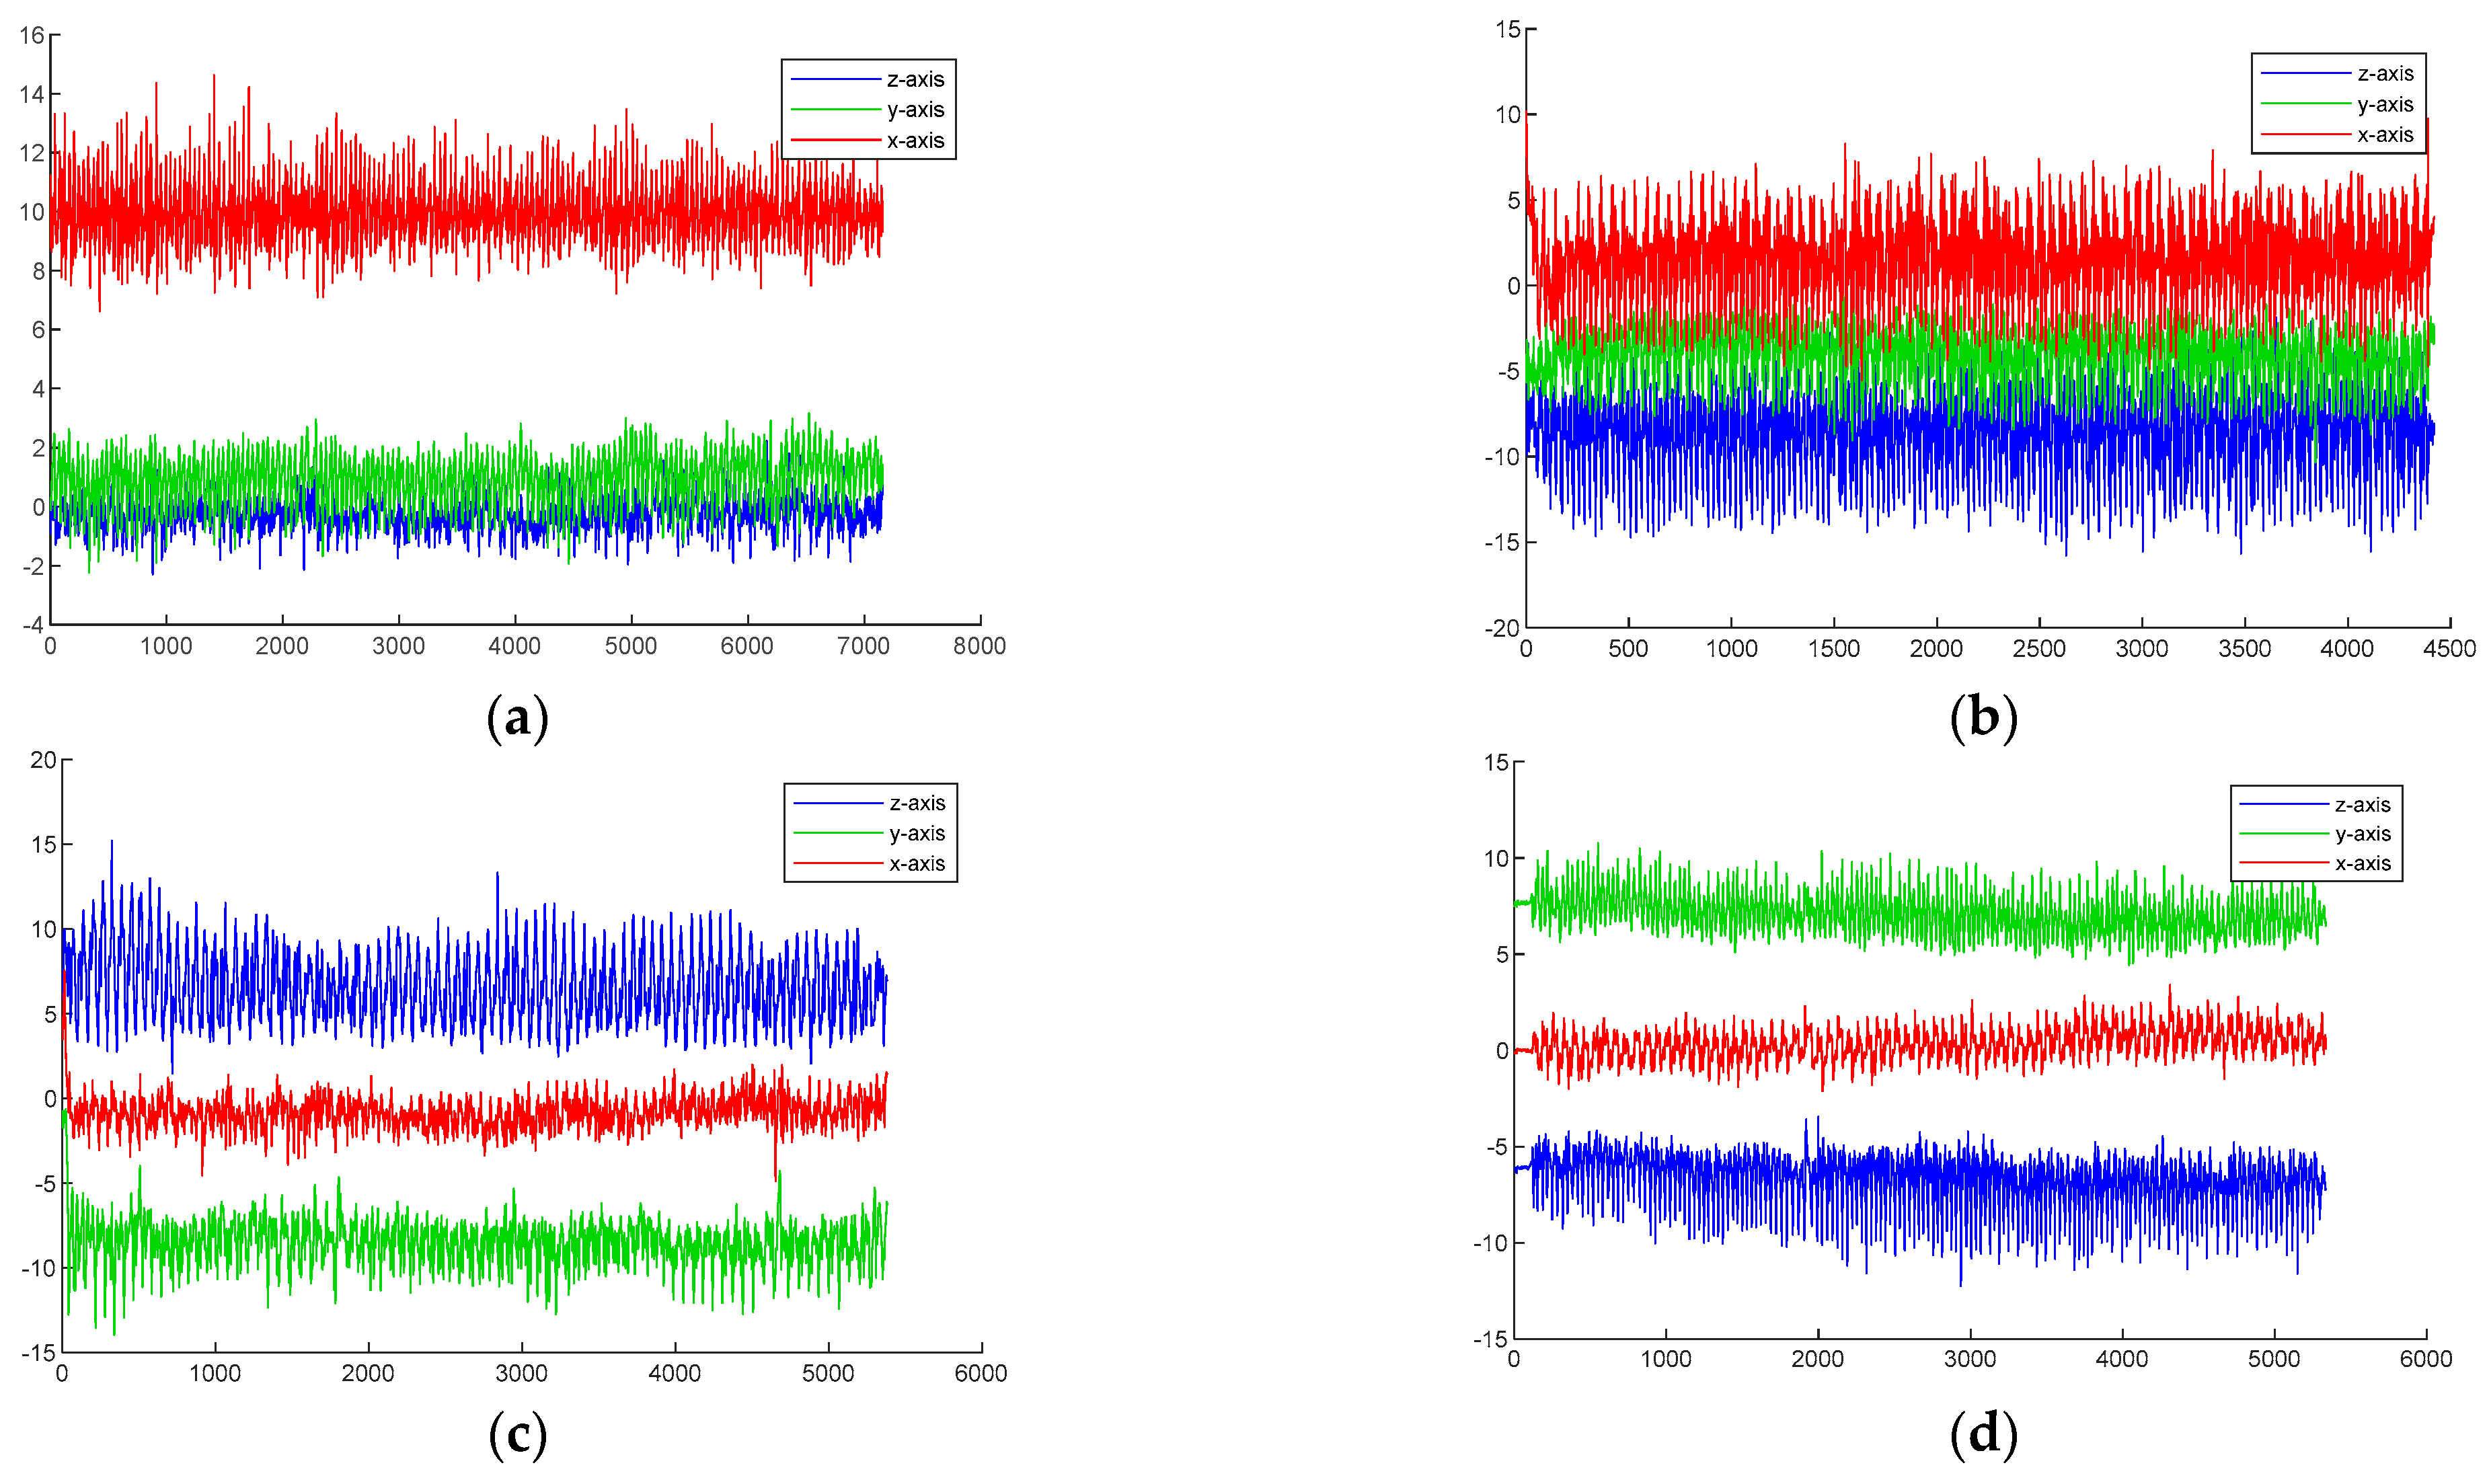
Three-dimensional acceleration under different movements reflects different motion postures. Figure 6 shows the changes in motion acceleration in reading, phone, swing, and pocket modes. The red line represents the X-axis acceleration, the green line represents the Y-axis acceleration, and the blue line represents the Z-axis acceleration. The results demonstrate that in reading mode and pocket mode, the acceleration changes in the z-axis and x-axis directions are more significant. In swing and phone modes, there are significant changes in acceleration in the x-axis and y-axis directions. Therefore, there are differences in the motion characteristics of different postures.
In gait detection, candidate peak pre-detection of motion acceleration is first performed using the peak detection method. The peak must be greater than the value of the acceleration before and after it. If a peak is detected, it is considered that the pedestrian has taken a step, and the peak time is recorded, as shown in the following equation:
C a n d i d a t e i p = A c c c p ( i ) A c c c p ( i ) > A c c c p ( i 1 ) & & A c c c p ( i ) > A c c c p ( i + 1 )
where C a n d i d a t e i p is the set of candidate peaks at sampling point i. A c c c p is the combined acceleration.
To avoid the pseudo peaks, the adaptive acceleration upper threshold is set by taking the average of the forward acceleration within a fixed time period, as shown in Equation (14).
A a d a p t i v e p = i = 1 c C a n d i d a t e i p c
u p d a t e i p = C a n d i d a t e i p C a n d i d a t e i p > A a d a p t i v e p
where A a d a p t i v e p is the adaptive acceleration upper threshold, and c is the number of candidate peaks.
Candidate peaks that are larger than the threshold for adaptive acceleration are saved, and u p d a t e i p is the set of updated candidate peaks.
The time interval between two adjacent peaks is finite. In this paper, an adaptive dynamic time threshold is set to verify the valid peaks. First, the initial time threshold is set to the time interval of the first step, and the number of prediction steps corresponding to the initial time threshold is recorded. This predicted number of steps then differs from the true number of steps obtained from the PCA-GWO-KELM model. If the difference is minimum at this point, the number of steps corresponding to the initial threshold is output. If the difference is not a minimum, the initial time threshold is doubled, and the algorithm loop continues. The current peak acceleration can be judged valid only if the time interval between two adjacent steps meets the requirements of the following equation.
v a l i d i p = C a n d i d a t e i p C a n d i d a t e i 1 p C a n d i d a t e i p > Δ t h a d a p t i v e p
where v a l i d i p is the set of peaks after verification of the adaptive dynamic time thresholds, and Δ t h a d a p t i v e p is an adaptive dynamic time threshold.
The flow of the double adaptive threshold gait detection method is depicted in Algorithm 1.
Algorithm 1: The double adaptive threshold gait detection method
Input: Motion acceleration data.
Output: Target steps and peak amplitude.
1: Data preprocessing using mean filtering.
2: Candidate peaks are selected using peak detection by Equation (21).
3: Candidate peaks are counted, and adaptive acceleration upper thresholds are calculated by Equation (22).
4: Update candidate peaks by Equation (23).
5: Set the time interval of the first step to the initial time threshold.
6: for each step do
7:          Record the difference between the step number corresponding to the current time threshold and the true step number.
8:     if the difference is minimal then
9:                     Save the step number at this moment.
10:       else
11:                 Double the time threshold.
12:     end if
13: Save the value of each peak.
14: end for

3.4. Adaptive Step Length Estimation

In this paper, an adaptive step length estimation algorithm is used, which considers the motion state of pedestrians. This algorithm first uses the previous two step lengths to obtain a rough estimate of the current step length. Eight feature variables are extracted from the acceleration signal, which are peak-to-valley amplitude difference, walk frequency, variance, mean acceleration, peak median, valley median, signal area, and signal energy.
S L E i n i t i a l ( t ) = q 1 * S L E i n i t i a l ( t 2 ) + q 2 * S L E i n i t i a l ( t 1 ) + q 3 * K * v a l i d t p v a l i d t v 4
where S L E i n i t i a l ( t ) is the rough estimate of the current step, and S L E i n i t i a l ( t 1 ) and S L E i n i t i a l ( t 2 ) are the previous step and the first two steps of the current step, respectively. v a l i d t p and v a l i d t v are the maximum and minimum values of acceleration for the current step, respectively. q 1 , q 2 , and q 3 are the weight factors.
Then, eight feature variables are regularized and constrained using the least absolute shrinkage and selection operator (Lasso) method. When formula (18) reaches its minimum value, the optimal step size feature coefficient is obtained.
L o s s = 1 2 t = 1 b ( S L E i m u ( t ) k = 1 d A F k t ρ k ) 2 + γ k = 1 d ρ k
where b is the total number of steps walked, d is the number of feature variables, A F represents the characteristic variables, and ρ stands for the regression coefficients. γ is the regularization factor, which serves to adjust the size of the characteristic coefficients. S L E i n i t i a l ( t ) is the fine estimate of the current step.
In the end, the obtained step length is
S L f i n a l = ρ k × A F + B
where AF is the step characteristic and B is the constant matrix corresponding to the regression coefficients.

3.5. Adaptive Heading Angle Estimation

The general heading estimation method is to use the accelerometer, magnetometer, and gyroscope that come with the mobile phone for attitude solving. The mobile phone is converted from the carrier coordinate system to the navigation coordinate system, and then the yaw angle in the navigation coordinate system is used as the forward direction angle. We use the quaternion method to coordinate and transform the gyroscope data [49].
M G y r = 1 2 ( q 2 2 + q 3 2 ) 2 ( q 1 q 2 q 0 q 3 ) 2 ( q 0 q 2 + q 1 q 3 ) 2 ( q 0 q 3 + q 1 q 2 ) 1 2 ( q 1 2 + q 3 2 ) 2 ( q 2 q 3 q 0 q 1 ) 2 ( q 0 q 2 q 1 q 3 ) 2 ( q 0 q 1 + q 2 q 3 ) 1 2 ( q 1 2 + q 2 2 )
where ( q 0 , q 1 , q 2 , q 3 ) are the four sub-elements that correspond to the four elements that make up the quaternion. And the attitude angle of the mobile phone in the navigation coordinate system is solved by Equation (21) [49].
A n g l e y a w = a r c t a n ( 2 ( q 2 q 3 + q 0 q 1 ) 1 q 1 2 q 2 2 ) A n g l e p i t c h = a r c s i n ( 2 q 1 q 3 + 2 q 0 q 2 ) A n g l e r o l l = a r c t a n ( 2 ( q 1 q 2 + q 0 q 3 ) 1 2 q 2 2 2 q 3 2 )
where A n g l e y a w is the yaw angle, A n g l e p i t c h is the pitch angle, and A n g l e r o l l is the roll angle. Then, the gyroscope data are fused with the acceleration and magnetometer data through KF. In this paper, the fusion process takes the heading angle measured by the direction sensor as the system observation and the gyroscope data as the measured value control input to the process. Continuously iterating this process implements KF to correct the heading angle.

3.6. Multiple Pattern Recognition Positioning

Particle filtering is a recursive Bayesian filtering method for state estimation of dynamic systems, which is suitable for nonlinear and non-Gaussian noise cases. Therefore, we utilized PF combined with PDR and acoustic signals for fusion positioning. The fusion positioning method designed in this paper performs the following steps:
Step 1: Initialize a particle swarm containing N particles in the positioning region, each with a weight of 1, and assume that the set of particles at moment t are S e t i t = ( p x i t , p y i t ) , i = 1 , , N . The position coordinates of the initial particle set are generated based on the acoustic positioning results.
Step 2: After obtaining the initialized particle set, the position of the particle at time t + 1 will be updated by Equation (30).
S e t i t + 1 = S e t i t + S L E i m u t + 1 s i n A n g l e y a w t + 1 c o s A n g l e y a w t + 1 + λ t + 1
where S L E i m u ( t + 1 ) and A n g l e i t + 1 are the step length and heading angle of the pedestrian at t + 1, respectively. λ t + 1 is Gaussian noise with zero mean and variance of 1.
Step 3: The acoustic positioning results are used as systematic observations, expressed as follows:
T D O A t + 1 = p x t d o a t + 1 p y t d o a t + 1 S L E i m u t + 1 A n g l e y a w t + 1 + φ t + 1
where p x t d o a t + 1 and p y t d o a t + 1 are the estimated positions for acoustic localization at t + 1, respectively, and φ t + 1 is the observation noise. The new weight update factor is calculated from the acoustic positioning results as follows:
e i t + 1 = 1 2 π ξ e x p 1 2 ξ ( S e t i t + 1 T D O A t + 1 ) T ( S e t i t + 1 T D O A t + 1 )
where ξ is the covariance matrix of the acoustic estimate.
Step 4: The particles are normalized by Equation (33).
e ¯ i t + 1 = e i t + 1 i + 1 N e i t + 1
The normalized particles are then resampled. Particles with large weights have a high percentage after resampling, and particles with small weights are discarded. The particles with high weights are replicated multiple times with the total number of particles remaining the same.
Step 5: Finally, fusion positioning estimation is performed. The pedestrian’s position at t + 1 can be calculated by Equation (34).
L o c f u s i o n t + 1 = i = 1 N e ¯ i t + 1 S e t i t + 1

4. Experimental Results

In this section, the experimental setup is described in Section 4.1. Then, the recognition accuracy of the proposed PCA-GWO-KELM model is analyzed in Section 4.2. In Section 4.3, a double adaptive threshold gait detection method is discussed. Section 4.4 evaluates the positioning accuracy of MPR-IPDR. Finally, Section 4.5 assesses the positioning performance of the fusion method.

4.1. Experimental Setting

To demonstrate the localization performance of the proposed method, we have conducted comprehensive experiments in two indoor architectural environments. As shown in Figure 5, the two experimental scenes include a public corridor and an office building with dimensions of approximately 68 × 20 × 3 m3 and 65 × 16 × 3 m3, respectively. And bold blue lines denote the planned movement trajectories of the target. In Figure 7a, the movement trajectory is a narrow corridor with fire extinguishers and greenery, and it contains a 120° and 90° corner. In Figure 7b, the movement trajectory is an irregular closed graph with six consecutive corners, and it is an office building with some display signs.
In these experiments, we recruit a volunteer from a local university to collect acoustic signals and IMU data along the planned path. The 17.5–19.5 kHz pseudo-ultrasound as the acoustic source is chosen. In this paper, a multi-device collaborative approach is used to complete the data acquisition and processing. Vivo Y93s and Huawei mate 60 pro cell phones were used in the data acquisition session to support the stable acquisition of pedestrian motion data at 50 Hz frequency. In the data processing stage, a Seven Rainbow iGame Sigma M500 desktop computer is used, which is equipped with an Intel Core i7-11700 K processor, 32 GB DDR4 3200 MHz RAM, and an NVIDIA GeForce RTX 3060 graphics card.

4.2. PCA-GWO-KELM Motion Pattern Recognition Analyses

To validate the recognition accuracy of the proposed PCA-GWO-KELM model, we compare it with the SVM, RF, ELM, GWO-ELM, and PSO-LSTM-GRU models [50] in the two test trajectories. SVM is a Radial Basis Kernel Function (RBF) with a penalty factor of C = 1.0 and trained using the Sequential Minimum Optimization (SMO) algorithm. RF consists of 100 decision trees with Gini impurity for feature partitioning, and ELM is a single-hidden-layer feed-forward neural network with 100 nodes and a Sigmoid activation function. The number of nodes is set to 100, and the activation function is Sigmoid. In GWO-ELM, the number of gray wolf individuals is 30, and the maximum number of iterations is 50. For PSO-LSTM-GRU, the swarm size is set to 40 particles, and both the LSTM and GRU layers use 64 hidden units and are trained for 30 epochs. The above model is used as a comparative method to verify the performance of our proposed PCA-GWO-KELM model.
The tester collects multiple sets of IMU data at each of the six movement models and then obtains the recognition accuracy of the movement modes under different classification methods. Figure 8 and Figure 9 show that the recognition accuracy of the proposed PCA-GWO-KELM model reaches the highest level under all six movement modes in the two experimental environments compared to the SVM, RF, ELM, GWO-ELM, and PSO-LSTM-GRU models. Although PSO-LSTM-GRU leverages swarm-driven tuning of deep recurrent layers, it still lags behind PCA-GWO-KELM by roughly 2–3 percentage points across devices and scenes, confirming the latter’s superior accuracy with lower computational cost. This is because the PCA-GWO-KELM model improves the convergence speed and final prediction performance of the model by PCA extracting the most important data features and GWO optimizing the network parameters of KELM.
Table 1 presents the average recognition accuracies of the six motion patterns for the PCA-GWO-KELM, SVM, RF, ELM, GWO-ELM, and PSO-LSTM-GRU models when using different devices in Scene 1. To make the data in the table more readable, we have bolded the PCA-GWO-KELM method in the table. It is noticeable that the average recognition accuracy of the proposed PCA-GWO-KELM model is higher than other methods in scene 1 under different mobile devices. For Vivo Y93s in scene 1, its accuracy of 97.63% outperforms the other models, and for Mate60 Pro in the same scene, the 99.07% accuracy also stands out. This is because PCA-GWO-KELM first performs dimensionality reduction using PCA to retain key features, and then optimizes the parameters using GWO to improve feature utilization and model fitting. The experimental results demonstrate that the PCA-GWO-KELM model can provide better movement pattern information to estimate the target states.
Table 2 presents the average recognition accuracies of the six motion patterns for the PCA-GWO-KELM, SVM, RF, ELM, GWO-ELM, and PSO-LSTM-GRU models when using different devices in Scene 2. It is observed that the average recognition accuracy of the proposed PCA-GWO-KELM model is higher than the other methods in scene 2 under different mobile devices. For the Vivo Y93s in scene 2, the accuracy of 98.33% is better, while for the Mate60 Pro in this scene, the accuracy of 99.27% is also the highest among the compared models. The experimental results demonstrate that the proposed model has more versatility, higher recognition accuracy, and can provide better movement pattern information.
To verify the robustness of the PCA-GWO-KELM model, we test it more times consecutively to check the recognition accuracy. Table 3 lists the motion model recognition accuracy of the recognition method proposed in this paper. The time complexity is compared using the SVM, RF, ELM, and the GWO-ELM and PSO-LSTM-GRU models, respectively. SVM has good stability but poor accuracy. The maximum difference in RF recognition accuracy reaches 5.74%. The maximum difference in recognition accuracy of the ELM method reaches 6.27%, and its characteristic of randomly initializing the input weights and biases leads to poor performance stability. And it is noticeable that recognition accuracy difference of the GWO-ELM model reaches 2.57%. Although the GWO-ELM model uses GWO to optimize the parameters of ELM, GWO is accompanied by stochasticity during initialization. In addition, PSO-LSTM-GRU exhibits higher stability than GWO-ELM, but its average accuracy is still lower than the proposed PCA-GWO-KELM model.
The PCA-GWO-KELM model not only has GWO-optimized kernel function parameters and regularization coefficients to enhance the performance of the ELM but also features dimensionality reduction, which effectively improves the recognition accuracy. Experimental results demonstrate that the PCA-GWO-KELM model’s recognition accuracy is higher than the others. It has high stability.
Table 4 shows the computational complexity of different models in scenario 1 and scenario 2. In these two scenarios, the time consumption of the PCA-GMO-KELM model is significantly higher than that of the SVM, RF, ELM, and GMO-ELM models. Although PCA-GWO-KELM achieves high recognition accuracy as shown in previous results, it does so at the cost of increased computational complexity, suggesting a trade-off between accuracy and processing efficiency. In contrast, the PSO-LSTM-GRU model brings the heaviest computational burden, limiting its applicability for deployment on mobile devices.

4.3. Gait Detection Analyses

Some experiments are designed to validate the proposed double adaptive threshold gait detection algorithm. During the experiments, the tester holds two different devices participating in the planned route and collects multiple sets of IMU data.
Table 5 shows the step detection results for different devices in two scenes. The experimental results illustrate the better effectiveness of the proposed double adaptive threshold step detection algorithm. This is because the proposed step detection algorithm is not only able to adaptively eliminate the peaks with large differences but also adaptively adjust the time threshold to be nearer to the real step count.

4.4. MPR-IPDR Positioning Analyses

In this section, the positioning errors of the MPR-IPDR method are validated with comprehensive experiments. Figure 10 shows the mean positioning errors of six motion patterns using the traditional PDR, Yan+ 2022 [51], and MPR-IPDR method under the two scenes and two devices. We observe that the mean positioning error of the PDR and Yan+ 2022 [51] method are larger than those of MPR-IPDR. This is attributed to the complexity of motion patterns during pedestrian navigation, and PDR applications are limited in many indoor scenarios. If human motion states are not distinguished, large deviations may occur during positioning. The MPR-IPDR method judges the motion pattern of the pedestrian before performing indoor positioning. And the MPR-IPDR method also employs the proposed step detection algorithm based on double adaptive thresholds and adaptive step length estimation method, which further reduces the cumulative error and improves the localization robustness.

4.5. Fusion Positioning Analyses

We have conducted extensive localization experiments in two experimental scenes. Figure 11 illustrates the cumulative distribution function (CDF) between the proposed MPR-IPDR-CT method and the PDR, MPR-IPDR, and Yan+ 2023 [52] methods for different motion modes in scene 1. Under the six different motion modes, the positioning error of the MPR method is less than 1.5 m with 90% probability. The proposed MPR-IPDR-CT algorithm performs adaptive gait detection, step length estimation and heading estimation by combining the results of different multi-modal recognitions. At the same time, the method is also combined with acoustic positioning to accurately estimate the pedestrian position. This method can overcome the defects of traditional PDR algorithms that are difficult to adapt to various combinations of pedestrian motion patterns, which are applicable to different indoor environments and provide a good solution for fusion positioning.
Figure 12 illustrates the CDF between the proposed MPR-IPDR-CT method and the PDR, MPR-IPDR, and Yan+2023 [52] methods for different motion modes in scene 2. Among all the motion mode types, the cumulative probabilities of the MPR-IPDR-CT methods all continue to show a steeper upward trend when the localization errors are in the smaller range. The reason why the MPR-IPDR-CT method achieves higher accuracy is most likely because it combines a multi-motion pattern recognition approach to accommodate different motion states, and incorporates acoustic localization to improve positioning accuracy. This integrated approach can better reduce motion interference and positioning errors and thus achieve higher positioning accuracy under different motion modes.
Table 6 illustrates the mean and root mean square error (RMS) of the PDR, MPR-PDR, Yan+ 2023 [52], and MPR-IPDR-CT methods under Scene 1. To make the data in the table more readable, we have bolded the MPR-IPDR-CT method in the table. The MPR-IPDR-CT method has the advantages of accurate action recognition, high action adaptability, and high localization accuracy. As a result, the method has a smaller average error and RMS error than the PDR, MPR-PDR, and Yan+ 2023 [52] methods for the six different motion modes. Meanwhile, the experimental results also show that the positioning error of the proposed algorithm is significantly reduced with the assistance of the motion pattern recognition results. This demonstrates that the algorithm can effectively improve the positioning performance of PDR under complex conditions and has strong practicality and scalability.
Table 7 illustrates the mean and root mean square error (RMS) of the PDR, MPR-PDR, Yan+ 2023 [52], and MPR-IPDR-CT methods under Scene 2. It is obvious that the MPR-IPDR-CT method minimizes both the mean error and the root mean square error in each motion mode. This superiority stems from its ability to combine multi-motion pattern recognition and improved dead reckoning with acoustic localization, which effectively reduces the errors caused by complex motions and environmental disturbances and thus exhibits excellent localization performance in different scenes.

5. Conclusions

To solve the problems of large cumulative error and poor stability caused by relative localization and different motion modes, an MPR-IPDR-CT method is proposed. In this approach, we propose an MPR-IPDR method that incorporates a multimode recognition model and a novel gait detection algorithm. Among them, the PCA-GWO-KELM-based multi-modal recognition model not only uses the PCA method to narrow down the motion features but also optimizes the network parameters of the KELM model through the GWO method. The motion pattern recognition information output from this model helps PDR to achieve high accuracy navigation and localization under multiple motion states of pedestrians. The dual adaptive threshold-based gait detection method possesses an acceleration adaptive upper threshold and an adaptive dynamic time threshold, which can filter out many pseudo peaks and improve the accuracy of gait detection. Finally, acoustic localization and PDR are fused for localization using PF to overcome the defects of single localization techniques and further improve the accuracy and stability of localization. We conduct multiple experiments in different experimental scenarios and with different equipment. The experimental results show that the proposed MPR-IPDR-CT method not only has excellent localization performance under different scenarios and different devices but also has good general adaptation and robustness. In the future, we will focus our work around expanding the analysis of more complex pedestrian movement patterns. We will consider analyzing various motion states such as stair climbing and backward movement to further enrich the diversity of data. By continuously optimizing the experimental design and data acquisition scheme, we will continuously improve the adaptability and reliability of the algorithm in complex indoor scenes. In addition, the multipath effect in complex indoor environments may introduce measurement outliers, leading to a decrease in acoustic localization accuracy. We will consider the combination of anti-interference algorithms to enhance the suppression ability of acoustic localization against multipath effects to further improve the stability and accuracy of the fusion localization system.

Author Contributions

Conceptualization, Xiaoyu Ji, Xiaoyue Xu, and Suqing Yan; methodology, Xiaoyu Ji and Xiaoyue Xu; software, Xiaoyu Ji, Xiaoyue Xu, and Suqing Yan; validation, Xiaoyu Ji, Xiaoyue Xu, and Jianming Xiao; formal analysis, Xiaoyue Xu, Suqing Yan, and Qiang Fu; investigation, Jianming Xiao, Qiang Fu, and Kamarul Hawari Bin Ghazali; resources, Xiaoyu Ji, Jianming Xiao, and Kamarul Hawari Bin Ghazali; writing—original draft preparation, Xiaoyu Ji, Xiaoyue Xu, and Suqing Yan; writing—review and editing, Suqing Yan and Kamarul Hawari Bin Ghazali; funding acquisition, Suqing Yan, Xiaoyu Ji, and Qiang Fu All authors have read and agreed to the published version of the manuscript.

Funding

This work is funded by Guangxi Science and Technology Project (GuikeZY23055048, GuikeAA23062038, GuikeAB23026120, GuikeZY22096026, GuikeAA24206043), Guangxi Science and Technology Base and Talent Special Project: Research and Application of Key Technologies for Precise Navigation (GuiKe AD25069103), Guangxi Natural Science Foundation (2024GXNSFBA010265), National Natural Science Foundation of China (U23A20280, 62161007, 62471153), Nanning Science Research and Technology Development Plan (20231029, 20231011), Guangxi Major Talent Project, Project of the Collaborative Innovation Center for BeiDou Location Service and Border and Coastal Defense Security Application, The Collaborative Innovation Center for BeiDou Location Service and Border and Coastal Defense Security Application. Graduate Student Innovation Project of Guilin University of Electronic and Technology (2025YCXS038), Innovation Project of Guang Xi Graduate Education.

Institutional Review Board Statement

Not applicable.

Informed Consent Statement

Not applicable.

Data Availability Statement

All test data mentioned in this paper will be made available on request to the corresponding author’s email with appropriate justification.

Conflicts of Interest

Jianming Xiao was employed by the company SGUET-Nanning E-Tech Research Institute Co., Ltd. The remaining authors declare that the research was conducted in the absence of any commercial or financial relationships that could be construed as a potential conflict of interest.

References

  1. Qi, L.; Liu, Y.; Yu, Y.; Chen, L.; Chen, R.Z. Current Status and Future Trends of Meter-Level Indoor Positioning Technology: A Review. Remote Sens. 2024, 16, 398. [Google Scholar] [CrossRef]
  2. Wan, R.J.; Chen, Y.X.; Song, S.W.; Wang, Z.F. CSI-Based MIMO Indoor Positioning Using Attention-Aided Deep Learning. IEEE Commun. Lett. 2024, 28, 53–57. [Google Scholar] [CrossRef]
  3. Lin, K.H.; Chen, H.M.; Li, G.J.; Huang, S.S. Analysis and Reduction of the Localization Error of the UWB Indoor Positioning System. In Proceedings of the 7th IEEE International Conference on Consumer Electronics—Taiwan (ICCE-Taiwan), Taoyuan, Taiwan, 28–30 September 2020. [Google Scholar]
  4. Ciezkowski, M.; Kociszewski, R. Fast 50 Hz Updated Static Infrared Positioning System Based on Triangulation Method. Sensors 2024, 24, 1389. [Google Scholar] [CrossRef] [PubMed]
  5. Xiao, K.; Hao, F.Z.; Zhang, W.J.; Li, N.N.; Wang, Y.T. Research and Implementation of Indoor Positioning Algorithm Based on Bluetooth 5.1 AOA and AOD. Sensors 2024, 24, 4579. [Google Scholar] [CrossRef]
  6. Li, S.H.; Tang, Z.; Kim, K.S.; Smith, J.S. On the Use and Construction of Wi-Fi Fingerprint Databases for Large-Scale Multi-Building and Multi-Floor Indoor Localization: A Case Study of the UJIIndoorLoc Database. Sensors 2024, 24, 3827. [Google Scholar] [CrossRef]
  7. Ge, T. Indoor positioning design based on HCC in the background of mobile edge computing. Soft Comput. 2023, 28, 471. [Google Scholar] [CrossRef]
  8. Liu, A.; Wang, J.G.; Lin, S.W.; Kong, X.Y. A Dynamic UKF-Based UWB/Wheel Odometry Tightly Coupled Approach for Indoor Positioning. Electronics 2024, 13, 1518. [Google Scholar] [CrossRef]
  9. Asraf, O.; Shama, F.; Klein, I. PDRNet: A Deep-Learning Pedestrian Dead Reckoning Framework. IEEE Sens. J. 2022, 22, 4932–4939. [Google Scholar] [CrossRef]
  10. Kan, R.X.; Wang, M.; Zhou, Z.; Zhang, P.; Qiu, H.B. Acoustic Signal NLOS Identification Method Based on Swarm Intelligence Optimization SVM for Indoor Acoustic Localization. Wirel. Commun. Mob. Comput. 2022, 2022, 5210388. [Google Scholar] [CrossRef]
  11. Ehrlich, C.R.; Blankenbach, J. Indoor localization for pedestrians with real-time capability using multi-sensor smartphones. Geo-Spat. Inf. Sci. 2019, 22, 73–88. [Google Scholar] [CrossRef]
  12. Thio, V.; Aparicio, J.; Anonsen, K.B.; Bekkeng, J.K.; Booij, W. Fusing of a Continuous Output PDR Algorithm With an Ultrasonic Positioning System. IEEE Sens. J. 2022, 22, 2464–2474. [Google Scholar] [CrossRef]
  13. Wu, L.; Guo, S.L.; Han, L.; Baris, C.A. Indoor positioning method for pedestrian dead reckoning based on multi-source sensors. Measurement 2024, 229, 114416. [Google Scholar] [CrossRef]
  14. Niu, C.L.; Chang, H. Research on Indoor Positioning on Inertial Navigation. In Proceedings of the 2nd IEEE International Conference on Computer and Communication Engineering Technology (CCET), Beijing, China, 16–18 August 2019; pp. 55–58. [Google Scholar]
  15. Diallo, A.; Konstantinidis, S.; Garbinato, B. A Pragmatic Trade-off Between Deployment Cost and Location Accuracy for Indoor Tracking in Real-Life Environments. In Proceedings of the 14th International Conference on Localization and GNSS (ICL-GNSS), Antwerp, Belgium, 25–27 June 2024. [Google Scholar]
  16. Zhao, G.L.; Wang, X.; Zhao, H.X.; Jiang, Z.H. An improved pedestrian dead reckoning algorithm based on smartphone built-in MEMS sensors. Aeu-Int. J. Electron. Commun. 2023, 168, 154674. [Google Scholar] [CrossRef]
  17. Weinberg, H. Using the ADXL202 in Pedometer and Personal Navigation Applications. Analog. Devices 2009, 2, 1–6. [Google Scholar]
  18. Yu, C.; Shin, B.; Kang, C.G.; Lee, J.H.; Kyung, H.; Kim, T.; Lee, T. RF signal shape reconstruction technology on the 2D space for indoor localization. In Proceedings of the International Conference on Electronics, Information, and Communication (ICEIC), Jeju, Republic of Korea, 6–9 February 2022. [Google Scholar]
  19. Huang, L.; Li, H.; Li, W.K.; Wu, W.T.; Kang, X. Improvement of Pedestrian Dead Reckoning Algorithm for Indoor Positioning by using Step Length Estimation. In Proceedings of the ISPRS TC III and TC IV 14th GeoInformation for Disaster Management (Gi4DM), Beijing, China, 1–4 November 2022; pp. 19–24. [Google Scholar]
  20. Widdison, E.; Long, D.G. A Review of Linear Multilateration Techniques and Applications. IEEE Access 2024, 12, 26251–26266. [Google Scholar] [CrossRef]
  21. Mandal, A.; Lopes, C.V.; Givargis, T. Beep: 3D Indoor Positioning Using Audible Sound. In Proceedings of the Second IEEE Consumer Communications and Networking Conference, Las Vegas, NV, USA, 6 January 2008. [Google Scholar]
  22. Khyzhniak, M.; Malanowski, M. Localization of an Acoustic Emission Source Based on Time Difference of Arrival. In Proceedings of the Signal Processing Symposium (SPSympo), Lodz, Poland, 20–23 September 2021; pp. 117–121. [Google Scholar]
  23. Urazghildiiev, I.R.; Hannay, D.E. Localizing Sources Using a Network of Synchronized Compact Arrays. IEEE J. Ocean. Eng. 2021, 46, 1302–1312. [Google Scholar] [CrossRef]
  24. Liu, T.; Niu, X.J.; Kuang, J.; Cao, S.; Zhang, L.; Chen, X. Doppler Shift Mitigation in Acoustic Positioning Based on Pedestrian Dead Reckoning for Smartphone. IEEE Trans. Instrum. Meas. 2021, 70, 3010384. [Google Scholar] [CrossRef]
  25. Wang, X.; Huang, Z.H.; Zheng, F.Q.; Tian, X.C. The Research of Indoor Three-Dimensional Positioning Algorithm Based on Ultra-Wideband Technology. In Proceedings of the 39th Chinese Control Conference (CCC), Shenyang, China, 27–29 July 2020; pp. 5144–5149. [Google Scholar]
  26. Zhu, H.Z.; Zhang, Y.X.; Liu, Z.F.; Wang, X.; Chang, S.; Chen, Y.Y. Localizing Acoustic Objects on a Single Phone. IEEE-Acm Trans. Netw. 2021, 29, 2170–2183. [Google Scholar] [CrossRef]
  27. Zhang, P.; Wang, M.; Qiu, H.B.; Kan, R.X. Acoustic Localization System based on Smartphone without Time Synchronization. In Proceedings of the 5th International Conference on Information Science, Computer Technology and Transportation (ISCTT), Shenyang, China, 13–15 November 2020; pp. 475–481. [Google Scholar]
  28. Zhou, Z.J.; Feng, W.; Li, P.; Liu, Z.T.; Xu, X.; Yao, Y.B. A fusion method of pedestrian dead reckoning and pseudo indoor plan based on conditional random field. Measurement 2023, 207, 112417. [Google Scholar] [CrossRef]
  29. Wang, J.T.; Xu, T.H.; Wang, Z.J. Adaptive Robust Unscented Kalman Filter for AUV Acoustic Navigation. Sensors 2020, 20, 60. [Google Scholar] [CrossRef]
  30. Klee, U.; Gehrig, T.; McDonough, J. Kalman filters for time delay of arrival-based source localization. Eurasip J. Appl. Signal Process. 2006, 2006, 12378. [Google Scholar] [CrossRef]
  31. Wang, B.Y.; Liu, X.L.; Yu, B.G.; Jia, R.C.; Gan, X.L. Pedestrian Dead Reckoning Based on Motion Mode Recognition Using a Smartphone. Sensors 2018, 18, 1811. [Google Scholar] [CrossRef] [PubMed]
  32. Kang, W.; Han, Y. SmartPDR: Smartphone-Based Pedestrian Dead Reckoning for Indoor Localization. IEEE Sens. J. 2015, 15, 2906–2916. [Google Scholar] [CrossRef]
  33. Yan, S.Q.; Xu, X.Y.; Luo, X.A.; Xiao, J.M.; Ji, Y.F.; Wang, R.R. A Positioning and Navigation Method Combining Multimotion Features Dead Reckoning with Acoustic Localization. Sensors 2023, 23, 9849. [Google Scholar] [CrossRef]
  34. Luo, Y.R.; Guo, C.; Su, J.T.; Guo, W.F.; Zhang, Q. Learning-Based Complex Motion Patterns Recognition for Pedestrian Dead Reckoning. IEEE Sens. J. 2021, 21, 4280–4290. [Google Scholar] [CrossRef]
  35. Zhang, L.; Huang, L.; Yi, Q.W.; Wang, X.J.; Zhang, D.W.; Zhang, G.H. Positioning Method of Pedestrian Dead Reckoning Based on Human Activity Recognition Assistance. In Proceedings of the 12th IEEE International Conference on Indoor Positioning and Indoor Navigation (IPIN), Beijing, China, 5–7 September 2022. [Google Scholar]
  36. Chen, X.T.; Xie, Y.X.; Zhou, Z.H.; He, Y.Y.; Wang, Q.L.; Chen, Z.M. An Indoor 3D Positioning Method Using Terrain Feature Matching for PDR Error Calibration. Electronics 2024, 13, 1468. [Google Scholar] [CrossRef]
  37. Khalili, B.; Abbaspour, R.A.; Chehreghan, A.; Vesali, N. A Context-Aware Smartphone-Based 3D Indoor Positioning Using Pedestrian Dead Reckoning. Sensors 2022, 22, 9968. [Google Scholar] [CrossRef]
  38. Gu, F.Q.; Khoshelham, K.; Valaee, S.; Shang, J.G.; Zhang, R. Locomotion Activity Recognition Using Stacked Denoising Autoencoders. IEEE Internet Things J. 2018, 5, 2085–2093. [Google Scholar] [CrossRef]
  39. Klein, I.; Solaz, Y.; Ohayon, G. Pedestrian Dead Reckoning With Smartphone Mode Recognition. IEEE Sens. J. 2018, 18, 7577–7584. [Google Scholar] [CrossRef]
  40. Guo, G.Y.; Chen, R.Z.; Yan, K.; Li, Z.; Qian, L.; Xu, S.H.; Niu, X.G.; Chen, L. Large-Scale Indoor Localization Solution for Pervasive Smartphones Using Corrected Acoustic Signals and Data-Driven PDR. IEEE Internet Things J. 2023, 10, 15338–15349. [Google Scholar] [CrossRef]
  41. Song, X.Y.; Wang, M.; Qiu, H.B.; Luo, L.Y. Indoor Pedestrian Self-Positioning Based on Image Acoustic Source Impulse Using a Sensor-Rich Smartphone. Sensors 2018, 18, 4143. [Google Scholar] [CrossRef] [PubMed]
  42. Wang, M.; Duan, N.; Zhou, Z.; Zheng, F.; Qiu, H.B.; Li, X.P.; Zhang, G.L. Indoor PDR Positioning Assisted by Acoustic Source Localization, and Pedestrian Movement Behavior Recognition, Using a Dual-Microphone Smartphone. Wirel. Commun. Mob. Comput. 2021, 2021, 9981802. [Google Scholar] [CrossRef]
  43. Wei, B.; Gao, M.C.; Li, F.L.; Luo, C.W.; Wang, S.; Zhang, J. rWiFiSLAM: Effective WiFi Ranging Based SLAM System in Ambient Environments. IEEE Robot. Autom. Lett. 2024, 9, 5362–5369. [Google Scholar] [CrossRef]
  44. Wu, Q.; Li, Z.K.; Shao, K.F. Location Accuracy Indicator Enhanced Method Based on MFM/PDR Integration Using Kalman Filter for Indoor Positioning. IEEE Sens. J. 2024, 24, 4831–4840. [Google Scholar] [CrossRef]
  45. Naheem, K.; Kim, M.S. A Low-Cost Foot-Placed UWB and IMU Fusion-Based Indoor Pedestrian Tracking System for IoT Applications. Sensors 2022, 22, 8160. [Google Scholar] [CrossRef]
  46. Jin, Z.; Li, Y.J.; Yang, Z.; Zhang, Y.F.; Cheng, Z. Real-Time Indoor Positioning Based on BLE Beacons and Pedestrian Dead Reckoning for Smartphones. Appl. Sci. 2023, 13, 4415. [Google Scholar] [CrossRef]
  47. Wu, J.; Zhu, M.H.; Xiao, B.; Qiu, Y.Z. The Improved Fingerprint-Based Indoor Localization with RFID/PDR/MM Technologies. In Proceedings of the 24th IEEE International Conference on Parallel and Distributed Systems (ICPADS), Singapore, 11–13 December 2018; pp. 878–885. [Google Scholar]
  48. Martinelli, A.; Gao, H.; Groves, P.D.; Morosi, S. Probabilistic Context-Aware Step Length Estimation for Pedestrian Dead Reckoning. IEEE Sens. J. 2018, 18, 1600–1611. [Google Scholar] [CrossRef]
  49. Kuipers, J.B. Quaternions and Rotation Sequences—A Primer with Applications to Orbits, Aerospace and Virtual Reality; Princeton University Press: Princeton, NJ, USA, 2002; p. 400. [Google Scholar]
  50. Nguyen, V.-H.; Do, T.C.; Ahn, K.-K. Implementing PSO-LSTM-GRU Hybrid Neural Networks for Enhanced Control and Energy Efficiency of Excavator Cylinder Displacement. Mathematics 2024, 12, 3185. [Google Scholar] [CrossRef]
  51. Yan, S.; Wu, C.; Deng, H.; Luo, X.; Ji, Y.; Xiao, J. A Low-Cost and Efficient Indoor Fusion Localization Method. Sensors 2022, 22, 5505. [Google Scholar] [CrossRef]
  52. Yan, S.Q.; Wu, C.P.; Luo, X.A.; Ji, Y.F.; Xiao, J.M. Multi-Information Fusion Indoor Localization Using Smartphones. Appl. Sci. 2023, 13, 3270. [Google Scholar] [CrossRef]
Figure 1. Framework of proposed MPR-IPDR-CT method.
Ijgi 14 00246 g001
Figure 2. Structure of multi-pattern recognition model.
Ijgi 14 00246 g002
Figure 3. The network model of KELM.
Ijgi 14 00246 g003
Figure 4. The recognition results of six motion patterns: (a) 24 m experimental path; (b) 97.2 m experimental path.
Ijgi 14 00246 g004
Figure 5. Framework of the double adaptive threshold gait detection method.
Ijgi 14 00246 g005
Figure 6. Waveforms of triaxial acceleration data for different mobile phone attitudes: (a) reading mode, (b) pocket mode, (c) swing mode, and (d) telephone mode.
Ijgi 14 00246 g006
Figure 7. Schematic of experimental scenes: (a) scene 1; (b) scene 2.
Ijgi 14 00246 g007
Figure 8. Recognition accuracy of SVM, RF, ELM, GWO-ELM, PSO-LSTM-GRU, and PCA-GWO-ELM models in scene 1 when using different devices: (a) Vivo Y93s smartphone in scene 1; (b) Mate60 Pro smartphone in scene 1.
Ijgi 14 00246 g008
Figure 9. Recognition accuracy of SVM, RF, ELM, GWO-ELM, PSO-LSTM-GRU, and PCA-GWO-ELM models in scene 2 when using different devices: (a) Vivo Y93s smartphone in scene 2; (b) Mate60 Pro smartphone in scene 2.
Ijgi 14 00246 g009
Figure 10. Mean positioning errors of six motion patterns using PDR, Yan+ 2022 [51], and MPR-IPDR methods: (a) using Vivo Y93s in scene 1, (b) using Vivo Y93s in scene 2, (c) using Mate60 Pro in scene 1, (d) and using Mate60 Pro in scene 2.
Ijgi 14 00246 g010
Figure 11. The CDF of the positioning error among the PDR, MPR-PDR, Yan+ 2023 [52], and the MPR-IPDR-CT method with different motions in the first scene: (a) walking and reading, (b) walking and telephoning, (c) walking and swinging, (d) walking and pocketing, (e) jogging and telephoning, and (f) jogging and pocketing.
Ijgi 14 00246 g011
Figure 12. The CDF of the positioning error among the PDR, MPR-PDR, Yan+ 2023 [52], and the MPR-IPDR-CT methods with different motions in the second scene: (a) walking and reading, (b) walking and telephoning, (c) walking and swinging, (d) walking and pocketing, (e) jogging and telephoning, (f) and jogging and pocketing.
Ijgi 14 00246 g012
Table 1. Average recognition accuracies of SVM, RF, ELM, GWO-ELM, PSO-LSTM-GRU, and PCA-GWO-ELM models in scene 1 under two different devices.
DeviceModelRecognition Accuracy (%)
Vivo Y93s (scene 1)SVM87.96
RF90.54
ELM92.28
GWO-ELM94.34
PSO-LSTM-GRU95.50
PCA-GWO-KELM97.63
Mate60 Pro (scene 1)SVM92.39
RF93.52
ELM94.34
GWO-ELM95.27
PSO-LSTM-GRU97.05
PCA-GWO-KELM99.07
Table 2. Average recognition accuracies of SVM, RF, ELM, GWO-ELM, PSO-LSTM-GRU, and PCA-GWO-ELM models in scene 2 under two different devices.
DeviceModelRecognition accuracy (%)
Vivo Y93s (scene 2)SVM92.08
RF94.69
ELM95.52
GWO-ELM96.15
PSO-LSTM-GRU97.10
PCA-GWO-KELM98.33
Mate60 Pro (scene 2)SVM84.06
RF94.79
ELM94.38
GWO-ELM95.63
PSO-LSTM-GRU97.20
PCA-GWO-KELM99.27
Table 3. Pattern recognition accuracy of the SVM, RF, ELM, GWO-ELM, PSO-LSTM-GRU, and PCA-GWO-KELM models for 5 tests (%).
Model12345
SVM87.9687.9687.9687.9687.96
RF92.6789.7188.9991.6786.93
ELM92.9095.1690.8493.8388.89
GWO-ELM95.1696.8194.2495.0694.75
PSO-LSTM-GRU96.2296.7595.6096.3496.53
PCA-GWO-KELM97.6397.5397.6397.6397.63
Table 4. Computational complexity of SVM, RF, ELM, GWO-ELM, PSO-LSTM-GRU, and PCA-GWO-KELM for different scenes.
DeviceModelTime Consumption(s)
Scene 1SVM1.20
RF3.98
ELM1.28
GWO-ELM10.15
PSO-LSTM-GRU32.03
PCA-GWO-KELM25.04
Scene 2SVM1.25
RF2.37
ELM1.23
GWO-ELM10.59
PSO-LSTM-GRU45.82
PCA-GWO-KELM24.56
Table 5. Step detection results of different devices in different scenes (%).
DeviceWRWTWSWPJTJP
Vivo Y93s (scene 1)10099.3898.7799.3898.7798.81
Mate60 Pro (scene 1)10010099.3899.3810098.77
Vivo Y93s (scene 2)98.7510098.7599.3899.3898.12
Mate60 Pro (scene 2)10010098.7510010099.75
Table 6. Localization error of the PDR, MPR-PDR, Yan+ 2023 [52], and MPR-IPDR-CT methods in the first scene (m).
Motion ModeMethodMean ErrorRMS Error
WRPDR 2.84613.4820
MPR-IPDR 1.25511.3299
Yan+ 2023 [52] 0.23960.5163
MPR-IPDR-CT0.13680.2974
WTPDR 2.89893.6168
MPR-IPDR0.82520.8980
Yan+ 2023 [52] 0.29580.6246
MPR-IPDR-CT0.23710.3384
WSPDR 5.45435.6563
MPR-IPDR 2.98371.3204
Yan+ 2023 [52] 0.62180.8139
MPR-IPDR-CT0.31550.4669
WPPDR 4.68725.5608
MPR-IPDR 1.07451.1664
Yan+ 2023 [52] 0.33590.6818
MPR-IPDR-CT0.16310.3011
JTPDR 5.25115.8661
MPR-IPDR 1.76312.0130
Yan+ 2023 [52] 0.48851.4189
MPR-IPDR-CT0.24090.4277
JPPDR 6.85407.6562
MPR-IPDR 0.94461.4565
Yan+ 2023 [52] 0.65770.8410
MPR-IPDR-CT0.34610.4278
Table 7. Localization error of the PDR, MPR-PDR, Yan+ 2023 [52], and MPR-IPDR-CT methods in the second scene (m).
Motion ModeModelMean ErrorRMS Error
WRPDR 3.92754.3837
MPR-IPDR 1.64381.8016
Yan+ 2023 [52] 0.39671.6046
MPR-IPDR-CT0.20370.4058
WTPDR 1.20265.2216
MPR-IPDR 0.96111.3696
Yan+ 2023 [52] 0.23650.7503
MPR-IPDR-CT0.19600.3352
WSPDR 4.93535.6657
MPR-IPDR 1.41641.7093
Yan+ 2023 [52] 0.63630.7008
MPR-IPDR-CT0.20930.3256
WPPDR 5.76256.3342
MPR-IPDR 1.99222.1354
Yan+ 2023 [52] 0.67830.7749
MPR-IPDR-CT0.22640.4797
JTPDR 5.98816.7053
MPR-IPDR 1.44771.5719
Yan+ 2023 [52] 0.69990.8838
MPR-IPDR-CT0.33700.5326
JPPDR 5.50645.7866
MPR-IPDR 1.48481.7541
Yan+ 2023 [52] 0.69270.8693
MPR-IPDR-CT0.26240.4737
Disclaimer/Publisher’s Note: The statements, opinions and data contained in all publications are solely those of the individual author(s) and contributor(s) and not of MDPI and/or the editor(s). MDPI and/or the editor(s) disclaim responsibility for any injury to people or property resulting from any ideas, methods, instructions or products referred to in the content.

