1. Introduction
Urban expansion is closely associated with the United Nation’s Sustainable Development Goals (SDGs) and affects the sustainable development of society and the environment [
1,
2]. Urban expansion leads to a dramatic loss of natural land [
3,
4], influences the carbon balance [
5,
6], is associated with urban morphology [
7,
8], increases the pressure to manage urban thermal environments [
9,
10], etc. As one of the countries that has experienced the most rapid urbanization, China has expanded urban land, attracting widespread attention [
11,
12]. Due to the spatiotemporal heterogeneity of urban expansion, adaptive policies need to be provided in a timely manner to promote high-quality urban development. China’s urban development strategy has gone through different development stages, from “strictly controlling the scale of large cities and rationally developing medium-sized and small cities” to “coordinated development of large, medium, and small cities and small towns” and then to “decelerating urbanization and improving quality development”. China has proposed regional integrated development policies based on the characteristics of different regions, such as the rise of the central region, the development of the western region, and the revitalization of the northeast region to promote urbanization in central and western China [
13]. The temporal and spatial pattern analysis of urban expansion can provide a reference for the formulation of relevant policies.
Many studies have analyzed the spatiotemporal pattern of urban expansion in China. For example, Wu et al. [
14] analyzed the urban expansion area and the expansion rate in China as a whole and in its east, central, west, and northeast regions from 2000 to 2015, and they found obvious differences among the four regions. Hu et al. [
15] analyzed the spatiotemporal characteristics of urban expansion in 23 urban agglomerations in China and found that their urban area increased by a total of 280.9%, with the growth area and growth rate of the eastern coastal urban agglomerations being significantly higher than those of the urban agglomerations in the inland regions. Zhao et al. [
16] analyzed the urban expansion of 32 large cities in China from 1978 to 2010 and found obvious differences in the growth rate of urban areas between cities, with the size of the city being negatively correlated with the growth rate. Liu et al. [
17] analyzed urban expansion in the Min-Delta region and found that it increased by 2.26 times between 1995 and 2015, although the spatial trajectories of urban expansion were anisotropic. These studies analyzed the spatiotemporal characteristics of urban expansion at different scales and found significant differences in urban expansion between different regions or cities; however, whether the future trends of these differences will converge needs to be tested further.
Convergence in mathematics refers to the tendency of a variable sequence to a certain value along a path. This concept was used in the framework of neoclassical economics to test whether economic development in different regions tends to the same level [
18]. Many researchers further developed the approaches and proposed σ-convergence [
19], absolute β-convergence [
19,
20], conditional β-convergence [
20,
21], and club convergence [
22]. In fact, economic development is a manifestation of changes in multiple production factors. Many studies have applied the convergence test to innovation efficiency [
23], energy utilization efficiency [
24], and other aspects. There are also many related studies on urban land use. For example, Li et al. [
25] used σ-convergence and β-convergence to test the convergence of land expansion in 268 cities at or above the prefecture level in China from 2006 to 2019 and found that there was overall convergence and club convergence in the three regions of east, central, and west China. Zeng et al. [
26] analyzed the club convergence characteristics of urban expansion in the Beijing–Tianjin–Hebei region using β-convergence and found that significant convergence only exists in regions with low urban expansion or regions with low urban expansion surrounded by high urban expansion. Ge et al. [
27] analyzed the convergence of land use efficiency of cities in the Yangtze River Economic Belt and found that absolute β-convergence and conditional β-convergence exist in the entire Yangtze River Basin and the upper, middle, and lower reaches of the basin.
The existing studies have provided useful references for convergence analysis of urban expansion; however, the following shortcomings still exist: First, for research, most studies focus on regional scales, and research on the overall country scale (whole of China) is not comprehensive; for example, in-depth research on the test and identification of club convergence is lacking [
25]. Second, for research data, studies generally use a collection of multiple cross-sectional data rather than longitudinal time series data, which increases the uncertainty of the results. Third, for research methods, existing studies usually use the σ-convergence and β-convergence test methods; however, changes in σ can only explain differences in the research period and cannot provide information on the convergence trends; additionally, the negative β coefficient in the β-convergence test cannot adequately indicate the regional convergence [
28]. Furthermore, the club convergence test typically separates clubs by geographical location without objective and reasonable standards [
26], which may lead to contradictory conclusions [
28].
Therefore, this study applies the log t regression test developed by Phillips and Sul [
29,
30] to explore the evolution and convergence of urban expansion across 315 Chinese cities from 2000 to 2022. This method compensates for the limitations of previous studies by taking into consideration the time-varying variability among individuals. To prevent the bias introduced by artificial categorization, the clustering algorithm is utilized to find convergence clubs. Each convergence club’s evolution path is illustrated using relative transition path analysis. This study is intended to provide a new perspective on urban expansion convergence in China and offer empirical support and policy insights for investigating the coordinated development of urban expansion.
2. Materials and Methods
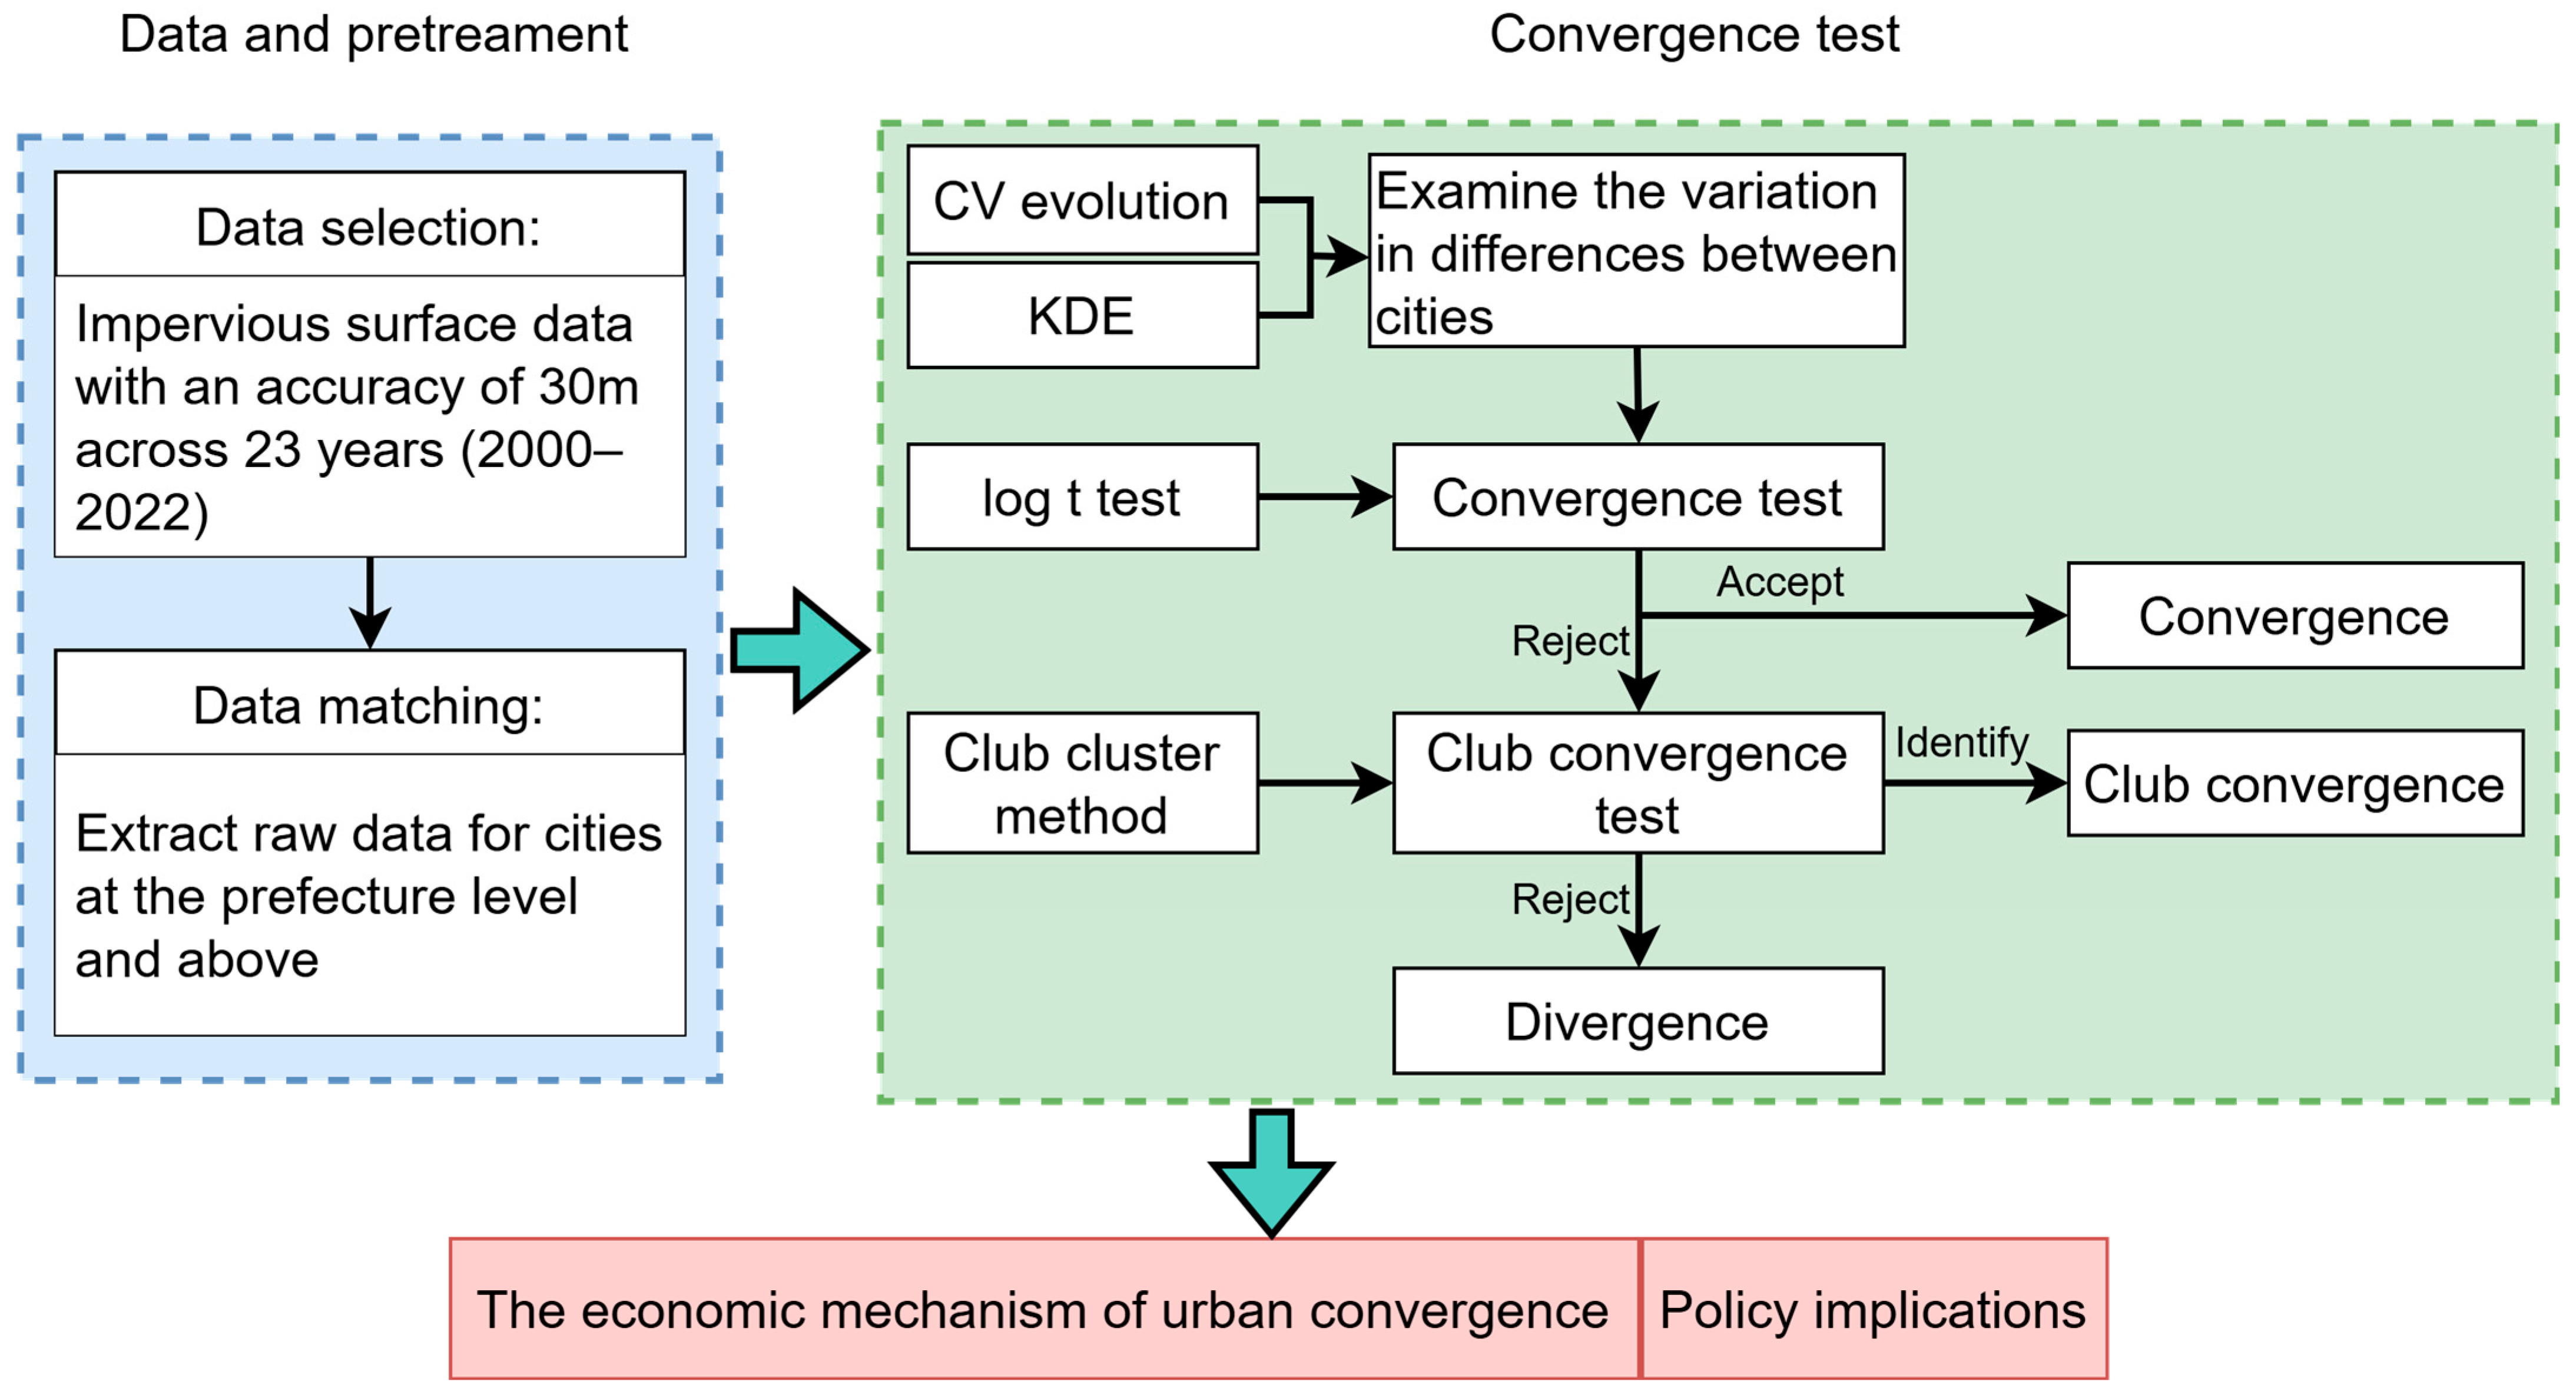
The analysis framework for urban expansion convergence is shown in
Figure 1. Firstly, the long time series dataset for urban expansion of cities at the prefecture level and above is prepared for testing convergence. Secondly, the coefficient of variation (CV) and kernel density estimation (KDE) are applied to explore the differences in variation in urban expansion across cities. The change in CV over time can measure the variation in urban expansion among cities, and KDE further indicates the differences in urban expansion by displaying the data distribution pattern across urban expansion. Finally, the log t regression test and the club cluster method are used to test the convergence of urban expansion based on the behavior of urban expansion in transition. Three transition patterns can be distinguished: convergence, divergence, and club convergence. Convergence indicates that all cities share a common steady state; divergence implies that cities with heterogeneous evolution paths do not tend to a single stable state, and club convergence suggests that all cities converge to multiple steady state equilibria [
29,
30].
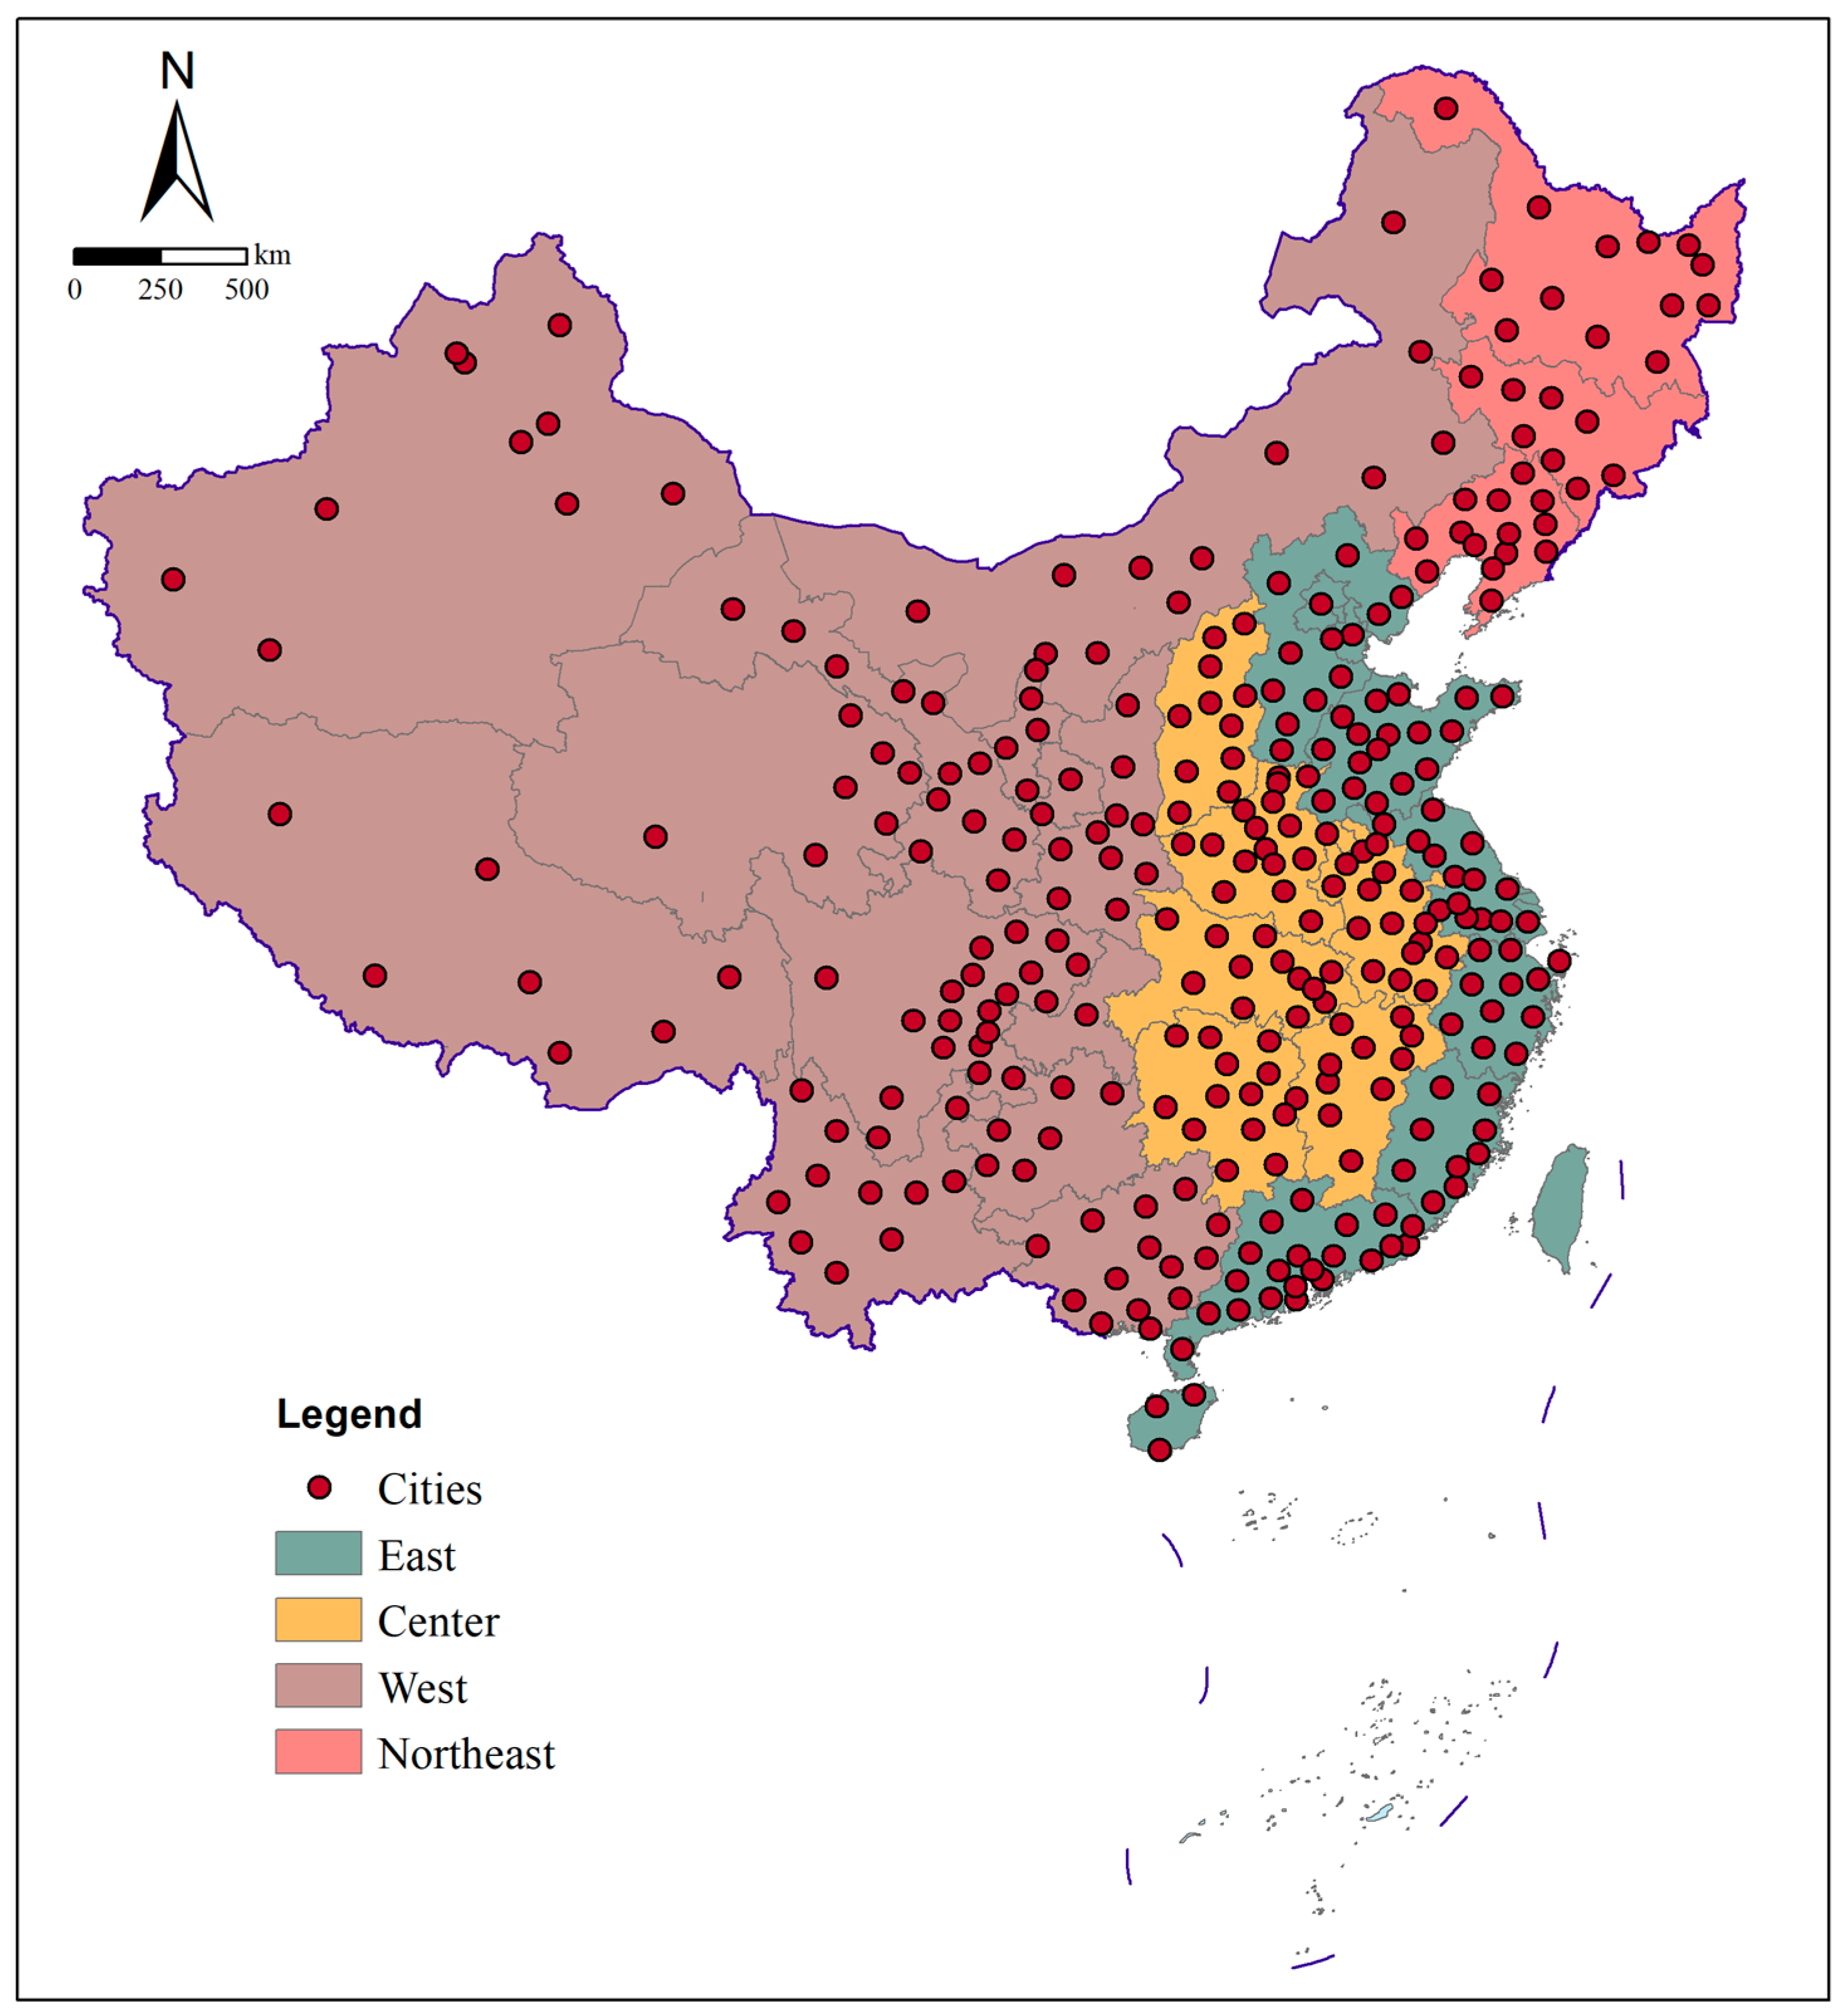
We examine the variations in urban expansion among cities and test convergence at national and regional scales. China is divided into four regions based on social and economic development: east, central, west, and northeast (
Figure 2). This division is an important basis on which China formulates regional development policies. In the regional development plan, China has clearly proposed the overall development strategy of “adhering to the promotion of the development of the Western region, revitalizing old industrial bases such as the Northeast, promoting the rise of the Central region, encouraging the Eastern region to accelerate development”.
These four regions have different social and economic development. The eastern region is the most developed region, with a high per capita GDP and an optimized industrial structure. It is located on the coast and is closely connected with the international market. The economy of the central region is developing rapidly, but it is still behind that of the eastern region. It is an important transportation hub and industrial base in China, connecting the east and the west, as well as the north and the south. The western region lags behind in economic development, but it is rich in resources. It is also an important channel and bridge between China and Southwest Asia, Central Asia, and Europe, and plays an important role in the construction of the “Belt and Road”. The northeast region was an important industrial base in China, with a strong economic foundation in the past; however, its economic growth has slowed down, and it has faced development difficulties. It is an important industrial base and a resource-based city concentration area.
2.1. Data
Per capita urban land is used as an indicator to investigate urban expansion convergence. The urban land area data come from the annual China land cover dataset (CLCD) created by Yang and Huang [
31], which was generated from Landsat imagery using a random forest classifier and the Google Earth Engine (GEE) platform. The dataset comprises many land cover types, including data on impervious surfaces in China collected annually from 1985 to 2022 at a resolution of 30 m. The study period between 2000 and 2022 is selected, and impervious surfaces data are extracted for cities at the prefecture level and above. The urban population was drawn from the China City Statistical Yearbook (2001–2023). The per capita urban areas of 315 cities from 2000 to 2022 are obtained; the numbers of cities included in the east, center, west, and northeast are 89, 80, 113, and 37, respectively. The cities’ distributions are shown in
Figure 2.
2.2. Coefficient of Variation
The coefficient of variation (CV) is used to measure the differences in urban expansion among cities using the following equation:
where
is the standard variance of urban expansion, and
is the mean value of urban expansion.
2.3. Kernel Density Estimation
Kernel density estimation (KDE) is a commonly used nonparametric statistical method for smoothing the probability density of one-dimensional or multi-dimensional data samples. In contrast to a histogram, KDE does not require the “bin width” to be divided in advance but generates a continuous and smooth density curve by placing a “kernel function” at each sample point and accumulating all kernel function values.
Kernel density estimation (KDE) is used to explore the evolution characteristics of urban expansion. If x
1, x
2, …, x
n are samples from an unknown distribution, KDE can be defined by the following equation:
where N is the total number of cities, d is bandwidth, x
i is the per capita urban area of the city i, and K(•) is the kernel function. Different kernel functions will give different estimated results. The Gaussian kernel function is chosen to estimate the probability density function. The bandwidth of KDE is automatically calculated by Silverman’s rule of thumb to balance smoothness and resolution.
KDE complements the shortcomings of the mean value and the CV index. The mean value of urban expansion only represents the overall situation, and the CV index can only measure the overall degree of dispersion in urban expansion. KDE shows the overall distribution pattern of urban expansion by displaying the left and right movements and the change in the height of the density peak. By comparing the movement and changes in the shape of the kernel density curve in different periods, it is possible to judge the transformation and data distribution of the urban expansion.
2.4. Convergence Test Methods
2.4.1. Common Methods for Convergence Test
The term “convergence” comes from the neoclassical economic growth theory, which is used to describe whether an indicator (such as per capita income, gross domestic product, etc.) of different economic entities (such as countries, regions, or cities) gradually tends to the same or stable range. If different economies gradually converge along similar evolutionary paths and demonstrate a persistent grouping phenomenon, it is referred to as club convergence.
Five test methods are usually used to examine convergence: cross-sectional regression, panel data regression, statistic index method, cointegration and unit root test, and log t test. The first and second regression methods are used to test β convergence [
20,
22,
32]. They investigate the relationship between the initial value and its growth rate. Convergence is confirmed if the relationship is a negative correlation; as a result, cities with low per capita urban areas have faster growth than cities with high per capita urban areas. The σ convergence is frequently tested using statistical indices [
33], such as the coefficient of variation (
CV), the Theil index, and the Gini index. The fourth method, the cointegration and unit root test, is used to examine stochastic convergence by testing for the existence of a shared steady trend between two cities using time series data [
34]. The fifth, log t test regression, has advantages that other methods do not have. It considers individual heterogeneity and provides a spectrum of transitional behavior from divergence to club convergence and overall convergence [
29,
30]. Therefore, log t test regression is applied to explore the convergence of urban expansion in China.
2.4.2. The Log t Regression
The log t regression accommodates the heterogeneity among the 315 cities and allows a wide range of possible time paths without the assumption of trend stationarity in other time series methodologies. Hence, we can trace any city’s transition path of urban expansion toward the steady-state level, enabling us to identify different types of transition behaviors. Following Phillips and Sul [
29,
30], the data should be filtered for the cycle components and spatial effects using the hp filter method and the Gi Statistic before using log t regression.
It should be noted that although urban planning and land supply policies have an important impact on urban expansion, the log t convergence framework does not require complete market equilibrium conditions. Its core lies in comparing the relative evolution paths between different entities [
29,
30]. A number of empirical studies have shown that convergence analysis using log t regression is effective [
35]. For example, Liu et al. [
36] applied log t regression to identify the convergence club of per capita industrial pollutant emissions in China. Cialani and Mortazavi [
37] identified the convergence clubs of CO
2 emissions among 28 European countries based on log t regression. Therefore, the log t regression can be used to examine the convergence of urban expansion in China, even though it is affected by urban planning and policies.
- (1)
Time-varying factor model
The panel data of per capita urban land, X
it, are decomposed as
where g
it denotes systematic components such as permanent common components, and a
it represents transitory components. The equation has no assumptions and can present many time-varying processes, including linear, nonlinear, stationary, and nonstationary processes. The equation can be transformed to identify the common components in the panel, namely,
where
represents a common trend in the panel data and
is the loading coefficient and measures the idiosyncratic distance between
and
.
- (2)
Log t regression test
Phillips and Sul [
25] assume the loading coefficient
as follows:
The null and alternative hypotheses can be characterized as follows:
The hypothesis can be tested using log t regression:
It is recommended that
be 0.3 when T is less than 50. The estimated
converges to 2a. The null hypothesis can be tested using a one-sided t-test. If
is less than −1.65, the convergence hypothesis is rejected at the 5% level.
- (3)
Club clustering method
When convergence in the whole panel is rejected, convergence in subgroups of the panel should be examined. Phillips and Sul developed a data-driven algorithm, and the steps are summarized as follows [
29]:
Step 1: Sort per capita urban land. Sort the cities in decreasing order according to the per capita urban land use in the previous year.
Step 2: Form a core group. Select the first k cities in the sorted panel data to form a core group G
k (where 2 ≤ k < N). Perform the log t regression on this core group and calculate the t-statistic, t
k. The core group’s size k* is subject to the following conditions:
Step 3: Sieve the club members. Add cities that are not assigned to Gk one at a time to Gk and run the t-test. If the t-statistic is greater than the criterion c*, the city can be included in the initial convergence club.
Step 4: Stop the rule. Perform the log t regression on the group formed by the remaining cities that are not in the initial convergence club. If , this group is convergent; otherwise, repeat steps 2 and 3 to identify smaller convergence groups.
4. Discussion
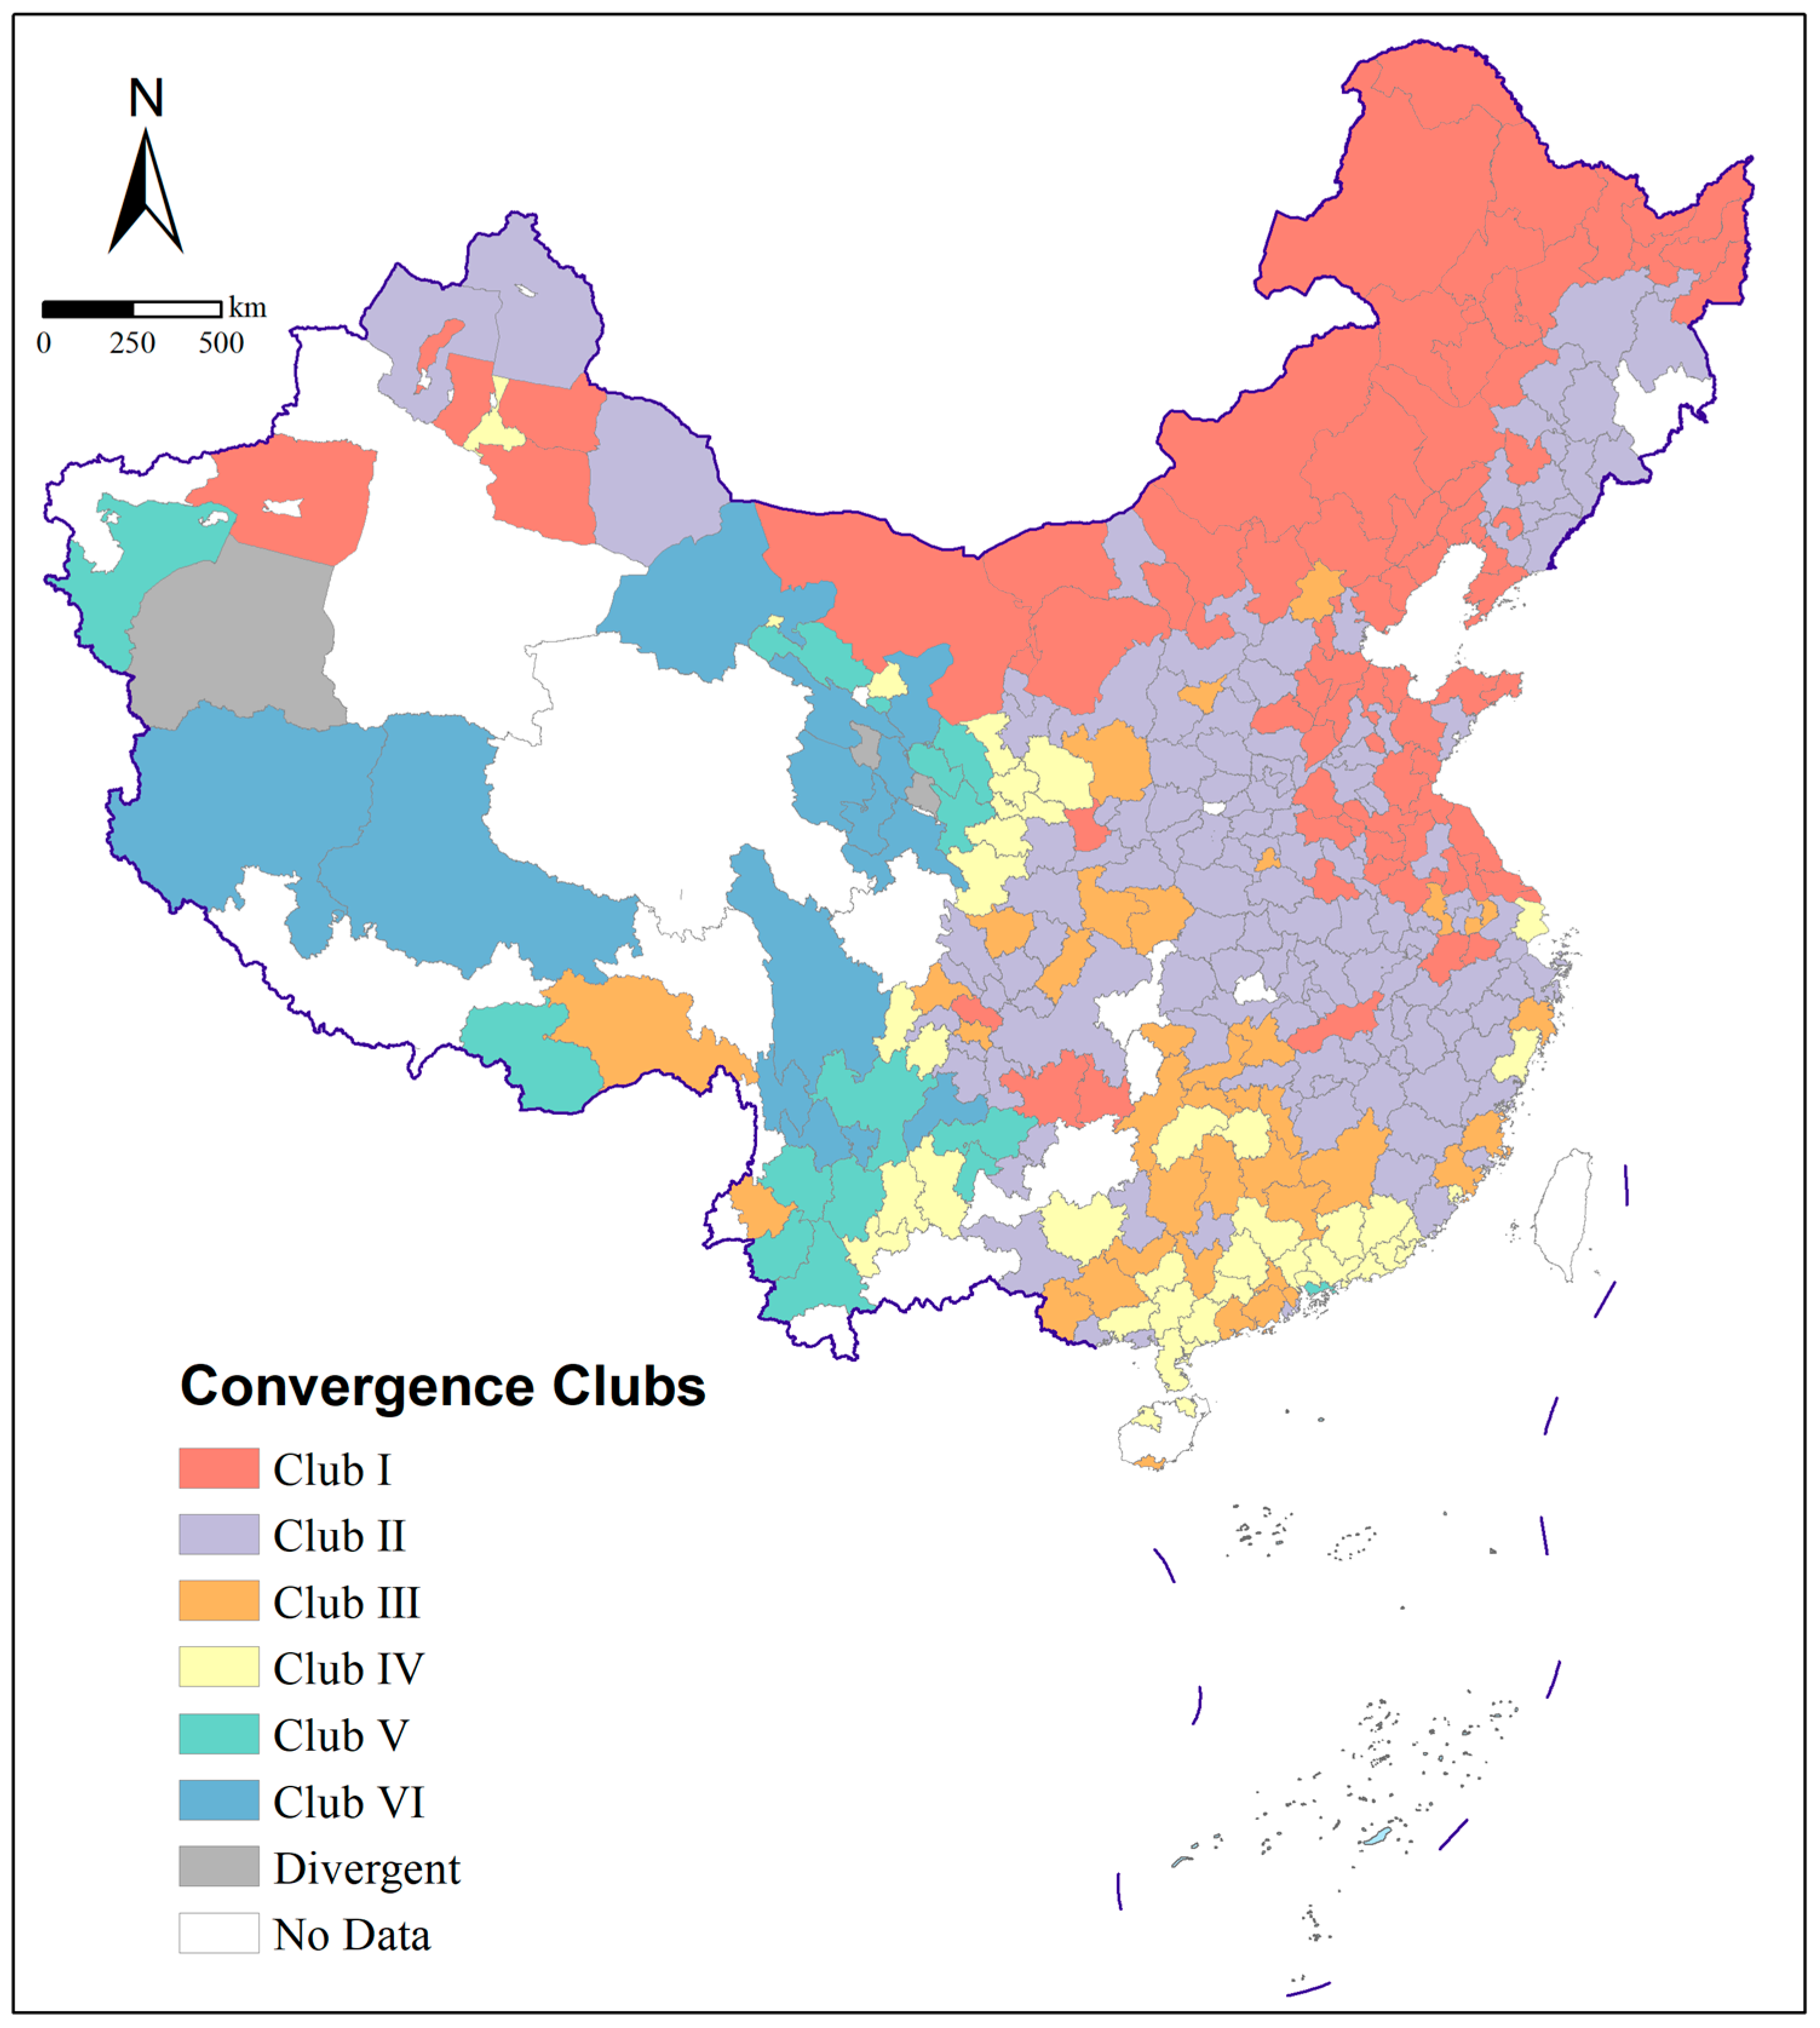
This study examined urban expansion trends in China and investigated the convergence of urban expansion across 315 cities at the prefecture level. Based on the findings, per capita urban land increased by 1.58 times on a national scale from 2000 to 2022. The northeast region had the highest per capita urban land, while the western region had the lowest over the 23 years. Although the convergence of urban expansion on national and regional scales is rejected, six club convergences are identified for the 315 cities. The clubs tend to different steady-state equilibria, and the cities within the clubs exhibit spatial aggregation. These findings indicate that the evolution of urban expansion in China is still in multiple equilibria, and that unbalanced urban expansion has stabilized.
4.1. Regional Variations in Urban Land Expansion in China
Urban land is still expanding in China, with regional variations. This result is in line with those of earlier research. For instance, Wu et al. [
14] found that the overall urban expansion in China and expansion in the eastern region had the slowest expansion rate and the largest expansion area. Wang et al. [
38] found that urban land was expanding quickly, with the eastern region having the quickest rate of expansion and the largest expansion area. The differences in the expansion rate or area among the studies may be caused by the indicators used to measure urban expansion. Wu and Wang used total urban area and urban expansion rate, whereas per capita urban land was applied here to minimize the scale effect. Notwithstanding the variations, these studies all suggest ongoing urban expansion in China and different regional trends in urban expansion. Moreover, this study reports that, at a national level, the gaps between different cities are narrowing, as measured using the CV index. This result is in line with the findings of Jing et al. [
39], who measured the trends in the gaps using the Gini index.
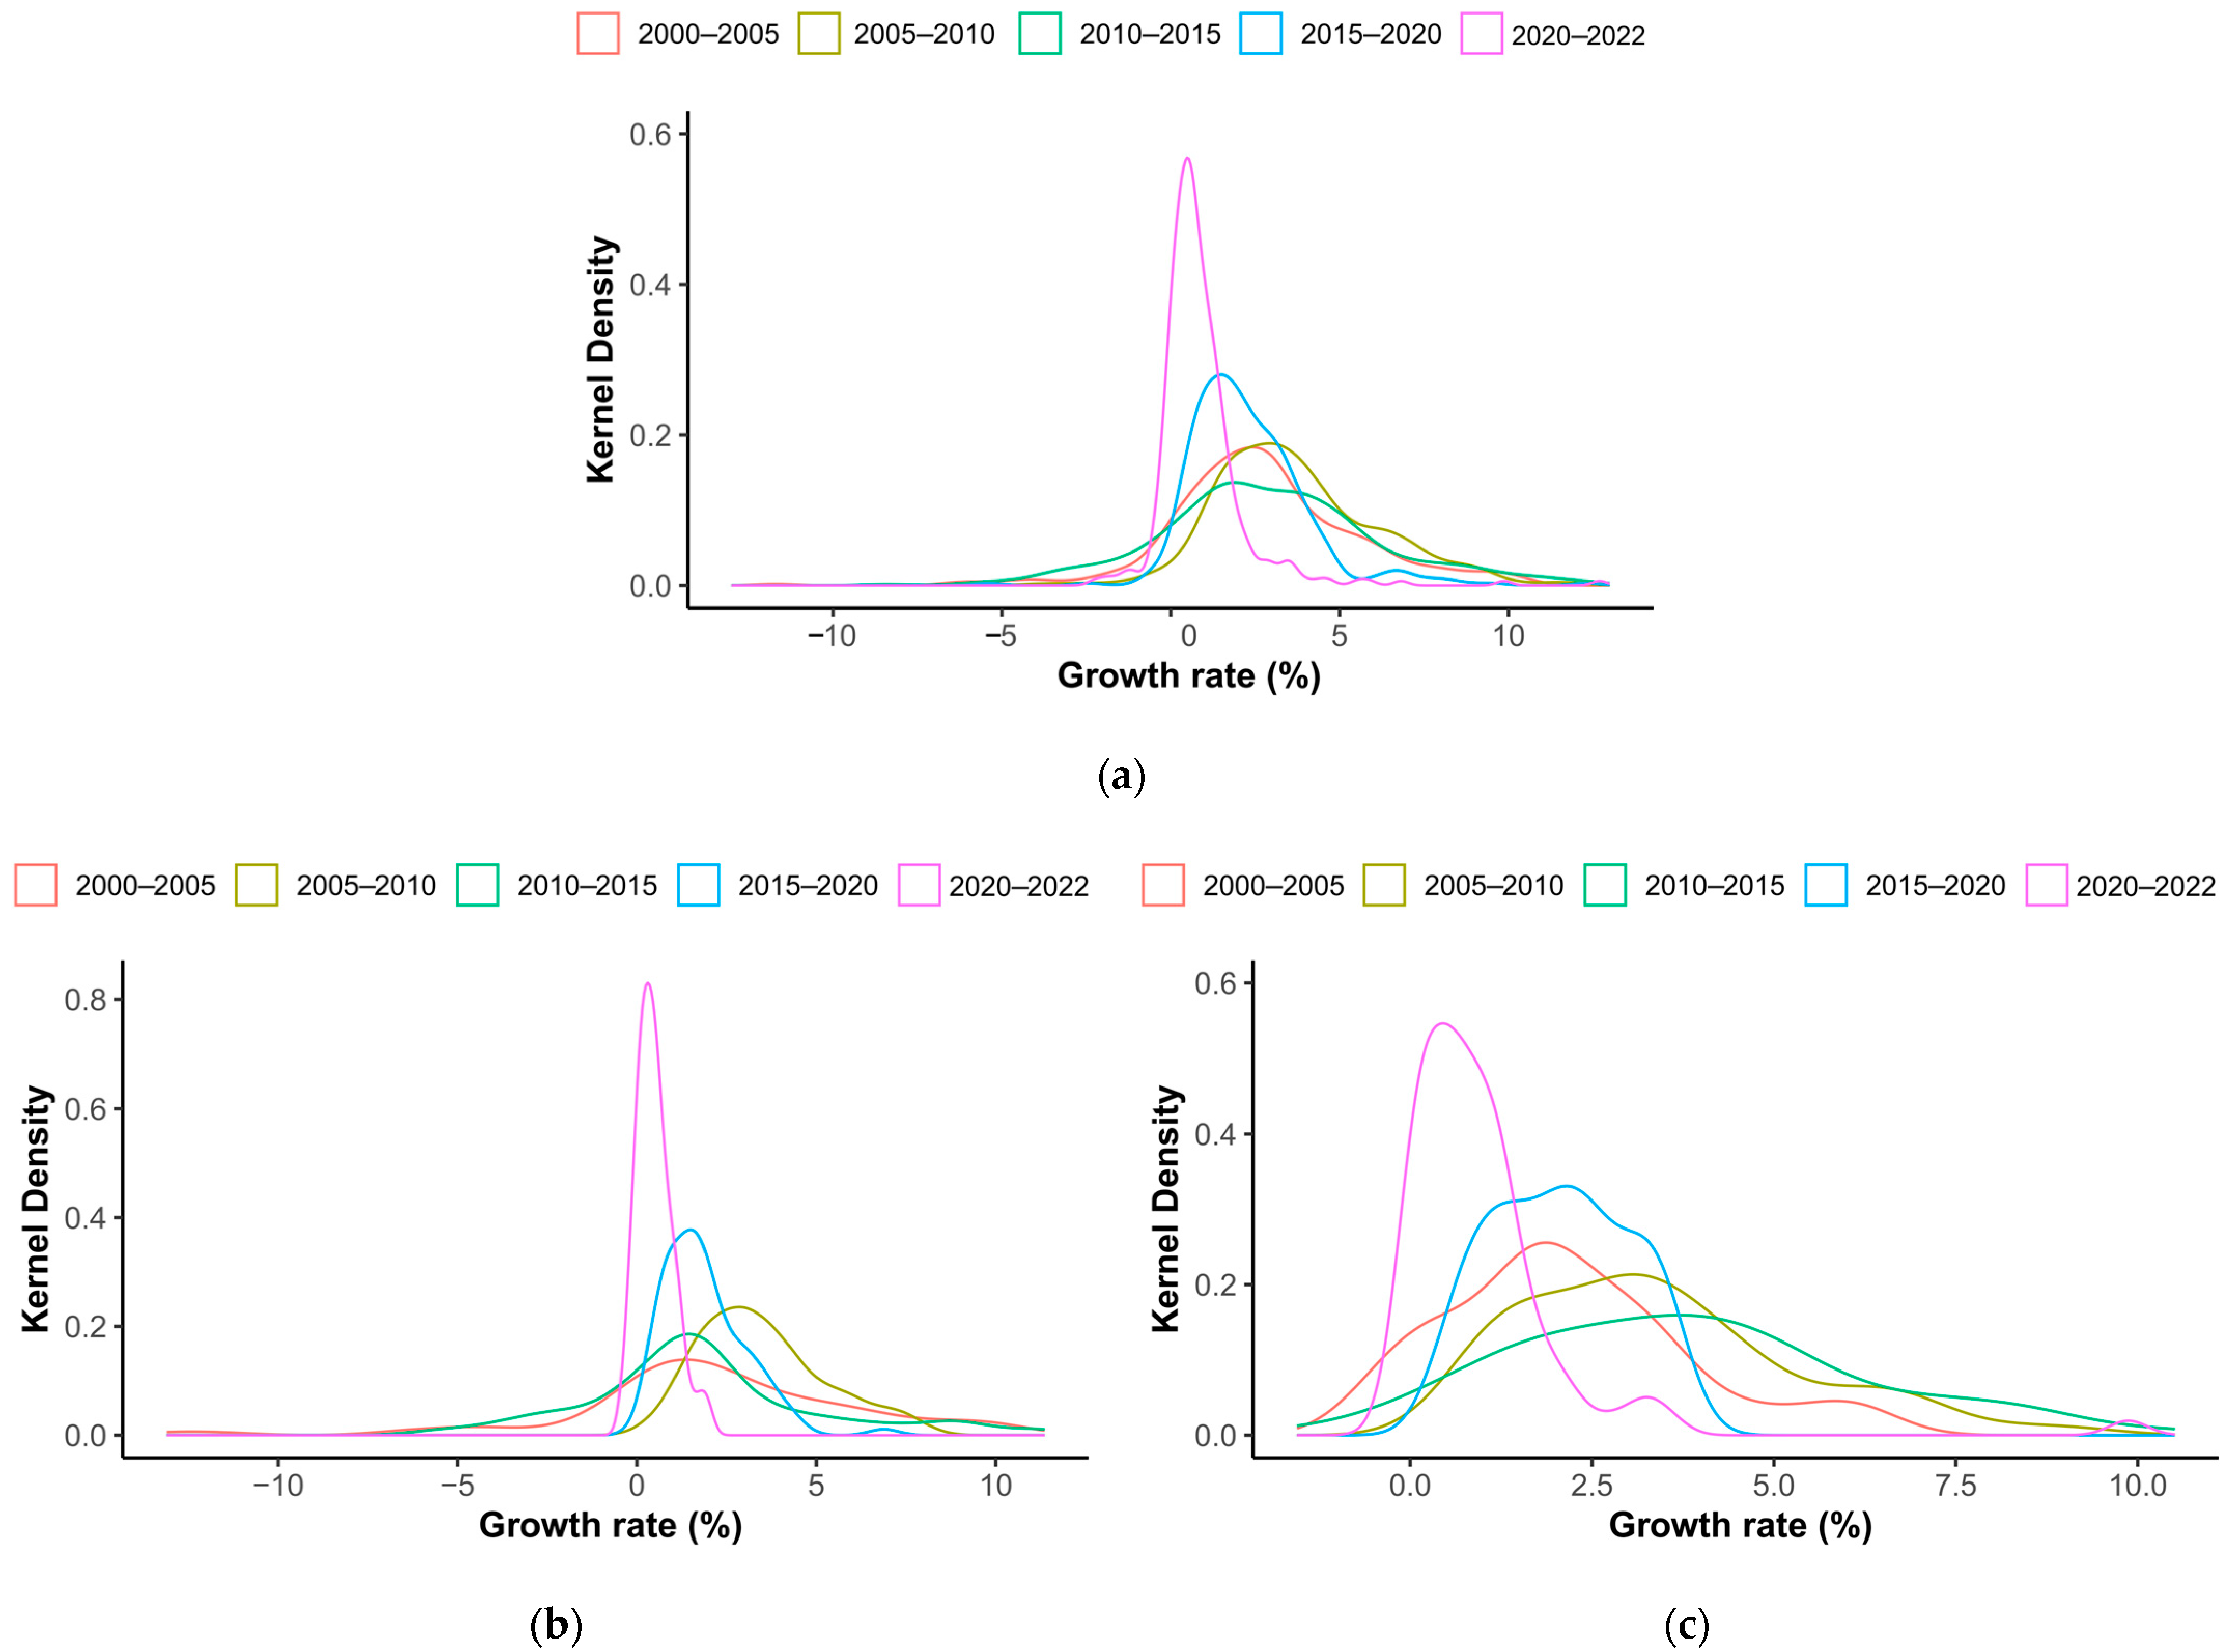
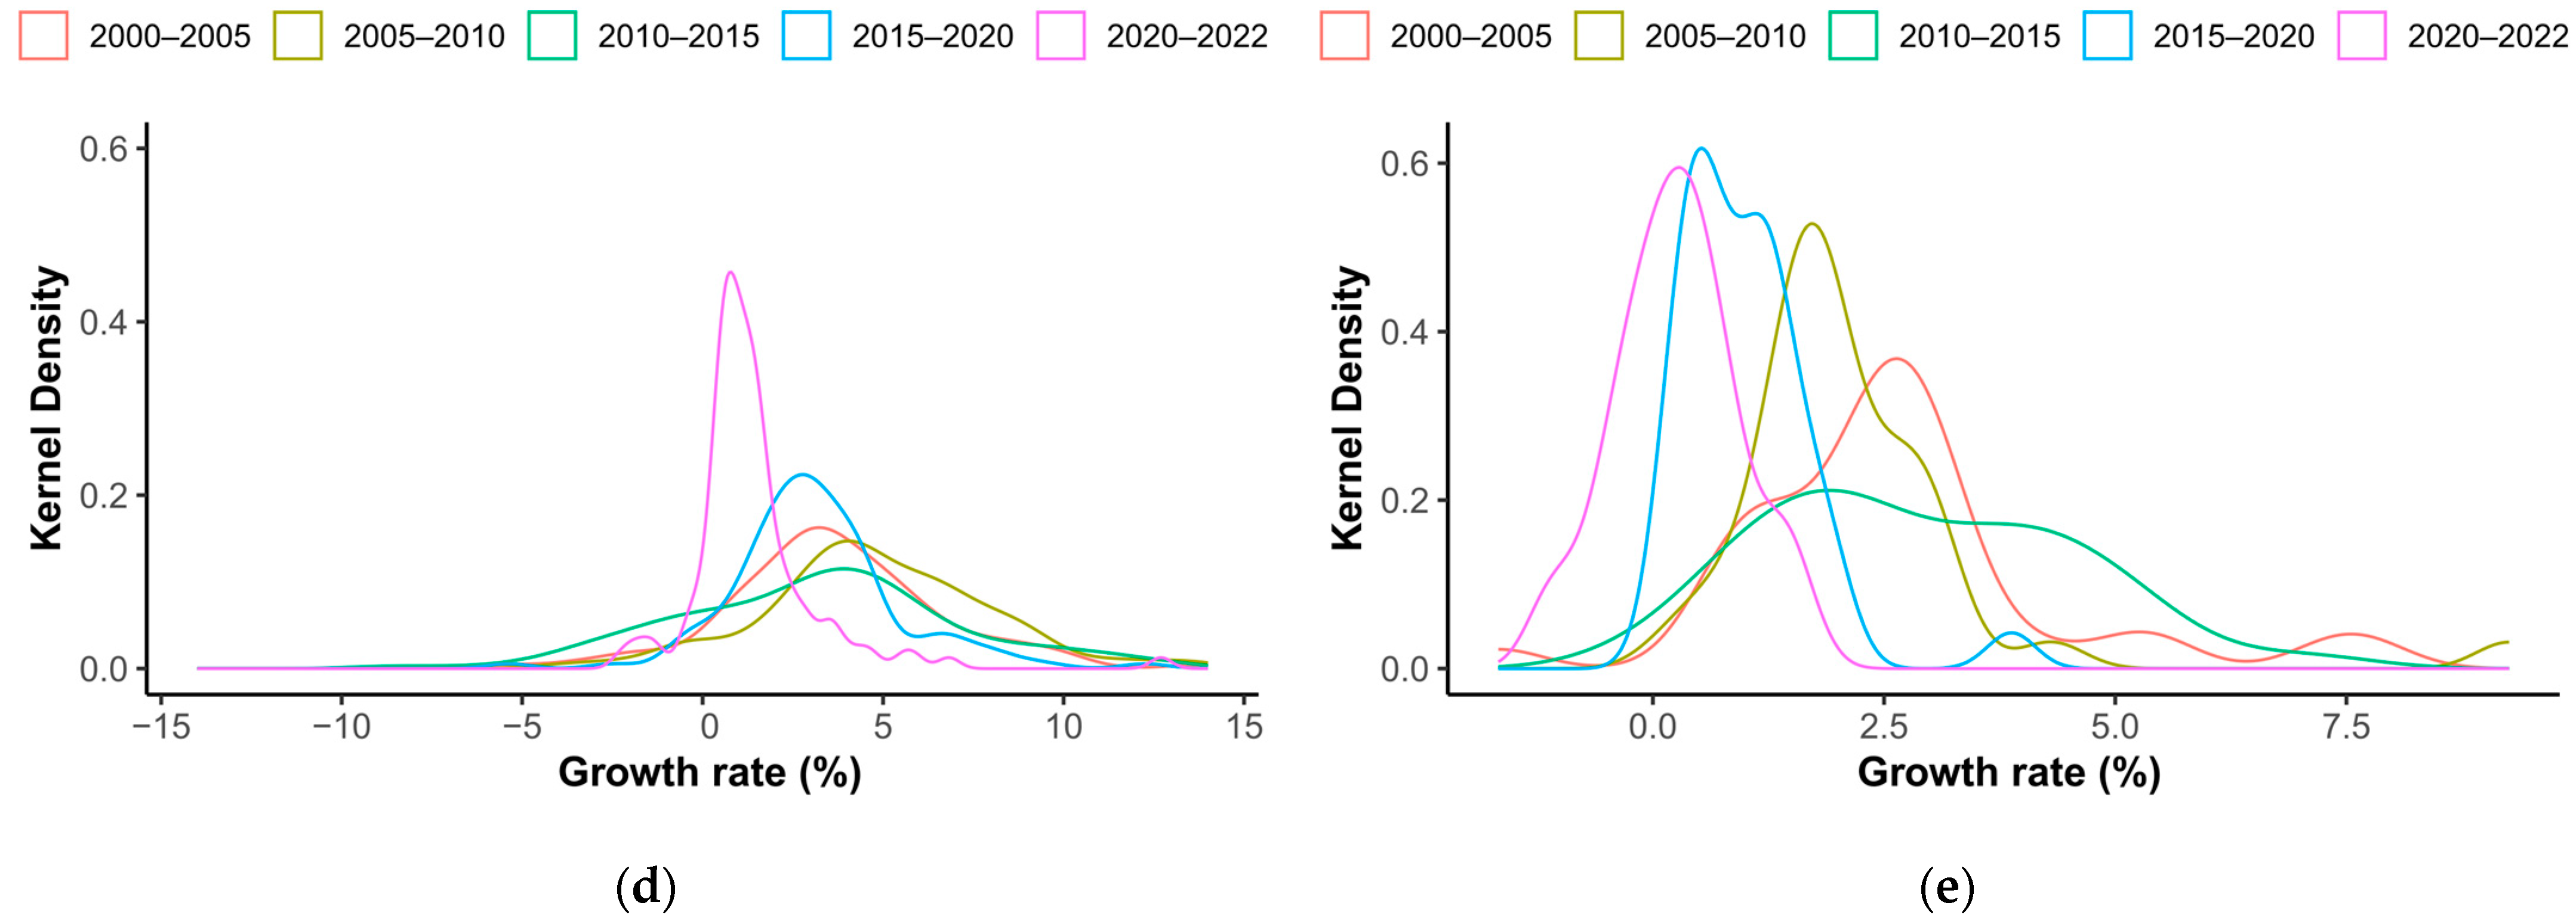
Urban expansion in different regions jointly shapes the characteristics of China’s overall urban expansion path. The eastern region, with the highest proportion of total population and built-up area, has a significant influence on national urban expansion. This explains the consistency in the peak shift and height change in the KDE curve between the national scale and the eastern region (
Figure 4). The western region covers a vast geographic area and includes the largest number of urban samples. Many cities in the west had relatively small built-up areas in the initial year but experienced rapid expansion. These contribute to the national KDE distribution, particularly to the right tail of the KDE curve. Urban expansion in the central region is moderate, while the northeastern region has a smaller number of urban samples. These two regions exert a “fine-tuning” effect on the peak position and width of the national KDE curve. In summary, the eastern region strongly influences the national urban expansion trend through its scale, whereas the extreme growth rates and large number of cities in the western region shape the right-tail characteristics of the national KDE curve. The central and northeastern regions play a supplementary role. It is the superposition of these regional dynamics that defines the typical evolutionary pattern of urban expansion in China.
To enhance comprehension of spatiotemporal urban expansion, we examined urban expansion in other countries. Urban expansion in India initially grew fast and then slowed down, with the growth rate of small and medium-sized cities surpassing that of large cities since 2010, indicating a narrowing of the gap in urban expansion [
40]. This tendency is similar to that observed in China, but is not universal. For example, urban expansion in Vietnam has occurred mainly in the Mekong Delta in the south and the Red River Delta in the north for a long time [
41]. The urban expansion area of large cities in Africa is much larger than that of small cities, and the expansion speed of the two is much closer [
42]. The variation in spatiotemporal urban expansion is usually associated with social and economic development [
43], and whether there is convergence of urban expansion within these countries or regions should be further tested using specialized methods.
4.2. Why Does Urban Expansion Converge?
This study examined the convergence of urban expansion in China. The convergence assumption is based on the diminishing marginal utility of urban expansion and the diffusion effect of capital and production. According to neoclassical theory and empirical studies, urban land, one of the three key production factors, expands in lockstep with economic development.
In the early stages of development, cities expand from other land types around the edges, which has more benefits than urban interior renovation. The conflict between urban land demand and overall land area restrictions increases with economic development, driving up land prices while diminishing the benefits of urban expansion. The declining marginal utility encourages land use efficiency improvement and slows down urban expansion.
Developed cities take the lead in upgrading industrial structures, reducing reliance on land and shifting the primary driver from production to capital [
44]. Developing cities benefit from the production diffusion of developed cities; thus, the hierarchical structure of urban development is formed [
45,
46]. The laggards keep up with the leaders in their shared development path of urban expansion, and all cities converge on a steady stage. Neoclassical schools treat regional diversity as a transitory process.
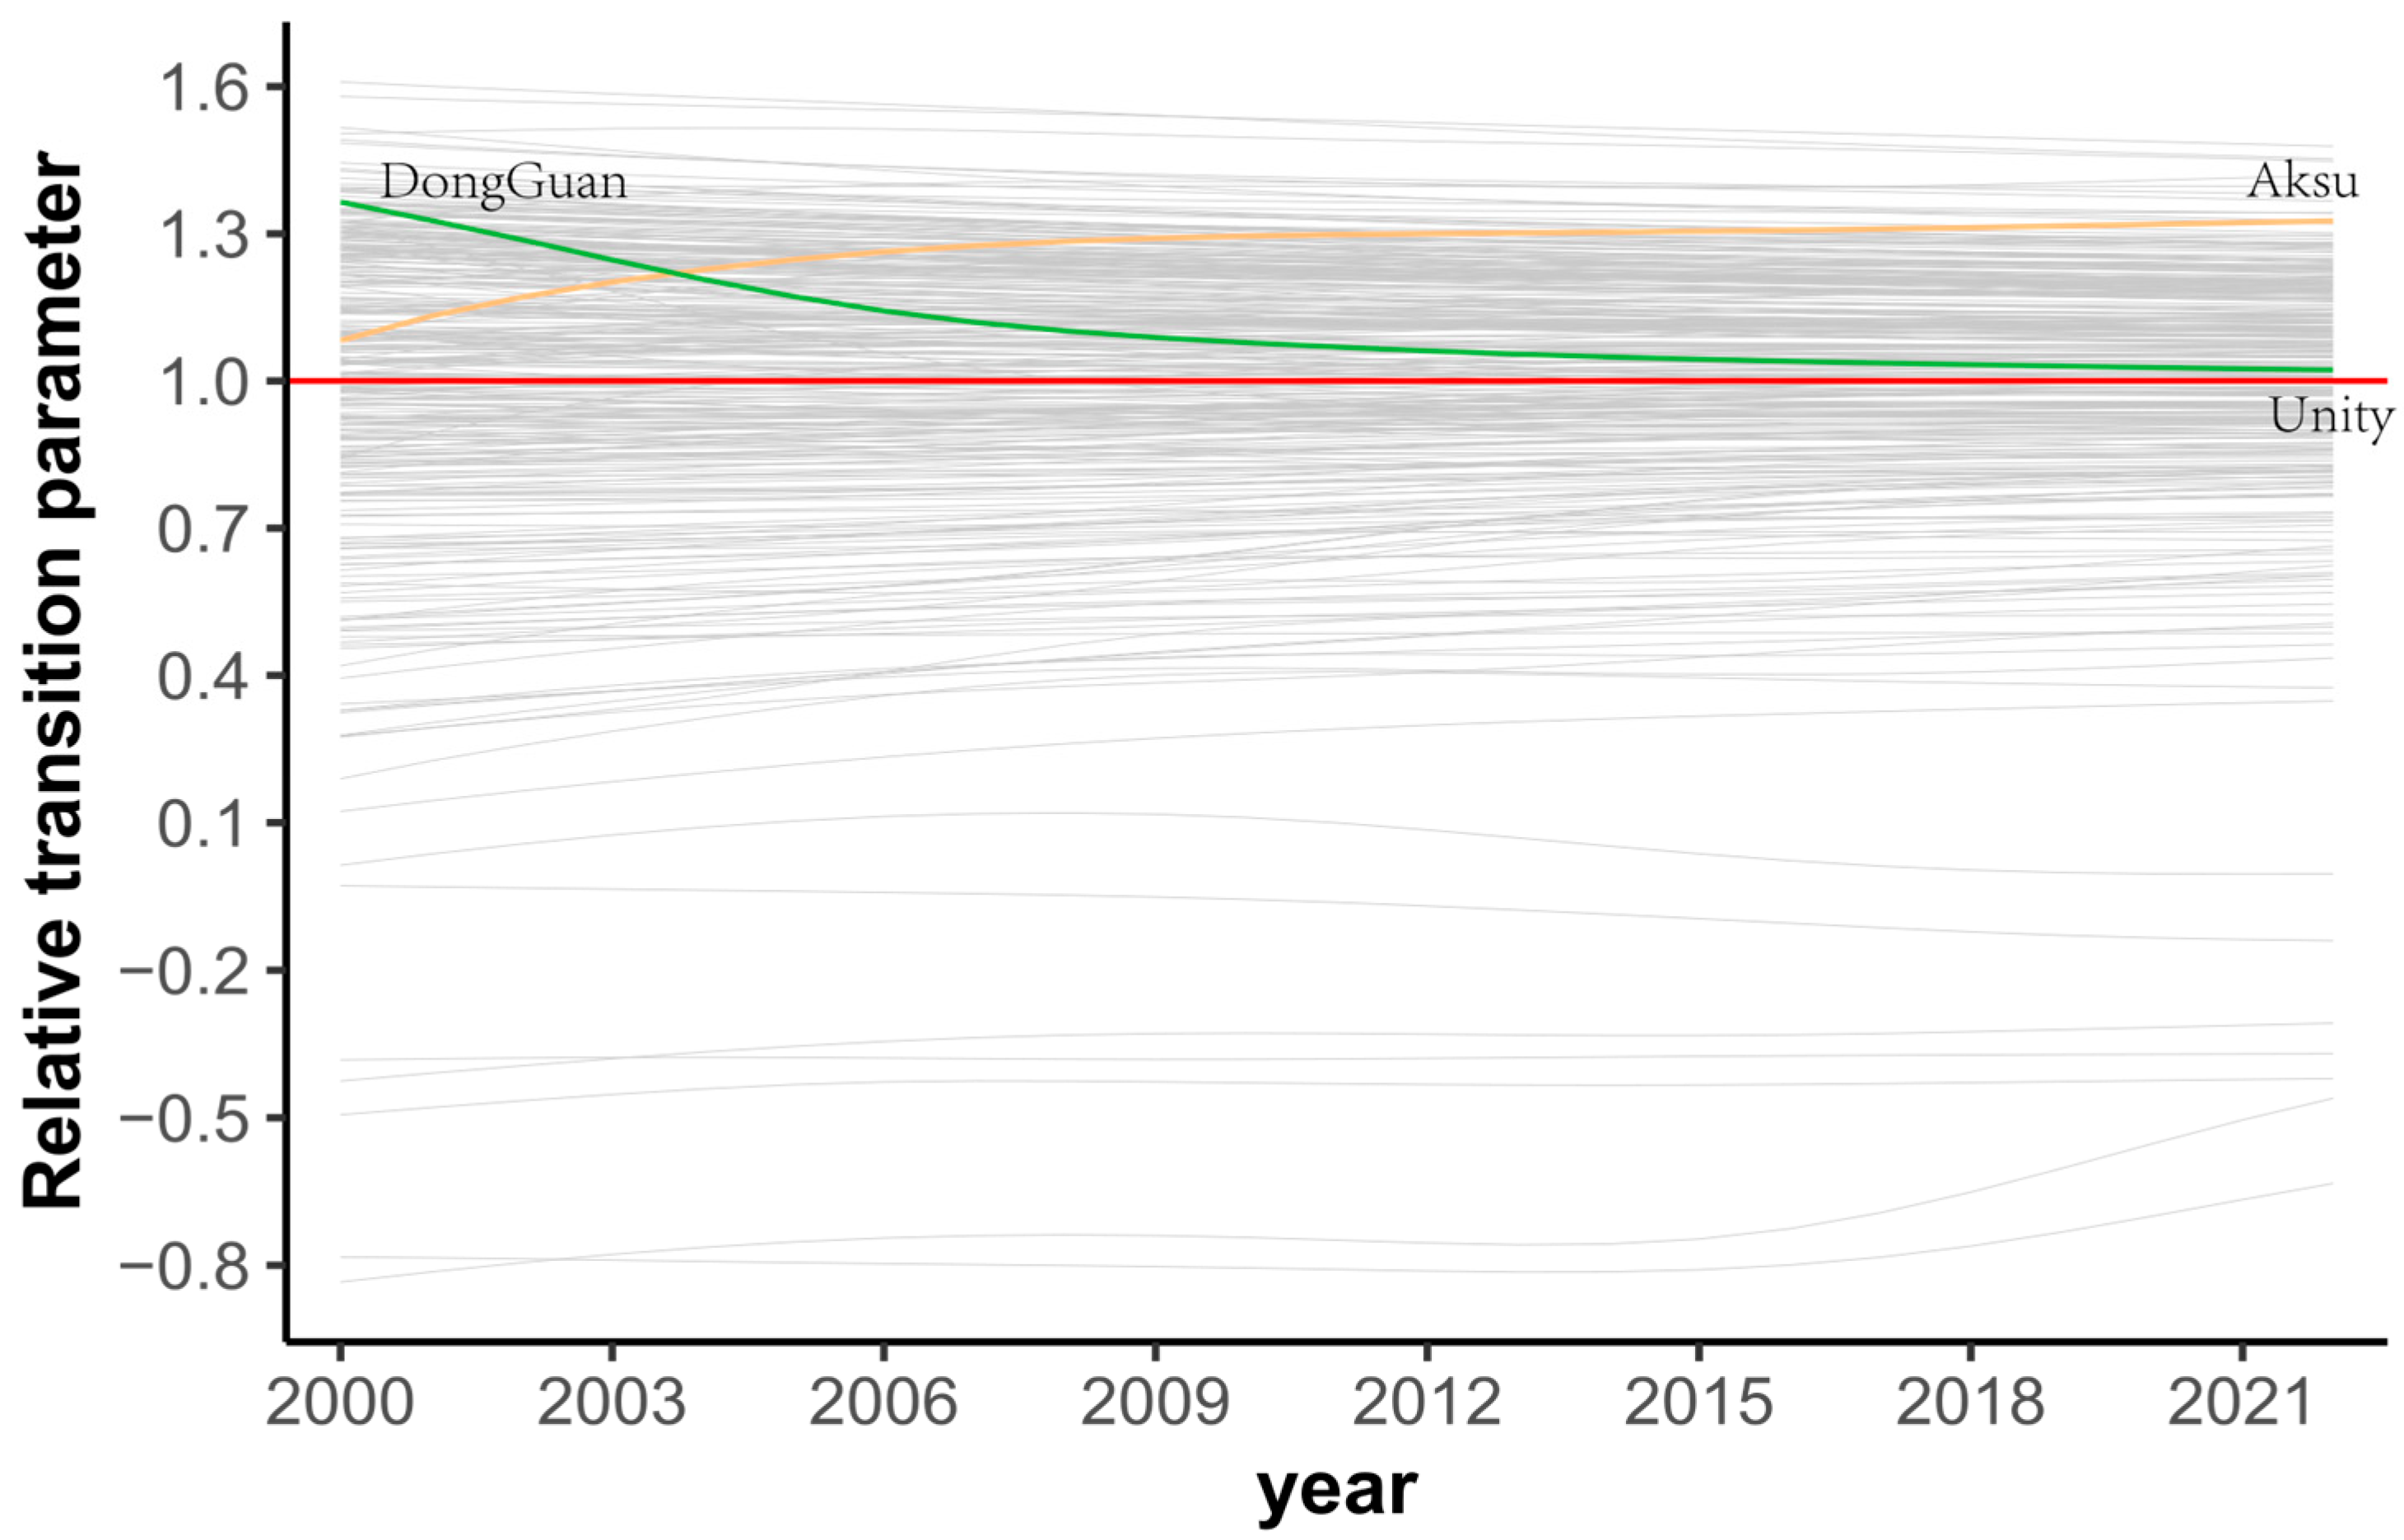
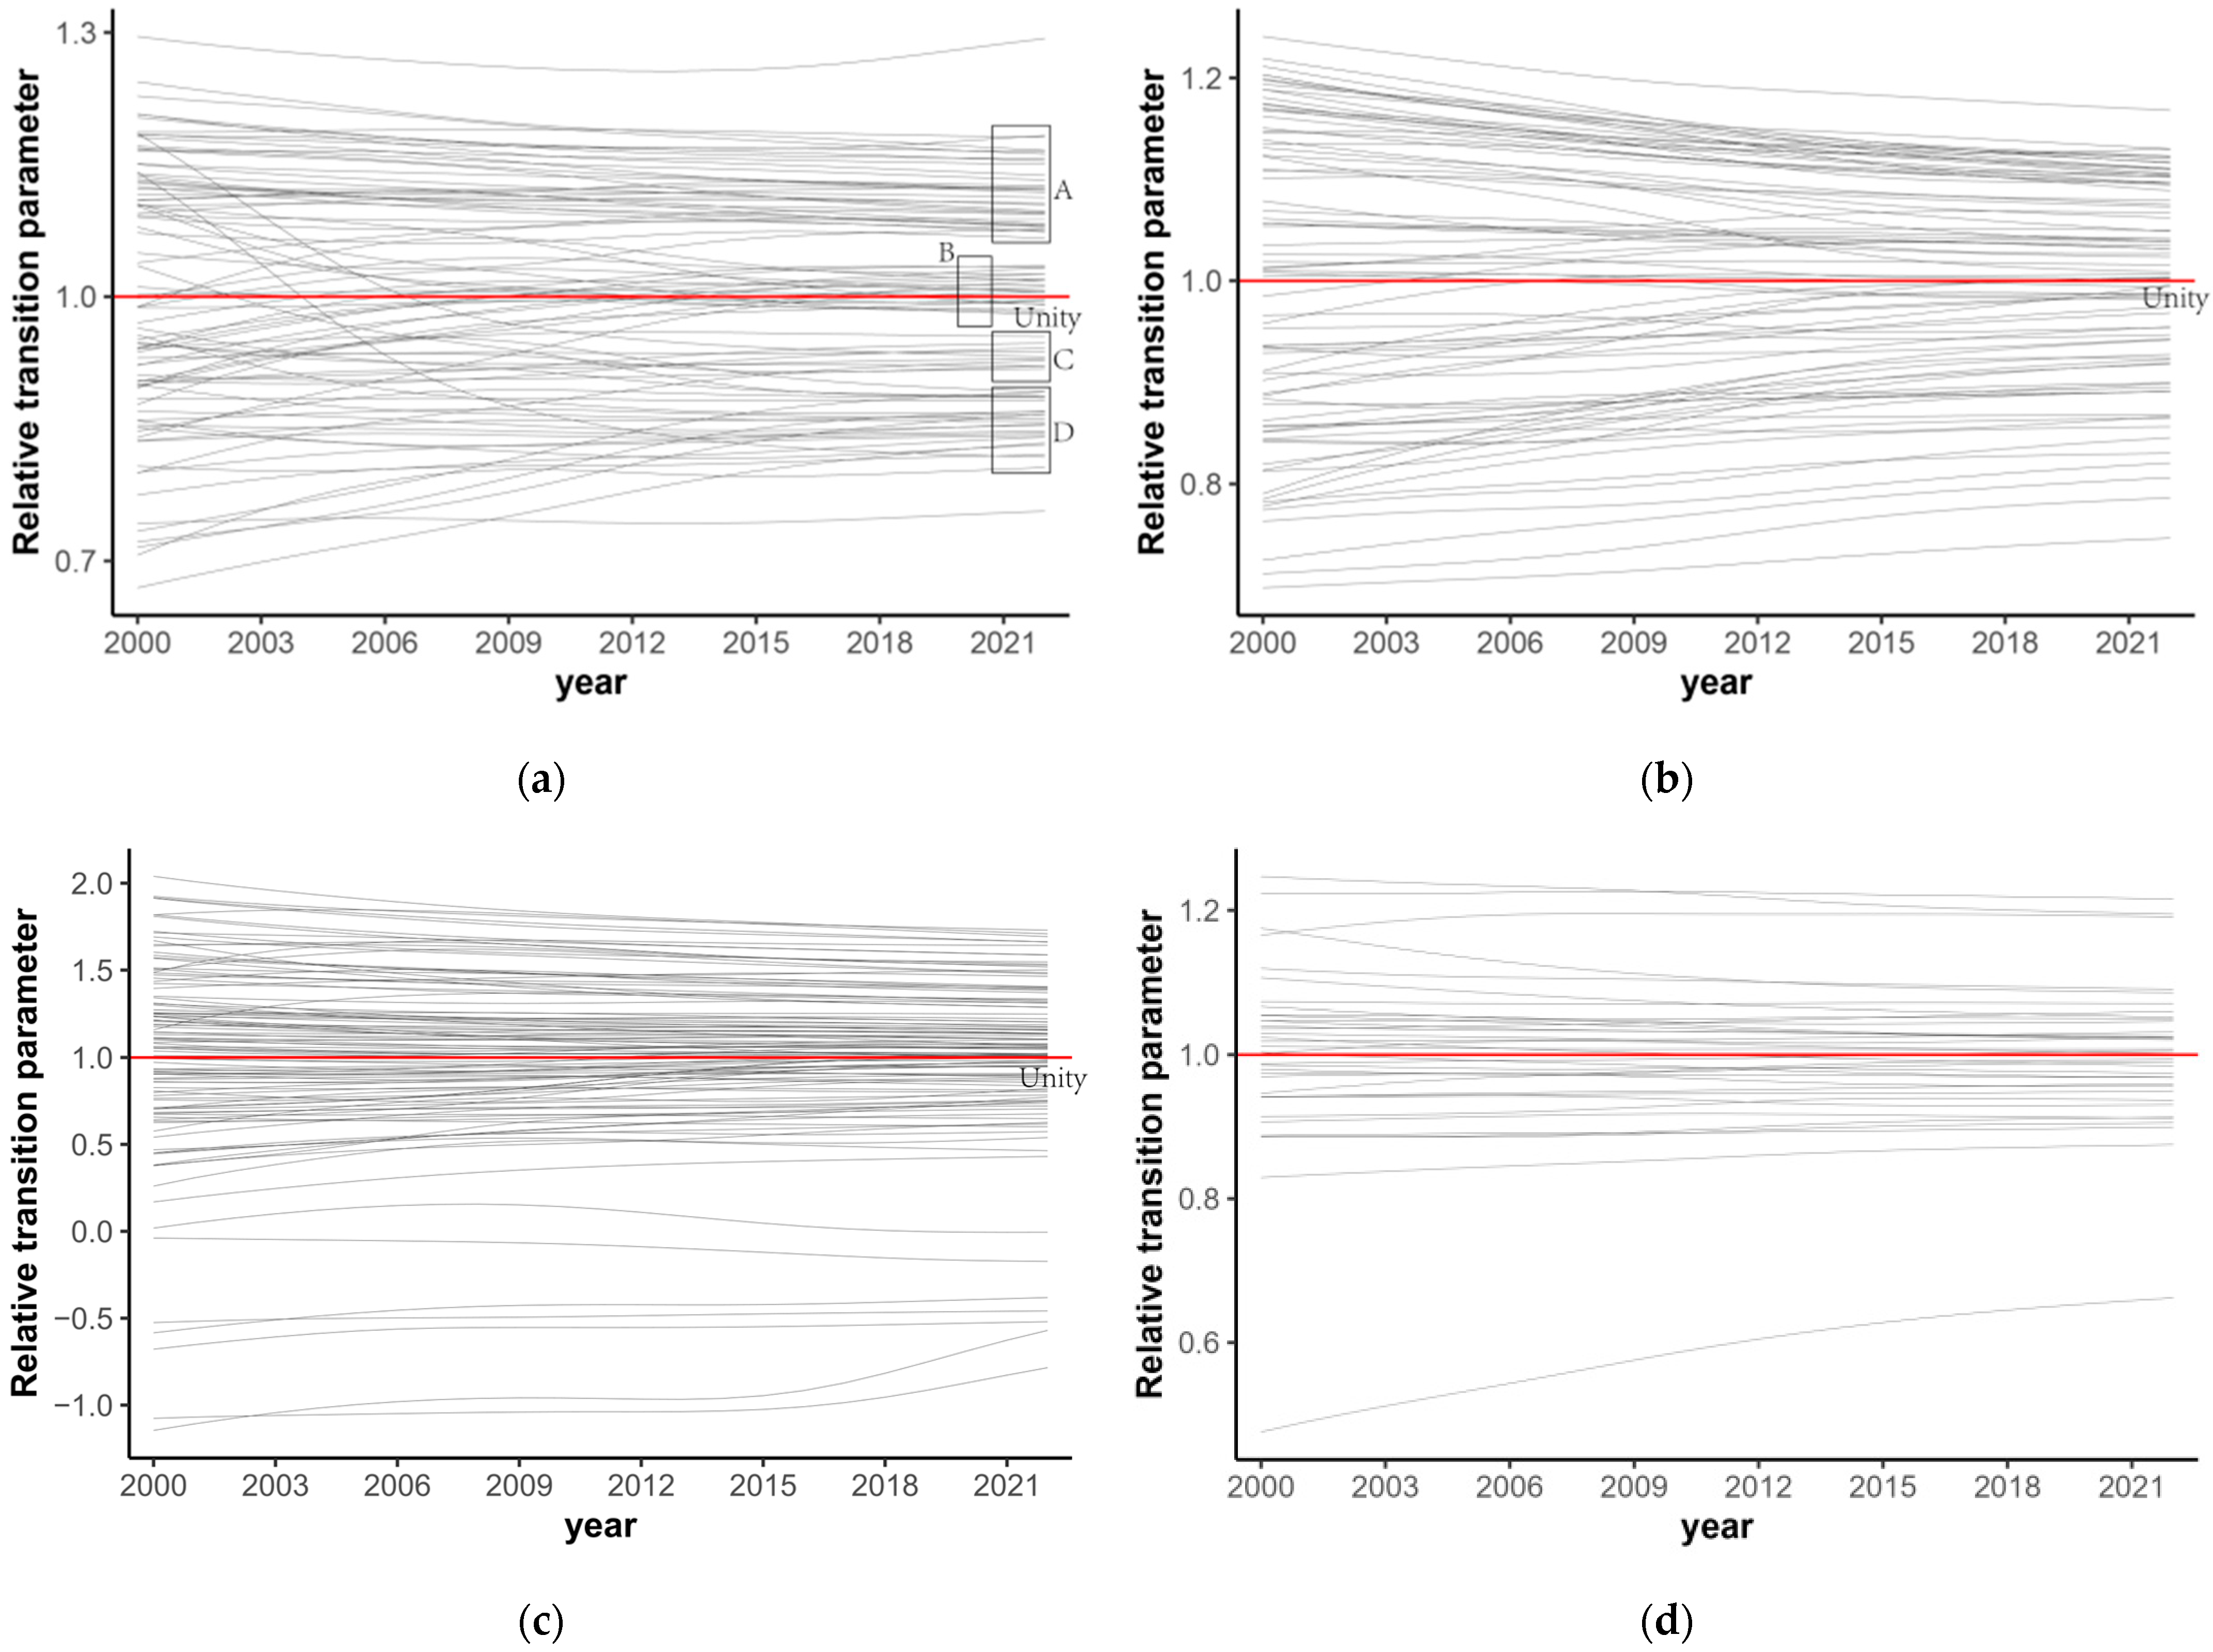
4.3. Why Does Urban Expansion Show Club Convergence?
Relative transition paths show that urban expansion convergence is not universal across cities (
Figure 7). Even if the gaps have narrowed as CV illustrates (
Figure 5), the disparities across cities are still large, suggesting that the laggards’ urban expansion is insufficient to catch up with the leaders. This could be the reason why national and regional urban expansion convergence is rejected based on the log t-test.
The club convergence indicates that the urban system is hierarchical. This hierarchy can be explained by endogenous growth theory and spatial economics. Endogenous growth theory verifies the existence of variable returns to scale of production factors, resulting in multiple economic equilibria [
47,
48]. Fujita et al. demonstrated that the interaction of economic agglomeration and consumer dispersion generates industrial stratification, which leads to a hierarchy of urban systems [
49].
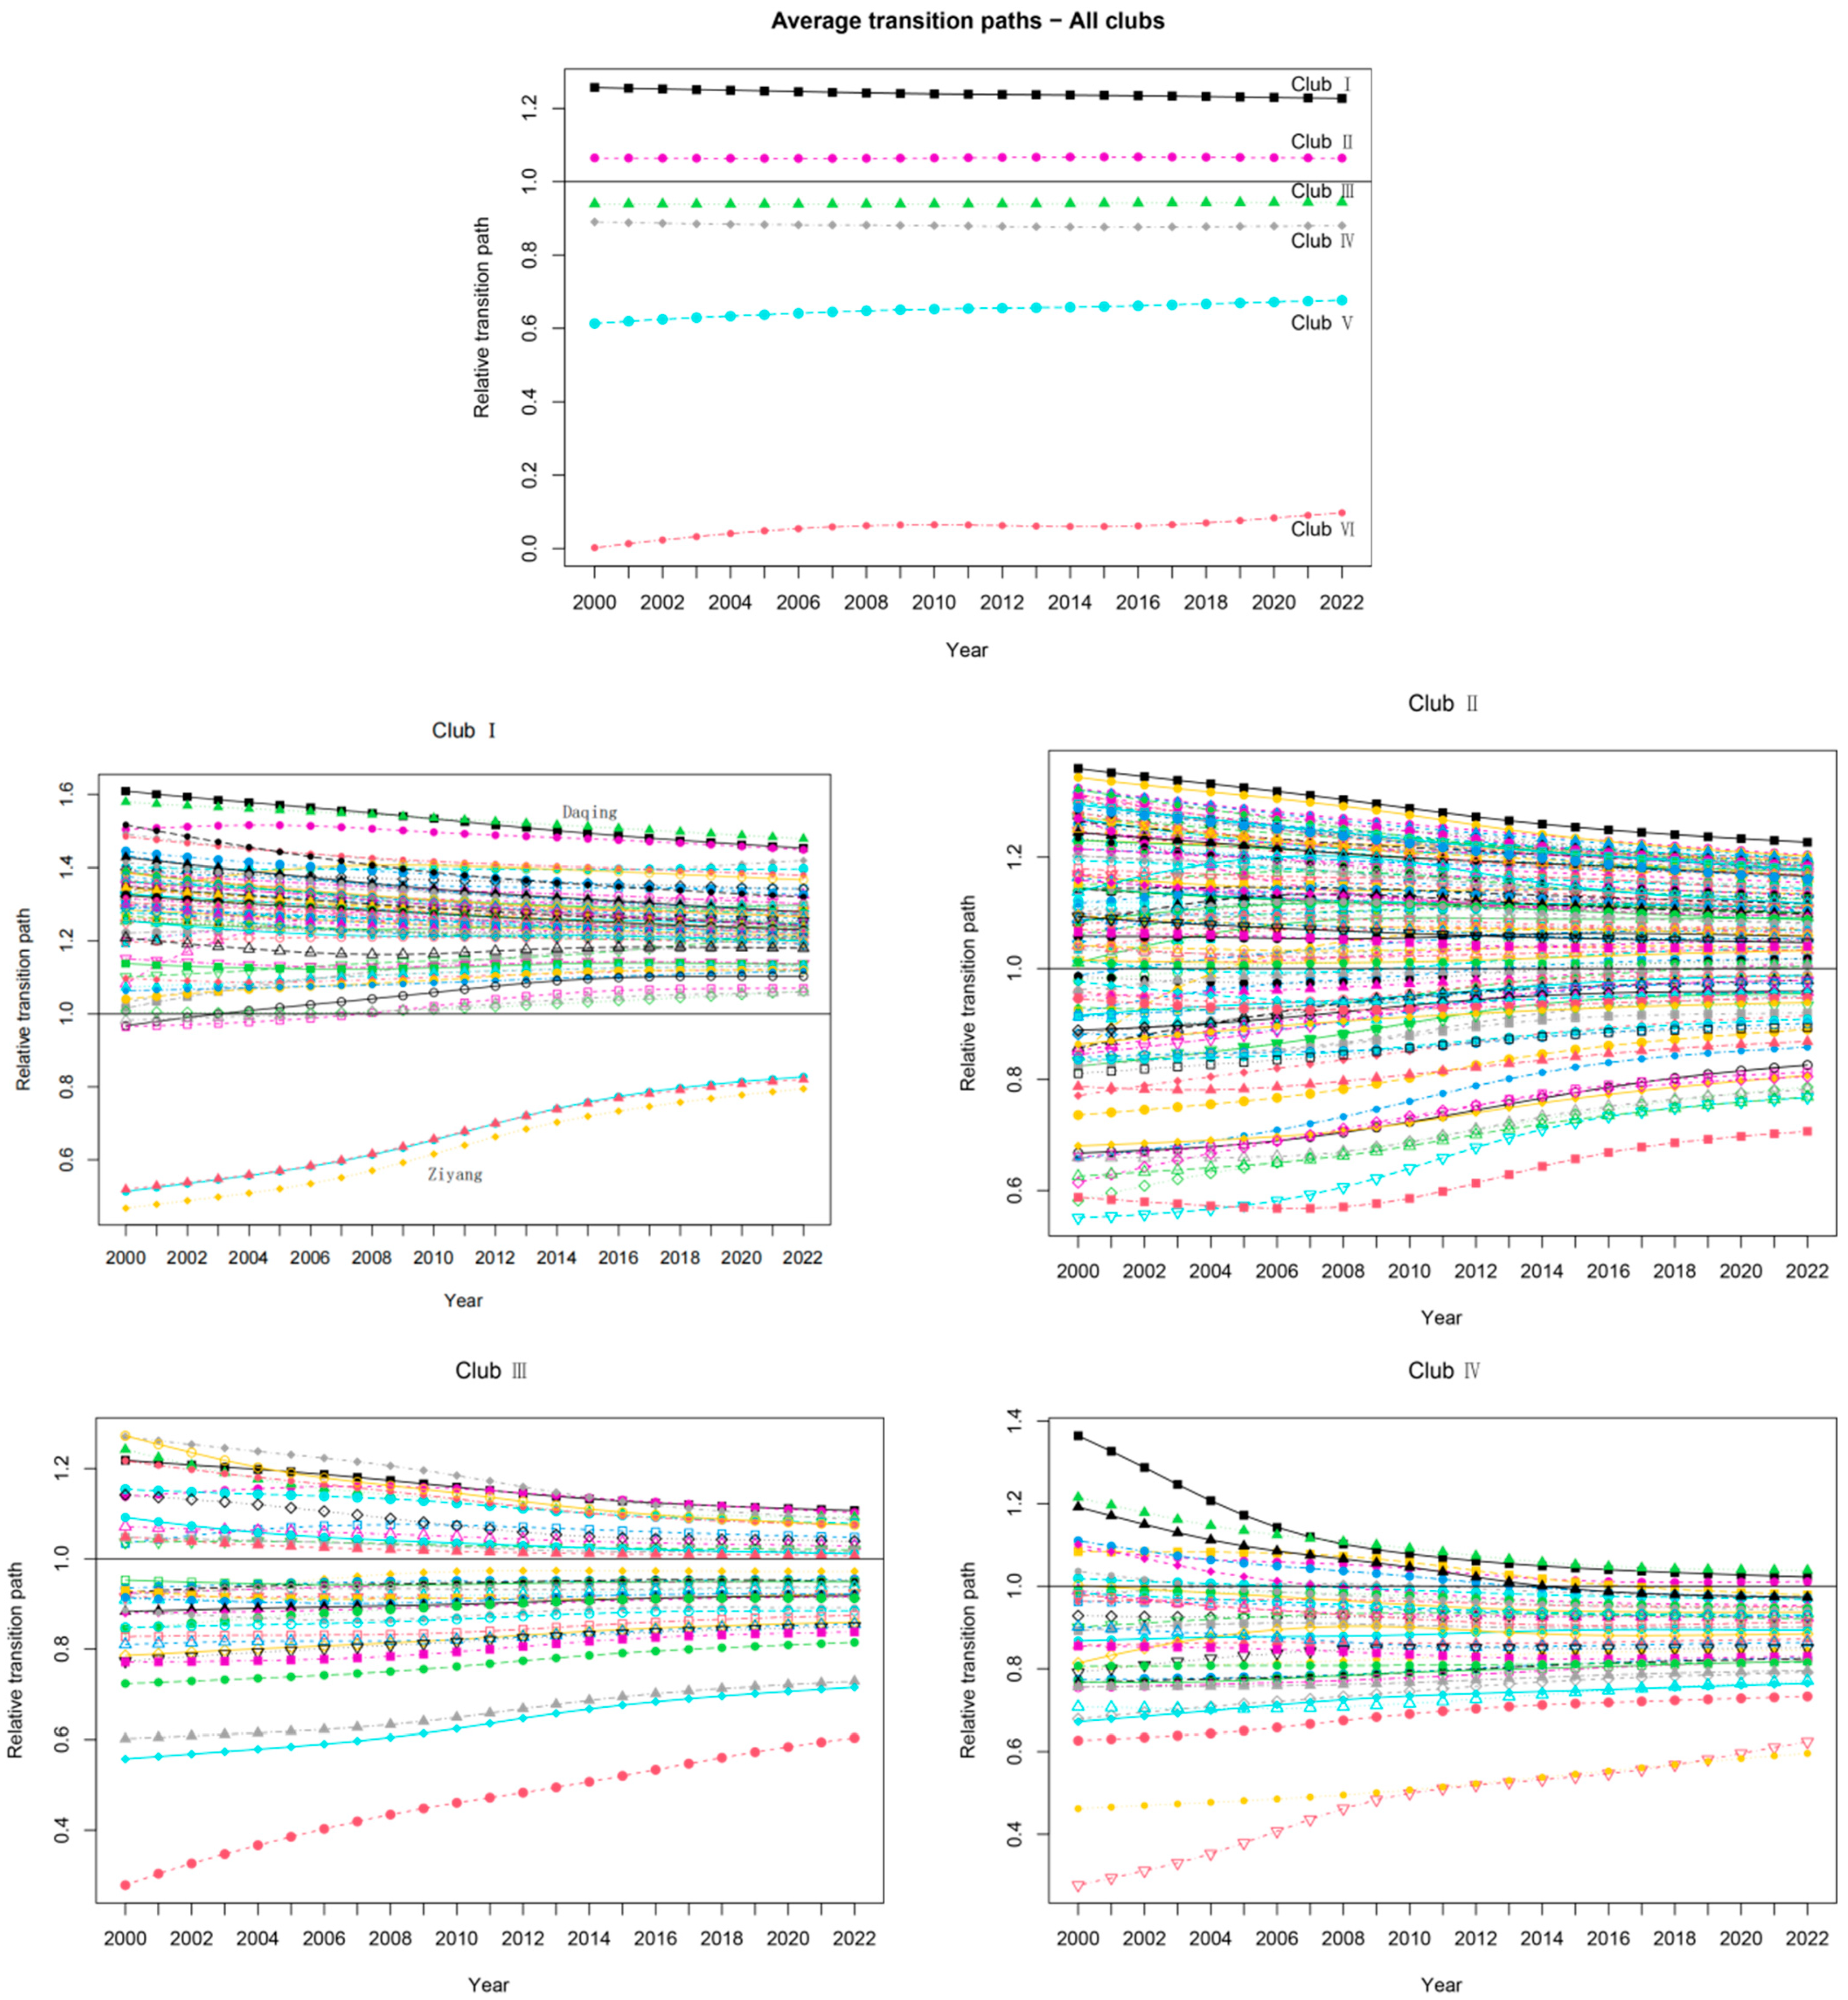
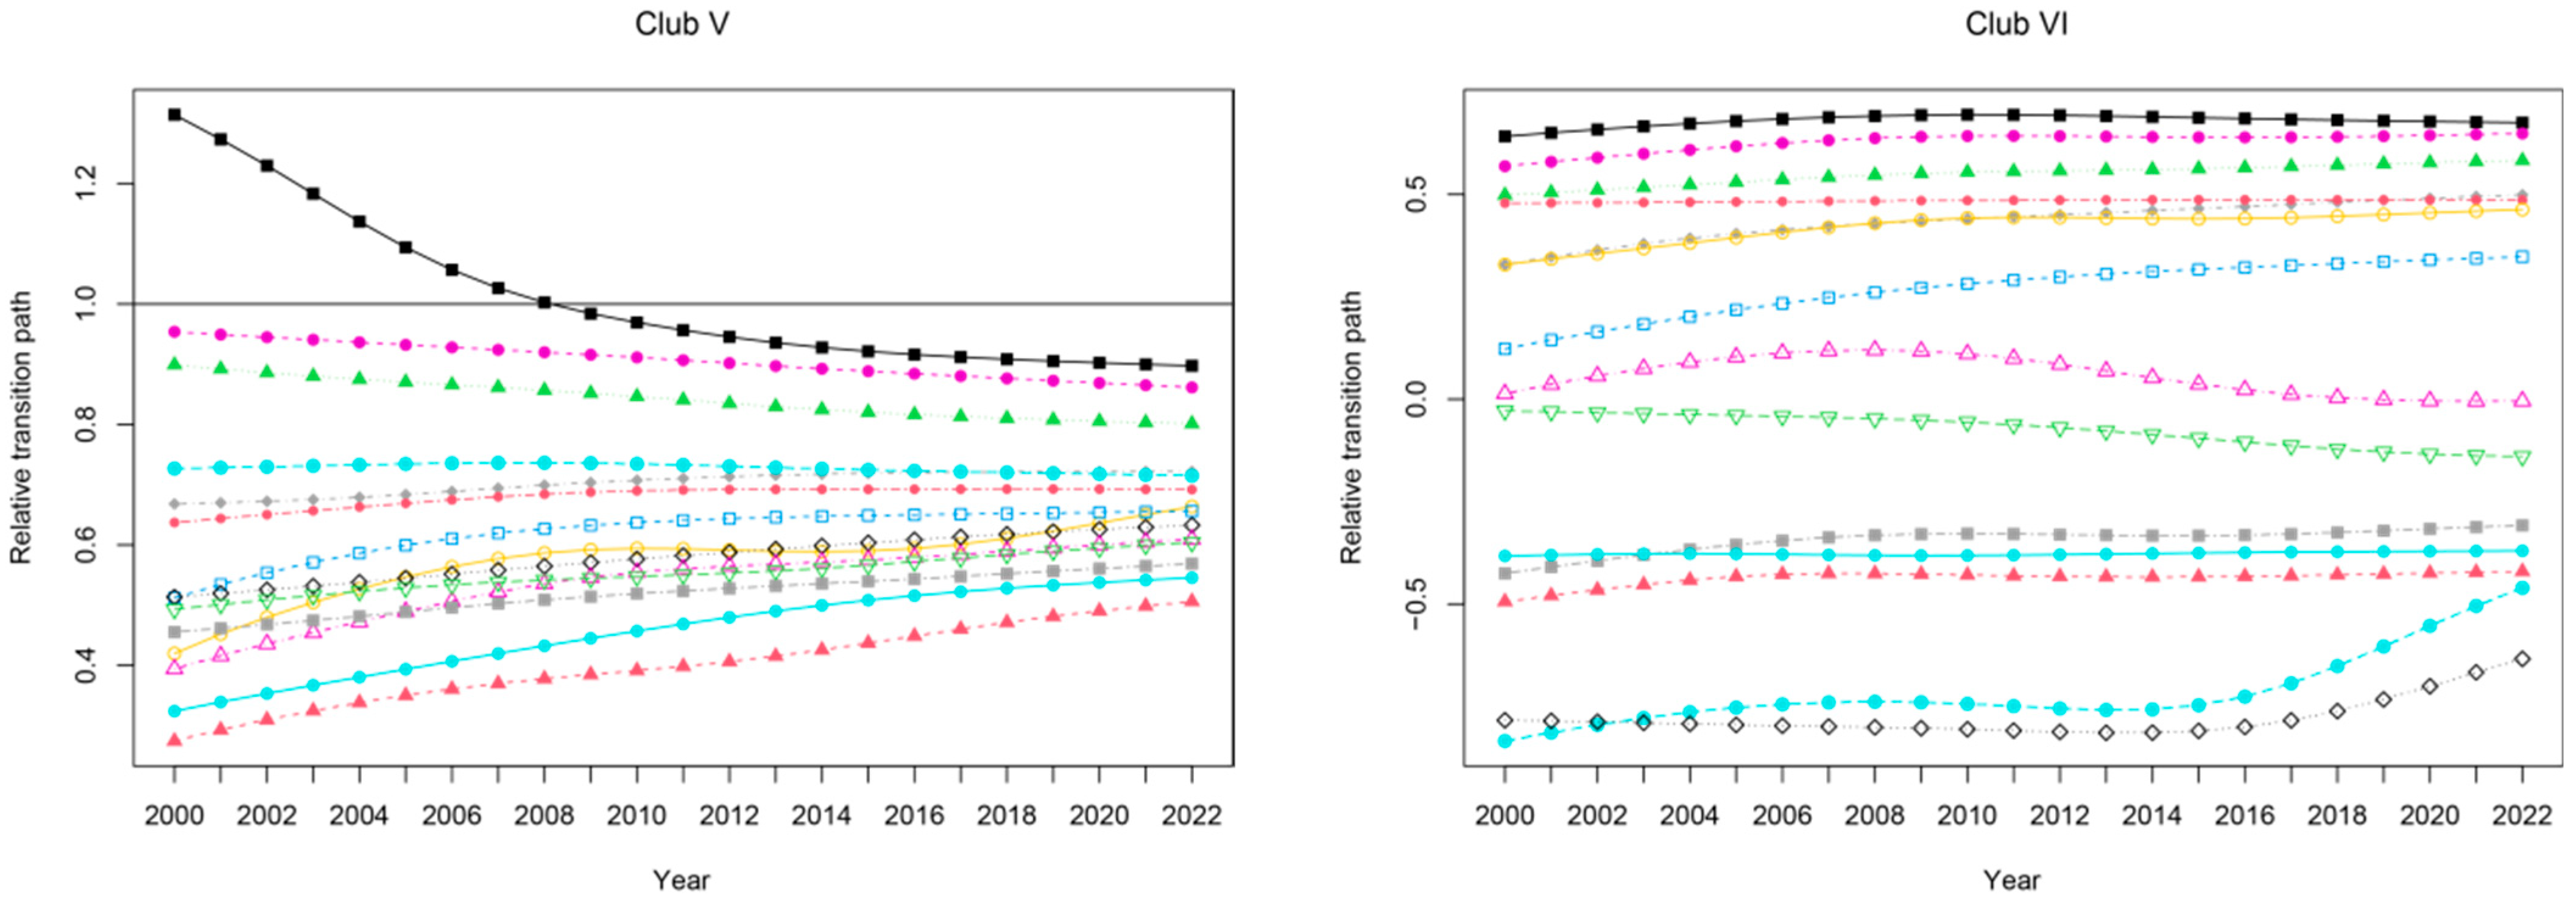
4.4. Why Do Convergence Clubs Show Spatial Aggregation?
The spatial distribution of the clubs is associated with local economics and policies. According to Krugman’s “first and second nature” theory, the endowment of natural resources enables cities to evolve from different starting points, and socioeconomic activities influence the development process [
50]. Club I and club II remain above the steady-state level. Even though each city’s socioeconomic development is unique, the majority of the cities in the two clubs are located in the plains. For the northeast region, dramatic population out-migration increases the urban area per capita [
51]. For the eastern and central regions, the rise in industries leads to the accumulation of populations and resources, leading to dramatic urban expansion. Club III and club IV aggregate in the southeast region, and the average transition paths are slightly below the steady-state level. The region covered by the two clubs has a developed service industry and foreign trade, attracting population inflows. Club V and club VI are mainly located in the western region, which falls behind the steady-state threshold and has resource concentration limits, and an inadequate industrial system.
4.5. Policy Implications
In light of the findings, the assumption that “urban expansion across the country will tend to be convergence” is clearly not proven, and club convergence indicates that nationwide urban expansion exhibits multi-level and multi-gradient clustering characteristics, which provides a basis for precise urban planning and regional policy making. Since there is no convergence at the national level and the transition paths of different clubs are significantly different, a “one-size-fits-all” land policy is unlikely to work. The government and planning departments need to formulate targeted land use plans based on the characteristics and spatial distribution of each club. Specifically, cities in club I are mainly spread across north China and the northern part of East China, and have the largest per capita urban land area, which indicates that there might be a problem of high land consumption and low population density. Therefore, cities in this club should reduce new urban construction land, and only when land acquisition and storage are organized can new construction land be obtained. Cities in club II mainly aggregate in the center region, the southern part of East China, and Northeast China, and have a higher per capita urban land area, indicating that there may also exist a certain risk of urban expansion with low population density. In addition to controlling the increase in new urban construction land, construction activities in urban marginal areas should also be supervised. Cities in club III are close to the overall equilibrium state of urban expansion and should maintain moderate expansion and further improve the efficiency of land use. Cities in clubs V and VI are mainly distributed in the western region, where per capita urban land is low and the incentive for urban expansion is weak. Cities in these clubs may have problems with imperfect land planning and weak infrastructure; for this reason, increasing urban construction land should be promoted by appropriate preferential treatment to reduce land costs and attract industries and projects. However, the increase in urban land must be within the environmental carrying capacity. In summary, a sustainable balance in urban expansion in various regions can be achieved only by adhering to a differentiated land management strategy.
5. Conclusions
This study investigated the evolution and convergence of urban expansion across 315 Chinese cities from 2000 to 2022. The following results were obtained. Per capita urban area continued to increase at both the national and regional scales. On a national scale, per capita urban area increased 1.58 times from 115.9 m2 to 182.8 m2. On a regional scale, the northeast had the largest per capita urban area, with 363.7 m2 in 2022; the west had the fastest growth rate, expanding 2.1 times in 23 years. Moreover, based on the urban expansion and the change in the CV value, the disparity between regions decreased only slightly. KDE showed fluctuations in differences between cities in each region over time, indicating that per capita urban land does not converge to a steady state in each region. Log t regression further verified the results of divergence on national and regional scales; however, six convergence clubs were identified. Transition paths within the convergence clubs moved toward a common state. The spatial pattern of the convergence clubs shows the characteristics of an overall east–west distribution and a local north–south distribution. The per capita urban land use is larger in the eastern region than in the western region and larger in the northern region than in the southern region. Targeted policy implications based on the transition paths and spatial distribution of each convergence club have been developed to promote multi-level regional coordination and sustainable development. In conclusion, this study provides a new perspective on further exploring the evolution of urban systems based on the coupling of temporal multiple equilibria and spatial stratified heterogeneity. Moreover, the analytical framework of combining long-term path equilibrium identification with spatially stratified heterogeneity provides a reference for other convergence analyses based on panel data with long time series and spatial information.
Although this study reveals the temporal evolution and convergence patterns of urban expansion in China, it still has some limitations. First, population data from statistical yearbooks may contain estimation errors in non-census years. Nevertheless, the data in the statistical yearbook are credible as official data sources, and the data were hp-filtered before the convergence test to reduce the impact of errors on the results. Second, the per capita urban land dataset lacks some cities in China due to a shortage of demographic data; however, it covers China’s major cities, and it could cover all cities if data become accessible. Third, attribution analysis was not conducted using the empirical method. Many socioeconomic and natural factors and development policies influence urban expansion convergence across cities. We will investigate these underlying influencing factors in the future.


