

A Multi-Dimensional Evaluation of Street Vitality in a Historic Neighborhood Using Multi-Source Geo-Data: A Case Study of Shuitingmen, Quzhou
Abstract
1. Introduction
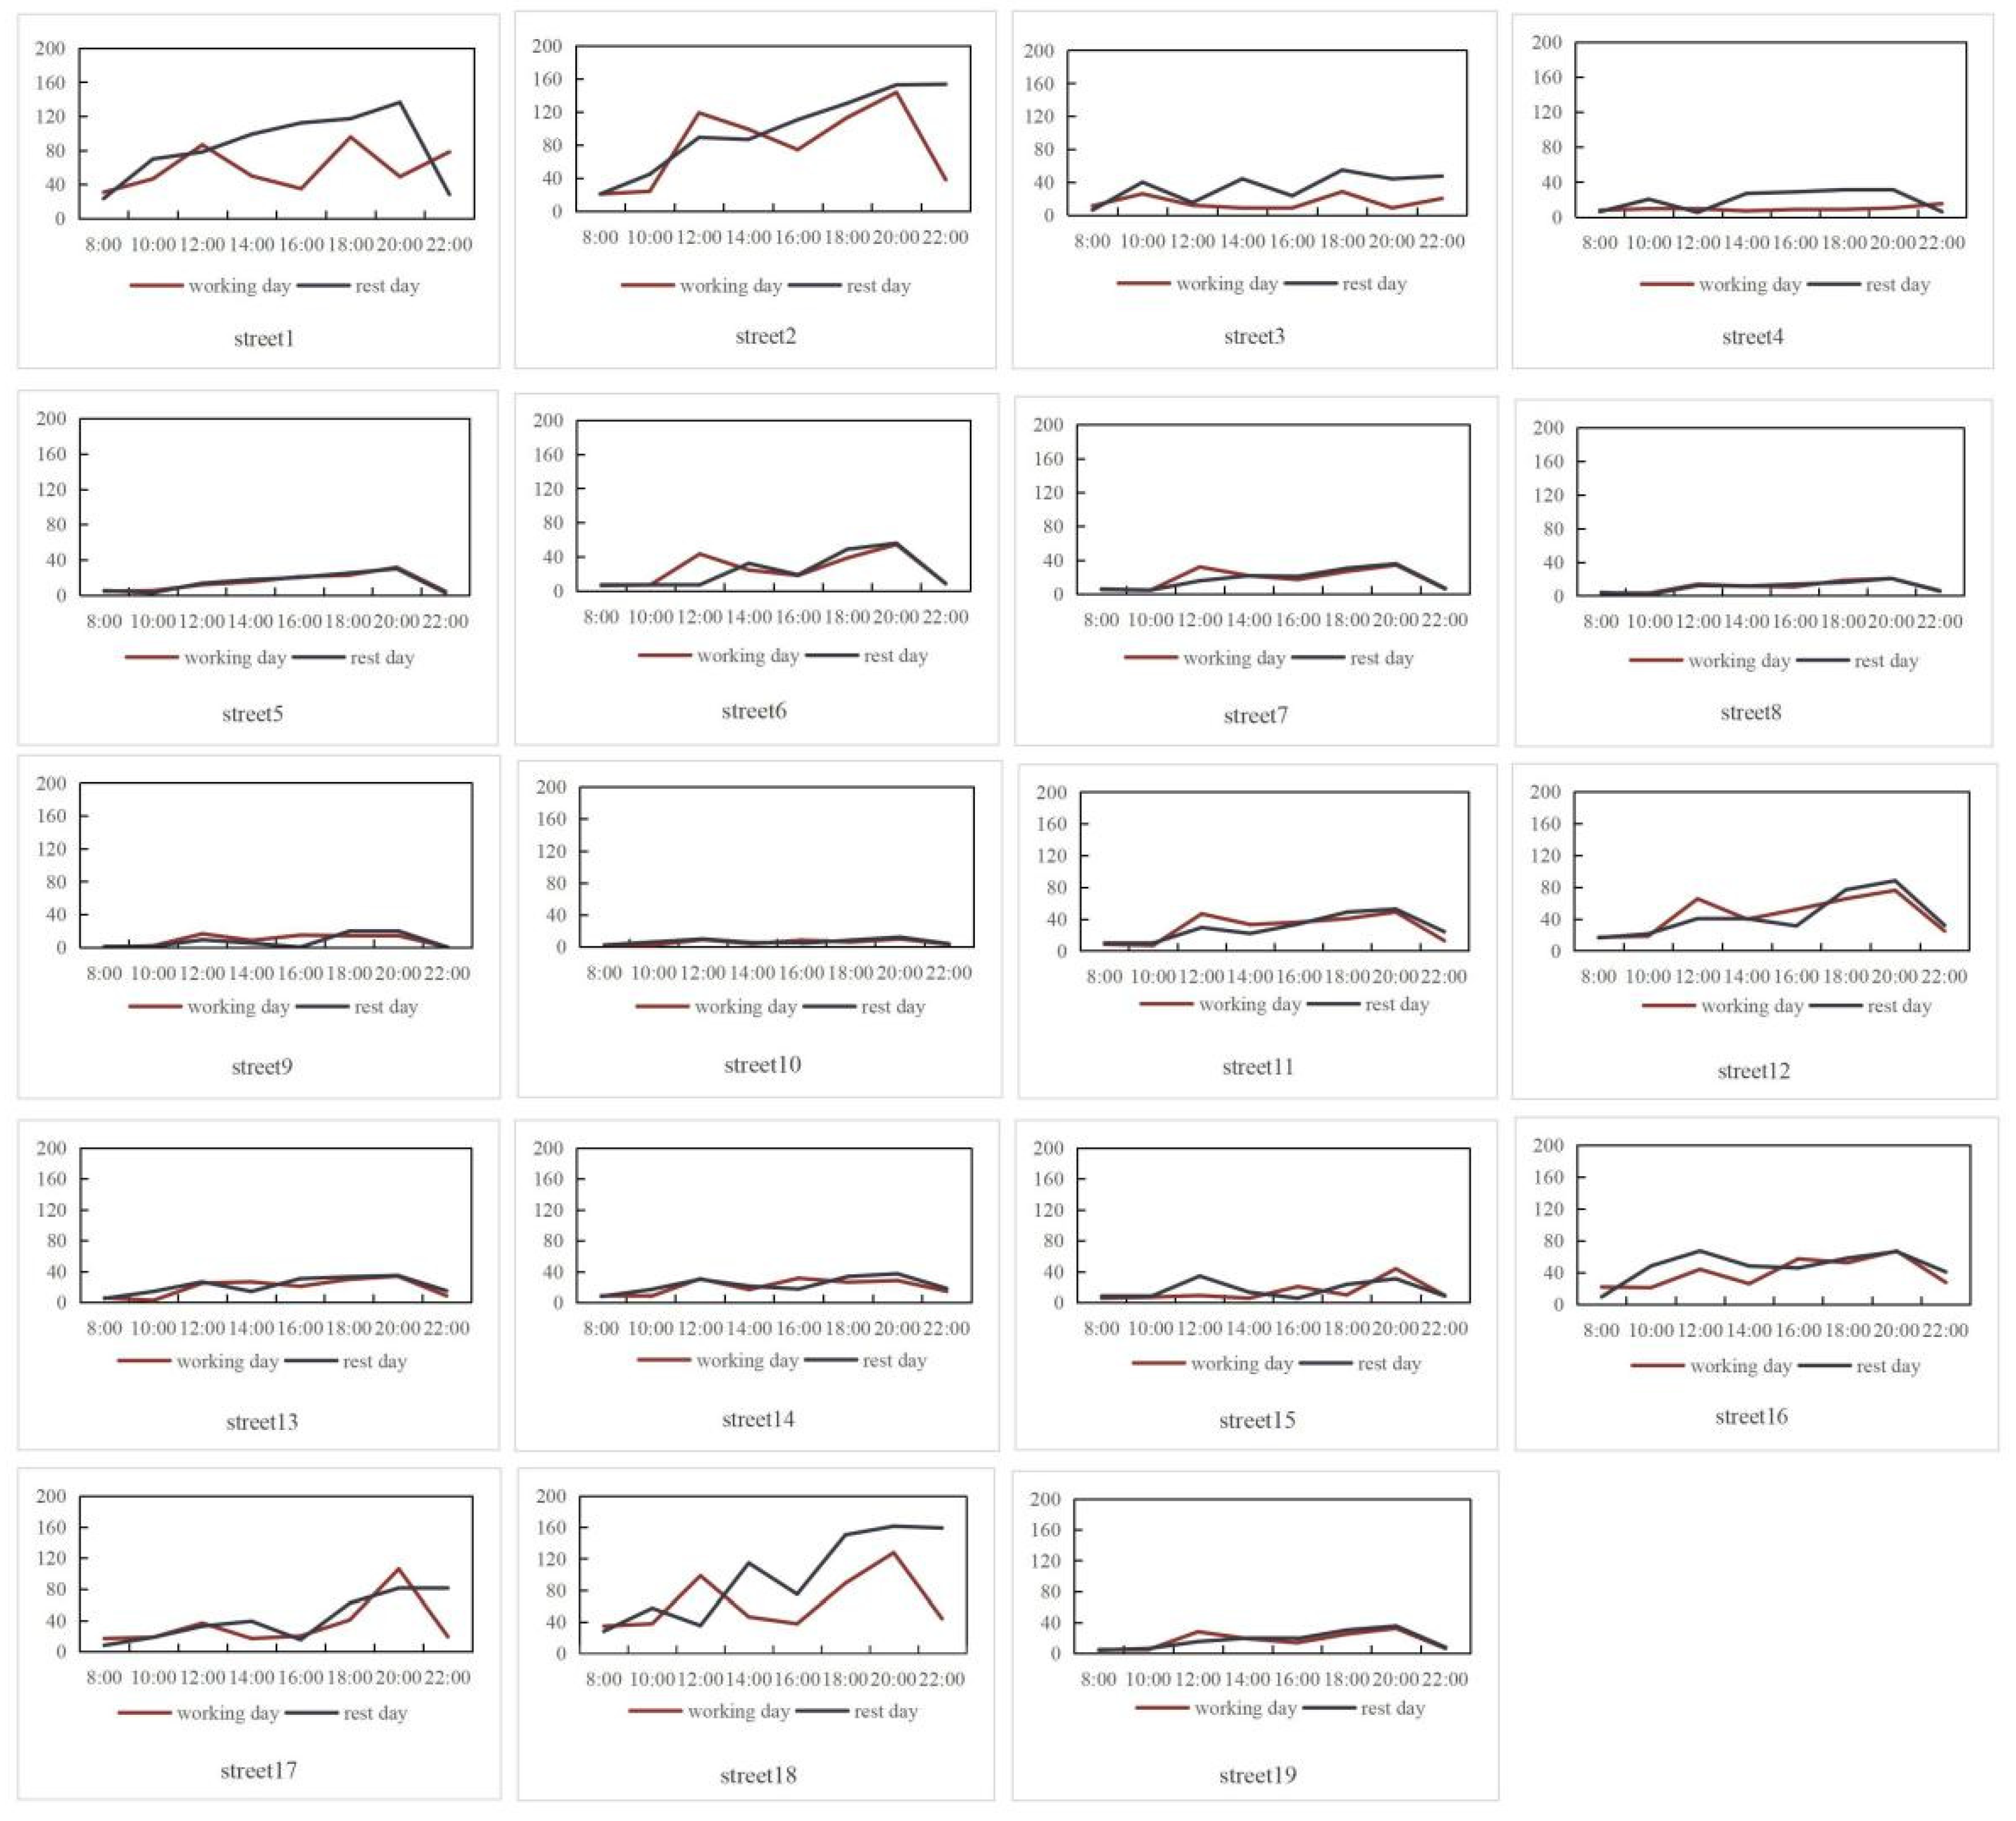
- What are the temporal variations in neighborhood vitality?
- How do functional diversity and accessibility influence street-level vitality?
2. Data and Methods
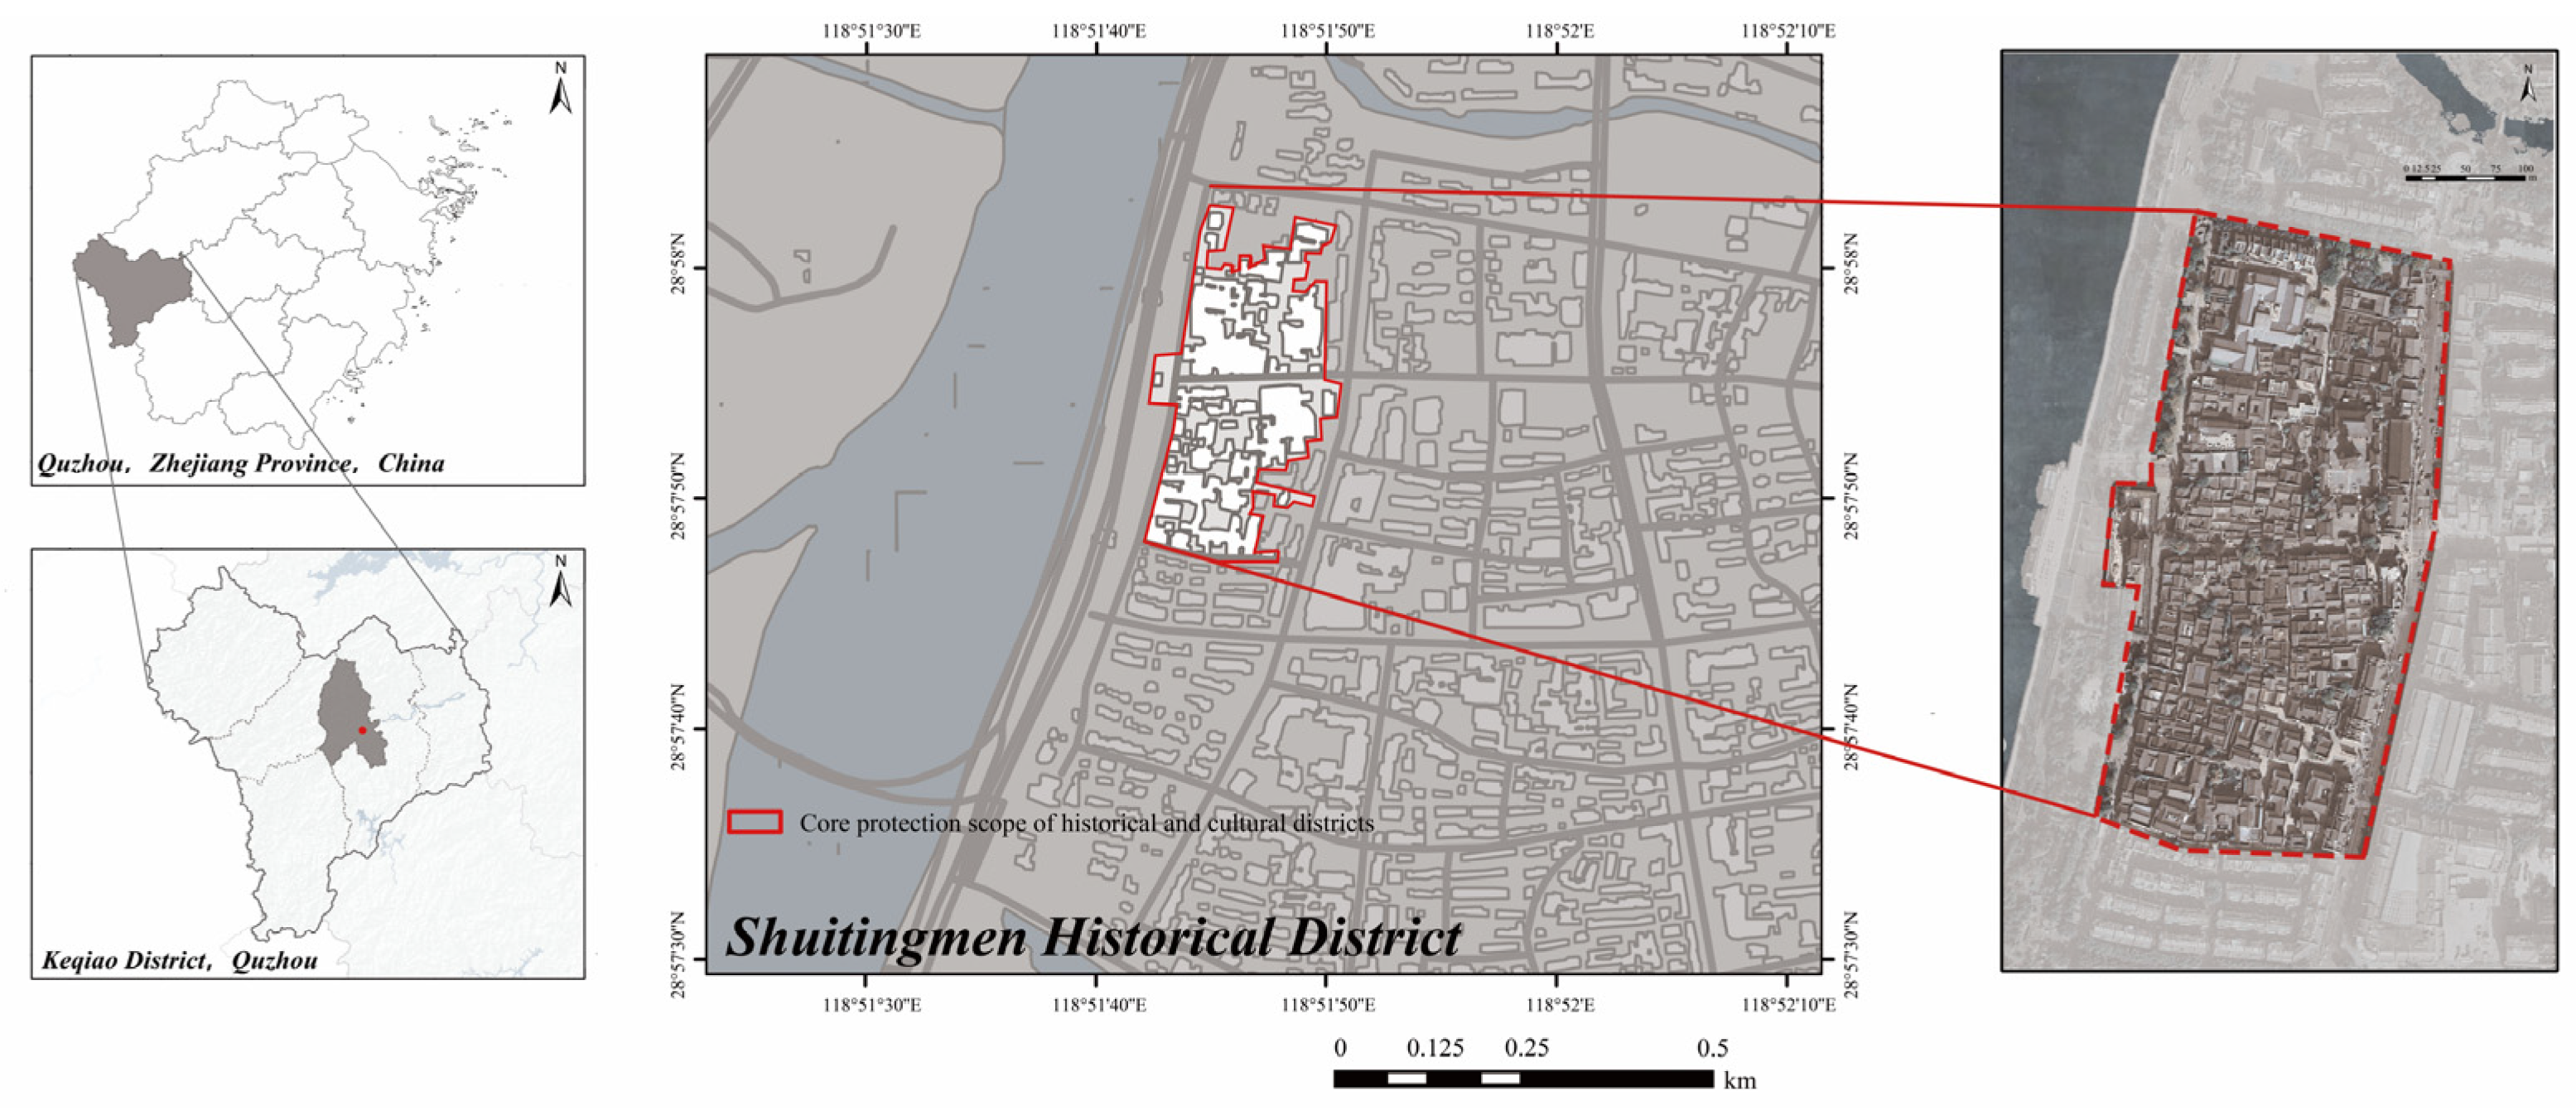
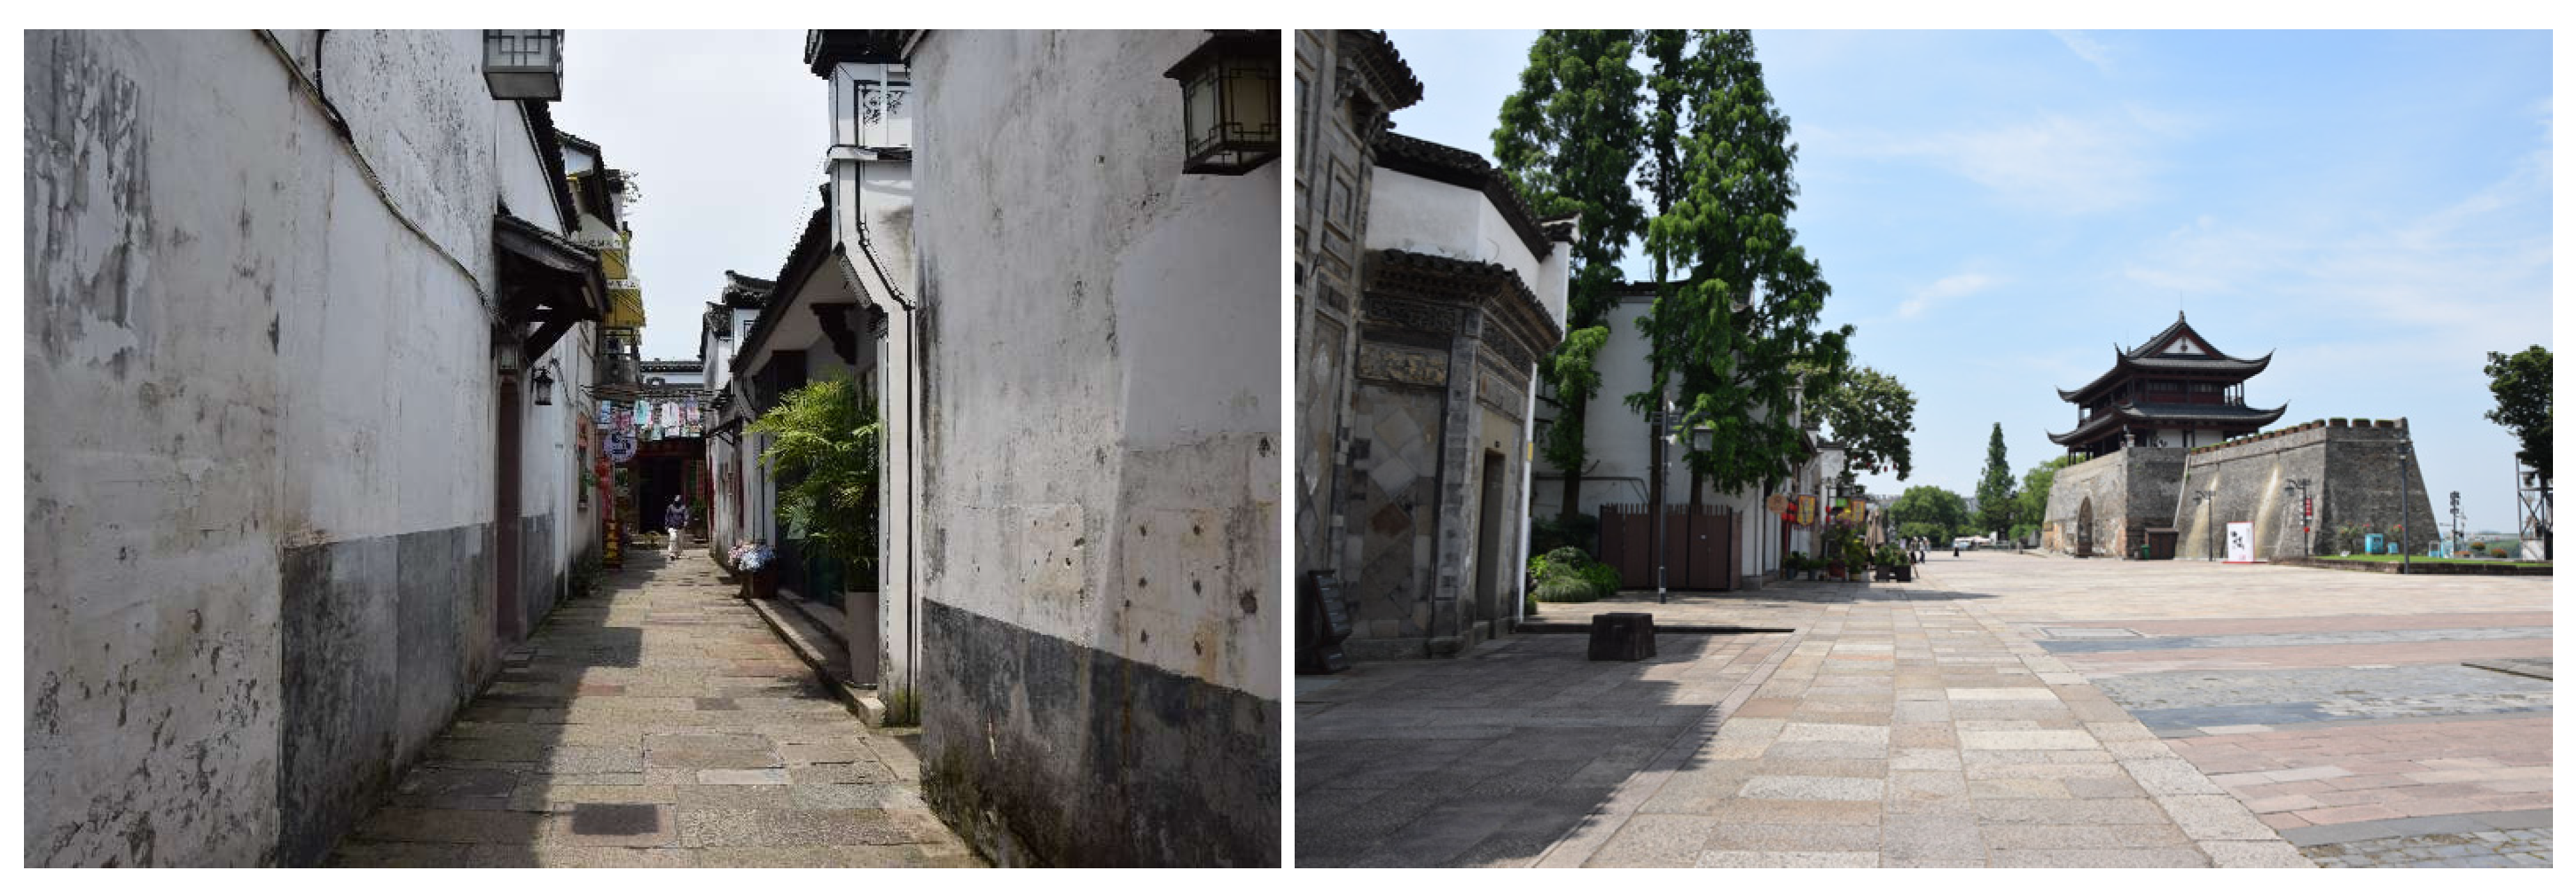
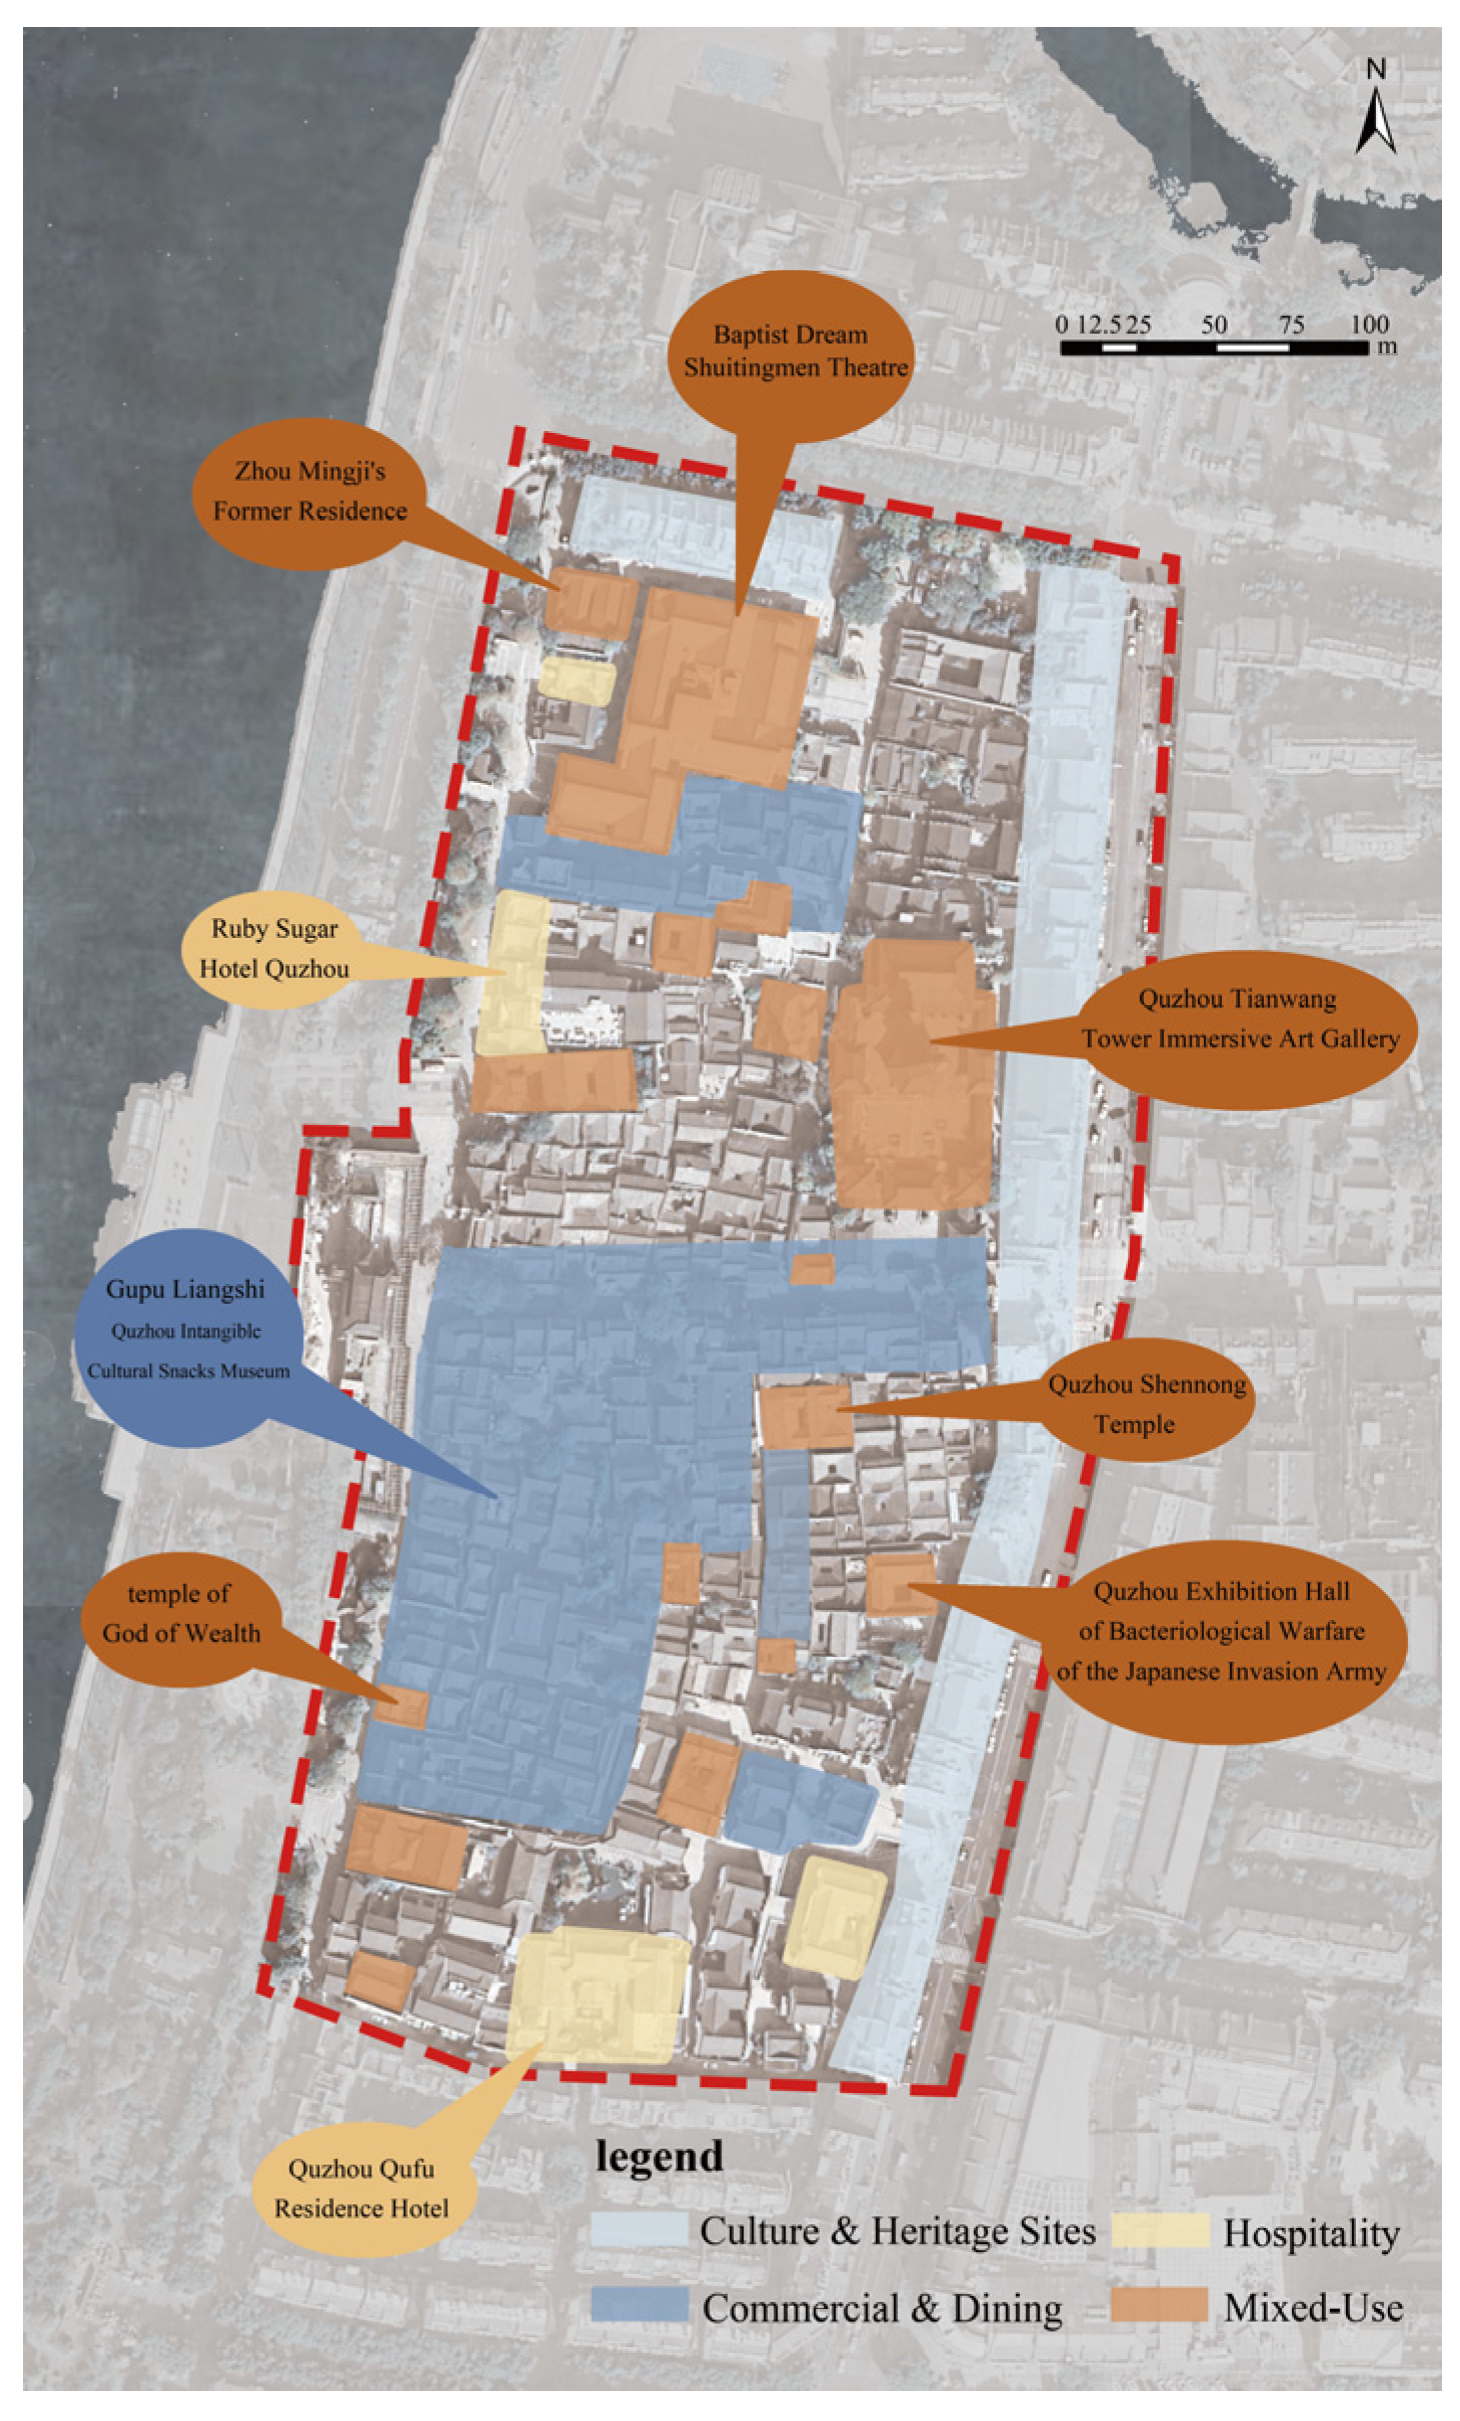
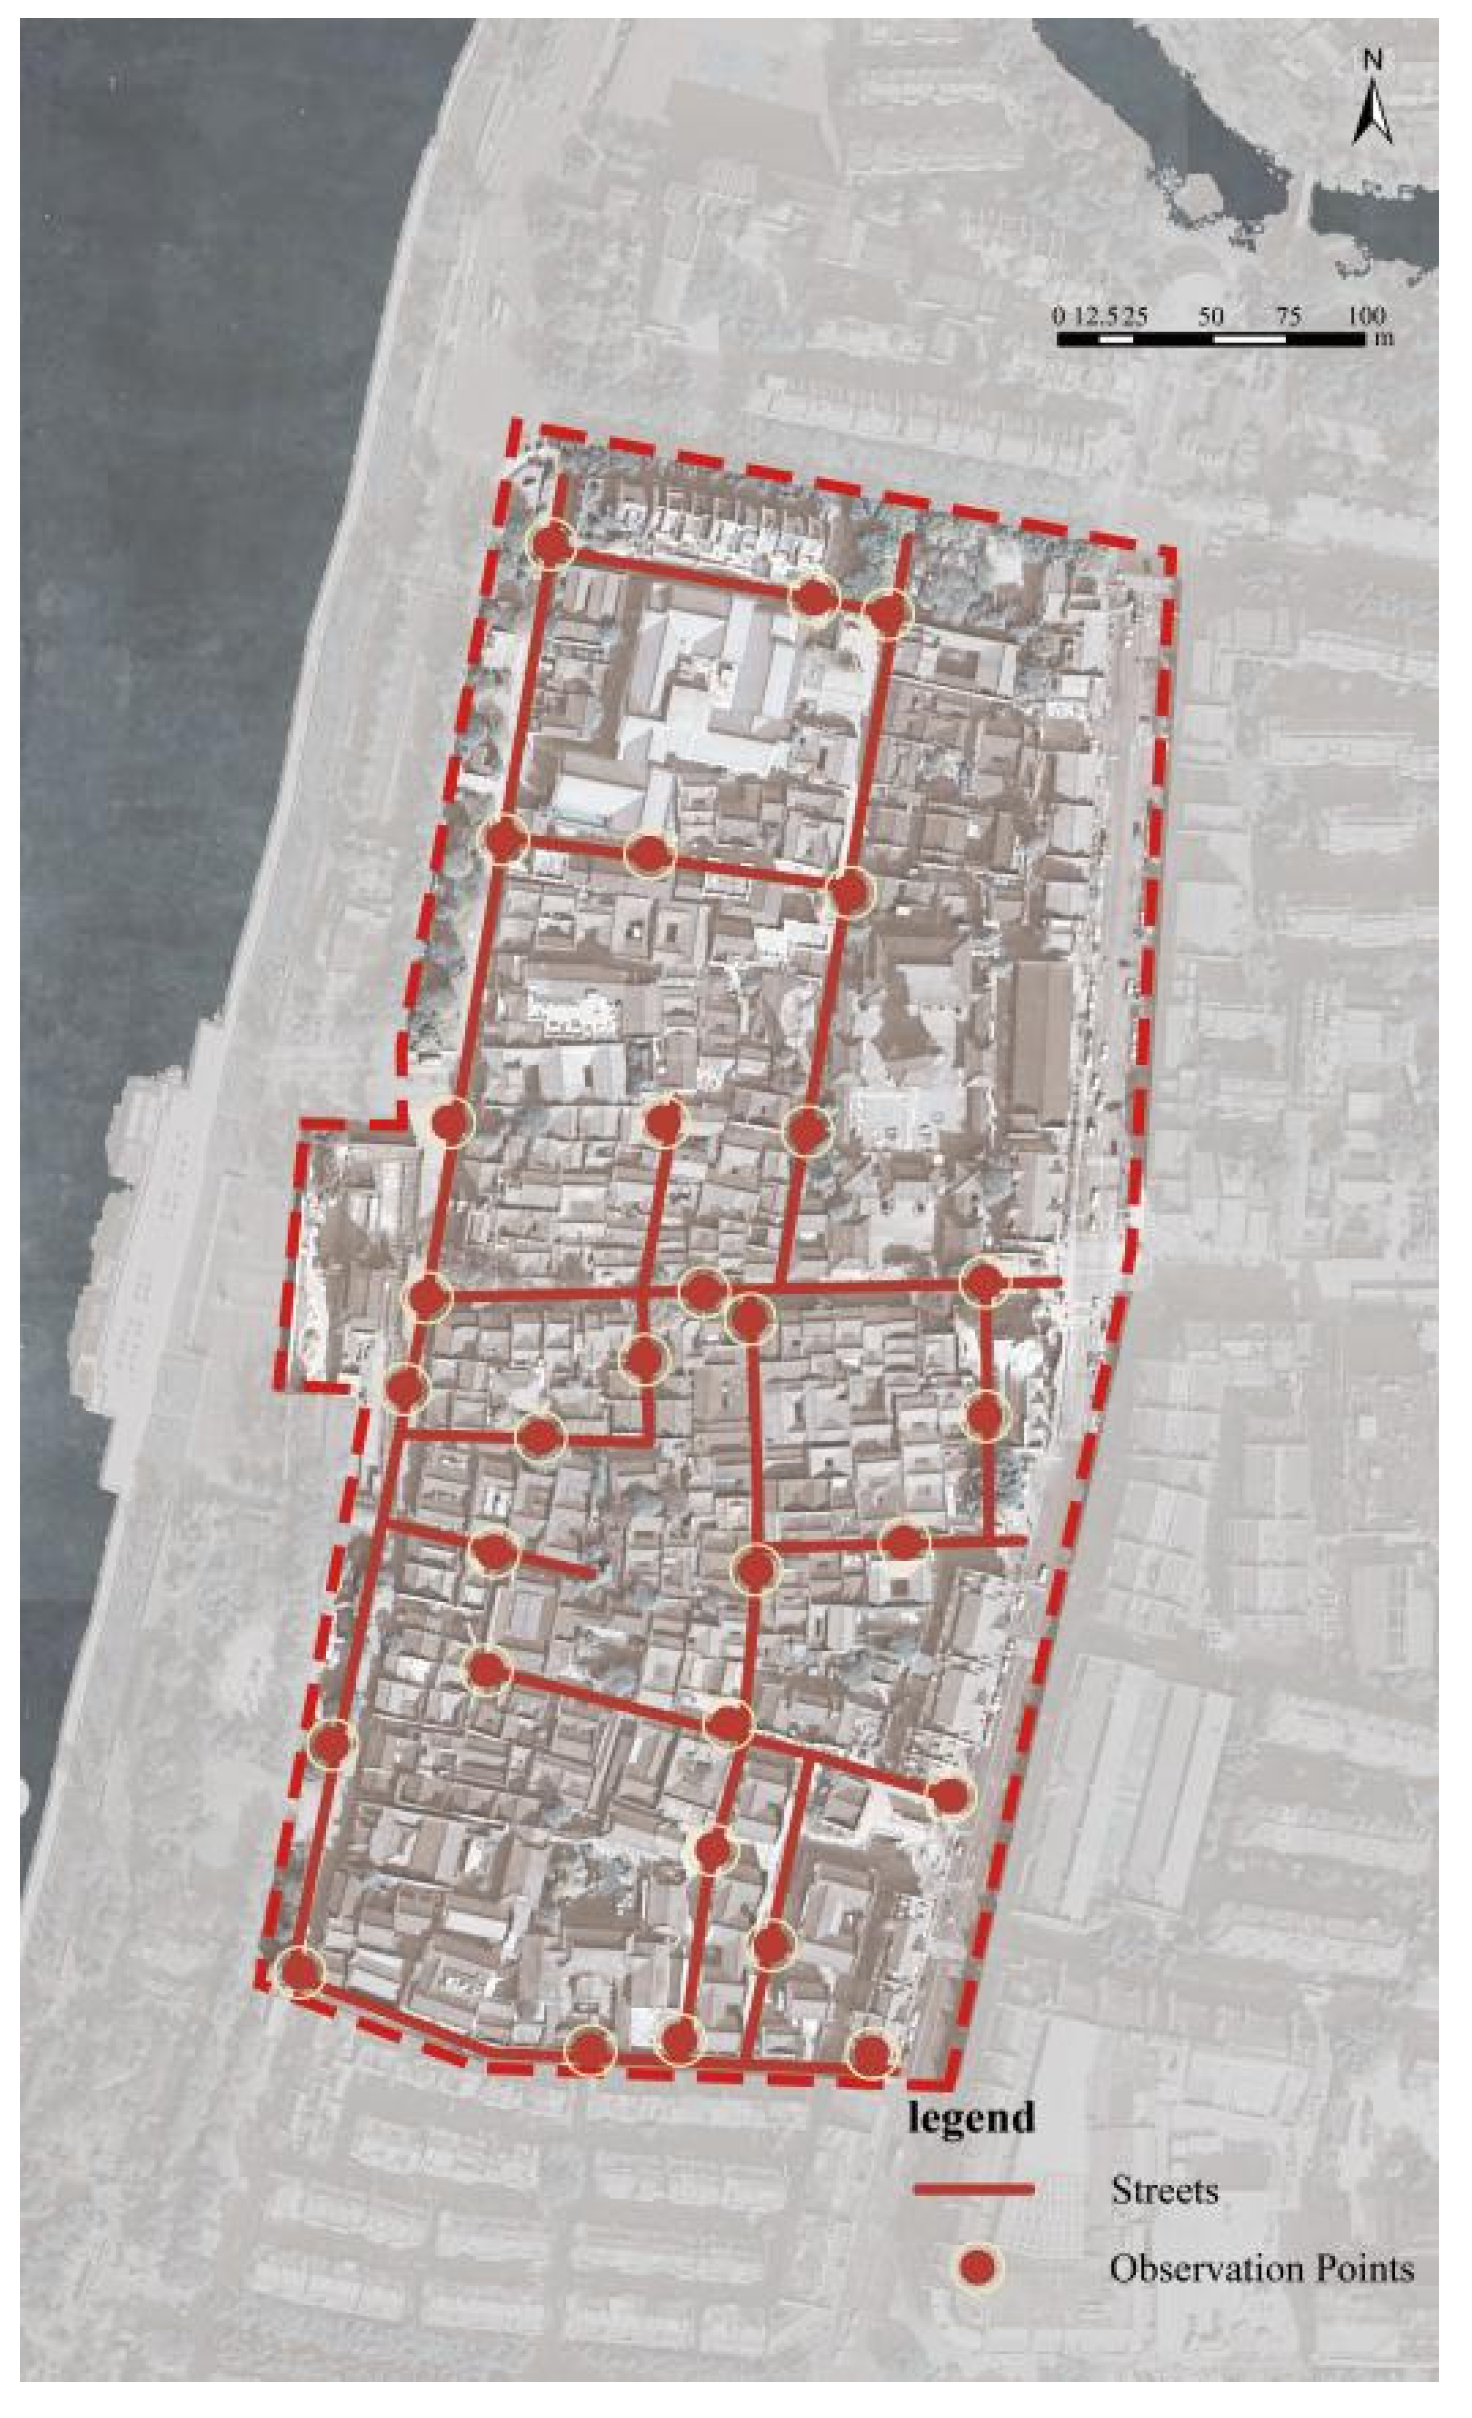
2.1. Study Area
2.2. Data Sources
2.3. Methods
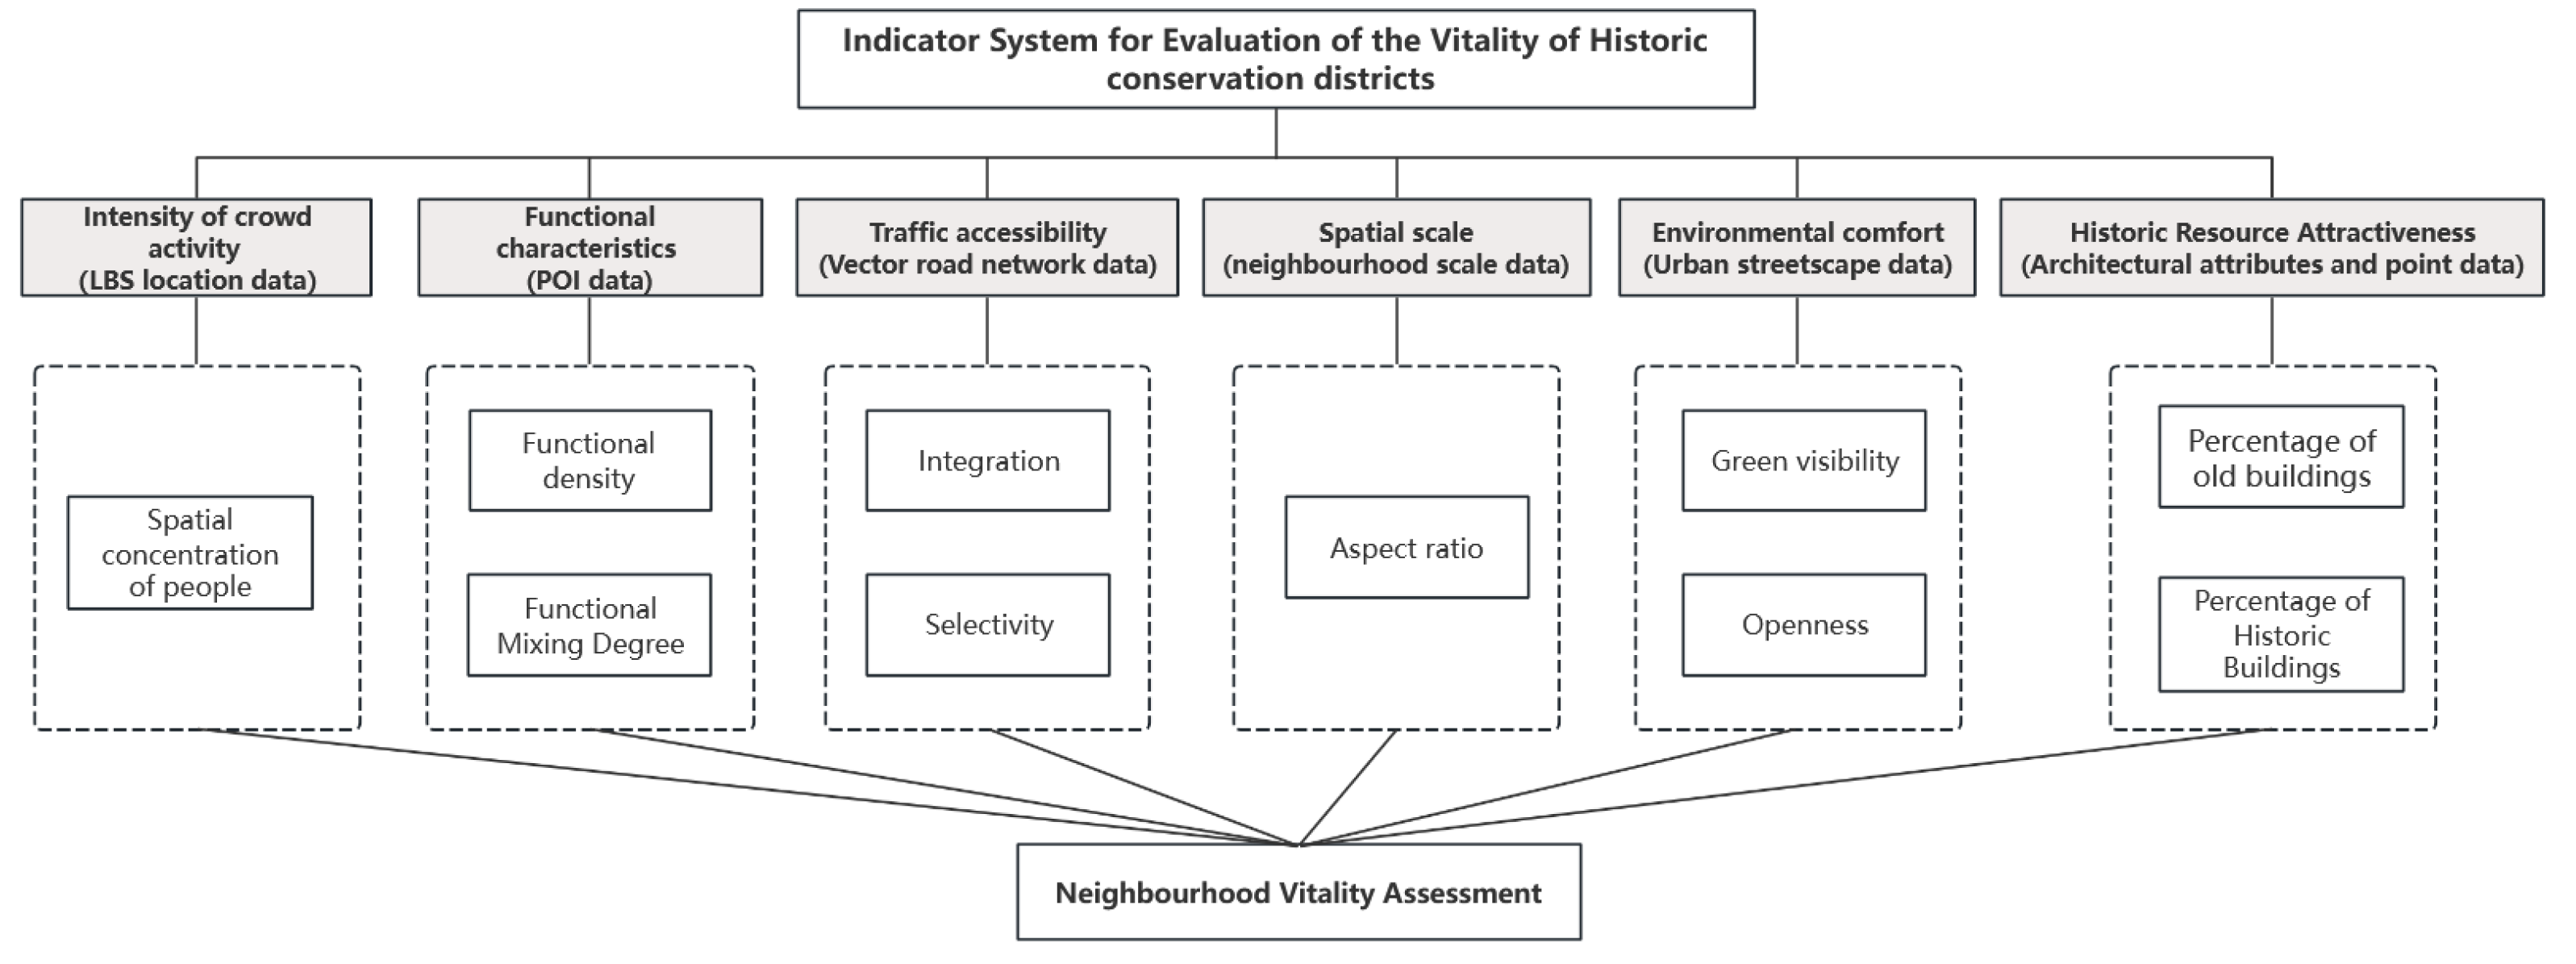
2.3.1. Construction of Evaluation Indicators
2.3.2. Quantification of Indicators
2.3.3. Assignment of Evaluation Indicators
3. Results
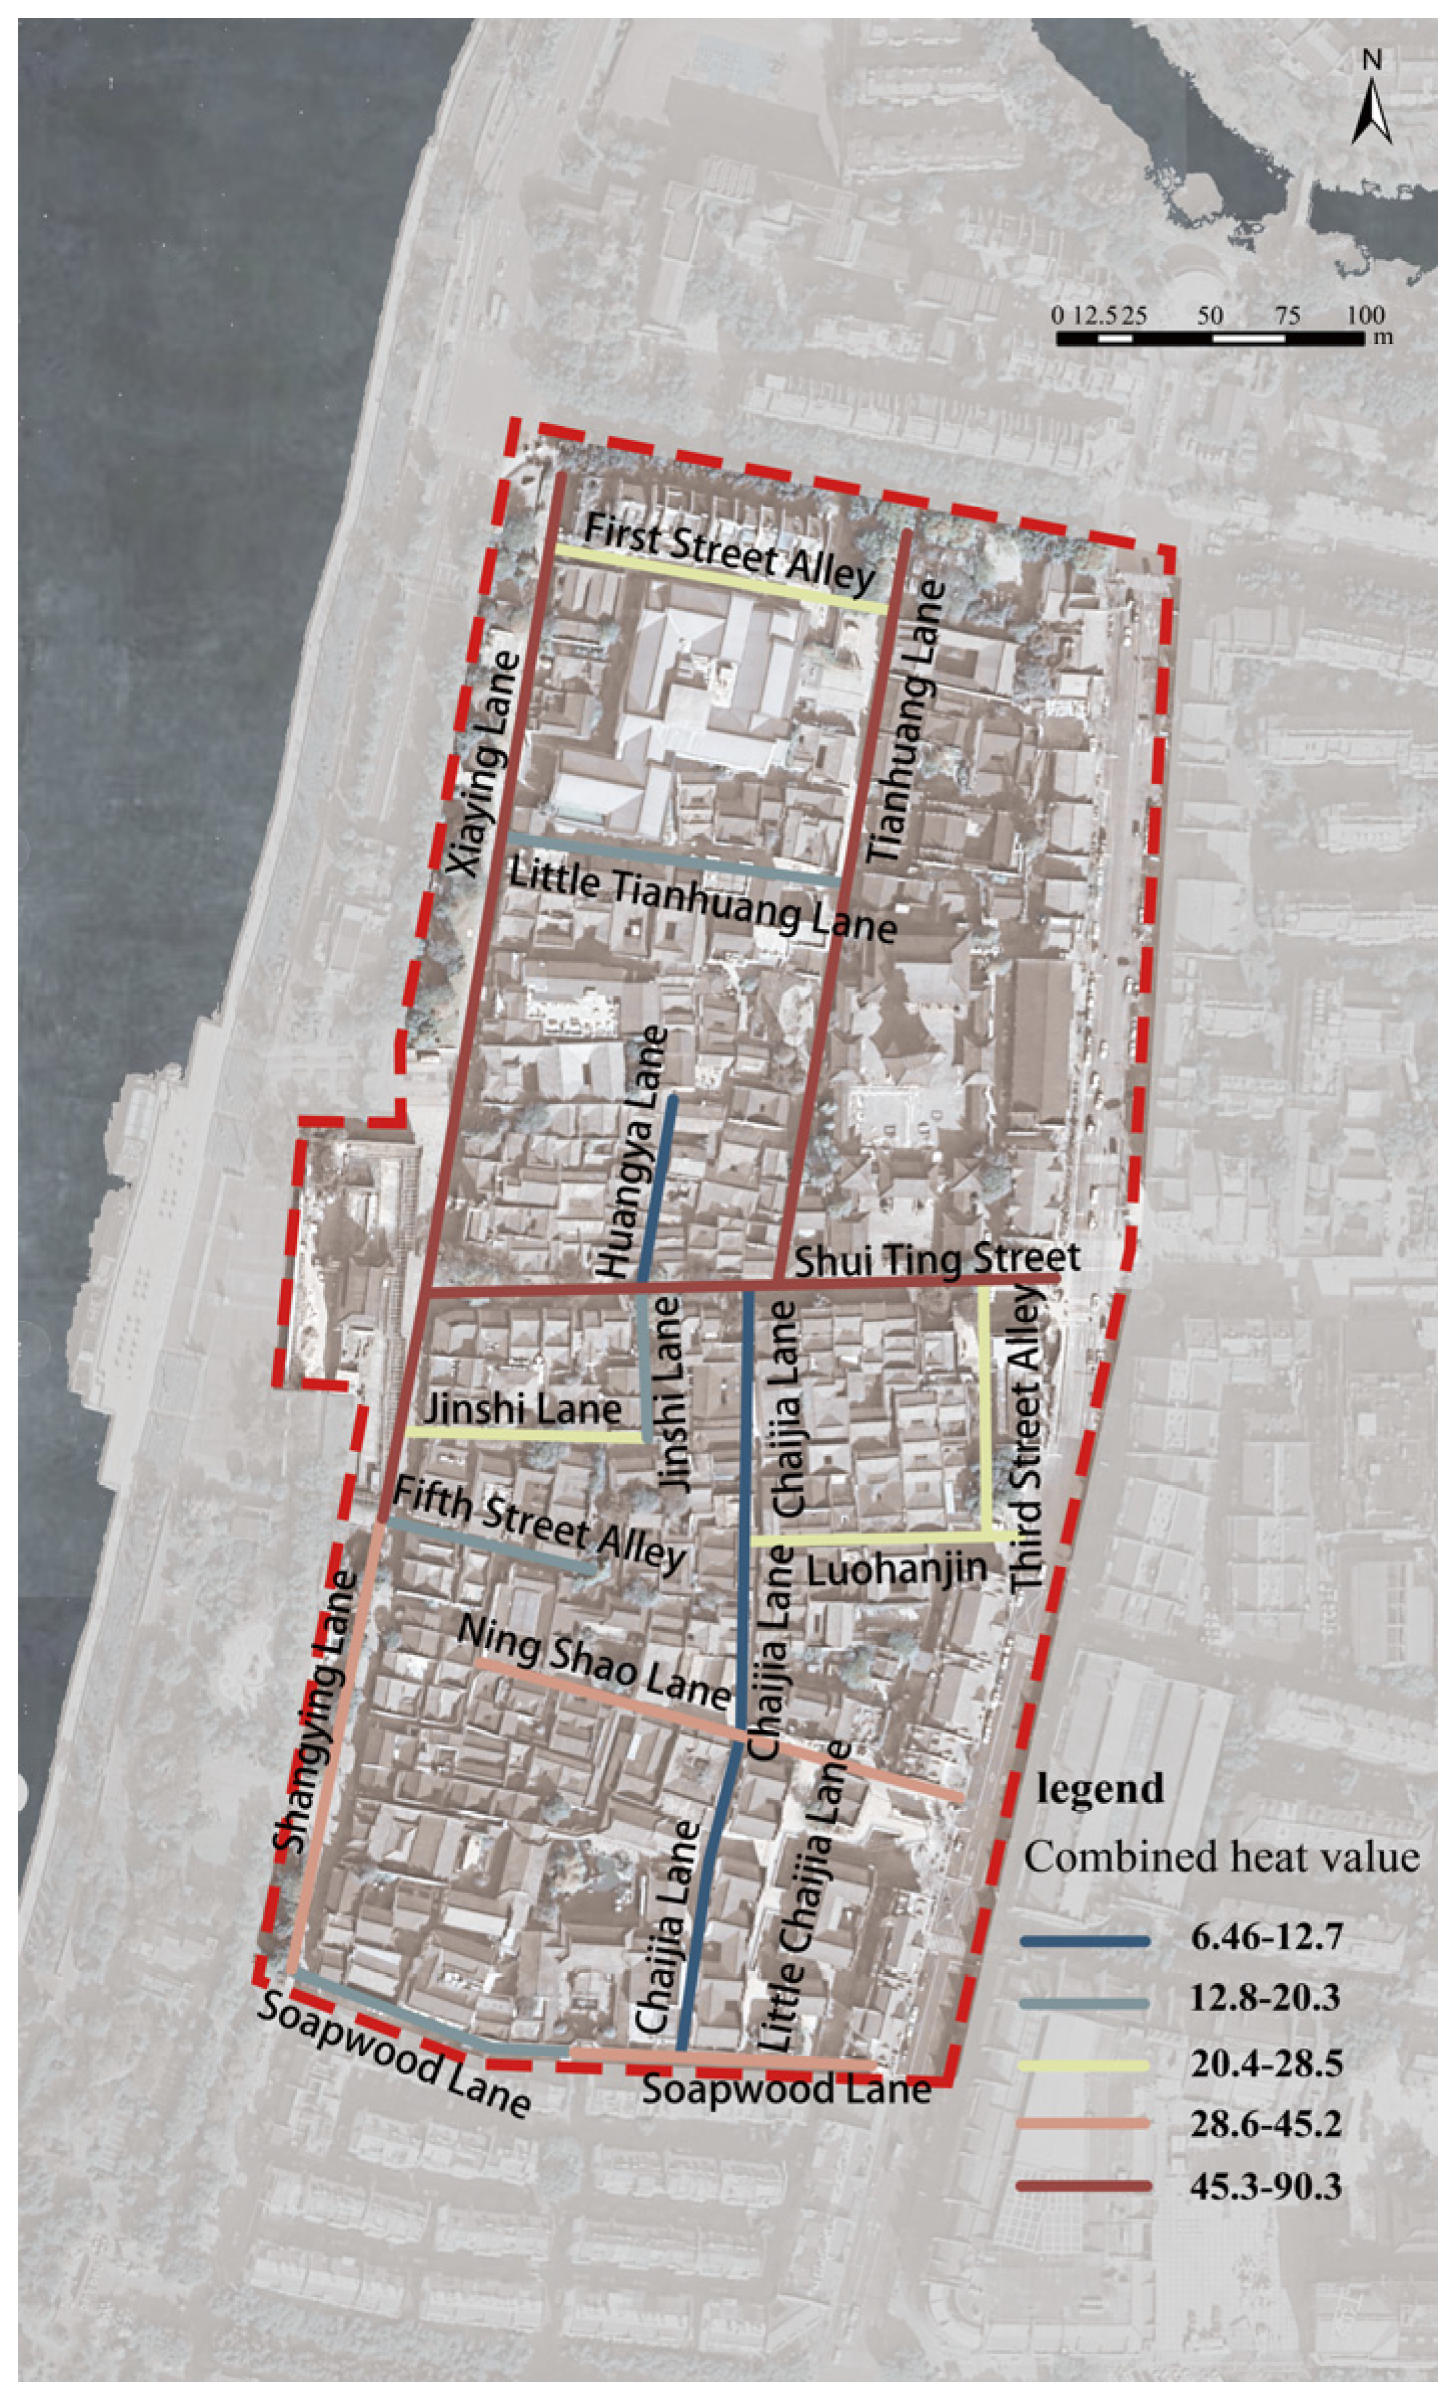
3.1. Characteristics of Temporal and Spatial Vigor Distribution
3.2. Multiple Vitality Influencing Factors
3.2.1. Functional Diversity Analysis
3.2.2. Accessibility Analysis
3.2.3. Spatial Scale and Environmental Quality
3.2.4. Vibrant Contribution of Historical and Cultural Elements
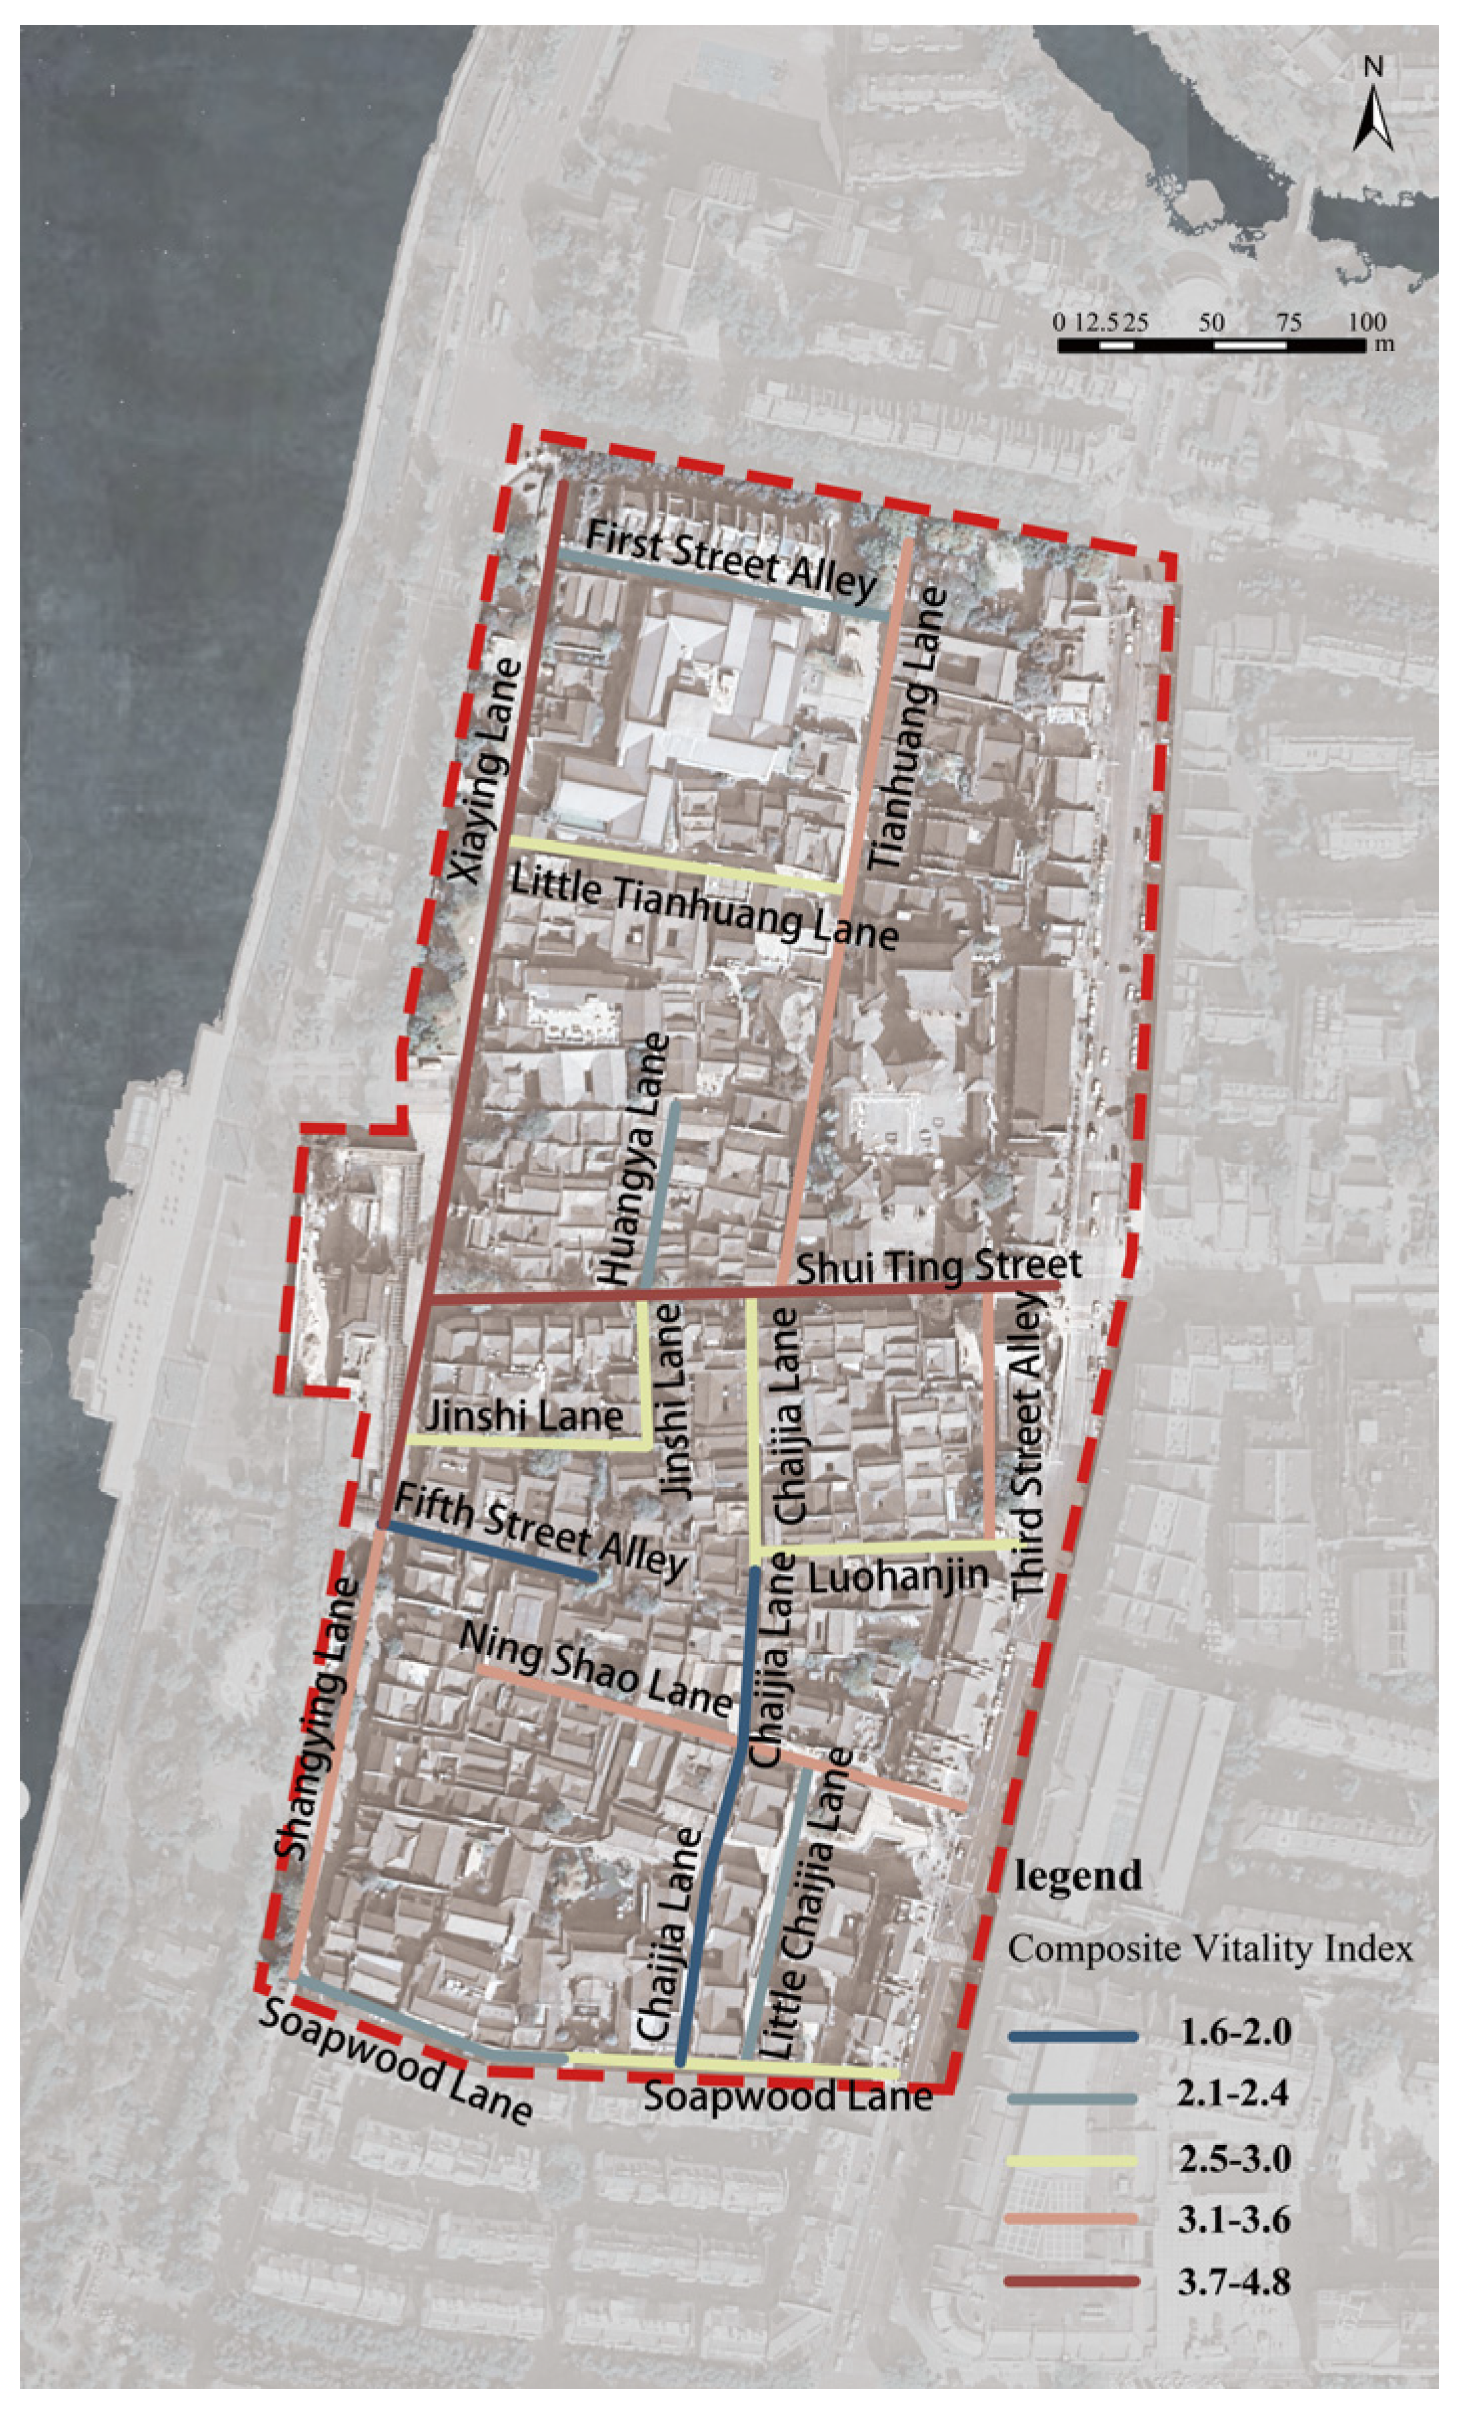
3.3. Comprehensive Vitality Evaluation
3.4. Street Vitality Levels and Compositional Characteristics
4. Discussion
4.1. Issues in Objective Components
- Monotonous Functional Business Forms
- 2.
- Poor Street Connectivity and Commercial Space Encroachment
- 3.
- Unfavorable Aspect Ratios and Enclosed Walking Spaces
- 4.
- Low Greenery and Poor Sky Openness
4.2. Enhancement Strategies
4.2.1. Delineate Functional Zones and Strengthen District Identity
4.2.2. Improve Pedestrian Connectivity to Enhance Accessibility
4.2.3. Adjust Spatial Proportions to Create Comfortable Streets
4.2.4. Enhance Landscape Design to Improve Environmental Comfort
5. Conclusions
Author Contributions
Funding
Data Availability Statement
Acknowledgments
Conflicts of Interest
Appendix A
Appendix B

| Evaluation Factor (from English MS Table 3) | Level 1 (Score 1) | Level 2 (Score 2) | Level 3 (Score 3) | Level 4 (Score 4) | Level 5 (Score 5) | Unit |
|---|---|---|---|---|---|---|
| Spatial concentration of people (C1) | 6.46–12.7 | 12.8–20.3 | 20.4–28.5 | 28.6–45.2 | 45.3–90.3 | Relative Index |
| POI mixing (C2) | 0.003 | 0.004–1.102 | 1.103–1.634 | 1.635–1.909 | 1.910–2.209 | Index (Shannon) |
| POI density (C3) | 0.009 | 0.010–0.037 | 0.038–0.052 | 0.053–0.142 | 0.143–0.279 | POIs/m |
| Road network integration (C4) | 0.996–1.09 | 1.10–1.25 | 1.26–1.46 | 1.47–1.72 | 1.73–2.07 | Index |
| Road network selectivity (C5) | 0.00–0.046 | 0.0461–0.13 | 0.137–0.323 | 0.324–0.595 | 0.596–0.965 | Index |
| Street aspect ratio (C6) | 0.308–0.533 | 0.534–0.760 | 0.761–1.00 | 1.01–1.50 | 1.51–1.89 | Ratio |
| Green vision (C7) (green visibility rate) | 0.000–0.042 | 0.043–0.093 | 0.094–0.151 | 0.152–0.225 | 0.226–0.245 | Proportion (0–1) |
| Sky opening (C8) (sky openness) | 0.030–0.03 | 0.033–0.091 | 0.092–0.110 | 0.111–0.148 | 0.149–0.240 | Proportion (0–1) |
| Percentage of old buildings (C9) | 0.000–6.541 | 6.542–24.74 | 24.748–43.78 | 43.785–59.845 | 59.846–87.10 | % |
| Density of historic elements (C10) | 0 | 1 | 2 | 3–5 | 6–9 | Elements/100 m |
| Composite vitality index (for reference) | 1.6–2.0 | 2.1–2.4 | 2.5–3.0 | 3.1–3.6 | 3.7–4.8 | Index |
References
- Chen, B. Revitalization Strategy in Conservation and Renewal of Historical and Cultural Districts: A Case Study of Shangxiahang in Fuzhou City. J. Landsc. Res. 2021, 13, 57–62. [Google Scholar]
- Li, M.; Liu, J.; Lin, Y.; Xiao, L.; Zhou, J. Revitalizing historic districts: Identifying built environment predictors for street vibrancy based on urban sensor data. Cities 2021, 117, 103305. [Google Scholar] [CrossRef]
- Mouratidis, K.; Poortinga, W. Built environment, urban vitality and social cohesion: Do vibrant neighborhoods foster strong communities? Landsc. Urban Plan. 2020, 204, 103951. [Google Scholar] [CrossRef]
- Lu, L.; Chi, C.G.; Liu, Y. Authenticity, Involvement, and Image: Evaluating Tourist Experiences at Historic Districts. Tour. Manag. 2015, 50, 85–96. [Google Scholar] [CrossRef]
- Zhang, Y.; Han, Y. Vitality Evaluation of Historical and Cultural Districts Based on the Values Dimension: Districts in Beijing City. Chin. Herit. Sci. 2022, 10, 137. [Google Scholar] [CrossRef]
- Yong, H.; Sun, Y. Review on Historical District Preservation and Renovation Practice. Planner 2015, 31, 98–104. [Google Scholar]
- Chen, Y.; Lei, C. Evolution of the Conservation Problems and Planning Strategies of Pingjiang Historic and Cultural Area: Mechanism Simulation Analysis Based on System Dynamics. Urban Plan 2022, 46, 84–95. [Google Scholar]
- Ehrig, S.; Jung, B.C.; Schaffer, G. Exploring the Transnational Neighbourhood: Perspectives on Community-Building, Identity and Belonging; Leuven University Press: Leuven, Belgium, 2022; p. 341. [Google Scholar]
- Jacobs, J. The Death and Life of Great American Cities; Random House: New York, NY, USA, 1961. [Google Scholar]
- Whyte, W. The Social Life of Small Urban Spaces; Project for Public Spaces: New York, NY, USA, 1980. [Google Scholar]
- Lynch, K. The Image of the City; MIT Press: Cambridge, MA, USA, 1964. [Google Scholar]
- Bentley, I. Responsive Environments: A Manual for Designers; Routledge: London, UK, 1985. [Google Scholar]
- Gehl, J. Life Between Buildings: Using Public Space; Island Press: Washington, DC, USA, 2012. [Google Scholar]
- Niu, X.Y.; Wu, W.; Li, M. Influence of built environment on street vitality and its spatiotemporal characteristics based on LBS positioning data. Urban Plan. Int. 2019, 34, 28–37. [Google Scholar] [CrossRef]
- Liu, S.; Ge, J.; Ye, X.; Wu, C.; Bai, M. Urban vitality assessment at the neighborhood scale with geo-data: A review toward implementation. J. Geogr. Sci. 2023, 33, 1482–1504. [Google Scholar] [CrossRef]
- Tong, M. How urban fabric can help sustain the vitality of cities. Urban Plan. Forum 2014, 21, 85–96. [Google Scholar]
- Zhou, C. Research on the Vitality Improvement of Historic and Cultural Block of Guantao Road in Qingdao. Master’s Thesis, Qingdao University of Technology, Qingdao, China, 2019. [Google Scholar]
- Guo, X.; Yang, Y.; Cheng, Z.; Liu, Y. Spatial social interaction: An explanatory framework of urban space vitality and its preliminary verification. Cities 2022, 121, 103487. [Google Scholar] [CrossRef]
- Fodde, E. Fired Brick and Sulphate Attack: The Case of Moenjodaro, Pakistan. J. Archit. Conserv. 2007, 13, 69–80. [Google Scholar] [CrossRef]
- Yu, B.; Sun, J.; Wang, Z.; Chen, Y.; Wang, S. Influencing Factors of Street Vitality in Historic Districts Based on Multisource Data: Evidence from China. ISPRS Int. J. Geo-Inf. 2024, 13, 277. [Google Scholar] [CrossRef]
- Zeng, Z.; Li, Y.; Tang, H. Multidimensional Spatial Driving Factors of Urban Vitality Evolution at the Subdistrict Scale of Changsha City, China, Based on the Time Series of Human Activities. Buildings 2023, 13, 2448. [Google Scholar] [CrossRef]
- Liu, M.; Jiang, Y.; He, J. Quantitative evaluation on street vitality: A case study of Zhoujiadu community in Shanghai. Sustainability 2021, 13, 3027. [Google Scholar] [CrossRef]
- Yue, W.; Chen, Y.; Thy, P.T.M.; Fan, P.; Liu, Y.; Zhang, W. Identifying urban vitality in metropolitan areas of developing countries from a comparative perspective: Ho Chi Minh City versus Shanghai. Sustain. Cities Soc. 2021, 65, 102609. [Google Scholar] [CrossRef]
- Ma, Z. Deep exploration of street view features for identifying urban vitality: A case study of Qingdao city. Int. J. Appl. Earth Obs. Geoinf. 2023, 123, 103476. [Google Scholar] [CrossRef]
- Katz, P. The New Urbanism: Toward an Architecture of Community; McGraw-Hill: New York, NY, USA, 1994. [Google Scholar]
- Montgomery, J. Making a city: Urbanity, vitality and urban design. J. Urban Des. 1998, 3, 93–116. [Google Scholar] [CrossRef]
- Jin, X.; Long, Y.; Sun, W.; Lu, Y.; Yang, X.; Tang, J. Evaluating cities’ vitality and identifying ghost cities in China with emerging geographical data. Cities 2017, 63, 98–109. [Google Scholar] [CrossRef]
- Kang, C.; Fan, D.; Jiao, H. Validating activity, time, and space diversity as essential components of urban vitality. Environ. Plan. B Urban Anal. City Sci. 2021, 48, 1180–1197. [Google Scholar] [CrossRef]
- Chen, M.; Cai, Y.; Guo, S.; Sun, R.; Song, Y.; Shen, X. Evaluating implied urban nature vitality in San Francisco: An interdisciplinary approach combining census data, street view images, and social media analysis. Urban For. Urban Green. 2024, 95, 128289. [Google Scholar] [CrossRef]
- Wu, C.; Ye, X.; Ren, F.; Du, Q. Check-in behaviour and spatio-temporal vibrancy: An exploratory analysis in Shenzhen, China. Cities 2018, 77, 104–116. [Google Scholar] [CrossRef]
- Chu, H.; Shi, X.; Tang, J. Vitality Evaluation and Enhancement Strategies of Wuzhou Historical and Cultural Districts Based on Semantic Differential Method. In Proceedings of the 2024 International Conference on Culture-Oriented Science & Technology (CoST), Beijing, China, 25–28 August 2024; IEEE: Piscataway, NJ, USA, 2024; pp. 126–131. [Google Scholar]
- Song, J.; Zhu, Y.; Chu, X.; Yang, X. Research on the Vitality of Public Spaces in Tourist Villages through Social Network Analysis: A Case Study of Mochou Village in Hubei, China. Land 2024, 13, 359. [Google Scholar] [CrossRef]
- Wang, M.; He, Y.; Meng, H.; Zhang, Y.; Zhu, B.; Mango, J.; Li, X. Assessing Street Space Quality Using Street View Imagery and Function-Driven Method: The Case of Xiamen, China. ISPRS Int. J. Geo-Inf. 2022, 11, 282. [Google Scholar] [CrossRef]
- Rose, G. Seeing the City Digitally: Processing Urban Space and Time; Amsterdam University Press: Amsterdam, The Netherlands, 2022; p. 276. [Google Scholar]
- Wagner, C. Visualizations of Urban Space: Digital Age, Aesthetics, and Politics; Routledge: London, UK, 2022. [Google Scholar]
- Zarin, S.Z.; Niroomand, M.; Heidari, A.A. Physical and social aspects of vitality case study: Traditional street and modern street in Tehran. Procedia Soc. Behav. Sci. 2015, 170, 659–668. [Google Scholar] [CrossRef]
- Long, Y.; Zhou, Y. Quantitative evaluation on street vibrancy and its impact factors: A case study of Chengdu. New Archit. 2016, 1, 52–57. [Google Scholar]
- Wu, Z.-J. Reweaving Cultural Fabrics of Neighborhood Heritage: The Case of Shuitingmen Street Cultural Heritage Study. Stud. Cult. Art. 2012, 5, 19–27. [Google Scholar]
- Paiva, D. The paradox of atmosphere: Tourism, heritage, and urban liveability. Ann. Tour. Res. 2023, 101, 103600. [Google Scholar] [CrossRef]
- Amore, A.; Falk, M.; Adie, B.A. One visitor too many: Assessing the degree of overtourism in established European urban destinations. Int. J. Tour. Cities 2020, 6, 117–137. [Google Scholar] [CrossRef]
- Hao, X.H.; Long, Y.; Shi, M.; Wang, P. Street vibrancy of Beijing: Measurement, impact factors and design implication. Shanghai Urban Plan. Rev. 2016, 3, 26–33. [Google Scholar]
- Ye, Y.Y.; Zhuang, Y.; Zhang, L.; Van Nes, A. Designing urban spatial vitality from morphological perspective—A study based on quantified urban morphology and activities’ testing. Urban Plan. Int. 2016, 31, 26–33. [Google Scholar]
- Huang, D.; Dai, D. Effect of Living Street’s Elements on Vitality: Taking Typical Streets in Shenzhen as an Example. Chin. Landsc. Archit. 2019, 35, 89–94. [Google Scholar]
- Zhang, Y.; Yang, C.; Qi, L. Study on the assessment of street vitality and influencing factors in the historic district—A case study of Shichahai historic district. Chin. Landsc. Archit. 2019, 35, 106–111. [Google Scholar]
- Mao, Z.R.; Chen, X.K.; Xiang, Z.H.; Chen, Y.R. Research on the measurement and influencing factors of street vigour in historic districts: A case study of Wenming Street historic district in Kunming. South Archit. 2021, 4, 54–61. [Google Scholar]
- Zhou, D.; Hu, J.; Wu, L. A study on spatial characteristics and planning guidance of micro public space under the orientation of spatial vitality: A case study of Guangzhou central districts. Urban Dev. Stud. 2021, 28, 24–28. [Google Scholar]
- Li, W.; Jin, B.; Song, Q.; Wang, L.; Zhong, Y. Historic street vibrancy estimation and mechanism: A case study of Liwan District, Guangzhou. Chin. Overseas Archit. 2024, 2, 63–70. [Google Scholar]
- Zachary, D.; Dobson, S. Urban development and complexity: Shannon entropy as a measure of diversity. Plan. Pract. Res. 2021, 36, 157–173. [Google Scholar] [CrossRef]
- Aikoh, T.; Homma, R.; Abe, Y. Comparing conventional manual measurement of the green view index with modern automatic methods using google street view and semantic segmentation. Urban For. Urban Green. 2023, 80, 127845. [Google Scholar] [CrossRef]
- Xia, Y.; Yabuki, N.; Fukuda, T. Sky view factor estimation from street view images based on semantic segmentation. Urban Clim. 2021, 40, 100999. [Google Scholar] [CrossRef]


| Author | Development Intensity | Accessibility | Spatial Form and Scale | Site Classification | Functionality | Historic Resource Elements | Neighbor-Hood Amenity | Other Elements |
|---|---|---|---|---|---|---|---|---|
| Jan Geier [13] (1971) | / | slow traffic | Open block | / | / | / | / | Diversity of space activities |
| Jacobs [9] (1992) | neighborhood scale | accessibility and continuity | Macro -block | / | Functional mix | Mixed building age | / | Spatial richness |
| KatzP [25] (1994) | construction density | / | Walking Scale | / | Functional mix | / | / | / |
| MontgoMery [26] (1998) | / | street connectivity | Street scale, building texture | Land mix | Functional mix | / | Green/ water spaces | Open space |
| Siavash (2011) | neighborhood scale | / | / | / | functional density | / | / | / |
| Zarin [36] (2015) | / | accessibility | / | / | / | / | / | Cultural atmosphere |
| Long Y [37] (2016) | development intensity | accessibility | Interface continuity | Nature of the plot | Functional density, degree of mixing | Iconic building | / | / |
| Hao X H [41] (2016) | / | accessibility | Street length, road texture | / | Functional density, degree of mixing | / | / | / |
| Ye Y [42] (2017) | construction density | accessibility | / | / | Functional mix | / | / | / |
| Dan H [43] (2018) | / | / | Pavement width | / | Functional density, degree of mixing | / | Green rating | Public service density |
| Niu X Y [14] (2019) | / | accessibility | Minor street code | / | Functional mix | Old building | / | / |
| Zhang Y Y [44] (2019) | / | accessibility | / | / | / | Attractive-ness of historical resources | / | Commercial attraction |
| Mao Z R [45] (2021) | / | accessibility | Neighborhood scale (aspect ratio, enclosure, openness) | / | Functional density, degree of mixing | / | Street green visibility | Situation of public facilities |
| Zhou D L [46] (2021) | / | accessibility | / | / | Functional mix | / | Green Configuration | Facility Functional Configuration |
| Li W [47] (2024) | / | integration, selectivity | Comprehensibility | / | Functional density, degree of mixing | Historic building density | / | / |
| Dimension | Category | Indicator | Source of Data | Quantitative Model | Formula | Formula Description |
|---|---|---|---|---|---|---|
| multi-source big data | LBS location data | Spatial concentration of people | Baidu Heat | Data overlay, vectorization | / | / |
| POI data | Functional density | Gaode Map | Information entropy | The number of POI functions refers to the number of functional business POIs. | ||
| Functional mix | Shannon Entropy Index [48] | i denotes the POI category and Pi denotes the ratio of the number of POIs in category i to the total number of POIs in the neighborhood. | ||||
| Vector road network data | Integration | Baidu Map | Depthmap integration, selectivity calculation | / | / | |
| selectivity | / | / | ||||
| Neighborhood-scale data | Street height and width | Actual Test | Data overlay, vectorization | Di is the width of the street and Fi is the number of stories of building i within the street buffer, and n average floor height of 3 m per story is assumed for calculating building height. | ||
| Building attribute and point data | Percentage of old floor space | Gaode Maps | nuclear density method | Soldi represents the floor area of the old buildings in street buffer zone i, and St represents the total floor area of the buildings in zone i. | ||
| Density of historical elements | The historical number of POIs means the number of historical element POIs. | |||||
| City streetscape data | Green visibility [49] | Baidu Street View | Semantic segmentation, data overlay | Gi denotes the sum of pixels occupied by the greenery in image i, and Vi denotes the sum of the ith facet domains. | ||
| Openness to the sky [50] | Si denotes the sum of the pixels of the sky in image i, and Vi denotes the sum of the ith field. |
| Target Level | Standardized Layer | Weights | Factor Level | Weights | Combined Weights |
|---|---|---|---|---|---|
| Neighborhood Vitality Evaluation Indicator System (A) | LBS thermal data (B1) | 0.3826 | Spatial concentration of people (C1) | 1 | 0.3826 |
| POI data (B2) | 0.2518 | POI mixing (C2) POI density (C3) | 0.6667 0.3333 | 0.1679 0.0839 | |
| Vector road network data (B3) | 0.0486 | Road network integration (C4) Road network selectivity (C5) | 0.6667 0.3333 | 0.0324 0.0162 | |
| Neighborhood scale data (B4) | 0.067 | Street aspect ratio (C6) | 1 | 0.067 | |
| Urban streetscape data (B6) | 0.0958 | Green vision (C7) Sky opening (C8) | 0.5 0.5 | 0.0479 0.0479 | |
| Building outline and attribute data (B5) | 0.1543 | Percentage of old buildings (C9) Density of historic elements (C10) | 0.25 0.75 | 0.0386 0.1157 |
| Street | Functional Density (pcs/m) | Functional Mixing Degree |
|---|---|---|
| Shui Ting Street 1 | 0.244 | 2.166 |
| Tianhuang Lane 2 | 0.049 | 1.355 |
| First Street Alley 3 | 0.023 | 0.640 |
| Little Tianhuang Lane 4 | 0.031 | 1.043 |
| Huangya Lane 5 | 0.121 | 1.497 |
| Jinshi Lane 6 | 0.142 | 1.634 |
| Jinshi Lane 7 | 0.279 | 1.811 |
| Chaijia Lane 8 | 0.104 | 1.597 |
| Chaijia Lane 9 | 0.031 | 0.003 |
| Chaijia Lane 10 | 0.037 | 0.003 |
| Luohanjing 11 | 0.097 | 1.584 |
| Ning Shao Lane 12 | 0.084 | 2.086 |
| Third Street Alley 13 | 0.107 | 1.889 |
| Little Chaijia Lane 14 | 0.009 | 0.003 |
| Soapwood Lane 15 | 0.029 | 1.102 |
| Soapwood Lane 16 | 0.034 | 1.043 |
| Xiaying Lane 17 | 0.049 | 1.909 |
| Shangying Lane 18 | 0.051 | 2.209 |
| Fifth Street Alley 19 | 0.052 | 1.043 |
| Street | Degree of Integration | Selectivity |
|---|---|---|
| Shui Ting Street 1 | 2.072 | 0.965 |
| Tianhuang Lane 2 | 1.606 | 0.484 |
| First Street Alley 3 | 1.253 | 0.080 |
| Little Tianhuang Lane 4 | 1.338 | 0.136 |
| Huangya Lane 5 | 1.352 | 0.043 |
| Jinshi Lane 6 | 1.212 | 0.117 |
| Jinshi Lane 7 | 1.374 | 0.046 |
| Chaijia Lane 8 | 1.576 | 0.304 |
| Chaijia Lane 9 | 1.285 | 0.236 |
| Chaijia Lane 10 | 0.996 | 0.075 |
| Luohanjing 11 | 1.331 | 0.028 |
| Ning Shao Lane 12 | 1.212 | 0.066 |
| Third Street Alley 13 | 1.460 | 0.041 |
| Little Chaijia Lane 14 | 1.000 | 0.058 |
| Soapwood Lane 15 | 1.004 | 0.059 |
| Soapwood Lane 16 | 1.235 | 0.206 |
| Xiaying Lane 17 | 1.147 | 0.323 |
| Shangying Lane 18 | 1.724 | 0.595 |
| Fifth Street Alley 19 | 1.179 | 0.003 |
| Street | Aspect Ratio | Green Rating | Sky Openness |
|---|---|---|---|
| Shui Ting Street 1 | 1.426 | 0.240 | 0.095 |
| Tianhuang Lane 2 | 0.588 | 0.151 | 0.107 |
| First Street Alley 3 | 1.000 | 0.078 | 0.134 |
| Little Tianhuang Lane 4 | 1.300 | 0.027 | 0.148 |
| Huangya Lane 5 | 0.308 | 0.074 | 0.030 |
| Jinshi Lane 6 | 0.844 | 0.224 | 0.086 |
| Jinshi Lane 7 | 0.711 | 0.127 | 0.074 |
| Chaijia Lane 8 | 0.533 | 0.030 | 0.089 |
| Chaijia Lane 9 | 0.645 | 0.011 | 0.092 |
| Chaijia Lane 10 | 0.645 | 0.001 | 0.110 |
| Luohanjing 11 | 0.504 | 0.000 | 0.086 |
| Ning Shao Lane 12 | 1.495 | 0.127 | 0.128 |
| Third Street Alley 13 | 1.220 | 0.225 | 0.101 |
| Little Chaijia Lane 14 | 1.167 | 0.093 | 0.124 |
| Soapwood Lane 15 | 1.258 | 0.042 | 0.227 |
| Soapwood Lane 16 | 1.000 | 0.237 | 0.178 |
| Xiaying Lane 17 | 1.000 | 0.239 | 0.188 |
| Shangying Lane 18 | 1.889 | 0.245 | 0.240 |
| Fifth Street Alley 19 | 0.760 | 0.212 | 0.032 |
| Street | Percentage of Old Buildings | Density of Historical Elements (pcs/100 m) |
|---|---|---|
| Shui Ting Street 1 | 87.1% | 9 |
| Tianhuang Lane 2 | 80.3% | 3 |
| First Street Alley 3 | 16.9% | 2 |
| Little Tianhuang Lane 4 | 32.4% | 2 |
| Huangya Lane 5 | 59.8% | 3 |
| Jinshi Lane 6 | 22.2% | 1 |
| Jinshi Lane 7 | 43.8% | 5 |
| Chaijia Lane 8 | 50.7% | 4 |
| Chaijia Lane 9 | 32.3% | 1 |
| Chaijia Lane 10 | 6.5% | 1 |
| Luohanjing 11 | 55.3% | 4 |
| Ning Shao Lane 12 | 39.1% | 2 |
| Third Street Alley 13 | 41.9% | 1 |
| Little Chaijia Lane 14 | 7.7% | 1 |
| Soapwood Lane 15 | 23.5% | 1 |
| Soapwood Lane 16 | 24.7% | 1 |
| Xiaying Lane 17 | 37.3% | 1 |
| Shangying Lane 18 | 52.3% | 2 |
| Fifth Street Alley 19 | 0.0% | 0 |
| Street Name | Street Code | Composite Vitality Index |
|---|---|---|
| Shui Ting Street | 1 | 4.8 |
| Shangying Lane | 18 | 4.2 |
| Tianhuang Lane | 2 | 3.6 |
| Ning Shao Lane | 12 | 3.5 |
| Xiaying Lane | 17 | 3.4 |
| Third Street Alley | 13 | 3.2 |
| Soapwood Lane | 16 | 3 |
| Jinshi Lane | 7 | 2.9 |
| Little Tianhuang Lane | 4 | 2.7 |
| Jinshi Lane | 6 | 2.7 |
| Chaijia Lane | 8 | 2.7 |
| luohanjing | 11 | 2.6 |
| Huangya Lane | 5 | 2.4 |
| Soapwood Lane | 15 | 2.4 |
| First Street Alley | 3 | 2.3 |
| Little Chaijia Lane | 14 | 2.1 |
| Chaijia Lane | 9 | 2 |
| Fifth Street Alley | 19 | 1.9 |
| Chaijia Lane | 10 | 1.6 |
| Vitality Level | Neighbor-hood Code | Functional Characteristics | Walking Accessibility | Space Scale | Environmental Comfort | Attractiveness of Historical Resources | ||||
|---|---|---|---|---|---|---|---|---|---|---|
| POI Mixedness Rating | POI Density Rating | Selectivity Rating | Integration Rating | Aspect Ratio Ratings | Green Ratings | Sky Openness Rating | Percentage of Old Buildings Scored | Historical Density Ratings | ||
| Higher Vitality Streets | 1 | √ | √ | √ | √ | √ | √ | √ | √ | √ |
| 2 | √ | √ | √ | √ | ○ | √ | √ | √ | √ | |
| 12 | √ | √ | ○ | ○ | √ | √ | √ | √ | √ | |
| 18 | √ | √ | √ | √ | √ | √ | √ | √ | √ | |
| Medium Vibrancy Streets | 3 | ○ | ○ | ○ | ○ | √ | ○ | ○ | ○ | √ |
| 6 | √ | √ | ○ | ○ | √ | √ | ○ | ○ | ○ | |
| 7 | √ | √ | ○ | √ | ○ | √ | ○ | √ | √ | |
| 11 | √ | √ | ○ | √ | ○ | ○ | ○ | √ | √ | |
| 13 | √ | √ | ○ | √ | √ | √ | √ | √ | ○ | |
| Inferiority Vitality Streets | 4 | ○ | ○ | ○ | √ | √ | ○ | √ | ○ | √ |
| 5 | √ | √ | ○ | √ | ○ | ○ | ○ | √ | √ | |
| 16 | ○ | ○ | √ | ○ | √ | √ | √ | ○ | ○ | |
| 17 | √ | √ | √ | ○ | √ | √ | √ | √ | ○ | |
Disclaimer/Publisher’s Note: The statements, opinions and data contained in all publications are solely those of the individual author(s) and contributor(s) and not of MDPI and/or the editor(s). MDPI and/or the editor(s) disclaim responsibility for any injury to people or property resulting from any ideas, methods, instructions or products referred to in the content. |
© 2025 by the authors. Published by MDPI on behalf of the International Society for Photogrammetry and Remote Sensing. Licensee MDPI, Basel, Switzerland. This article is an open access article distributed under the terms and conditions of the Creative Commons Attribution (CC BY) license (https://creativecommons.org/licenses/by/4.0/).
Share and Cite
Zheng, G.; Ding, L.; Zheng, J. A Multi-Dimensional Evaluation of Street Vitality in a Historic Neighborhood Using Multi-Source Geo-Data: A Case Study of Shuitingmen, Quzhou. ISPRS Int. J. Geo-Inf. 2025, 14, 240. https://doi.org/10.3390/ijgi14070240
Zheng G, Ding L, Zheng J. A Multi-Dimensional Evaluation of Street Vitality in a Historic Neighborhood Using Multi-Source Geo-Data: A Case Study of Shuitingmen, Quzhou. ISPRS International Journal of Geo-Information. 2025; 14(7):240. https://doi.org/10.3390/ijgi14070240
Chicago/Turabian StyleZheng, Guoquan, Lingli Ding, and Jiehui Zheng. 2025. "A Multi-Dimensional Evaluation of Street Vitality in a Historic Neighborhood Using Multi-Source Geo-Data: A Case Study of Shuitingmen, Quzhou" ISPRS International Journal of Geo-Information 14, no. 7: 240. https://doi.org/10.3390/ijgi14070240
APA StyleZheng, G., Ding, L., & Zheng, J. (2025). A Multi-Dimensional Evaluation of Street Vitality in a Historic Neighborhood Using Multi-Source Geo-Data: A Case Study of Shuitingmen, Quzhou. ISPRS International Journal of Geo-Information, 14(7), 240. https://doi.org/10.3390/ijgi14070240