

Text Geolocation Prediction via Self-Supervised Learning
 , ,
, ,
Abstract
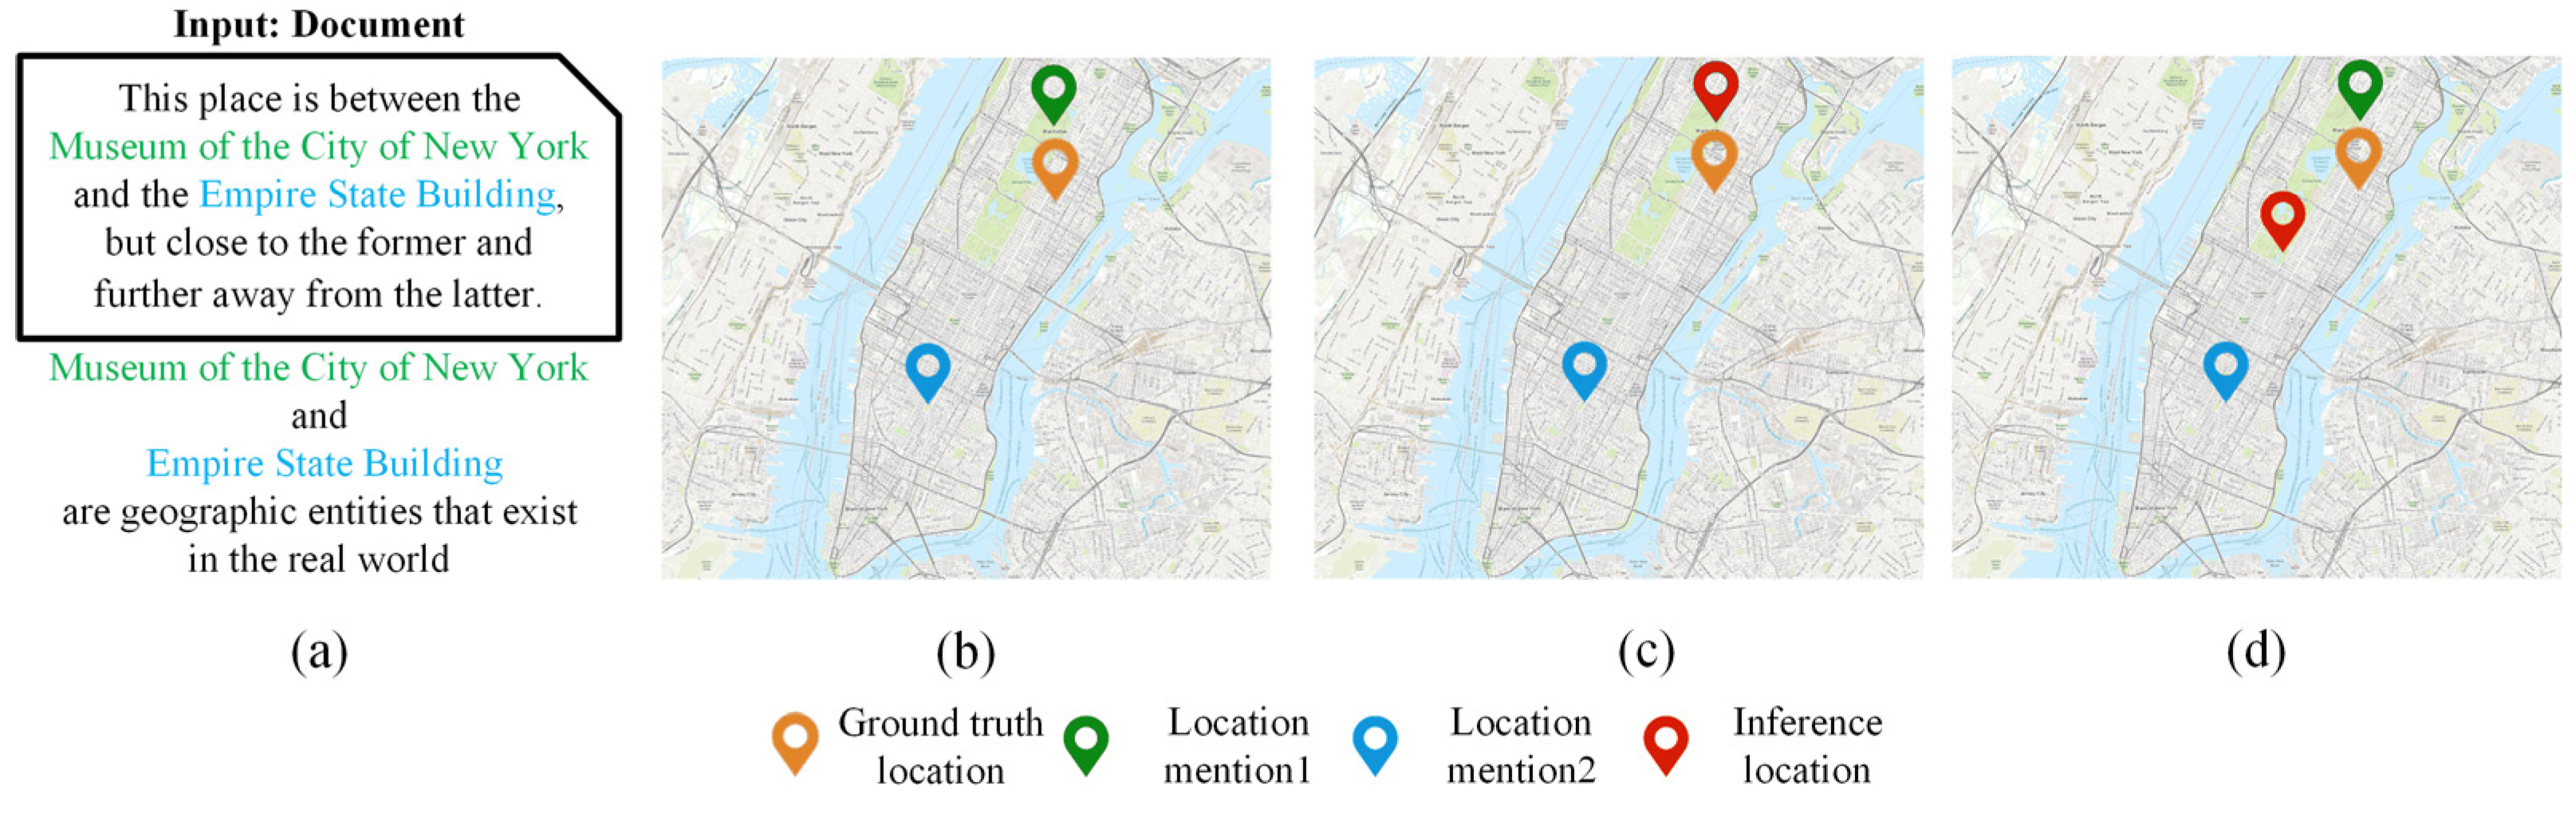
1. Introduction
2. Related Work
2.1. Text Geolocation Prediction Methods
2.2. Machine Learning Models Without Labeled Samples
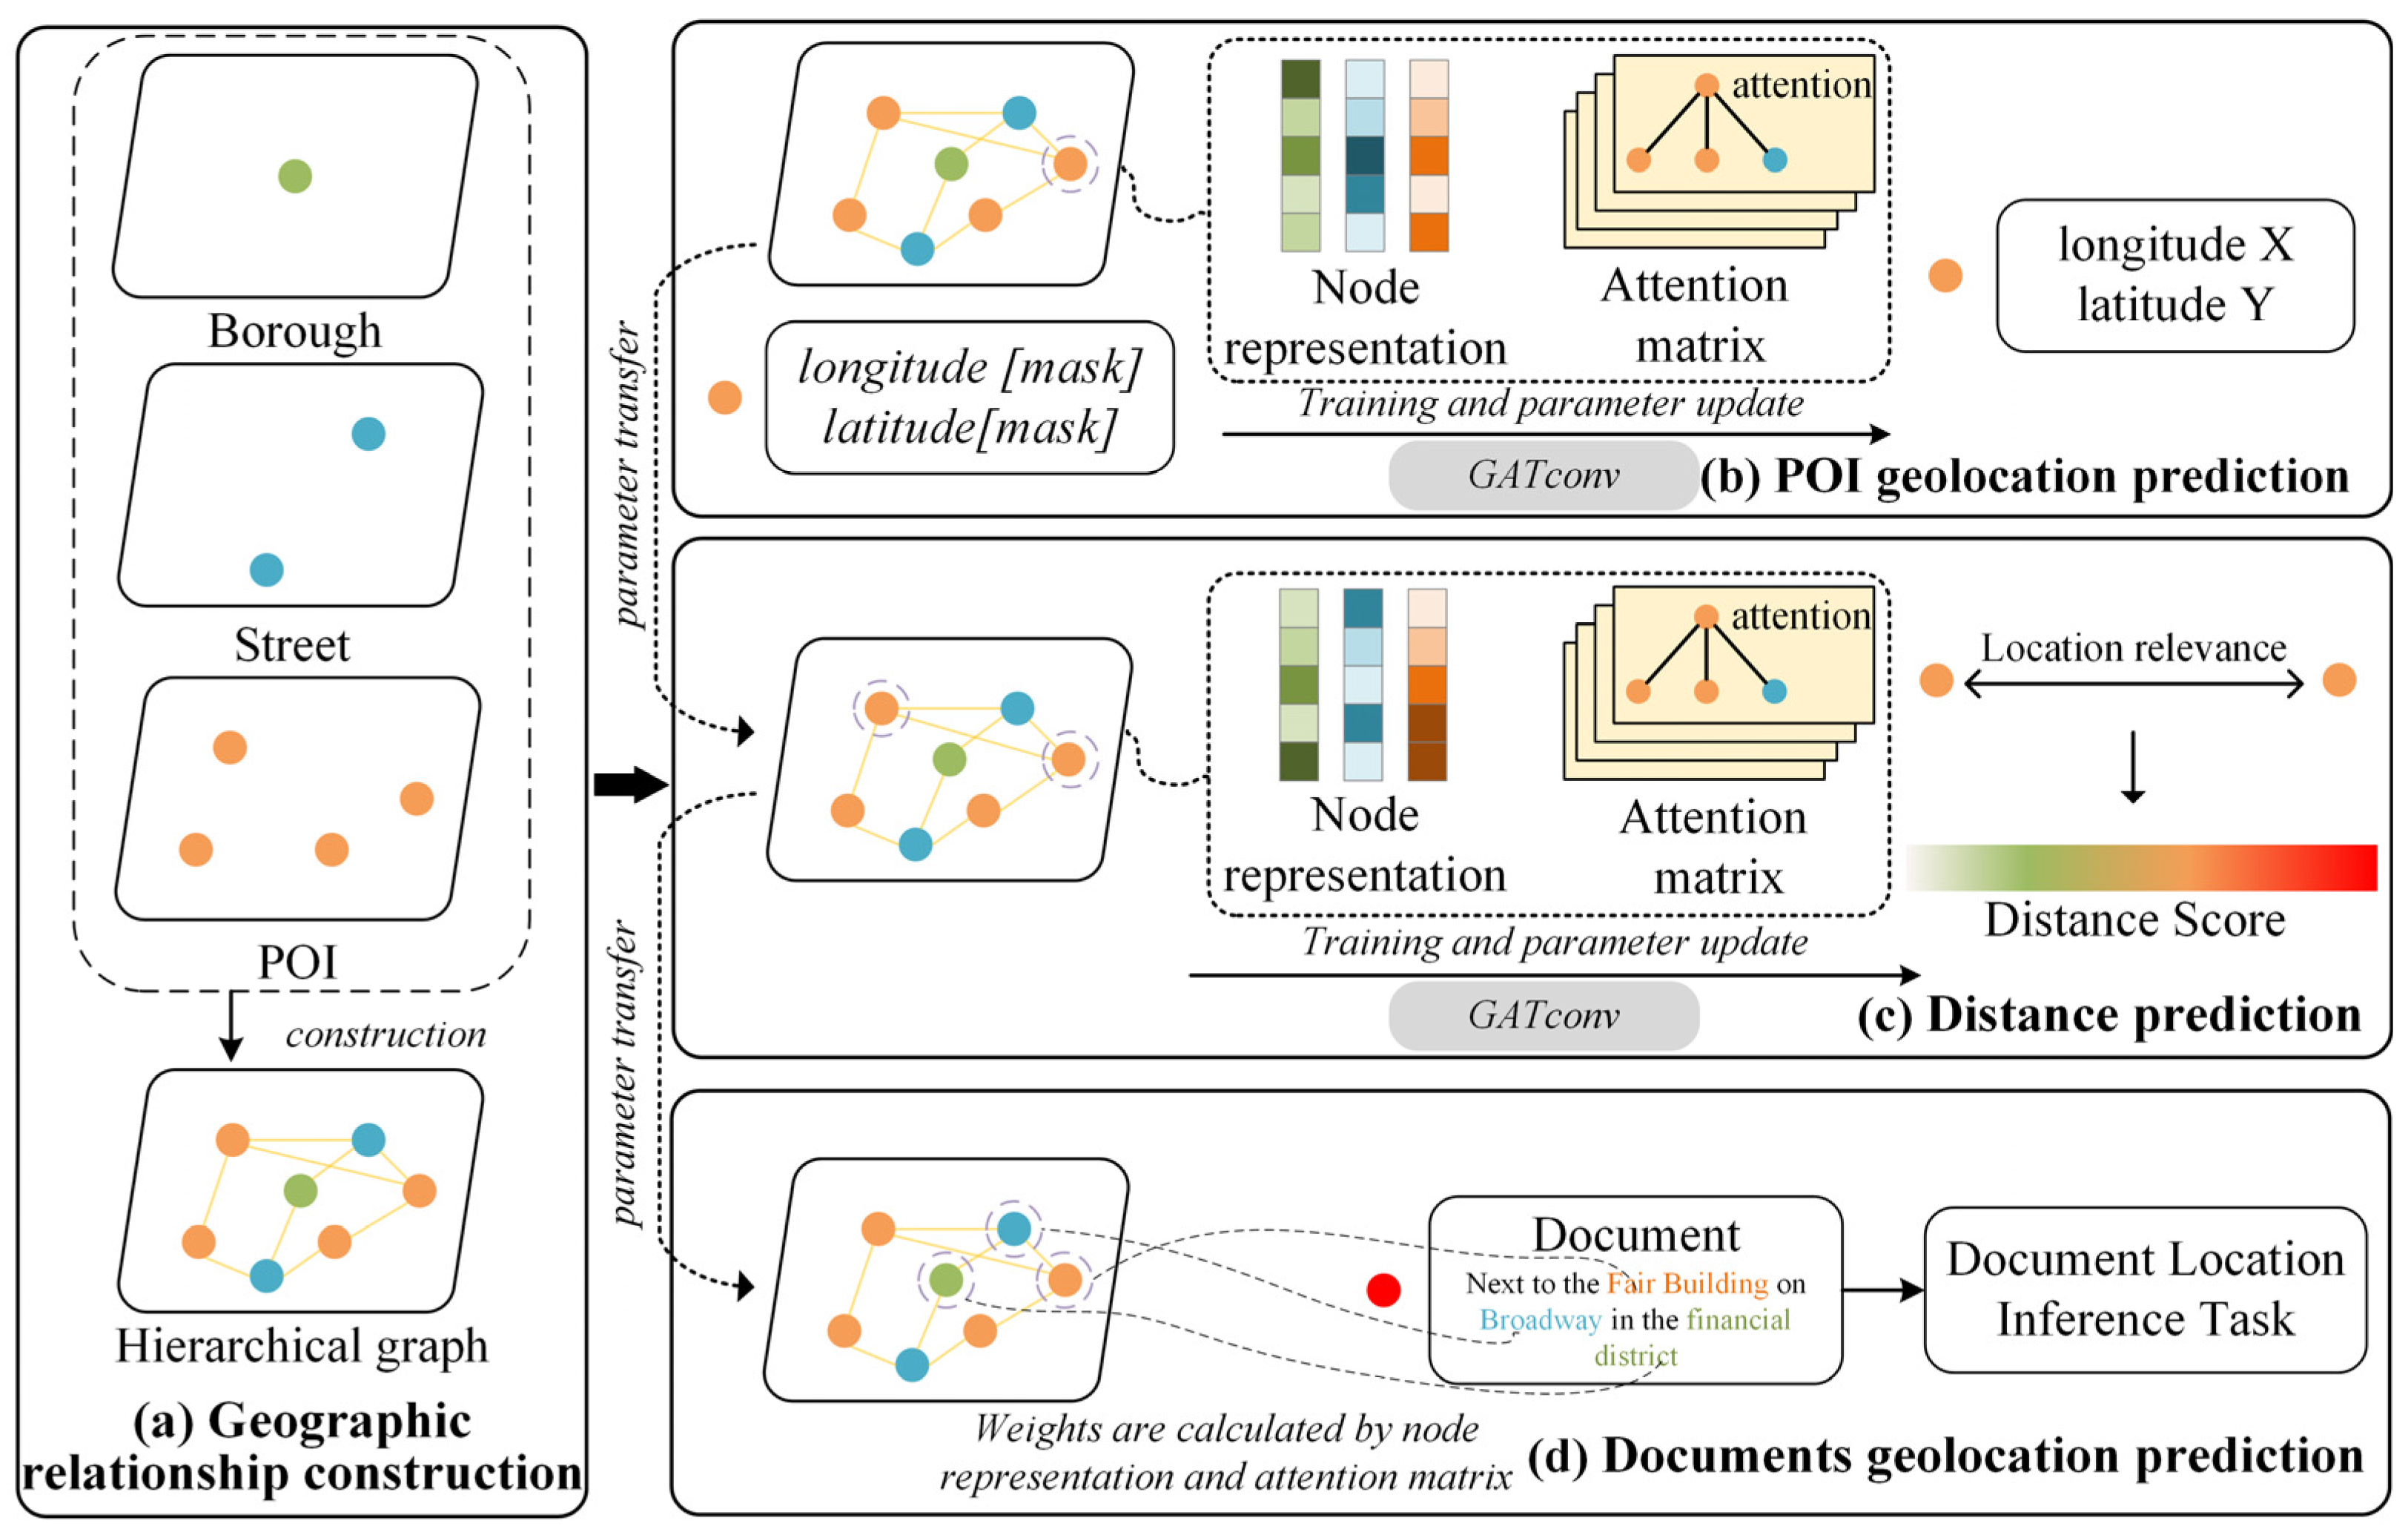
3. Method
3.1. Overview
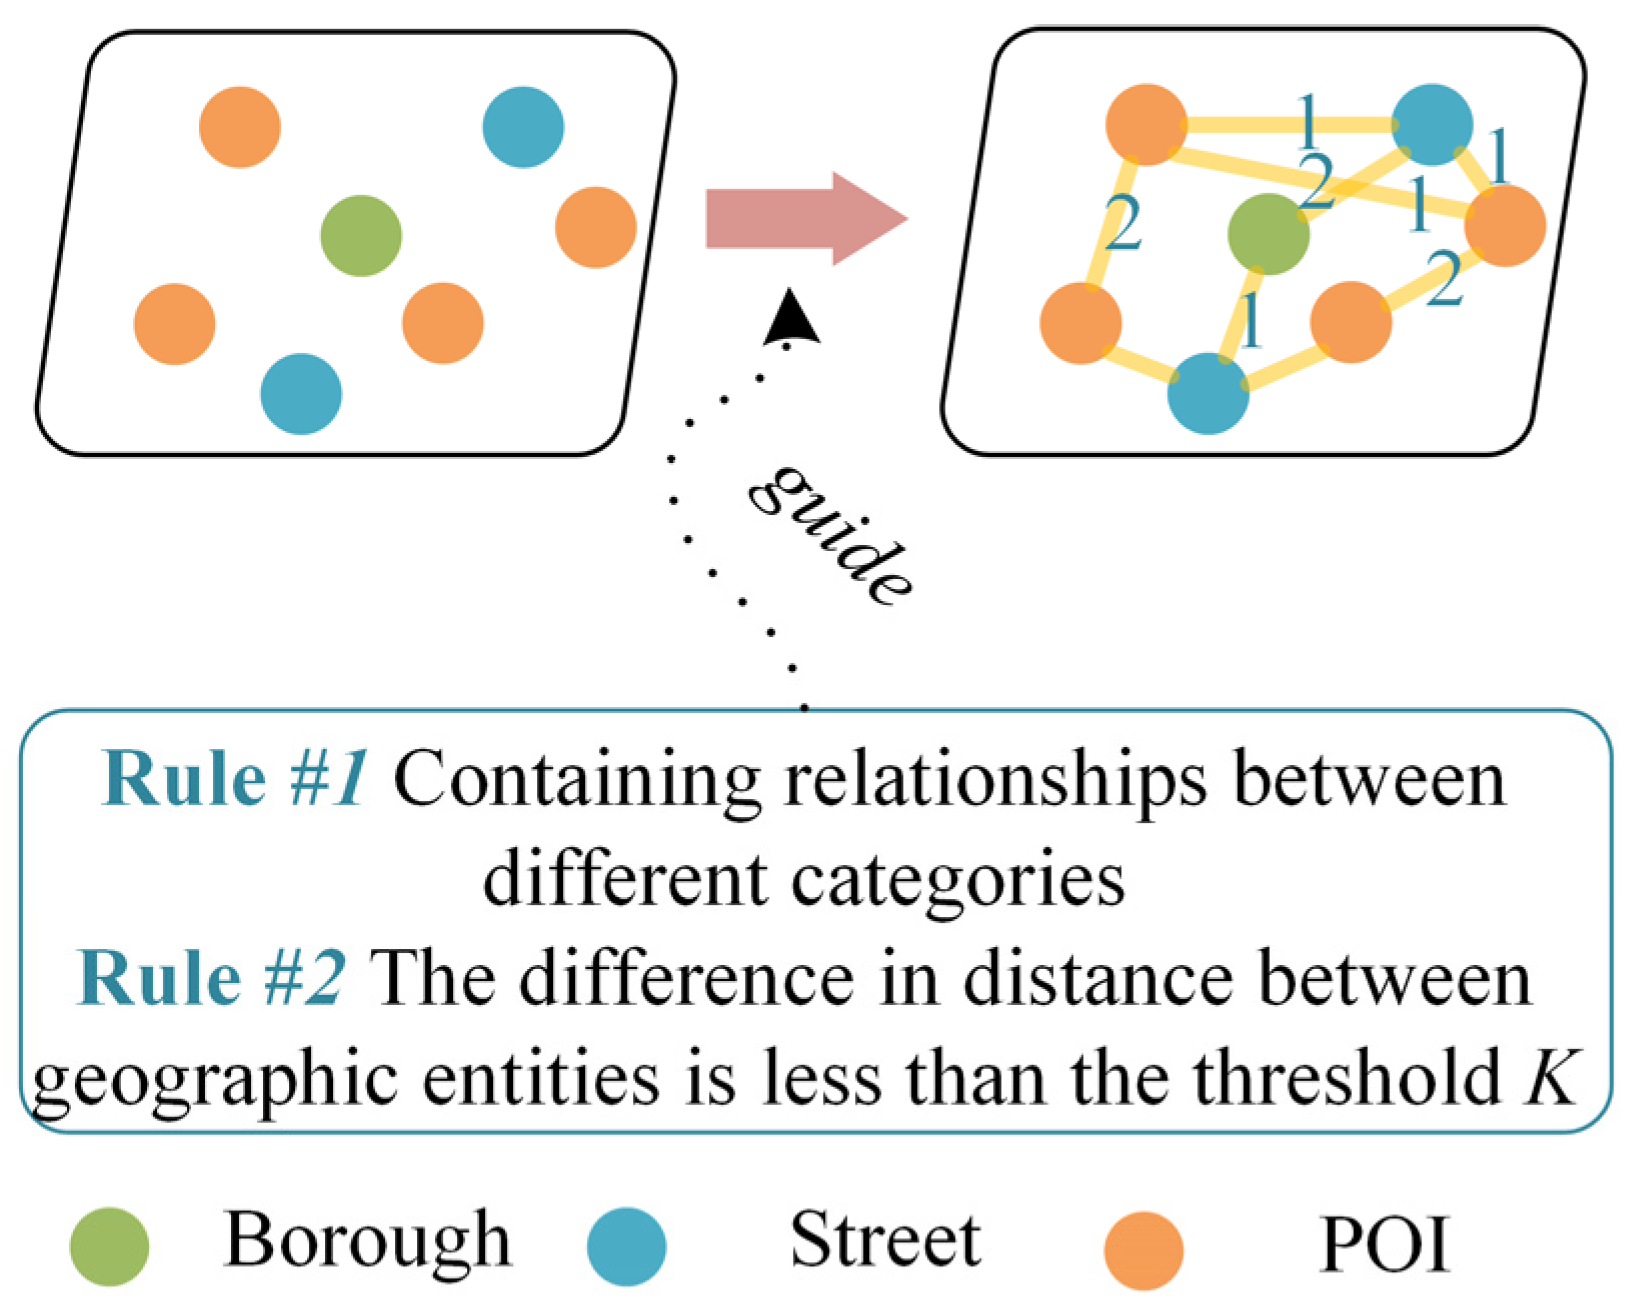
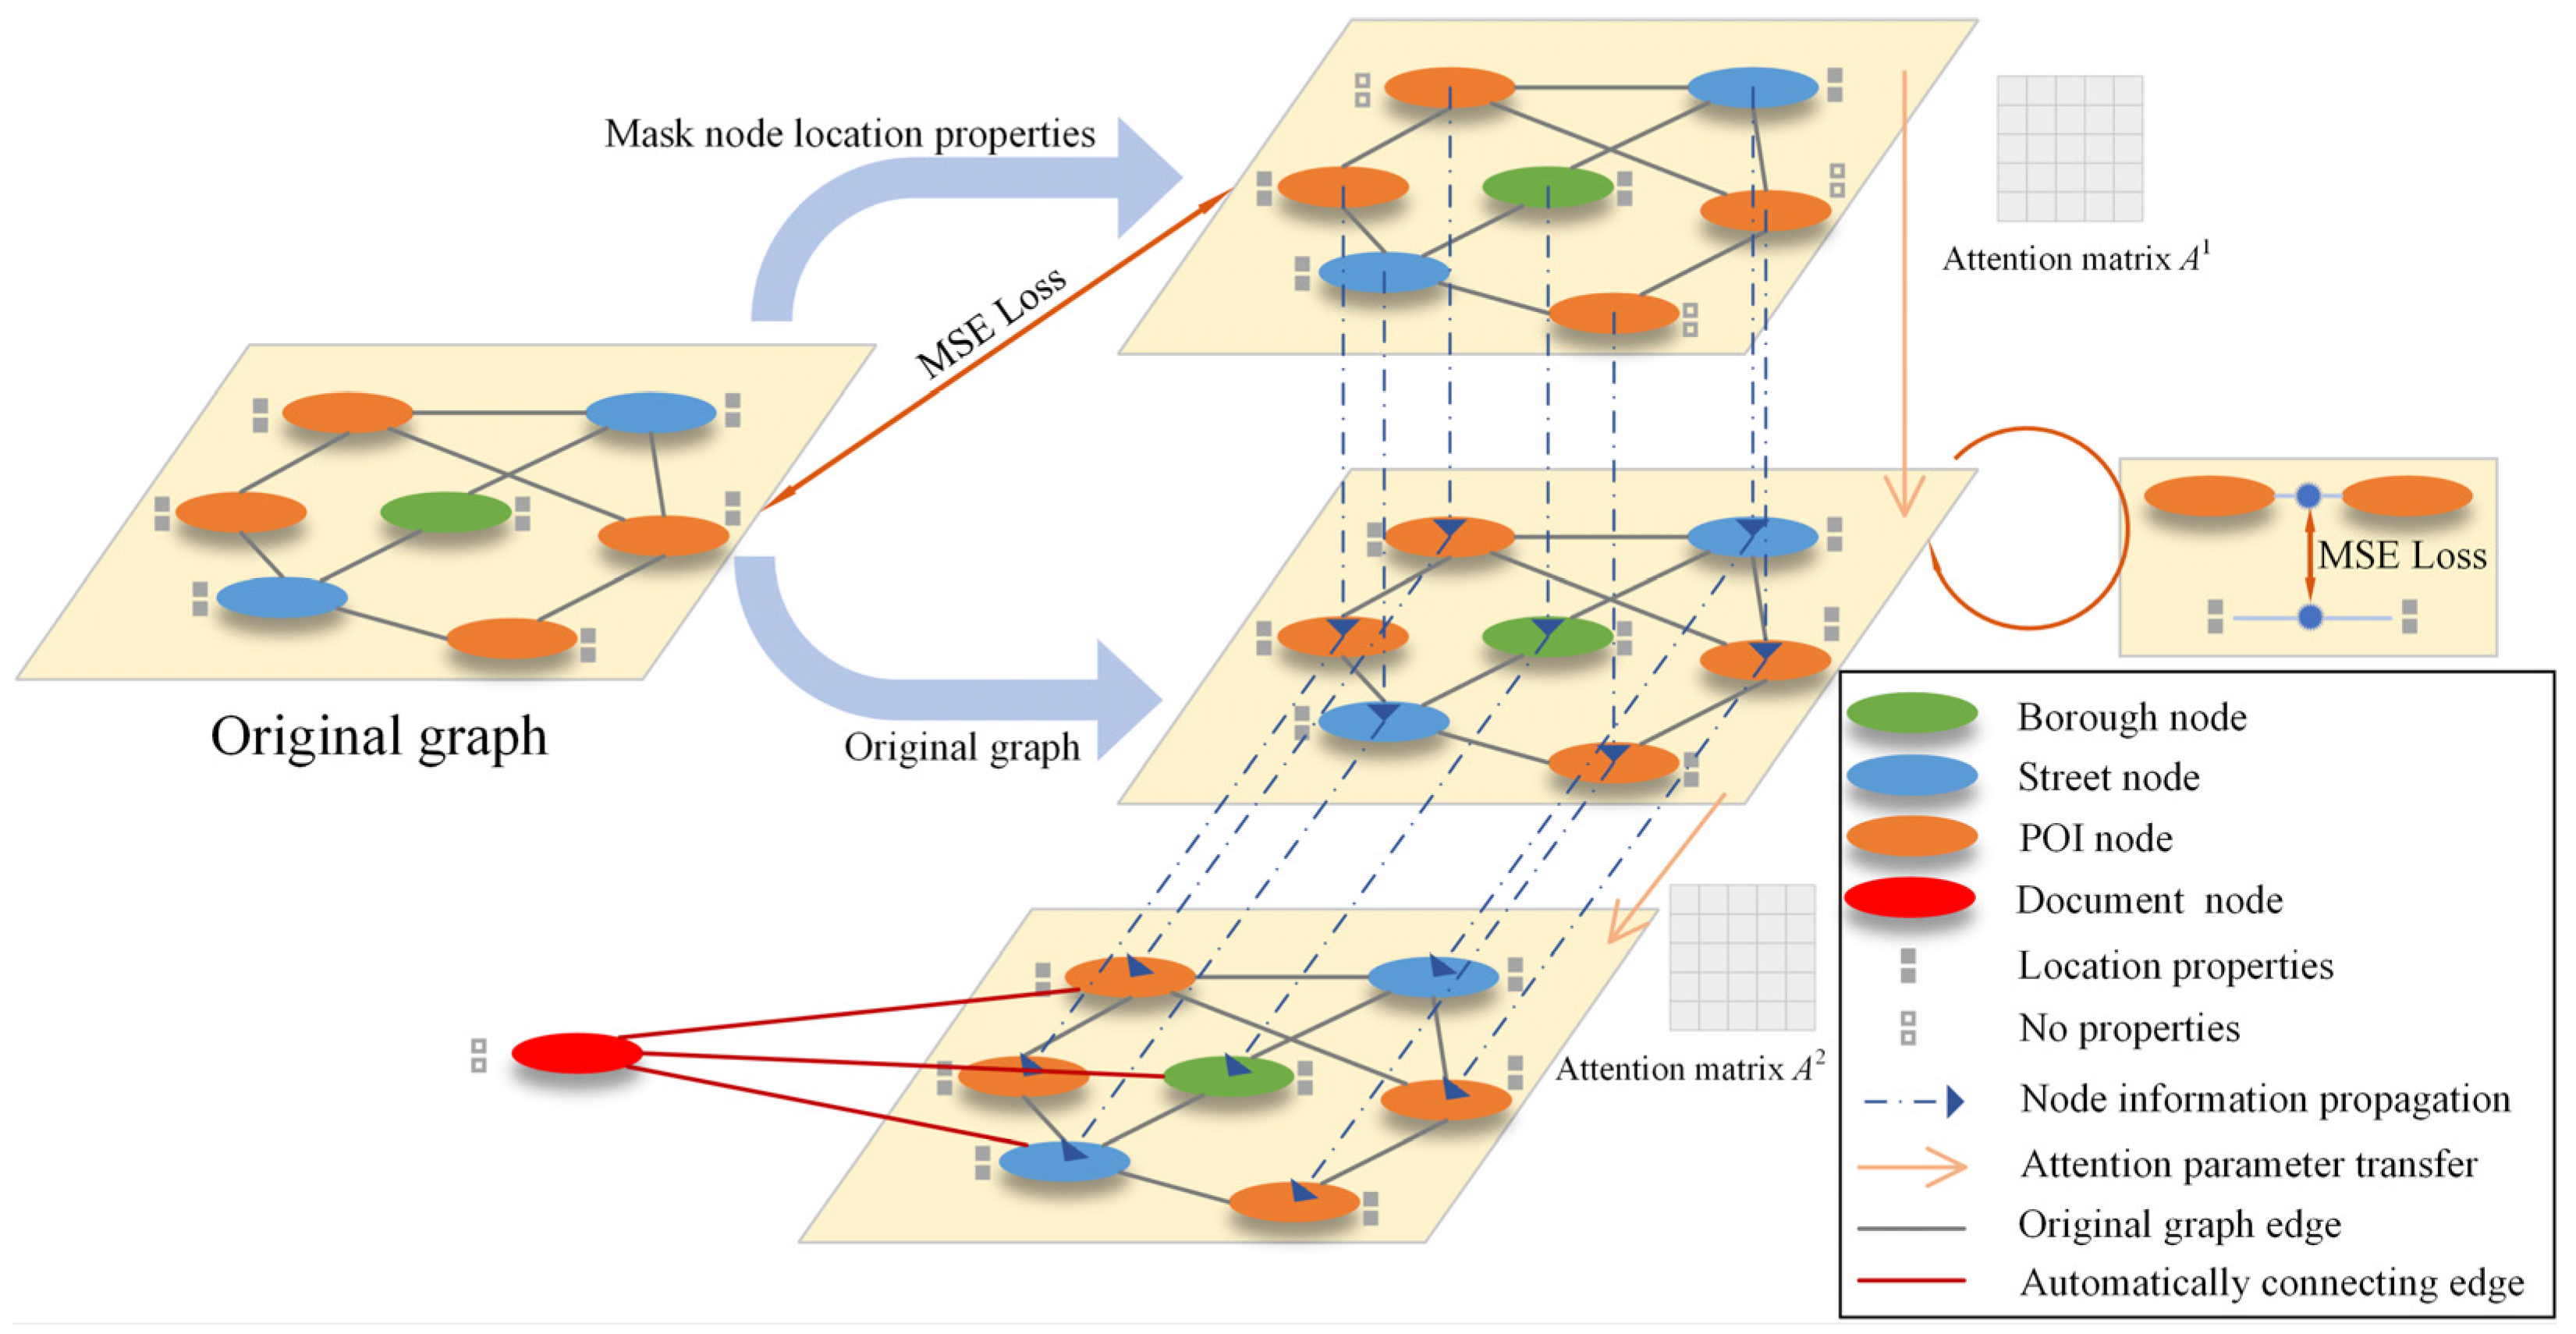
3.2. Geographic Relationship Construction
3.3. POI Geolocation Prediction Module
3.4. Distance Prediction Module
3.5. Geolocation Prediction Module
4. Experiment and Result
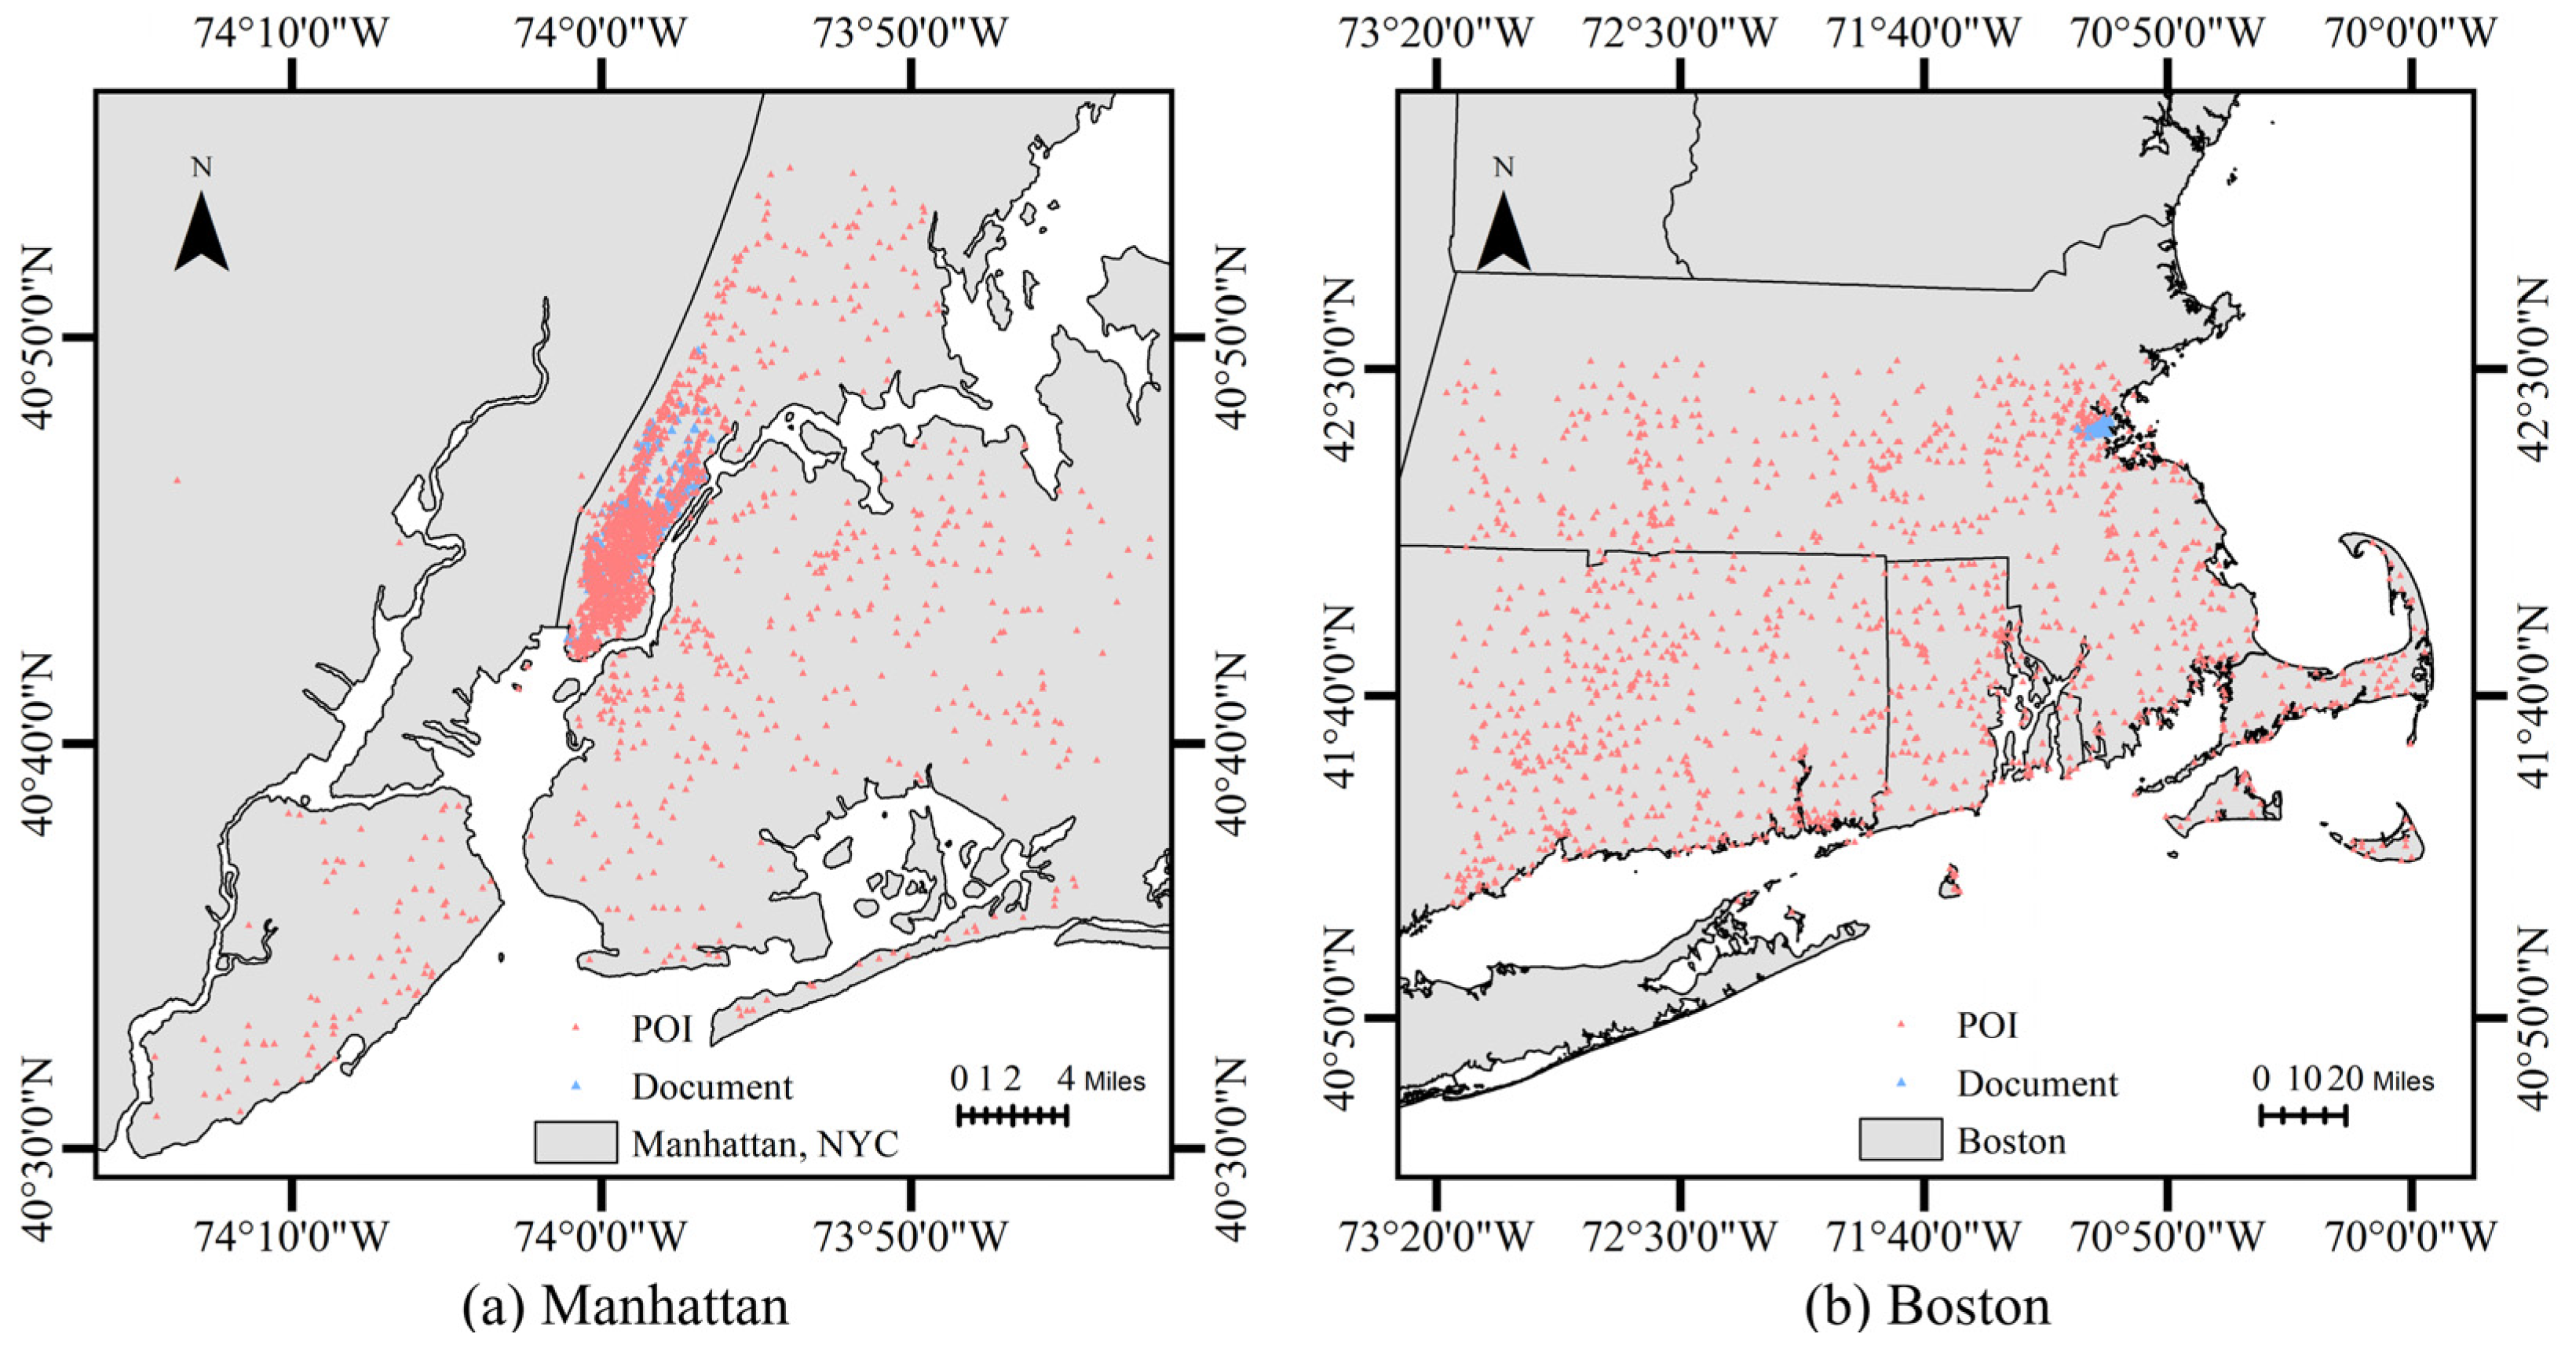
4.1. Dataset
4.2. Evaluation Metric
4.3. Baseline
4.4. Implementation Detail
4.5. Overall Result
5. Discussion
5.1. Ablation Study
5.2. Impact of Module Order on Performance
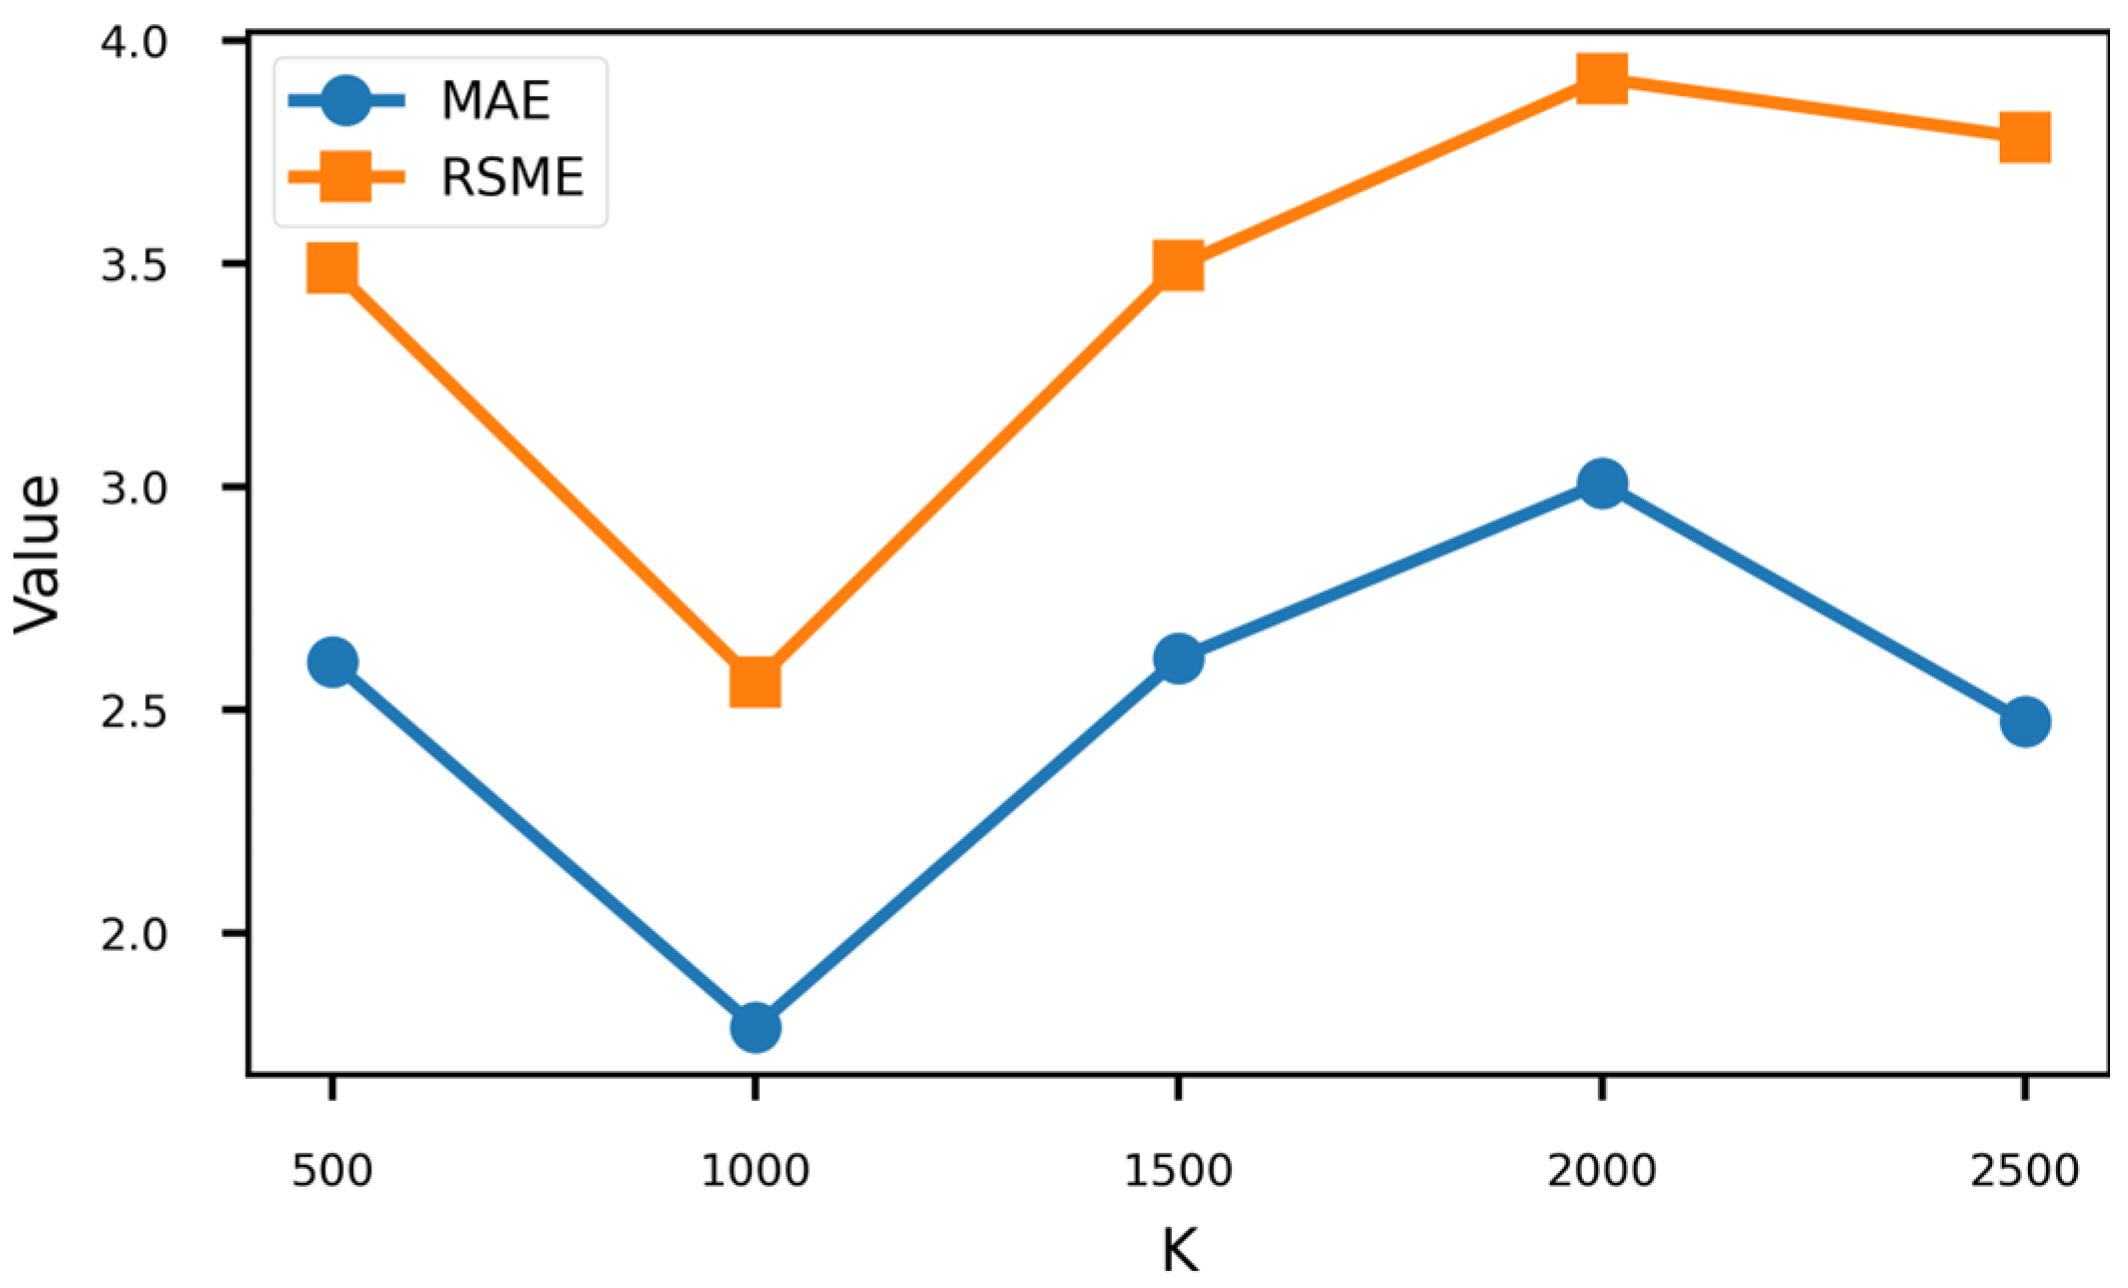
5.3. Effect of K
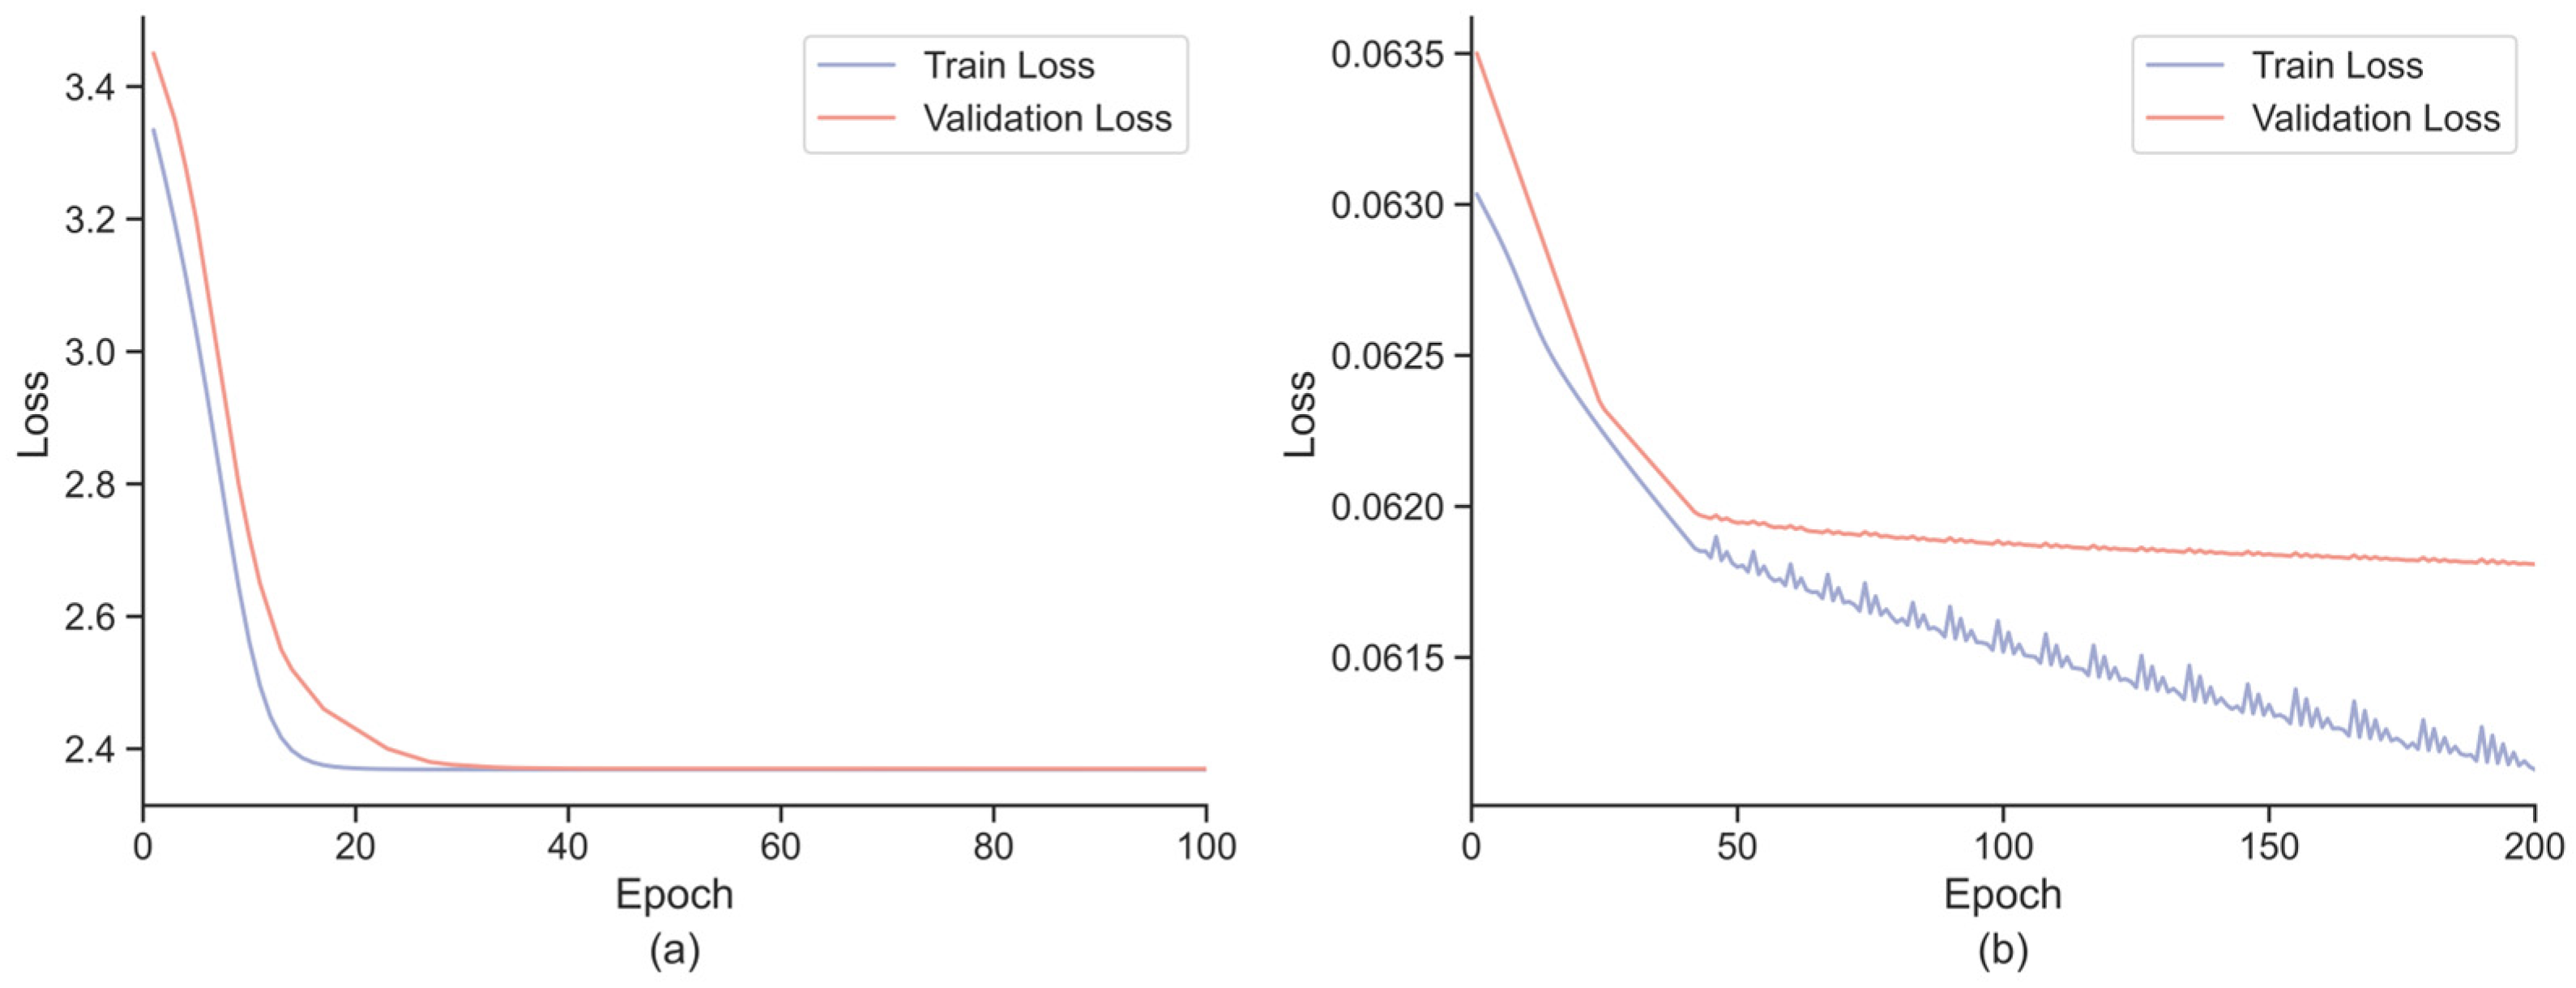
5.4. Model Convergence Analysis
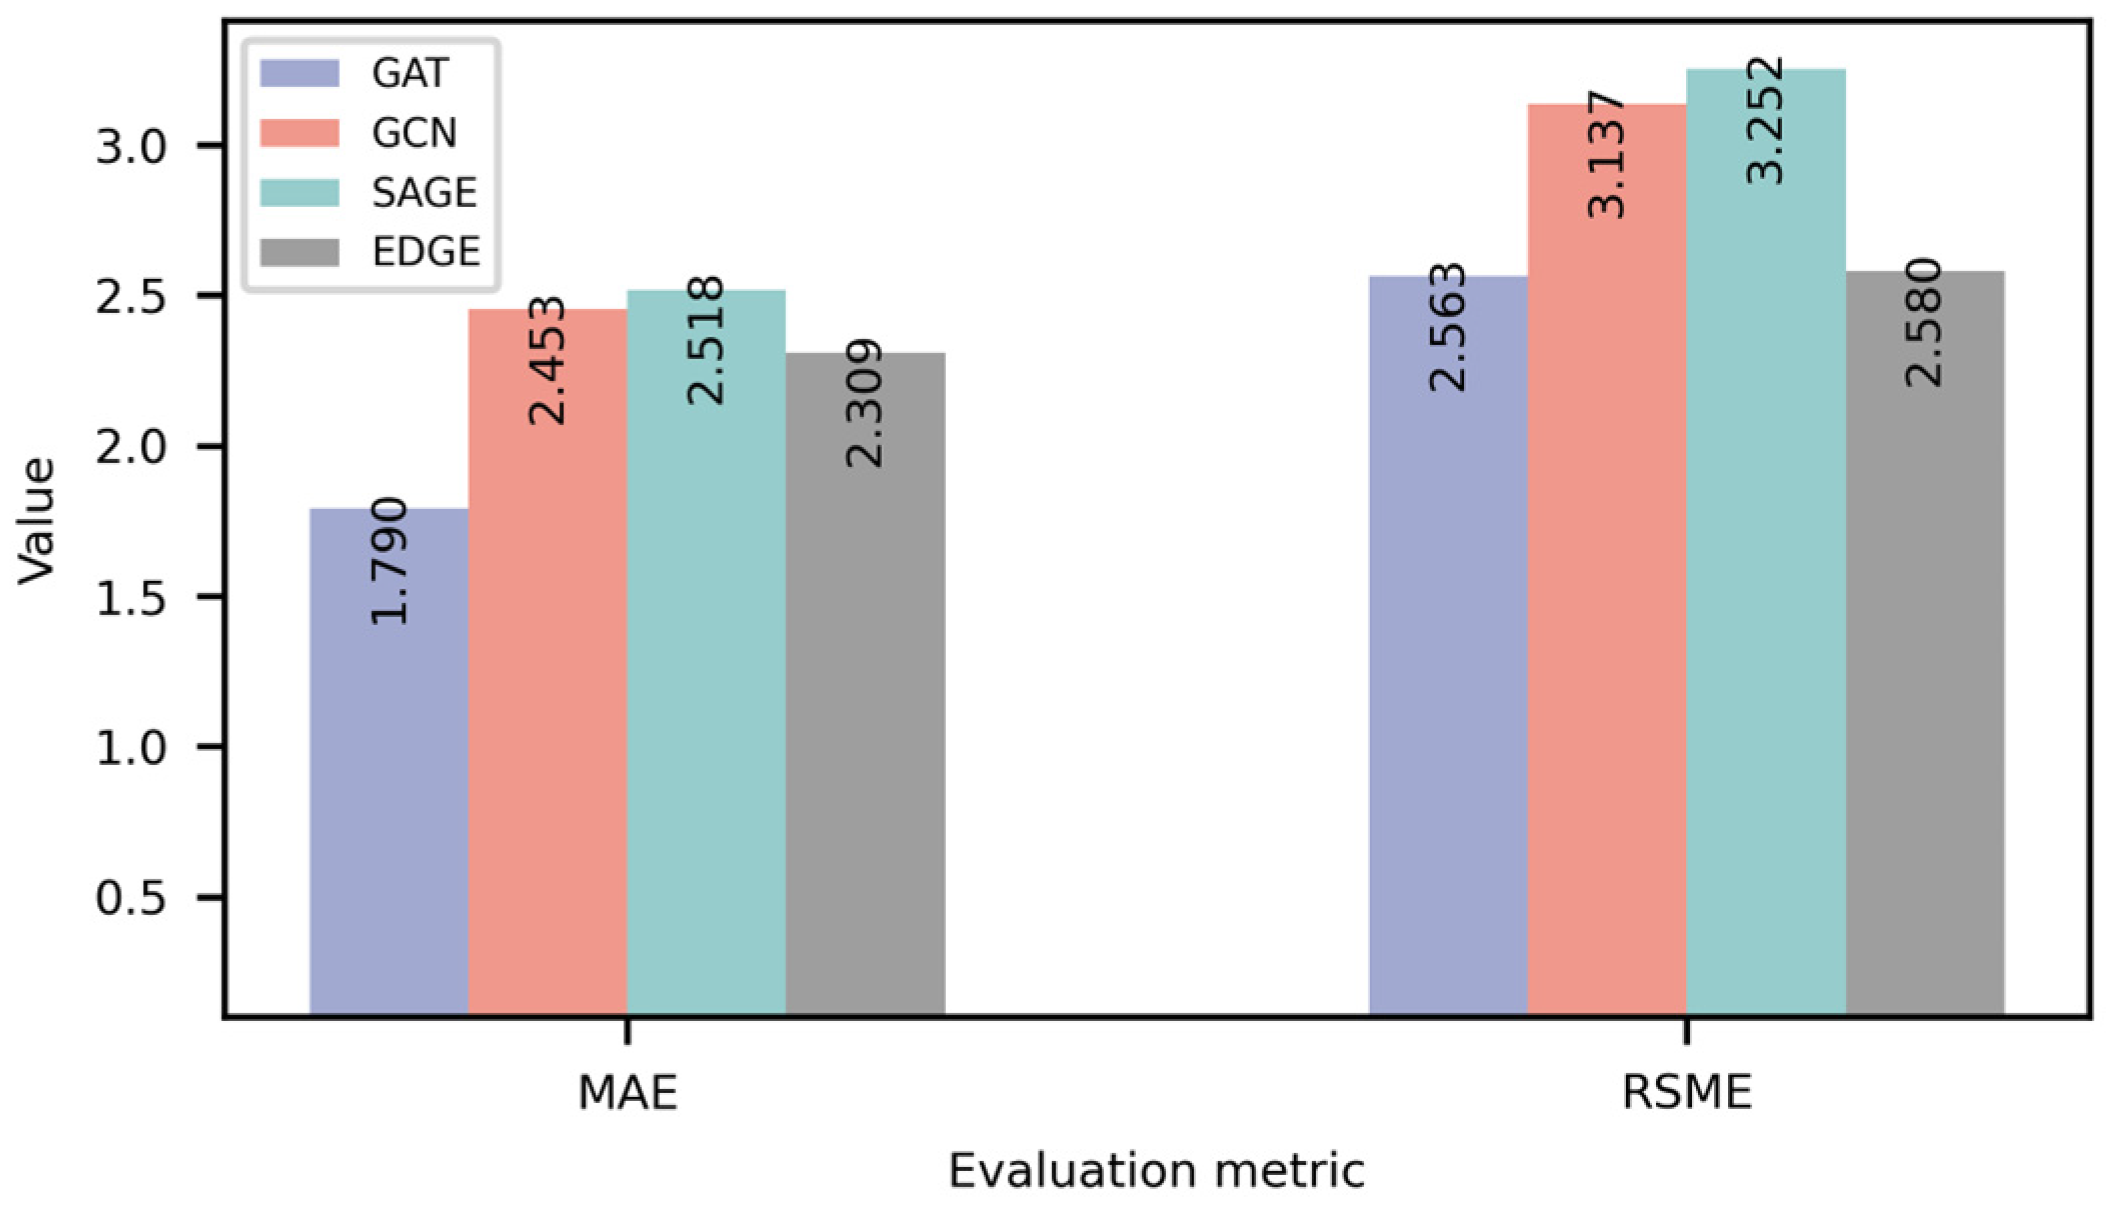
5.5. Selection of Graph Network
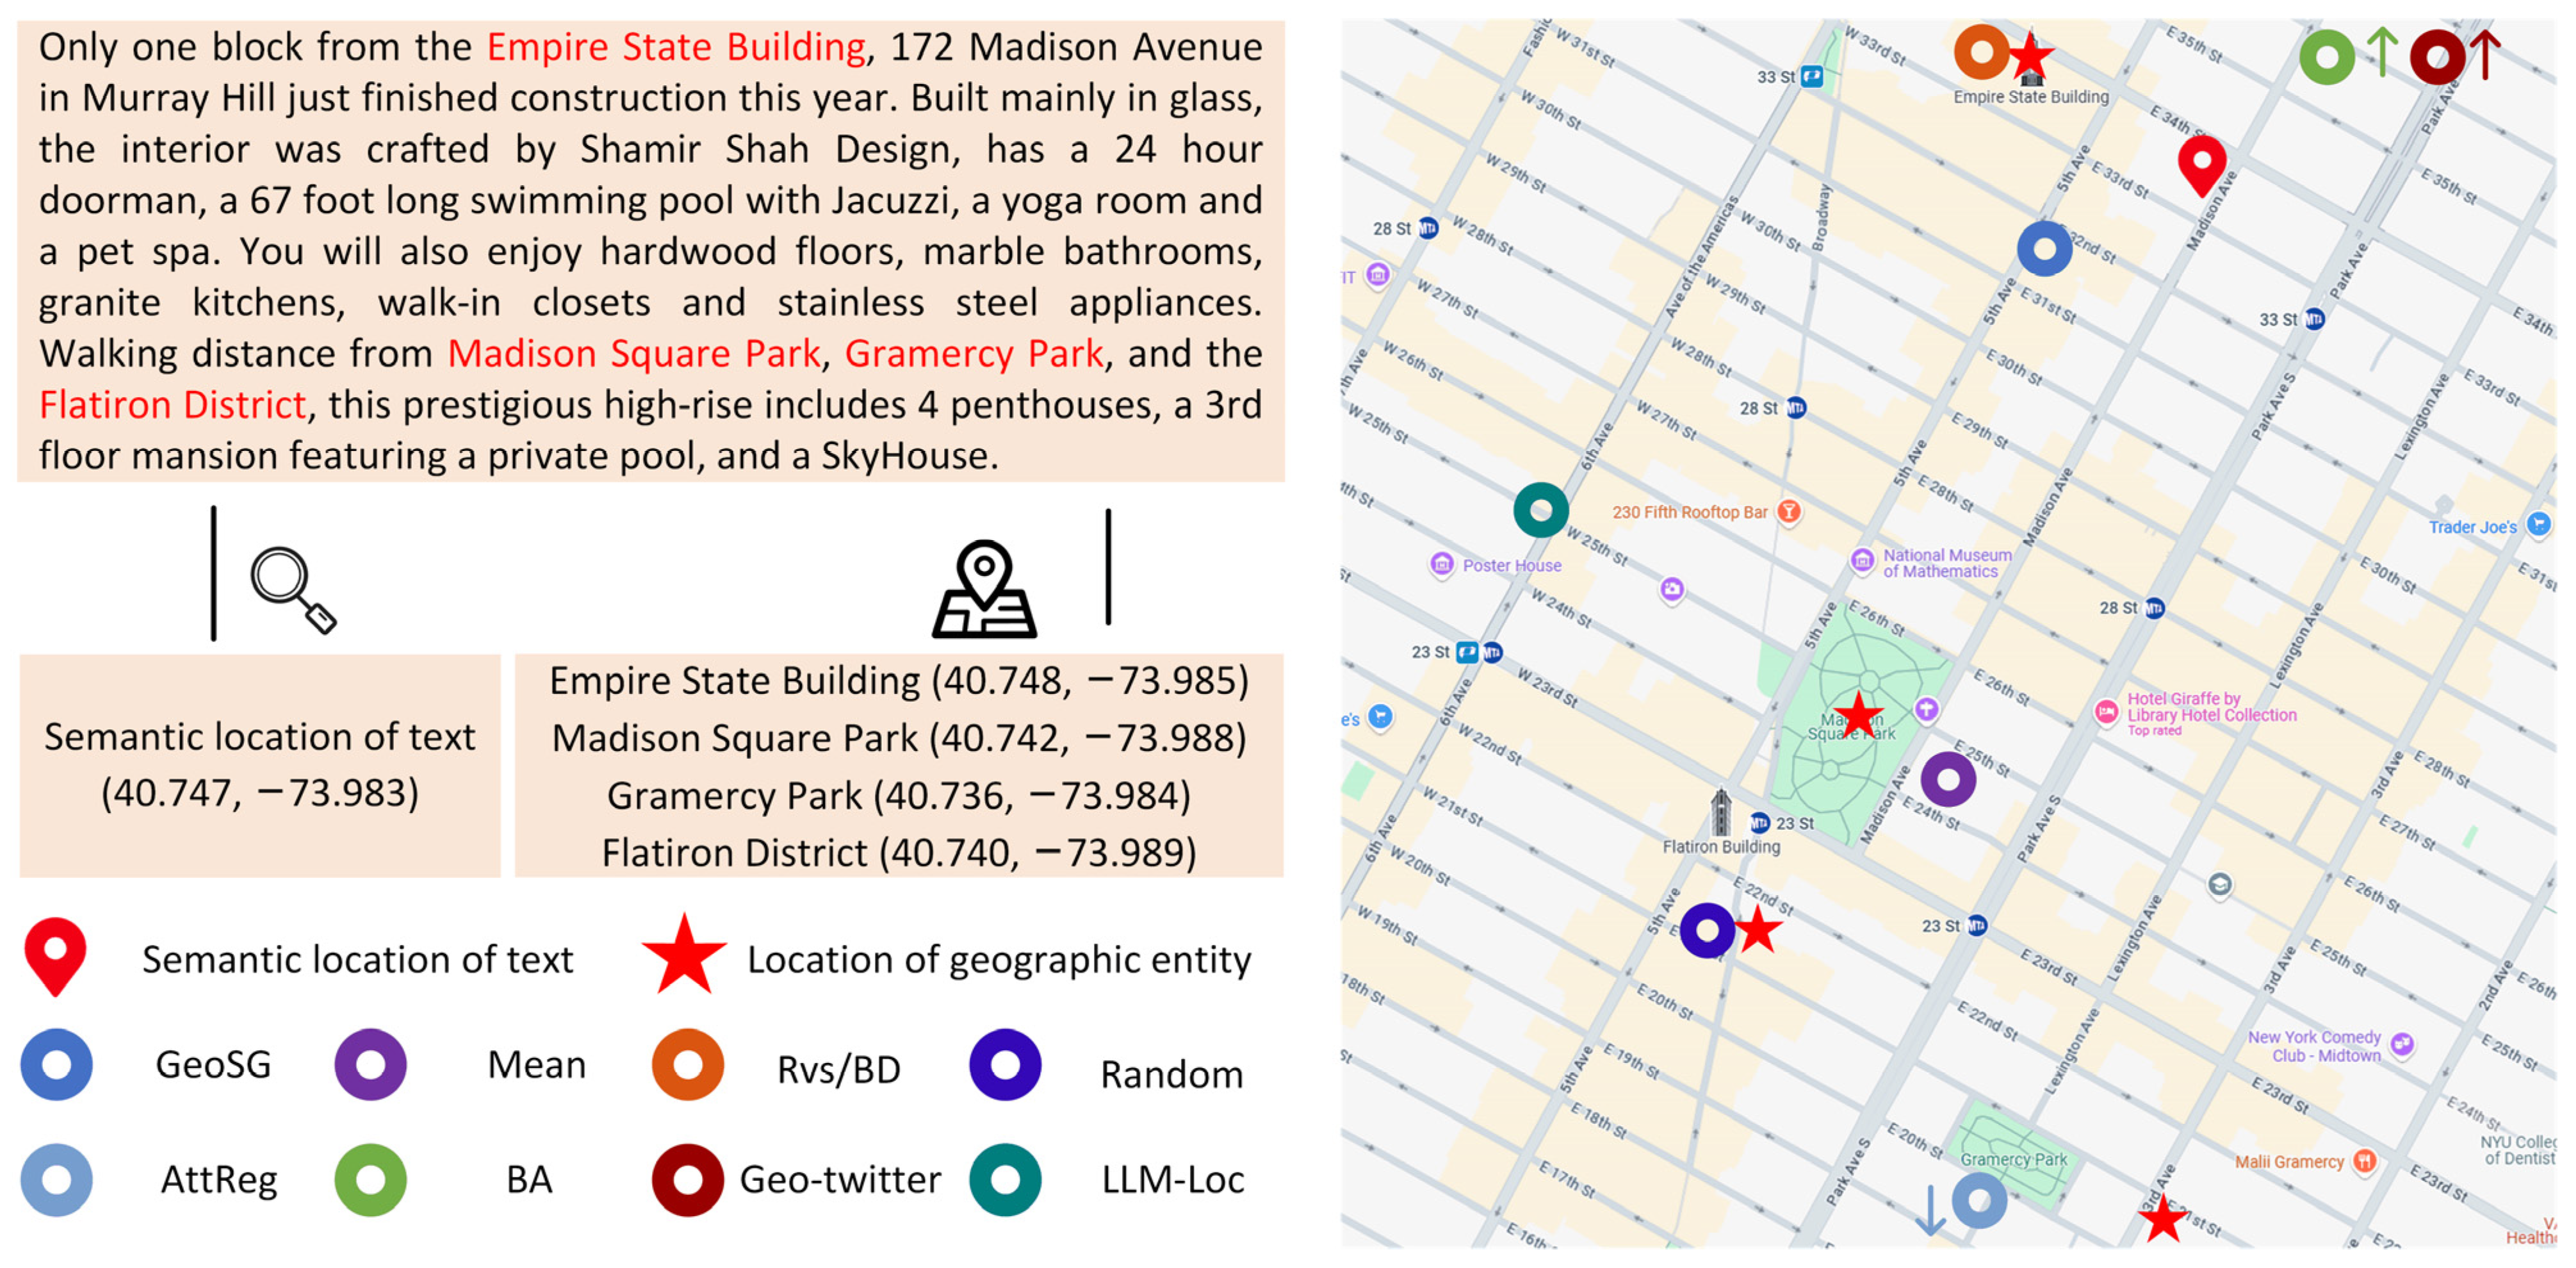
5.6. Case Study
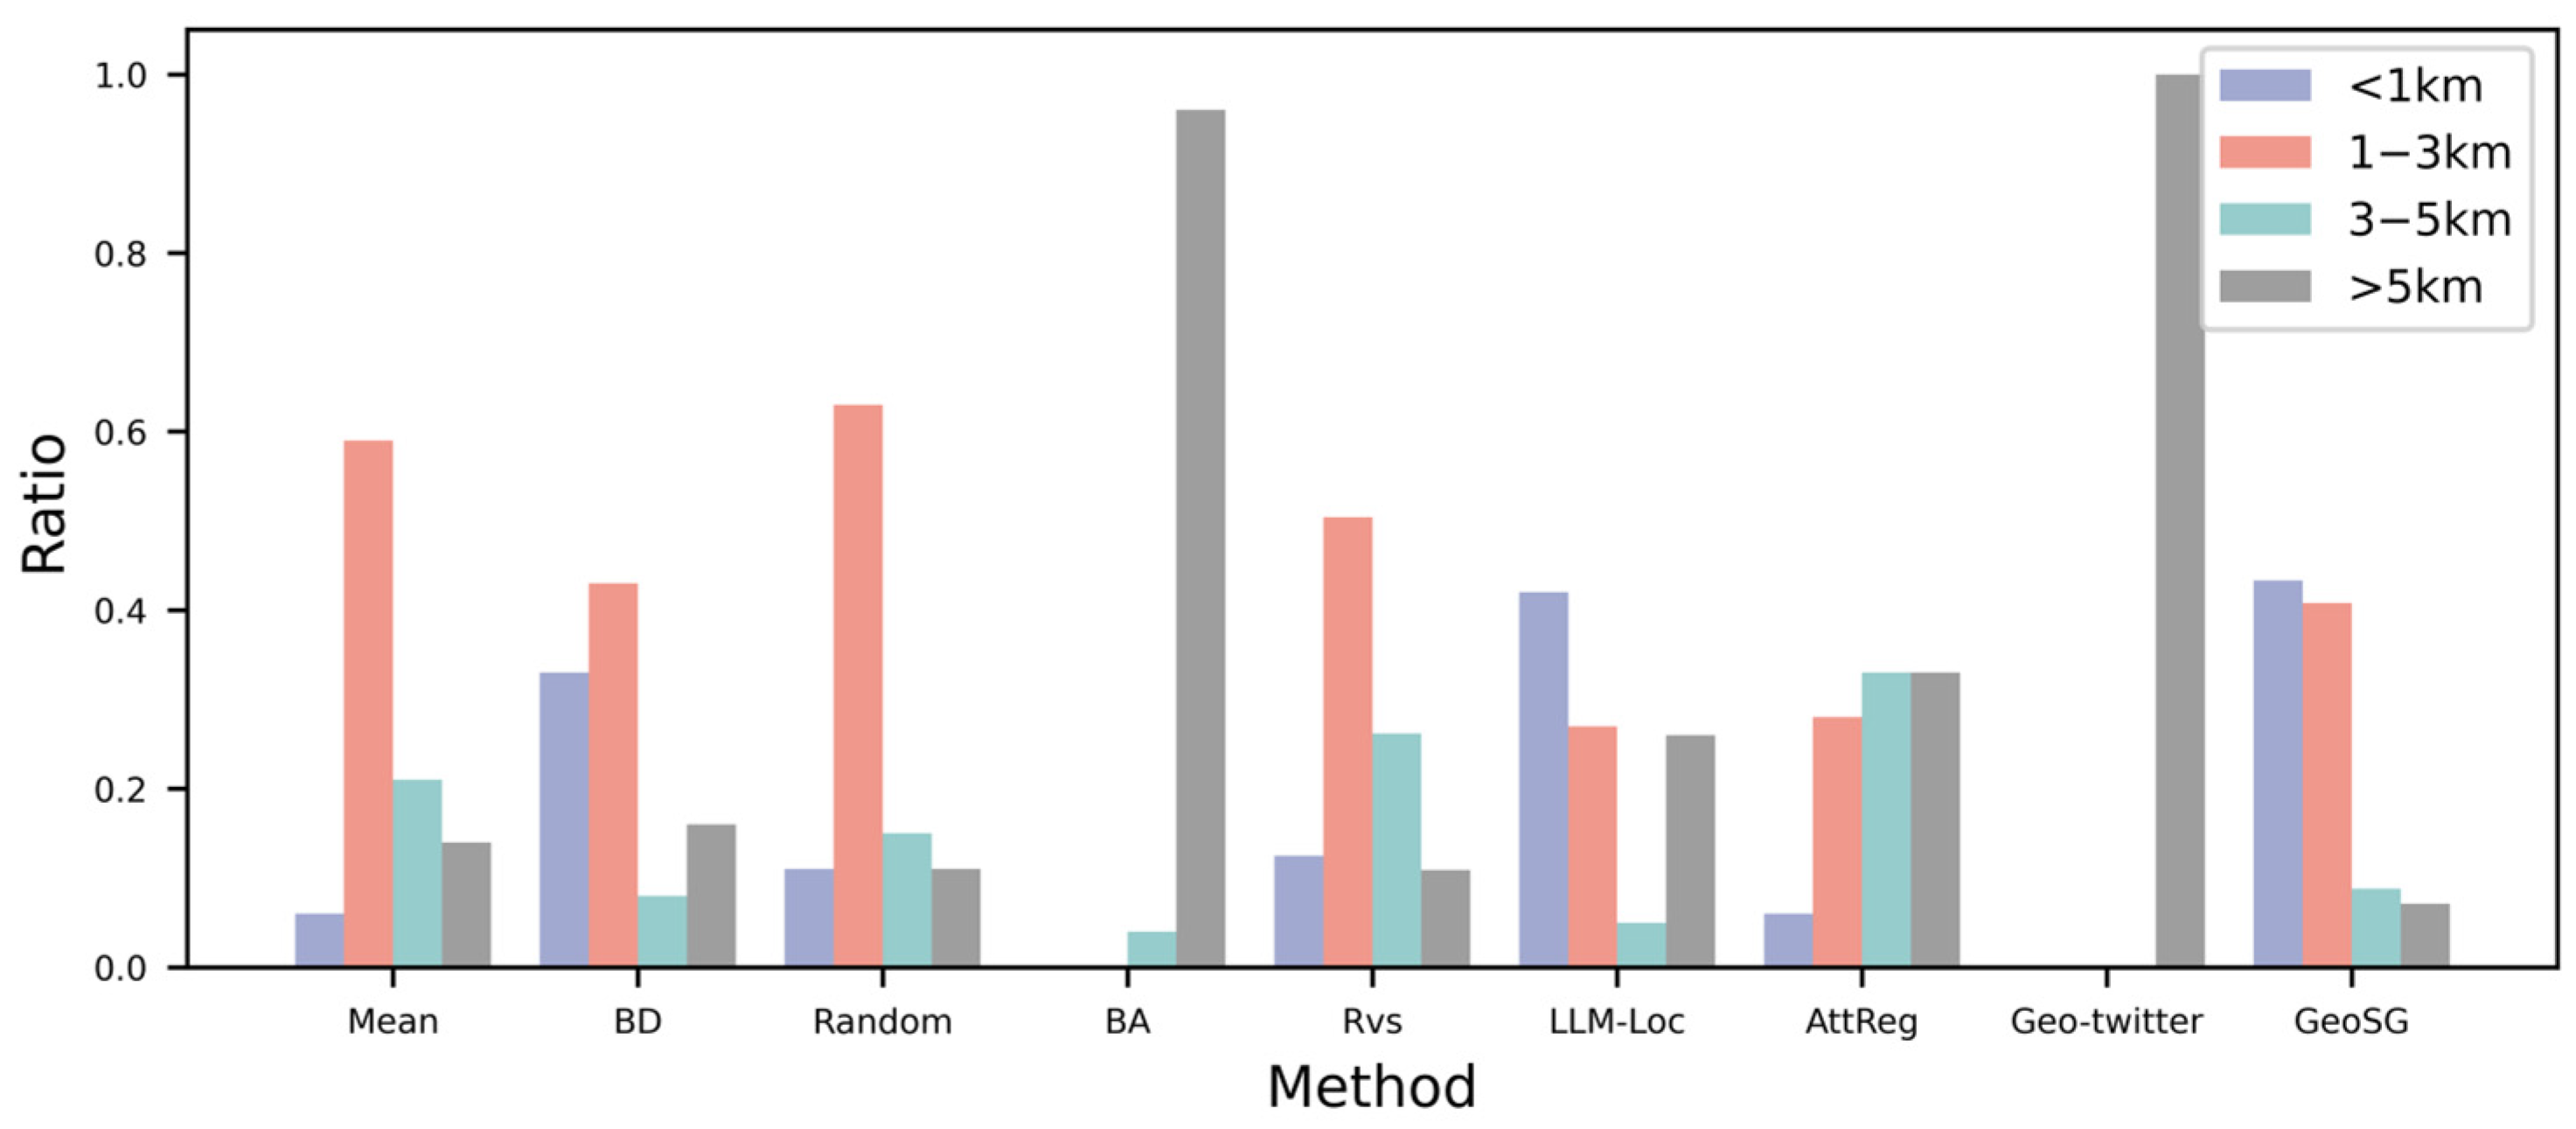
5.7. Error Distribution Analysis
6. Conclusions
Author Contributions
Funding
Data Availability Statement
Conflicts of Interest
References
- Adesina, A.A.; Okwandu, A.C.; Nwokediegwu, Z.Q.S. Geo-information systems in urban planning: A review of business and environmental implications. Magna Sci. Adv. Res. Rev. 2024, 11, 352–367. [Google Scholar] [CrossRef]
- Olaniyi, O.O.; Abalaka, A.I.; Olabanji, S.O. Utilizing Big Data Analytics and Business Intelligence for Improved Decision-Making at Leading Fortune Company. J. Sci. Res. Rep. 2023, 29, 64–72. [Google Scholar] [CrossRef]
- Guo, F.; Liu, Z.; Lu, Q.; Ji, S.; Zhang, C. Public Opinion About COVID-19 on a Microblog Platform in China: Topic Modeling and Multidimensional Sentiment Analysis of Social Media. J. Med. Internet Res. 2024, 26, e47508. [Google Scholar] [CrossRef] [PubMed]
- Morstatter, F.; Pfeffer, J.; Liu, H.; Carley, K.M. Is the Sample Good Enough? Comparing Data from Twitter’s Streaming API with Twitter’s Firehose. arXiv 2013, arXiv:1306.5204. [Google Scholar] [CrossRef]
- Hu, X.; Zhou, Z.; Li, H.; Hu, Y.; Gu, F.; Kersten, J.; Fan, H.; Klan, F. Location Reference Recognition from Texts: A Survey and Comparison. ACM Comput. Surv. 2023, 56, 112. [Google Scholar] [CrossRef]
- Ariyachandra, M.R.M.F.; Wedawatta, G. Digital Twin Smart Cities for Disaster Risk Management: A Review of Evolving Concepts. Sustainability 2023, 15, 11910. [Google Scholar] [CrossRef]
- Awan, A.T.; Gonzalez, A.D.; Sharma, M. A Neoteric Approach toward Social Media in Public Health Informatics: A Narrative Review of Current Trends and Future Directions. Information 2024, 15, 276. [Google Scholar] [CrossRef]
- Zohar, M. Geolocating tweets via spatial inspection of information inferred from tweet meta-fields. Int. J. Appl. Earth Obs. Geoinform. 2021, 105, 102593. [Google Scholar] [CrossRef]
- Hui, B.; Chen, H.; Yan, D.; Ku, W.-S. EDGE: Entity-Diffusion Gaussian Ensemble for Interpretable Tweet Geolocation Prediction. In Proceedings of the 2021 IEEE 37th International Conference on Data Engineering (ICDE), Chania, Greece, 19–22 April 2021; pp. 1092–1103. [Google Scholar]
- Lutsai, K.; Lampert, C. Predicting the geolocation of tweets using transformer models on customized data. J. Soc. Inf. Sci. 2024, 29, 69–99. [Google Scholar] [CrossRef]
- Mousset, P.; Pitarch, Y.; Tamine, L. End-to-End Neural Matching for Semantic Location Prediction of Tweets. ACM Trans. Inf. Syst. TOIS 2020, 39, 1–35. [Google Scholar] [CrossRef]
- Li, B.-X.; Chen, C.-Y. Typhoon-DIG: Distinguishing, Identifying and Geo-Tagging Typhoon-Related Social Media Posts in Taiwan. In Proceedings of the 2024 9th International Conference on Big Data Analytics (ICBDA), Tokyo, Japan, 16–18 March 2024; pp. 149–156. [Google Scholar] [CrossRef]
- Liu, Y.; Luo, X.Y.; Tao, Z.; Zhang, M.; Du, S. UGCC: Social Media User Geolocation via Cyclic Coupling. IEEE Trans. Big Data 2023, 9, 1128–1141. [Google Scholar] [CrossRef]
- Fernández-Martínez, N.J.; Periñán Pascual, C. Knowledge-based rules for the extraction of complex, fine-grained locative references from tweets. Rev. Electrón. Lingüíst. Apl. 2020, 19, 136–163. [Google Scholar]
- Lozano, M.G.; Schreiber, J.; Brynielsson, J. Tracking geographical locations using a geo-aware topic model for analyzing social media data. Decis. Support Syst. 2017, 99, 18–29. [Google Scholar] [CrossRef]
- Paule, J.D.G.; Sun, Y.; Moshfeghi, Y. On fine-grained geolocalisation of tweets and real-time traffic incident detection. Inf. Process. Manag. 2019, 56, 1119–1132. [Google Scholar] [CrossRef]
- Özdikis, Ö.; Ramampiaro, H.; Nørvåg, K. Locality-adapted kernel densities of term co-occurrences for location prediction of tweets. Inf. Process. Manag. 2019, 56, 1280–1299. [Google Scholar] [CrossRef]
- Mishra, P. Geolocation of Tweets with a BiLSTM Regression Model. In Proceedings of the 7th Workshop on NLP for Similar Languages, Varieties and Dialects, Barcelona, Spain, 13 December 2020; Zampieri, M., Nakov, P., Ljubešić, N., Tiedemann, J., Scherrer, Y., Eds.; International Committee on Computational Linguistics (ICCL): New York, NY, USA, 2020; pp. 283–289. [Google Scholar]
- Fukushima, K. Neocognitron: A self-organizing neural network model for a mechanism of pattern recognition unaffected by shift in position. Biol. Cybern. 1980, 36, 193–202. [Google Scholar] [CrossRef]
- Hochreiter, S.; Schmidhuber, J. Long Short-Term Memory. Neural Comput. 1997, 9, 1735–1780. [Google Scholar] [CrossRef]
- Mahajan, R.; Mansotra, V. Predicting Geolocation of Tweets: Using Combination of CNN and BiLSTM. Data Sci. Eng. 2021, 6, 402–410. [Google Scholar] [CrossRef]
- Elteir, M.K. Fine-Grained Arabic Post (Tweet) Geolocation Prediction Using Deep Learning Techniques. Information 2025, 16, 65. [Google Scholar] [CrossRef]
- Abboud, M.; Zeitouni, K.; Taher, Y. Fine-grained location prediction of non geo-tagged tweets: A multi-view learning approach. In Proceedings of the 5th ACM SIGSPATIAL International Workshop on AI for Geographic Knowledge Discovery, Hamburg, Germany, 18 October 2022. [Google Scholar]
- Li, M.; Lim, K.H.; Guo, T.; Liu, J. A Transformer-based Framework for POI-level Social Post Geolocation. In European Conference on Information Retrieval; Springer: Berlin/Heidelberg, Germany, 2022. [Google Scholar]
- Gao, J.; Xiong, W.; Chen, L.; Ouyang, X.; Yang, K. SRGCN: Social Relationship Graph Convolutional Network-Based Social Network User Geolocation Prediction. In Proceedings of the 2023 4th International Conference on Intelligent Computing and Human-Computer Interaction (ICHCI), Guangzhou, China, 4–6 August 2023; pp. 281–286. [Google Scholar] [CrossRef]
- Wu, X.; Liu, X.; Zhou, Y. Review of Unsupervised Learning Techniques. In Proceedings of the 2021 Chinese Intelligent Systems Conference, Fuzhou, China, 16–17 October 2021; Jia, Y., Zhang, W., Fu, Y., Yu, Z., Zheng, S., Eds.; Springer: Singapore, 2022; pp. 576–590. [Google Scholar]
- Liu, X.; Zhang, F.; Hou, Z.; Mian, L.; Wang, Z.; Zhang, J.; Tang, J. Self-Supervised Learning: Generative or Contrastive. IEEE Trans. Knowl. Data Eng. 2023, 35, 857–876. [Google Scholar] [CrossRef]
- Liu, Y.; Pan, S.; Jin, M.; Zhou, C.; Xia, F.; Yu, P.S. Graph Self-Supervised Learning: A Survey. IEEE Trans. Knowl. Data Eng. 2021, 35, 5879–5900. [Google Scholar] [CrossRef]
- Wu, L.; Lin, H.; Tan, C.; Gao, Z.; Li, S.Z. Self-Supervised Learning on Graphs: Contrastive, Generative, or Predictive. IEEE Trans. Knowl. Data Eng. 2023, 35, 4216–4235. [Google Scholar] [CrossRef]
- Hou, Z.; Liu, X.; Cen, Y.; Dong, Y.; Yang, H.; Wang, C.; Tang, J. GraphMAE: Self-Supervised Masked Graph Autoencoders. In Proceedings of the 28th ACM SIGKDD Conference on Knowledge Discovery and Data Mining, Washington, DC, USA, 14–18 August 2022; Association for Computing Machinery: New York, NY, USA, 2022; pp. 594–604. [Google Scholar] [CrossRef]
- Sun, X.; Wang, Z.; Lu, Z.; Lu, Z. Self-supervised graph representations with generative adversarial learning. Neurocomputing 2024, 592, 127786. [Google Scholar] [CrossRef]
- Liu, J.; He, M.; Shang, X.; Shi, J.; Cui, B.; Yin, H. BOURNE: Bootstrapped Self-Supervised Learning Framework for Unified Graph Anomaly Detection. In Proceedings of the 2024 IEEE 40th International Conference on Data Engineering (ICDE), Utrecht, The Netherlands, 13–17 May 2024; pp. 2820–2833. [Google Scholar] [CrossRef]
- Jing, B.; Park, C.; Tong, H. HDMI: High-order Deep Multiplex Infomax. In Proceedings of the Web Conference, Ljubljana, Slovenia, 19–23 April 2021; Association for Computing Machinery: New York, NY, USA, 2021; pp. 2414–2424. [Google Scholar] [CrossRef]
- Gao, Q.; Hong, J.; Xu, X.; Kuang, P.; Zhou, F.; Trajcevski, G. Predicting Human Mobility via Self-Supervised Disentanglement Learning. IEEE Trans. Knowl. Data Eng. 2024, 36, 2126–2141. [Google Scholar] [CrossRef]
- Gao, Q.; Wang, W.; Zhang, K.; Yang, X.; Miao, C.; Li, T. Self-supervised representation learning for trip recommendation. Know-Based Syst. 2022, 247, 108791. [Google Scholar] [CrossRef]
- Devlin, J.; Chang, M.-W.; Lee, K.; Toutanova, K. BERT: Pre-training of Deep Bidirectional Transformers for Language Understanding. In Proceedings of the 2019 Conference of the North American Chapter of the Association for Computational Linguistics: Human Language Technologies, Minneapolis, MN, USA, 2–7 June 2019; Burstein, J., Doran, C., Solorio, T., Eds.; Association for Computational Linguistics: Minneapolis, MN, USA, 2019; Volume 1, pp. 4171–4186. [Google Scholar] [CrossRef]
- Wing, B.; Baldridge, J. Simple supervised document geolocation with geodesic grids. In Proceedings of the 49th Annual Meeting of the Association for Computational Linguistics: Human Language Technologies, Portland, OR, USA, 19–24 June 2011. [Google Scholar]
- Paz-Argaman, T.; Palowitch, J.; Kulkarni, S.; Baldridge, J.; Tsarfaty, R. Where Do We Go From Here? Multi-scale Allocentric Relational Inferencefrom Natural Spatial Descriptions. In Proceedings of the 18th Conference of the European Chapter of the Association for Computational Linguistics, St. Julian’s, Malta, 17–22 March 2024; Graham, Y., Purver, M., Eds.; Association for Computational Linguistics: St. Julian’s, Malta, 2024; Volume 1, pp. 1026–1040. [Google Scholar]
- Savarro, D.; Zago, D.; Zoia, S. Leveraging Large Language Models to Geolocate Linguistic Variations in Social Media Posts. arXiv 2024, arXiv:2407.16047. [Google Scholar]
- Dubey, A.; Jauhri, A.; Pandey, A.; Kadian, A.; Al-Dahle, A.; Letman, A.; Mathur, A.; Schelten, A.; Yang, A.; Fan, A.; et al. The Llama 3 Herd of Models. arXiv 2024, arXiv:2407.21783. [Google Scholar]
- Kingma, D.P.; Ba, J. Adam: A Method for Stochastic Optimization. In Proceedings of the 3rd International Conference on Learning Representations (ICLR), San Diego, CA, USA, 7–9 May 2015; Bengio, Y., LeCun, Y., Eds.; Conference Track Proceedings: New York, NY, USA, 2015. [Google Scholar]
- Kipf, T.N.; Welling, M. Semi-Supervised Classification with Graph Convolutional Networks. In Proceedings of the International Conference on Learning Representations, Toulon, France, 24–26 April 2017. [Google Scholar]
- Hamilton, W.L.; Ying, R.; Leskovec, J. Inductive representation learning on large graphs. In Proceedings of the 31st International Conference on Neural Information Processing Systems, Long Beach, CA, USA, 4–9 December 2017; Curran Associates Inc.: Red Hook, NY, USA, 2017; pp. 1025–1035. [Google Scholar]
- Wang, Y.; Sun, Y.; Liu, Z.; Sarma, S.E.; Bronstein, M.M.; Solomon, J.M. Dynamic Graph CNN for Learning on Point Clouds. ACM Trans. Graph. 2019, 38, 1–12. [Google Scholar] [CrossRef]

| Metrics | #Words/Document | #Geographic Entities/Document | #Document | ||
|---|---|---|---|---|---|
| MAX | AVG | MAX | AVG | NUM | |
| Manhattan | 358 | 142.38 | 10 | 3.92 | 240 |
| Boston | 195 | 113.10 | 6 | 2.58 | 72 |
| Models | Manhattan | Boston | ||
|---|---|---|---|---|
| MAE | RSME | MAE | RSME | |
| Mean | 3.239 | 10.202 | 7.538 | 45.042 |
| BD | 3.286 | 5.412 | 7.327 | 19.080 |
| Random | 3.076 | 4.369 | 10.795 | 30.916 |
| BA | 8.608 | 8.921 | 44.807 | 55.445 |
| Rvs | 2.804 | 3.417 | 7.785 | 18.284 |
| LLM-Loc | 14.167 | 36.552 | 14.033 | 41.751 |
| AttReg | 4.399 | 4.964 | 16.814 | 29.860 |
| Geo-twitter | 81.781 | 120.014 | 151.536 | 186.114 |
| GeoSG | 1.790 | 2.563 | 6.026 | 11.847 |
| Method | Manhattan | Boston | ||
|---|---|---|---|---|
| MAE | RSME | MAE | RSME | |
| GeoSG | 1.790 | 2.563 | 6.026 | 11.847 |
| w/o distance prediction | 1.854 | 2.512 | 6.147 | 12.182 |
| w/o POI geolocation prediction | 1.837 | 2.526 | 6.364 | 12.764 |
| w/o self-supervised modules | 2.293 | 3.011 | 6.362 | 12.755 |
| w/o graph | 2.410 | 3.104 | 6.726 | 12.813 |
| Order | Manhattan | Boston | ||
|---|---|---|---|---|
| MAE | RMSE | MAE | RMSE | |
| GeoSG | 1.790 | 2.563 | 6.026 | 11.847 |
| Interchanged | 1.907 | 2.588 | 6.174 | 12.341 |
| w/o self-supervised tasks | 2.293 | 3.011 | 6.362 | 12.755 |
Disclaimer/Publisher’s Note: The statements, opinions and data contained in all publications are solely those of the individual author(s) and contributor(s) and not of MDPI and/or the editor(s). MDPI and/or the editor(s) disclaim responsibility for any injury to people or property resulting from any ideas, methods, instructions or products referred to in the content. |
© 2025 by the authors. Published by MDPI on behalf of the International Society for Photogrammetry and Remote Sensing. Licensee MDPI, Basel, Switzerland. This article is an open access article distributed under the terms and conditions of the Creative Commons Attribution (CC BY) license (https://creativecommons.org/licenses/by/4.0/).
Share and Cite
Wu, Y.; Zeng, Z.; Liu, K.; Xu, Z.; Ye, Y.; Zhou, S.; Yao, H.; Li, S. Text Geolocation Prediction via Self-Supervised Learning. ISPRS Int. J. Geo-Inf. 2025, 14, 170. https://doi.org/10.3390/ijgi14040170
Wu Y, Zeng Z, Liu K, Xu Z, Ye Y, Zhou S, Yao H, Li S. Text Geolocation Prediction via Self-Supervised Learning. ISPRS International Journal of Geo-Information. 2025; 14(4):170. https://doi.org/10.3390/ijgi14040170
Chicago/Turabian StyleWu, Yuxing, Zhuang Zeng, Kaiyue Liu, Zhouzheng Xu, Yaqin Ye, Shunping Zhou, Huangbao Yao, and Shengwen Li. 2025. "Text Geolocation Prediction via Self-Supervised Learning" ISPRS International Journal of Geo-Information 14, no. 4: 170. https://doi.org/10.3390/ijgi14040170
APA StyleWu, Y., Zeng, Z., Liu, K., Xu, Z., Ye, Y., Zhou, S., Yao, H., & Li, S. (2025). Text Geolocation Prediction via Self-Supervised Learning. ISPRS International Journal of Geo-Information, 14(4), 170. https://doi.org/10.3390/ijgi14040170