Article

Assess Spatial Equity Considering the Similarity Between GIS-Based Supply and Demand Maps: A New Framework with Case Study in Beijing

1
Jiangsu Key Laboratory of Urban ITS, Southeast University, Southeast University Road #2, Nanjing 211189, China
2
Jiangsu Province Collaborative Innovation Center of Modern Urban Traffic Technologies, Southeast University, Southeast University Road #2, Nanjing 211189, China
3
National Demonstration Center for Experimental Road and Traffic Engineering Education, Southeast University, Southeast University Road #2, Nanjing 211189, China
4
School of Transportation, Southeast University, Southeast University Road #2, Nanjing 211189, China
*
Author to whom correspondence should be addressed.
ISPRS Int. J. Geo-Inf. 2025, 14(4), 157; https://doi.org/10.3390/ijgi14040157
Submission received: 4 January 2025 / Revised: 1 March 2025 / Accepted: 2 April 2025 / Published: 4 April 2025

Abstract

:
Spatial equity is a critical issue that the supply allocation should align with the level of demand, enabling all community members to equally benefit from the city’s resources and opportunities, yet commonly used assessment methods have inherent limitations. This study proposes a new framework to assess spatial equity based on the evaluation of similarity between GIS-based supply and demand maps and provides a simplified case study that assesses public transportation services across the area inside the Sixth Ring Road of Beijing to facilitate the comprehension of this framework. The results show that while services in this region are relatively spatially equitable, significant spatial inequity remains in certain areas, where targeted policy recommendations are put forward such as promoting innovative transportation solutions and redistributing excessive demand to less congested facilities. The application prospects and future development directions of the proposed framework are thoroughly discussed. This framework stands out for its ease of comprehension, visualization, and general applicability. Specifically, it is capable of identifying areas with severe inequity, thus contributing to the establishment of targeted intervention measures to mitigate spatial inequity.

1. Introduction

Spatial equity, which refers to the quality of being equal or fair in a distribution that affects individual well-being [1,2], has recently become a hot topic in urban geography and infrastructure development. This issue does not mean equal shares of public services for all; instead, service allocation should align with the varying levels of ‘need’ within each region [3,4,5]. From the perspective of the supply–demand structure, it means that areas with a higher level of demand should receive a proportionately larger share of supply [6,7,8]. This principle suggests that urban planners and policymakers can use data-driven insights to allocate resources, balancing supply with not merely the population size of an area but with a composite index of demand that considers a broad range of determinants, including socio-economic factors, existing infrastructure, and historical neglect. In addition, it emphasizes the need to prioritize investments and resources in areas where the gap between current service supply levels and the actual demand is greatest. However, numerous studies across various interdisciplinary academic fields continue to demonstrate the persistent existence of spatial inequity in supply–demand structures, with certain demographic groups experiencing disproportionate burdens [9,10,11]. Enhancements in the supplies of essential services such as housing, education, transportation, medical care, and entertainment, along with investments and welfare distribution, tend to favor the demands of representatives of social privileges and wealthier areas while neglecting equity-deserving groups such as minority and disadvantaged people.
The existence of spatial inequity has caused a series of social problems, such as social division and conflict [12], poverty and social exclusion [13], environmental degradation [14], and social mobility reduction [15], and has become a non-negligible challenge for many countries. Urban planners and policymakers are seeking effective ways to assess regional spatial equity, which can help them identify areas of insufficient service provision and improvement. The assessment results offer guidance on allocating and renovating scarce public facilities, ensuring equitable allocation of resources, and mitigating social inequalities [16,17,18]. It provides evidence for analyzing the city’s development status, evaluating the effectiveness of existing urban policies, and formulating future development strategies [19,20,21].
Researchers have developed a variety of methods to assess spatial equity, which primarily includes the following three categories: coverage and accessibility analysis, Gini coefficient analysis, and geospatial analysis [22,23,24]. Coverage refers to the extent to which a service is provided to the public within a given area. Accessibility refers to the extent to which an individual can reach potential destinations within a given area and obtain the service needed. These two evaluation indexes, commonly seen in transportation research, are closely related and widely applied in assessing spatial equity of facilities and services such as public transportation [25,26], urban parks [27,28], and health care [23,29]. However, coverage and accessibility are often calculated based on the locations of existing suppliers and the maximum acceptable travel times or distances of potential users to obtain services. The real distribution and strength of demands are largely neglected. It should be emphasized that high levels of service coverage and accessibility do not guarantee a high spatial density of potential users. Thus, the coverage and accessibility analysis of an area is assessing more about the convenience of living in this region rather than the spatial equity from a viewpoint of supply–demand structure.
The Gini coefficient, as an index originally developed to evaluate the fairness of income distribution, has gradually been adopted to assess spatial equity [30,31,32]. It describes the variance between real spatial distributions and the ideal of perfect equity. This index is favored for its clarity (i.e., a certain value ranging between 0 and 1) and ease of interpretation. But it is an aggregate index that presents the overall condition and, hence has almost no guiding role in taking steps to mitigate spatial inequity. Geospatial approaches, such as spatial autocorrelation used to understand the extent to which an object is similar to its nearby objects, and Geographical Weighted Regression (GWR) used to explore spatial heterogeneity, has been widely adopted to assess spatial equity as well [33,34,35]. However, these approaches always face criticism for their spatial complexity and failure to involve all significant factors that have effects on local supplies and demands. And it always faces the challenge of gathering sufficient small-scale data [36,37,38].
Despite the widespread application of the three commonly used spatial equity assessment methods mentioned above, they each have their inherent limitations that constrain their effectiveness in guiding real-world engineering practices aimed at reducing spatial inequities. Several researchers have dedicated efforts to develop new methods for assessing spatial equity, such as developing a multi-scale supply–demand equity index of urban park distribution [39], calculating the maximum similarity difference in the evaluation indices of green infrastructure in multiple annular zones [40], and simultaneously considering the balance of different children’s service types at one spatial scale and the same service types across various scales [4]. These methods have managed to overcome some of the limitations of the three common approaches to a certain extent. However, they are often limited to assessing the spatial equity of specific public service types, which raises questions about their broader applicability. Therefore, it is essential to develop a method that is simple, effective, and generally applicable for assessing spatial equity to foster sustainable urban planning.
The rapid advancement in image processing techniques has opened a new avenue for assessing spatial equity. Current studies primarily apply image recognition techniques to analyze remote sensing and street view images, extracting valuable data such as the distribution of urban infrastructure, transportation networks, and environmental resources [41,42,43,44,45]. However, despite the novel approaches to data acquisition, spatial equity is still evaluated through traditional assessment methods in these studies. In contrast to existing studies, this study proposes a new framework to assess regional spatial equity based on map similarity analysis. Maps of supply and demand illustrate the spatial distribution and strength of them across different urban areas, hence comparing the similarity between these two maps allows for an evaluation of how well service supply allocations correspond with demand levels, essentially indicating the degree of spatial equity. This framework is theoretically generally applicable and has multiple advantages, including simplicity and visualization, ease of comprehension, and a focus on areas with severe inequity. It can also address the pain points of the above-mentioned widely used assessment methods to some extent. Furthermore, to facilitate the comprehension of this framework, it is applied to assess the spatial equity of public transportation in the region inside Beijing’s Sixth Ring Road, based on which some suggestions are put forward to help improve the status quo.
The remainder of this paper is organized as follows: In Section 2, the fundamental principles and implementation procedures of the proposed spatial equity assessment framework are described. In Section 3, the case study area and data sources are presented, along with an explanation of how the framework was implemented. In Section 4, the assessment results are revealed step-by-step. The case’s implications and limitations, and the framework’s application prospects are discussed as well. The final Section 5 summarizes the main ideas of this study.

2. Methods

2.1. Map Similarity as a Measure of Spatial Equity

Image similarity refers to the extent to which two images are alike based on their structural and content attributes [46,47]. The demand map illustrates the varying levels of need for particular services across different regions, whereas the supply map shows the actual provision of these services to each region. As a result, the similarity between these two maps can reflect the matching degree between supply and demand levels from a structural viewpoint. A high value of similarity indicates that the spatial allocation of supply is relatively reasonable, with high-demand areas receiving more supply and low-demand areas receiving less. Conversely, low similarity suggests inequities in service allocation, where some high-demand areas may be undersupplied while some low-demand areas may have an excess of services.
Spatial equity requires that services are properly allocated across different regions, aligning with the varying needs for those services in each area. In simple terms, areas with high demand should receive more services and vice versa. It is evident that the concept of spatial equity shows a remarkable consistency with the practical meaning of the similarity between supply and demand maps, which is further explained and illustrated in Figure 1. The first line describes an ideal situation of complete spatial equality, where service supplies are spatially uniformly distributed, regardless of the socio-economic characteristics and real needs of residents [48,49,50]. However, this often results in a significant difference between supply and demand maps and a relatively low level of spatial equity. The second line describes a more realistic situation where service supplies tend to concentrate on high-demand areas [51,52,53], attributing to these areas offering more opportunities for providers, and resulting in a spatial mismatch between supply and demand to a limited extent. The overall map similarity might be high, but differences still exist, indicating the limited spatial inequity in certain regions. Urban planners and policymakers should intervene to adjust the supply–demand structure and approach the ideal situation of complete spatial equity described in the third line, where supply and demand maps are perfectly aligned.
To sum up, map similarity can serve as an effective and visualized measure of spatial equity. And a widely applicable assessment framework based on map similarity can be proposed, as it is founded on reliable and easily comprehensible principles. Analyzing the overall similarity between supply and demand maps for a region can reflect the region’s overall level of spatial equity. In addition, examining the regional similarity differences can identify areas with significant inequities, enabling the establishment of targeted intervention measures.

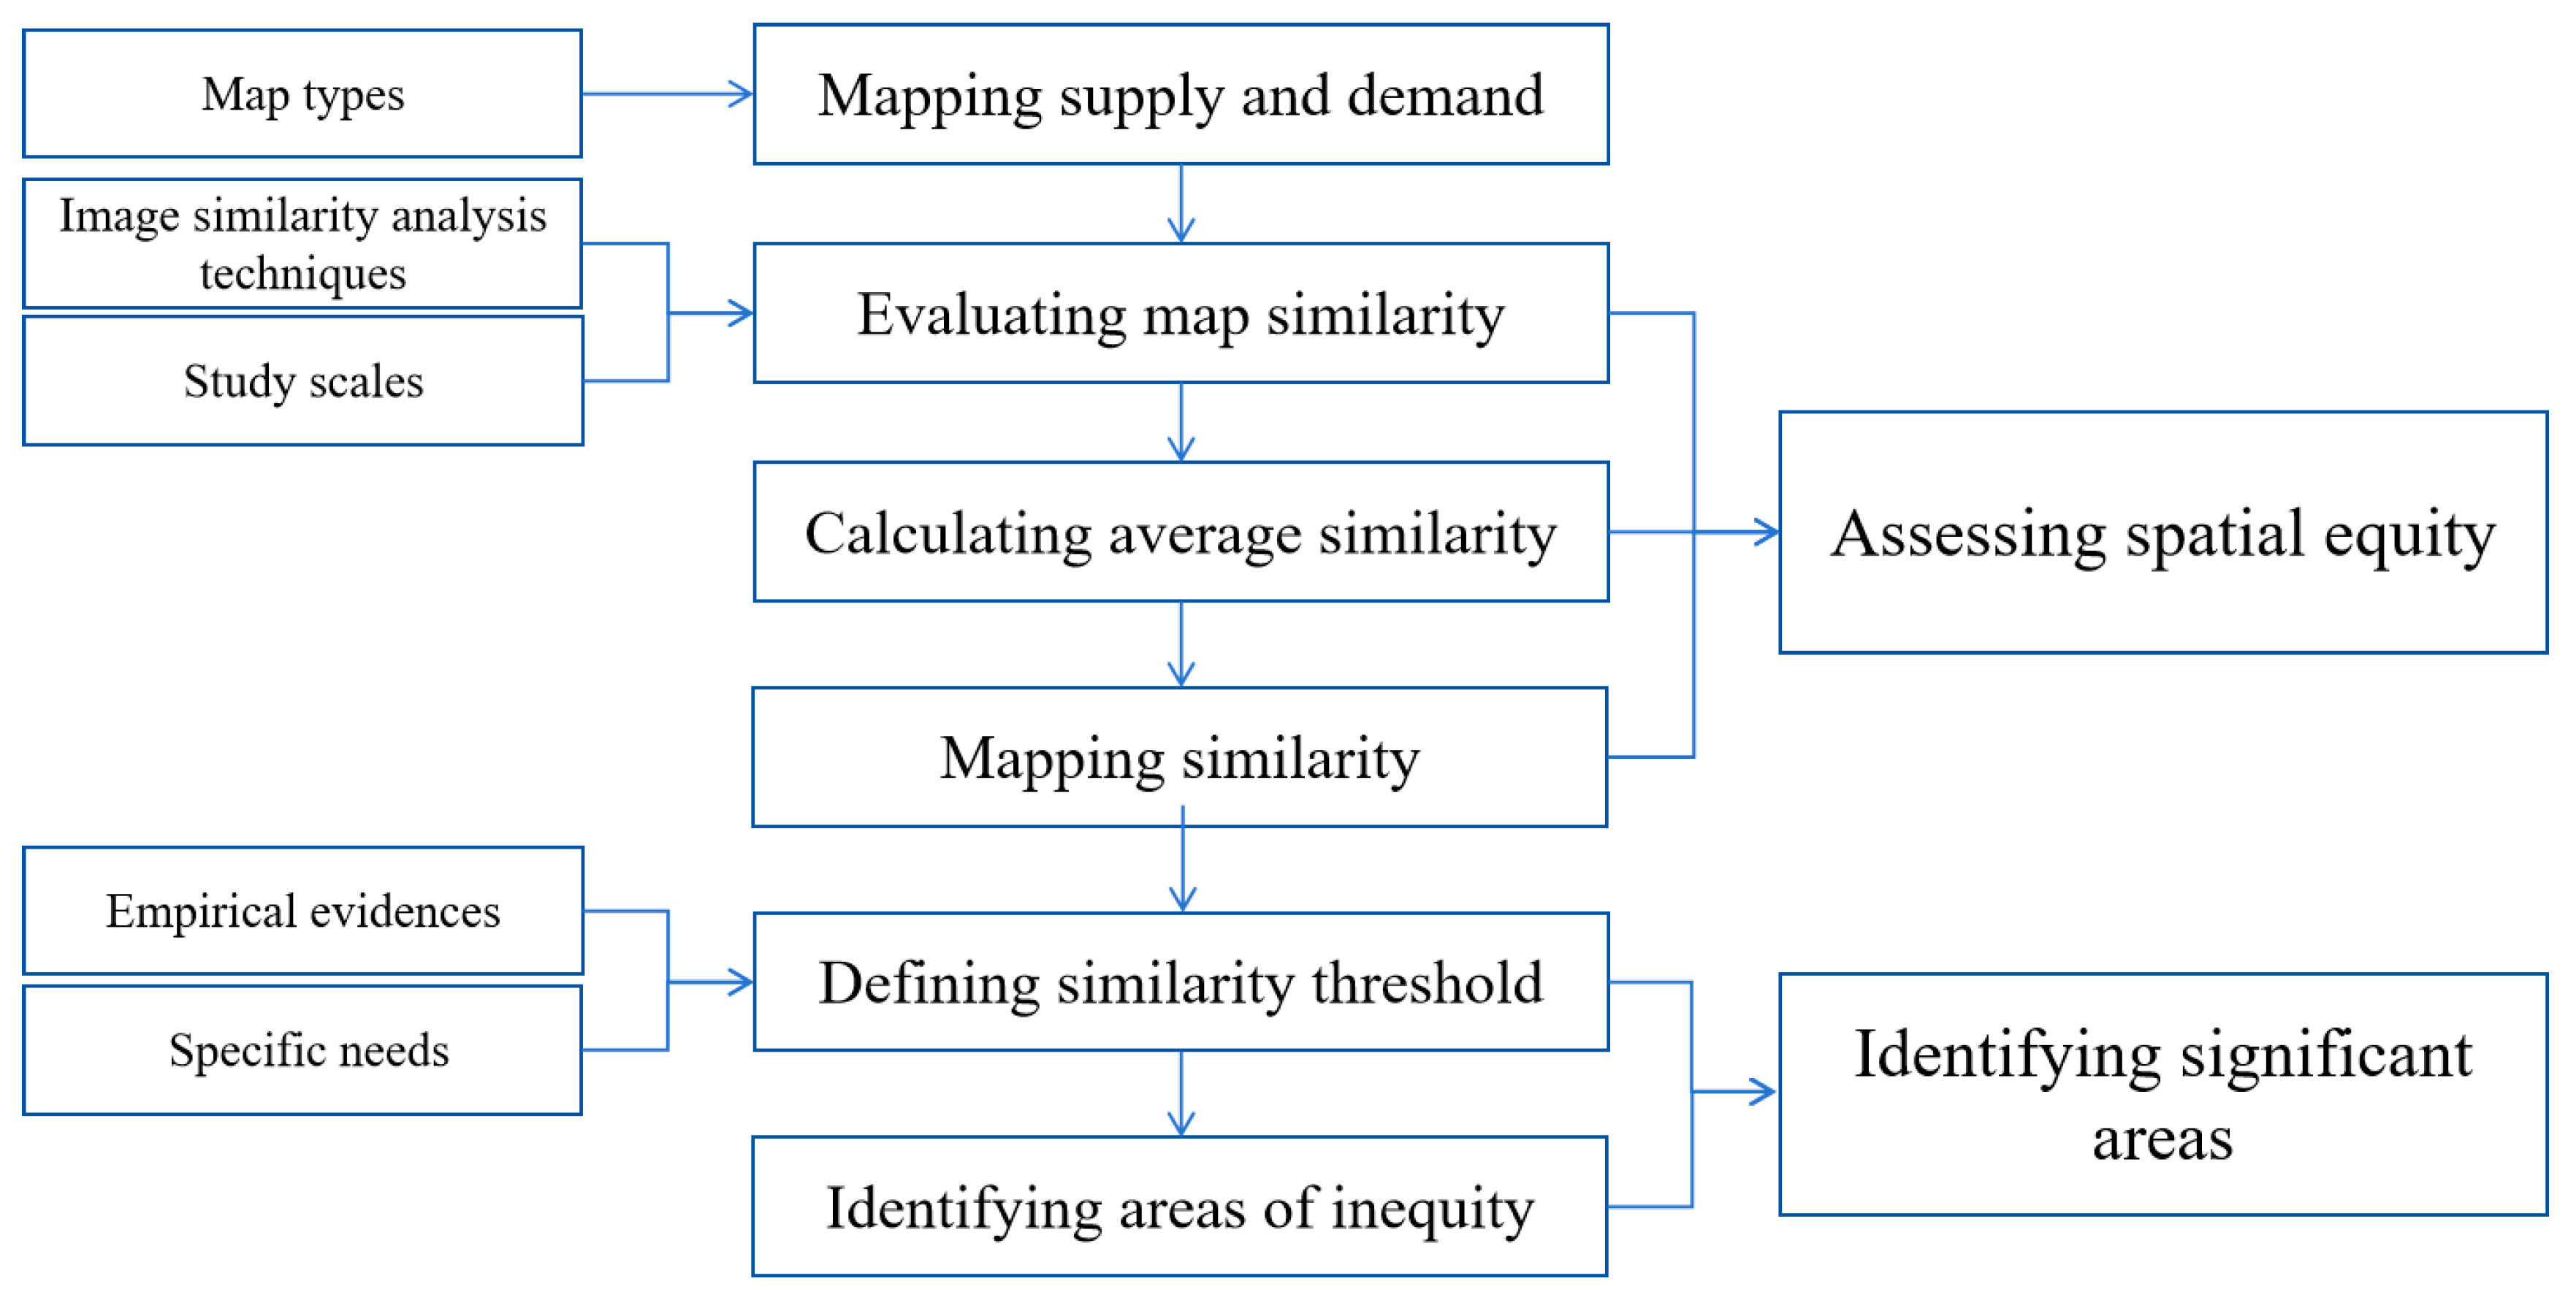
2.2. Procedure for Spatial Equity Assessment

The proposed spatial equity assessment framework is shown in Figure 2. First, the required two maps should be drawn according to the spatial distribution and strength of service supply and demand. The similarity between these maps for different regions can then be evaluated using image similarity analysis techniques. These similarities are mapped to visualize the varying supply–demand matching degrees across the study area, and the average serves as the assessment indicator of the level of spatial equity for the entire region. Subsequently, a threshold for similarity is defined establishing the minimum acceptable level of regional spatial equity, and significant areas with similarities falling below the threshold can then be identified. Special attention is required for these areas to offer guidance on targeted intervention measures. The step-by-step explanations of this framework are as follows:
Step 1: Mapping supply and demand
The proposed framework begins with drawing the supply and demand maps of services, which should effectively illustrate the variations in supply and demand levels across the study region. It should be noted that various types of maps can meet the basic requirements of the proposed framework. However, to fully leverage the capabilities of this framework, especially for evaluating the disparities of spatial equity among different regions and identifying notably inequitable regions, map types such as heat maps, contour maps, and choropleth maps should be used, which depict the spatial continuity and gradual changes in supply and demand with continuous surfaces, rather than focusing on dispersal or specific location information. In this study, heat maps of supply and demand are used, which is drawn through an extended kernel density estimator explained in Section 2.3.
Step 2: Evaluating map similarity
The second step is to evaluate the similarity between supply and demand maps. To effectively analyze the regional differences in spatial equity, the entire study region should be divided into smaller segments based on the required study scales, such as various GIS rasters or urban communities, and then the similarity for each segment should be evaluated separately. With regard to the image similarity analysis techniques, this study uses the Structural Similarity (SSIM) index to evaluate map similarity, which stands out for its sensitivity to supply–demand structural information and is explained in Section 2.4.
Step 3: Calculating average similarity
The third step is to calculate the average similarity among all segments. The mean similarity reflects the average extent to which the service allocation aligns with demand levels within the whole study region, serving as the assessment indicator of overall spatial equity.
Step 4: Mapping similarity
The fourth step involves drawing a map depicting the regional difference in similarities. This step allows for a visual demonstration of the variations in spatial equity level across the study region, based on which regional differences can be easily recognized.
Step 5: Defining similarity threshold
The fifth step is to set a threshold for map similarity, the physical meaning of which is the minimum acceptable level of spatial equity. It can be either a predefined value based on empirical evidence, or determined based on specific needs. For example, if the objective is to identify and prioritize improvement in the bottom 25% of urban areas with the lowest level of spatial equity, the similarity value at the lower quartile can be adopted as the threshold.
Step 6: Identifying areas of inequity
The proposed framework ends with identifying significant areas with severe spatial inequity. These areas can be identified by comparing the similarity of each divided segment with the threshold. Furthermore, whether the service supply within each of these areas is significantly greater or less than the demand can be determined by comparing the supply and demand maps. The results can provide guidance on the establishment of targeted intervention measures and the improvement of local supply–demand structure to mitigate spatial inequity.

2.3. Depicting Spatial Distribution and Strength: Extended Kernel Density Estimator

Kernel Density Estimation (KDE) is a widely used technique in geographic mapping and spatial analysis, which was originally developed as a non-parametric method for the empirical estimation of a probability density function without step discontinuities by using kernel functions [54,55]. Given a sample set x i of size n , the standard formation of KDE is as follows:
f ^ S K D E ( x ) = 1 n h · i = 1 n K ( x x i h )
where f ^ S K D E ( x ) is the estimated kernel density value of x , h is a smoothing parameter called bandwidth, x x i is the distance from the estimation point x to the sample x i , and K is a weight function called kernel function characterizing how the contribution of sample x i varies as a function of x x i .
Previous studies have shown that the selection of the kernel function K has little influence on the KDE results, while the identification of bandwidth h controlling the smoothness is more critical [56,57,58]. An overlarge bandwidth often leads to too many generalizations so that oversimplifying the result, and an overly small bandwidth often over-emphasizes the local variations and results in discrete regions. As a result, many researchers have focused on KDE with an adaptive bandwidth that varies depending on either the location of the samples (called sample smoothing estimator) or the location of the estimation point (called balloon estimator), and the scale of the study.
The potential contribution of each sample to the estimated PDF may be different, but the standard KDE treats each sample on the same basis. The natural alternative is to attach a weight to each sample reflecting its own contribution [59,60,61]. Some researchers have used weighted estimator to avoid uneven sampling, or to calculate the stacked PDF using several different types of samples.
In practice, there are always considerable differences in the distribution of service supplies and demands among different regions, and each of them may have its own characteristics and effects (scopes and sizes). From the perspective of the physics meaning and practical application, the bandwidth can be regarded as the influence distance of the samples, which is strongly related to the effect scope, and the attached weight can be regarded as the effect size. Therefore, in this study, a two-dimension weighted sample smoothing kernel density estimator is proposed to depict the spatial distribution and the strength of supplies and demands. Given that the samples carrying an adaptive bandwidth h 1 , h 2 , . . . h n and a weight ω 1 , ω 2 , . . . ω n , the proposed estimator can be expressed as follows:
f ^ W S S K D E ( x , y ) = i = 1 n ω i · 1 h i 2 · K ( d i , ( x , y ) h i )
h i = H ( s c i )
ω i = W ( s i i )
where f ^ W S S K D E ( x , y ) is the estimated value at location ( x , y ) , d i , ( x , y ) is the distance between sample i (location ( x i , y i ) ) and location ( x , y ) , and H and W are extension functions characterizing how the influence distance and size of the sample vary as its own characteristics s c and s i respectively. It should be noted that if H is set as a constant and W is set to be 1 / n , a two-dimension standard kernel density estimator can be obtained.

2.4. Evaluating Map Similarity: SSIM Index

The SSIM index, as a grayscale-based algorithm originally developed to provide a perceptually relevant assessment of image quality [62,63], has now been widely used in assessing image similarity due to its remarkably robust performance, even in the presence of a wide variety of image distortions. This index is favored for its mirroring the human visual system’s sensitivity to structural information including image luminance, contrast, and structure. In the spatial domain, the SSIM index between two image patches x = x i i = 1 , . . . M and y = y i i = 1 , . . . M is defined as follows:
S S I M = 2 μ x μ y + C 1 2 σ x y + C 2 μ x 2 + μ y 2 + C 1 σ x 2 + σ y 2 + C 2
where C 1 and C 2 are two small positive constant, μ x = 1 M i = 1 M x i is the average of grayscale for image x , σ x 2 = 1 M i = 1 M ( x i μ x ) 2 is the variance of grayscale for image x , and σ x y = 1 M i = 1 M ( x i μ x ) ( y i μ y ) is the covariance between image x and y . The values of SSIM range from −1 to 1, where a value of 1 is achieved only if image x and y are identical [62,63].

3. Case Study

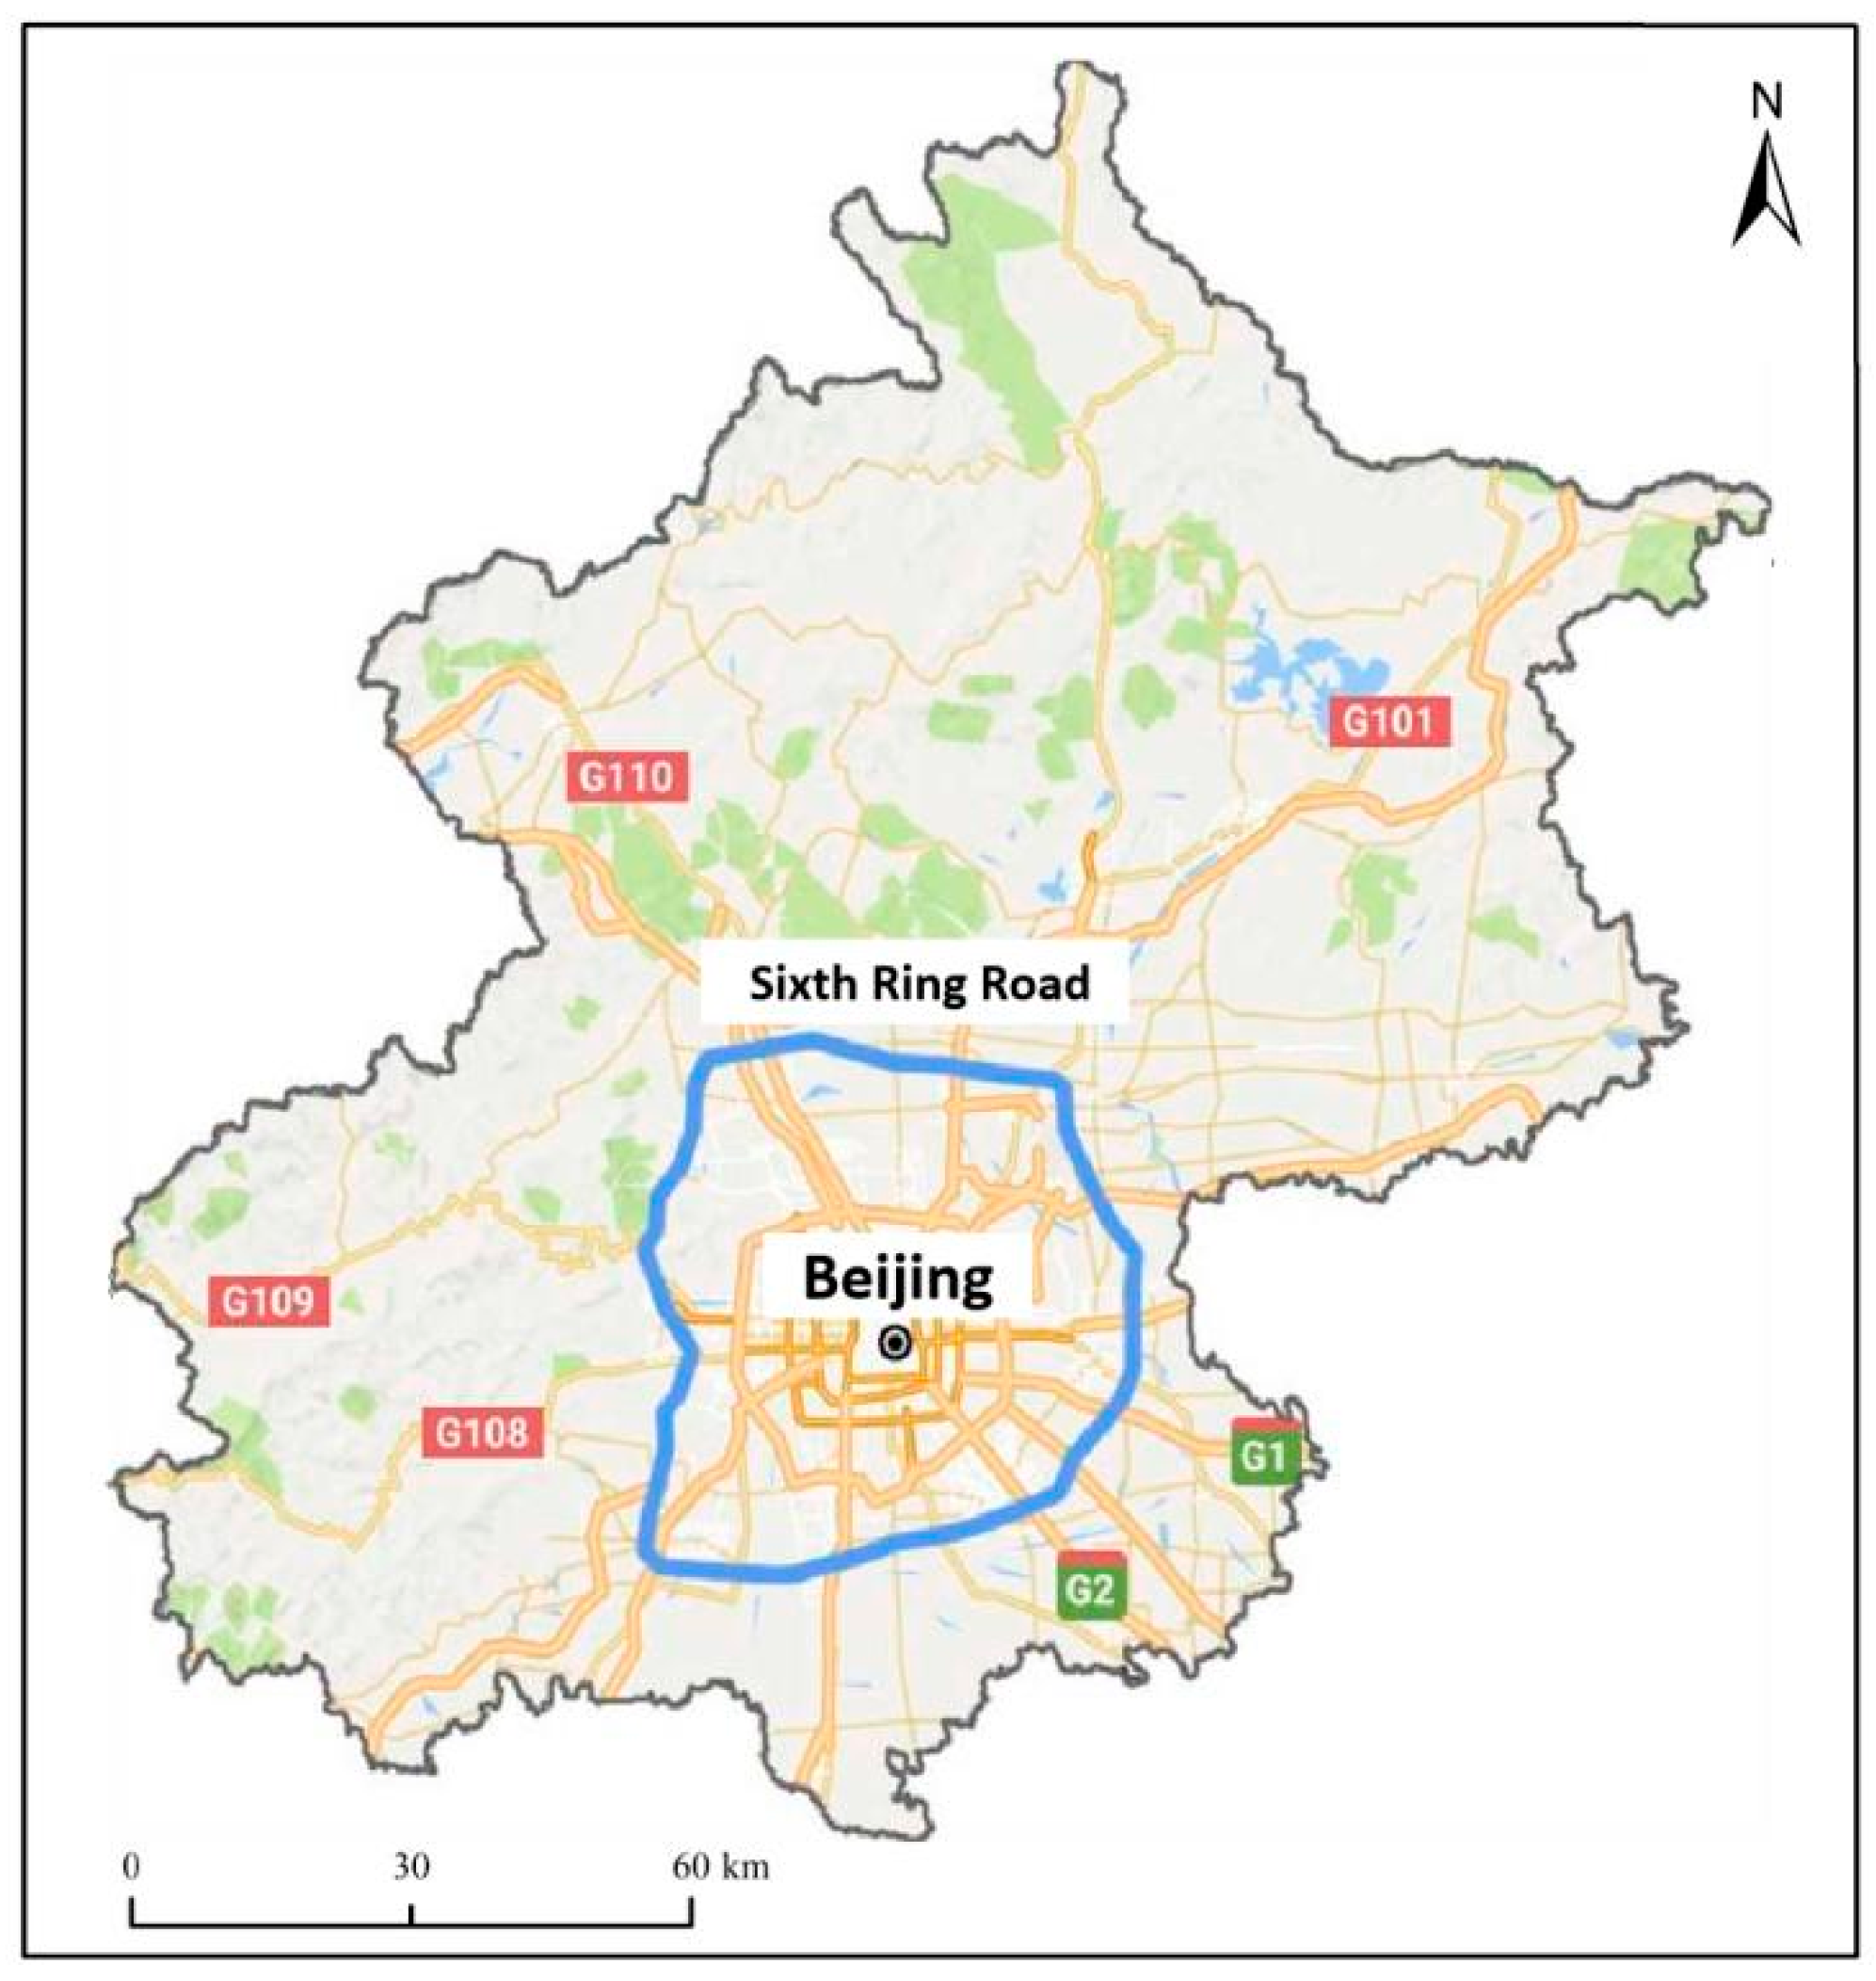
3.1. Study Area and Data Source

The spatial equity assessment of public transportation in the area inside the Sixth Ring Road of Beijing was selected as the case study area, which is shown in Figure 3. As the capital of China and a major international city, Beijing has long faced severe traffic congestion. Recent traffic reports indicate that Beijing’s average commuting time significantly exceeds that of many other major cities, with average speeds on main roads often dropping to as low as 20 km per hour during peak hours [64]. With over seven million vehicles registered in recent years, the need for robust public transport solutions is essential [65,66]. The city’s metro and bus systems, which are among the most heavily utilized in the world, play a vital role in mitigating road congestion. These systems are not merely key urban infrastructure but also pivotal to Beijing’s strategy for sustainable development. Therefore, examining Beijing’s public transportation from the perspective of spatial equity provides a valuable case study.
Despite Beijing’s emphasis on enhancing public transportation, uneven development across various areas continues to pose challenges. For a long time, the improvement and upgradation of Beijing’s public transportation infrastructure have been concentrated in the central districts filled with key destinations such as government offices, multinational corporations, and commercial centers, while de-prioritizing outskirts and exurbs [67]. This could potentially lead to spatial inequity between the centers and the off-centers. In addition, despite Beijing’s strong momentum of economic and transportation development, there has been an incline towards subway infrastructure development over recent years, thus inadvertently sidelining the expansion and enhancement of the bus network [68,69]. This neglect could potentially lead to a mismatch between the supply of bus services and the rapidly changing travel demands, hence possibly increasing the spatial inequity of not only the bus system but also the whole public transportation system.
In order to enhance readability and reduce technical complexity, this case study adopts a simplified approach to data acquisition, employing easily accessible indirect indicators to represent the supply and demand of public transportation services in Beijing. The case study data were collected in June 2023, including the bus and subway stations together forming the public transportation service network, and POI distributions indirectly reflecting the travel demand. A total of 15,606 bus stations, 441 subway stations, and more than 100,000 other available POIs such as education, business, finance, and government were obtained from the web API of Baidu Maps, which is China’s leading map service provider. The layout of the bus and subway stations and the number of routes they serve indicate the spatial distribution and strength of public transportation supplies, respectively. The density of POIs serves as the demand indicator for public transportation, since they can reflect the potential for travel activities to some extent.

3.2. Implementation of the Proposed Framework

In step 1 of the case study, the supply and demand maps are drawn through the extended kernel density estimator (see Section 2.3 for details). When the mapping supply considers the bus and subway network, all stations serve as key samples for the estimator. The weight of these samples reflects the node importance of them within the overall network. As a result, bus stations are weighted by the number of bus routes they serve, while subway stations are weighted by multiplying the number of subway lines they serve by 62.5. The reason is that since 2019, the average annual passenger volume per subway line has been approximately 62.5 ± 2 times that of per bus route according to the Beijing Statistical Yearbook [70]. The bandwidth of these samples reflects to the service coverage. As a result, the bandwidth of the bus stations is set to be 500 m, since the Chinese Transport Agency focuses on a 500 m coverage of the bus network. The bandwidth of subway stations is set to be 1500 m, since the spacing of adjacent subway stations in Beijing is always less than 3 km. When the mapping demand considers POI distributions, a uniform weight and a standardized bandwidth of 500 m are applied to all POI samples, respectively, reflecting a widespread method in transportation geography that equally treats the POIs, and a widely used maximum acceptable walkable distance for residents to access public transportation. At this stage, the extended kernel density estimator regresses to the standard kernel density estimator.
In step 2, the study region is divided into multiple square rasters with lengths of 1 km, 2 km, and 4 km, respectively, to analyze the regional differences and make comparisons, which are twice, four times, and eight times as long as the bandwidth of the bus stations and all POI samples. The three different scales were chosen to facilitate the understanding of the impact of scale on the spatial equity assessment results, with smaller scales highlighting localized disparities and larger scales providing a broader understanding of city-wide patterns. In practical applications, the scale should be determined according to the specific objectives of the assessments, allowing urban planners and policymakers to tailor their interventions and prioritize areas that require more focused attention.
In step 5, two different thresholds for map similarity reflecting minimum acceptable levels of spatial equity are set to make comparisons. One is 0.8, which is set based on empirical evidence [71,72,73,74]. Previous research has demonstrated that this value indicates a sufficiently high degree of similarity, suggesting that the two maps being compared share substantial structural similarities. SSIM values above this threshold are generally associated with visually indistinguishable or highly similar pictures, making it a practical cutoff point for many image processing applications. By adopting this value, the case study can align with established practices and accepted standards. The other is the lower quartile of the similarity values obtained in step 2. This choice is based on the practical needs of urban management, where decision-makers often prioritize addressing the most spatially inequitable areas. By defining the threshold at the 25th percentile, the case study can identify the bottom quartile of regions with the lowest spatial equity, allowing for targeted interventions in the areas experiencing the most severe disparities. It should be noted that in this case, setting the threshold at the lower quartile is to provide a standardized and comparable basis for evaluating spatial equity alongside the other predefined threshold. In practical application, this threshold is not fixed at the 25th percentile. It should be determined based on specific policy objectives and evolving urban planning needs.

4. Result and Discussion

4.1. Mapping Supply and Demand

The supply and demand maps of Beijing’s public transportation in the study area are shown in Figure 4. The color intensity on these maps directly reflects the strength of supply and demand. In the supply map, significant variations in color intensity across different areas can be observed, especially between the regions inside and outside Beijing’s Fourth Ring Road. This illustrates the Fourth Ring Road acting as a distinct boundary separating central Beijing from the outer districts, and the focus on central area in the development of Beijing’s public transportation infrastructure. Some areas outside the boundary still exhibit high supply strengths, largely due to the presence of subway transfer stations facilitating the formation of transportation hubs.
In the demand map, the public transportation demand within Beijing’s Sixth Ring Road is densely centralized and disperses radially. This distribution pattern may be associated with the construction of fast roads. Significantly, a direct visual comparison between supply and demand maps enables the preliminary identification of severe spatial inequity, where areas with deep colors on the supply map correspond to light colors on the demand map, or vice versa.

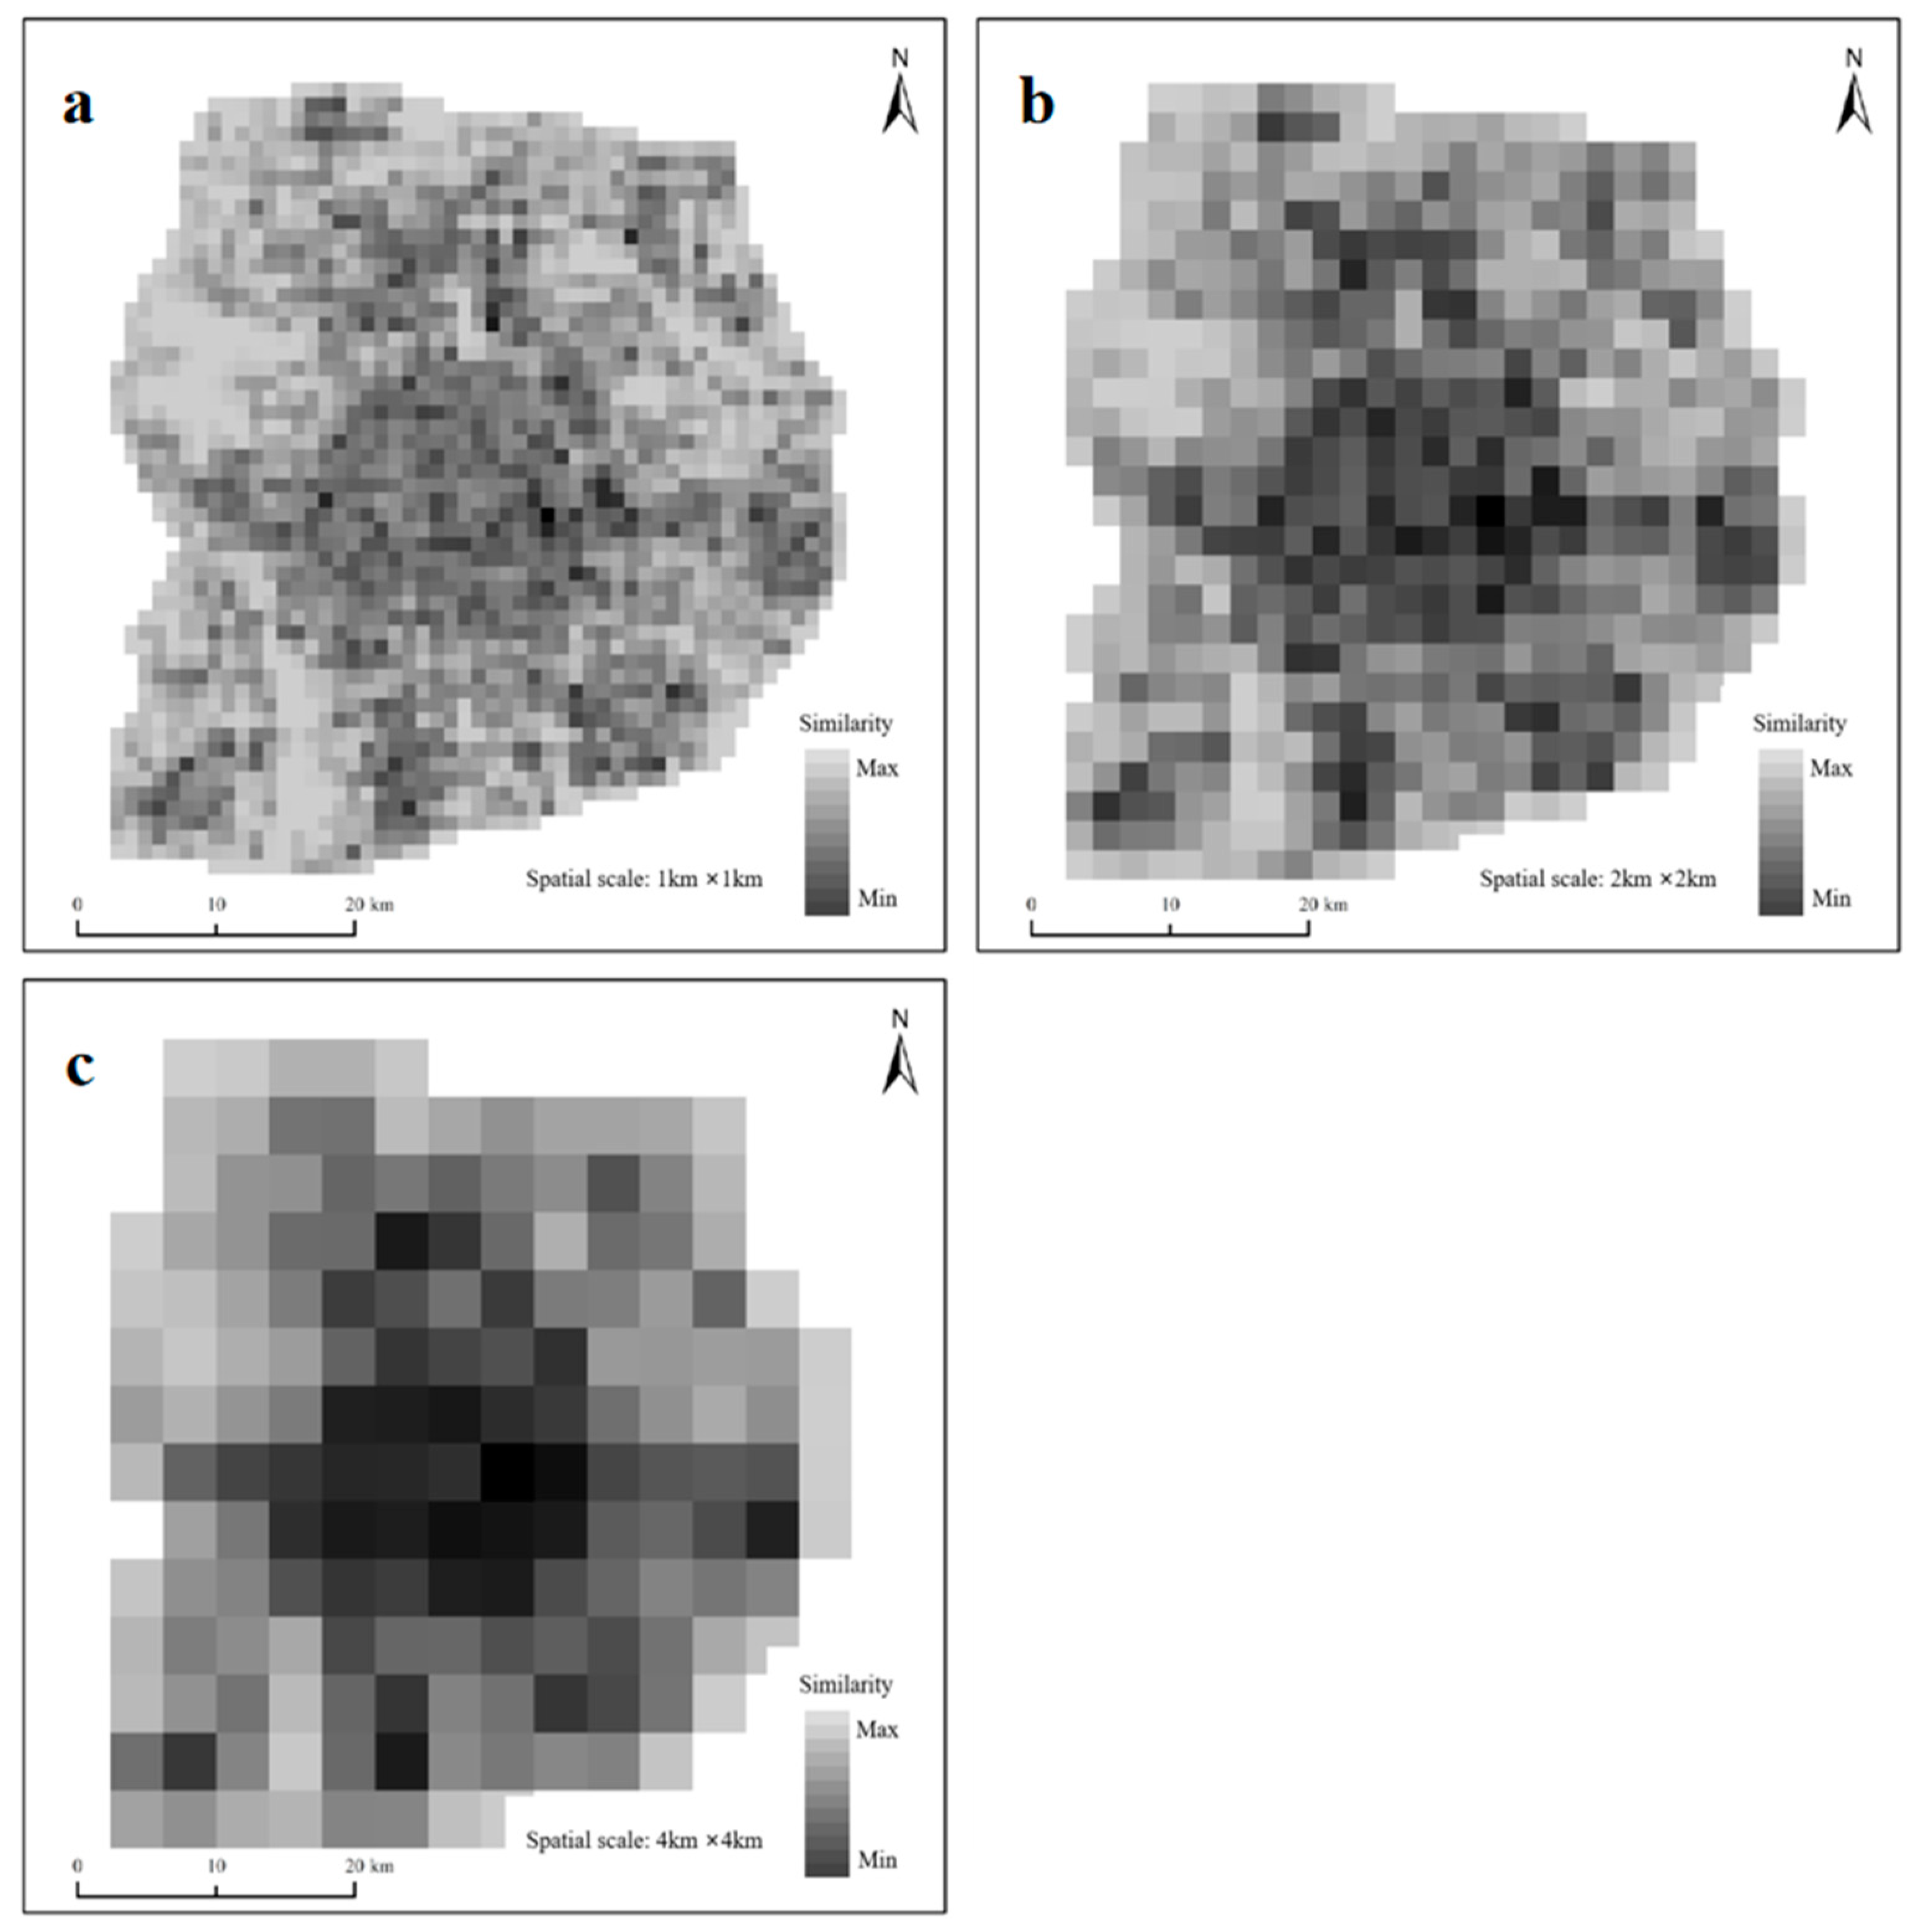
4.2. Assessing Spatial Equity

The similarity of each 1 km × 1 km, 2 km × 2 km, and 4 km × 4 km raster in the case study region between supply and demand maps is evaluated individually. The descriptive statistics of evaluation results are presented in Table 1. The average map similarity of the whole study region in each spatial scale is more than 0.8, reflecting a relatively high overall degree of alignment of public transportation between service allocation and demand levels, serving as the overall level of spatial equity in the study area. Regions inside the Fourth Ring Road exhibit a lower average map similarity in each spatial scale compared to those outside, suggesting that the focused development of public transportation infrastructure within the central areas may be inadvertently intensifying regional spatial inequities. A high variance (i.e., standard deviation) in map similarity indicates significant disparities in levels of spatial equity across different rasters
These results are consistent with those of Jin et al.’s research, who found a mismatch between supply and demand for public transportation services in central Beijing [75]. Conversely, Sun et al. and Yang et al. both reported higher transportation equity in these regions [76,77]. The discrepancy arises because Jin et al. took into account both the supply and demand of public transportation services, whereas Sun et al. and Yang et al. focused on coverage and accessibility analysis, considering only the supply side without addressing the distribution of demand within the region. Due to the prioritized development of public transportation infrastructure within central Beijing, this region enjoys an ample supply and high accessibility of public transportation services. However, the limited demand in this area ultimately leads to an oversupply of services.
The visualizations of evaluation results are depicted in Figure 5, where rasters with darker colors indicate lower map similarity, thus more severe spatial inequity. The results show that as the spatial scale increases, the differences in map similarity between different rasters gradually decrease. Smaller spatial scales more intuitively highlight the detailed differences in spatial equity between different areas, while larger spatial scales provide a clearer representation of the overall level of spatial equity within the whole region. In the central areas of Beijing, there are noticeable shadows observed. In parts of the outer areas, shadows are also observable. Some of these areas are transportation hubs, seeing high volumes of transferring passengers but having low local demands for public transportation. Others are peripheral commercial centers, attracting heavy demands but suffering from inadequate public transportation infrastructures.

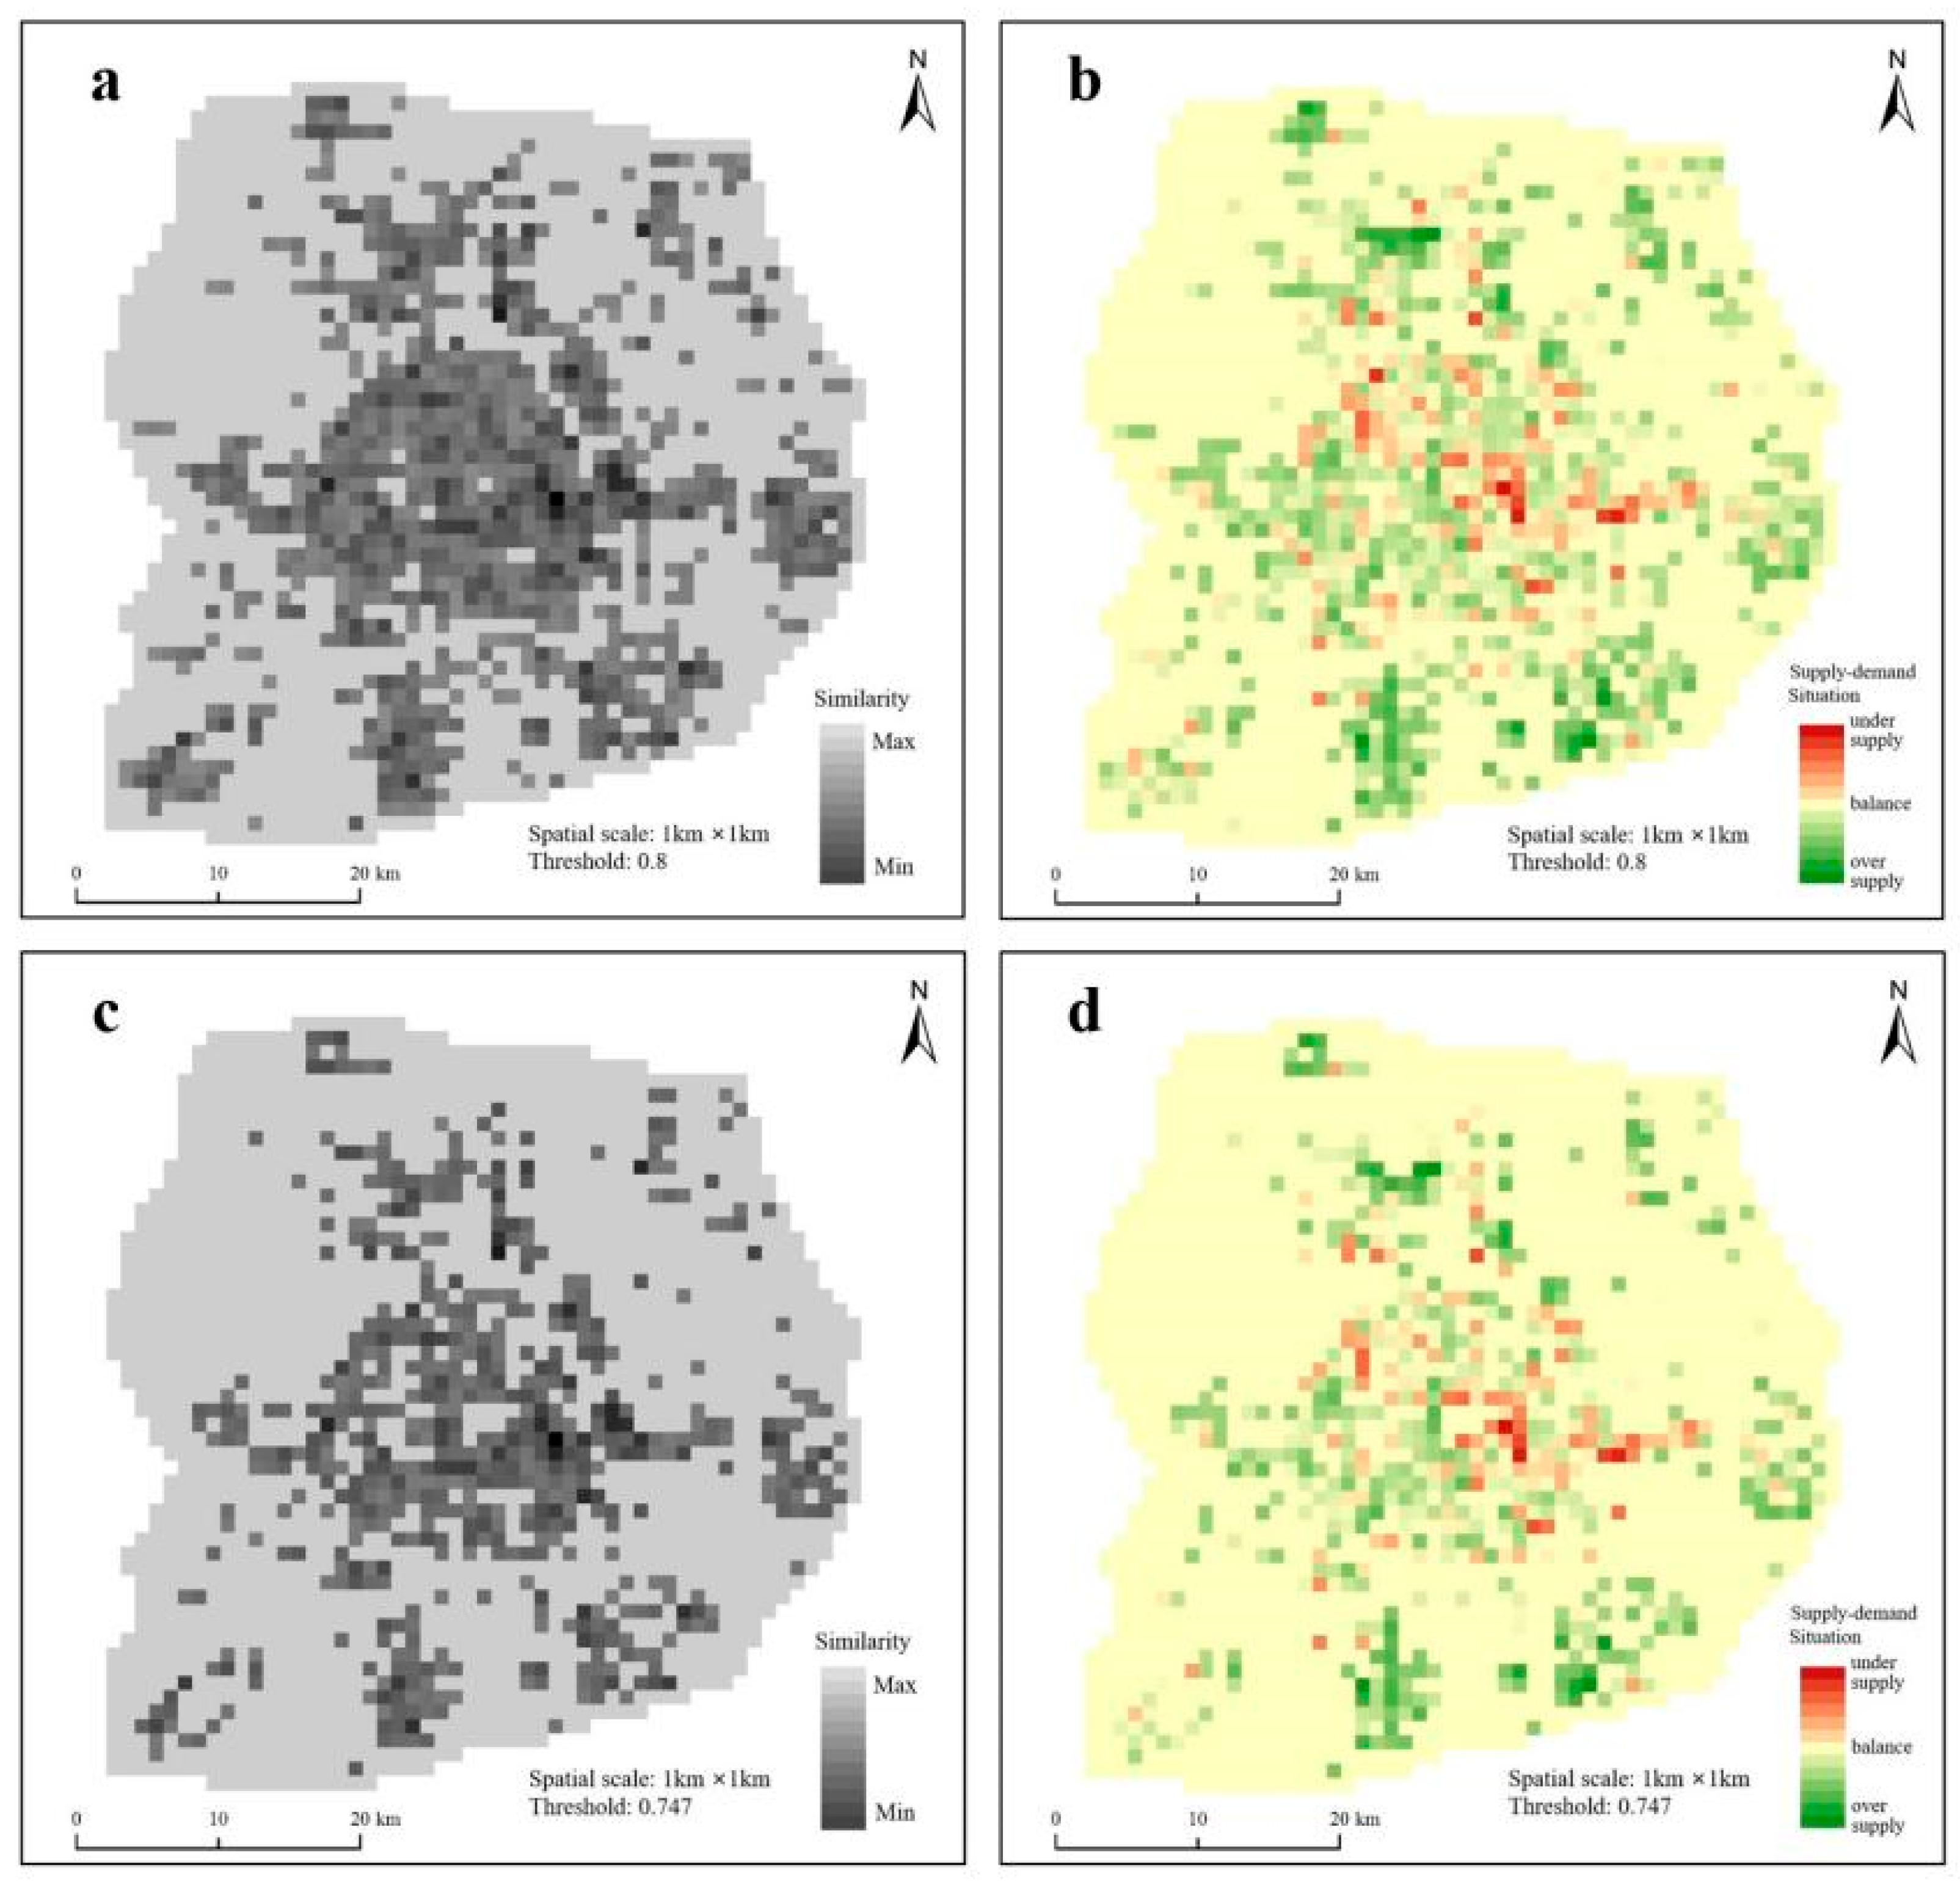
4.3. Identifying Significant Areas

To highlight the detailed differences between areas, the map similarity evaluation results at the 1 km × 1 km spatial scale were used to conduct further analysis. The significant areas whose similarities fall below the defined thresholds are identified and visualized in Figure 6a,c. Larger shaded areas and deeper colors in these figures indicate more severe spatial inequities within those regions. The results show that when the threshold is set to 0.8, the central area of Beijing is almost entirely shaded, and several outer areas also exhibit coherent shadowed zones. This indicates that the central and some certain outer areas of Beijing have noteworthy imbalanced supply–demand structures for public transportation services, which should draw concern from urban managers. In contrast, when the threshold is adjusted to 0.747 as the lower quartile, the shadowed areas on the map become fragmented. This phenomenon suggests that the setting of the threshold has a significant impact on the identification results. This shift from a coherent spatial distribution to a more scattered pattern highlights the identification of the underlying issues contributing to spatial inequality, pinpointing the specific regions where the most significant disparities occur. Specifically, areas with critical spatial inequity of public transportation services (i.e., areas with very low similarities) are generally not continuous, which can be attributed to the relatively mature development of Beijing’s public transportation network, with only a few small areas experiencing severe spatial inequity.
The relative disparities between supply and demand levels in significant areas are analyzed and visualized in Figure 6b,d. Rasters, where supply allocation of public transportation satisfactorily aligns with demand levels (i.e., where the value of map similarity exceeds the threshold), are marked in yellow, and those with an oversupply or undersupply are marked in green and red, respectively. The deeper the colors of red and green, the more severe the imbalance. The results show that about three-quarters of significant areas are facing considerable surpluses of supplies, while the remaining undersupplied areas are fragmented and mainly located in the central area of Beijing. Urban planners and policymakers should pay special attention to these significant areas and establish targeted intervention measures to mitigate spatial inequity. Additionally, it should be noted that rasters with extremely low map similarity do not always coincide with those with severe supply–demand imbalances. This is primarily because the similarity evaluation based on the SSIM index takes into account both the spatial distribution and strength of supply and demand within each raster, while the analysis of the current supply–demand situation only considers the average strengths.

4.4. Implications and Recommendations from the Case

The above results indicate that the public transportation services within Beijing’s Sixth Ring Road are relatively spatially equitable, but there are still a few issues that need to be addressed. Despite the central area within the Fourth Ring Road having a dense public transportation network, some regions still experience a mismatch between the service prevision and the actual travel demands. In particular, certain stations in areas marked red in Figure 6 may face significant traffic pressure during peak hours. In order to mitigate spatial inequity in these areas, urban managers are recommended to prioritize public transportation infrastructure projects, such as constructing new stations, expanding and upgrading existing ones, and increasing the frequency of public transportation lines to enhance the region’s travel capacity.
Whether in the central or the outer areas of Beijing, there are regions marked green in Figure 6 where there is a surplus of available public transportation services. In these regions, urban managers are recommended to promote the adoption of transit-oriented development (TOD) strategies. These strategies involve the construction of high-density, multifunctional districts centered around public transportation stations [78,79,80], which facilitate easier and more efficient access to the public transportation system and more cohesive urban environments, thereby encouraging the shift towards public transportation and mitigating spatial inequity.
Given an extended application of the above recommendations, every significant area facing the challenge of spatial inequity can implement targeted intervention measures to effectively address such issues. On the one hand, a more equitable service allocation can be achieved through directly controlling the suppliers, such as building new schools, hospitals, transport stations, and other relevant facilities in areas lacking public services but having a high supply of public transportation. On the other hand, the spatial inequity can be alleviated through redirecting excessive demand to regions with ample service supply, such as promoting the utilization of local hospitals for minor ailments by advising patients to avoid congested central hospitals for their medical needs.
While this case study demonstrates the application of the proposed framework, its simplified nature suggests the need for a more comprehensive analysis in future research. First, although POI data have been validated as an effective indicator of demand [81,82,83], it overlooks critical demographic factors like population density and travel habits. Future studies should integrate real demand data, such as surveys or mobile location analytics, to strengthen the assessment’s reliability. Second, the study only used the proposed method for assessing spatial equity, without comparing it to conventional methods due to data accessibility challenges. Future studies should combine both methods to cross-validate results and support urban planning. Lastly, there has been limited exploration into detailed strategies for mitigating spatial inequity in Beijing’s public transportation services. Future studies can address these issues by narrowing spatial scales and focusing on significant areas to identify bus and subway station gaps or redundancies.

4.5. Application Prospects of the Proposed Framework

The proposed assessment framework provides multiple advantages and promising applications. First, this framework is theoretically generally applicable, which makes it suitable for various assessment objects, research scales, and types of supply and demand data. Its strong broad applicability stems from the fact that it can be employed as long as the maps of supply and demand are available. Second, the implementation of this framework enables the identification of areas with severe spatial inequities, which makes it provide guidance on formulating more focused and effective intervention strategies. Third, the results of this framework at each phase are clearly visualized, which is easy to comprehend for a wide range of stakeholders such as urban planners, policymakers and experts in various relevant industries.
Furthermore, this framework can eliminate the pain points of the widely used assessment methods. It allows for varied data types, as long as they involve the spatial distribution and strength of supplies and demands. Thus, it overcomes the limitations of coverage and accessibility analysis that often overlooks the real distribution and strength of demand, and of geospatial analysis that often struggles with an incomplete consideration of influencing factors and a lack of data. The results generated by approaches based on this framework can contribute to the development of targeted intervention strategies to mitigate spatial inequity. Thus, it overcomes the limitations of Gini coefficient analysis that is only informative about overall conditions, having almost no guiding role in practical improvements in spatial equity.
The application of this framework could greatly contribute to urban development strategies by providing a clear and targeted analysis of where and how spatial inequities occur. Such knowledge allows for the design of more targeted infrastructure development, equitable public service distribution and a comfortable overall life quality. The potential to integrate this framework with emerging technologies such as big data analysis and real-time supply–demand data tracking could further enhance its effectiveness, making it a pivotal tool in the pursuit of a more equitable urban future.
The proposed framework does have some limitations, which can be improved by future research. First and foremost, this framework is theoretically generally applicable, suitable for various assessment objects, research scales, and types of supply and demand data. However, its applicability requires validation through further related studies. Therefore, it is expected that experts interested in this framework contribute to its ongoing development, enhancement, and application. Second, this framework involves a variety of combinations between spatial map types and image similarity analysis techniques that can meet the basic requirements. However, applying different techniques to various types of supply and demand maps can result in notably different similarity outcomes, which significantly influences the assessment result of overall spatial equity and the setting of similarity threshold. As a result, determining the most appropriate image similarity analysis technique with the corresponding spatial map type is of great importance. Third, this framework involves the setting of a similarity threshold. This process carries certain risks due to its dependence on users’ familiarity with the image similarity analysis techniques, and their understanding of the correlation between map similarity and spatial equity, which is susceptible to personal bias. As a result, to derive an objective and reasonable threshold, it is essential to extensively employ this framework in practice and accumulate a wealth of empirical insights.

5. Conclusions

Spatial inequity has caused a series of social problems and become a non-negligible challenge for many countries. Urban planners and policymakers are seeking effective ways to assess regional spatial equity, while the commonly used assessment methods each have their inherent limitations, which constrain their effectiveness in guiding the establishment of targeted intervention measures to mitigate spatial inequity. In this context, a new framework to assess spatial equity through evaluating the similarities between the supply and demand maps is proposed in this study, which offers a targeted, comprehensible, and generally applicable tool to identify significant areas with severe inequity. Specifically, the proposed framework can address the pain points of the widely used assessment methods to some extent. Future research could further develop this framework by applying it to various spatial equity assessments to verify its applicability, reliability, and effectiveness. Concurrently, it should focus on determining the most appropriate image similarity analysis technique, the corresponding spatial map type, and the most suitable settings for map similarity thresholds.
To facilitate the comprehension of this framework, a case study is included that assesses the spatial equity of public transportation within Beijing’s Sixth Ring Road. The results show that the overall level of spatial equity in the study area is relatively high, but some issues remain. Nearly 75% of significant areas are clustered in several regions experiencing an oversupply, whereas the rest with an undersupply are scattered and mainly located in the central area of Beijing. The implications and some recommendations from the case are discussed. Spatial inequity can be mitigated by implementing targeted intervention measures including enhancing infrastructure in undersupplied areas and guiding excess demand toward areas with sufficient services.

Author Contributions

Conceptualization, Xiaojian Hu and Qian Chen; Data curation, Xiatong Hao; formal analysis, Xiatong Hao; Funding acquisition, Xiaojian Hu; investigation, Xiatong Hao; Methodology, Xiatong Hao; project administration, Xiaojian Hu; resources, Xiatong Hao; Software, Ke Zhang; supervision, Xiaojian Hu and Qian Chen; validation, Xiaojian Hu; visualization, Ke Zhang; writing—original draft, Xiatong Hao; writing—review and editing, Xiatong Hao and Ke Zhang. All authors have read and agreed to the published version of the manuscript.

Funding

The work is supported by National Natural Science Foundation of China (Grant No. 52272344).

Data Availability Statement

Data will be made available on request.

Acknowledgments

The authors would like to sincerely thank the editor and anonymous reviewers for their thoughtful and valuable comments.

Conflicts of Interest

The authors declare no conflicts of interest.

References

  1. Alonso, W. Equity and its relation to efficiency in urbanization. In Essays in Regional Economics; Harvard University Press: Cambridge, MA, USA, 1971; pp. 40–57. [Google Scholar]
  2. Deutsch, M. Equity, equality, and need: What determines which value will be used as the basis of distributive justice? J. Soc. Issues 1975, 31, 137–149. [Google Scholar]
  3. Omer, I. Evaluating accessibility using house-level data: A spatial equity perspective. Comput. Environ. Urban Syst. 2006, 30, 254–274. [Google Scholar]
  4. Taleai, M.; Sliuzas, R.; Flacke, J. An integrated framework to evaluate the equity of urban public facilities using spatial multi-criteria analysis. Cities 2014, 40, 56–69. [Google Scholar] [CrossRef]
  5. Stone, D.A. Policy Paradox: The Art of Political Decision Making; WW Norton & Company: New York, NY, USA, 2022. [Google Scholar]
  6. Lucy, W. Equity and planning for local services. J. Am. Plan. Assoc. 1981, 47, 447–457. [Google Scholar]
  7. Talen, E. The social goals of new urbanism. Hous. Policy Debate 2002, 13, 165–188. [Google Scholar]
  8. Tsou, K.W.; Hung, Y.T.; Chang, Y.L. An accessibility-based integrated measure of relative spatial equity in urban public facilities. Cities 2005, 22, 424–435. [Google Scholar]
  9. Qin, X.; Wei, Y.D.; Wu, Y.; Huang, X. Regional development and inequality within city regions: A study of the Yangtze River delta, China. Geogr. Rev. 2023, 113, 359–385. [Google Scholar]
  10. Wang, Z.; Wang, T.; Zang, L.; Wang, L.; Zhang, Y. Spatial Equity Disparities of Work Commuting Based on Job Accessibility in Chengdu, China. ISPRS Int. J. Geo-Inf. 2024, 13, 417. [Google Scholar] [CrossRef]
  11. Zhao, Y.; Zhou, Y. Isochrone-Based Accessibility Analysis of Pre-Hospital Emergency Medical Facilities: A Case Study of Central Districts of Beijing. ISPRS Int. J. Geo-Inf. 2024, 13, 288. [Google Scholar] [CrossRef]
  12. Peters, P.E. Inequality and social conflict over land in Africa. J. Agrar. Change 2004, 4, 269–314. [Google Scholar]
  13. Oviedo, D. Making the links between accessibility, social and spatial inequality, and social exclusion: A framework for cities in Latin America. Adv. Transp. Policy Plan. 2021, 8, 135–172. [Google Scholar]
  14. Boyce, J.K. Inequality as a cause of environmental degradation. Ecol. Econ. 1994, 11, 169–178. [Google Scholar] [CrossRef]
  15. Bjørnskov, C.; Dreher, A.; Fischer, J.A.; Schnellenbach, J.; Gehring, K. Inequality and happiness: When perceived social mobility and economic reality do not match. J. Econ. Behav. Organ. 2013, 91, 75–92. [Google Scholar]
  16. Harmon, T. Integrating Social Equity and Growth Management; Institute for Community Economics: Springfield, MA, USA, 2003. [Google Scholar]
  17. Yu, P.; Yung, E.H.; Chan, E.H.; Zhang, S.; Wang, S.; Chen, Y. The Spatial Effect of Accessibility to Public Service Facilities on Housing Prices: Highlighting the Housing Equity. ISPRS Int. J. Geo-Inf. 2023, 12, 228. [Google Scholar] [CrossRef]
  18. Zhang, R.; Peng, S.; Sun, F.; Deng, L.; Che, Y. Assessing the social equity of urban parks: An improved index integrating multiple quality dimensions and service accessibility. Cities 2022, 129, 103839. [Google Scholar]
  19. Angelidou, M. Smart city policies: A spatial approach. Cities 2014, 41, S3–S11. [Google Scholar] [CrossRef]
  20. Li, C.; Wang, J. Measuring multi-activities accessibility and equity with accessibility-oriented development strategies. Transp. Res. Part D Transp. Environ. 2024, 126, 104035. [Google Scholar]
  21. Wilkinson, C.; Saarne, T.; Peterson, G.D.; Colding, J. Strategic spatial planning and the ecosystem services concept–an historical exploration. Ecol. Soc. 2013, 18, 37. [Google Scholar]
  22. Guo, Y.; Chen, Z.; Stuart, A.; Li, X.; Zhang, Y. A systematic overview of transportation equity in terms of accessibility, traffic emissions, and safety outcomes: From conventional to emerging technologies. Transp. Res. Interdiscip. Perspect. 2020, 4, 100091. [Google Scholar]
  23. Neutens, T. Accessibility, equity and health care: Review and research directions for transport geographers. J. Transp. Geogr. 2015, 43, 14–27. [Google Scholar]
  24. Whitehead, J.; Pearson, A.L.; Lawrenson, R.; Atatoa-Carr, P. How can the spatial equity of health services be defined and measured? A systematic review of spatial equity definitions and methods. J. Health Serv. Res. Policy 2019, 24, 270–278. [Google Scholar] [CrossRef] [PubMed]
  25. Faghihinejad, F.; Zoghifard, M.; Amiri, A.M.; Monajem, S. Evaluating social and spatial equity in public transport: A case study. Transp. Lett. 2023, 15, 1420–1429. [Google Scholar] [CrossRef]
  26. Guo, S.; Pei, T.; Wang, X.; Song, C.; Chen, X.; Chen, J.; Shu, H.; Liu, Y.; Wu, M. Equity of subway accessibility: A perspective from work commute trips. Transp. Res. Part D Transp. Environ. 2022, 113, 103515. [Google Scholar] [CrossRef]
  27. Li, Z.; Liang, Z.; Feng, L.; Fan, Z. Beyond accessibility: A multidimensional evaluation of urban park equity in Yangzhou, China. ISPRS Int. J. Geo-Inf. 2022, 11, 429. [Google Scholar] [CrossRef]
  28. Yang, W.; Cheng, Y.; Xu, C.; Zhang, J. The Seasonal Migrants Spatially Affect the Park Green Space Accessibility and Equity under Different Travel Modes: Evidence from Sanya, China. ISPRS Int. J. Geo-Inf. 2023, 12, 423. [Google Scholar] [CrossRef]
  29. Sabokbar, H.F.; Mohammadi, H.; Tahmasbi, S.; Rafii, Y.; Hosseini, A. Measuring spatial accessibility and equity to healthcare services using fuzzy inference system. Appl. Geogr. 2021, 136, 102584. [Google Scholar] [CrossRef]
  30. Jang, S.; An, Y.; Yi, C.; Lee, S. Assessing the spatial equity of Seoul’s public transportation using the Gini coefficient based on its accessibility. Int. J. Urban Sci. 2017, 21, 91–107. [Google Scholar] [CrossRef]
  31. Mahmut, M.; Yin, P.; Peng, B.; Wu, J.; Wang, T.; Yuan, S.; Zhang, Y. Examining Spatial Accessibility and Equity of Public Hospitals for Older Adults in Songjiang District, Shanghai. ISPRS Int. J. Geo-Inf. 2024, 13, 403. [Google Scholar] [CrossRef]
  32. Raza, A.; Zhong, M.; Akuh, R.; Safdar, M. Public transport equity with the concept of time-dependent accessibility using Geostatistics methods, Lorenz curves, and Gini coefficients. Case Stud. Transp. Policy 2023, 11, 100956. [Google Scholar] [CrossRef]
  33. Ansong, D.; Ansong, E.K.; Ampomah, A.O.; Adjabeng, B.K. Factors contributing to spatial inequality in academic achievement in Ghana: Analysis of district-level factors using geographically weighted regression. Appl. Geogr. 2015, 62, 136–146. [Google Scholar] [CrossRef]
  34. Roy, S.; Majumder, S.; Bose, A.; Chowdhury, I.R. The rich-poor divide: Unravelling the spatial complexities and determinants of wealth inequality in India. Appl. Geogr. 2024, 166, 103267. [Google Scholar]
  35. Xiao, Y.; Wang, Z.; Li, Z.; Tang, Z. An assessment of urban park access in Shanghai–Implications for the social equity in urban China. Landsc. Urban Plan. 2017, 157, 383–393. [Google Scholar]
  36. Bergs, R.; Budde, R. The potential of small-scale spatial data in regional science. Rev. Reg. Res. 2022, 42, 97–110. [Google Scholar]
  37. Dungan, J.L.; Perry, J.N.; Dale, M.R.T.; Legendre, P.; Citron-Pousty, S.; Fortin, M.J.; Jakomulska, A.; Miriti, M.; Rosenberg, M. A balanced view of scale in spatial statistical analysis. Ecography 2002, 25, 626–640. [Google Scholar]
  38. Oshan, T.M.; Wolf, L.J.; Sachdeva, M.; Bardin, S.; Fotheringham, A.S. A scoping review on the multiplicity of scale in spatial analysis. J. Geogr. Syst. 2022, 24, 293–324. [Google Scholar] [CrossRef]
  39. Zhang, J.; Tan, P.Y. Assessment of spatial equity of urban park distribution from the perspective of supply-demand interactions. Urban For. Urban Green. 2023, 80, 127827. [Google Scholar] [CrossRef]
  40. Hou, W.; Li, X. Assessing urban green infrastructure: A simple and practical measure of its spatial distribution equity and a comprehensive evaluation. Ecol. Indic. 2024, 158, 111408. [Google Scholar]
  41. Sari Aslam, N.; Ibrahim, M.R.; Cheng, T.; Chen, H.; Zhang, Y. ActivityNET: Neural networks to predict public transport trip purposes from individual smart card data and POIs. Geo-Spat. Inf. Sci. 2021, 24, 711–721. [Google Scholar] [CrossRef]
  42. Wang, Z.; Ito, K.; Biljecki, F. Assessing the equity and evolution of urban visual perceptual quality with time series street view imagery. Cities 2024, 145, 104704. [Google Scholar] [CrossRef]
  43. Weigand, M.; Wurm, M.; Dech, S.; Taubenböck, H. Remote sensing in environmental justice research—A review. ISPRS Int. J. Geo-Inf. 2019, 8, 20. [Google Scholar] [CrossRef]
  44. Yang, G.; Zhao, Y.; Xing, H.; Fu, Y.; Liu, G.; Kang, X.; Mai, X. Understanding the changes in spatial fairness of urban greenery using time-series remote sensing images: A case study of Guangdong-Hong Kong-Macao Greater Bay. Sci. Total Environ. 2020, 715, 136763. [Google Scholar] [CrossRef] [PubMed]
  45. Xu, C.; Chen, G.; Huang, Q.; Su, M.; Rong, Q.; Yue, W.; Haase, D. Can improving the spatial equity of urban green space mitigate the effect of urban heat islands? An empirical study. Sci. Total Environ. 2022, 841, 156687. [Google Scholar] [CrossRef] [PubMed]
  46. Okarma, K. Combined image similarity index. Opt. Rev. 2012, 19, 349–354. [Google Scholar] [CrossRef]
  47. Zhang, L.; Zhang, L.; Mou, X.; Zhang, D. FSIM: A feature similarity index for image quality assessment. IEEE Trans. Image Process. 2011, 20, 2378–2386. [Google Scholar]
  48. Mouter, N.; van Cranenburgh, S.; van Wee, B. An empirical assessment of Dutch citizens’ preferences for spatial equality in the context of a national transport investment plan. J. Transp. Geogr. 2017, 60, 217–230. [Google Scholar] [CrossRef]
  49. Rahman, M.; Neema, M.N. A GIS based integrated approach to measure the spatial equity of community facilities of Bangladesh. Aims Geosci. 2015, 1, 21–40. [Google Scholar] [CrossRef]
  50. Zhao, M.; Liu, S.; Qi, W. Spatial differentiation and influencing mechanism of medical care accessibility in Beijing: A migrant equality perspective. Chin. Geogr. Sci. 2018, 28, 353–362. [Google Scholar] [CrossRef]
  51. Angus, A.; Burgess, P.J.; Morris, J.; Lingard, J. Agriculture and land use: Demand for and supply of agricultural commodities, characteristics of the farming and food industries, and implications for land use in the UK. Land Use Policy 2009, 26, S230–S242. [Google Scholar] [CrossRef]
  52. Ding, M.; Song, Y.; Hu, Y. Supply–Demand Matching of Smart Parcel Lockers in a Residential Area: Insights from Tianjin. Buildings 2023, 13, 2088. [Google Scholar] [CrossRef]
  53. González-García, A.; Palomo, I.; González, J.A.; López, C.A.; Montes, C. Quantifying spatial supply-demand mismatches in ecosystem services provides insights for land-use planning. Land Use Policy 2020, 94, 104493. [Google Scholar] [CrossRef]
  54. Parzen, E. On estimation of a probability density function and mode. Ann. Math. Stat. 1962, 33, 1065–1076. [Google Scholar]
  55. Rosenblatt, M. Remarks on some nonparametric estimates of a density function. Ann. Math. Stat. 1956, 27, 832–837. [Google Scholar]
  56. Bailey, T.C.; Gatrell, A.C. Interactive Spatial Data Analysis; Longman Scientific: Harlow, UK, 1995. [Google Scholar]
  57. Schabenberger, O.; Gotway, C.A. Statistical Methods for Spatial Data Analysis; Chapman Hall/CRC: Boca Raton, FL, USA, 2005. [Google Scholar]
  58. Silverman, B.W. Density Estimation for Statistics and Data Analysis; Chapman Hall: London, UK, 1986. [Google Scholar]
  59. Deaton, A. The Analysis of Household Surveys: A Microeconometric Approach to Development Policy; World Bank Publications: Washington, DC, USA, 1997. [Google Scholar]
  60. Gisbert, F.J.G. Weighted samples, kernel density estimators and convergence. Empir. Econ. 2003, 28, 335–351. [Google Scholar] [CrossRef]
  61. Patil, G.P.; Rao, C.R.; Zelen, M.; Patil, G.P. Weighted Distributions. Center for Statistical Ecology and Environmental Statistics; Pennsylvania State University: University Park, PA, USA, 1987. [Google Scholar]
  62. Wang, Z.; Bovik, A.C. A universal image quality index. IEEE Signal Process. Lett. 2002, 9, 81–84. [Google Scholar] [CrossRef]
  63. Wang, Z.; Bovik, A.C.; Sheikh, H.R.; Simoncelli, E.P. Image quality assessment: From error visibility to structural similarity. IEEE Trans. Image Process. 2004, 13, 600–612. [Google Scholar]
  64. Sun, C.; Zheng, S.; Wang, R. Restricting driving for better traffic and clearer skies: Did it work in Beijing? Transp. Policy 2014, 32, 34–41. [Google Scholar]
  65. Zheng, Y.; Moody, J.; Wang, S.; Zhao, J. Measuring policy leakage of Beijing’s car ownership restriction. Transp. Res. Part A Policy Pract. 2021, 148, 223–236. [Google Scholar]
  66. Shi, J.; Wu, Z.; Jin, J. Reform Beijing to a public transit oriented city–from the view of transportation equity. J. Adv. Transp. 2011, 45, 96–106. [Google Scholar]
  67. Cuthill, N.; Cao, M.; Liu, Y.; Gao, X.; Zhang, Y. The association between urban public transport infrastructure and social equity and spatial accessibility within the urban environment: An investigation of Tramlink in London. Sustainability 2019, 11, 1229. [Google Scholar] [CrossRef]
  68. Wang, J.; Deng, Y.; Song, C.; Tian, D. Measuring time accessibility and its spatial characteristics in the urban areas of Beijing. J. Geogr. Sci. 2016, 26, 1754–1768. [Google Scholar]
  69. Zhang, C.; Xia, H.; Song, Y. Rail transportation lead urban form change: A case study of Beijing. Urban Rail Transit 2017, 3, 15–22. [Google Scholar] [CrossRef]
  70. Beijing Municipal Bureau of Statistics. Beijing Statistical Yearbook 2023; China Statistics Press: Beijing, China, 2023. [Google Scholar]
  71. Coskun, B.; Memon, N. Confusion/diffusion capabilities of some robust hash functions. In Proceedings of the 2006 40th Annual Conference on Information Sciences and Systems, Princeton, NJ, USA, 22–24 March 2006; pp. 1188–1193. [Google Scholar]
  72. Mudeng, V.; Kim, M.; Choe, S.W. Prospects of structural similarity index for medical image analysis. Appl. Sci. 2022, 12, 3754. [Google Scholar] [CrossRef]
  73. Rueangsuwan, N.; Jariyapongsgul, N.; Chen, C.C.; Lin, C.S.; Ruengittinun, S.; Chootong, C. Automatic Anomaly Mark Detection on Fabric Production Video by Artificial Intelligence Techniques. In Proceedings of the 2022 IEEE 5th International Conference on Knowledge Innovation and Invention (ICKII), Hualien, Taiwan, 22–24 July 2022; pp. 81–84. [Google Scholar]
  74. Wu, J.W.; Wu, C.C.; Cen, W.S.; Chao, S.A.; Weng, J.T. Integrated compressed sensing and YOLOv4 for application in image-storage and object-recognition of dashboard camera. In Proceedings of the 2021 Australian & New Zealand Control Conference (ANZCC), Gold Coast, Australia, 25–26 November 2021; pp. 7–11. [Google Scholar]
  75. Jin, H.; Jin, F.; Zhu, H. Measuring spatial mismatch between public transit services and regular riders: A case study of Beijing. ISPRS Int. J. Geo-Inf. 2019, 8, 186. [Google Scholar] [CrossRef]
  76. Sun, Z.; Zacharias, J. Transport equity as relative accessibility in a megacity: Beijing. Transp. Policy 2020, 92, 8–19. [Google Scholar] [CrossRef]
  77. Yang, X.; Niu, F.; Sun, D. Evaluation of urban spatial equality based on accessibility to economic activities: Beijing as a case study. Complexity 2020, 2020, 4560146. [Google Scholar]
  78. Ibraeva, A.; de Almeida Correia, G.H.; Silva, C.; Antunes, A.P. Transit-oriented development: A review of research achievements and challenges. Transp. Res. Part A Policy Pract. 2020, 132, 110–130. [Google Scholar] [CrossRef]
  79. Wang, F.; Zheng, Y.; Wu, W.; Wang, D. The travel, equity and wellbeing impacts of transit-oriented development in Global South. Transp. Res. Part D Transp. Environ. 2022, 113, 103512. [Google Scholar] [CrossRef]
  80. Wang, R.; Wu, W.; Yao, Y.; Tan, W. “Green transit-oriented development”: Exploring the association between TOD and visible green space provision using street view data. J. Environ. Manag. 2023, 344, 118093. [Google Scholar]
  81. Nie, Y.; Yang, W.; Chen, Z.; Lu, N.; Huang, L.; Huang, H. Public curb parking demand estimation with poi distribution. IEEE Trans. Intell. Transp. Syst. 2021, 23, 4614–4624. [Google Scholar]
  82. Zhu, B.; Hu, S.; Kaparias, I.; Zhou, W.; Ochieng, W.; Lee, D.H. Revealing the driving factors and mobility patterns of bike-sharing commuting demands for integrated public transport systems. Sustain. Cities Soc. 2024, 104, 105323. [Google Scholar] [CrossRef]
  83. Zhou, H.; He, S.; Cai, Y.; Wang, M.; Su, S. Social inequalities in neighborhood visual walkability: Using street view imagery and deep learning technologies to facilitate healthy city planning. Sustain. Cities Soc. 2019, 50, 101605. [Google Scholar] [CrossRef]
Figure 1. The consistency among the degrees of supply–demand matching, map similarity, and spatial equity.
Ijgi 14 00157 g001
Figure 2. Spatial equity assessment framework based on map similarity evaluation.
Ijgi 14 00157 g002
Figure 3. Map of the case study area.
Ijgi 14 00157 g003
Figure 4. Supply and demand maps of the case study area: (a) supply map, (b) demand map, and (c) case study area (inside the Sixth Ring Road of Beijing).
Ijgi 14 00157 g004
Figure 5. Similarity map evaluated by SSIM: (a) spatial scale: 1 km × 1 km, (b) spatial scale: 2 km × 2 km, and (c) spatial scale: 4 km × 4 km.
Ijgi 14 00157 g005
Figure 6. Significant areas with different similarity thresholds and the current supply–demand situations of these areas: (a,b) The threshold is set to 0.8 based on empirical evidences; (c,d) The threshold is set to 0.747, as the lower quartile based on specific needs.
Ijgi 14 00157 g006
Table 1. Descriptive statistics of the evaluated similarities.
Spatial ScaleItemsMeanStd.devMax.Min.L.Q.
1 km × 1 kmWhole study region0.8360.1171.0000.3690.747
Inside the Fourth Ring Road0.7290.0891.0000.4610.678
Outside the Fourth Ring Road0.8460.1141.0000.3690.759
2 km × 2 kmWhole study region0.8430.1021.0000.5540.761
Inside the Fourth Ring Road0.7170.0620.8890.5540.677
Outside the Fourth Ring Road0.8540.0971.0000.6220.777
4 km × 4 kmWhole study region0.8550.0921.0000.6440.784
Inside the Fourth Ring Road0.7380.0460.8150.6960.707
Outside the Fourth Ring Road0.8590.0911.0000.6440.788
Disclaimer/Publisher’s Note: The statements, opinions and data contained in all publications are solely those of the individual author(s) and contributor(s) and not of MDPI and/or the editor(s). MDPI and/or the editor(s) disclaim responsibility for any injury to people or property resulting from any ideas, methods, instructions or products referred to in the content.

