Abstract
An Earth system spatial grid (ESSG) is an extension of a discrete global grid system (DGGS) in the radial direction. It is an important tool for organizing, representing, simulating, analyzing, sharing, and visualizing spatial data. The existing ESSGs suffer from complex spatial relationships and significant geometric distortion. To mitigate these problems, a spherical geodesic degenerate octree grid (SGDOG) and its encoding and decoding schemes are proposed in this paper. The SGDOG extends the great circle arc QTM in the radial direction and adopts different levels of the great circle arc QTM at different radial depths. The subdivision of SGDOG is simple and clear, and has multi-level characteristics. The experimental results demonstrate that the SGDOG has advantages of simple spatial relationships, convergent volume distortion, and real-time encoding and decoding. The SGDOG has the potential to organize and manage global spatial data and perform large-scale visual analysis of the Earth system.
1. Introduction
Scientific and technological advances in recent years have enabled Earth research to extend from surface studies to interior and exterior exploration. Various types of sensors, such as satellite-based remote sensors, atmospheric monitoring sensors, geodetic sensors, and underground detection devices, collect data from high altitudes and underground environments [1,2]. The acquired data are utilized for applications such as satellite trajectory tracking [3], atmospheric circulation analysis [4], crustal movement monitoring [5], and large-scale urban modeling [6]. The traditional method of processing these data is to project the Earth’s surface onto a plane. The geometric distortion and map edges will affect the accuracy of certain analyses [7]. The increasing amount of spatial data poses challenges to traditional geographic information technology and tools for organizing and processing data [8,9,10,11]. A data model suitable for organizing and processing the large amount of spatial data in the global scale is needed.
The discrete global grid system (DGGS) framework is a spherical surface grid theory and an innovative type of geographic information system (GIS) and method of spatial data processing [12,13]. DGGSs employ a discrete and hierarchical structure by dividing the Earth’s surface into regular and non-overlapping cells with unique identifiers [14] to establish an organized and efficient spatial data structure.
An Earth system spatial grid (ESSG) [15], also called a 3D-DGGS by some scholars [16,17], extends a DGGS in the radial direction. ESSGs are important tools for organizing, representing, simulating, analyzing, sharing, and visualizing spatial data in 3D GIS, and can support the integration of multi-source spatial data [18]. The ESSG framework has been applied to match crustal data to establish crustal models [16,19], represent Earth’s structure to calculate mantle P-wave velocity [20,21], estimate feature volumes in urban planning and management [7], discretely carry meteorological data for the differential operation of atmospheric dynamics equations and temperature field modeling [19], and for many other purposes. The research on ESSGs mainly focuses on 3D spherical latitude–longitude grids and 3D spherical regular polyhedron grids.
A 3D spherical latitude–longitude grid divides the sphere using latitude and longitude lines and spherical surfaces at specific intervals, offering the advantage of orthogonal grid boundaries that coincide with the latitude and longitude lines. Its disadvantages are as follows: (1) it is difficult to extend to an ellipsoid since the normals of points on the ellipsoid, except for the poles and the points on equator, do not pass through the center of the ellipsoid [22]; and (2) the shapes and sizes of cells vary significantly when the latitude–longitude grid is extended in the radial direction, such as GeoSOT-3D [23]. A Yin–Yang grid [24] has been proposed to avoid the convergence of the latitude–longitude grid. However, the boundaries of the Yin and Yang regions overlap, leading to a non-unique mapping between physical space and grid space. The ambiguous expression of spatial and attribute information in the Yin–Yang boundary region contradicts the unified expression, modeling, and analysis of the sphere. To address the issue of the cell sizes decreasing toward the poles and the center of the sphere, the spherical degenerated octree grid (SDOG) [25] has been proposed, along with a corresponding multi-level degenerated Z-curve filling coding (MDZ coding). The SDOG extends the degenerated quadtree grid (DQG) [26,27] in the radial direction and is applied to the stereoscopic modeling of large-scale spatial objects [28]. Although the SDOG maintains approximate cell volumes, it features complex cell shapes and spatial relationships.
A 3D spherical regular polyhedron grid extends the spherical surface regular polyhedron grid in the radial direction. The spherical surface regular polyhedron grid is generally divided based on five regular polyhedra: the regular tetrahedron, regular hexahedron, regular octahedron, regular dodecahedron, and regular icosahedron [29]. Their cell shapes are primarily triangles [30], quadrilaterals [31], and hexagons [32,33]. The hexagonal hierarchical geospatial indexing system (H3) is a hexagonal grid system with a seven-aperture hierarchical subdivision, based on a regular icosahedron [33]. Compared with quadrilateral and triangular grids, hexagonal grids resemble circles more closely in shape, offering uniform distances between adjacent cells and achieving the optimal perimeter-to-area ratio. However, the hierarchical subdivision strategy for hexagonal grids is more complex than that for quadrangular and triangular grids. The quaternary triangular mesh (QTM) based on the triangular subdivision in a regular octahedron, has advantages of well-defined vertex positioning, simple structure, moderate geometric distortion, and extendibility to ellipsoid form [34]. Thus, it has been widely applied in global spatial data extraction and multi-resolution management [35], spatial hierarchical indexing [36], global navigation [37], global DEM generation [38], and remote sensing data organization [39]. However, compared to grid systems based on icosahedra, the geometric distortion of QTM is larger [34]. There are two methods to determine the midpoints of the spherical triangle edges in the QTM: (1) taking the mid-value of the longitude and latitude [40,41], and (2) taking the midpoint of the great circle arc [42]. Except for midpoints on longitude lines or the equator, the midpoints generated by taking the mid-values of the longitude and latitude are not on the great circle of the original spherical triangle. As a result, the edges of the four child spherical triangles and the parent spherical triangle do not coincide exactly. Thus, many researchers have chosen to take the midpoint of the great circle arc, which is the intersection point between the angle bisector of the two vertices of the great circle arc and the spherical surface. The spherical geodesic octree grid (SGOG) [42,43] performs a spherical surface subdivision of the great circle arc QTM and adopts an encoding structure consisting of “layer ID (hexadecimal) + octant ID (octal) + spherical position code (quaternary) + radial depth code (binary)”. The spherical position code adopts a fixed-direction code named the Goodchild code [44]. To avoid the conical surface generated by the latitude and radial lines and to make the cell shapes approximately consistent, the bottom edges of SGOG cells are designed as great circle arcs. However, the SGOG does not fully account for the geometric distortion such as area and volume distortion. The SGOG divides the radius equally in the radial subdivision without adjusting the spherical surface subdivision for each layer, resulting in significant geometric distortion of cells. The variable-length octree generates cells with approximate volumes by assigning different radial intervals to cells from the center to the spherical surface, resulting in significant distortions in cell shapes. The parallel method QTM [45] changes the bottom of each spherical triangle from a great circle arc into a latitude line and keeps the waists of the spherical triangles as great circle arcs. This change makes the area of the middle triangle more similar to that of the other three triangles, resulting in smaller grid distortion and higher data conversion efficiency. However, this change also leads to complex spatial relationships of cells, which generally exist in 3D spherical latitude–longitude grids, when the parallel method QTM is extended in the radial direction to divide the 3D sphere.
The existing ESSGs have the following limitations: (1) complex spatial relationships [25], (2) a large variety of cell shapes and sizes [24,46], and, in some cases, (3) designs that are specific to a certain field and difficult to apply in others [21,47]. Therefore, an ESSG suitable for comprehensively and systematically modeling, expressing, and analyzing the interior, surface, and exterior of the Earth is needed.
To reduce the geometric distortion and simplify the complex spatial relationships of cells in the existing ESSGs, a spherical geodesic degenerate octree grid (SGDOG) is proposed in this paper. This SGDOG extends the great circle arc QTM in the radial direction and adopts different levels of the great circle arc QTM at different radial depths. It adopts an encoding structure of “octant ID + radial depth code + spherical position codes”, along with dedicated encoding and decoding schemes. The experimental results show that the SGDOG has advantages of simple spatial relationships, convergent volume distortion, and real-time encoding and decoding.
2. Subdivision Method
2.1. Spherical Surface Subdivision
The SGDOG, as an extension of the great circle arc QTM in the radial direction, subdivides the spherical surface as follows:
- 1
- Divide the sphere into eight octants using the longitude planes and the equatorial plane. Divide the southern hemisphere into octants 0 to 3 from longitude −180° to 180° with an interval of 90°, and the northern hemisphere into octants 4 to 7 in the same way, as shown in Figure 1. Each octant has a spherical triangular surface of equal area on the spherical surface, as shown in Figure 1.
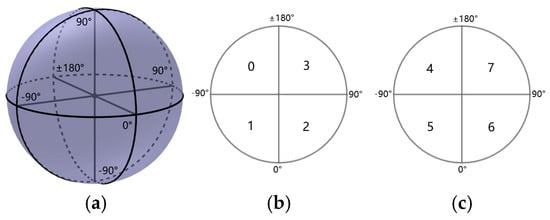 Figure 1. Octant schematic diagram. (a) Global schematic diagram. (b) Top view of Southern Hemisphere. (c) Top view of Northern Hemisphere.
 - 2
- Take the midpoints of the great circle arcs as midpoints and connect them with the original vertices using the great circle arcs to divide the parent spherical triangle into four child spherical triangles. To distinguish from the parallel method QTM, this method is called the great circle arc QTM. The edges of child spherical triangles are still on the edges of the parent triangle, as shown in Figure 2.
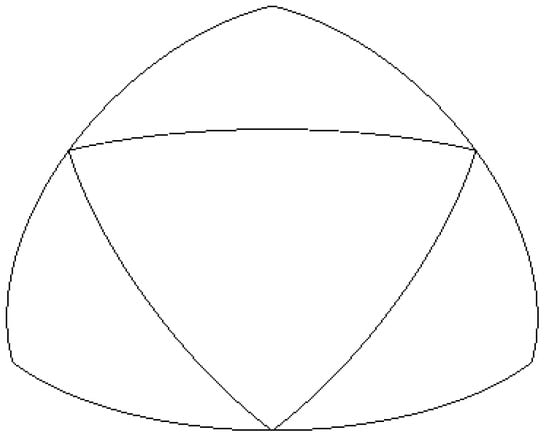 Figure 2. Schematic diagram of the great circle arc QTM.
 - 3
- Repeat step 2 to generate the hierarchical levels of the great circle arc QTM.
2.2. 3D Spherical Subdivision
The SGDOG can be formed by combining different levels of the great circle arc QTM with radial subdivision as follows:
- 1
- First-level subdivision. Bisect the radius lines and cut the octants with a spherical surface at half the original radius. The outer layers are quasi-triangular prisms, as shown in the red part of Figure 3a. The inner layers are quasi-triangular pyramids, that is, octants with half the radius of the original octants.
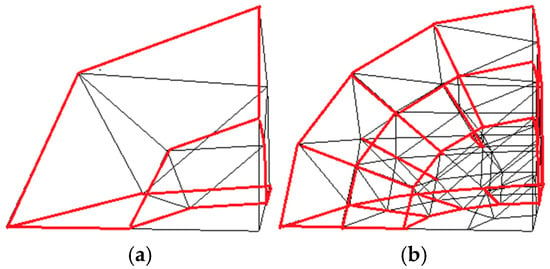 Figure 3. Subdivision diagram. (a) nlevel = 1. (b) nlevel = 2.
 - 2
- Second-level subdivision. Subdivide each outer quasi-triangular prism into 4 × 2 child quasi-triangular prisms where the great circle arc QTM partitions and radii bisect, as shown in the red part of Figure 3b. Subdivide each inner octant into an inner octant and a quasi-triangular prism following the method described in step 1.
- 3
- Repeat step 2 until the SGDOG cell sizes meet the specified requirements.
The QTM is a quadtree, and the radial partitioning is a binary tree. If the whole spherical surface adopts the same level of QTM at a SGDOG subdivision level, the entire sphere will be an octree. However, different levels of QTM are adopted at different points on the radius, resulting in the grid at the center of the Earth having only five child grids (four quasi-triangular prisms and one quasi-triangular pyramid). Thus, the entire sphere is a degenerate octree.
3. Encoding and Decoding Schemes
Since the SGDOG bisects the radius during subdivision and its spherical layer can be calculated from the radial depth, it removes the layer ID from the SGOG encoding structure and adopts an encoding structure of “octant ID I + radial depth code J + spherical position code K” to reduce redundant codes.
The SGDOG employs Goodchild encoding for spherical position encoding, as shown in Figure 4, where 0, 1, 2, and 3 represent the child triangles at the center, top/bottom, left, and right, respectively.
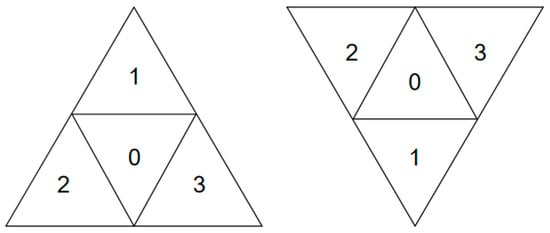
Figure 4.
Goodchild encoding.
The SGDOG employs the ETP conversion method and the distance comparison method to convert latitude–longitude coordinates into address codes. The principle involves comparing the distances between the point P(x, y) and the center points of four triangles and recording the address code of the triangle with the smallest distance until the distance is less than a specified threshold. For example, the first-level address code of point P is 3, as shown in Figure 5. The conversion from address code to latitude–longitude coordinates is the inverse process.
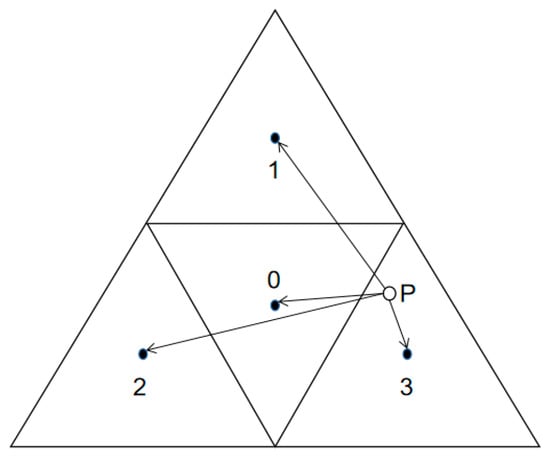
Figure 5.
ETP projection combined with Goodchild encoding. P is the desired point, and the solid circles are the centers of the equilateral triangles.
The variables in this section are defined as follows:
- Define the sphere radius as R.
- Define the level of SGDOG as nlevel.
- Define the level of the great circle arc QTM as n.
- Define the ETP projection coordinates as (x0, y0).
- Define the Cartesian coordinates of a point as .
- Define the latitude–longitude coordinates of a point as where is the longitude, is the latitude, and is the radial distance.
- Define the layer from the center to the spherical surface as radial depth J. For the innermost layer, n = 0 and J = 0.
3.1. Encoding Schemes
Given the sphere radius R and a point P the steps to calculate the address code of P at nlevel are as follows:
- 1
- Calculate the octant ID I from using equationwhere .
- 2
- Calculate the radial interval of the cell using equation
- 3
- Calculate the radial depth code J of P using equationwhere floor represents rounding down, as it does below.
- 4
- Calculate the QTM level n of P using equationswhere ceil represents rounding up.
- 5
- Convert the longitude and latitude to ETP projection coordinates using Equation (6) [36], and obtain the spherical position code K (quaternary) by applying the distance comparison method.
- 6
 Table 1. The structure of SGDOG address code.
For example, given R = 6,371,000 m, nlevel = 10, and P (25.124°, 38.592°, 3,652,000 m), then I = 6 (decimal), J = 586 (decimal), and K = 0200010230 (quaternary). Convert I, J, and K to binary, resulting in I = 110, J = 1001001010, and K = 00100000000100101100. The SGDOG code for the grid containing P is 110100100101000100000000100101100.
3.2. Decoding Schemes
Decoding is the inverse process of encoding. Given R, nlevel, and the SGDOG address code of a grid, the steps to calculate the coordinates of the grid vertices are as follows:
- 1
- Separate the octant ID I, radial depth code J, and spherical position code K from the 3 + nlevel + 2n bits address code. Convert I and J to decimal and K to quaternary.
- 2
- Obtain the latitude and longitude ranges of octant I.
- 3
- Calculate using Equation (2) and then calculate the radii R1 and R2 of the inner and outer spherical surfaces of the cell using equation
- 4
- Sequentially read each digit of the spherical position code K in quaternary. Determine the position of the child triangle within the parent triangle and calculate the Cartesian coordinates of its three vertices at each level. The Cartesian coordinates of the three vertices on the inner spherical surface of the cell are obtained after reading the last digit. Convert the Cartesian coordinates into latitude–longitude coordinates using equation
- 5
- Each vertex on the outer spherical surface has the same latitude and longitude as its corresponding vertex on the inner spherical surface within a grid. If V1 is a vertex on the inner spherical surface, V2 is its corresponding vertex on the outer spherical surface. Convert into Cartesian coordinates using Equation (9). The Cartesian coordinates and latitude–longitude coordinates of the three vertices on the outer spherical surface can be obtained. Note that a cell is the innermost cell and has only one vertex (0, 0, 0) on the inner spherical surface when J = 0. The vertices on the outer spherical surface of the innermost cell correspond to the three vertices on the inner spherical surface of the innermost quasi-triangular pyramid in the SGDOG.
For example, assume nlevel = 8 and the grid address code is 110/10100011/0111101101000010 in binary. According to step 1 and Table 1, separate I (bits 0th to 2th), J (bits 3th to 10th), and K (bits after 11th) from the address code, then I = 6 in decimal (110 in binary), J = 163 in decimal (10100011 in binary), and K = 13,231,002 in quaternary (0111101101000010 in binary). According to step 2, the latitude and longitude ranges are both 0° to 90° since I = 6. According to step 3, R1 = 4,056,535.15625 m and R2 = 4,081,421.875 m. According to step 4, the Cartesian coordinates of the three vertices on the inner spherical surface are (935,008 m, 2,049,860 m, 3,373,320 m), (960,902 m, 2,051,140 m, 3,365,260 m), and (935,221 m, 2,071,550 m, 3,359,990 m). According to step 5, the latitude–longitude coordinates of the three vertices on the inner spherical surface are and ; the Cartesian coordinates of the three vertices on the outer spherical surface are (940,745 m, 2,062,440 m, 3,394,020 m), (966,797 m, 2,063,730 m, 3,385,900 m), and (940,959 m, 2,084,260 m, 3,380,600 m); and the latitude–longitude coordinates of the three vertices on the outer spherical surface are and .
4. Experiment
The experiment was conducted in the Visual Studio 2022 environment using the C++ programming language on a computer equipped with a 13th Gen Intel® CoreTM i7-13700F 2.10 GHz processor, 16 GB of RAM, and an NVIDIA GeForce RTX 4060 graphics card.
4.1. Visualization
The SGDOG was visualized using Direct3D and C++ programming to clearly illustrate the partitioning method in the radial direction. Figure 6 retains only the bottom surface of the octant and shows that the radial depth J gradually increases from the inner layer to the outer layer. The vertical lines are the straight radial lines, and the horizontal lines are the curved great circle arcs. The partitioning structure of the bottom surface is a degenerate quadtree, where the grid at J = 0 has only three child grids. Figure 7 shows the 3D visualization of the entire sphere when nlevel = 1, 2, and 3. The innermost cells adjacent to the sphere center are quasi-triangular pyramids with spherical bottom surfaces. Other cells are quasi-triangular prisms with spherical inner and outer surfaces and three planar sides composed of great circle arcs and radial lines.

Figure 6.
Bottom surface of the octant. (a) nlevel = 1. (b) nlevel = 2. (c) nlevel = 3.
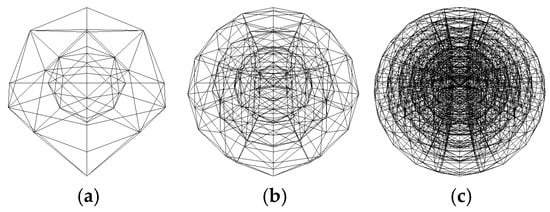
Figure 7.
The entire sphere of the SGDOG. (a) nlevel = 1. (b) nlevel = 2. (c) nlevel = 3.
4.2. Volume Distortion
The QTM cells are spherical triangles. The area of a spherical triangle ABC can be calculated using equation
where R is the radius of the spherical surface containing the spherical triangle, and is each interior angle of the spherical triangle.
Since each interior angle of the spherical triangle is a dihedral angle formed by the intersection of the planes in which the two great circle arcs lie, it can be calculated using equation
where . are vectors of points A, B, and C, respectively.
Since the SGDOG extends the great circle arc QTM in the radial direction, the volumes of SGDOG cells can be calculated using equation
where R1 and R2 are the radii of the inner and outer spherical surfaces of the cell, respectively, and R2 > R1.
The volume distortion of four ESSGs was compared: SGDOG, SDOG, H3-3D, GeoSOT-3D.
Given R = 6,371,000 m, the maximum volume Vmax, minimum volume Vmin, and the ratio Vmax/Vmin of the SGDOG, SDOG [25], H3-3D, and GeoSOT-3D [23] for levels 1 to 15 were calculated using Equation (12). H3-3D is generated by extending the H3 [33] in the radial direction using the same method as the SGDOG. As shown in Table 2 and Figure 8, the Vmax/Vmin of the SGDOG increases slowly as the level increases and converges to 8.43, which is smaller than the convergence value 8.89 of the SDOG, while the Vmax/Vmin of H3-3D and GeoSOT-3D increases rapidly and diverges as the level increases.

Table 2.
Volume distortion.
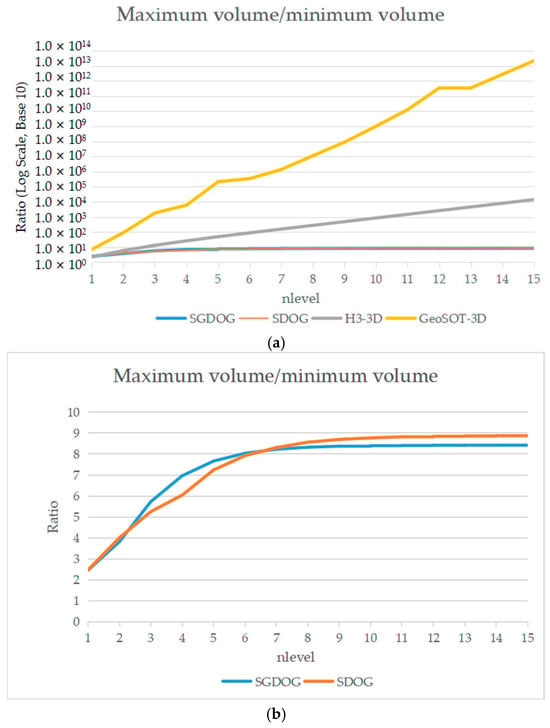
Figure 8.
Comparison of volume distortion. (a) Volume distortion of the SGDOG, SDOG, H3-3D and GeoSOT-3D. (b) Volume distortion of the SGDOG and SDOG.
4.3. Encoding and Decoding Efficiency
The encoding and decoding efficiency is defined as the number of encoding and decoding times per second. Table 3 presents the encoding and decoding efficiency for levels 1 to 15 of the SGDOG, tested with one million random latitude–longitude coordinates and one million random SGDOG address codes. The experimental results demonstrate that the encoding and decoding schemes can achieve real-time processing for spatial queries and data retrieval. The encoding and decoding efficiency decreases as the level increases, since the number of bits in address codes grows with the level. Encoding is less efficient than decoding since the ETP conversion method used in encoding requires determining the direction and involves calculations with irrational numbers and exponents.

Table 3.
Encoding and decoding efficiency of SGDOG.
5. Discussion
The SGDOG is compared with the SDOG, GeoSOT-3D, and H3-3D in terms of ESSG types, recursive subdivision methods, encoding schemes, and volume distortion, as shown in the Table 4.

Table 4.
Comparison of Four ESSGs.
5.1. Types of ESSG
The SGDOG and H3-3D are 3D spherical regular polyhedral grids, while the SDOG and GeoSOT-3D are 3D spherical latitude–longitude grids.
5.2. Recursive Subdivision Methods
Both the SGDOG and SDOG adopt a degenerate octree structure, while H3-3D adopts a degenerate fourteen-tree structure, and GeoSOT-3D adopts a complete octree structure.
5.3. Encoding Methods
The SGDOG adopts a hierarchical encoding scheme consisting of ”octant ID + radial depth code + and spherical position code”, while the SDOG and GeoSOT-3D adopt Z-curve encoding. H3-3D was designed by us for comparison by extending the H3 in the radial direction using the same method as the SGDOG. Thus, H3-3D does not have a corresponding encoding method. Since the encoding and decoding processes for I and J are inverse to each other, the encoding and decoding efficiency for I, J should be roughly the same. However, the experimental results show significant differences, with encoding efficiency consistently lower than decoding efficiency. This gap tends to widen as the level increases. It can be inferred that the primary reason for this efficiency discrepancy lies in the conversion process between the spherical position code K and the spatial coordinates. The encoding of K adopts the ETP conversion method, while the decoding process recursively identifies the midpoint of the great circle arc in the corresponding direction based on the Goodchild encoding. Although the ETP method is not the most efficient for calculating the QTM address code, it produces the most accurate results [48]. Since this paper prioritizes accuracy, the ETP method was adopted.
5.4. Cell Shapes
The SGDOG has two types of cell shapes: quasi-triangular pyramids next to the sphere center, and quasi-triangular prisms elsewhere. Both the SDOG and GeoSOT-3D have three types of cell shapes: quasi-triangular pyramids next to the sphere center, quasi-triangular prisms next to the poles in the outer layers, and quasi-quadrangular prisms elsewhere. H3-3D has four types of cell shapes: quasi-hexagonal pyramids and quasi-pentagonal pyramids next to the sphere center, and quasi-hexagonal prisms and quasi-pentagonal prisms elsewhere. Therefore, the SGDOG has the fewest types of cell shapes among these four ESSGs.
5.5. Volume Distortion
The Vmax/Vmin of the SGDOG increases slowly as the level increases and converges to 8.43, which is smaller than the convergence value 8.89 of the SDOG, while the Vmax/Vmin of H3-3D and GeoSOT-3D increases rapidly and diverges as the level increases. The SGDOG, SDOG, and H3-3D adopt different levels of spherical surface subdivision at different radius, while GeoSOT-3D adopts the same level of spherical surface subdivision for all the spherical surface. Thus, the Vmax/Vmin of GeoSOT increases most rapidly as the level increases. Although the maximum-to-minimum area ratio of H3 converges [33], when the radial differences of all grids are consistent, its seven-aperture characteristic causes the outer surface area of the grid at radial depth to be approximately 7 times that of the inner surface area of the grid at . The spherical surface subdivision levels are the same from to , and the outer surface area of grids at is about 4 times that of grids at , while the outer surface area of grids at is about times that of grids at . Consequently, the outer surface area of the innermost grid at J = 0 is approximately times that of the outermost grid at . The higher the level, the faster the volume of the innermost grid increases, resulting in Vmax/Vmin divergence in H3-3D as the level increases. The SGDOG is based on the QTM, while the SDOG is based on the latitude–longitude spherical surface subdivision. The QTM has smaller area distortion than the latitude–longitude spherical surface subdivision. The smaller area distortion results in a corresponding smaller volume distortion. Therefore, the SGDOG has a smaller convergence value compared to the SDOG.
6. Conclusions and Future Work
To reduce geometric distortion and simplify the complex spatial relationships of cells in existing ESSGs, the SGDOG based on the great circle arc QTM is proposed and corresponding encoding and decoding schemes are designed in this paper. The SGDOG offers the following advantages:
- 1
- Simple spatial relationships of cells. The spherical surface is subdivided by great circles, ensuring no curved surfaces are generated in the 3D subdivision. The SGDOG has only two types of cells shapes: quasi-triangular pyramids and quasi-triangular prisms. The relationships between cells and spatial rectangular coordinates are straightforward.
- 2
- Explicit encoding structure. The SGDOG adopts an encoding structure of “octant ID + radial depth code + spherical position code”, enabling real-time conversion between latitude–longitude coordinates and cell address codes.
- 3
- Convergent volume distortion. The volume distortion converges to 8.43, smaller than the convergence value 8.89 of the SDOG, and better than the divergent volume distortion of H3-3D and GeoSOT-3D.
Since the properties of spherical great circles and ellipsoid geodesics are similar, we suspect that the SGDOG can be applied to an ellipsoid. Further research is required to justify this conjecture and make necessary changes to the method. This paper primarily focuses on the conversion accuracy between the address code and the spatial coordinates, while the encoding and decoding efficiency can be improved in the future work. Moreover, we will utilize the SGDOG for spatial entity modeling, such as aircraft trajectory simulations and urban building modeling, which will facilitate the statistical analysis of spatial geometric properties.
Author Contributions
Conceptualization, Yilin Ren and Mengyun Zhou; methodology, Yilin Ren; software, Yilin Ren; validation, Yilin Ren; formal analysis, Yilin Ren; investigation, Yilin Ren and Aijun Zhong; resources, Mengyun Zhou; data curation, Yilin Ren; writing—original draft preparation, Yilin Ren; writing—review & editing, Mengyun Zhou; visualization, Yilin Ren; supervision, Mengyun Zhou; project administration, Mengyun Zhou; funding acquisition, Mengyun Zhou. All authors have read and agreed to the published version of the manuscript.
Funding
This research was funded by the National Natural Science Foundation of China, grant number 42101439; and the Open Research Project of The Hubei Key Laboratory of Intelligent Geo-Information Processing, grant number KLIGIP-2022-B09.
Data Availability Statement
No new data were created or analyzed in this study. Data sharing is not applicable to this article.
Acknowledgments
We would like to thank all editors and reviewers.
Conflicts of Interest
The authors declare no conflicts of interest.
References
- Kurt, G.K.; Yanikomeroglu, H. Communication, computing, caching, and sensing for next-generation aerial delivery networks: Using a high-altitude platform station as an enabling technology. IEEE Veh. Technol. Mag. 2021, 16, 108–117. [Google Scholar]
- Zhao, D.; Zhou, Z.; Wang, S.; Liu, B.; Gaaloul, W.J.P.; Computing, U. Reinforcement learning–enabled efficient data gathering in underground wireless sensor networks. Pers. Ubiquitous Comput. 2023, 27, 581–598. [Google Scholar] [CrossRef]
- Lagona, E.; Hilton, S.; Afful, A.; Gardi, A.; Sabatini, R. Autonomous trajectory optimisation for intelligent satellite systems and space traffic management. Acta Astronaut. 2022, 194, 185–201. [Google Scholar]
- Voigt, A.; Albern, N.; Ceppi, P.; Grise, K.; Li, Y.; Medeiros, B. Clouds, radiation, and atmospheric circulation in the present-day climate and under climate change. Wiley Interdiscip. Rev. Clim. Change 2021, 12, e694. [Google Scholar]
- Kowalczyk, K.; Pajak, K.; Wieczorek, B.; Naumowicz, B. An analysis of vertical crustal movements along the European coast from satellite altimetry, tide gauge, GNSS and radar interferometry. Remote. Sens. 2021, 13, 2173. [Google Scholar]
- Batty, M.; Milton, R. A new framework for very large-scale urban modelling. Urban Stud. 2021, 58, 3071–3094. [Google Scholar]
- Ulmer, B.; Hall, J.; Samavati, F. General method for extending discrete global grid systems to three dimensions. ISPRS Int. J. Geo-Inf. 2020, 9, 233. [Google Scholar] [CrossRef]
- Ziegler, P.; Chasins, S.E. A need-finding study with users of geospatial data. In Proceedings of the 2023 CHI Conference on Human Factors in Computing Systems, Hamburg, Germany, 23–28 April 2023; pp. 1–16. [Google Scholar]
- Wu, J.; Gan, W.; Chao, H.-C.; Yu, P.S. Geospatial big data: Survey and challenges. IEEE J. Sel. Top. Appl. Earth Obs. Remote. Sens. 2024, 17, 17007–17020. [Google Scholar]
- Ulmer, B.; Samavati, F. Toward volume preserving spheroid degenerated-octree grid. GeoInformatica 2020, 24, 505–529. [Google Scholar]
- Wang, Y.; Liu, Z.; Liao, H.; Li, C. Improving the performance of GIS polygon overlay computation with MapReduce for spatial big data processing. Clust. Comput. 2015, 18, 507–516. [Google Scholar]
- Li, M.; Stefanakis, E. Geospatial operations of discrete global grid systems—A comparison with traditional GIS. J. Geovis. Spat. Anal. 2020, 4, 26. [Google Scholar] [CrossRef]
- Hojati, M.; Robertson, C.; Roberts, S.; Chaudhuri, C. GIScience research challenges for realizing discrete global grid systems as a Digital Earth. Big Earth Data 2022, 6, 358–379. [Google Scholar] [CrossRef]
- Kmoch, A.; Vasilyev, I.; Virro, H.; Uuemaa, E. Area and shape distortions in open-source discrete global grid systems. Big Earth Data 2022, 6, 256–275. [Google Scholar] [CrossRef]
- Yu, J.Q.; Wu, L.X.; Jia, Y.J. ESSG-based global spatial reference frame for datasets interrelation. ISPRS Int. Arch. Photogramm. Remote Sens. Spat. Inf. Sci. 2013, 40, 57–62. [Google Scholar] [CrossRef]
- Bassin, C. The current limits of resolution for surface wave tomography in North America. Eos Trans. AGU 2000, 81, F897. [Google Scholar]
- Yoo, J.S.; Min, K.J.; Ahn, J.W. Concept and framework of 3D geo-spatial grid system. In Proceedings of the Web and Wireless Geographical Information Systems: 17th International Symposium, W2GIS 2019, Kyoto, Japan, 16–17 May 2019; Proceedings 17, 2019. pp. 136–149. [Google Scholar]
- SUN, Q.; WEN, B.; CHEN, X. Research on consistency processing of multi-source geospatial data. Acta Geod. Cartogr. Sinica 2022, 51, 1561. [Google Scholar]
- Zhou, J.; Ding, J.; Ben, J.; Chen, Y.; Liang, Q. Multi-mode 3D extension methods for equal-area discrete global grid systems for geospatial data representation. Acta Geod. Cartogr. Sinica 2024, 53, 173. [Google Scholar]
- Zhao, D.; Interiors, P. Global tomographic images of mantle plumes and subducting slabs: Insight into deep Earth dynamics. Phys. Earth Planet. Inter. 2004, 146, 3–34. [Google Scholar] [CrossRef]
- Baumgardner, J.R. Three-dimensional treatment of convective flow in the Earth’s mantle. J. Stat. Phys. 1985, 39, 501–511. [Google Scholar] [CrossRef]
- Wang, J.; Zheng, Y.; Li, Y.; Lu, F.; Liu, J. Building the Platform of Digital Earth with Sphere Split Bricks. Acta Geod. Cartogr. Sinica 2015, 44, 694. [Google Scholar]
- Hu, X.; Cheng, C. The three-dimensional data organization method based on GeoSOT-3D. In Proceedings of the 2014 22nd International Conference on Geoinformatics, Taiwan, China, 25–27 June 2014; pp. 1–4. [Google Scholar]
- Ohno, N.; Kageyama, A. Visualization of spherical data by Yin–Yang grid. Comput. Phys. Commun. 2009, 180, 1534–1538. [Google Scholar]
- Yu, J.-Q.; Wu, L.-X. Spatial subdivision and coding of a global three-dimensional grid: Spheoid degenerated-octree grid. In Proceedings of the 2009 IEEE International Geoscience and Remote Sensing Symposium, Cape Town, South Africa, 12–17 July 2009; pp. II-361–II-364. [Google Scholar]
- Sun, W.; Cui, M.; Zhao, X.; Gao, Y. A global discrete grid modeling method based on the spherical degenerate quadtree. In Proceedings of the 2008 International Workshop on Education Technology and Training & 2008 International Workshop on Geoscience and Remote Sensing, Shanghai, China, 21–22 December 2008; pp. 308–311. [Google Scholar]
- Cui, M.J.; Zhao, X.S.; Science, G.-I. Tessellation and distortion analysis based on spherical DQG. Geogr. Geo-Inf. Sci. 2007, 23, 23–25. [Google Scholar]
- Yu, J.; Wu, L.; Li, Z.; Li, X. An SDOG-based intrinsic method for three-dimensional modelling of large-scale spatial objects. Ann. GIS 2012, 18, 267–278. [Google Scholar] [CrossRef]
- Wang, Z.; Zhao, X.; Sun, W.; Luo, F.; Li, Y.; Duan, Y. Correlation analysis and reconstruction of the geometric evaluation indicator system of the discrete global grid. ISPRS Int. J. Geo-Inf. 2021, 10, 115. [Google Scholar] [CrossRef]
- Dutton, G. Part 4: Mathematical, algorithmic and data structure issues: Geodesic modelling of planetary relief. Cartogr. Int. J. Geogr. Inf. Geovis. 1984, 21, 188–207. [Google Scholar]
- Luo, F.; Gao, S.; Wang, X.; Chen, A.; Wang, Z.; Li, Y. Construction of quality evaluation indicator system for diamond discrete global grid systems. Int. J. Digit. Earth 2023, 16, 3637–3660. [Google Scholar]
- Zhao, L.; Li, G.; Yao, X.; Ma, Y.; Cao, Q. An optimized hexagonal quadtree encoding and operation scheme for icosahedral hexagonal discrete global grid systems. Int. J. Digit. Earth 2022, 15, 975–1000. [Google Scholar]
- Brodsky, I. H3: Uber’s Hexagonal Hierarchical Spatial Index. Uber Engineering Blog. 2019. Available online: https://www.uber.com/en-JP/blog/h3/ (accessed on 10 March 2025).
- Bai, J.; Sun, W.; Zhao, X. Character analysis and hierarchical partition of WGS-84 ellipsoidal facet based on QTM. Acta Geod Cartogr. Sin. 2011, 40, 243–248. [Google Scholar]
- Gyorgy, F. Rendering and managing spherical data with sphere quadtrees. In Proceedings of the First IEEE Conference on Visualization: Visualization90, San Francisco, CA, USA, 23–26 October 1990; pp. 176–186. [Google Scholar]
- Gooodchild, M.F.; Shiren, Y. A Hierarchical Spatial Data structure for global geographic information systems. Graph. Mod. Image Process 1992, 54, 31–44. [Google Scholar]
- Lee, M.; Samet, H. Navigating through triangle meshes implemented as linear quadtrees. ACM Trans. Graph. 2000, 19, 79–121. [Google Scholar]
- Zhao, X.; Bai, J.; Chen, J.; Li, Z. A seamless visualizaton model of the global terrain based on the qtm. In Proceedings of the International Conference on Artificial Reality and Telexistence, Hangzhou, China, 29 November–1 December 2006; pp. 1136–1145. [Google Scholar]
- Lv, Z.; Wu, J.; Zhang, S.; Zhao, H. Research on representing remote sensing images based on QTM. In Proceedings of the Sixth International Symposium on Digital Earth: Data Processing and Applications, Beijing, China, 9–12 September 2009; pp. 63–71. [Google Scholar]
- Dutton, G.J.C.; Science, G.I. Scale, sinuosity, and point selection in digital line generalization. Cartogr. Geogr. Inf. Sci. 1999, 26, 33–54. [Google Scholar]
- Zhao, X.; Sun, W.; Chen, J. Distortion distribution and convergent analysis of the global discrete grid based on QTM. J. China Univ. Min. Technol. Chin. Ed. 2005, 34, 438. [Google Scholar]
- Wang, J.; Lu, F.; Guo, T.; Chen, J. Global 3D\| Grids Based on Great Circle Arc QTM Sphere Octree and Unequal Octree. Geomat. Inf. Sci. Wuhan Univ. 2013, 38, 344–348. [Google Scholar]
- Wang, J.; Shi, Y.; Qin, Z.; Chen, Y.; Cao, Z. A three-dimensional buffer analysis method based on the 3D Discrete Global Grid System. ISPRS Int. J. Geo-Inf. 2021, 10, 520. [Google Scholar] [CrossRef]
- Gold, C.; Mostafavi, M.A. Towards the global GIS. SPRS J. Photogramm. Remote Sens. 2000, 55, 150–163. [Google Scholar]
- Zhao, X.; Yuan, Z.; Zhao, L.; Zhu, S. An improved QTM subdivision model with approximate equal-area. Acta Geod. Cartogr. Sinica 2016, 45, 112. [Google Scholar]
- Li, B.; Wang, J.; Zhang, Y.; Sun, Y. Innovative Adaptive Multiscale 3D Simulation Platform for the Yellow River Using Sphere Geodesic Octree Grid Techniques. Water 2024, 16, 1791. [Google Scholar] [CrossRef]
- Tsuboi, S.; Komatitsch, D.; Ji, C.; Tromp, J. Computations of global seismic wave propagation in three dimensional earth model. In Proceedings of the International Symposium on High Performance Computing, Nara, Japan, 7–9 September 2005; pp. 434–443. [Google Scholar]
- Wang, Q.; Zhao, X.; Wang, Z.; Liu, Q.J.G. An improved transformation algorithm between QTM code and longitude/latitude coordinate. Geomat. Inf. Sci. Wuhan Univ. 2020, 45, 303–308, 316. [Google Scholar]
Disclaimer/Publisher’s Note: The statements, opinions and data contained in all publications are solely those of the individual author(s) and contributor(s) and not of MDPI and/or the editor(s). MDPI and/or the editor(s) disclaim responsibility for any injury to people or property resulting from any ideas, methods, instructions or products referred to in the content. |
© 2025 by the authors. Published by MDPI on behalf of the International Society for Photogrammetry and Remote Sensing. Licensee MDPI, Basel, Switzerland. This article is an open access article distributed under the terms and conditions of the Creative Commons Attribution (CC BY) license (https://creativecommons.org/licenses/by/4.0/).