Abstract
In recent years, there has been a sharp increase in the number of online fraud cases. However, research on crime geography has paid little attention to online crimes, especially to the influencing factors behind their spatial distributions. Online fraud is closely related to people’s daily internet use. The existing literature has explored the impact of internet use on online crimes based on small samples of individual interviews. There is a lack of large-scale studies from a community perspective. This study applies the routine activity theory to online activities to test the relationship between online fraud alert data and the usage durations of different types of mobile phone users’ applications (apps) for communities in ZG City. It builds negative binomial regression models for analyzing the impact of the usage of different types of apps on the spatial distribution of online fraud. The results reveal that the online fraud crime rate and the online time spent on a financial management app share the most similar spatial distribution. While financial management, online education, transportation, and search engine app usages have a significant positive association with online fraud, the use of a financial management app has the greatest impact. Additionally, time spent on social media, online shopping and entertainment, and mobile reading apps have a significant negative association with online fraud. As not all online activities lead to cybercrime, crime prevention efforts should target specific types of apps, such as financial management, online education, transportation, and search engines.
1. Introduction
As a new form of crime, online fraud has seen a continuous increase in both the number of cases and the amounts of money involved, posing a serious threat to the safety of people’s lives and property and to social and economic stability. According to the Communications Fraud Control Association, global telecommunication revenue losses due to fraud amounted to nearly USD 39.89 million in 2021. In China, the National Bureau of Statistics notes that online fraud crimes have shown a continuous upward trend, growing at an average annual rate of 13.48%. It has become the fastest-growing criminal offense in the country. Based on the 47th Statistical Report on China’s Internet Development, by the end of 2020, about 16.5% of internet users in China had fallen victim to online fraud [1]. In 2020, the financial loss caused by telecom network fraud cases reported by public security authorities amounted to CNY 35.37 billion. The frequent occurrence of online fraud and the severe social harm it causes have garnered significant attention from industry and academia.
Studies have analyzed the spatial and temporal patterns of online fraud, finding that offline geographic features and individual online activities may increase the chance of online fraud victimization [2]. Yet, research on the relationship between residents’ online activities and the spatial distribution of online fraud victimization at the community level is still lagging. In China, communities are the most fundamental social units [3]. Chinese policing work is essentially community policing [4]. Community-based crime prevention and control are more conducive to policing work compared to that which is individual-based. Therefore, this study takes the communities of ZG City, China, as the units of analysis and uses online fraud alert data and mobile phone usage duration data on various types of apps to explore the impacts of various internet activities on the spatial distribution of online fraud. This study is crucial for the prevention, combat, management, control, and publicity efforts against online fraud crimes.
2. Literature Review
2.1. Spatial and Temporal Patterns of Online Fraud
The study of the spatial-temporal patterns of crime is fundamental to understanding criminal phenomena and analyzing the mechanisms behind crime occurrence. Recent empirical studies have explored the spatio-temporal pattern of online fraud, finding that online fraud has significant spatio-temporal concentrations across various geographic scales and that the agglomeration of online fraud exhibits regional differences. For example, by analyzing the spatio-temporal pattern of identity theft crime in the US, Lane and Sui (2010) found that crime rates were higher in the southwest and west than in the New England and Northern Plains states [5]. Chen et al. (2021) explored the spatio-temporal distribution and cross-regional mobility characteristics of cyber fraud at the municipal level in China, showing an increasing trend of spatial agglomeration in southeastern coastal cities and stronger agglomeration in the south than in the north [2]. Xiang, Gao, Ma, Jiang, and Hao (2021) found that online fraud was concentrated in the southeast coastal counties and that the number of occurrences increased during the study period [6]. At the community level in ZG City, Liu et al. (2017) revealed that online scams followed a “fragmented polycentric” distribution pattern, with peak occurrences observed from 15:00 to 16:00 on weekdays and around 15:00 on weekends [7].
2.2. Factors Behind Cybercrime
Studies that explore the factors influencing cybercrime focus on macro- or meso-level socio-demographic, geographic, and environmental elements and micro-level individual behavior in cyberspace. Specifically, the former include features of the social environment and built environment, indicative of opportunities for exposure to offline daily activities, while the latter pertains to individuals’ online activities.
2.2.1. Macro and Meso Levels: Socio-Demographic and Geographic Characteristics
Social disorganization theory and routine activity theory are key theories for explaining the mechanisms behind cybercrime. Social disorganization theory focuses on the role of the social environment in the formation of motivation to commit crime [8], while routine activity theory suggests that crime is the result of the convergence of motivated offenders, potential victims, and the absence of guardianship in space and time [9]. Drawing on these two theories, a large body of research has examined the role of social and physical environment characteristics and exposure opportunities resulting from people’s daily activities on cybercrime. The social environment mainly refers to economic conditions and socio-demographic compositions, including gender, age, educational level, and domestic migrants. For example, studies have found that the level of economic development and demographic characteristics of cities are closely related to the spatial distribution of online fraud victimization at the state level in the US [5] and at the city level in China [2]. C. Zhang, Liu, and Zhou (2018) concluded that females are more likely to be victimized by non-contact fraud in communities with a lower proportion of young people in ZG City, China [10]. Liu et al. (2017) further showed that the proportion of migrants has a positive impact on online fraud, while the proportion of less educated and elderly people shows a negative impact [7].
The impact of the built environment on cybercrime mainly considers how people’s offline activities shape their exposure to cybercrime risks. The agglomeration of people’s activities in the physical space (residential neighborhoods, hotels, schools, etc.) creates more opportunities for offenders to commit crimes. Alternatively, certain venues (e.g., bank branches, companies, etc.) may naturally attract offenders (e.g., cash transactions and a large number of internet users), which, in turn, contribute to an increase in cybercrime exposure opportunities for potential victims. At the same time, the disclosure of personal information during interactions at such venues (e.g., filling out information for business, offline dating, and chatting) may further expose potential victims to cybercrime offenders [11]. Studies have also characterized built environment features by examining elements such as residential communities, dining facilities, bank branches, corporate enterprises, accommodation facilities, road density, land use mix, and the presence of universities and colleges. For example, Liu and Zhang revealed that the presence of bank branches, corporate enterprises, tourist attractions, accommodation facilities, road density, land use mix, and colleges and universities is linked to online fraud [7]. In another study, they further found that bank branches, large retail commercial outlets, and the presence of colleges and universities have an impact on the occurrence of non-contact fraud crimes [12].
Overall, these studies investigate factors at the macro and meso levels, indicating that the occurrence of cybercrime is shaped by both the social environment and the built environment. Another line of geographic inquiry focuses on micro-level individual behavior, considering the relationship between online fraud and individual exposure to online daily activities.
2.2.2. Micro Level: Individual Online Activities
With the rapid development of information networks and the increasing popularity of the internet and mobile internet, activities such as querying information, communicating with friends and family, reading news, online shopping, and online gaming have become an integral part of everyday life. Meanwhile, however, online fraud has emerged alongside these developments. By the end of 2020, 33% of internet users experienced online shopping fraud [1]. In 2021, among the valid fraud reports, dating fraud accounted for 25.8% of the total, followed by part-time job scams at 24.5% and financial fraud at 15.6% [13]. Furthermore, on a popular gaming forum, approximately 60% of posts were either posting fraudulent scam information or debunking scam tactics [13]. All of these types of scams are, to some extent, associated with search engines. When browsing the internet, individuals may unknowingly expose themselves to the risk of deception through various applications (apps) or websites. For instance, fraudsters may create malicious programs on shopping, social networking, investment, and financial management apps that enable privacy theft, remote control, and other functions. Once an individual installs the malicious program, offenders can gain access to extensive personal information and potentially control victims’ devices remotely. Likewise, fraudsters mislead users by creating fake websites that disseminate fraudulent information via search engines. Search engines are often used by offenders to promote fraudulent websites (e.g., pushing fraudulent websites to the top of the search results). Such promotion makes users more likely to click the first few search results and enter a phishing website. While online fraud is a non-contact crime and takes place in the virtual realm, the process of fraud is, nevertheless, intricately linked to individuals’ online behaviors.
Researchers expanded the routine activity theory by introducing a network-based theory of daily activity. As per the theory, if suitable targets and motivated offenders converge in the same virtual environment, offenders can interact with suitable targets [14,15]. Though suitable targets and motivated cyber offenders may not be fully synchronous in space and time, their interactions in cyberspace and the eventual overlap in time ensure the integrity of the theory. Individual online daily activities can influence the occurrence of opportunities to become a victim of online crime.
Based on the routine activity theory on the internet, growing research begins to consider elements such as the length of time spent on the internet, social networking habits, searching habits, and online shopping behaviors, exploring their impacts on online crimes such as malware, consumer fraud, cyber harassment, and identity theft. For example, Bossler and Holt (2009) used data on the online activities of 570 college students to explore the relationship between online behavior and malware victimization [16]. By investigating online activities such as shopping, chatting, and banking, they found that chatting and the use of emails had an impact on data loss due to malware infections. In a similar study, Pratt, Holtfreter, and Reisig (2010) surveyed 922 respondents in Florida and concluded that longer weekly online hours and online purchases made a person more likely to be targeted by consumer scammers [17]. Using an online survey of 295 university students in the southeastern US, Ngo and Paternoster (2011) reported that the length of time spent using instant messaging had a significant positive effect on non-stranger online harassment [18]. By analyzing British Crime Survey data on the daily activities of 5985 residents from England and Wales who used the internet, Reyns (2011) found that people who use the internet for banking, sending emails, and instant messaging were 50% more likely to suffer from identity theft victimization [19]. Leukfeldt and Yar (2016) analyzed the online behavior of 9161 Dutch internet users and showed that browsing with purposeful searches had a significantly positive relationship with identity theft [20]. Additionally, they found that the frequency of using the internet, emails, MSN, and Skype and online shopping had a significantly positive effect on consumer fraud.
2.2.3. Summary
Existing research on the factors behind the spatial and temporal distributions of cybercrime has centered on the macro- and meso-level elements of the physical and social environment, as well as micro-level individual online daily activities. The occurrence of online fraud is the result of multiple factors at play. It is influenced not only by offline geographic elements, but also by online daily activities. There are three research gaps in the literature on online fraud and online daily activities.
First, most studies are based on small samples of interview data to investigate individual-level online behavior and the occurrence of online fraud. The generalizability of study results, therefore, remains limited. More research utilizing a larger-scale research design is needed to systematically understand the activity–online fraud relationship, especially at the community level. This paper adopts the duration of various online activities among residents and aggregates the data to communities. It investigates the relationship between residents’ daily activities on the internet and the incidence of online fraud. By doing so, it aims to provide scientific evidence for law enforcement to develop community-based strategies for the prevention and control of internet fraud.
Second, prior studies attend to seemingly a wide range of online activities, but some of them are attributed to the same type, and a detailed distinction of online activities type is missing. For instance, Leukfeldt and Yar (2016) discussed three types of internet access activities, namely, email, MSN, and Skype, all of which are communication activities [20]. As such, this study differentiates the various online activities more comprehensively and divides all activities into one of the following thirteen categories: social media, search engines, news, online shopping, service access, travel booking, financial management, audio entertainment, mobile gaming, video streaming, reading, transportation, and online education.
Furthermore, research on online fraud remains scarce in China. It is essential to examine which types of internet access among community residents in a typical low- or middle-income country are closely linked to cyber fraud offenses, particularly given the variations in socio-demographic attributes across different study regions all over the globe. The southeastern coast of China offers rich social, demographic, and urban contexts for such a timely research agenda.
To address the aforementioned research gaps, this study analyzes data from online fraud alerts and mobile phone app usage duration at the community level in ZG City. Through negative binomial regression analysis and spatial autocorrelation analysis, this study examines the relationships between 13 categories of online activities and the likelihood of online fraud, and how these relationships may vary across space.
3. Data and Methods
3.1. Study Area
The study area of this research is the urban area of ZG City, a megacity located in the southeastern coastal region of China. The urban area covers 2055 communities. As of 2019, the urban area had a registered population of around 8 million people (i.e., people with a local household registration) and a total population of 13 million people. The urban population is characterized by a high diversity and mobility. Meanwhile, the advanced internet infrastructure creates opportunities for fraudsters to commit crimes. ZG City’s environmental characteristics make it an ideal location for investigating the connection between online activities and fraud. The city’s comprehensive police data records through the local police department provide valuable data support for this study.
3.2. Data Sources
The data used in this paper include online fraud alert data, the online behavior data of mobile phone users, points of interest (POIs) data, and socio-demographic data from the seventh national census.
3.2.1. Crime Data
Online fraud alert data come from the ZG City Public Security Bureau P-GIS database on online fraud in 2019. After applying geocoding to the original dataset with physical addresses, there are a total of 20,961 online fraud cases confirmed by the police.
3.2.2. Online Activities of Mobile Phone Users
Data on the online behavior data of mobile phone users come from China Unicom’s Smart Footprint DaaS (dataset as a service) platform. China Unicom is a major telecom company with a market share of approximately 20% in China. In this study, we use anonymized data collected in October 2020. Data attributes include (1) resident users’ monthly residential locations, gender, and age groups (0–6, 7–18, 19–29, 30–44, 45–59, and 60 years or above) and (2) mobile phone app name, category, and usage duration by users.
Users’ online behavioral characteristics are extracted as follows. First, we extract users’ residential locations at the geohash7 level (provided by the data platform) and intersected grids with community boundaries to obtain users’ residential communities. Second, we match the user app list with the APP label classification table, which includes information on the type and usage duration of various apps. The APP label classification table provides 36 primary categories. Following the 44th China Internet Development Statistics Report published by the China Internet Network Information Centre in 2019 [21], we only consider 13 categories, including “social media”, “search engines”, “news”, “online shopping”, “service access”, “travel booking”, “financial management”, “audio entertainment”, “mobile gaming”, “video streaming”, “ reading”, “transportation”, and “online education”. We calculate the total duration of all users’ online activities across the 13 types. Third, we join resident users’ demographics with their mobile phone app usage data, and aggregate the number of resident users by age and gender and their internet usage duration at the community level to create the final dataset.
In this study, we only consider the use of apps among the residential population. Users categorized as visitors or employees in the community are not included in the analysis (see Table 1 for details on how we categorized users into residents, visitors, or employees). The rationale behind this approach is that public security authorities generally register fraud alarms in the user’s place of residence or work. This is confirmed by the Opinions on Several Issues of Applicable Laws in Handling Criminal Cases of Telecommunication Network Frauds and Other Crimes (the Opinions) issued by the Chinese Supreme Court, the Supreme Procuratorate, and the Ministry of Public Security. The Opinions indicate that the locations of fraud offenses encompass both the site of the criminal act and the place where the offense’s consequence materializes. It is recommended that a victim reports the case to the police department in these two locations. Generally speaking, victims are exposed to longer periods of scam risk while at their homes or workplaces. Employees potentially have less interaction with scammers, as they need to focus on their work. The focus of this paper is, therefore, on potential victims who are residents.

Table 1.
Identification of users’ stay information.
As discussed above, we classify all apps into 13 categories. Table 2 below summarizes the numbers of major apps by each category.
Table 2.
App tag attributes and statistics.
3.3. Model and Variables
3.3.1. Model Selection
Our outcome variable is the number of online fraud alerts, which is a count variable. With a mean value of 10.20 and variance of 15.18, our outcome variable is overdispersed, meaning that negative binomial models are preferred over Poisson models among statistical models for a count variable. We, therefore, apply negative binomial regression models to assess online fraud alerts. The negative binomial regression model is derived from the Poisson regression model, incorporating an estimation function to account for the error term. Osgood presented a systematic approach to the utilization of negative binomial regression in handling crime rates [10,22].
The negative binomial model takes the following form:
where λi represents the number of online fraud cases within community i, Xik denotes the kth explanatory variable, βk represents the regression coefficient, β0 is the intercept when k = 0, and εi is the error term.
When calculating the crime rate, Formula (1) becomes the following:
When the resident population coefficient is fixed at 1, the resident population size n is used as the exposure variable, and the negative binomial regression model can effectively analyze the per capita number of reported online fraud cases, i.e., the online fraud rate.
Based on Formulas (2) and (3), although this study uses the number of online fraud cases occurring in the community as the dependent variable, it treats the resident population as the exposure variable, which is essentially equivalent to calculating the crime rate. Therefore, when dealing with the independent variables, this study divides variables related to internet usage duration and the built environment by the resident population to ensure the reasonability of the analysis. Detailed explanations are provided in the next section.
The model coefficients, incidence rate ratios (IRRs), and standardized coefficients for the negative binomial regression models are presented. The meaning of IRR is that for every one-unit increase in the independent variable, the value of the dependent variable becomes IRR times its original value. In this study, standardized coefficients for each variable are computed, meaning that all variables are standardized prior to being included in the negative binomial regression model. When the IRR (incidence rate ratio) is greater than 1, it indicates a positive influence of the variable on the dependent variable; when the IRR is less than 1, it indicates a negative influence. Standardized coefficients eliminate the effects of different measurement units and gauge the relative impact of each independent variable on the crime rate.
3.3.2. Dependent and Independent Variables
As discussed above, we adopt the durations of 13 types of online behaviors by mobile phone users to indicate the online daily activities of potential victims. Regarding control variables, following existing studies on the environmental factors affecting the spatial and temporal distributions of online fraud [7], we choose four types of POIs, namely, bank branches, internet cafes, colleges and universities, and convenience stores, to measure the built environment. We also use the proportion of the migrant population, mean age, and gender composition to measure the characteristics of the social context (Table 3).
Table 3.
Variables and measurements.
During the process of data analysis, the variables of social media, mobile gaming, video streaming, online shopping, and audio entertainment were highly correlated with each other (Table A1 in Appendix A). To reduce multicollinearity, we collapsed social media, mobile gaming, video streaming, online shopping, and audio entertainment to form a new variable “social media, online shopping, and entertainment”. From Table A1, we can see that Social Media, Online Shopping, and Entertainment and their sub-variables are highly correlated. Moreover, their correlation coefficients with online fraud are all positive and significant, and the magnitudes of these coefficients are relatively close.
Table 4 reports the VIF values for the final predictors. The highest VIF value observed for “social media, online shopping, and entertainment” (3.410) does not surpass 5. Thus, there is limited evidence of multicollinearity in the dataset.
Table 4.
Results of collinearity test after some variables are combined.
4. Results
4.1. Descriptive Analyses
Table 5 presents the descriptive statistics of the activities. In the study location, the number of online fraud alerts per 1000 residential population in the community ranged from 0 to 344. The average residential population of the communities was approximately 2820 people, with a maximum of over 60,000. In terms of the duration of online activities, the average monthly duration of social media, online shopping, and entertainment activities per resident per community was about 121 h, with a range between 14 and 287 h. The monthly duration of search engine use was 6 h, which was about twice as long as that of news. The monthly involvement in service access was about 4 h. The monthly durations of travel booking and financial management were close to 1.5 h and 1.4 h, respectively. The average durations of reading, transportation, online education, and other online activities were less than 1 h per month. In terms of offline routine activity POIs, there were on average 2.4 bank branches per 1000 people, followed by convenience stores (mean of 0.8 per 1000 people). The numbers of colleges and universities and internet cafes were both around 0.7 per 1000 people. Regarding social environment indicators, the average proportion of migrants per community was 0.423. Men accounted for 64.5 percent of all resident users, and the average age of the communities was about 34.
Table 5.
Descriptive statistics (n = 2151).
4.2. The Relationship Between Online Daily Activities and Online Fraud
4.2.1. Analysis of the Correlation Between Online Daily Activities and Online Fraud
Table 6 presents the pairwise correlation coefficients between the length of time spent online in different activity categories and online fraud. Social media, online shopping, and entertainment, search engines, travel booking, service access, online education, online reading, news, financial management, and transportation showed a moderate positive correlation with online fraud. By contrast, news was negatively associated with online fraud. The correlation coefficient between the use of transportation and travel and online fraud was low.
Table 6.
The relationship between different online activities and online fraud.
4.2.2. The Spatial Relationship Between Online Daily Activities and Online Fraud
Figure 1 shows the spatial distribution of online fraud alerts. Fraud cases were concentrated in the central part of the urban area, exhibiting a “pear-shaped” distribution. The places with a high prevalence of fraud were migrant-concentrated communities, rural communities with an aging population, and university communities. The spatial distribution of online fraud alerts followed a similar clustered pattern as that of online activities on nine app types (Figure 2), particularly for social media, online shopping, and entertainment, news, and search engines.
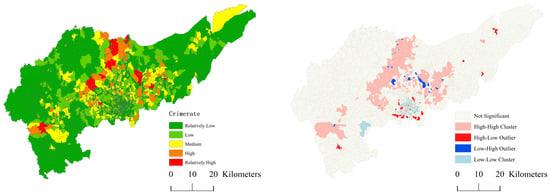
Figure 1.
Spatial distribution of online fraud and LISA cluster map.
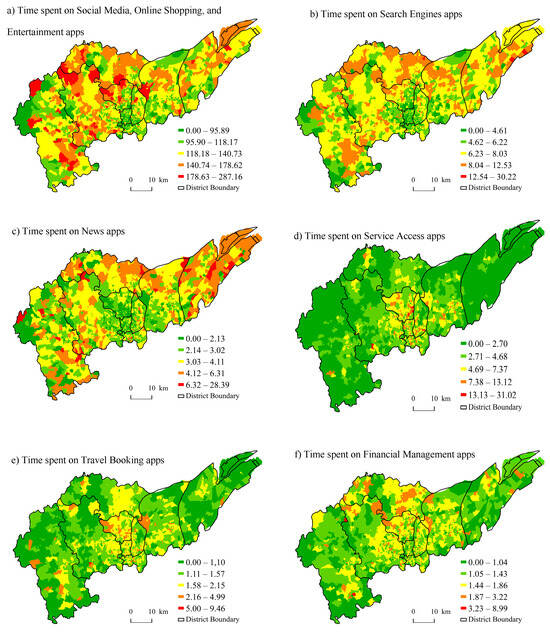
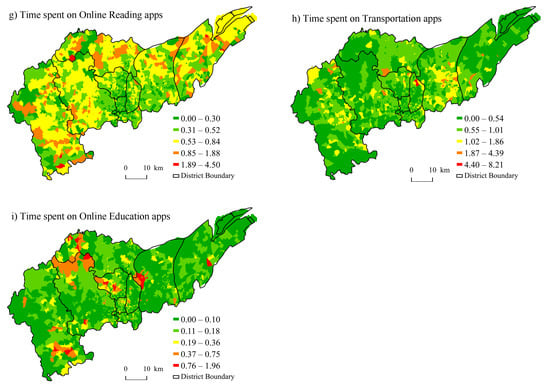
Figure 2.
Spatial distribution of time spent on 9 app categories.
4.3. Differences in the Impact of Time Spent on Different Types of Apps on Online Fraud
Table 7 shows the results from a negative binomial regression predicting the number of online fraud cases. We observed significant differences across different types of apps on the spatial distribution of online frauds.
Table 7.
Model results of the impact of online activities on the spatial patterns of online fraud.
Firstly, the occurrence rate of online fraud in the urban area of ZG City mainly showed a negative correlation with social media, online shopping and entertainment (p < 0.001) and online reading time use (p < 0.05). For every unit increase in social media, online shopping, and entertainment and online reading activities by the residents in the community, the incidence rate of online fraud reduced by 23.5% [(1 − 0.765) × 100%] and 7.1% [(1 − 0.929) × 100%], respectively. Next, financial management (p < 0.001), transportation (p < 0.05), online education (p < 0.05), and search engine (p < 0.05) use were positively linked to online fraud. For every unit increase in financial management, transportation, online education, and search engine activities, the incident rate of online fraud increased by 8.8% [(1.088 − 1) × 100%], 6.0%, 6.8%, and 7.6%, respectively. From the absolute values of Std.β, it can be known that the time spent on Social Media, Online Shopping, and Entertainment had the strongest impact on the occurrence of online fraud, followed by financial management and online reading.
5. Discussion
Based on the online routine activity perspective, this paper focuses on the impacts of different online activities of residents on the spatial distribution of online fraud victimization, with the influence of offline physical and social environment controlled. It takes the communities of ZG City, China, as an example. This study finds that there is a significant spatial agglomeration of online fraud cases and that different types of online activities contribute differently to the spatial distribution of online fraud. Two major findings emerge in our analysis.
The use of search engines, financial management, online education, and transportation apps has a significant positive impact on the occurrence of online fraud. Previous studies found that phishing offenders often create a large number of fake pages visible in search engine results through loopholes in certain browsers to confuse users. Due to the relatively small screen size of mobile devices and high quality of fake websites, users can easily be deceived into visiting malicious web pages, thus becoming victims of online fraud [23]. In addition, online scammers commonly use promotional advertisements in web browsers to conduct their fraudulent activities. Embedding online advertisements in the browser app has become the main source of income for many internet companies. When users use search engines, they can be easily confused by search results and promotional links, which makes them easy targets for scammers [24].
The use of financial management apps involves various risks of fraud. Data leaks and the illegal acquisition of private data allow offenders to obtain a massive amount of personal identifiable information of potential victims on the internet at a relatively low price. They then lure potential victims into financial scams by offering low-risk, high-return investment opportunities. By taking advantage of potential victims’ greed, financial difficulties, and the fear of losing investment opportunities, offenders prompt people to make investment decisions or transfer money to them [25,26]. In addition, technological advances have also created new channels for scammers to commit investment scams, with the anonymity of the internet acting as an “umbrella” for scammers [27]. Furthermore, the lack of effective regulation on the internet (e.g., external auditors and regulators) also creates opportunities for investment scams [28,29].
Online education is gaining increasing popularity among Chinese people. This also creates opportunities for scammers to commit crimes. For instance, scammers can use education platforms to commit online class refund fraud. In addition, students may also click on fraudulent links on education platforms during online classes, which may increase their risk of being scammed. For transportation, with the prevalence of various types of rideshare platforms, people may be targeted by scammers while enjoying the convenience of such apps. Scammers may commit crimes under the guise of rideshare recharge sales and other discount services.
Next, the occurrence of online fraud is significantly negatively affected by social media, online shopping, and entertainment, and online reading activities. For social media, online shopping, and entertainment, teenagers around 13–18 years old have long social network online durations. However, members of this group are typically in school and do not have a stable income, making them less likely to be targeted by online scammers. On average, the longer the time spent on social media, the closer the connection between users, which can lead to the formation of online social networks, social control, and the spread of anti-fraud strategies, which may inhibit the occurrence of online fraud.
There is a significant negative correlation between online reading and online fraud victimization. The Consumer Financial Protection Bureau investigated the relationship between financial literacy and fraud detection in 5698 residents, finding that the more financially literate the respondents, the more likely they were to identify fraudulent tactics [30]. From a knowledge perspective, reading apps contain a large number of electronic books of various types, including economic and financial management, psychology, encyclopedias, etc., which may enhance readers’ knowledge and awareness of safety precautions and, thus, reduce the probability of online fraud victimization.
Overall, the findings of this study both supported and diverged from the findings in prior studies. Our finding that various types of online activities shape the occurrence of online fraud echoes previous studies, where scholars consistently found that the use of social media and online shopping increased the likelihood of cyberbullying, cyberstalking victimization, and consumer fraud [17,31,32,33]. In contrast, our study found that social media, online shopping, and entertainment had a negative effect on cyber fraud. One possible explanation is that this paper took the community as the unit of analysis, while prior studies typically used individuals as the unit of analysis. As a result, our findings reflect more of the differences in the online behaviors of communities on average rather than individual residents. It is possible that the variability in the online behaviors of residents within a community were omitted. This means that the variance within a community was larger than the variance between communities, which led to different findings from previous studies. Another explanation is that this study focused solely on online fraud while previous studies examined multiple types of online fraud. Online activities could have different relationships with different online fraud types.
In summary, this paper contributes to the literature in two ways. First, different from the small-sample studies of previous researchers using individual interview data, our study has a large sample and analyzes nine types of online activities and their relationships with online fraud at the community level. We found that a longer time spent on using financial management, online education, transportation, and search engine apps was linked to a greater risk of online fraud victimization. The results can provide insights on the prevention and control of online fraud. For search engines, online education, and transportation, police may take the community as a unit and propose targeted online fraud promotion strategies based on the overall internet behavioral characteristics of mobile phone users in the community. App developers can improve the security of their apps by establishing a user authentication procedure and developing a fraud detection system [10,34]. For potential victims, more safety precaution education (e.g., how to identify common fraud tactics and fraudulent links) is needed. Next, we used the durations of use of different app types to characterize online routine activities, thus enriching the empirical support of routine activities theory.
However, this study also has limitations. First, it fails to differentiate between specific types of fraud. Our ability to link specific types of activity to specific types of fraud is limited. Existing studies have shown that specific routine activities have impacts on specific crimes [35]. Next, this paper mainly focused on the routine activities of potential victims and did not account for other key elements of routine activity theory (e.g., guardianship) due to data limitations, primarily focusing on analyzing the spatial distribution of online fraud victims, without fully accounting for the potential discrepancies between the perpetrator’s and victim’s locations. Furthermore, while the process of online fraud may simultaneously involve a variety of online behaviors such as online social networking, investment and finance management, and money transfer and payments, this study did not examine the interaction between different online behaviors and failed to accurately establish the causal relationship between residents’ internet usage habits and their susceptibility to online fraud due to the use of aggregated data. Last, we combined highly correlated variables related to social media, mobile gaming, video streaming, online shopping, and audio entertainment into a single variable. This aggregation may have resulted in the loss of nuanced information from individual variables, potentially leading to discrepancies in the model outcomes. Our findings may not be directly generalizable to other countries due to the specific context of our study, although we believe the insights gained can still be informative for understanding online fraud in different contexts.
Despite the limitations of the study, this paper paves the way for future research. For example, future research could introduce other key components of routine activity theory to understand online fraud more comprehensively. The presence and use of antivirus and anti-fraud apps can serve as measures of guardianship and the detection of malicious programs is a valuable indicator for identifying motivated offenders. Differences in victimization risk across other socio-demographic dimensions (e.g., age, gender, and income) may offer new insights into the mechanisms behind online fraud and facilitate the development of group-specific prevention strategies.
6. Conclusions
This study applies the routine activity theory to online activities to test the relationship between online fraud alert data and the usage durations of different types of mobile phone users’ applications (app) for communities in ZG City. It builds negative binomial regression models for analyzing the impact of the usage of different types of apps on the spatial distribution of online fraud. The results reveal that the online fraud crime rate and online time spent on financial management apps share the most similar spatial distribution. While financial management, online education, transportation, and search engine app usages have a significant positive association with online fraud, the use of financial management apps has the greatest impact. Additionally, time spent on social media, online shopping and entertainment, and mobile reading apps have a significant negative association with online fraud. As not all online activities lead to cybercrime, crime prevention efforts should target specific types of apps, such as financial management, online education, transportation, and search engines.
Author Contributions
Conceptualization, Guangwen Song and Lin Liu; methodology, Chunxia Zhang and Jiajun Liang; formal analysis, Guangwen Song and Chunxia Zhang; investigation, Chunxia Zhang and Linlin Wu; writing—original draft preparation, Guangwen Song and Linlin Wu; writing—review and editing, Lin Liu and Linlin Wu; supervision, Chunxia Zhang and Jiajun Liang; project administration, Lin Liu; funding acquisition, Guangwen Song. All authors have read and agreed to the published version of the manuscript.
Funding
This research was funded by National Natural Science Foundation of China (Grant No. 42171218,42101246), Natural Science Foundation of Guangdong Province (Grant No. 2023A1515011462), Philosophy and Social Science Planning Programme of Guangdong Province (Grant No. GD22CSH07), Guangdong-Hong Kong-Macao Cultural and Tourism Research Base (Grant No. 2023WZJD019), Key Educational Reform Projects of Guangzhou Panyu Polytechnic (Grant No.2022JG06,2022SK04), Guangzhou Research Base for Collaborative Cultivation of High-Level Technical and Skilled Talents.
Institutional Review Board Statement
Informed consent was obtained from all subjects involved in the study.
Informed Consent Statement
Informed consent was obtained from all subjects involved in the study.
Data Availability Statement
The datasets presented in this article are not readily available due to the confidentiality agreement with local police.
Conflicts of Interest
The authors declare no conflicts of interest.
Appendix A
Table A1.
The correlation coefficient matrix of social media, online shopping, and entertainment and their sub-variables with online fraud.
Table A1.
The correlation coefficient matrix of social media, online shopping, and entertainment and their sub-variables with online fraud.
| Online Fraud Alerts | Social Media | Mobile Gaming | Video Streaming | Online Shopping | Audio Entertainment | Social Media, Online Shopping, and Entertainment | |
|---|---|---|---|---|---|---|---|
| Online Fraud Alerts | 1.000 | ||||||
| Social Media | 0.232 *** | 1.000 | |||||
| Mobile Gaming | 0.133 *** | 0.698 *** | 1.000 | ||||
| Video Streaming | 0.187 *** | 0.872 *** | 0.822 *** | 1.000 | |||
| Online Shopping | 0.207 *** | 0.825 *** | 0.632 *** | 0.740 *** | 1.000 | ||
| Audio Entertainment | 0.184 *** | 0.772 *** | 0.625 *** | 0.716 *** | 0.675 *** | 1.000 | |
| Social Media, Online Shopping, and Entertainment | 0.224 *** | 0.986 *** | 0.912 *** | 0.804 *** | 0.845 *** | 0.795 *** | 1.000 |
note: *** p < 0.001.
References
- China Internet Network Information Center. The 47th Statistical Report on Internet Development in China. 2021. Available online: https://www.cnnic.com.cn/ (accessed on 28 March 2024).
- Chen, S.; Gao, C.; Jiang, D.; Hao, M.; Ding, F.; Ma, T.; Zhang, S.; Li, S. The Spatiotemporal Pattern and Driving Factors of Cyber Fraud Crime in China. ISPRS Int. J. Geo-Inf. 2021, 10, 802. [Google Scholar] [CrossRef]
- Yungui, S. The Status Quo, Problems and Reflection of China’s Urban Community Governance. J. Shanghai Adm. Inst. 2021, 14, 88–97. [Google Scholar]
- Zhang, L.N. Communities, Crime and Social Capital in Contemporary China. Theor. Criminol. 2010, 14, 244–246. [Google Scholar]
- Lane, G.W.; Sui, D.Z. Geographies of identity theft in the U.S.: Understanding spatial and demographic patterns, 2002–2006. GeoJournal 2010, 75, 43–55. [Google Scholar] [CrossRef]
- Xiang, J.; Gao, C.; Ma, T.; Jiang, D.; Hao, M. Spatial-temporal Distribution Characteristics of Cyber Fraud in China on County Scale. Sci. Geogr. Sin. 2021, 41, 1079–1087. [Google Scholar] [CrossRef]
- Liu, L.; Zhang, C.; Feng, J.; Xiao, L.; He, Z.; Zhou, S. The spatial-temporal distribution and influencing factors of fraud crime in ZG city, China. Acta Geogr. Sinica. 2017, 72, 315–328. [Google Scholar]
- Shaw, C.R.; McKay, H.D. Juvenile Delinquency and Urban Areas: A Study of Rates of Delinquents in Relation To differential Characteristics of Local Communities in American Cities; University of Chicago Press: Chicago, IL, USA, 2006. [Google Scholar]
- Cohen, L.; Felson, M. Social Change and Crime Rate Trends: A Routine Activity Approach. Am. Sociol. Rev. 2006, 44, 588–608. [Google Scholar] [CrossRef]
- Song, G.; Liu, L.; Bernasco, W.; Zhou, S.; Xiao, L.; Long, D. Theft from the person in urban China: Assessing the diurnal effects of opportunity and social ecology. Habitat Int. 2018, 78, 13–20. [Google Scholar] [CrossRef]
- Higgins, G.E.; “Tad” Hughes, T.; Ricketts, M.L.; Wolfe, S.E. Identity theft complaints: Exploring the state-level correlates. J. Financ. Crime 2008, 15, 295–307. [Google Scholar] [CrossRef]
- Zhang, C.; Liu, L.; Zhou, S. Gender Difference on Relative Probability of Non-contact Fraud in ZG City. Sci. Geogr. Sin. 2018, 38, 1218–1226. [Google Scholar] [CrossRef]
- 360 Mobile Security; 360 Government & Enterprise Security Group; Tianshu Zhiku. China Mobile Security Status Report 2021. 2021. Available online: https://www.360.cn/n/12069.html (accessed on 28 March 2024).
- Eck, J.; Clarke, R.V. Classifying common police problems: A routine activity approach. Crime Prev. Stud. 2003, 16, 7–39. [Google Scholar]
- Reyns, B.W.; Henson, B.; Fisher, B.S. Being Pursued Online: Applying Cyberlifestyle–Routine Activities Theory to Cyberstalking Victimization. Crim. Justice Behav. 2011, 38, 1149–1169. [Google Scholar] [CrossRef]
- Bossler, A.M.; Holt, T.J. On-line Activities, Guardianship, and Malware Infection: An Examination of Routine Activities Theory. Int. J. Cyber Criminol. 2009, 3, 400–420. [Google Scholar]
- Pratt, T.C.; Holtfreter, K.; Reisig, M.D. Routine Online Activity and Internet Fraud Targeting: Extending the Generality of Routine Activity Theory. J. Res. Crime Delinq. 2010, 47, 267–296. [Google Scholar] [CrossRef]
- Ngo, F.; Paternoster, R. Cybercrime Victimization: An examination of Individual and Situational level factors. Int. J. Cyber Criminol. 2011, 5, 773–793. [Google Scholar]
- Reyns, B.W. Online Routines and Identity Theft Victimization: Further Expanding Routine Activity Theory beyond Direct-Contact Offenses. J. Res. Crime Delinq. 2011, 50, 216–238. [Google Scholar] [CrossRef]
- Leukfeldt, E.R.; Yar, M. Applying Routine Activity Theory to Cybercrime: A Theoretical and Empirical Analysis. Deviant Behav. 2016, 37, 263–280. [Google Scholar] [CrossRef]
- China Internet Network Information Center. The 44th Statistical Report on Internet Development in China. 2019. Available online: http://www.cac.gov.cn/2019-08/30/c_1124939590.htm?from=singlemessage (accessed on 28 March 2024).
- Osgood, D.W. Poisson-Based Regression Analysis of Aggregate Crime Rates. J. Quant. Criminol. 2000, 16, 21–43. [Google Scholar] [CrossRef]
- Ali, M.A.; Azad, M.A.; Parreno Centeno, M.; Hao, F.; van Moorsel, A. Consumer-facing technology fraud: Economics, attack methods and potential solutions. Future Gener. Comput. Syst. 2019, 100, 408–427. [Google Scholar] [CrossRef]
- Zhang, T.; Zhang, H.; Gao, F. A Malicious Advertising Detection Scheme Based on the Depth of URL Strategy. In Proceedings of the 2013 Sixth International Symposium on Computational Intelligence and Design 2013, Hangzhou, China, 28–29 October 2013; pp. 57–60. [Google Scholar]
- Nelen, H.; Ritzen, L.; Will, S.; Handelman, S.; Brotherton, D.C. How They Still Try to Get Away with It: Crime in the Dutch Real Estate Sector Before and After the Crisis. In How They Got Away with It: White Collar Criminals and the Financial Meltdown; Columbia University Press: New York, NY, USA, 2012. [Google Scholar]
- Reurink, A. FINANCIAL FRAUD: A LITERATURE REVIEW. J. Econ. Surv. 2018, 32, 1292–1325. [Google Scholar] [CrossRef]
- Frankel, T. The Ponzi Scheme Puzzle: A History and Analysis of Con Artists and Victims, 1st ed.; Oxford University Press: New York, NY, USA, 2012; ISBN 978-01-9992-661-9. [Google Scholar]
- Markopolos, H. No One Would Listen: A True Financial Thriller; John Wiley & Sons: Hoboken, NJ, USA, 2010. [Google Scholar]
- Will, S.; Handelman, S.; Brotherton, D.C. How They Got Away with It: White Collar Criminals and the Financial Meltdown; Columbia University Press: New York, NY, USA, 2013. [Google Scholar]
- Christian, E.; Kamlesh, K.; Dennis, P. Financial Literacy and Fraud Detection. SSRN Electron. J. 2019, 26. [Google Scholar] [CrossRef]
- Choi, K.-S.; Cho, S.; Lee, J.R. Impacts of online risky behaviors and cybersecurity management on cyberbullying and traditional bullying victimization among Korean youth: Application of cyber-routine activities theory with latent class analysis. Comput. Hum. Behav. 2019, 100, 1–10. [Google Scholar] [CrossRef]
- Holt, T.J.; Bossler, A.M. Examining the Applicability of Lifestyle-Routine Activities Theory for Cybercrime Victimization. Deviant Behav. 2008, 30, 1–25. [Google Scholar] [CrossRef]
- Navarro, J.N.; Jasinski, J.L. Going Cyber: Using Routine Activities Theory to Predict Cyberbullying Experiences. Sociol. Spectr. 2012, 32, 81–94. [Google Scholar] [CrossRef]
- Nandhakumar, N.K.; Binu, A.; Paul, V. Non Repudiation for Internet Access by Using Browser Based User Authentication Mechanism. In Proceedings of the 2013 Third International Conference on Advances in Computing and Communications, Kochi, India, 29–31 August 2013; pp. 296–299. [Google Scholar]
- Reyns, B.W.; Fisher, B.S.; Bossler, A.M.; Holt, T.J. Opportunity and Self-Control: Do they Predict Multiple Forms of Online Victimization? Am. J. Crim. Justice 2019, 44, 63–82. [Google Scholar] [CrossRef]
Disclaimer/Publisher’s Note: The statements, opinions and data contained in all publications are solely those of the individual author(s) and contributor(s) and not of MDPI and/or the editor(s). MDPI and/or the editor(s) disclaim responsibility for any injury to people or property resulting from any ideas, methods, instructions or products referred to in the content. |
© 2025 by the authors. Published by MDPI on behalf of the International Society for Photogrammetry and Remote Sensing. Licensee MDPI, Basel, Switzerland. This article is an open access article distributed under the terms and conditions of the Creative Commons Attribution (CC BY) license (https://creativecommons.org/licenses/by/4.0/).