1. Introduction
Population aging is a major and prevalent reality faced by countries worldwide [
1]. According to estimates by the World Health Organization, between 2020 and 2050, the global population aged 60 and above will increase from 1 billion to 2.1 billion, and the rate of population aging in developing countries will significantly outpace that of developed countries. Consequently, the urgent need to actively address aging has never been more prominent, particularly for developing nations [
2]. Addressing the transportation needs of older adults is the foundation for tackling the challenges posed by aging [
3]. Generally, older adults have multiple transportation options at their disposal. However, as they age, driving private vehicles becomes less appealing due to safety concerns, and an increased reliance on private vehicles among older adults may also lead to environmental and congestion issues [
4]. Although walking accounts for a significant portion of daily travel for many older adults, physical decline can hinder their ability to walk long distances. From the perspective of sustainable transportation, as the population structure increasingly shifts towards aging, providing appropriate transportation services for older adults has become crucial [
5]. Regular buses, as the most convenient, economical, and environmentally friendly public transportation option, have become the preferred mode of transportation for older adults [
4]. For instance, in Beijing and Fuzhou, China, the proportion of older adults traveling by bus is as high as 98% and 60%, respectively [
6,
7]. Therefore, gaining a deeper understanding of the bus travel behavior of older adults is essential for achieving equity and sustainability in the transportation system.
Fare prices, socioeconomic attributes, and built environment characteristics have been widely recognized as the three core factors influencing public transit use [
8,
9]. However, fare strategies, such as the implementation of free public transit programs, have a limited impact on the public transit choices of older adults [
10]. In contrast, the built environment has become a significant factor influencing the travel behavior of older adults, and this influence exhibits notable differences among different groups, particularly as the travel patterns and needs of older adults may become more complex [
11]. For instance, compared to younger individuals, elderly public transit users exhibit socio-spatial differences in their travel, often concentrating on non-work-related travel needs such as accessing medical services and green spaces. Additionally, older adults tend to have shorter travel distances, lower travel frequencies, and shorter durations [
7,
12]. With improvements in their mobility and health, older adults are more willing to move around than before, with the overall number of trips almost on par with that of younger people [
13]. Against this backdrop, transportation equity becomes particularly crucial, encompassing not only the setting of fares but also the attention to and satisfaction of the needs of different groups. Especially for vulnerable groups such as older adults, maintaining their activity levels will better help them sustain a decent standard of living [
11]. Therefore, the rapidly growing needs of the older adult population and the heterogeneity in travel behavior compared to other groups, along with their potential long-term impacts, necessitate attention in future transportation planning to ensure the equity and sustainability of the transportation system. Additionally, socioeconomic factors, including housing prices, also exert an influence on bus travel [
10].
Furthermore, current research indicates that residents’ travel behavior exhibits significant spatiotemporal heterogeneity and nonlinear characteristics. Spatiotemporal heterogeneity manifests as the varying impacts of the built environment on travel behavior across different times and spatial locations. For instance, there are notable differences between weekdays and weekends in the temporal dimension [
9], as well as distinct variations between urban centers and suburbs in the spatial dimension [
14]. Existing studies primarily employ Geographically Weighted Regression (GWR) and its extended form, Geographically and Temporally Weighted Regression (GTWR), to analyze spatial heterogeneity [
15]. These methods effectively capture the spatial non-stationarity of parameter estimates. Nonlinear characteristics, meanwhile, are reflected in the threshold effects of the built environment on travel behavior, where the influence may weaken or disappear beyond a certain threshold [
16,
17]. To capture such nonlinear relationships, studies often adopt machine learning models such as Gradient Boosting Decision Trees (GBDT) and eXtreme Gradient Boosting (XGBoost) for analysis [
18]. For example, a study based in Wuhu, China, found that building density is generally positively correlated with bus passenger volume; however, when the value falls below five units per kilometer, it exhibits a negative impact [
17]. Nevertheless, existing single-method approaches struggle to simultaneously reveal the spatiotemporal heterogeneity and nonlinear relationships between the built environment and travel behavior, making it difficult for research findings to precisely guide planning practices. Therefore, it is necessary to combine the strengths of multiple methods to develop integrated models that account for both spatial heterogeneity and nonlinear modeling capabilities. This will enable a more comprehensive and accurate understanding of the complex relationships between the built environment and travel behavior, thereby providing a scientific basis for policy-making.
In summary, scholars both domestically and internationally have conducted extensive research on the relationship between the built environment and travel behavior, yielding a wealth of findings. However, existing studies exhibit three main limitations. First, although public transportation has become a primary mode of travel for older adults, research focusing on the public transport usage behavior of this demographic remains limited. Second, most studies on the built environment and public transport travel behavior concentrate on general or commuting populations. Given the unique physical characteristics and distinct travel needs of older adults, the findings from these studies may not be directly applicable to this group. Finally, while existing research has confirmed the presence of spatial heterogeneity and nonlinear relationships between the built environment and travel behavior, current methods struggle to simultaneously capture these two complex dynamics.
Although scholars both domestically and internationally have conducted extensive research on the built environment and travel behavior, significant limitations remain in studies focusing on bus travel behavior among older adults, as well as in methods for simultaneously capturing the spatial heterogeneity and nonlinear relationships of the built environment. To fill the aforementioned research gaps, we investigated the following three questions: (1) What are the distinctions in how the built environment affects bus travel behavior between older adults and younger adults? (2) How do the impacts of the built environment on elderly bus travel differ between weekdays and weekends? (3) What are the specific manifestations of spatial heterogeneity and nonlinearity in the impact of the built environment on elderly bus travel behavior? Firstly, we compared bus usage behavior between older adults and younger adults in Wuhan, China, in 2023. Subsequently, we developed a combined model named Geographically Weighted Gradient Boosting (GWRBooST), which integrates GWR and XGBoost. This hybrid model leverages the strengths of both methods, making it capable of accounting for spatial heterogeneity and demonstrating significant advantages in handling nonlinear relationships.
This study makes two core contributions. (1) From a theoretical perspective, our research innovatively introduces the GWRBooST model to explore the nonlinear relationship and spatial heterogeneity between the built environment and elderly bus service usage, thereby enhancing our understanding of the complex and unique travel characteristics of older adults. (2) This study also carries significant practical implications. By revealing the characteristics of elderly bus usage, it lays the groundwork for formulating effective and appropriate public transportation policy measures to improve the travel experiences of older adults, thus promoting the equity and sustainability of public transportation and addressing the trend of population aging more effectively.
2. Literature Review
Due to changes in physiological functions and shifts in social activity needs, the travel patterns of older adults exhibit significant differences compared to other demographic groups. These differences are fundamentally a result of the varying impacts of the built environment on different populations. Furthermore, existing research highlights that travel behavior is characterized by notable spatiotemporal heterogeneity and nonlinearity. To comprehensively understand elderly travel behavior, this section reviews three critical aspects: (1) the unique travel patterns of older adults, (2) the relationship between the built environment and elderly travel behavior, and (3) the necessity of spatial heterogeneity and nonlinearity analysis.
2.1. Travel Patterns of Older Adults
The travel modes of older adults vary across various countries and regions and are primarily shaped by the varying levels of local economic prosperity and social structures. For instance, in Western countries, cars are widely regarded as the most preferred mode of transportation for older adults, with only a minority utilizing public transportation services [
19]. In Australia and the United States, the share of private car travel among older adults reaches 88.6% and 83%, respectively [
20]. Similarly, in most European countries, such as the United Kingdom and Germany, the proportion of public transportation use is less than 20%. Conversely, in some Asian cities, such as Beijing and Changchun in China, which are characterized by low car ownership rates, walking is the primary mode of travel for older adults, followed by public transportation, with cars accounting for less than 1% [
21]. Nonetheless, in Hong Kong and Seoul, older adults predominantly rely on public transportation as their mode of choice [
19,
22]. Cultural attitudes and social norms are the primary reasons for this disparity. In societies where urban development is predominantly centered around car use, automobiles are often regarded as symbols of independence, freedom, and social status. This cultural perception leads older adults to continue relying on private cars for transportation, even as their driving ability and willingness decline [
1,
23]. In contrast, in societies with well-developed public transportation systems, the use of public transit is often encouraged by social norms and is viewed as an environmentally friendly, economical, and efficient mode of travel. This societal consensus motivates older adults to prefer public transportation [
19,
24].
The travel characteristics of older adults differ considerably from those of younger individuals. While the overall travel frequency of older adults is relatively low [
10], their utilization of public transportation is much higher than that of younger adults, particularly among those residing in proximity to transit stations [
20]. For instance, in Hong Kong, China, the Mass Transit Railway (MTR) is the favored mode of transportation for young people, whereas Franchised Buses (FBs) are the preferred choice for older adults [
19]. Notably, recent studies have found that older adults today are more inclined to be mobile than in the past, with their travel frequency almost comparable to that of younger adults [
13,
19]. For example, in the Netherlands, there is no significant age-related difference in travel patterns between older adults and younger adults [
25]. These shifts further emphasize the significance of public transportation in accommodating the travel needs of older adults.
In terms of temporal and spatial distribution, there are also differences in travel patterns between older adults and younger individuals. Studies have shown that, during the morning and afternoon peak commuting hours, older adults make significantly fewer trips, indicating their tendency to avoid traveling alongside younger people. Conversely, older adults are more frequent travelers during the off-peak hours from 10 a.m. to 5 p.m. [
19], and they are more active during the daytime than after dark [
11]. Furthermore, although older adults are more willing to travel on weekdays than on weekends, the temporal trends in their travel remain consistent [
7,
26]. Spatial distribution characteristics constitute another important factor in the analysis of mobility behavior. Research conducted by Shi et al. has revealed that areas with a higher number of older adults trips are concentrated in urban centers [
7], and regions where older adults are more frequently seen have a higher elderly population [
27].
2.2. The Correlation Between the Built Environment and the Travel Behaviors of Older Adults
For an extended time, the built environment has been acknowledged as a pivotal factor in shaping residents’ travel patterns. To evaluate this impact, the 5Ds framework is typically employed, encompassing density, diversity, design, distance to public transit, and destination accessibility [
28]. Among these, density emerges as a critical determinant of residents’ travel behavior, with higher density generally promoting greater use of public transportation compared to lower density [
29]. Nevertheless, for the older adults population, high density may give rise to overcrowding issues, thereby diminishing their willingness to engage in activities [
30].
Land use mix can represent the layout of urban functional facilities and serves as a key driving factor for public transit ridership [
31]. A higher degree of land use mix leads to higher utilization rates of various transportation and land resources, resulting in a more balanced demand for public transportation in both time and space, which helps enhance the attractiveness of the area [
16]. Similar research findings have also been discovered regarding the public transit travel patterns of older adults [
1,
17].
Design elements, including the characteristics of the street network and other micro-level street features within a region, play a positive role in shaping residents’ travel behavior, and this influence also shows a positive correlation among older adults population [
15]. Research indicates that well-connected street networks provide more route options and increase the likelihood of residents using public transportation. At the same time, continuous, safe, and barrier-free street environments can significantly enhance residents’ willingness to use public transportation, particularly for older adults with limited mobility [
32]. However, Satariano et al. argue that overly complex intersections may create inconveniences for older adults due to safety concerns and navigation difficulties [
33].
Distance to public transit, including the distance to bus stops, subway stations, and the nearest transit points, is a crucial factor in motivating residents to use public transportation [
34]. Some studies have shown that convenient transportation services can make it easier for older adults to access these services, thereby enhancing their willingness to travel [
10]. Furthermore, this impact tends to be much greater among older adults population compared to younger groups [
35].
Destination accessibility is also related to public transportation ridership [
29]. Some researchers use the distance to the city center to assess urban accessibility. Due to the agglomeration effect of the city center, the proximity to the city center has a favorable effect on ridership, especially for the older adults population [
36]. POI types, serving as another important indicator for assessing destination accessibility, also exhibit a significant correlation with public transportation ridership [
37,
38]. Studies have found that commercial and public service facilities are POI types that have the greatest impact on the general population [
17]. For older adults, shopping and leisure facilities, as well as healthcare facilities, hold greater sway, particularly green spaces, which show a significant positive relationship with the travel behavior of older adults [
1,
17].
2.3. A Need for Spatial Heterogeneity and Nonlinear Analysis
According to Tobler’s First Law of Geography, all things are related, and the correlations between neighboring entities tend to be stronger [
39]. Consequently, in different geographical spaces, influenced by various factors such as land use and transportation infrastructure, certain characteristics or phenomena may exhibit significant differences. These differences constitute spatial heterogeneity. When studying the built environment and travel behavior, it is vital to consider spatial heterogeneity. It aids in a better understanding of regional disparities, thereby enabling the formulation of targeted policy interventions for the travel behavior of residents. Ignoring it may lead to changes in spatial parameters [
14]. In analytical methods, the GWR model and its extensions, such as the Mixed Geographically and Temporally Weighted Regression (MGWR) and the Geographically and Temporally Weighted Regression (GTWG), are primarily utilized [
14]. For instance, Tu et al. employed the GWR model to assess the relationship between bus ridership and the built environment, uncovering significant differences in the effect of mixed land use on public bus usage between urban centers and suburbs [
40]. Research conducted in Nanjing, China, found that amenities such as shopping and leisure facilities are more attractive to riders in the suburbs compared to the urban center [
40]. Their studies demonstrate that the relationship between the built environment and travel patterns varies across spatial scales. Therefore, identifying this spatial heterogeneity and capturing the spatial variations in the effect of the built environment on travel patterns are of great significance for government agencies to achieve higher public transportation utilization through accurate estimations.
Many studies have revealed the relationship between the built environment and travel patterns, but they are generally based on linear assumptions. However, recent research suggests that the correlation between the built environment and travel is often complex and exhibits irregular nonlinearity [
30]. Recognizing and considering this nonlinear relationship can make research findings closer to real-world conditions. In analytical methods, classical models such as Ordinary Least Squares (OLS) and the Multinomial Logit Model (MNL) are widely used to analyze travel patterns. However, these traditional models have significant limitations in capturing nonlinear relationships between variables. Furthermore, many studies have proven that these traditional models perform less well than machine learning models, such as the XGBoost model, in predicting travel mode choices. In this regard, machine learning models are widely used due to their model fitting and prediction accuracy [
18]. Many scholars have begun to adopt machine learning models to explore the nonlinear relationship between the built environment and bus ridership [
31]. For example, research based in the Washington area found that ridership stops increasing when factors such as population density and land use mix reach certain levels [
41]. Similarly, research conducted in Wuhan, China, found that the threshold values for the impact of land use mix and development intensity on ridership are 0.653 and 0.783, respectively, and once these thresholds are exceeded, their benefits for increasing ridership begin to diminish [
42]. Therefore, identifying the nonlinear connection and threshold influences between the built environment and bus travel is crucial for determining the effective scope of built environment variables and avoiding the negative consequences of overdevelopment. Furthermore, XGBoost can also assess the relative importance of various variables. However, XGBoost has limitations in explaining spatial heterogeneity.
An increasing number of studies have shown that a single modeling approach cannot meet research needs. Therefore, in this study, we have developed a hybrid modeling framework that combines GWR and XGBoost. By leveraging the strengths of GWR in considering spatial heterogeneity and the advantages of XGBoost in handling nonlinear effects, we provide a more comprehensive research framework for grasping the complex connection between the built environment and bus transportation.
2.4. Research Gaps and Our Contributions
In conclusion, we have pinpointed three major research gaps in this domain. Firstly, despite buses increasingly serving as a vital means of transportation for older adults, there are limited studies investigating their use among this population. Secondly, existing research primarily examines the relationship between younger groups such as commuters, and the built environment. However, given the shifts in travel needs among older adults, the specific differences between them are unclear. Lastly, existing research has demonstrated spatial heterogeneity and nonlinearity between the built environment and travel, but existing methods have failed to explore these two relationships simultaneously.
To address these research gaps, we developed a combined model, GWRBooST, which integrates GWR and XGBoost, to explore the spatially heterogeneous and nonlinear impacts of the built environment on bus ridership, including both older adults and younger adults.
3. Study Design
To further investigate the spatial heterogeneity and nonlinear effects of the built environment on public transport use among older adults, this section is divided into three parts. First, the Study Area section introduces the geographical context of the research and justifies the selection of the region based on its relevance to the research objectives. Second, the Methodology section elaborates on the analytical framework, including the GWRBoost model, which integrates spatial heterogeneity and nonlinear effects to systematically address the research questions. Finally, the Data and Variables section details the data sources and variable selection.
3.1. Study Area
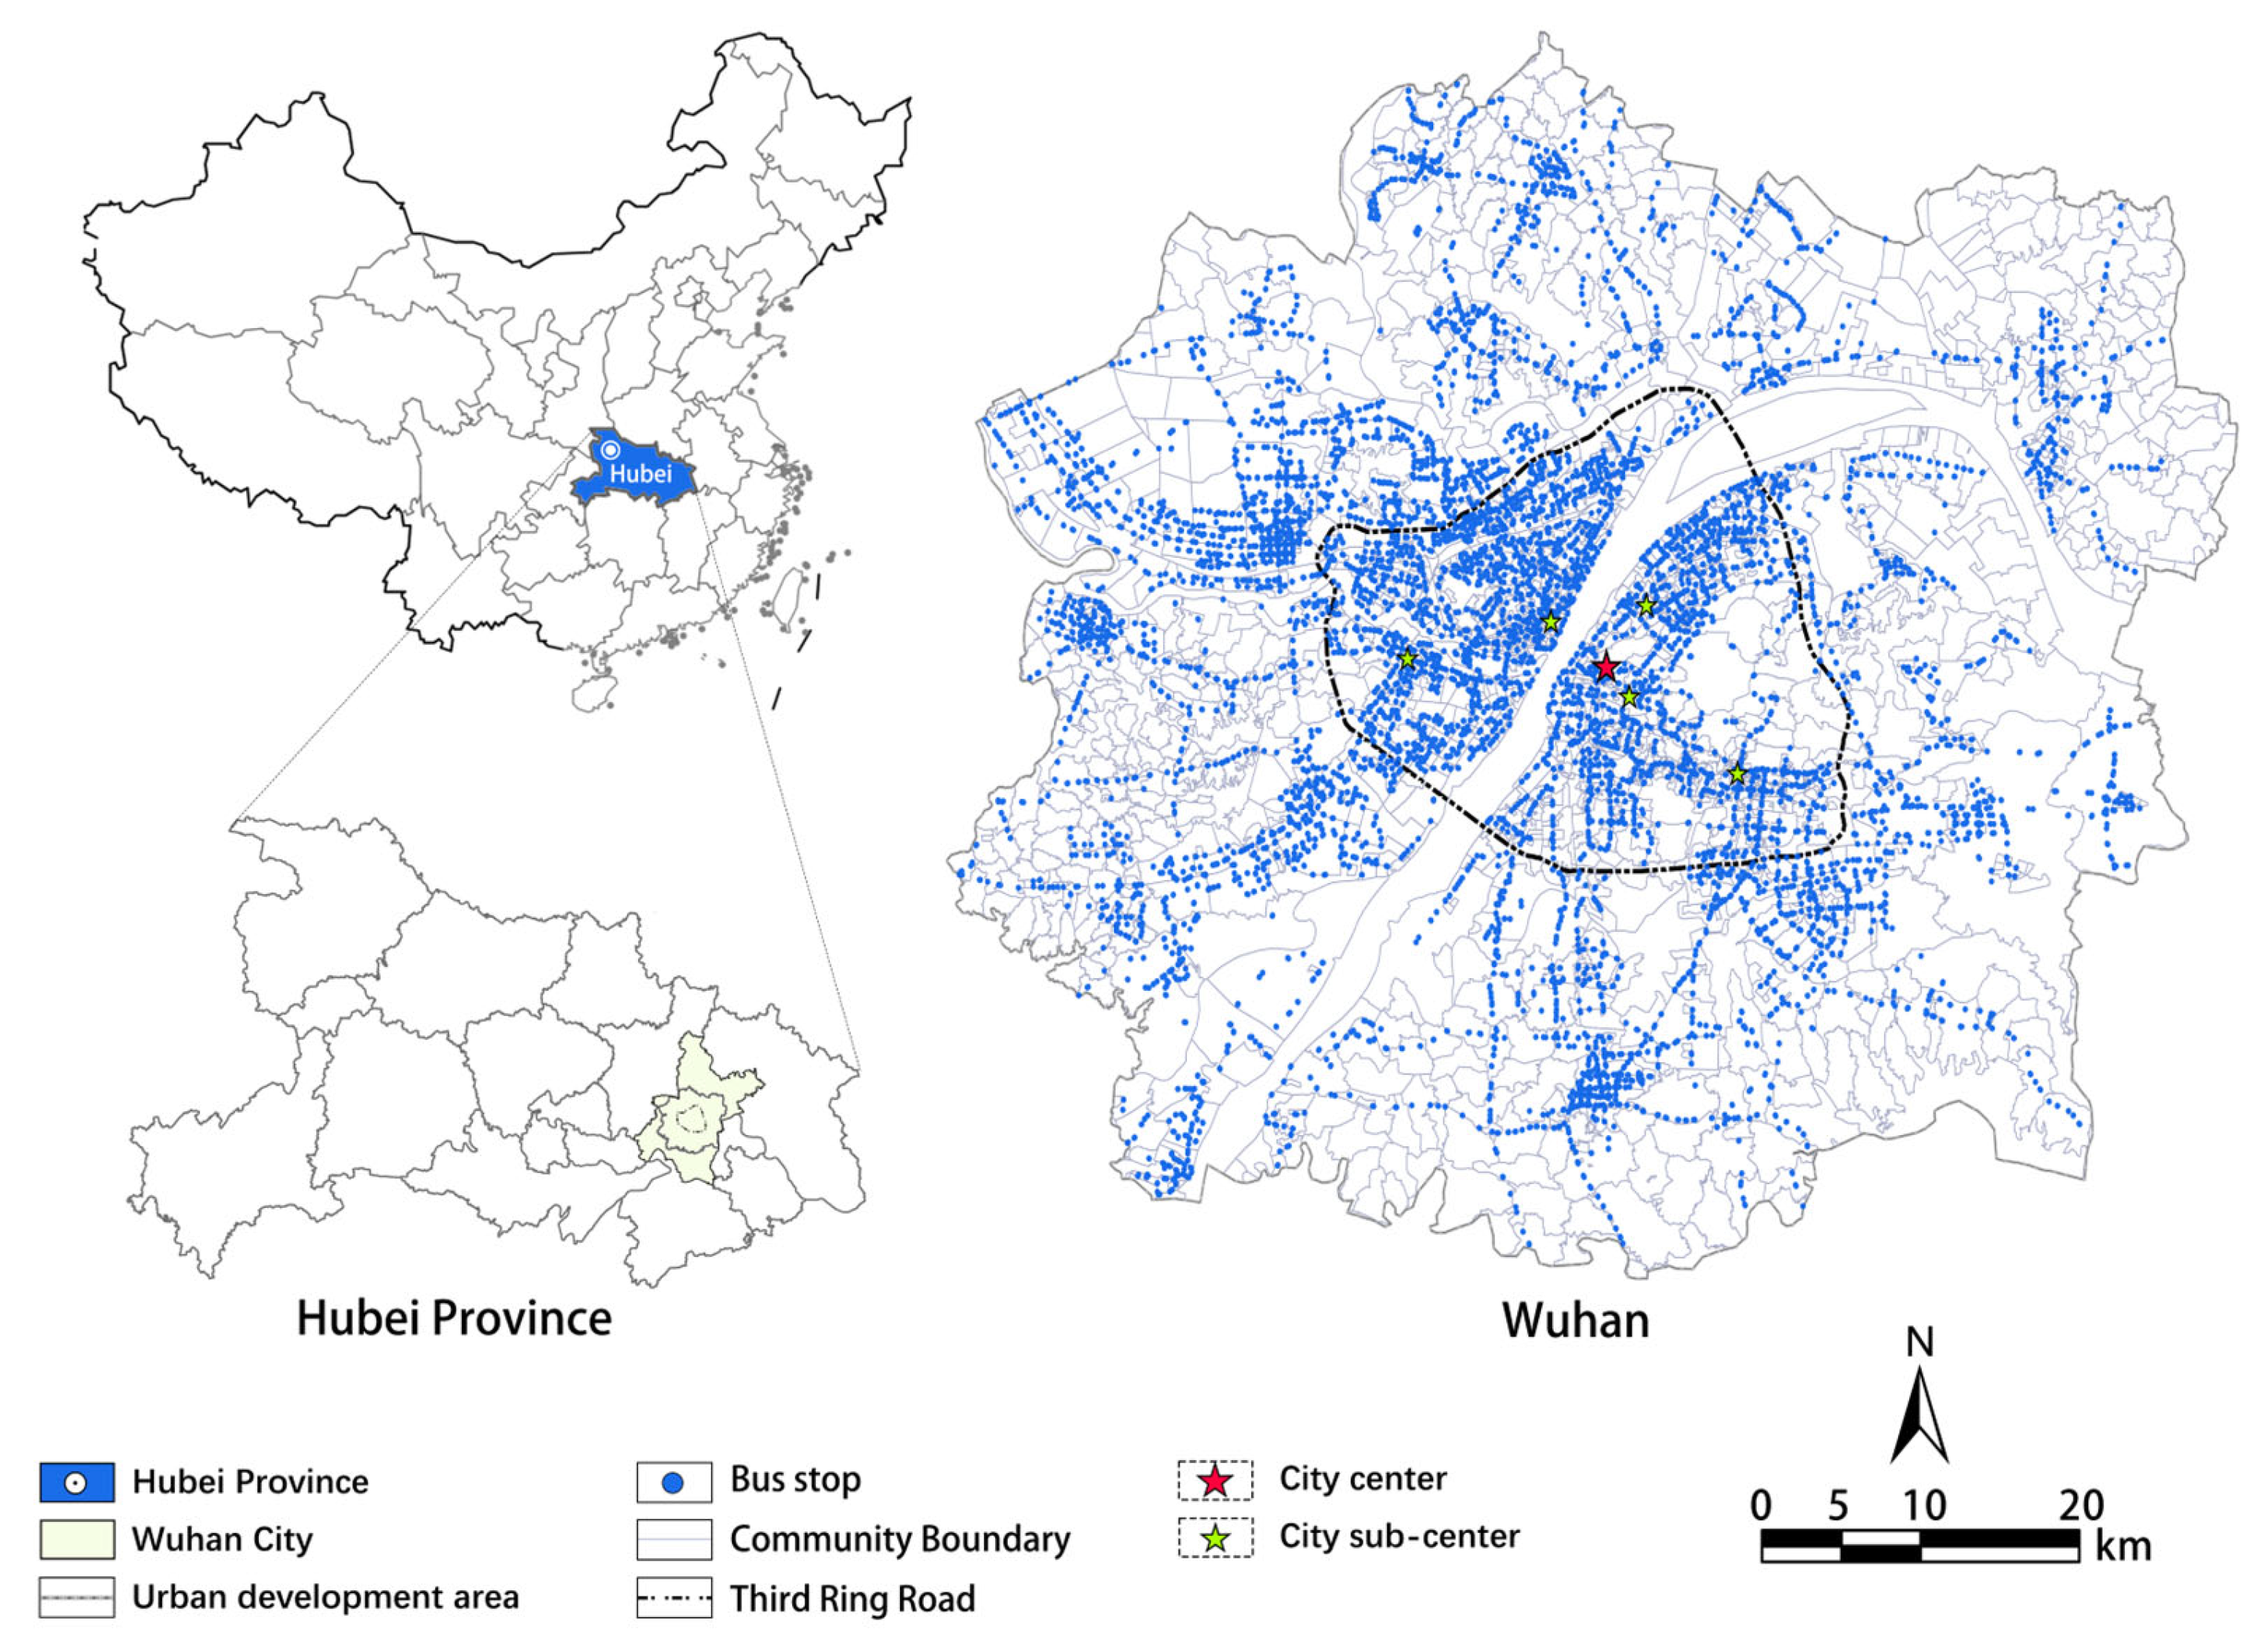
Wuhan is the political, economic, and cultural center of Hubei Province. Its unique geographical layout of “two rivers and three towns” has shaped Wuhan’s diversified travel distribution pattern. Wuhan is currently facing an increasingly severe issue of population aging. According to statistics, by the end of 2022, the population aged 60 and above in Wuhan was 2.1 million, accounting for 22% of the permanent resident population, which is higher than the national average of 19.8%. Wuhan boasts a highly developed public transportation system. By the end of 2023, Wuhan had 773 bus routes, 188 bus depots, and a total operating length of 13,699 km. Buses play a significant role in the public transportation network, accounting for 24% of total public transportation passengers. Currently, seniors aged 65 and above in Wuhan can apply for an elderly privilege card, which entitles them to 730 free public transportation services annually, making public transit the preferred travel mode for older adults in Wuhan. The travel behavior of older adults has become a significant component influencing urban transportation systems. Therefore, in-depth research into their travel patterns is of great importance for optimizing urban design, enhancing the quality of life for older adults, and building age-friendly urban environments.
Our research focuses on the community level (
Figure 1). Firstly, residential areas in China often serve as crucial anchors for different types of activities among diverse populations. Different communities not only vary in their built environments but also in their locations and social contexts, and these differences profoundly influence residents’ travel behaviors [
43]. Taking Wuhan as an example, the Jianghan Road community in Hankou, located in the city center with dense commercial facilities, encourages short-distance walking and public transit use. In contrast, the East Lake High-Tech Zone in Wuchang, situated on the urban periphery, features a separation of residential and work areas, leading to greater reliance on private cars and long-distance commuting. This diversity offers a valuable empirical context for studying how the built environment shapes travel behavior. Secondly, compared to rail-based transportation, bus services have broader spatial coverage and can meet the travel needs of a wider range of communities [
44]. Therefore, neglecting the intrinsic link between community planning and bus usage may significantly hinder our ability to achieve more sustainable and equitable urban transportation, necessitating further investigation.
3.2. Research Methodology
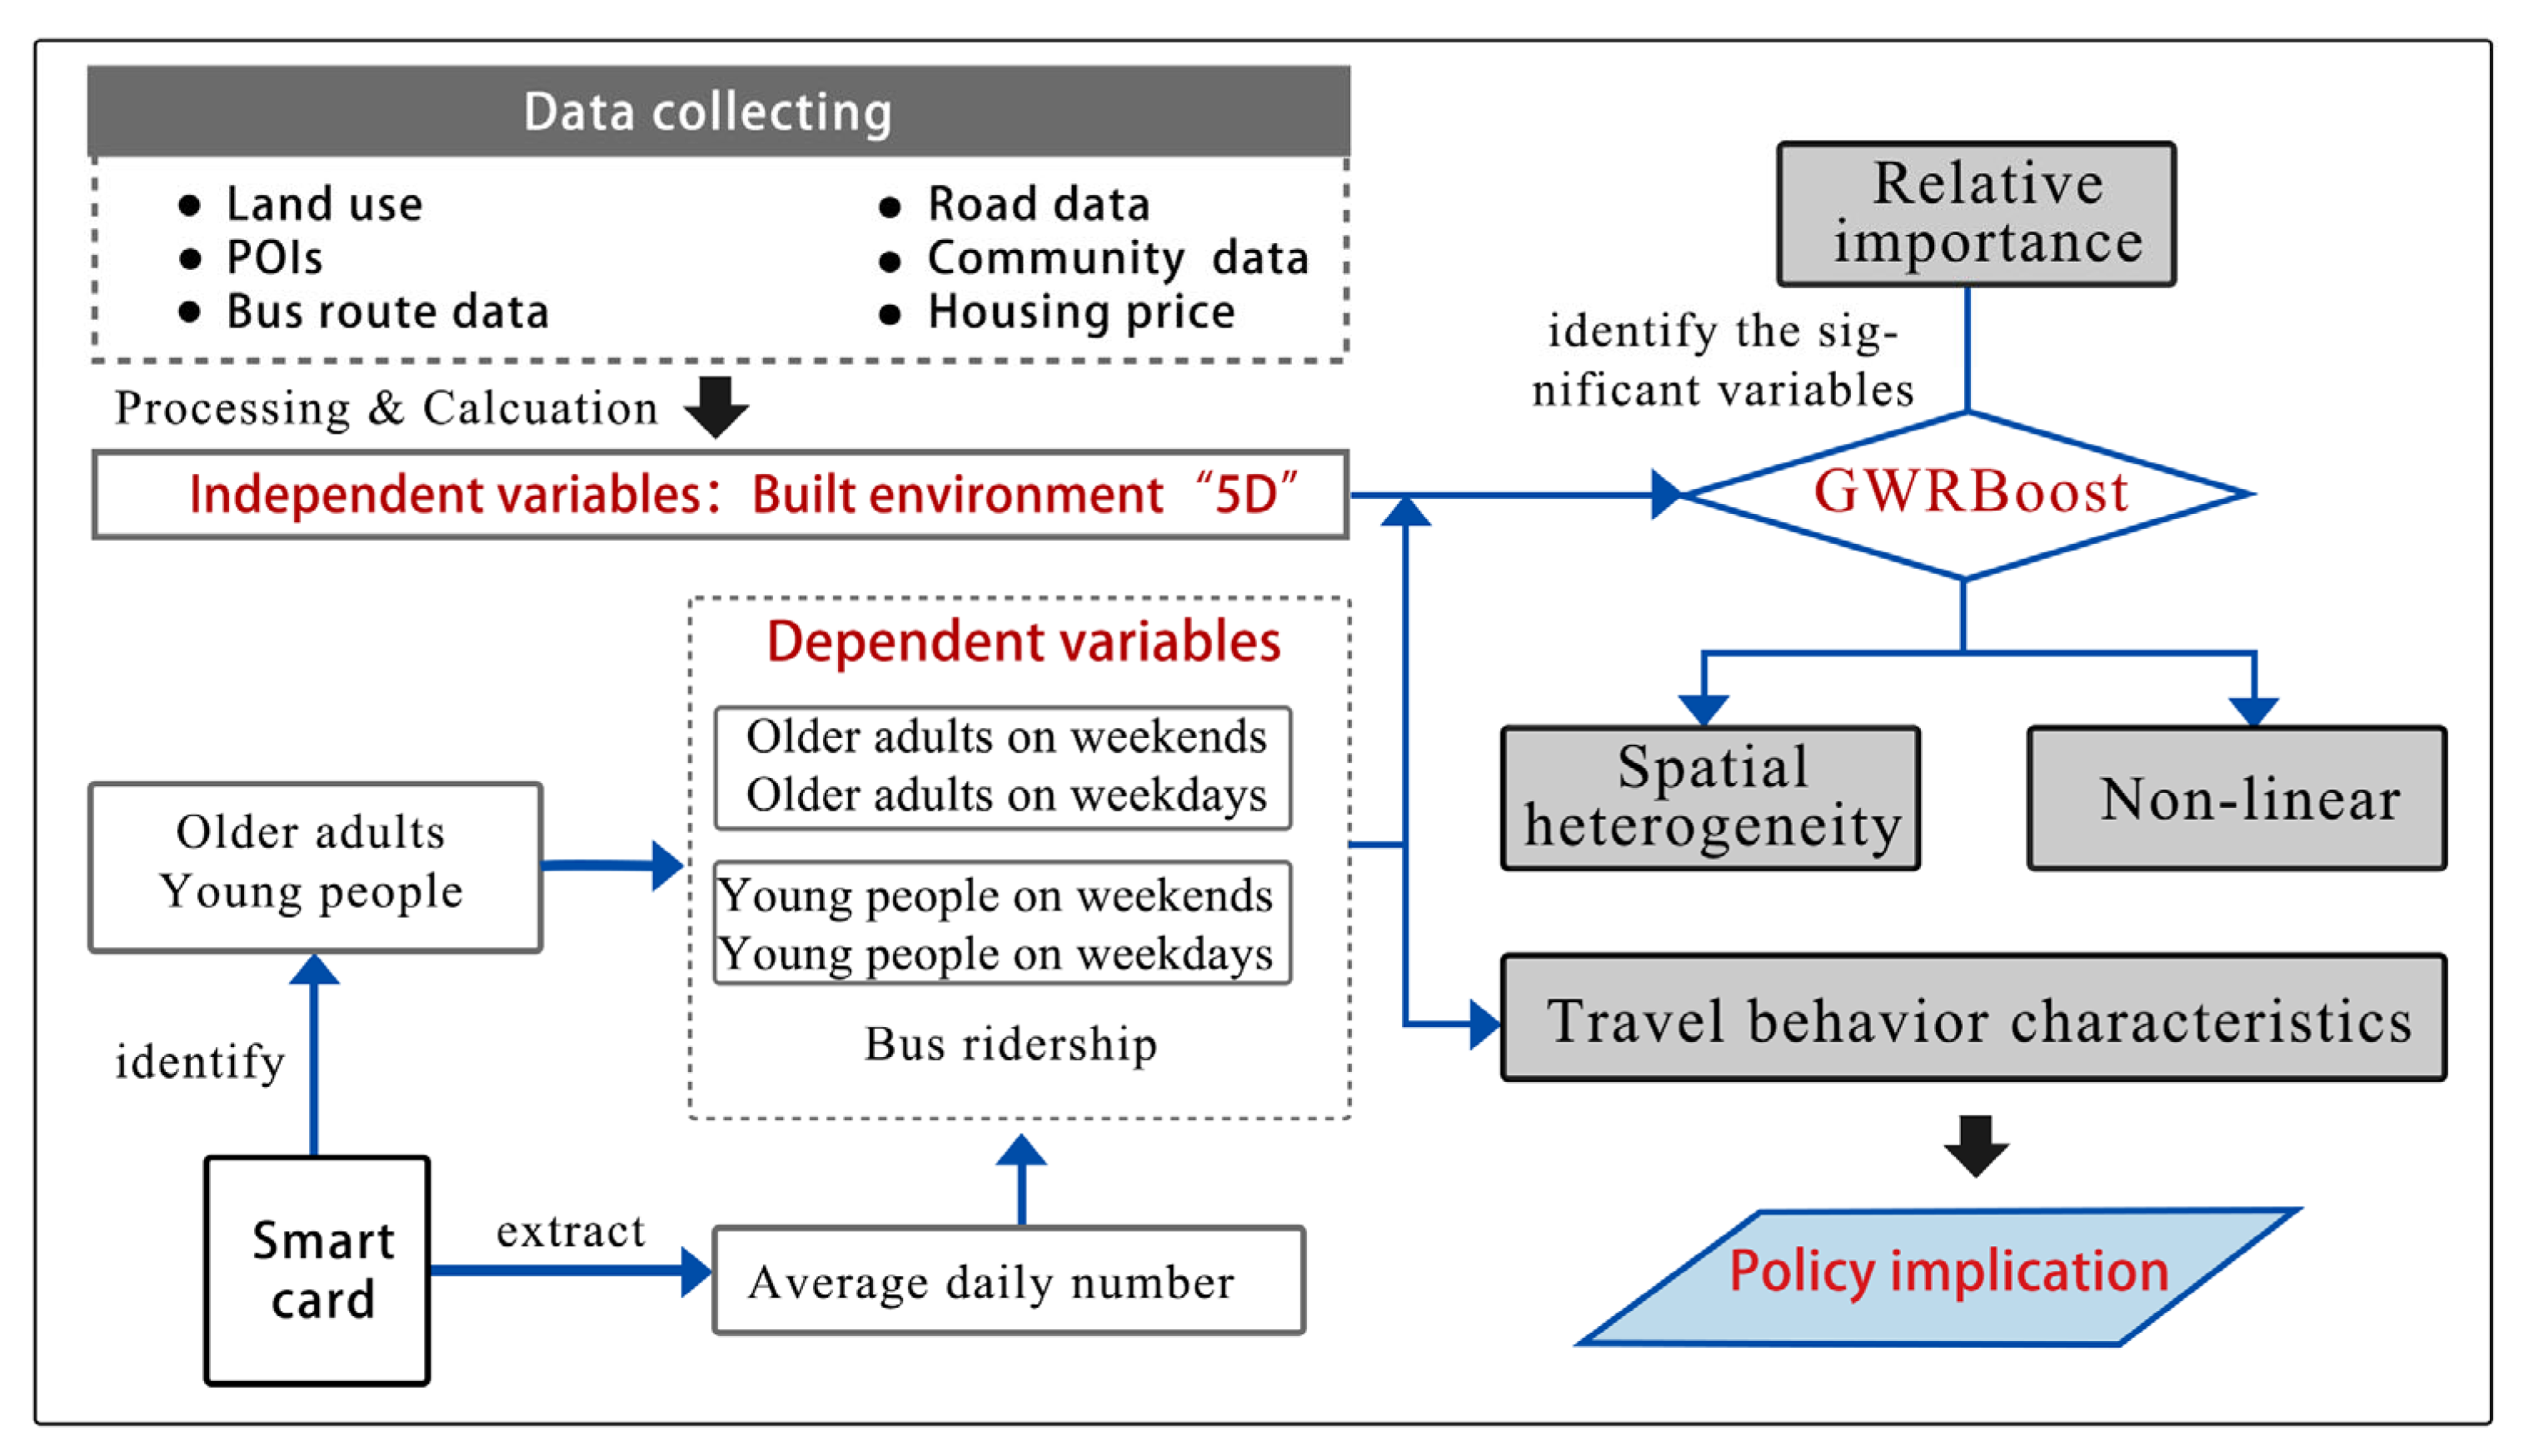
This study utilizes multi-source data, including land use, road networks, and POIs, to construct an independent variable system based on the “5D” elements. Simultaneously, we conducted an in-depth analysis of public transportation data recorded by smart cards, identifying two groups—older adults and younger individuals—and specifically extracted data for weekdays and weekends as dependent variables. This approach aims to comprehensively capture the travel patterns and spatiotemporal variations of different groups (
Figure 2).
XGBoost (eXtreme Gradient Boosting), as an optimized algorithm within the Gradient Boosting Decision Tree (GBDT) framework, employs Classification and Regression Trees (CARTs) as its base learners. By constructing multiple decision trees, XGBoost can significantly enhance classification performance and bolster its modeling capability for nonlinear relationships. Compared to other gradient boosting models and some deep neural networks, XGBoost demonstrates superior fitting effects, particularly when modeling heterogeneous data. However, in datasets with spatial effects, complex nonlinear relationships often exist between features, which may be difficult to capture through simple decision tree splitting rules. GWR exhibits notable advantages in analyzing spatial heterogeneity, as it allows data from different locations to have distinct regression coefficients, thereby more accurately capturing and describing spatial variations and differences. Nevertheless, GWR falls short when dealing with nonlinear relationships. To address this issue, some studies have attempted to include spatial features as input features in XGBoost models, yet these approaches fail to fully exploit the spatial positional information implicit in the existing features. Other studies, inspired by ensemble learning principles, utilize GWR to construct additive models to improve fitting accuracy. Motivated by the existing work, we propose a combined model, GWRBoost, which integrates GWR and XGBoost. The core of this model lies in using GWR as the base learner and incorporating the idea of the gradient boosting algorithm to construct a combined model through iterative residual fitting, enabling the simultaneous capture of nonlinear relationships and spatial heterogeneity. Compared to other hybrid models (e.g., GWR-SVM), GWRBoost offers higher computational efficiency and predictive accuracy, making it particularly suitable for analyzing large-scale spatial data. Specifically, GWR can precisely fit the spatial variation characteristics between dependent and independent variables within a region through linear regression, with its formula expressed as follows:
where
denotes the observation number,
is the corresponding dependent variable,
represents the value of the predictor variable for feature
at location
,
represents the spatially heterogeneous regression coefficients, and
is the random term capturing the unexplained part of the model. The calculation of
is achieved through weighted least squares (WLS) method, specifically:
where
represents the observed values and
is the spatial weight matrix estimated by the Gaussian kernel density function. The essence of the GWR model remains a linear regression, which cannot enhance fitting accuracy through local optimization. To address this limitation, GWRBoost improves upon it by performing multiple fits. Assuming that the result of a single GWR fit is expressed as follows:
In subsequent fits, the model will use the residuals from the previous round to update the predicted values. Therefore, the result of the
m-th round is as follows:
Substituting into Formula (1), it can be expressed as follows:
Since the base learner is GWR, the objective function of GWRBoost is the mean squared error between the predicted values and the observed values. Within the framework of gradient boosting, the first-order derivative indicates the direction of model optimization, while the second-order derivative reflects the step size for updating the model’s regression coefficients. The first-order derivative gradient
and the second-order derivative (Hessian)
of the GWRBoost objective function can be expressed as follows, respectively:
where
is the learning rate and
is a constant, ensuring a fixed step size for the model in each iteration; meanwhile,
represents the residual between the predicted value and the observed value. This mechanism enables GWRBoost to continuously fit the residuals between the predicted and observed values with a preset fixed step size, thereby ensuring rapid convergence of the model and improving prediction accuracy. To prevent overfitting, GWRBoost provides multiple parameters for flexible control of the fitting process, such as the learning rate, the maximum number of learners, and the threshold for minimum residual improvement. Additionally, the model can automatically stop fitting based on criteria such as cross-validation or the Akaike Information Criterion (AIC), guiding the stopping decision by balancing model complexity (cost) and model fit (benefit) comprehensively, further enhancing the model’s stability and reliability.
3.3. Data and Variables
The bus passenger data used in this study originate from a smart card dataset collected over a continuous week in March 2023, provided by Wuhan Transportation Strategy and Development Research Institute, represents the flow of traffic arriving at the neighborhood. The detailed information captured in the original smart card dataset includes card identification numbers, user types, and station ID numbers. Based on card types, we classified passengers into two groups: seniors and young adults. Since the bus data used in this study only includes boarding records and lacks alighting data, it is not possible to track complete travel routes or calculate the travel time for each trip. Nevertheless, the boarding data can still effectively reflect the departure times, spatial distribution of boarding stations, and travel frequency of older adults. To ensure data quality, we removed incomplete or erroneous records (e.g., transactions with missing station IDs or timestamps) and aggregated the data at the community level to align with the geographic scope of the study. According to statistics, during weekdays, the average passenger volume for seniors in each community reached 3924 trips, decreasing to 1341 trips on weekends; for young adults, the average passenger volume was 6408 trips on weekdays and 2122 trips on weekends. In this study, we used communities as the basic research units and took the bus passenger volume per unit area as the dependent variable.
When examining the relationship between built environment characteristics and bus passenger volumes among seniors and young adults, we evaluated the 5Ds elements of built environment attributes within communities (
Table 1). Specifically, we quantified density using the community’s floor area ratio, assessed diversity through land use mix, and measured design based on the density of road intersections and road networks. In terms of destination accessibility, we gauged urban-level accessibility by the distance to the city center. Additionally, given Wuhan’s multi-centered urban structure, we also examined the distance to secondary city centers. Meanwhile, to more comprehensively reflect the convenience of residents’ daily lives, we incorporated the number of important facilities such as healthcare, education, and employment within communities as evaluation indicators, thereby gaining a deeper understanding of the potential impact of the built environment on residents’ travel choices. Regarding distance to public transportation, we measured the number of bus stops and subway stations within communities, as well as the distance to the nearest bus stop and subway station. Furthermore, this study used the average housing price within communities as a proxy variable for socio-economic status.
4. Results
This section presents the key findings of our study, which are organized into four subsections to systematically address the research objectives. First, we analyze travel characteristics, including travel frequency, temporal distribution characteristics, and spatial patterns, to provide a comprehensive overview of older adults’ travel behavior. Next, we examine the relative importance of different factors influencing travel decisions. Then, we explore the spatial heterogeneity of these factors across the study area. Finally, we discuss the nonlinear relationships between built environment variables and travel behavior.
4.1. Travel Behavior Characteristics
4.1.1. Travel Frequency
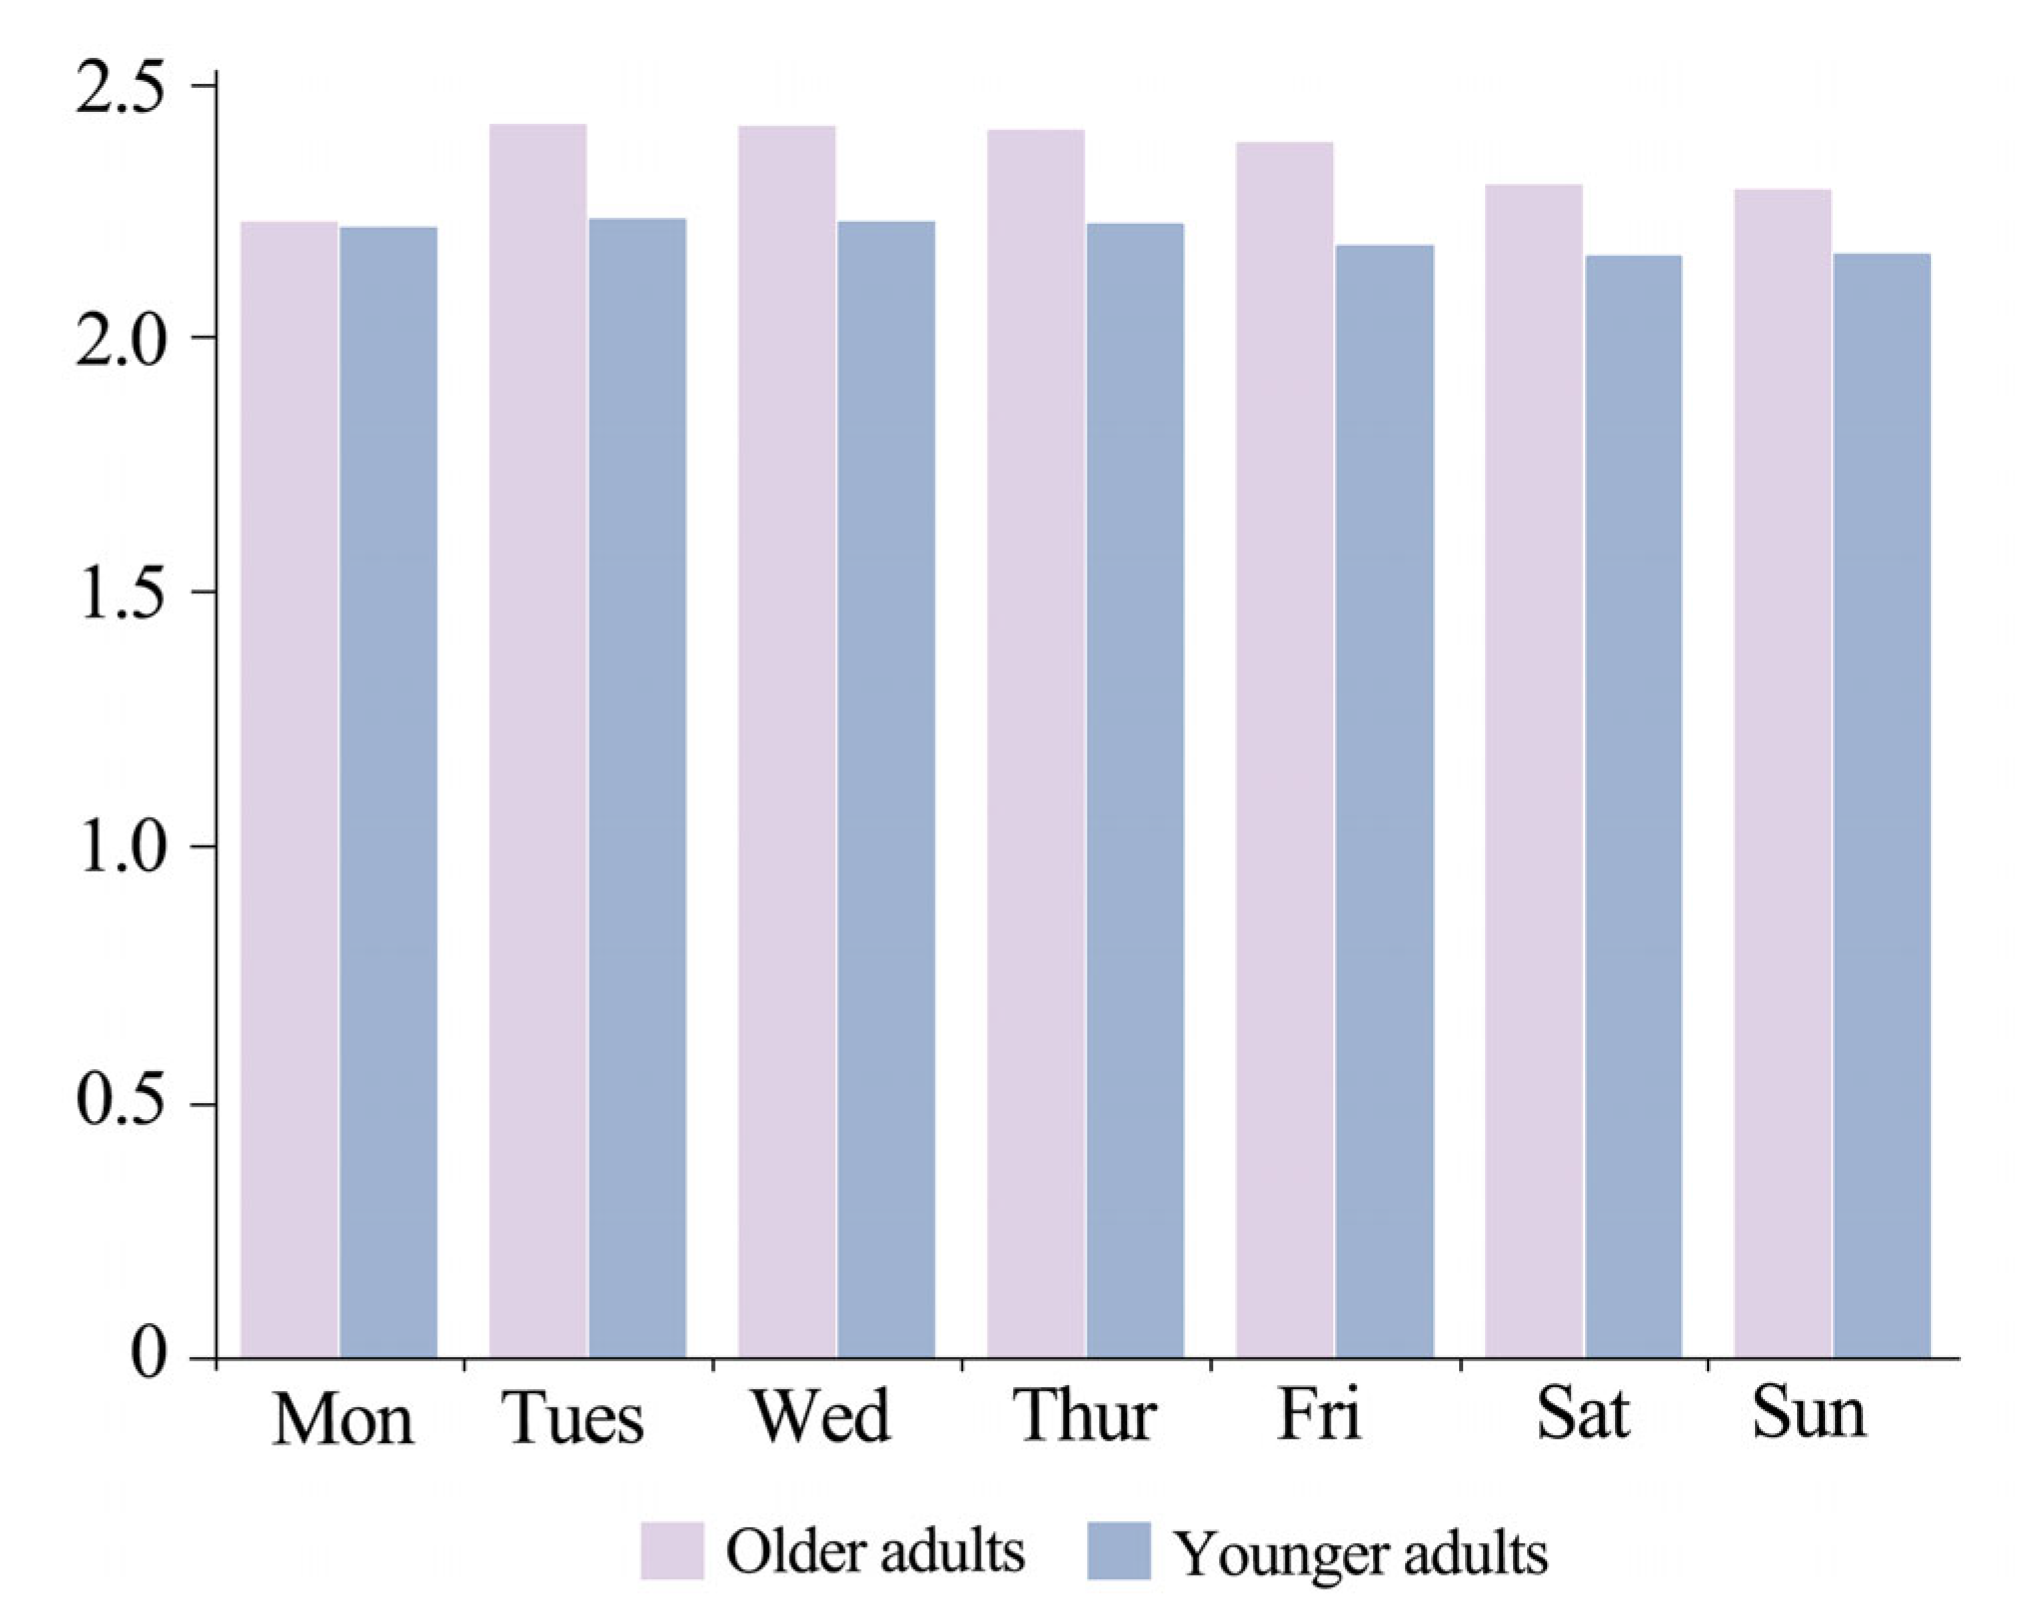
Travel frequency refers to the number of times an individual takes the bus each day.
Figure 3 compares the travel frequency between older adults and young people, revealing that the travel frequencies of older adults and younger adults are quite similar. Specifically, older adults have a travel frequency of 2.37 times per day on weekdays and 2.30 times per day on weekends, both higher than the frequencies of 2.22 times per day and 2.17 times per day for the young. This contrasts with some previous studies but aligns with recent research findings, suggesting that with improved physical health and aspirations for a higher quality of life, today’s older adults are more willing to move around than their predecessors [
13]. Notably, this is in contrast to the results for subway travel frequency among older adults and younger adults [
12], highlighting the importance of buses for older adults’ travel. In addition, both older adults and younger adults have higher travel frequencies on weekdays than on weekends, reflecting the different impacts of daily commuting and leisure activities on travel demand.
4.1.2. Temporal Distribution Characteristics
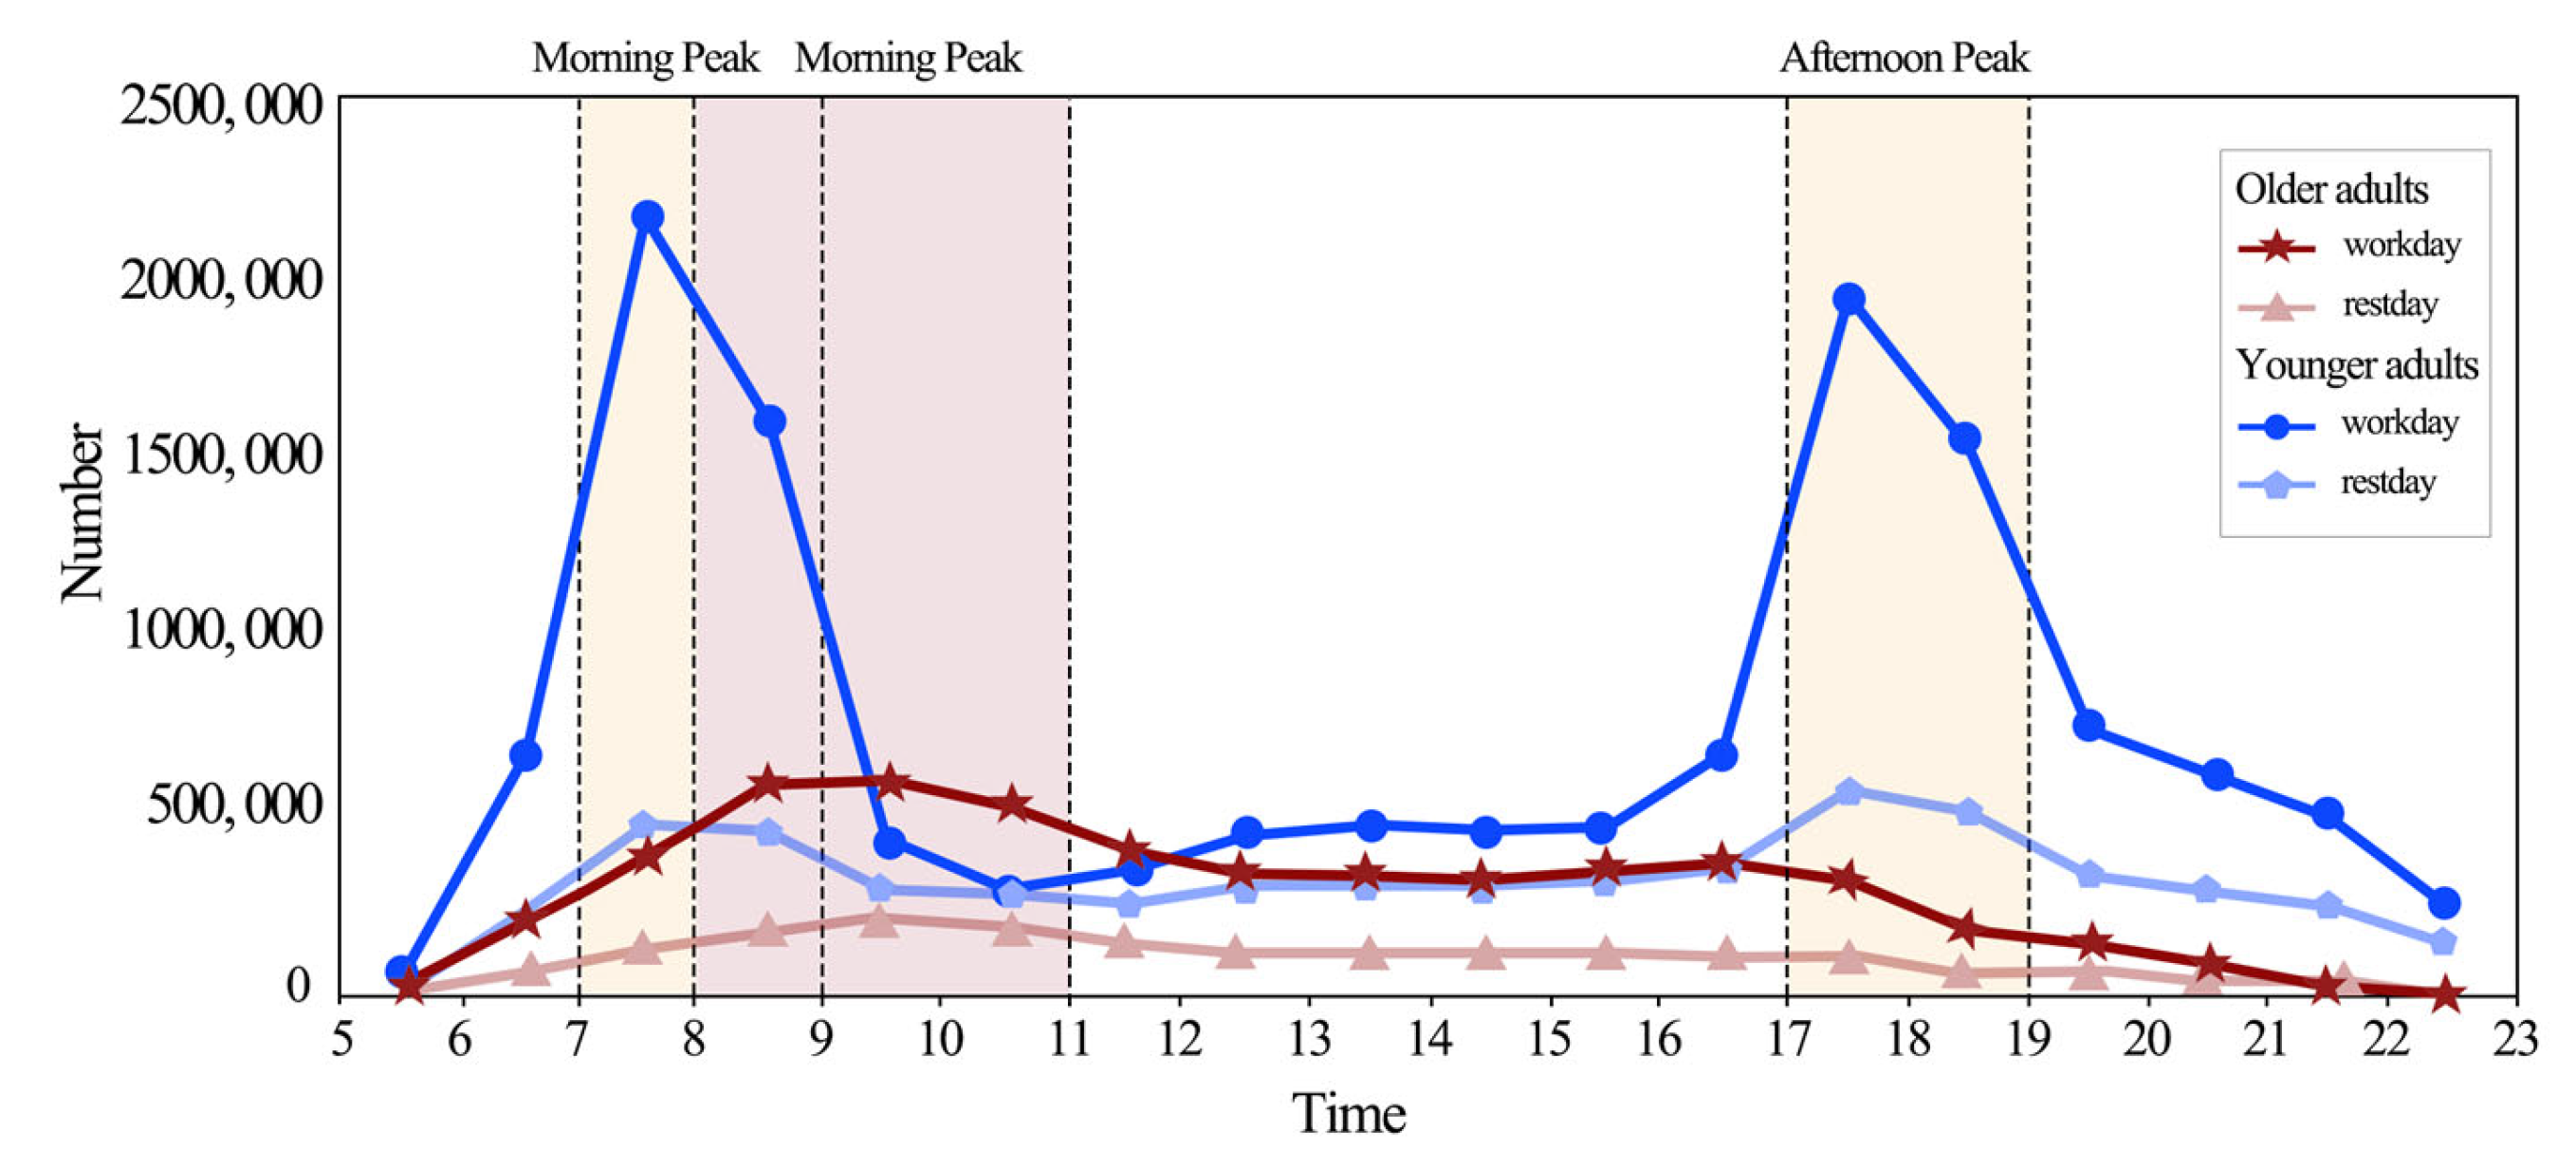
Figure 4 demonstrates the travel distribution characteristics of older adults and younger adults across different time periods, highlighting the significant differences in their daily travel patterns. For young adults, weekday travel exhibits clear morning and evening peaks: the morning peak occurs between 7:00–9:00, and the evening peak between 17:00–19:00, with fewer trips during other time periods. On weekends, the number of trips decreases, especially during the morning and evening peaks. In contrast, the travel time distribution of older adults remains relatively stable, with an overall higher willingness to travel on weekdays compared to weekends. Their morning peak is broader, spanning from 8:00–11:00, overlapping with the young adults’ morning peak for one hour; however, there is no significant peak in the afternoon, indicating that older adults’ travel activities are more dispersed and flexible.
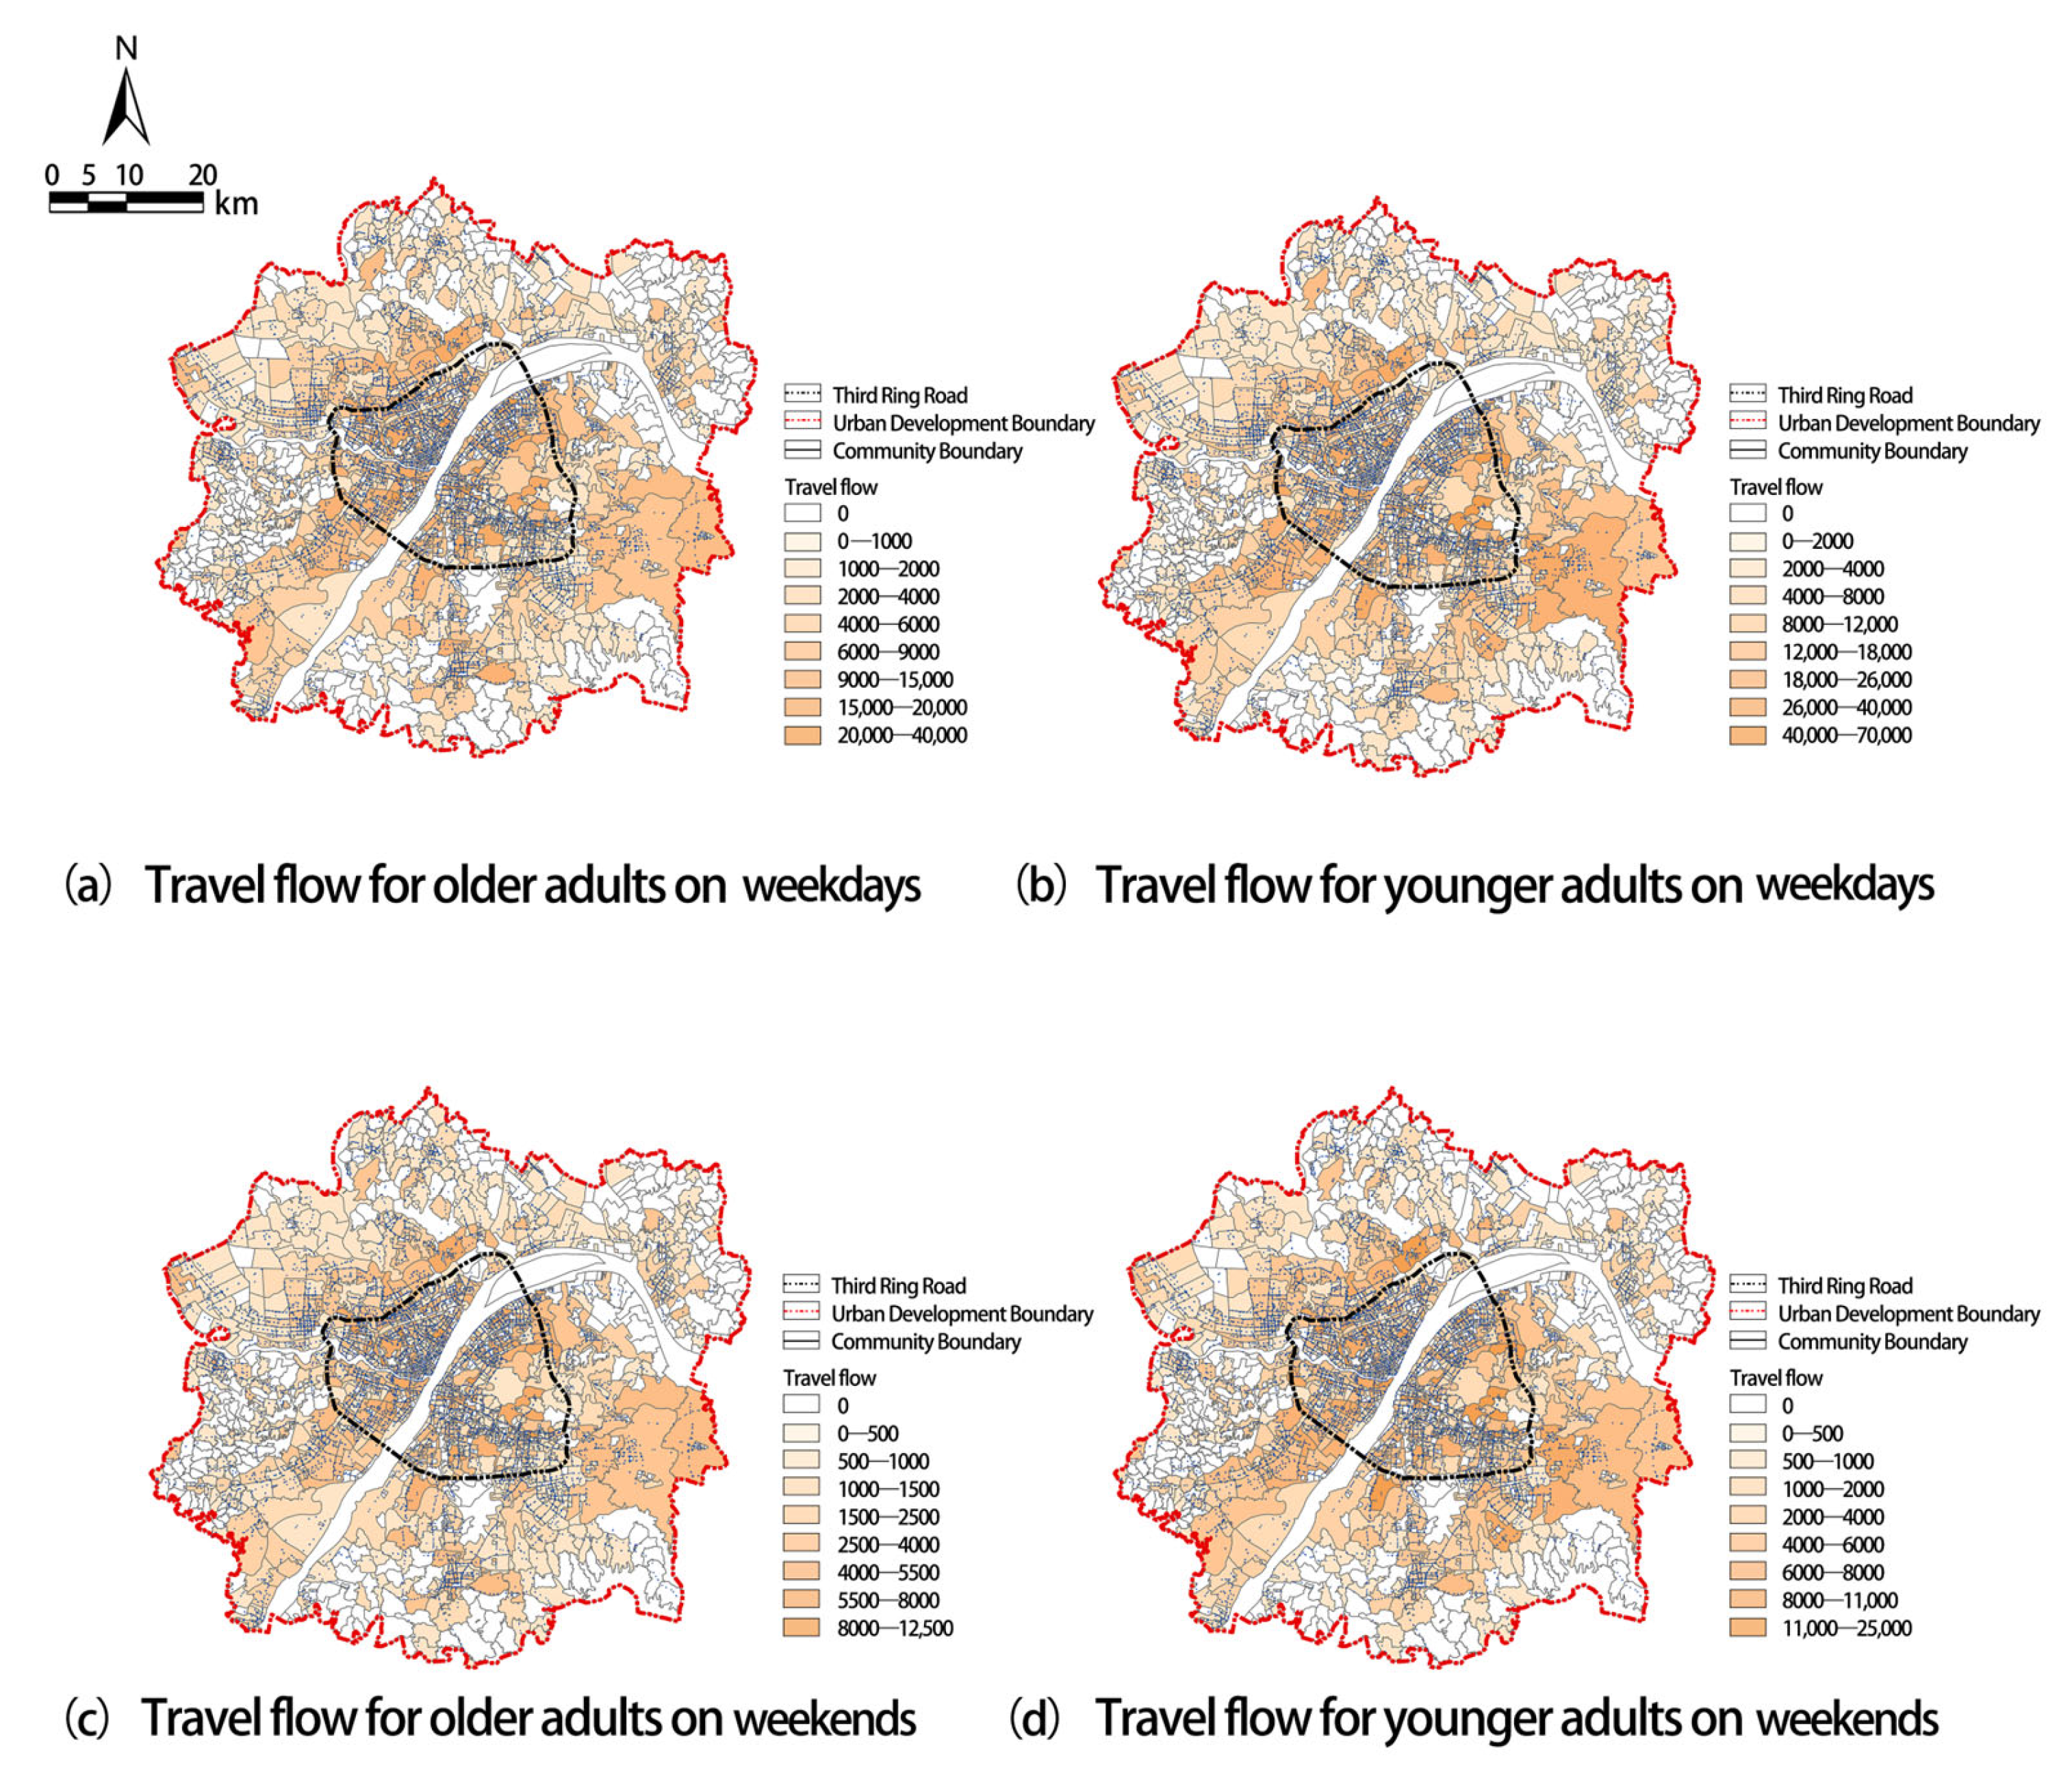
4.1.3. Spatial Distribution Characteristics
Figure 5 displays the spatial distribution of travel for both older adults and younger adults on weekdays and weekends. Overall, the travel patterns of older adults and young show similarities, with the most frequent travel activities concentrated within the Third Ring Road and distributed in an axial belt along the east and west banks of the Yangtze River, aligning with the city’s main development direction. Outside the Third Ring Road, areas with higher travel volumes also extend to the Hannan District, Hongshan District, and the Caidian area along the Yangtze River. This distribution pattern is closely related to the number of bus stops in Wuhan City. Additionally, although the travel volume of older adults on weekends is lower than that on weekdays, the spatial distribution patterns between the two remain basically consistent.
During weekdays, there is an overlap in the morning peak travel times between older adults and young people between 8:00 and 9:00. To gain a deeper understanding of this difference, we conducted a comparative analysis of their spatial distribution of travel during this time period. As shown in
Figure 6, for both older adults and young, the hotspots for bus travel are concentrated within the city’s Third Ring Road and along its corridors, exhibiting a pattern of point-like distribution. On this basis, there are certain differences in their specific distributions. Specifically, compared to the young, older adults demonstrate a stronger willingness to travel by bus within the Third Ring Road, and also show higher travel activity in some communities in the Jiangxia District and Hannan District.
4.2. The Relative Importance of Independent Variables
Figure 7 displays the ranking of the significance of independent variables in predicting bus ridership among older adults and young individuals, with the cumulative importance of all variables being 100%. The study found that there are significant differences in the impact of the built environment on bus ridership between older adults and young individuals. Precisely, the proximity to the nearest bus stop emerges as the most critical factor for predicting weekday bus usage among older adults, constituting 44.36% of its relative importance. In contrast, its relative importance for predicting young ridership is lower, at 6.99%. This is because compared to young people, older adults are more sensitive to travel distances due to decreased physical mobility [
45]. A survey in Florida revealed that bus usage within 200 m of a bus stop is three times that within 400 m, suggesting that when the walking distance increases by 200 m, the likelihood of older adults using public transportation decreases by approximately 70% [
46]. Science, education, and cultural facilities have a significant impact on weekday passenger volumes for both young and older adults, ranking second in terms of relative importance with percentages of 8.60% and 7.54%, respectively. This is because on weekdays, both older adults and younger adults may use public transportation for transporting schoolchildren to and from school [
47,
48]. According to the China Health and Retirement Longitudinal Study, 47.62% of older adults live with at least one child, and this family structure, where older adults live with and care for their grandchildren, is very common in China [
49]. It is noteworthy that scenic and tourist facilities play a more prominent role in the weekday bus travel of older adults compared to young people. This is because after retirement, older adults have more discretionary time for leisure and social activities [
22]. Scenic and tourist facilities, including parks, recreational squares, and other entertainment venues, precisely meet the needs of older adults for a rich leisure life. For young people, street density has the highest relative importance for weekday bus travel, accounting for 17.08%, whereas for older adults, its importance is very low, at only 0.77%. A higher street density may enhance street connectivity and shorten travel distances. However, research conducted by Borst et al. has found that older adults do not always opt for the shortest route, especially in high-density street networks, where their ability to accurately identify paths may be limited. Furthermore, compared to older adults, the number of companies and businesses and the distance to the nearest subway station hold greater relative importance for young people, but have the lowest impact on older adults. This is because, for most older adults, commuting and work-related travel diminish after retirement, while entertainment-related activities increase [
21,
22]. Meanwhile, for young people, subway stations, serving as transfer hubs, can effectively encourage them to use buses for transfers; however, this advantage is less pronounced among older adults. Older adults tend to prefer direct and convenient bus services to avoid the additional complexity and inconvenience of transfers.
Regarding the variations between weekdays and weekends, the greatest increase in relative importance is observed for shopping amenities among elderly bus riders. Meanwhile, scenic spots and street density exhibit a significant decline in their relative importance for older adults travel during weekdays and weekends. This shift may stem from the fact that older adults are more likely to accompany their families for shopping and other activities on weekends, thereby reducing the influence of street density and scenic spots on their choice of public transport and placing greater emphasis on the convenience of shopping facilities. In stark contrast to older adults, the relative importance of the number of business facilities undergoes the greatest decrease for young people’s weekday–weekend public transport choices. Similarly, the relative importance of shopping facilities is seen to increase the most for young people during weekends. This underscores the difference in travel purposes between weekdays and weekends for young people: on weekdays, influenced by rigid commuting demands, the relative importance of the number of businesses significantly surpasses other variables, whereas on weekends, the demand for shopping facilities increases substantially [
10]. Furthermore, compared to older adults, the impact of the built environment on weekday–weekend variations in bus ridership is more subdued among young people. This finding suggests that, due to changes in travel demands and physical limitations, older adults are more likely to exhibit variability due to built environment factors in their use of public transport [
47].
4.3. Spatial Heterogeneity of Influencing Factors
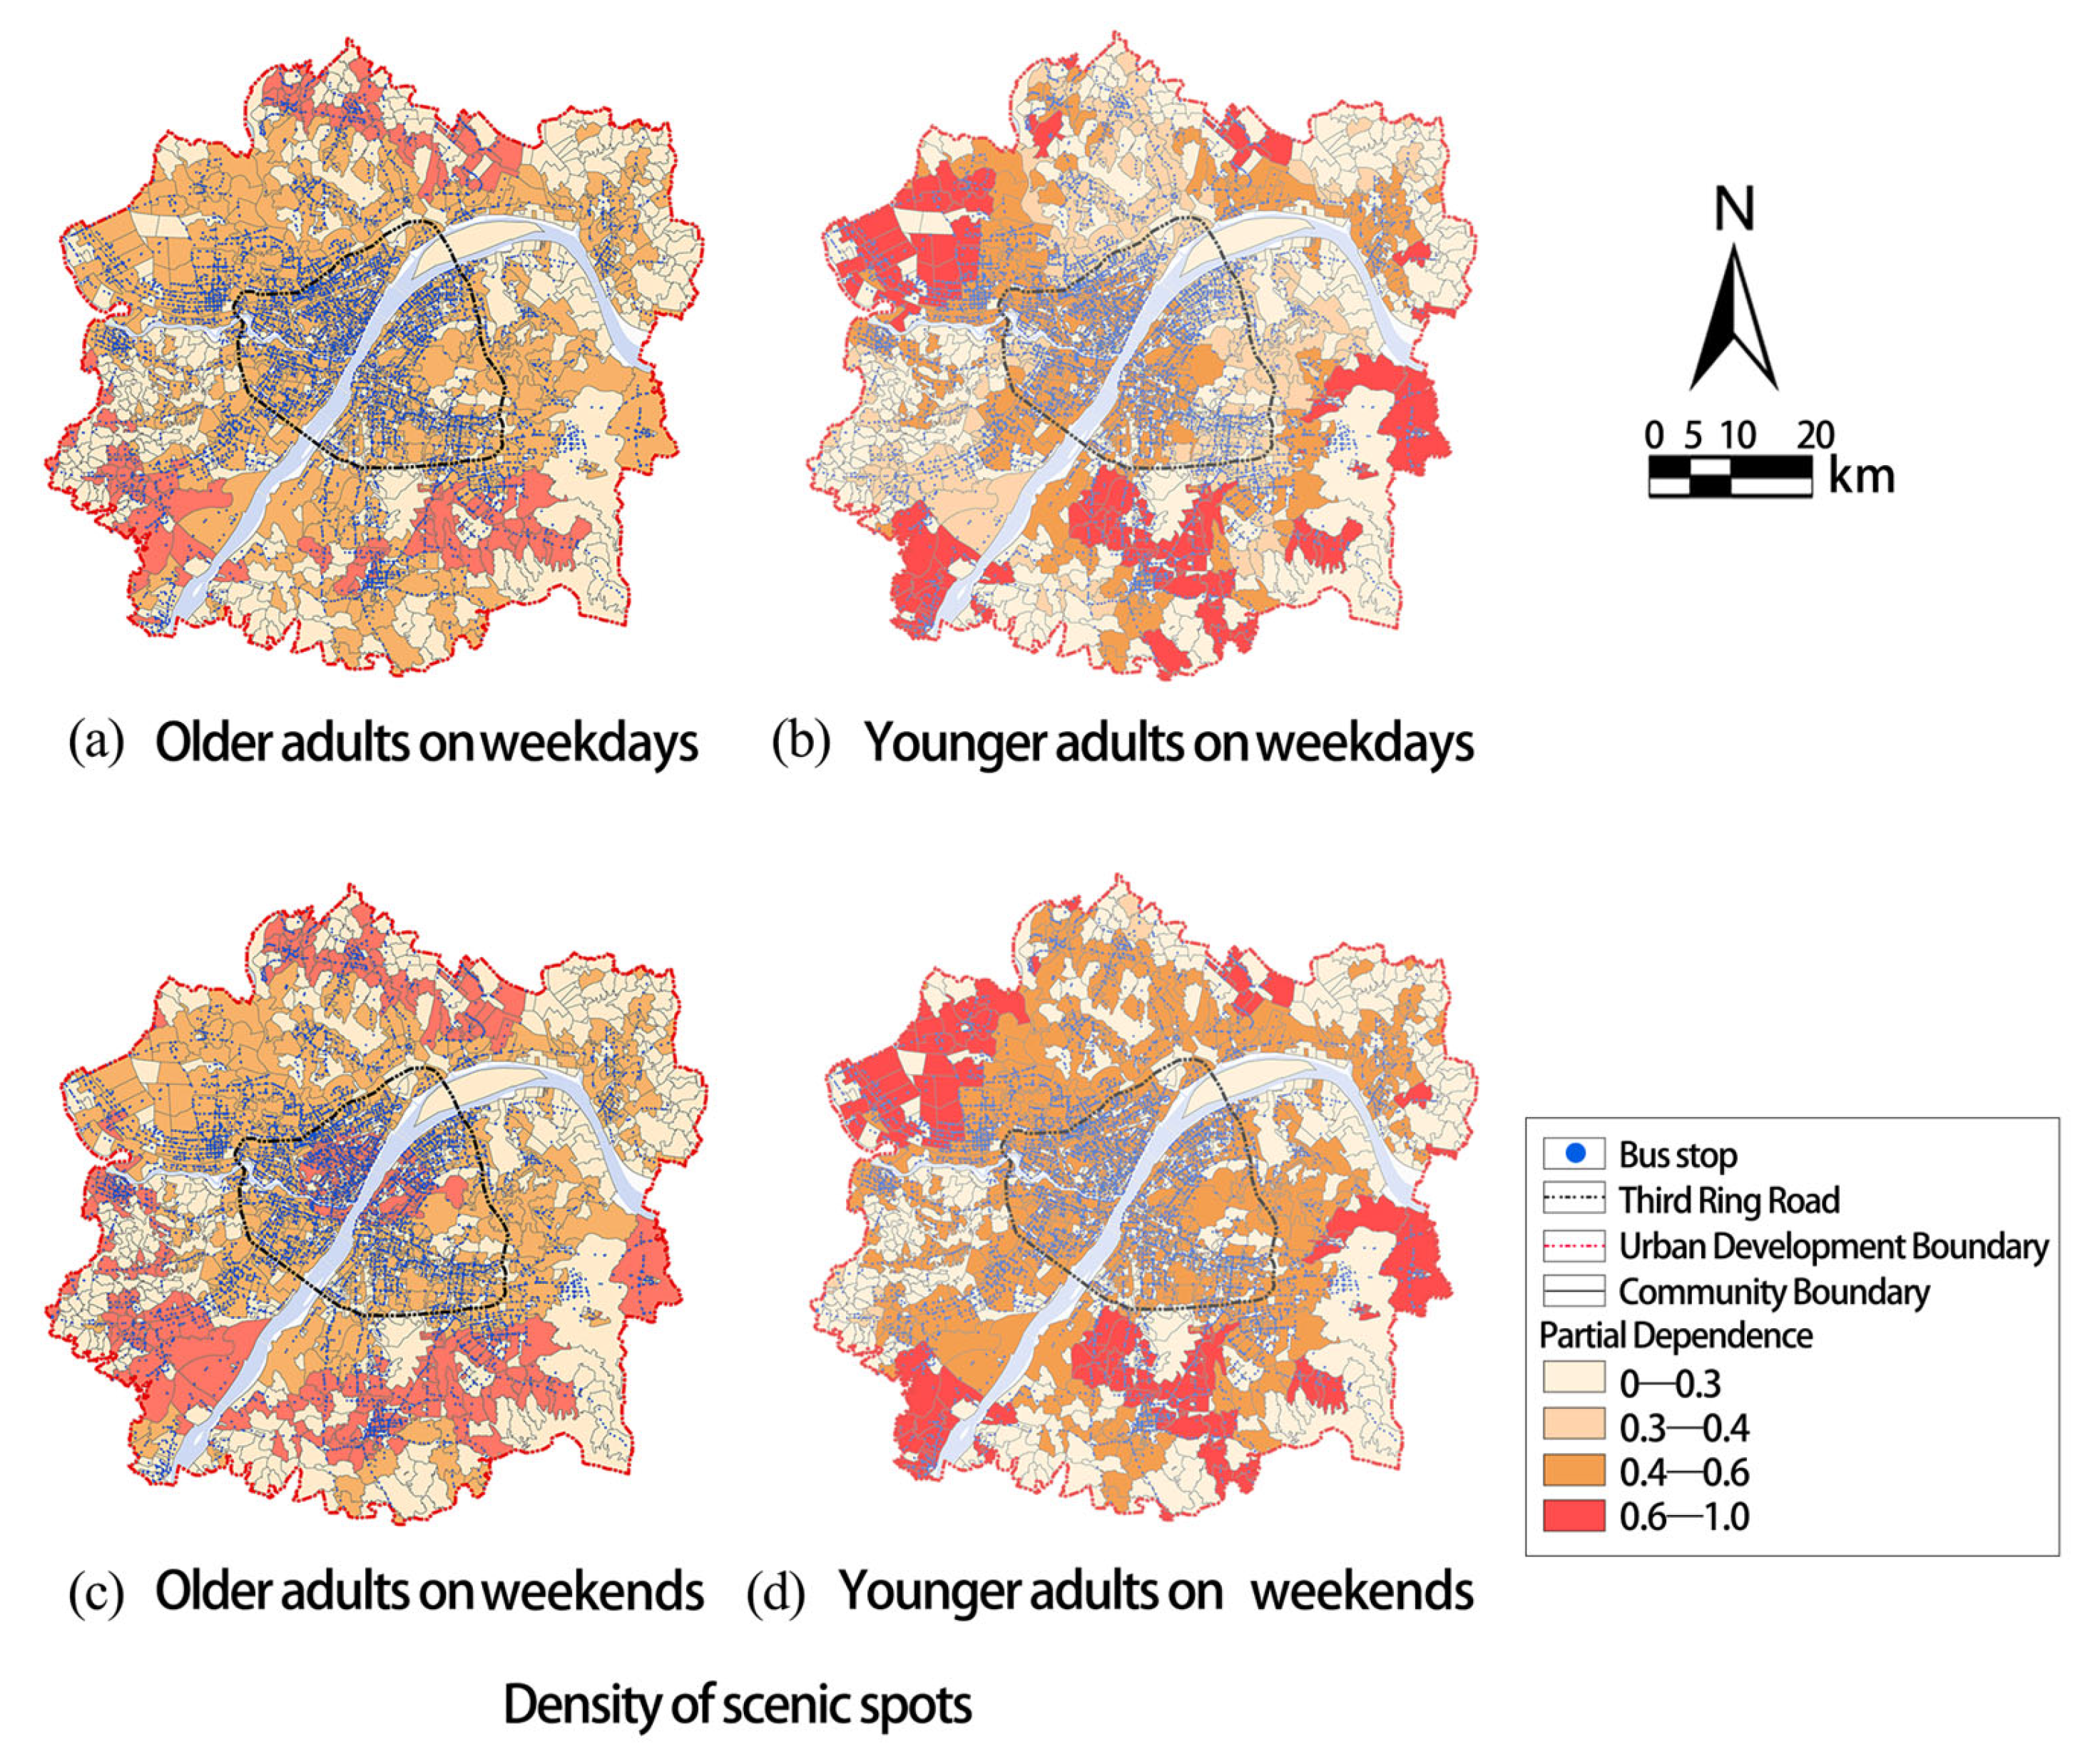
Figure A1 presents the visualization results of spatial heterogeneity in the impact of built environment factors. Overall, there are differences in the influence of built environment factors on older adults and young adults, and these influences dynamically change over time. For instance, scenic facilities have no regular impact on young adults during weekdays (
Figure 8), but their influence significantly intensifies in certain areas along the Third Ring Road (such as Dongxihu and Jiangxia) on weekends, highlighting the attractiveness of these places to young adults during leisure time. In contrast, for older adults, the trend of influence from scenic facilities remains similar whether it is on weekdays or weekends, with the main impacted areas being Caidian, Huangpi, and Jiangxia, and the influence intensifies on weekends. This reflects the stability of older adults’ daily activity patterns and their different leisure preferences compared to young adults.
4.4. The Non-Linear Relationship Between the Built Environment and Travel Flow
Figure 9 displays the partial dependence plots extracted from the GWRBoost model, distinguishing between older adults and young people. Overall, there exists a notable nonlinear relationship between most elements of the built environment and bus passenger volume. Additionally, the impact of the built environment on bus ridership differs significantly between older adults and young people, and this impact also varies between weekends and weekdays. We selected six variables for in-depth analysis, considering their relative importance in influencing the passenger volume of the two bus groups.
For older adults, the threshold of impact in terms of the distance to the nearest bus stop is 800 m on weekdays and 1000 m on weekends. This is mainly due to their limited mobility, which leads them to prefer bus stops that are closer by. On weekends, however, the companionship of family members may to some extent enhance their mobility. In contrast, young people show a significantly lower degree of dependence on the distance to bus stops, with their impact threshold stably within a 900-m range.
Furthermore, the distance to the city center, intersection density, and the number of medical facilities positively influence bus ridership within specific ranges for both older adults and young people. Specifically, for older adults, being within 3.2 km of the city center, having an intersection density of less than nine per square kilometer, and having a number of medical facilities between 0 and 130 positively impact their weekday travel. On weekends, the threshold for the impact of distance to the city center shortens to 2.8 km, intersection density exhibits a negative impact, and the positive influence of medical facilities extends to a range of 0 to 160. For young people, the positive impact of distance to the city center shortens to within 1 km, intersection density consistently exhibits a negative impact, and the positive influence of the number of medical facilities remains stable within a range of 0 to 200.
The impact of the number of public facilities and sports and leisure facilities exhibits a similar trend, both having a positive influence on the public transportation usage of older adults within the range of 0–200. For young people, the trend of influence from the number of sports and leisure facilities on weekends aligns with that of older adults; however, during weekdays, this positive influence is limited to the ranges of 50–150 and above 500. In contrast, the impact of public facilities on the public transportation usage of young people remains relatively stable, consistently falling within the range of 0–180.
In summary, this study reveals significant differences in travel behavior between older adults and younger adults, particularly in terms of travel frequency, temporal patterns, and spatial distribution. The GWRBoost model successfully captures the spatial heterogeneity and nonlinear relationships between the built environment and bus ridership. These findings provide valuable insights into the unique mobility needs of older adults and underscore the importance of optimizing the built environment to promote equitable and sustainable transportation systems.
6. Conclusions
This study developed a GWRBoost ensemble model integrating spatial heterogeneity and nonlinear effects to thoroughly analyze the spatiotemporal heterogeneity and nonlinear impacts of the built environment on public transport travel behavior among older adults, with comparisons made to younger adults. The main findings are as follows: First, the frequency of public transport use among older adults is higher than that of younger adults on both weekdays and weekends, with a longer morning peak and no significant evening peak. Second, in terms of the relative importance of the built environment on public transport use, the distance to the nearest bus stop consistently emerged as the most significant variable, while the number of companies, road network density, and distance to the nearest metro station had a more pronounced impact on younger adults. Additionally, spatial heterogeneity analysis revealed that the influence of the built environment on public transport use among older adults remained relatively stable on both weekdays and weekends, whereas its impact on younger adults significantly increased in specific areas during weekends. Finally, all variables exhibited complex nonlinear relationships and clear threshold effects. For instance, distances to the nearest bus stop within 800 m, distances to the city center within 3.2 km, and intersection densities of up to nine intersections per square kilometer had a significantly positive impact on public transport use among older adults, with other variables showing similar trends. These findings not only provide new theoretical insights into understanding public transport travel behavior among older adults but also offer a scientific basis for age-friendly urban transport planning and built environment optimization. Moreover, cross-modal research has significant potential for future research, not only to improve the ability to identify complex patterns, but also to reduce bias and increase the reliability of conclusions. In future work, this integrated analysis will be able to provide a powerful tool for revealing in-depth the interactions between the built environment, travel behavior, and individual preferences.


