Article

Analysis of Regional Spatial Characteristics and Optimization of Tourism Routes Based on Point Cloud Data from Unmanned Aerial Vehicles

1
Faculty of Art and Communication, Kunming University of Science and Technology, Kunming 650500, China
2
School of Automation Science and Electrical Engineering, Beihang University, Beijing 100191, China
*
Author to whom correspondence should be addressed.
ISPRS Int. J. Geo-Inf. 2025, 14(4), 145; https://doi.org/10.3390/ijgi14040145
Submission received: 22 January 2025 / Revised: 19 March 2025 / Accepted: 22 March 2025 / Published: 27 March 2025

Abstract

:
In this study, we analyzed regional spatial features and optimized tourism routes based on point cloud data provided by unmanned aerial vehicles (UAVs) with the goal of developing the Xiaosongyuan Red Tourism Scenic Area in Kunming, Yunnan Province, China. We first proposed a novel method for UAV point cloud data coverage based on an irregular regional segmentation technique along with an optimized search path designed to minimize travel time within the specified area. Three DJI Phantom drones were employed to collect data over the designated region, and an improved progressive triangular irregular network densification filtering algorithm was used to extract ground points from the UAV-acquired point cloud data. DJI Terra software was used for image stitching to generate a comprehensive map of spatial features in the target area. Using this three-dimensional map of spatial features, we explored tourist routes in complex environments and applied an improved particle swarm optimization algorithm to identify optimal tourist routes characterized by safety, smoothness, and feasibility. The findings provide valuable technical support for enhancing tourism planning and management in scenic areas while maintaining a balance with conservation efforts.

1. Introduction

1.1. Background Description

The thriving tourism industry is not solely sustained by stunning natural landscapes and profound cultural heritages but also by sophisticated tourism resource planning and design. Tourism resource planning serves a pivotal role in optimizing operational costs, enhancing management efficiency, and elevating visitor experiences. This discipline encompasses three primary dimensions: scenic spot design for highlighting unique attractions, infrastructure development for ensuring sustainable resource utilization, and route optimization for guiding visitor itineraries effectively. Once the scenic spot design and infrastructure development are finished, the route optimization is the important one for tourism resource planning.
Optimal tourism route design holds significant practical value, as it minimizes navigational confusion and redundant travel while maximizing scenic exposure. Two fundamental challenges underpin this discipline.
One is tourism coverage and a precision 3D map obtained via UAVs. As systematically reviewed by [1], unmanned aerial vehicles (UAVs) have transformed 3D data acquisition through advanced photogrammetric techniques. Their study evaluates state-of-the-art workflows, emphasizing innovations in image matching algorithms, spatial resolution enhancement, and data modeling frameworks for tourism applications.
The other one is multi-objective tourism route optimization. Ref. [2] conducted a comprehensive review on UAV remote sensing applications, identifying key parameters for effective route planning. Their framework integrates geometric efficiency (e.g., shortest path algorithms) with experiential quality (e.g., scenic coverage metrics) while incorporating threat zone avoidance strategies, providing a theoretical foundation for balancing competing objectives in route design.
This paper addresses critical challenges in route optimization areas through theoretical design and engineering practice.

1.2. Related Works

1.2.1. Tourism Area Coverage Issues

The integration of UAVs in applications such as search and rescue, digital design, environmental monitoring, and precision agriculture has spurred the development of efficient path-planning and coverage algorithms [3].
In a summary of existing research on UAV path planning, Cogay et al. proposed Phoenix, an application for wildfire monitoring that optimized drone routes through path planning, graph engine, and an algorithm based on a modified traveling salesman problem [4]. Ref. [5] proposed a cooperative multi-drone path-planning method for disaster-hit areas. The authors applied a satisfaction-driven encoding scheme based on one-hot encoding and successfully conducting a large-scale aerial photography survey in the area around Yushu Lake. Ref. [6] developed a drone swarm path-planning method based on probability inclusion. Ref. [7] proposed a multi-region path-planning method for rescue drones that combined coverage path planning with a model of the hierarchical traveling salesman problem. Ref. [8] highlighted studies on the challenges in obtaining complete area coverage, the effects of electro-optical equipment parameters, and task planning optimization. Ref. [9] investigated the use of UAVs in long-range aerial surveys, contributing to significant advances in path planning and coverage techniques. Coverage tasks aim to ensure that the entire area of interest is surveyed while minimizing the time and distance spent completing the route [10]. Ref. [11] reviewed a range of solutions for the drone coverage path-planning problem from simple geometric flight patterns to more complex grid-based approaches, including various methods under both complete and partial information scenarios. However, for irregularly shaped areas, most route-planning algorithms decompose the target area into sub-cells [12]. For example, Choset’s approximate cell decomposition method generates navigation trajectories covering the entire area based on the density of obstacles in each sub-map [13]. Xiao et al. [14] proposed a heterogeneous clustering-based method for multi-drone and multi-region path planning. Their approach integrates region allocation and access sequence optimization based on a novel clustering algorithm and a two-end shortest selection strategy to generate regional scanning trajectories.
The coverage width of a search device is usually set to be constant, and routes are planned accordingly. However, the electro-optical device resolution, scanning mode, and other factors significantly affect the coverage width and route planning [15]. Xiao et al. [16] developed a model of coverage width in consideration of factors such as flight altitude, pitch angle, and search azimuth. Having multiple UAVs cooperate on a specific task can significantly improve coverage efficiency and timeliness [17]. The leader–follower approach is an effective route-planning strategy for multi-UAV flights [18]. Lahmeri et al. [19] developed a multi-area coverage strategy to address the challenges of covering discontinuous areas.
Coverage tasks aim to ensure that UAVs provide effective sensing and monitoring of a designated area. A key challenge during coverage tasks is making sure that the flight path of a fixed-wing UAV can cover all regions of interest. The complexity of the coverage problem is especially evident for non-convex regions [20].
Coverage approaches typically assume that each UAV is equipped with a downward-pointing on-board camera capable of shooting at a constant altitude. Numerous coverage methods, including grid-based and graph-based coverage methods, have been proposed to transform the coverage task into a path-planning problem by subdividing the target coverage area. The coverage task is more difficult in dynamic environments. A coverage strategy based on a multi-agent system was proposed to improve the coverage efficiency by having multiple UAVs working in coordination.

1.2.2. Tourism Trajectory Planning Issues

The goal of path planning is to generate a feasible path for tourists that avoids obstacles and satisfies multiple constraints [21,22]. Although traditional path-planning algorithms such as the A* and Dijkstra’s algorithms perform well in static environments, their application in dynamic and complex environments is limited. In recent years, numerous modern algorithms have been introduced into UAV path planning, including the genetic algorithm (GA), ant colony algorithm (ACO), and particle swarm optimization algorithm (PSO). The A* algorithm efficiently determines the shortest path through a heuristic search strategy; however, it requires complex computations, making it difficult to cope with changes in real time in dynamic environments [23]. Although the Dijkstra’s algorithm is suitable for determining the shortest paths, it is inefficient in large-scale graphs. Thus, bio-inspired algorithms such as GA and ACO, which optimize paths by simulating natural selection and ant foraging behavior, have been explored for path planning [24].
PSO is a modern optimization algorithm based on group intelligence [25,26]. PSO gradually approximates the optimal solution by simulating the foraging behavior of a flock of birds. The application of PSO to path planning can significantly improve the search efficiency. The improved spherical vector-based PSO algorithm (SPSO) enhances the search performance and adaptation to the path optimization constraints by transforming the particle positions into spherical coordinates [27]. Deep learning methods are also beginning to show potential for path planning by training neural networks to predict optimal paths [28,29]. Chen et al. [30] proposed an autonomous path-planning algorithm based on multi-agent reinforcement learning. The proposed method effectively addressed incomplete information and inefficiency issues, enabling autonomous path planning in unknown environments [30]. Tang et al. [31] introduced an improved deep reinforcement learning method for path planning in dynamic scenarios. They used a Q-function approximation and a prioritized experience replay mechanism to design an algorithmic network structure based on the TensorFlow framework. This method successfully completed experimental drone path-planning tasks in dynamic environments, outperforming traditional approaches [31].
Zhao et al. [32] proposed a path-planning and following method based on multi-agent reinforcement learning. Using laser scanning data as input, the authors implemented end-to-end path planning through the soft actor–critic (SAC) algorithm. Experimentally, this method showed a high convergence speed during training and effectively enabled collaborative path planning.

1.2.3. Identified Gaps in the Literature and Contribution of This Paper

Compared with the existing literature, this paper provides the following three innovations:
Firstly, a coverage method for UAV point cloud data is proposed based on the non-regular regional segmentation technique. This method identifies the shortest path in the specified coverage space. In [12,13], the non-regular areas are divided into several relatively regular small regions, which need additional operations. These operations are not needed in this paper, which improves the convenience. In addition, compared with the classical methods such as [8], the performance of the task completion time can be improved.
Secondly, based on SPSO, the optimal path of travel for tourists is provided to ensure safety, smoothness, and feasibility. In Refs. [22,23,24,25,26,27,28,29,30,31,32], only short distances and safety are considered. This paper provides an optimal tourist travel path that ensures safety, smoothness, and feasibility, achieving a better balance among multiple factors for tourist path planning.
Thirdly, this study presents an analysis of regional spatial features and optimization of tourist routes based on UAV point cloud data. Our approach is verified by applying it to the digital science integration and rural scenic area construction scenarios of Xiaosongyuan Red Tourism Scenic Area in Kunming, Yunnan Province. The findings provide support for planning tourist attractions while balancing tourism and conservation. However, there are rare experimental results that consider both these issues.

2. Problem Formulation

The prosperity of the tourism industry not only benefits from magnificent natural landscapes and profound cultural heritage but also relies on refined tourism route design. The best tourism planning can effectively prevent tourists from getting lost or having to turn back within the scenic area, while also ensuring that they do not miss any fascinating attractions.
The design of tourism planning has two core issues. One is how to accurately obtain local 3D map information, and the other is to design a travel route with the best distance and experience, which can cover important scenic spots and avoid threat areas. This paper mainly studies the analysis of regional spatial characteristics and optimization of tourism routes, as shown in Figure 1. Firstly, UAVs are used to cover the tourism area and obtain point cloud data to establish an accurate 3D map model of the region. Secondly, based on accurate map information, necessary scenic spots and threat areas are selected. Then, the optimal tourist route is determined through a three-dimensional trajectory optimization method.

3. Main Results

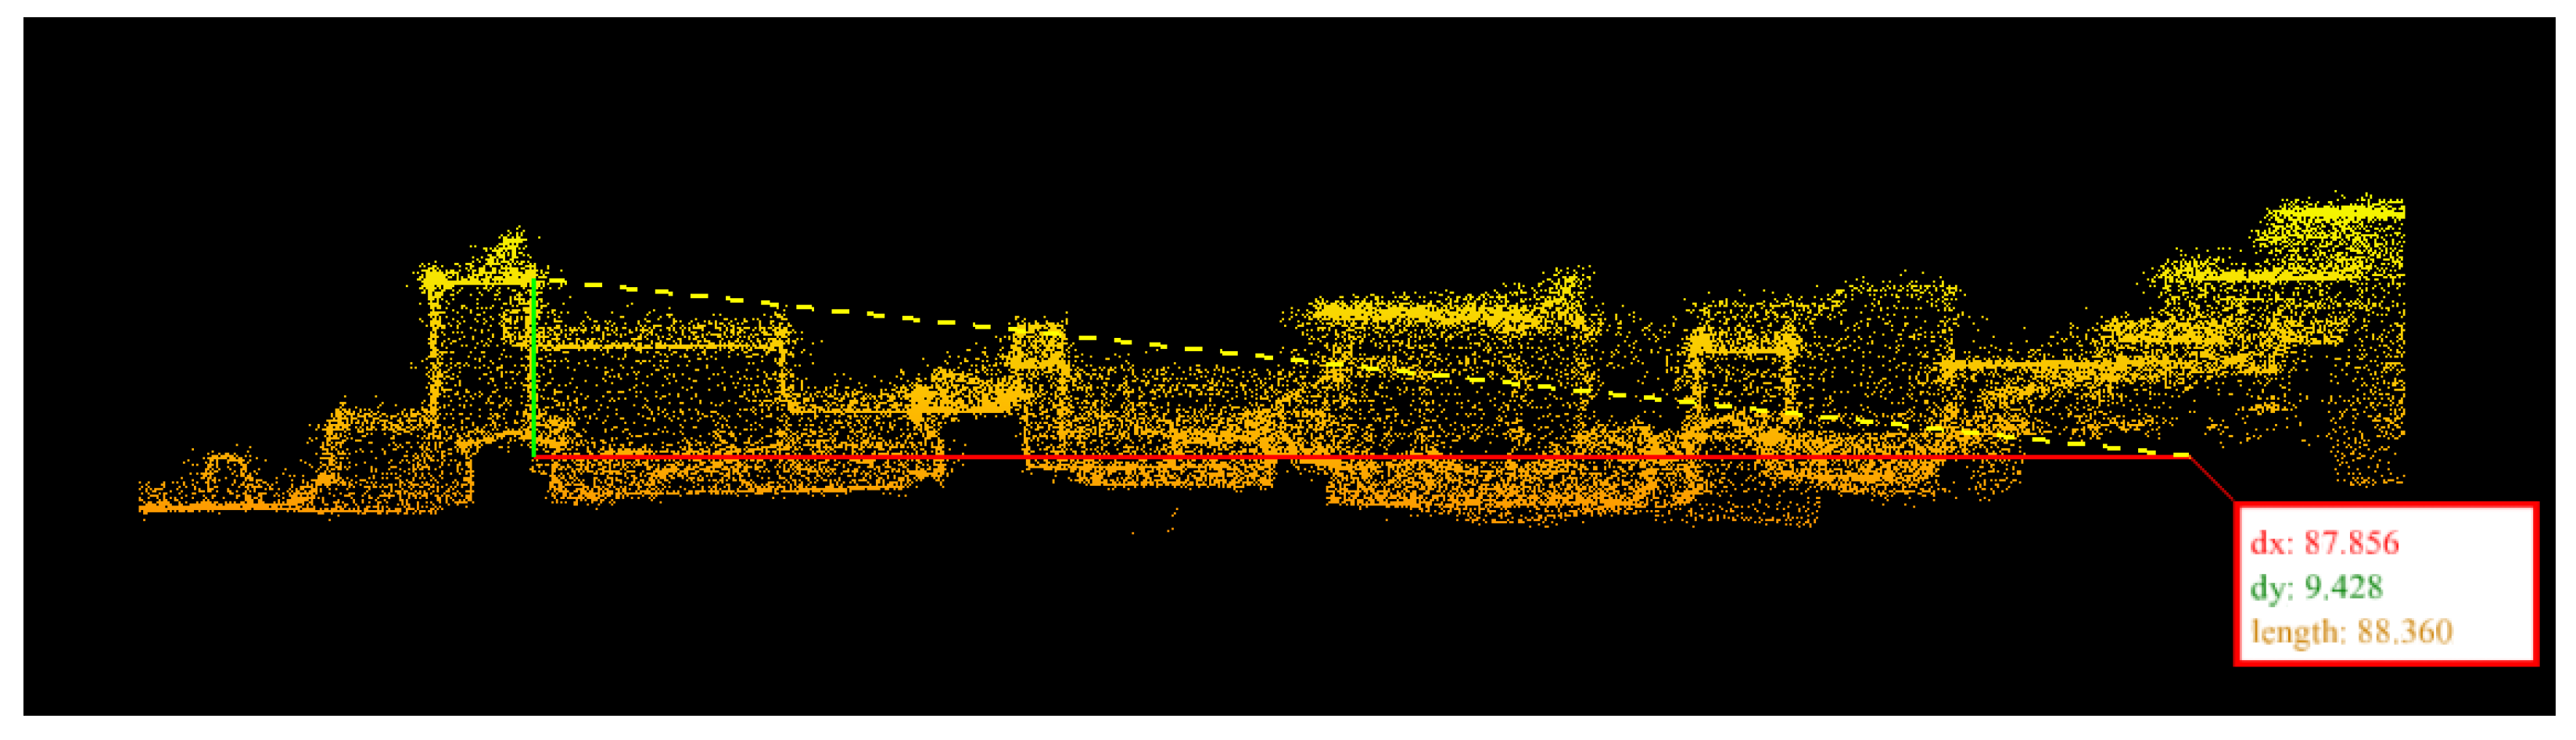
3.1. Point Cloud Collection

Tilt photography/photogrammetry can simultaneously collect images from different angles by equipping the same flight platform with multiple sensors. Three-dimensional (3D) point cloud data obtained from 3D images by methods such as dense multi-view image matching are called image point cloud data (or photogrammetric, image matching, or dense image matching point cloud data). As shown in Figure 2, image point cloud data have comparable accuracy to laser point cloud data and contain direct spectral information with broad applications. SensatUrban is a representative image point cloud dataset for urban scene segmentation.
The three-dimensional (3D) point clouds were generated from high-quality aerial imagery captured by a professional UAV mapping system. To cover the measurement area fully and uniformly, all flight paths were pre-planned in a grid fashion and automated using a flight control system (e-Motion). Cameras mounted on UAVs can be used to collect the 3D coordinates of points on the ground to generate highly accurate 3D models of terrain and objects. This strategy has a wide range of applications in various fields such as terrain mapping, building monitoring, and agricultural assessment. The high accuracy and resolution of point cloud data facilitate the analysis of complex environments, providing a powerful tool for spatial features and resource management in tourist attractions.

3.2. The Coverage Path Planning of Ground Areas Using UAVs

In this section, the first problem of this paper is dealt with, where UAVs’ coverage path planning for tourism areas is presented. The UAVs can track the planned coverage path to obtain point cloud data to establish an accurate 3D map model of the region.

3.2.1. Regional Decomposition

Suppose that the task of a group of fixed-wing UAVs is to cover, as quickly as possible, a polygonal convex region represented by a set of P vertices. If the region to be covered is non-convex, P is assumed to represent the vertex of the region. The maximum flight time of each UAV is finite and known in advance. Each UAV is equipped with a downward-pointing on-board camera. The UAVs’ task is to perceive the entire area specified using the on-board camera. Each UAV maintains a constant flight altitude that is carefully chosen so that the resolution of the camera permits observation of features of interest on the ground.
Suppose that each UAV flies over the area to be covered while performing a back-and-forth motion in rows perpendicular to the given scanning direction, as shown in Figure 3. While tracking the row, the UAV is leveled (meaning that its camera is pointing down); however, at the end of the row, the UAV makes a curve outside the area back to the next row. During such a curve, the camera generally does not point toward the ground. The number of turns is directly related to the coverage time of a given region. Therefore, the first step in our approach was to determine the optimal coverage direction that was perpendicular to the minimum height of the polygonal region. In that direction, the area can be covered with the minimum number of rows and thus the minimum number of curves, as shown in Figure 4. Paths with fewer turns are more efficient from the perspective of route length, flight duration, and energy expenditure. However, the scanning direction may be chosen in different ways. For example, the direction of the coverage row may be chosen as a function of wind because flying against the wind may destabilize the vehicle.
The optimal coverage direction for a given polygon was determined using a simple search procedure, as shown in Figure 5. In that procedure, the polygon is rotated on a surface, and its height is measured. The optimal direction is the one that yields the minimum height.
Once the optimal scanning direction is found, rows can be distributed over the region. In our approach, the distance between two rows was chosen as a function of the footprint of the on-board camera on the ground. As shown in Figure 6, assuming that the image sensor is parallel to the ground plane (i.e., the UAV is level), the width L of the camera footprint can be computed from the width l of the image sensor, the focal length f of the camera lens in millimeters, and the distance H of the camera from the ground (flight height):
L = H l f .
The number of rows covered is calculated as:
N l = h min L ( 1 s ) .
The distance between two rows is:
d l = h min N l .
In Equation (7), s ( 0 , 1 ) represents the percentage of overlap between two images. This overlap is usually necessary to stitch the images together to form an aerial map. Assuming that the polygon representing the region is rotated such that the direction of optimal coverage is parallel to the axis of the global reference frame, the coverage rows can be defined by two planar points with the same coordinates as follows:
y i = i × d l d l 2 , i = 1 , , N l .

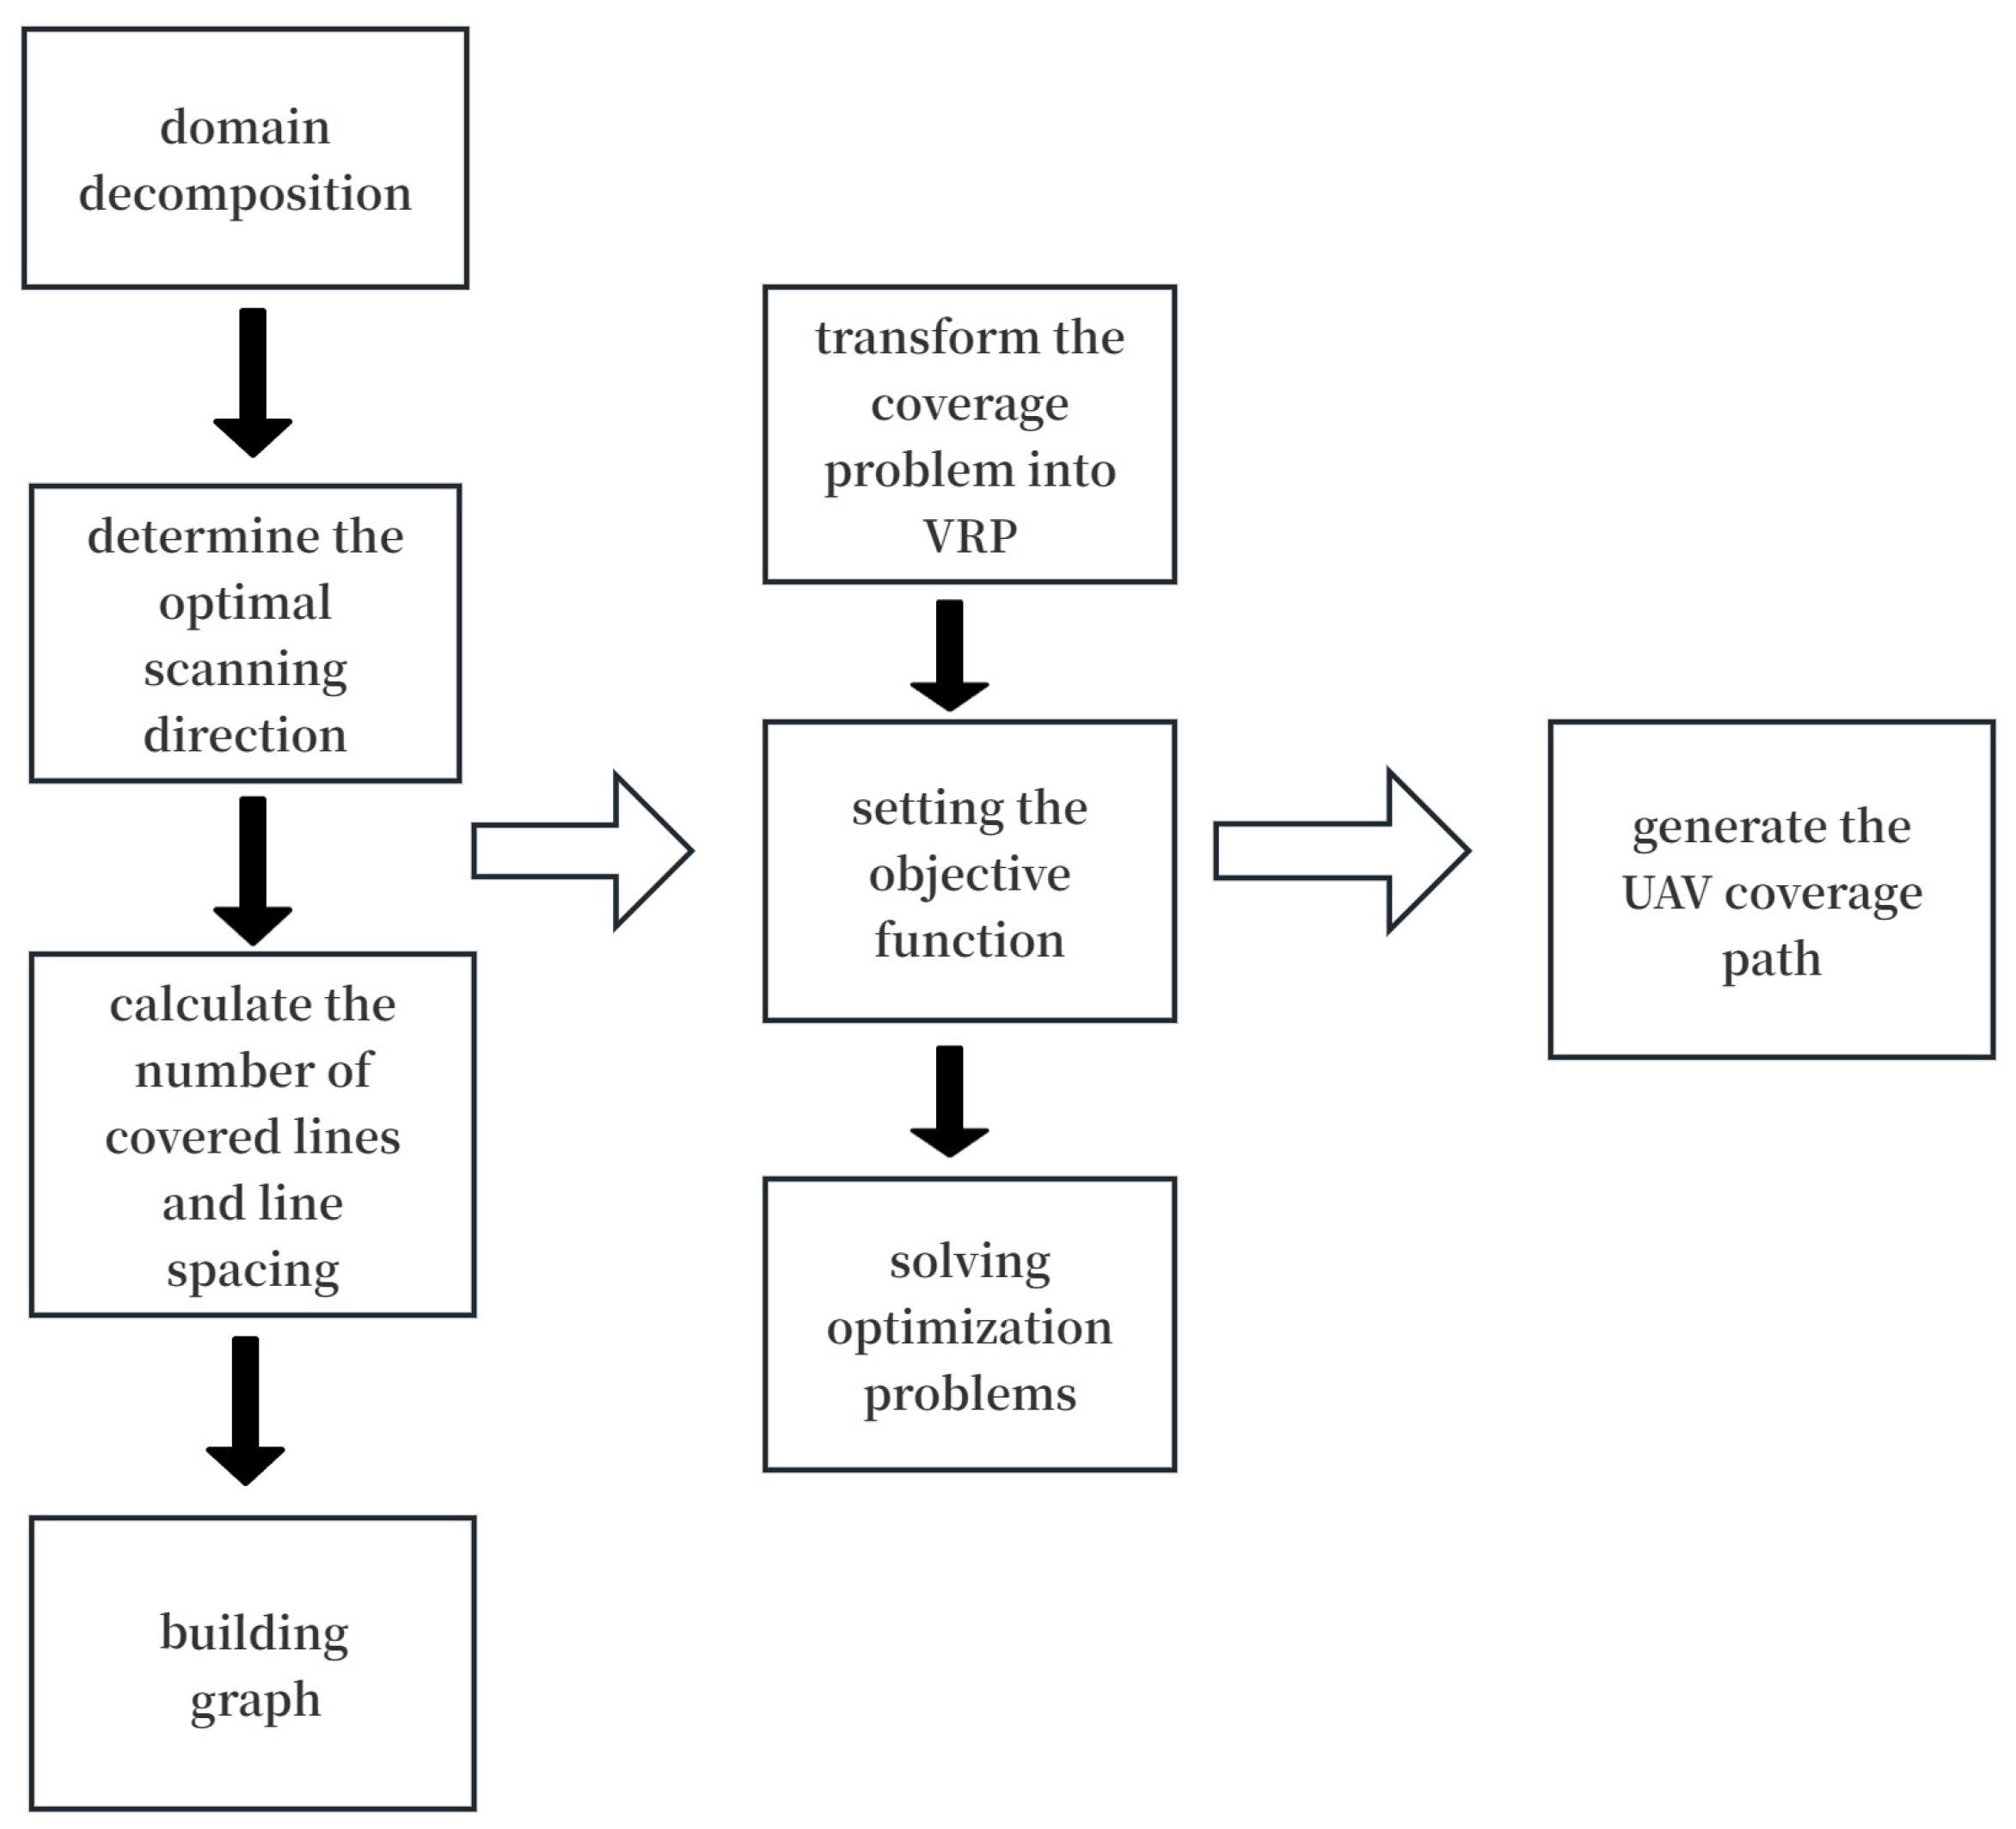
3.2.2. Coverage Path-Planning Strategy

Once the graph associated with the region to be covered has been created, the coverage problem can be posed as a vehicle routing problem (VRP) in which each UAV is modeled. Additionally, by proposing new constraints, the UAV can be forced to use pre-specified graph–edge routes in its navigation row so that the coverage row is followed by a launched UAV. Finally, by solving the VRP, the trajectory that each UAV must execute can be obtained. Before giving the mathematical formulation of the VRP, we define the constants and variables necessary for this formulation. The constant C i j represents the traversal cost of the edge (i,j) between node i and node j. To indicate whether the first UAV flies from vertex i to vertex j, binary variables X i j k { 0 , 1 } are used. The constant V i j k R denotes the flight speed of UAV k when it flies from vertex i to vertex j. The constant t s R denotes the individual setup time, and Lk denotes the battery life of UAV k. Meanwhile, M N denotes the number of UAVs designed for a particular task, and O N is the constant of the UAV operator, where N is the number of nodes of the graph. Finally, d k denotes the additional time required to launch UAV k. Based on the variables defined earlier, the time taken by the UAV to fly its course is given by:
T k = i = 1 N j = 1 N C i j V i j k X i j k + d k .
Our main goal is to minimize the task time, which can be achieved by minimizing the time of the longest route among all UAV routes. Thus, our problem is actually a min–max problem in which we want to minimize the maximum value of T k . To transform the min–max problem into a linear problem, we introduce an additional variable to represent the longest route of the UAV. The basic optimization problem can then be written as
min ( V ) i = 1 N j = 1 N C i j V i j k X i j k + d k V , k = 1 , , M . t s k O j = 1 N X 1 j k = d k , k = 1 , , M
To complete the optimization problem and guarantee its solution, other constraints need to be incorporated. The first of these constraints is
i = 1 N j = 1 N C i j V i j k X i j k L k , k = 1 , , M .
The maximum flight time L k of UAV k is limited by its battery life. To ensure that each node of the graph is visited only once by a UAV, two other constraints are needed:
k = 1 M i = 1 N X i j k = 1 , j = 2 , 3 , 4 , , N i = 1 N X i p k j = 1 N X p j k = 0 , p = 1 , 2 , 3 , , N , k = 1 , 2 , 3 , , M .
The first constraint ensures that each node except the departure point (node 1) is visited by only one UAV. The second constraint guarantees that the UAV that arrives at a given node is the same UAV that leaves that node.
In this text, u i , u j , ( i = 2 , 3 , 4 , , N ) where u i , u j belong to the set of integers, denoted as Z ) is an integer variable used in the subtour elimination constraint. To ensure that each UAV path starts and ends at the departure point (node 1), and that the paths have no internal loops, the standard subtour elimination constraints are used:
u i u j + N k = 1 M X i j k N 1 , i , j = 2 , 3 , 4 , , N where u i Z , i = 2 , 3 , 4 , , N u i u j + N k = 1 M X i j k N 1 , i , j = 2 , 3 , 4 , , N .
The following constraints are also required to ensure that the VRP program enables the UAV to cover the area shown in map G:
k = 1 M X ( i , i + 1 ) k + k = 1 M X ( i + 1 , i ) k = 1 , i = 2 , 4 , 6 , , N .
The flow of the coverage algorithm is shown in Figure 7.

3.3. The Three-Dimensional Tourism Trajectory Planning

This section handles the second problem of this paper. The core objective of the work described in the previous section was to cover the target area using multiple drones and generate a three-dimensional map of terrain features using laser-based point cloud data. In this section, based on accurate map information, necessary scenic spots and threat areas are selected. Then, the research discussed in this section aims to identify the optimal path for creating three-dimensional maps of terrain features to accomplish optimal tourist route-planning tasks.

3.3.1. Problem Definition

The main goal of path planning is to generate safe, smooth, and feasible paths that avoid obstacles at mandatory waypoints, satisfy the physical and dynamic constraints of the road, and optimize the path lengths under multiple threats. The SPSO algorithm improves the search performance by transforming the particle positions to spherical coordinates while ensuring that the actual path constraints are adequately considered.

3.3.2. Three-Dimensional Trajectory-Planning Methods

(1) Construction of the cost function
A path planning problem can be transformed into an optimization problem by defining a cost function. In other words, the properties of the optimized route can be described by the cost functions, which comprehensively consider the path length, safety, climb height, and smoothness constraints on the path. The functions (1) and (2) are based on the classical literature [33]. However, the third and fourth functions of the climb altitude and smoothness are proposed in this paper.
1)
Cost function of path length
Minimizing the path length is one of the core objectives of optimization. Assuming that the path contains n path points P j = ( x j , y j , z j ) , the cost function of the total path length can be expressed as:
F 1 = j = 1 n 1 P j P j + 1
where ( x j , y j , z j ) is the 3D coordinates of path point j, where j = 1, 2, L, n; and denotes the Euclidean distance between two points.
P j P j + 1 = ( x j + 1 x j ) 2 + ( y j + 1 y j ) 2 + ( z j + 1 z j ) 2
2)
Cost function of security
To prevent paths from crossing obstacles or threat zones, the security cost is defined as a function of the distance from the threat center. Assuming that the location of the threat area K is C k , and its radius is R k , the distance of the path from the threat area d k is defined as
d k = min P j C k
The security cost function is then given as:
F 2 = j = 1 n 1 k = 1 K T k ( P j , P j + 1 )
where the threat function T k is defined as:
T k ( P j , P j + 1 ) = 0 if d k > S + D + R k , S + D + R k d k if D + R k < d k S + D + R k , if d k < S + D + R k .
In Equation (20), S is the safe distance between a tourist and the threat area, and D is the characteristic diameter of a tourist.
3)
Climb altitude constraint
To ensure that tourists walk within a comfortable height range, the height cost function F 3 is defined as:
F 3 = j = 1 n H j
where the height cost H i j is given by:
h j h max h min 2 if h min h j h max , if h i j [ h min , h max ] .
In Equation (22), h m i n and h m a x are the minimum and maximum allowable climb heights, respectively.
4)
Smoothness cost function
To ensure smooth paths, the steering angle and the climb angle of the paths are defined. The steering angle φ j is the angle between neighboring path segments and is defined as
ϕ j = arctan P j × P j + 1 P j · P j + 1 ,
where P j is the projection of the path segment P j onto the horizontal plane.
The climb angle ψ j is the angle between the path segment and the horizontal plane, defined as:
ψ j = arctan z j + 1 z j P j .
The smoothness cost function F 4 is defined as:
F 4 = a 1 j = 1 n 2 ϕ j + a 2 j = 1 n 1 ψ j ψ j 1 ,
where a 1 and a 2 are the penalty coefficients for the steering angle and climb angle, respectively.
5)
Total cost function
Based on the above cost functions, the total cost function is defined as
F = b 1 F 1 + b 2 F 2 + b 3 F 3 + b 4 F 4 ,
where b 1 , b 2 , b 3 , and b 4 are the weight coefficients of each respective cost function.
(2) SPSO Algorithm
In SPSO, a spherical coordinate system (i.e., magnitude ρ , elevation ψ , and azimuth ψ ) is introduced to encode the path points, and the motion characteristics of the particles correspond to the velocity, steering angle, and climb angle of a tourist.
1)
Particle update equations
In SPSO, the positions of particles are represented by spherical vectors Ω containing 3n dimensions. The position update rule for each particle is given by
Ω j ( k + 1 ) = Ω j k + Δ Ω j ( k + 1 ) ,
where the incremental update equation for the particle is:
Δ Ω j ( k + 1 ) = w Δ Ω j k + c 1 r 1 Ω best k Ω j k + c 2 r 2 Ω g , best k Ω j k .
In Equation (28), Ω is the inertia weight, c 1 and c 2 are the acceleration factors, and r 1 and r 1 are uniformly distributed random numbers.
2)
Position mapping
The spherical vectors ( ρ j , ψ j , φ j ) of the particles are mapped to Cartesian coordinates as follows:
x j = x j 1 + ρ j sin ( ψ j ) cos ( ϕ j ) y j = y j 1 + ρ j sin ( ψ j ) sin ( ϕ j ) z j = z j 1 + ρ j cos ( ψ j ) .
(3) Description of Algorithm Performance
Path length optimality: the optimization objective function F 1 ( X i ) of the path length ensures that the total length of the path is minimized, and that the shortest path is continuously adjusted between the local and global solutions to obtain the optimal solution by iterating in the particle swarm.
Security and obstacle avoidance: The security cost function F 2 ( X i ) ensures that the path does not enter the threat zone. By introducing an infinitely large penalty value in the cost function, when the path is close to the threat zone, the position of the particle is updated to avoid the threat zone, ensuring obstacle avoidance.
Smoothness and climbing angle constraints: By introducing steering angle and climbing angle constraints, SPSO can ensure the smoothness and feasibility of the planned path of the tourist. The angle penalty term F 4 ( X i ) in the formulation ensures that the turns and climbs are not too drastic, making the path more consistent with the physical constraints of tourist walking.
The walk vector coordinates can directly characterize the motion of tourists. When tourists are represented in 3D space, their paths are usually constrained by their speed, climb angle, and turn angle. These motion characteristics are directly related to the three basic parameters in spherical coordinates.
With spherical vector coordinates, we can search for optimal solutions in the configuration space of the path, rather than being restricted to the planar projection of Cartesian coordinates. This allows for a more natural representation of the 3D motion of the tourists; as a result, the optimized paths are more consistent with the physical constraints of tourist walking.

4. Experiment and Discussions

4.1. Search Coverage Flight Experiment and Discussions

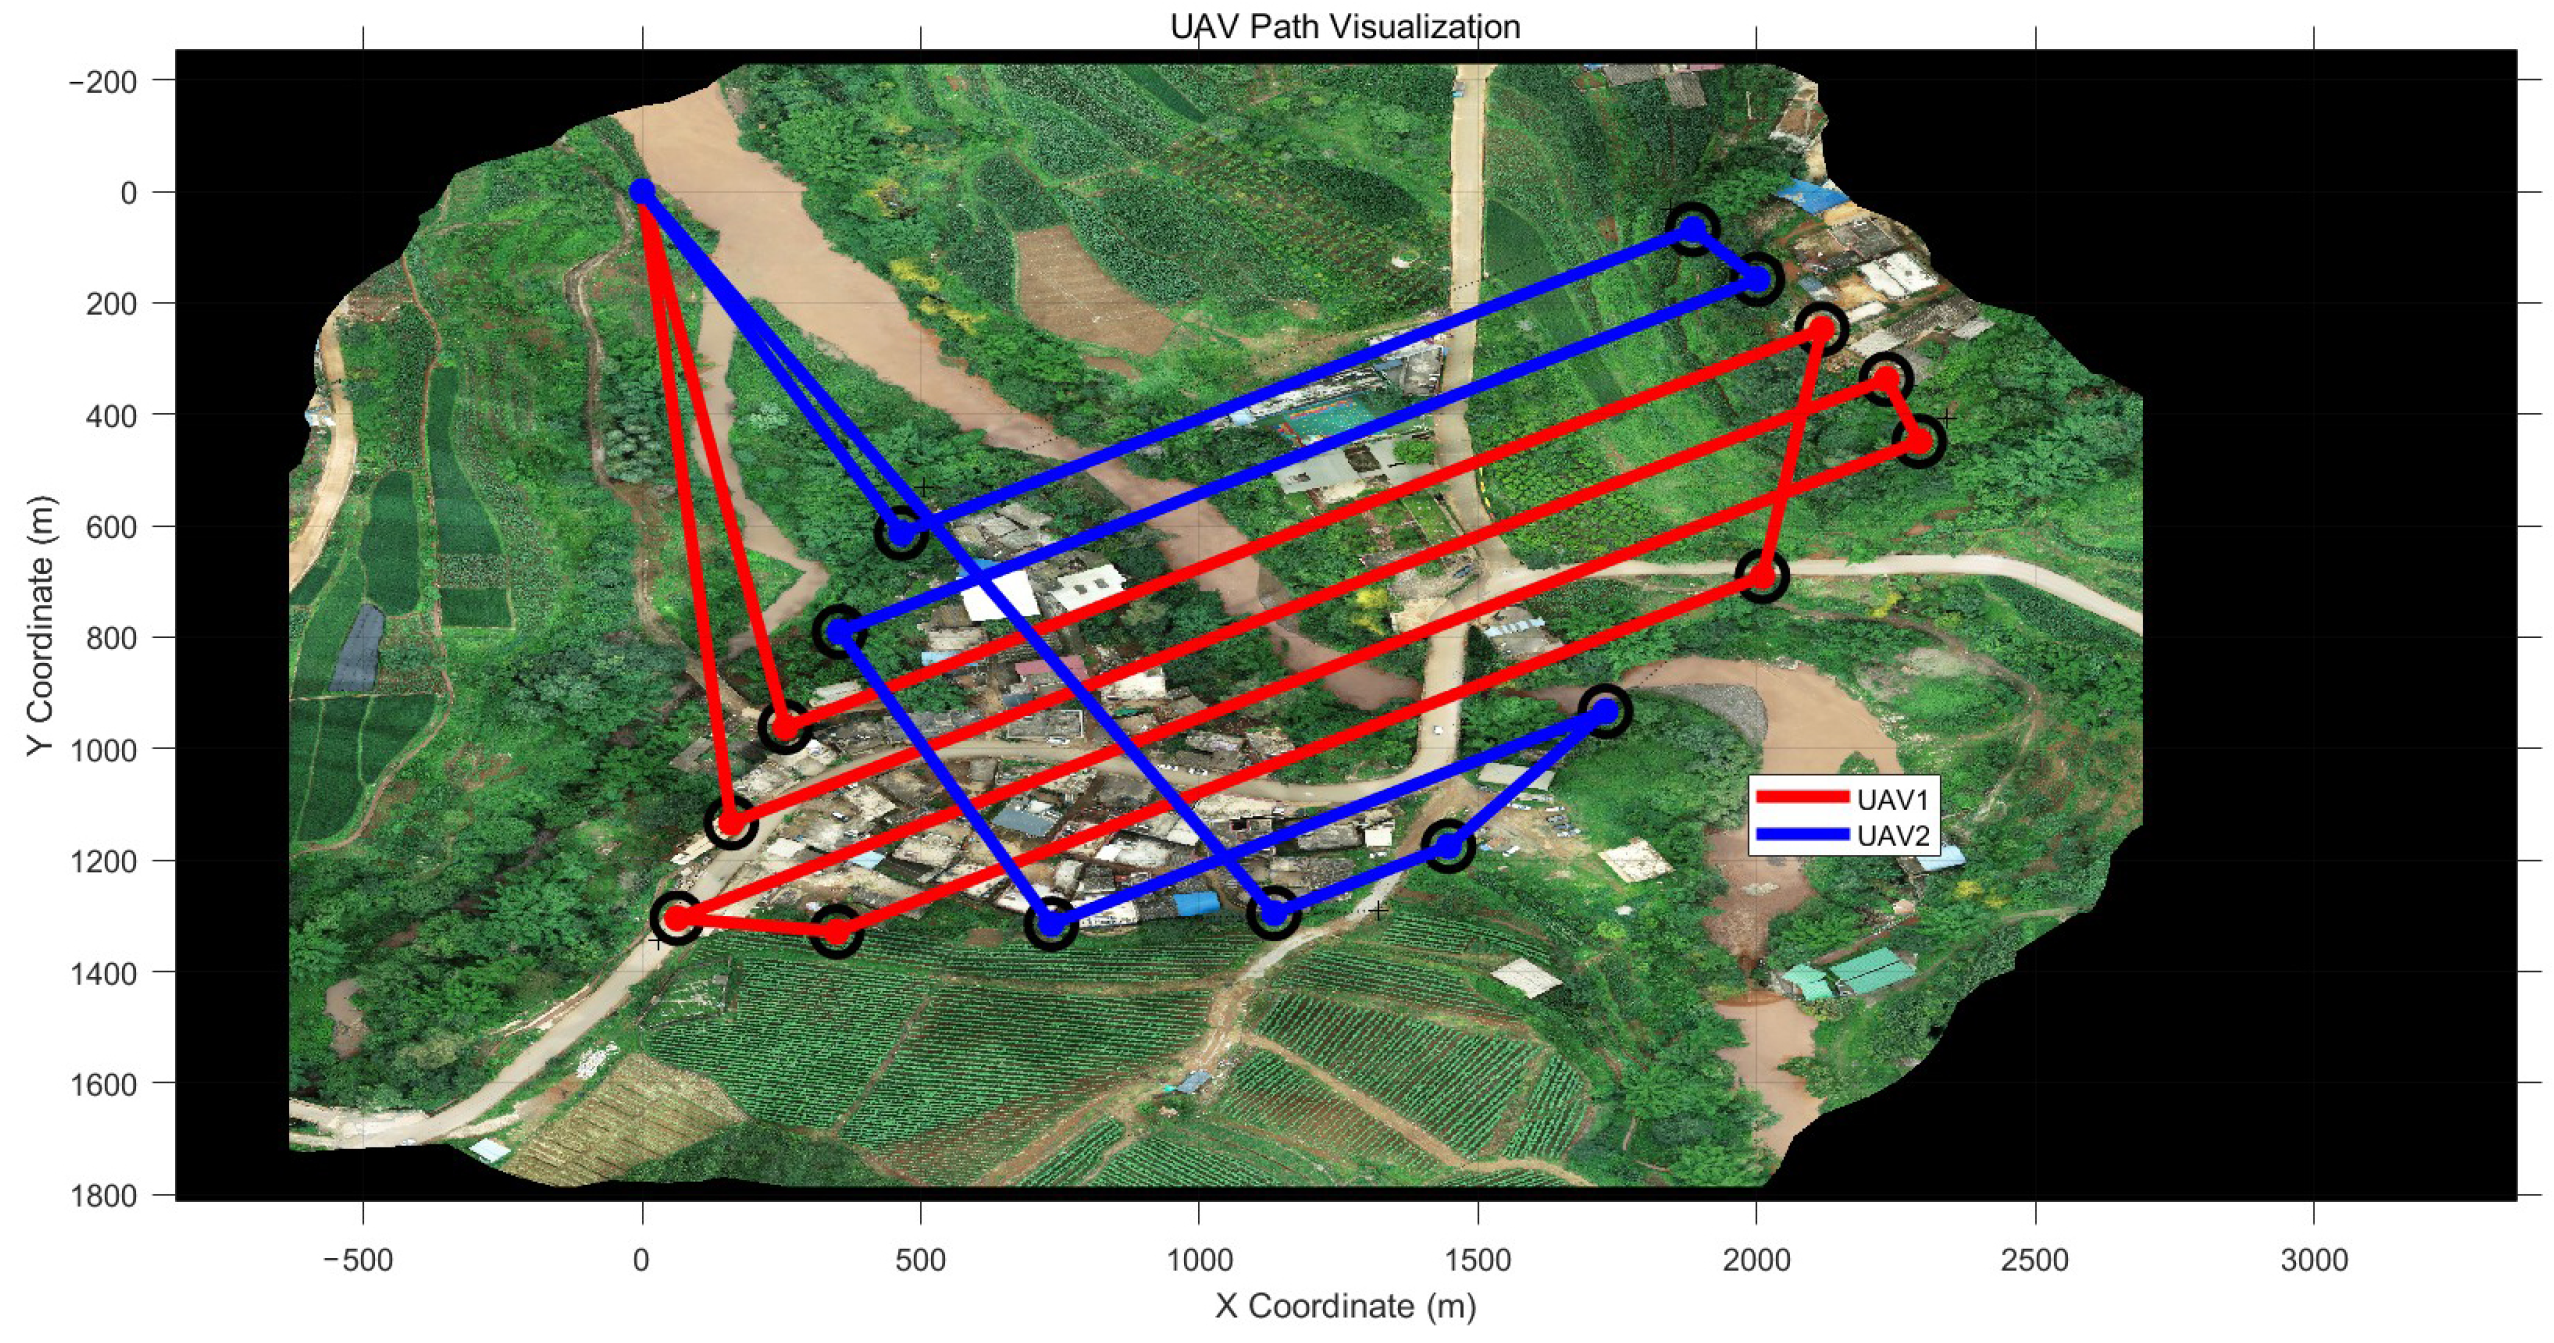
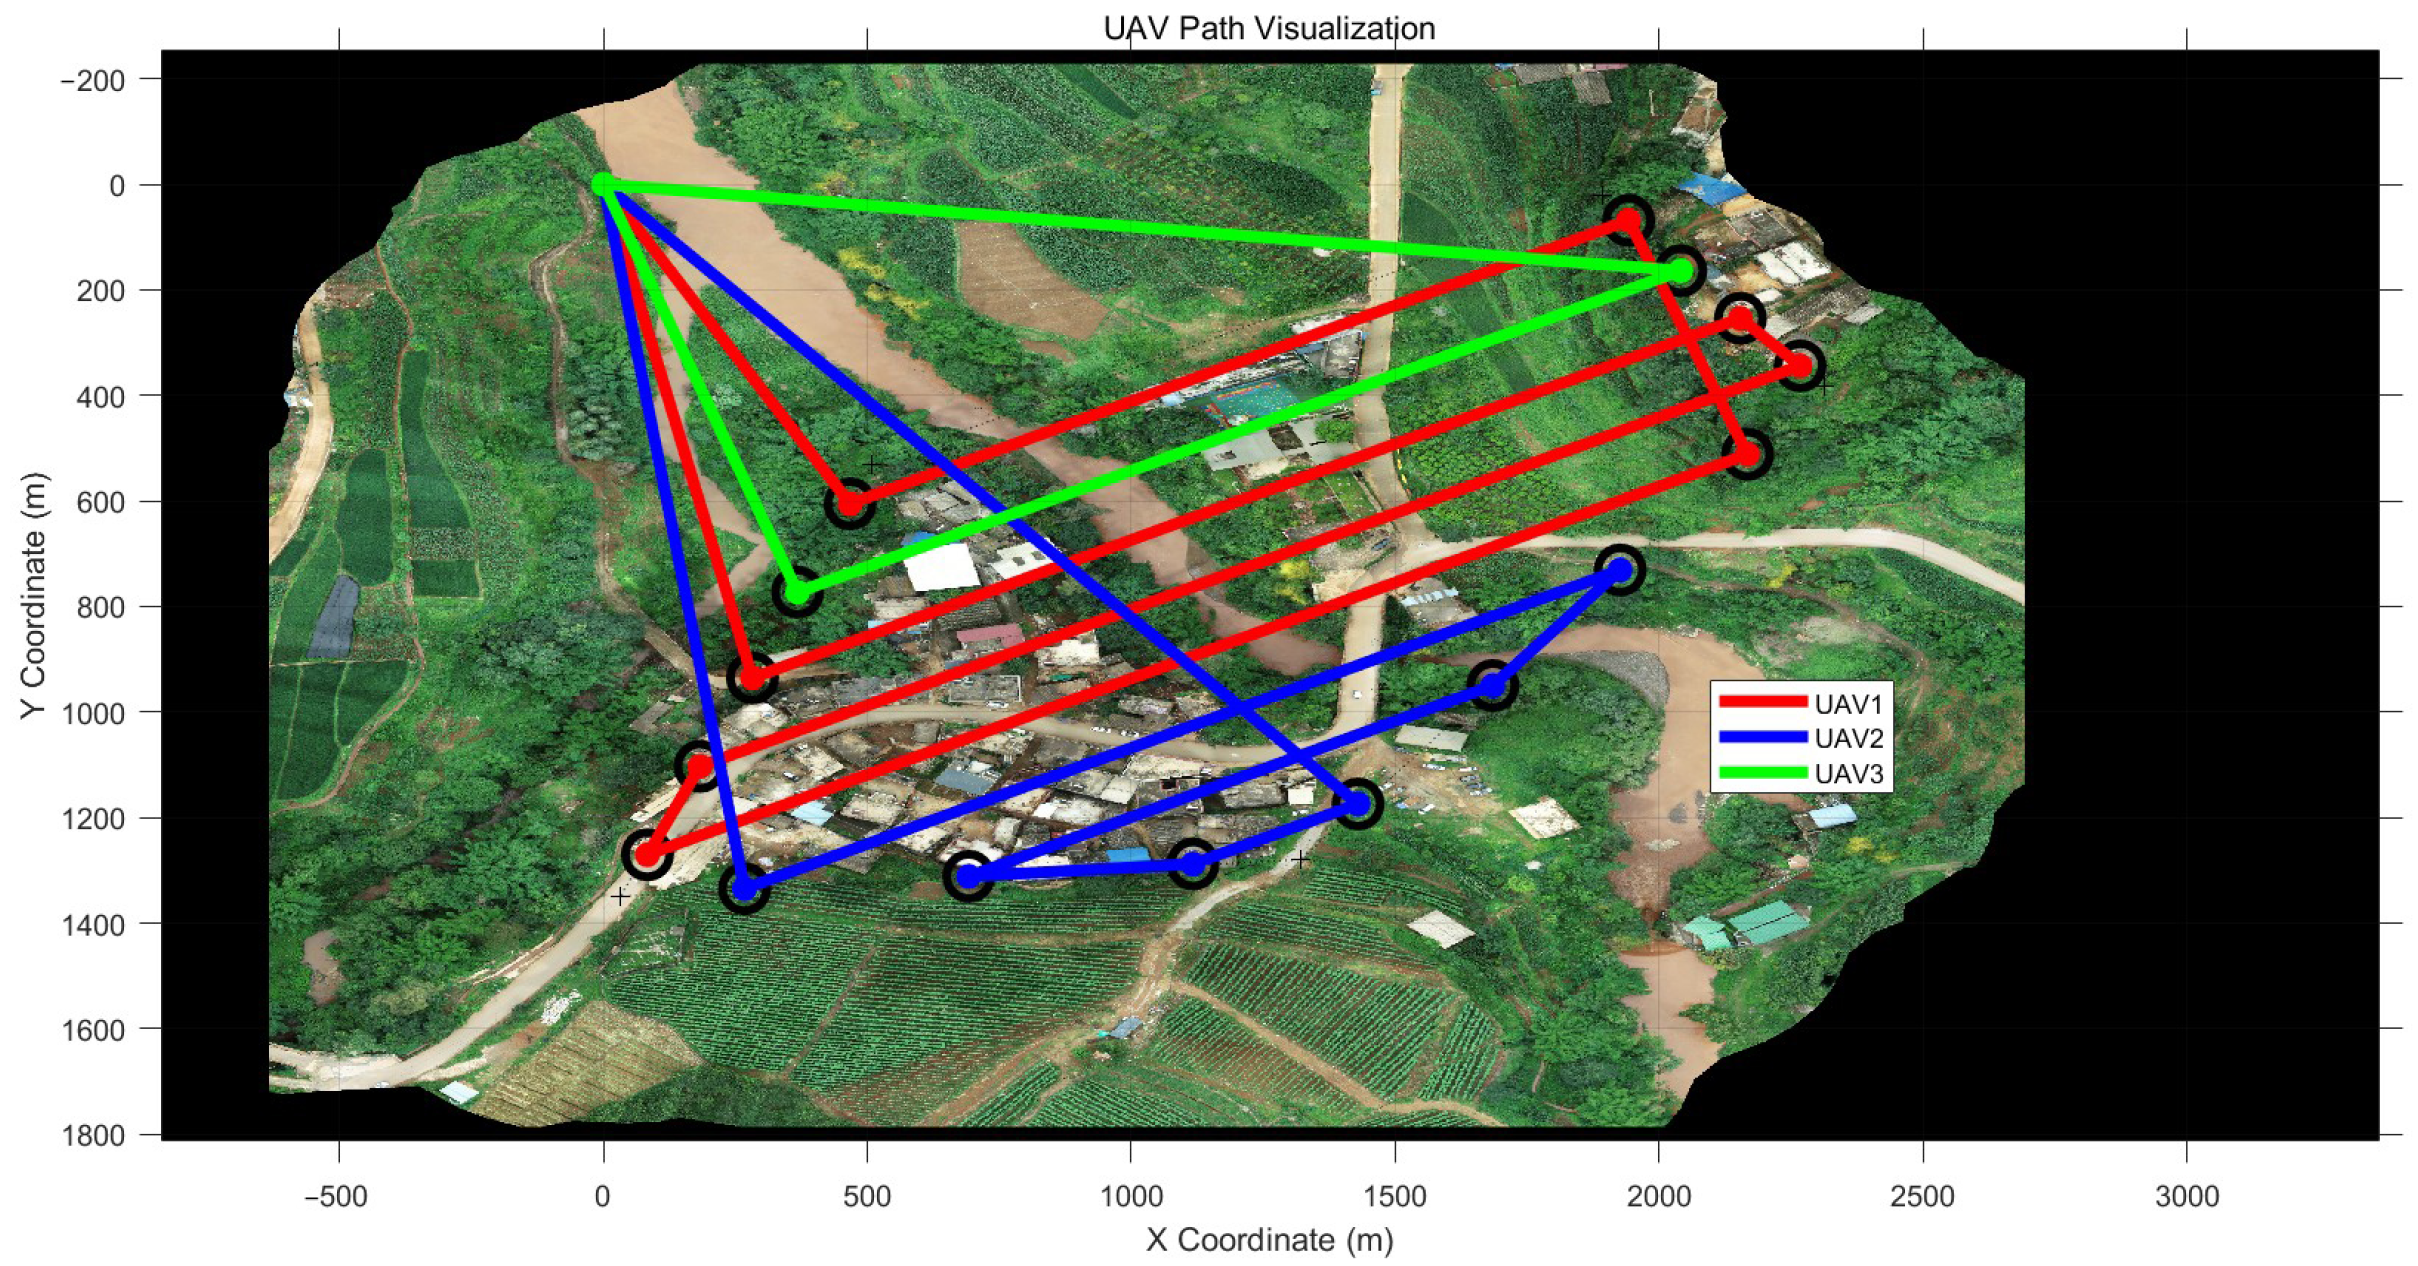
4.1.1. Coverage Path-Planning Experiment 1

To validate the effectiveness of the algorithm proposed in Section 4, we conducted verification in Dawa Village, Yunnan Province. To obtain the point cloud data, the search was conducted with one, two, and three UAVs (number of operators O = 1). In the first experiment, only one UAV (M = 1) was used to establish the time for covering the area as a reference. The first graph in Figure 8 shows the flight path of the UAV. The search algorithm gave time for the UAV to effectively perform its task and its setup on the ground. In Figure 8, the first row is the flight time of each UAV (including setup time), the second row is the actual flight time, and the third row is the length of the flight path. The task completion of the single UAV was 27.87 min, including 4 min of setup time, and the path value was 129 m.
In the second experiment, two UAVs (M = 2) were used to establish a time reference covering the area. In Figure 9, the red solid line is the flight path of the first UAV, and the blue solid line is the flight path of the second UAV. The simulation yielded the time it took for the UAV to effectively perform the task and its setup time on the ground. Compared to the first experiment, the task completion time was reduced to 20.06 min, including the setup time for each UAV, with a path value of 118.74 m.
In the third experiment, three UAVs (M = 3) were used to establish a time reference covering the area. In Figure 10, the red, green, and blue solid lines show the flight paths of the first, second, and third UAVs, respectively. The simulation yielded the time it took for the UAVs to effectively perform the task and their setup time on the ground. The task completion time was 18.27 min, including the setup time for each UAV, with a path value of 125.55 m.
The experimental data are shown in Table 1.
Using the search coverage method and experiment, the point cloud data were obtained and processed by DJI Terra to generate a high-precision 3D point cloud model. The basic data were used for subsequent spatial feature analysis and resource optimization, as shown in Figure 11 and Table 2. In Figure 11, the size of the point cloud is 5.8 GB, and our processing time was 6 h.

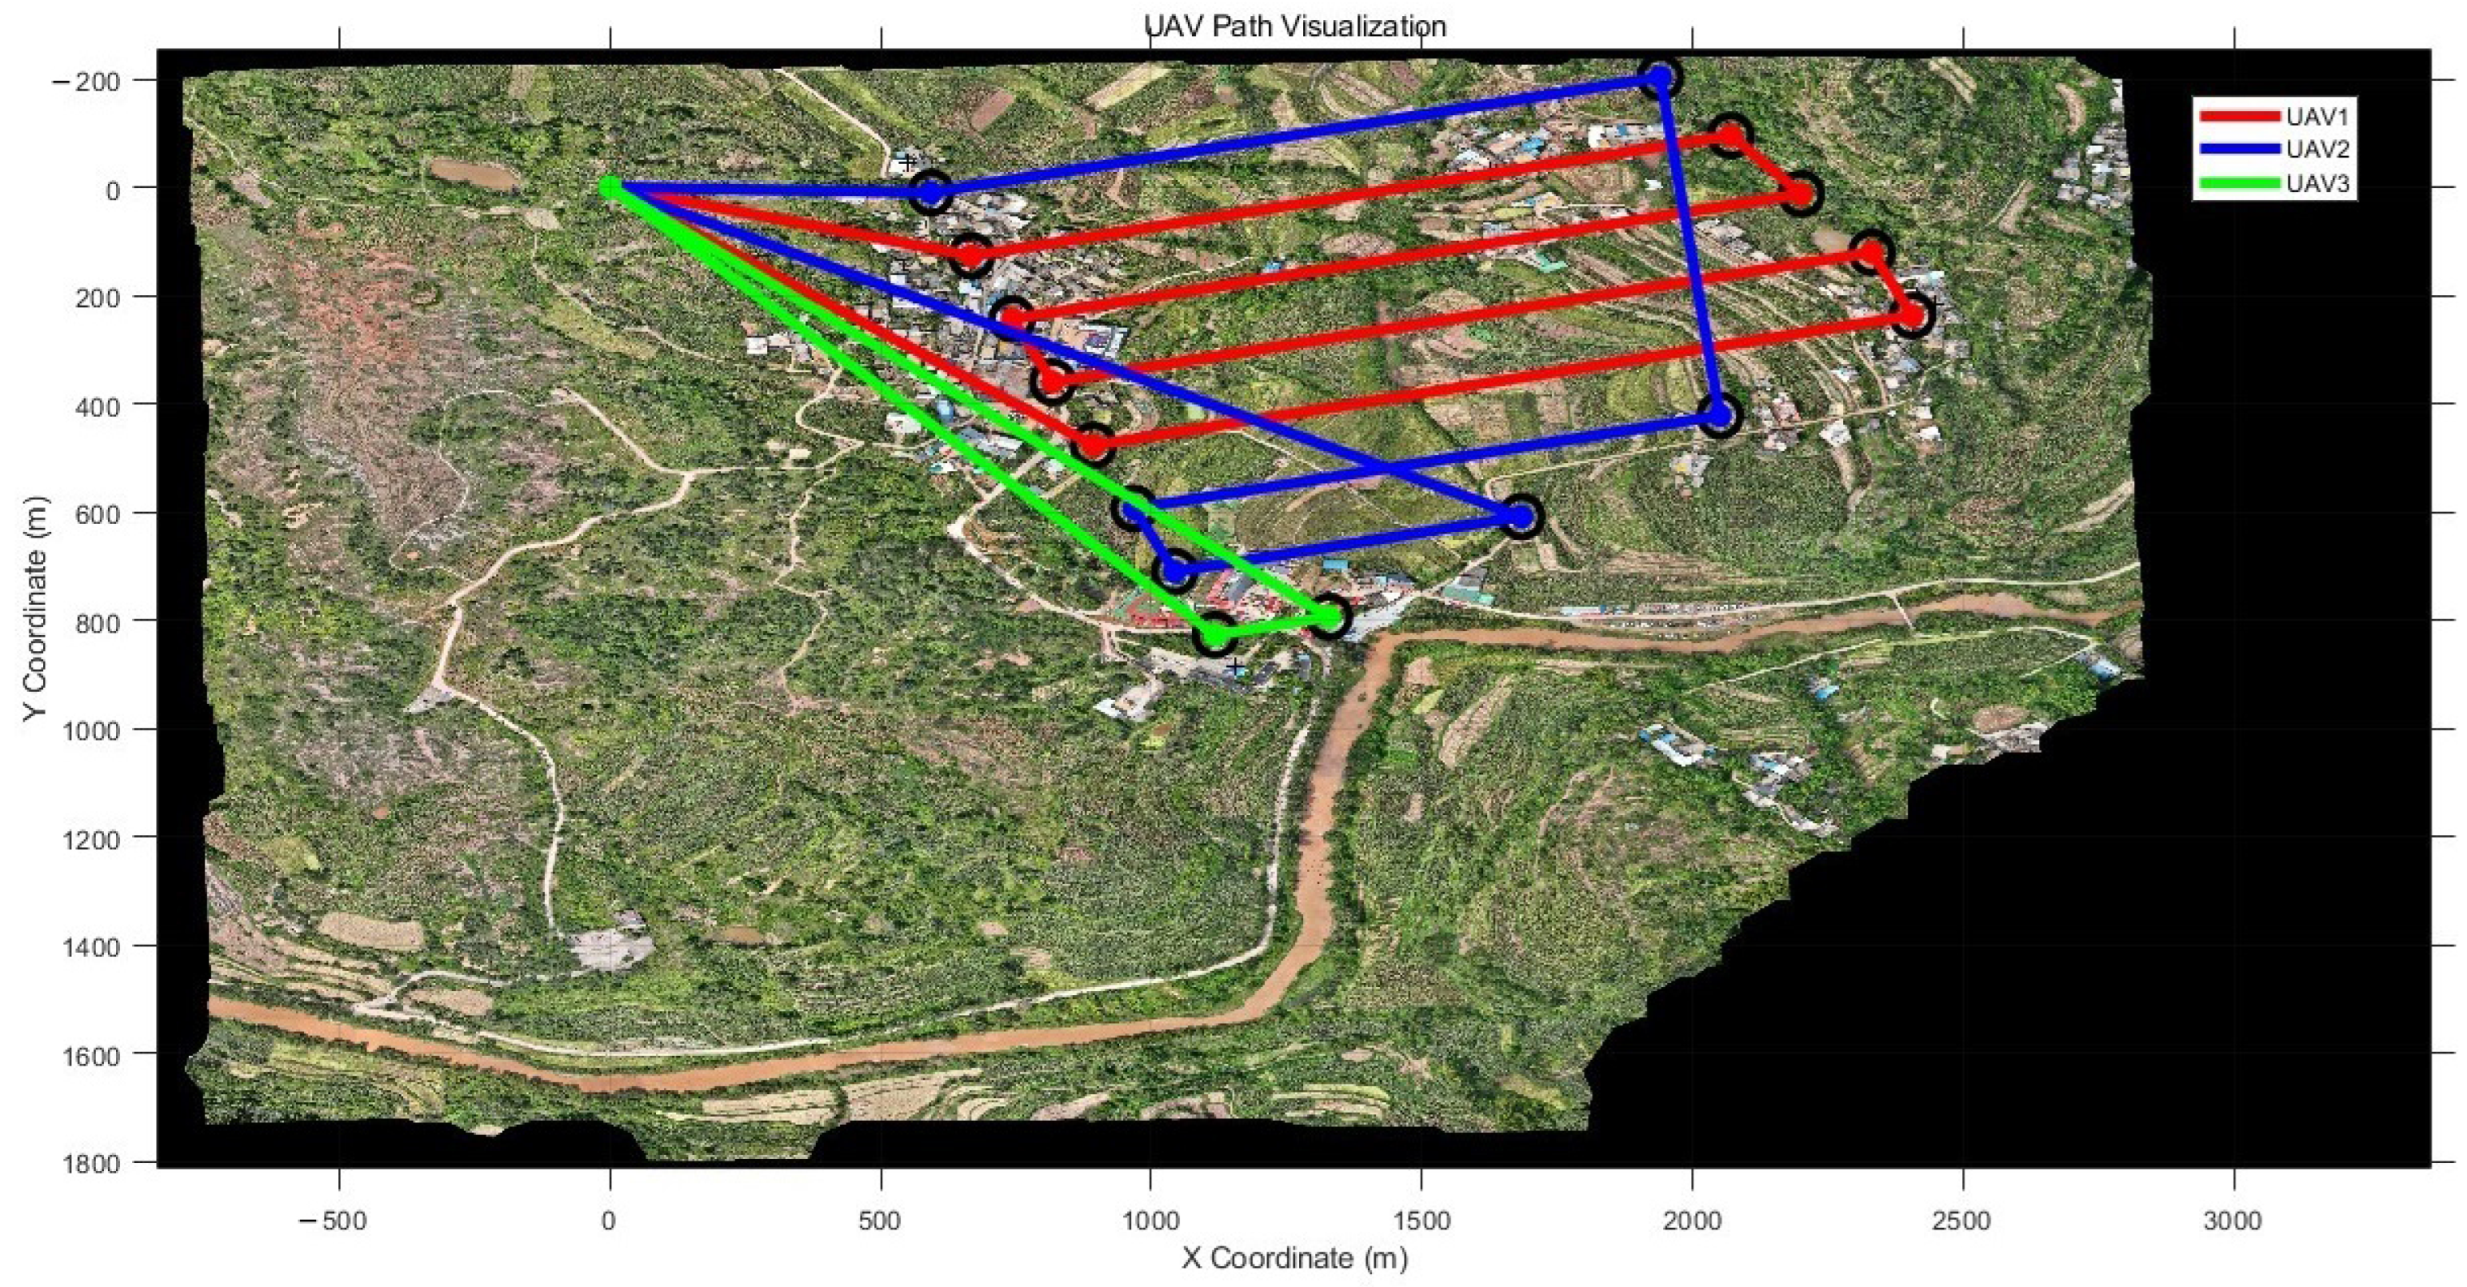
4.1.2. Coverage Path-Planning Experiment 2

The biggest challenge in using drones for path planning is the algorithm’s real-time performance. To demonstrate the effectiveness of the proposed method, we tested the method with another region in Dawa Village, Yunnan Province to obtain the data. The experiments are shown in Figure 12, Figure 13 and Figure 14. Using the search coverage method and experiment, the point cloud data were obtained and processed by DJI Terra to generate a high-precision 3D point cloud model, as shown in Figure 15.
It can be seen that this coverage scheme had strong transferability and could achieve the coverage search in different scenarios. In addition, we compared our method with the classical A-star-based searching method from [8]. The results are shown in Figure 16. In Figure 16, the size of the point cloud is 6.1 GB, and our processing time was 6.5 h. In the results using the comparison method, the task completion time was 18.126 min, and the path value was 178.44 km. Through the comparison results, we can see that the proposed method in this paper had better performance for the task completion time and the path value.

4.2. Tourist Trajectory-Planning Simulation Experiment and Discussions

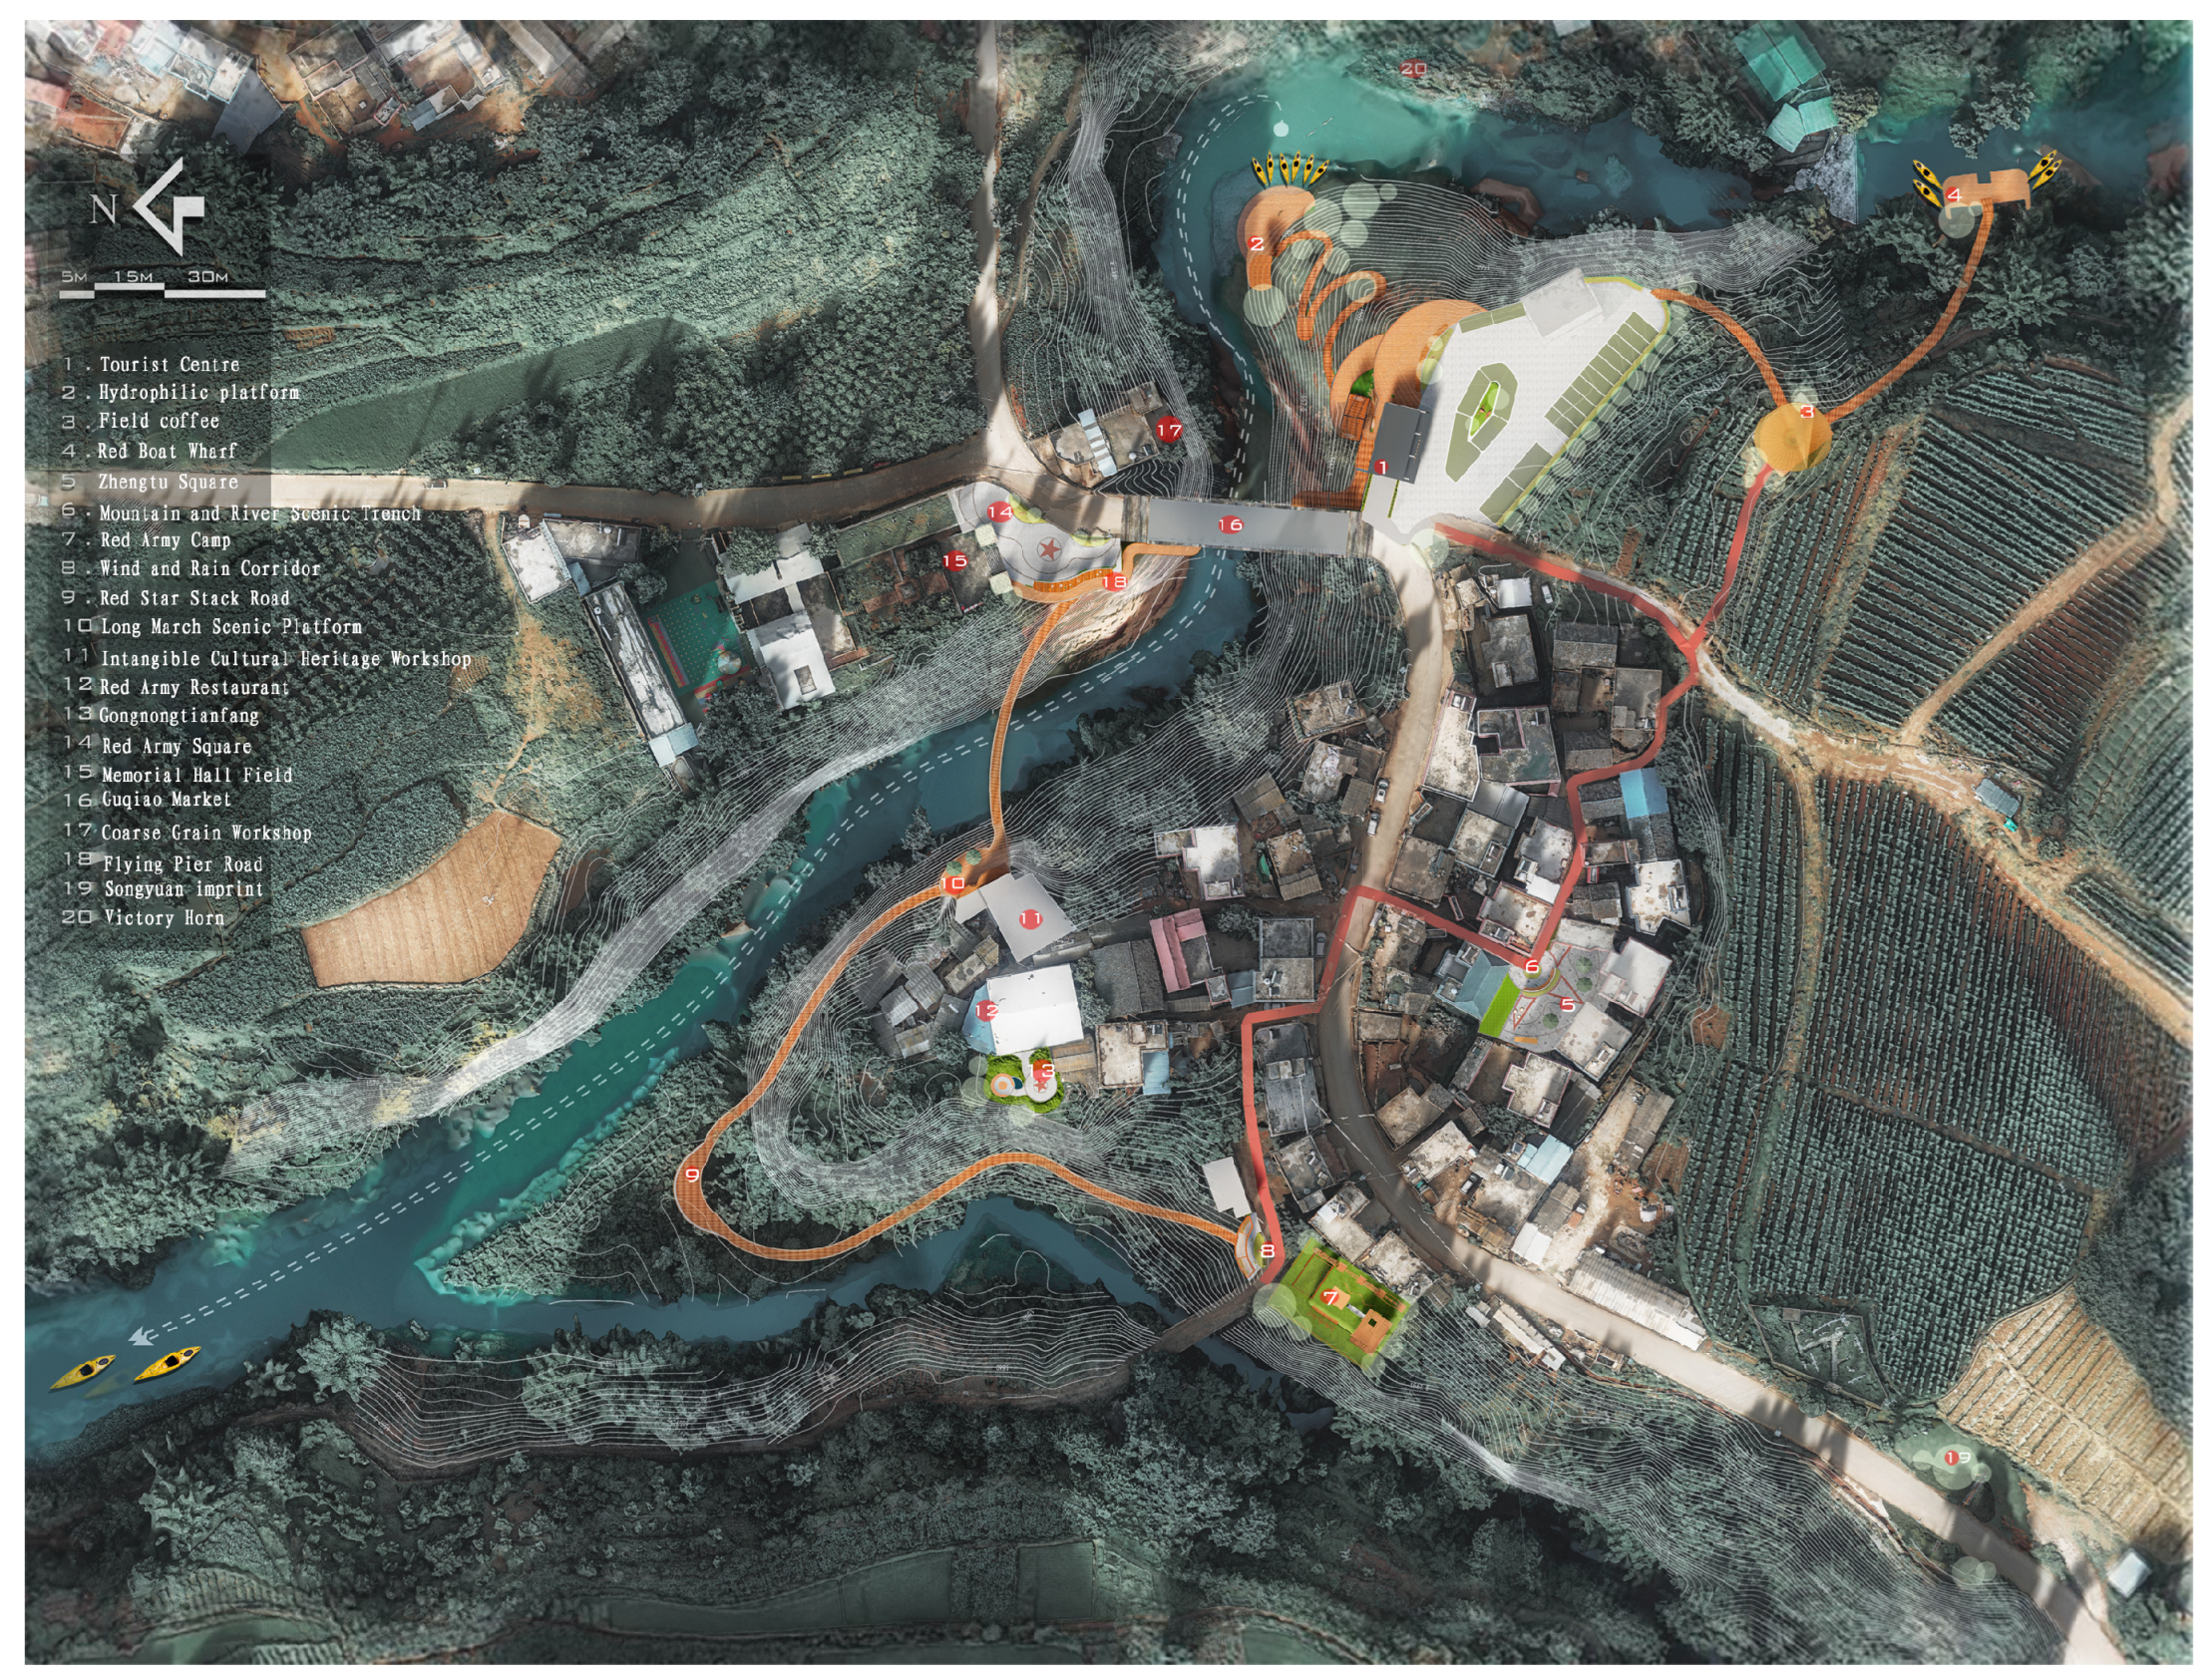
4.2.1. Selection of Trajectory Points

In the problem of tourism route planning, mandatory waypoints refer to small scenic spots with high visiting value or fascinating attractions. The choice of the mandatory waypoints should be reasonably made based on the actual situation of the tourist area. In this paper, the mandatory waypoints were determined by the following principles.
The entrance to a village is the first impression of a tourist and is usually marked with a sign or map. As the heart of the village, the central square is a place for residents to gather and hold cultural events. The central square allows tourists to see the social lives and cultural activities of villagers and helps tourists understand the community dynamics and cultural characteristics. The streets and main roads are the arteries of the village, reflecting its vitality and traffic conditions. Emergency service facilities are key to responding to emergencies and providing emergency relief. Educational institutions showcase youth and allow tourists to see the school environment and campus. Therefore, the mandatory waypoints were given as in Figure 17.

4.2.2. Selection of Obstacle Points

Certain areas (e.g., fast-moving rivers) are not conducive to tourist safety, and some areas have fragile ecology and wildlife that require protection. The selected obstacle points are shown in Figure 18.

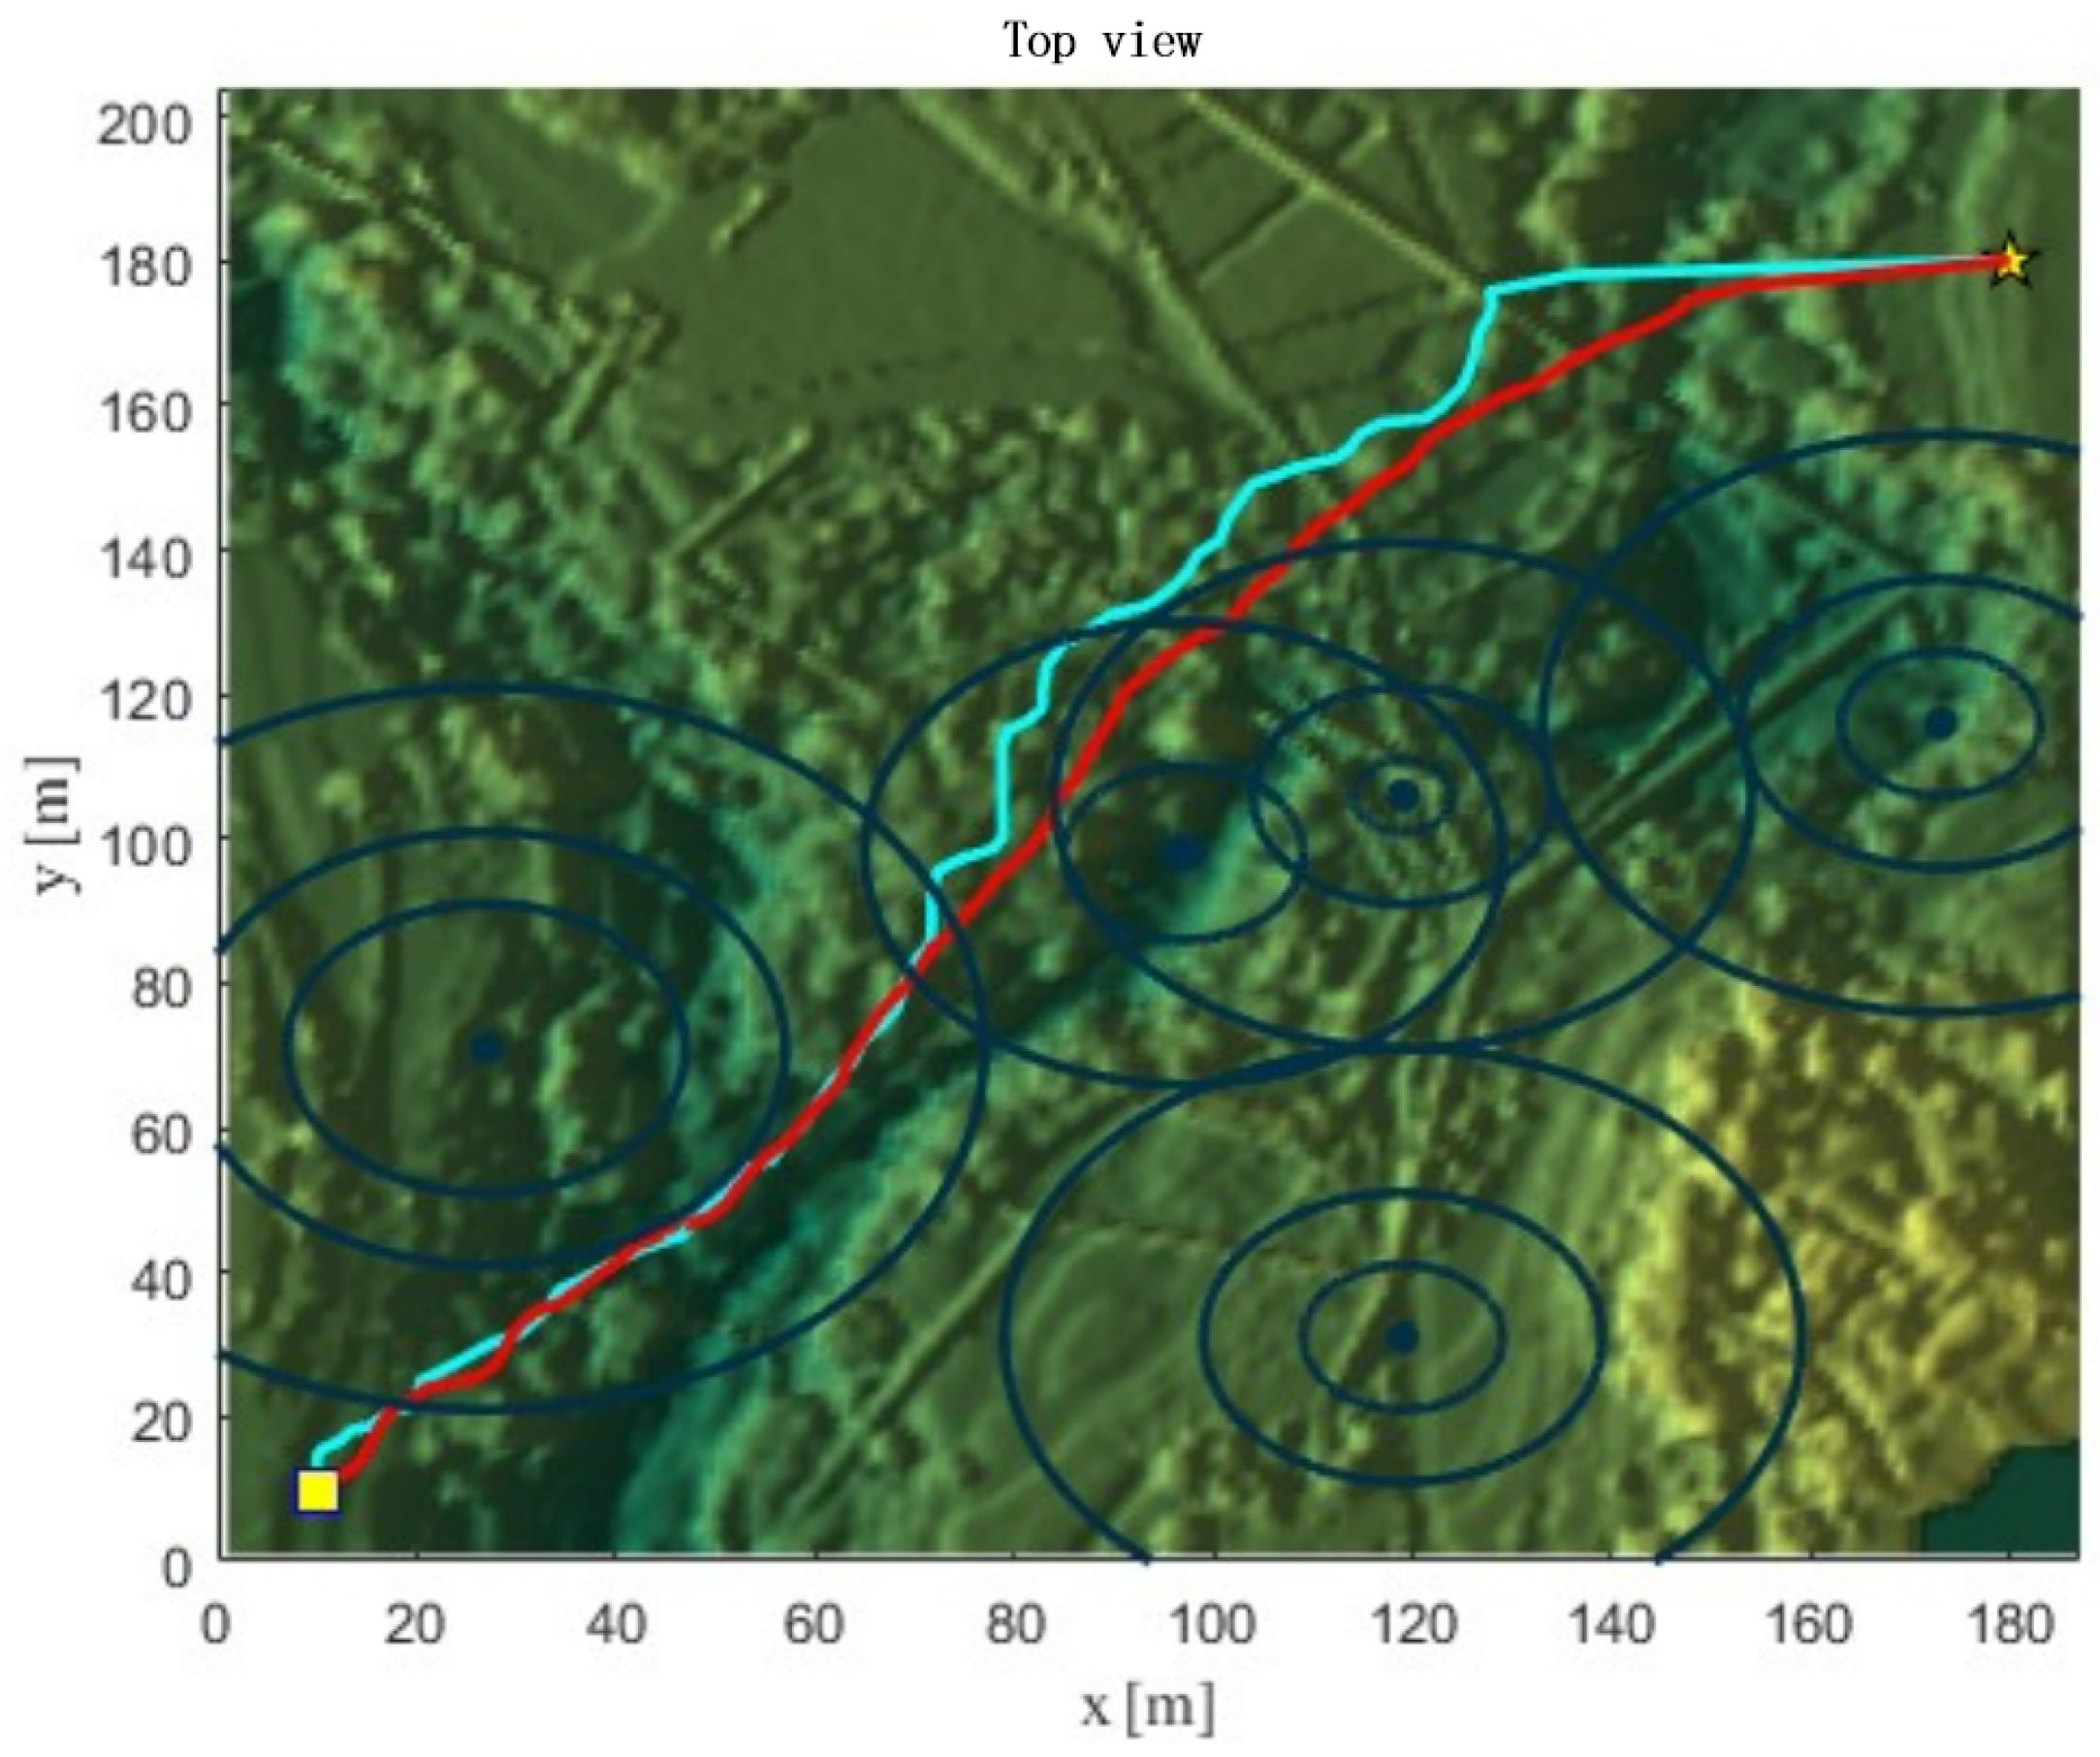
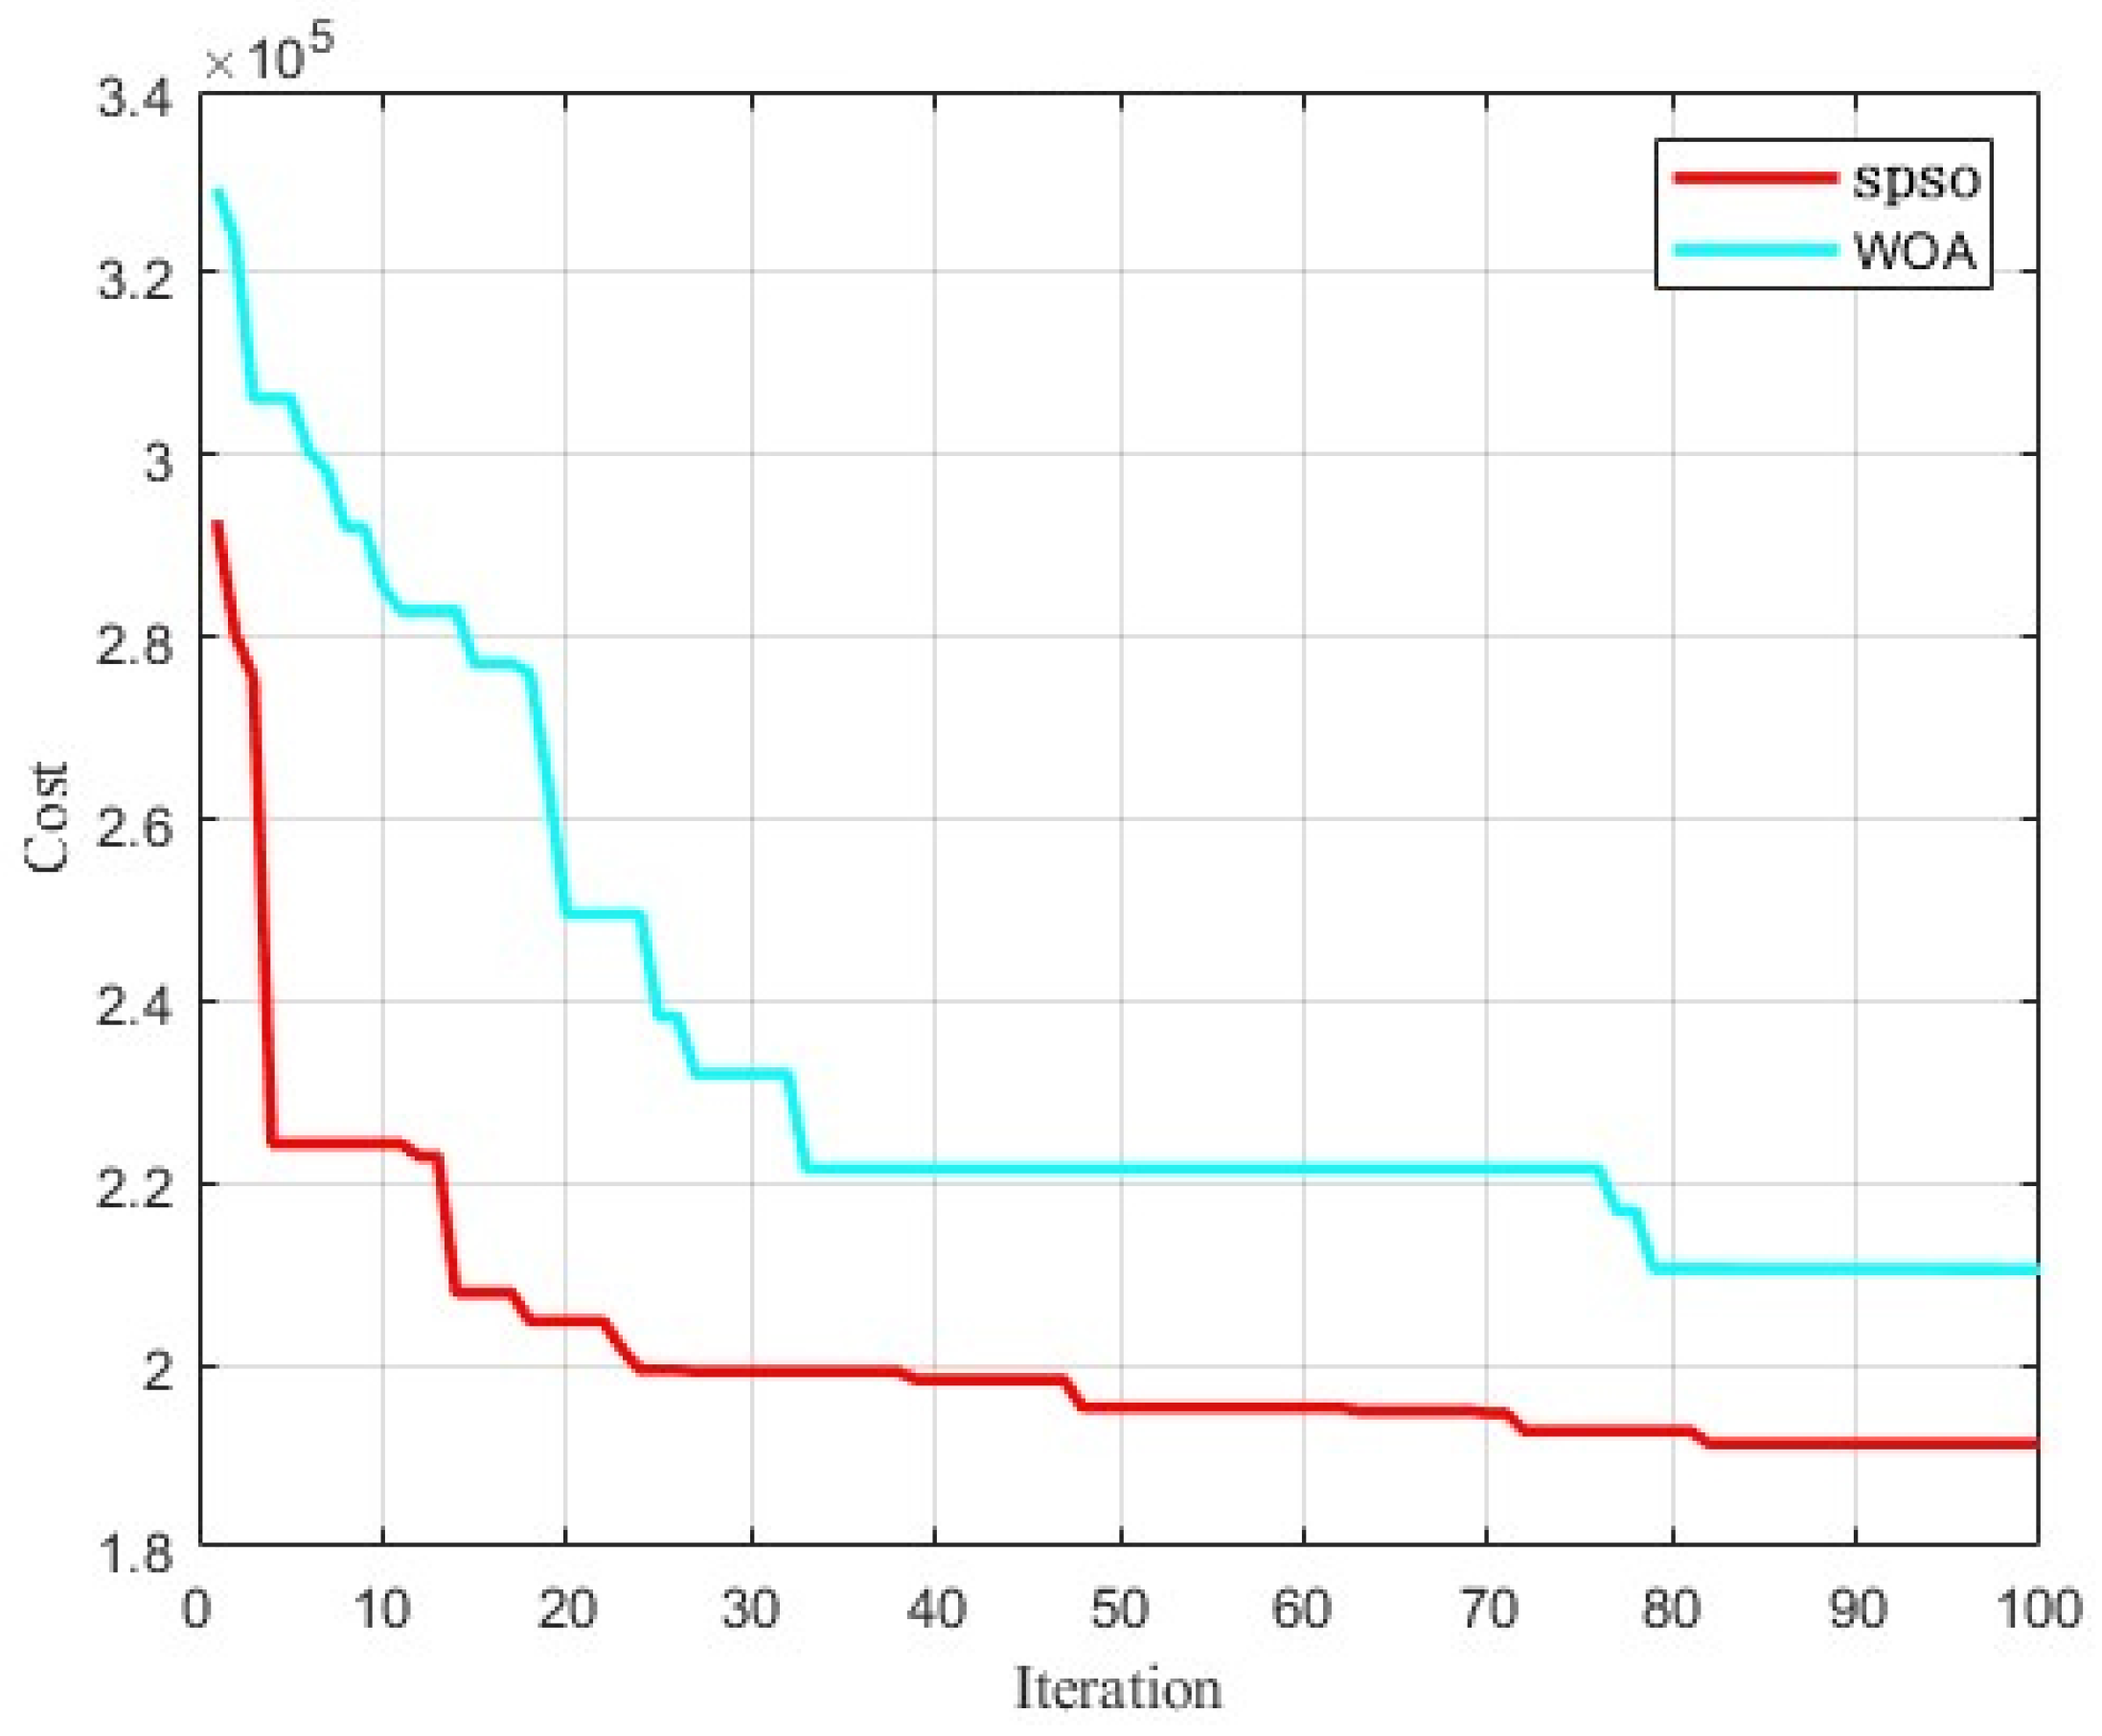
4.2.3. Simulation of Trajectory Planning

The overall trajectory obtained from global optimization is shown in Figure 19 and Figure 20. The trajectory obtained from multiple iterations was the optimal trajectory that minimized the cost function.
We performed comparison experiments for the path-planning method. In addition, the quantitative comparative results are given to demonstrate the effectiveness of the method. In Figure 21, the red line represents the trajectory of the SPSO algorithm, while the blue line represents the trajectory of the WOA algorithm [34]. In comparison, the proposed SPSO is smoother and has fewer folds. At the same time, the proxy value curve shows that there is less loss under the SPSO algorithm.
The quantitative comparative results are discussed as follows. The different tourist walking path schemes were obtained using two algorithms. Scheme one was the SPSO algorithm, and scheme two was the WOA algorithm; we calculated their path length costs separately.
For the cost function of path length F1, after simulation calculations (only fabricated numerical values were used here), we obtained F 1 = 13837.28 m with the SPSO algorithm, and F 1 = 13964.59 m with the WOA algorithm.
For the cost function of security F2, we obtained F 2 = 5330.73 m with the SPSO algorithm, and F 2 = 5836.28 m with the WOA algorithm.
For the cost function of climb altitude constraint F3, we obtained F 3 = 1318.27 m with the SPSO algorithm, and F 3 = 1331.43 m with the WOA algorithm.
For the cost function of smoothness F4, we obtained F 4 = 1811.2 with the SPSO algorithm, and F 4 = 2213.6 with the WOA algorithm.
Among the two algorithm path schemes, SPSO had a significant advantage in normalizing the various costs, indicating that this scheme had better comprehensive performance in path length, safety, and comfort and was a relatively more reasonable tourist walking path selection.

4.2.4. Refinement of Trajectory Planning

To optimize the tourist route in the Xiaosongyuan scenic area, we considered the fine terrain information within the UAV image point cloud data along with the natural and humanistic features inside the scenic area to develop. Twenty mandatory waypoints were established. As shown in Figure 22, the algorithm was practical and reliable for obtaining the continuous optimal path for the given refined route.

4.3. Limitations of the Study

This paper analyzed regional spatial features and optimized tourism routes based on point cloud data provided by unmanned aerial vehicles (UAVs). There exist several limitations as follows.
The map constructed in this paper was only a three-dimensional laser point cloud. Due to some errors in the electric cloud data, the map constructed in this article may have certain errors. The cooperative fusion of multi-source sensor data, such as laser clouds and visible light, can provide more accurate map information. This paper did not consider the safety issues of drone operation within scenic spot. During the coverage mapping process, the path-planning methods for drones need to consider factors such as no fly zones and compliance with relevant regulations and safety standards. At present, the relevant planning algorithms mainly consider feasibility and have not been fully integrated with artificial intelligence technology. Therefore, the relevant algorithms are still conducted offline, and their intelligence is not yet outstanding.

5. Conclusions and Future Work

This paper presented a methodology for the coverage and sensing of ground areas using UAVs. The UAV point cloud data-based regional spatial feature analysis and route optimization strategy were empirically applied to the red tourism resource data collection and digital village design scenarios in Xiaosongyuan, Kunming, Yunnan Province. We introduced an innovative method for obtaining full-coverage UAV point cloud data in irregular regions for efficient path optimization. In our approach, point cloud data were accurately collected by three DJI Phantom UAVs through an automated task in a preset area. The ground data were processed using an improved progressive triangular irregular network densification filtering algorithm. Subsequently, DJI Terra software was used to stitch the collected image data, generating a feature map of the target area. We also used the generated 3D feature maps to recommend optimal tourist paths in complex environments based on an improved SPSO algorithm that identified tourist paths that were both safe and smooth. The results provide valuable technical support for the planning, renovation, upgrading, and management of tourist attractions, which is conducive to achieving a balance between tourism and conservation.
In future work, we will develop more efficient point cloud data processing techniques to support real-time or near-real-time applications. We will also explore strategies for fusing UAV point cloud data with other sensor data (e.g., multispectral and thermal infrared sensor data) to obtain more comprehensive spatial feature information. UAV point cloud data could be incorporated into augmented reality and virtual reality technologies to create immersive tourism experiences for tourists. We also plan to conduct an environmental impact assessment of UAV operations in tourist attractions and develop environmental protection measures to ensure the sustainability of UAV applications. Machine learning and artificial intelligence technologies will be integrated to develop a smart tourism path-planning system to provide tourists with customized experiences. We also plan to conduct in-depth research on safety issues related to UAV operations in tourist attractions to ensure that UAV operations comply with relevant regulations and safety standards.

Author Contributions

Flight testing, data collection and processing, and manuscript writing, Yu Chen; manuscript formatting, proofreading, and guidance, Hui Zhong; writing review and editing, Jianglong Yu. All authors have read and agreed to the published version of the manuscript.

Funding

This research was funded by Phased achievements from construction of environmental design major in the Ministry of Education’s National First-Class Undergraduate Major Construction Program (3320109620210144).

Data Availability Statement

Data is contained within the article.

Conflicts of Interest

The authors declare no conflicts of interest.

Abbreviations

UAVsUnmanned aerial vehicles
GAGenetic algorithm
ACOAnt colony algorithm
PSOParticle swarm optimization algorithm
SPSOSpherical vector-based PSO algorithm
RNNsRecurrent neural networks
SACSoft actor–critic
VRPVehicle routing problem

References

  1. Jiang, S.; Jiang, W.; Wang, L. Unmanned Aerial Vehicle-Based Photogrammetric 3D Mapping: A survey of techniques, applications, and challenges. IEEE Geosci. Remote. Sens. Mag. 2021, 10, 135–171. [Google Scholar] [CrossRef]
  2. Yao, H.; Qin, R.; Chen, X. Unmanned aerial vehicle for remote sensing applications—A review. Remote. Sens. 2019, 11, 1443. [Google Scholar] [CrossRef]
  3. Wen, H.; Zhou, S.; Wang, X.; Zhang, H. Research on emergency search and rescue strategy of UAV group in complex mountain environment. Comput. Technol. Autom. 2024, 43, 127–134. [Google Scholar] [CrossRef]
  4. Çoğay, S.; Seçinti, G. Phoenix: Aerial monitoring for fighting wildfires. Drones 2023, 7, 19. [Google Scholar] [CrossRef]
  5. Huang, R.; Zhou, H.; Liu, T.; Hanlin, S. Multi-UAV collaboration to survey Tibetan antelopes in Hoh Xil. Drones 2022, 6, 196. [Google Scholar] [CrossRef]
  6. Fan, X.; Li, H.; You, C.; Danna, D. UAV swarm search path planning method based on probability of containment. Drones 2022, 8, 132. [Google Scholar] [CrossRef]
  7. Du, L.; Fan, Y.; Gui, M.; Zhao, D. A multi-regional path-planning method for rescue UAVs with priority constraints. Drones 2023, 7, 692. [Google Scholar] [CrossRef]
  8. Ma, Y.; Zhao, Y.; Li, Z.; Yan, X.; Bi, H.; Królczyk, G. A new coverage path planning algorithm for unmanned surface mapping vehicle based on A-star based searching. Appl. Ocean Res. 2022, 123, 103163. [Google Scholar] [CrossRef]
  9. Jing, X.; Hou, M.; Li, W.; Chen, C.; Feng, Z.; Wang, M. Task parameter planning algorithm for UAV area complete coverage in EO sector scanning mode. Aerospace 2023, 10, 612. [Google Scholar] [CrossRef]
  10. Wang, X.; Wang, P.; Ding, M.; Lin, Z.; Lin, F.; Vucetic, B.; Hanzo, L. Performance analysis of terahertz unmanned aerial vehicular networks. IEEE Trans. Veh. Technol. 2020, 69, 16330–16335. [Google Scholar] [CrossRef]
  11. Cabreira, T.; Brisolara, L.; Ferreira, P.R., Jr. Survey on coverage path planning with unmanned aerial vehicles. Drones 2019, 3, 4. [Google Scholar] [CrossRef]
  12. Kumar, K.; Kumar, N. Region coverage-aware path planning for unmanned aerial vehicles: A systematic review. Phys. Commun. 2023, 59, 102073. [Google Scholar] [CrossRef]
  13. Jia, Y.; Zhou, S.; Zeng, Q.; Li, C.; Chen, D.; Zhang, K.; Liu, L.; Chen, Z. The UAV path coverage algorithm based on the greedy strategy and ant colony optimization. Electronics 2023, 11, 2667. [Google Scholar] [CrossRef]
  14. Xiao, P.; Li, N.; Xie, F.; Ni, H.; Zhang, M.; Wang, B. Clustering-based multi-region coverage-path planning of heterogeneous UAVs. Drones 2023, 7, 664. [Google Scholar] [CrossRef]
  15. Tong, Y.; Sheng, M.; Liu, J.; Zhao, N. Energy-efficient UAV-NOMA aided wireless coverage with massive connections. Sci. China Inf. Sci. 2023, 66, 222303. [Google Scholar] [CrossRef]
  16. Xiao, J.; Yuan, G.; Xue, Y.; He, J.; Wang, Y.; Zou, Y.; Wang, Z. A deep reinforcement learning based distributed multi-UAV dynamic area coverage algorithm for complex environment. Neurocomputing 2024, 595, 127904. [Google Scholar] [CrossRef]
  17. Yang, Y.; Feng, Y.; Liang, Y. UAV cluster dense obstacle area coverage route planning based on Dubins-RRT algorithm. Tact. Miss. Technol. 2024, 45, 83–98. [Google Scholar] [CrossRef]
  18. Yan, X.; Chen, R.; Jiang, Z. UAV cluster mission planning strategy for area coverage tasks. Sensors 2023, 23, 9122. [Google Scholar] [CrossRef]
  19. Lahmeri, M.A.; Kishk, M.A.; Alouini, M.S. Stochastic geometry-based analysis of airborne base stations with laser-powered UAVs. IEEE Commun. Lett. 2020, 24, 173–177. [Google Scholar] [CrossRef]
  20. Xing, S.; Chen, X.; Wang, W.; Xue, P. Multi-UAV coverage optimization method based on information map and improved ant colony algorithm. IEEE Commun. Lett. 2024, 43, 84–91+96. [Google Scholar] [CrossRef]
  21. Cao, X.; Xuqiong, L.; Jing, L.; Enfeng, H. Improved multi-UAV formation path planning method under artificial potential field method. J. Comput. Appl. 2024, 1–7. [Google Scholar]
  22. Zhu, J.; Changjian, Z.; Xiaoping, L.; Weimin, B. Multi-target assignment and intelligent decision based on reinforcement learning. Acta Armamentarii 2021, 42, 2040–2048. [Google Scholar] [CrossRef]
  23. Hart, P.E.; Nilsson, N.J.; Raphael, B. A formal basis for the heuristic determination of minimum cost paths. IEEE Trans. Syst. Sci. Man Cybern. 1968, 4, 100–107. [Google Scholar] [CrossRef]
  24. Li, Z.; Xu, X. Improved genetic algorithm applied to UAV path planning in earthquake scenarios. J. Saf. Environ. 2024, 25, 1–16. [Google Scholar] [CrossRef]
  25. Shao, S.; Peng, Y.; He, C.; Du, Y. Efficient path planning for UAV formation via comprehensively improved particle swarm optimization. ISA Trans. 2020, 97, 415–430. [Google Scholar] [CrossRef]
  26. Zhang, W.; Zhang, W. An efficient UAV localization technique based on particle swarm optimization. IEEE Trans. Veh. Technol. 2022, 71, 9544–9577. [Google Scholar] [CrossRef]
  27. Ye, Z.; Li, H.; Wei, W. Improved particle swarm optimization based on multi-strategy fusion for UAV path planning. Int. J. Intell. Comput. Cybern. 2024, 17, 213–235. [Google Scholar] [CrossRef]
  28. Hedjar, R.; Bounkhel, M. Real-time obstacle avoidance for a swarm of autonomous mobile robots. Int. J. Adv. Rob. Syst. 2014, 11, 36–47. [Google Scholar] [CrossRef]
  29. Rafai, A.N.A.; Adzhar, N.; Jaini, N.I. A review on path planning and obstacle avoidance algorithms for autonomous mobile robots. J. Rob. 2022, 2022, 1–14. [Google Scholar] [CrossRef]
  30. Chen, Y.; Dong, Q.; Shang, X.; Wu, Z.; Wang, J. Multi-UAV autonomous path planning in reconnaissance missions considering incomplete information: A reinforcement learning method. Drones 2022, 7, 10. [Google Scholar] [CrossRef]
  31. Tang, J.; Liang, Y.; Li, K. Dynamic scene path planning of UAVs based on deep reinforcement learning. Drones 2024, 8, 60. [Google Scholar] [CrossRef]
  32. Zhao, X.; Yang, R.; Zhong, L.; Hou, Z. Multi-UAV path planning and following based on multi-agent reinforcement learning. Drones 2024, 8, 18. [Google Scholar] [CrossRef]
  33. Li, G.; Chou, W. Path planning for mobile robot using self-adaptive learning particle swarm optimization. Sci. China Inf. Sci. 2018, 61, 052204. [Google Scholar]
  34. Han, Q.; Yang, X.; Song, H.; Du, W. Multi-objective ship path planning using non-dominant relationship-based WOA in marine meteorological environment. Ocean. Eng. 2022, 266, 112862. [Google Scholar]
Figure 1. The conceptual transfer diagram of this paper.
Ijgi 14 00145 g001
Figure 2. Schematic of lidar UAV detection.
Ijgi 14 00145 g002
Figure 3. Schematic of area decomposition. (a) Detection area. (b) Detection route.
Ijgi 14 00145 g003
Figure 4. Coverage strategy. (a) Horizontal coverage strategy. (b) Vertical coverage strategy.
Ijgi 14 00145 g004
Figure 5. Optimal coverage direction for rotational searching of an area.
Ijgi 14 00145 g005
Figure 6. Sensor size versus height and trajectory.
Ijgi 14 00145 g006
Figure 7. Flowchart of the coverage algorithm.
Ijgi 14 00145 g007
Figure 8. Information map of Xiaosongyuan point cloud.
Ijgi 14 00145 g008
Figure 9. Xiaosongyuan’s point cloud with surface attachments removed.
Ijgi 14 00145 g009
Figure 10. Xiaosongyuan’s point cloud generated contour overlay.
Ijgi 14 00145 g010
Figure 11. Point cloud of some buildings in Xiaosongyuan park.
Ijgi 14 00145 g011
Figure 12. Coverage search trajectory based on one UAV.
Ijgi 14 00145 g012
Figure 13. Coverage search trajectory based on two UAVs.
Ijgi 14 00145 g013
Figure 14. Coverage search trajectory based on three UAVs.
Ijgi 14 00145 g014
Figure 15. Point cloud of some buildings in Dawa Village, Yunnan Province.
Ijgi 14 00145 g015
Figure 16. The comparison results with the A-star method.
Ijgi 14 00145 g016
Figure 17. Trajectory point indication.
Ijgi 14 00145 g017
Figure 18. Calibration of the obstacle area.
Ijgi 14 00145 g018
Figure 19. Global trajectory.
Ijgi 14 00145 g019
Figure 20. Top view of the global trajectory.
Ijgi 14 00145 g020
Figure 21. The cost function curve.
Ijgi 14 00145 g021
Figure 22. Refined path simulation results.
Ijgi 14 00145 g022
Table 1. Coverage path-planning algorithm data table of experiment 1.
Test NumberUAV CountTask Completion Time (min)Path Value (km)Setup Time for Each UAV (min)Notes
1127.871294Task completion time for one UAV
2220.06118.744Task completion time for two UAVs
3318.27125.554Task completion time for three UAVs
Table 2. Coverage path-planning algorithm data table of experiment 2.
Test NumberUAV CountTask Completion Time (min)Path Value (km)Setup Time for Each UAV (min)Notes
11 Plane28.3567185.48924Task completion time for one UAV
22 Plane18.2345175.76344Task completion time for one UAV
33 Plane13.4567172.084Task completion time for one UAV
Disclaimer/Publisher’s Note: The statements, opinions and data contained in all publications are solely those of the individual author(s) and contributor(s) and not of MDPI and/or the editor(s). MDPI and/or the editor(s) disclaim responsibility for any injury to people or property resulting from any ideas, methods, instructions or products referred to in the content.

